early childhood education - crakenya.org€¦ · 27 uasin-gishu 894,179 ... governments for...
TRANSCRIPT

CRA RECOMMENDATION ON THE CRITERIA FOR SHARING REVENUE AMONG COUNTIES
FOR FINANCIAL YEARS
2016/2017 2017/2018 2018/19
COMMISSION ON REVENUE ALLOCATION
14TH MARCH 2016
Health
County Roads
Early Childhood Education
REVISED SECOND SUBMISSION

REVISED SECOND SUBMISSION
Tel: 254 (20) 4298000 Email: [email protected] Website: www.crakenya.org
14 Riverside Drive Grosvenor block 2nd Floor P.O. Box 1310 – 00200 NAIROBI
COMMISSION ON REVENUE ALLOCATION
Mr. J. M. Nyegenye DATE: 14th March 2016 Clerk of the Senate Clerk‟s Chambers Parliament Buildings NAIROBI Dear Mr. Nyegenye RE: RECOMMENDATION ON THE BASIS OF EQUITABLE SHARING
OF REVENUE AMONG COUNTY GOVERNMENTS
The Commission on Revenue Allocation hereby submits to the Senate the recommended basis for sharing revenue among county governments for the three financial years commencing 2016/2017. The submission is made in accordance with the following provisions of the Constitution:- Article 216 (1)(b), which stipulates that one of the principal mandates of the Commission on Revenue Allocation is to make recommendations concerning the basis for the equitable sharing of revenue raised by the national government among the county governments; Article 217 (2)(b) which stipulates that in determining the basis of revenue sharing, the Senate shall request and consider recommendations from the Commission on Revenue Allocation; and Schedule 6 (16) which stipulates that despite the provisions of Article 217(1), the first and second determinations of the basis of division of revenue among the counties shall be made at three year intervals, rather than every five years as provided in that Article. We stand ready to come before the relevant Senate Committee to clarify any issues on this recommendation. Yours Faithfully
Micah Cheserem
CHAIRMAN

i
TABLE OF CONTENTS
TABLE OF CONTENTS ........................................................................................................ i
EXECUTIVE SUMMARY ................................................................................................... iii
1.0 INTRODUCTION .......................................................................................................... 7
1.1 Legal Framework for Preparation of the Revenue Formula ................................. 8
1.2. Objectives of Transfers .......................................................................................... 9
1.3. Features of a Good Transfer System ................................................................... 10
2.0. THE FIRST REVENUE SHARING FORMULA...................................................... 12
2.0 THE SECOND REVENUE SHARING FORMULA ..................................................... 14
2.1 Methodology for Preparation of the Second Revenue Sharing Formula ............ 14
2.2 Consultations with County Stakeholders ............................................................ 14
2.3 Review of literature on Intergovernmental Transfers ........................................ 15
2.3.1 South Africa ................................................................................................... 15
2.3.2 Ethiopia ......................................................................................................... 16
2.3.3 Philippines ..................................................................................................... 17
2.3.4 India ............................................................................................................... 17
3.4. Consultations with Experts .............................................................................. 19
3.5. Consultations with Governors.......................................................................... 19
3.6. CRA FIRST RECOMMENDATION ON THE SECOND BASIS FOR REVENUE
SHARING AMONG COUNTIES ................................................................................... 20
3.7. Revised Second Submission on the Second Basis for Revenue Sharing Among
County Governments .................................................................................................... 22
3.8. The Rationale for Choice of the Parameters .................................................... 22
3.8.1. Population .................................................................................................. 22
3.8.2. Basic Equal Share ...................................................................................... 23
3.8.3. Poverty ....................................................................................................... 24
3.8.4. Land Area ................................................................................................... 26
3.8.5. Fiscal Effort ............................................................................................... 27
3.8.6. Development Factor .................................................................................. 29
3.8.7. The Second Recommendation on Revenue Sharing ................................. 30
3.8.8. Other Parameters Considered but not Selected ........................................ 32

ii
4.0 THE APPLICATION OF CRITERIA OF ARTICLE 203 ............................................. 35
Appendix I: Aggregate Annual Allocations to County Governments Based on the First
Revenue Sharing Formula (Ksh. Millions). ...................................................................... 37
Appendix II: The Second Revenue Sharing Formula ..................................................... 39
Appendix III: Revenue Sharing Formula Allocation Factors (%) .................................... 41
Appendix V: Summary of Simulation at Ksh. 259,775 Million ........................................ 45
Appendix VI (b): Data for the Second Revenue Sharing Formula ................................. 49
Appendix VII: County Data on Poverty for 2005/2006 and 2009 .................................. 51

iii
EXECUTIVE SUMMARY
In accordance with the provisions of Article 216 (1)(b), read together with Article
217 (2)(b) and Schedule 6 (16), the Commission on Revenue Allocation
recommends a new basis for sharing revenue among county governments for the
next three financial years commencing 2016/2017. The recommended basis has
six parameters. A comparison of the first and second (1st and 2nd submissions)
revenue sharing formulas is presented in Table 1.
Table 1: First and Second Revenue sharing formula: Summary on
Parameters and Weights
No. Parameter
First Revenue Sharing Formula
First CRA Submission on
the Second Revenue Sharing
Formula
Second CRA Submission on the Second Revenue Sharing Formula
1 Population 45 45 45
2 Equal Share 25 25 26
3 Poverty 20 18 18
4 Land Area 8 8 8
5 Fiscal Effort 2 1 2
6 Development Factor
- 1
1
7 Personnel Emolument
- 2
0
Total 100 100 100
Source: Commission on Revenue Allocation 2016
The weights on the parameter on Population, Land Area and Fiscal Effort have
been retained at 45 percent, 8 per cent, and 2 percent, respectively in revised
second basis for revenue sharing among county governments. To correct for over-
redistribution in the first generation revenue sharing formula, the weight on the
parameter on poverty has been reduced from 20 percent to 18 percent. Further,
the second recommendation utilizes the latest data on poverty for 2009 from the
Kenya National Bureau of Statistics.

iv
The first formula allocated two percent (Fiscal Responsibility) of the equitable
share equally among all the 47 counties. The Commission recognized that all
counties inherited manual revenue collection systems from the defunct local
authorities which needed a complete overhaul. The two percent equal allocation
in all counties was therefore meant to incentivize counties to automate their
revenue collection system and address revenue leakages.
The revised second recommendation defines fiscal effort of counties using the
increase in revenue per capita based on the Controller of Budget published
reports for the financial years 2013/14 and 2014/15. In the absence of data on
revenue potential of counties, revenue per capita is considered a good proxy.
Counties will share a two percent of the equitable revenue allocation based on a
county‟s proportion on increase in revenue per capita. Allocation to counties
based on fiscal effort will incentivize counties to maximize the capacity to raise
revenue in accordance with the provisions of Article 203(1)(i)) and to ensure that
all money raised or received by or on behalf of the county governments is paid
into the County Revenue Fund in accordance with the provisions of the Public
Finance Management Act 2012 (109) (2).
A new parameter, development factor index has been introduced with a weight of
one per cent. The development factor provides a measure of developmental needs
of counties using data on counties‟ access to roads, water and electricity.
Following extensive consultations, the Personnel Emolument parameter
introduced in the CRA‟s first submission on the second basis for revenue sharing
among counties was dropped from the revised submission. The allocation to
counties through this parameter was meant to cushion counties that inherited a
huge wage bill. However, given that the wage bill challenge is national it will be
addressed once the national and county governments implement the national
task force recommendation on staff rationalization.
Table 2 below provides allocations to all counties based on the revised second
basis for revenue sharing.

v
Table 2: Indicative Allocations based on the Second Revenue Formula
No County Population
Actual allocations 2015/2016
(Ksh. 259,775 Million)
Simulation of New Formula
Ksh 259,775 Million
Ksh. 331,765 Million
1 Mombasa 939,370 5,198 6,342 8,099
2 Kwale 649,931 5,126 6,292 8,035
3 Kilifi 1,109,735 7,441 8,620 11,009
4 Tana-River 240,075 3,985 4,597 5,871
5 Lamu 101,539 2,052 2,292 2,927
6 Taita-Taveta 284,657 3,310 3,562 4,549
7 Garissa 623,060 5,772 5,852 7,474
8 Wajir 661,941 7,233 7,049 9,003
9 Mandera 1,025,756 8,956 8,385 10,709
10 Marsabit 291,166 5,189 5,676 7,248
11 Isiolo 143,294 3,057 3,294 4,206
12 Meru 1,356,301 6,494 6,706 8,565
13 Tharaka-Nithi
365,330 3,138 3,061 3,910
14 Embu 516,212 3,838 3,826 4,886
15 Kitui 1,012,709 7,267 7,254 9,264
16 Machakos 1,098,584 6,769 6,473 8,267
17 Makueni 884,527 5,970 5,892 7,524
18 Nyandarua 596,268 4,307 4,056 5,180
19 Nyeri 693,558 4,449 4,387 5,603
20 Kirinyaga 528,054 3,538 3,556 4,541
21 Murang'a 942,581 5,356 5,267 6,726
22 Kiambu 1,623,282 7,464 8,105 10,351
23 Turkana 855,399 10,479 8,659 11,058
24 West Pokot 512,690 4,314 4,135 5,280

vi
No County Population
Actual allocations 2015/2016
(Ksh. 259,775 Million)
Simulation of New Formula
Ksh 259,775 Million
Ksh. 331,765 Million
25 Samburu 223,947 3,552 3,261 4,165
26 Trans-Nzoia 818,757 5,100 4,742 6,056
27 Uasin-Gishu 894,179 5,191 5,077 6,483
28 Elegeyo Marakwet
369,998 3,270 3,244 4,144
29 Nandi 752,965 4,755 4,547 5,808
30 Baringo 555,561 4,441 4,201 5,365
31 Laikipia 399,227 3,450 3,508 4,480
32 Nakuru 1,603,325 8,116 7,972 10,181
33 Narok 850,920 5,288 5,344 6,825
34 Kajiado 687,312 4,413 5,277 6,739
35 Kericho 752,396 4,487 4,455 5,689
36 Bomet 730,129 4,725 4,519 5,771
37 Kakamega 1,660,651 8,908 8,627 11,018
38 Vihiga 554,622 3,871 3,677 4,697
39 Bungoma 1,375,063 7,676 7,461 9,528
40 Busia 743,946 5,440 4,937 6,305
41 Siaya 842,304 4,995 4,801 6,131
42 Kisumu 968,909 5,681 5,850 7,472
43 Homa-Bay 963,794 5,635 5,552 7,090
44 Migori 917,170 5,837 5,637 7,199
45 Kisii 1,152,282 7,094 6,406 8,181
46 Nyamira 598,252 4,155 3,965 5,063
47 Nairobi City 3,138,369 12,997 13,379 17,087
Total 38,610,097 259,775 259,775 331,765
Source: Commission on Revenue Allocation 2016

7
1.0 INTRODUCTION
The Kenyan devolved system of government consists of one national government
and 47 county governments. The governments at the national and county levels
are distinct and inter-dependent, (Article 6). Though Article 209 empowers both
county and national governments to impose taxes and charges, Article 202(1)
provides for equitable sharing of revenues raised nationally among the national
and county governments. The Commission prepared the first recommendation
concerning the basis for equitable sharing of revenue among county governments
in 2012. The basis for sharing was approved by the National Assembly in
November 2012. This basis has been used for sharing revenue among county
governments for financial year 2012/2013; 2013/2014; 2014/2015 and 2015/16.
This recommendation specifies the revised second basis for sharing of revenues
among county governments for financial years 2016/2017; 2017/2018 and
2018/19.
The choice of a specific basis for a transfer system is guided by the ultimate
objective of the transfer program. Transfers serve various purposes: closing the
vertical fiscal imbalance, equalizing fiscal conditions, or promoting a specific
policy objective.
To the extent that the determination of the basis for revenue sharing aims to
ensure that all county governments have the fiscal means to provide a
comparable level of public services, it should include some indicators capturing
the differences in the costs of county government services. The choice of and
relative weight attached to each of the indicators depend on the specific range of
functions assigned to county governments. However, it is yet to be determined
what constitutes a comparable level of public services in the various counties
based on acceptable levels of norms and standards. In the absence of this
information, historical budget data on devolved services still provides a good
guide on how the cost of delivering services varies across county governments
and in particular how these costs are responsive to variations in socio-economic
characteristics of counties that need to be remedied.
Partly, county government services are funded by locally raised revenues. Article
209 empowers both levels of government to impose taxes and charges. Given that
counties are differently endowed with varying revenue potentials, locally-raised
revenues provide key information on existing disparities among county
government services levels. To incentivize counties to maximize their capacity to

8
raise revenues, the transfer formula has taken into account some indicators of
revenue capacity in the revenue allocation formula.
1.1 Legal Framework for Preparation of the Revenue Formula
Article 216 (1) mandates the Commission on Revenue Allocation to make
recommendations concerning the basis for the equitable sharing of revenue
raised by the National Government between the national and county
governments; and among the county governments. Further, Article 216 (2)
mandates the Commission to make recommendations on other matters relating
to financing of, and financial management by county governments; and to
encourage fiscal responsibility.
Article 217(1) stipulates that every five years, the Senate shall determine the basis
for allocating revenues among counties. The Sixth Schedule, Section 16 further
specifies that the first and second determinations of the basis of the division of
revenue among the counties shall be made at three year intervals. Article 217(2)
provides that the criteria in article 203(1) should be taken into account in
determining the basis of revenue sharing.
Article 203 (1) (d) to (k) provides for the criteria to be taken into account in
determining the equitable shares among the national and county governments
and in all national legislation concerning county government. These are:
d) Ability of the county governments to perform the functions allocated to them;
e) The fiscal capacity and efficiency of county governments;
f) The developmental and other needs of counties;
g) The economic disparities within and among counties and the need to remedy
them;
h) The need for affirmative action in respect of disadvantaged areas and groups;
i) The need for economic optimization of each county and to provide incentives
for each county to optimize its capacity to raise revenue;
j) The desirability of stable and predictable allocations of revenue; and
k) The need for flexibility in responding to emergencies and other temporary
needs, based on similar objective criteria.
Article 201 provides for openness, accountability and public participation in
financial matters. In accordance with this provision, the Commission issued
public notices on review of the first basis for revenue sharing and requested for
submission of memoranda on the second basis for revenue sharing by various
stakeholders. The Commission held consultations with county governments;

9
county stakeholders; the public; Professional bodies; the academic community;
the Council of Governors; and the Senate.
Article 201 requires the public finance system to promote an equitable society,
ensure public money is used in a prudent and responsible way; the burdens and
benefits of use of the resources and public borrowing are shared equitably
between present and future generations; revenue raised nationally is shared
equitably among the national and county governments; and expenditures
promote equitable development in the country, including by making special
provision for marginalized groups and areas; and the financial management be
responsible and fiscal reporting be clear. The basis recommended promotes
equity and makes special provisions to ensure marginalized areas get relatively
higher allocations to bring services in their areas to level currently enjoyed by
residents of other counties.
1.2. Objectives of Transfers
International literature reveals that intergovernmental transfers are meant to
achieve the following objectives, among others:
a) Improve the fiscal balance of the system of intergovernmental relations
based on assigned functions;
b) Improve the fiscal balance of the system of intergovernmental relations;
c) Compensate for the presence of economic disparities between jurisdictions
in the provision of services;
d) Provide for adequate funding of national priorities; and
e) Improve tax administration efficiency at both level of government.
Often, there is an imbalance between expenditure responsibilities of county
governments and their revenue raising powers. This fiscal gap needs to be filled
either by giving county governments more revenue raising powers or by revenue
transfers from the central government. As shown in Appendix VI, collections of
own revenues by county governments in Kenya comprise a small component of
county government budgets.
The Kenyan transfer system is driven by the vertical balance objective. The key
challenge is how to measure the vertical fiscal balance objectively. To know how
much transfer is necessary, one must estimate the difference between the
revenues available to county governments as a whole, and the expenditure needs
of each level of government. This is a subjective matter because expenditure
needs are almost limitless. Most countries that use the vertical balance approach

10
determine a “minimum service level”, and fill the gap with transfers. In some
cases, the amount of transfers is determined by a central budget constraint
rather than “minimum requirements” approach. Alternatively, historical
spending levels are used to determine county government needs. The Kenyan
transfer system uses the historical spending levels to determine the amount of
transfers due to county governments.
1.3. Features of a Good Transfer System
Though the manner in which a transfer program is structured and the method
used to divide its funds among eligible county governments is a political process,
the design of the mechanism should be guided by sound principles. Transfer
systems should therefore obey the following principles:
a) Provide adequate revenues to county governments to undertake their
assigned functions;
b) Preserve budget autonomy at the county government level. While there are
sound policy arguments for conditional (targeted) transfers, general purpose
transfers and equalization, funding should be lump-sum in nature and
unconditional. Benefits from decentralization arise due to increased flexibility
and spending discretion at the county government;
c) Support a fair allocation system. More resources should be given to counties
with low tax capacity and greater fiscal needs. While fairness is a subjective
social concept, a transfer system that provides disproportionately more
resources to wealthier county governments are often considered unfair.
d) Provide predictable resources and be dynamic. The formula should be stable
over a period of years to promote multi-year planning and overall budget
certainty;
e) Be simple and transparent. Simple in terms of clarity of objective it is
addressing and transparent in terms of the formula being understandable to
all stakeholders, and not being subject to political manipulation or
negotiation in any of its aspects;
f) Avoid negative incentives for revenue mobilization by county governments,
and inefficient expenditure choices. For example, negative incentive to
revenue mobilization would be created if the amount of transfer is reduced
every time a county government made a greater effort to increase their own
revenues. Similar negative inducements to expenditure choices are present if
the amount to be received from the intergovernmental transfer is increased
when governments hire more employees or hoard excess physical capacity in
the form of half empty hospitals or idle classrooms, or when the national

11
government provides „deficit grants‟ to cover county governments deficits at
the end of the year. This gives governments an incentive to incur budget
deficits.
g) Avoid sudden large changes in funding for county governments. It takes time
for government to build additional capacity to absorb an increase in funding
and similarly to dispose of idle capacity in case of a funding cut. Therefore,
changes in the funding formula should strive to hold county governments
„harmless; during the transition to a new allocation formula

12
2.0. THE FIRST REVENUE SHARING FORMULA
In accordance with the provisions of Article 216 (1)(a) (b) the Commission
prepared the first revenue sharing formula which was approved by the National
Assembly in November 2012. The formula was based on five parameters, namely:
population, poverty, land area, basic equal share and fiscal responsibility. This is
summarized in Table 3 below.
Table 3: The First Revenue Sharing Formula
Parameter Population Equal
Share
Poverty
Gap
Land
Area
Fiscal
Responsibility Total
Weights
(%) 45 25 20 8 2 100
Source: Commission on Revenue Allocation 2016
The formula sought to achieve two objectives: service delivery and redistribution.
To achieve the service delivery objective, the Commission used population, equal
share, land area, and fiscal responsibility parameters. The poverty gap parameter
was used to achieve the redistribution objective.
Population was used as a measure of the expenditure needs of counties. On the
basis of a county‟s share of population, counties shared 45 per cent of revenues.
To enable counties meet the fixed costs of setting up and running the government
machinery, 25 per cent of the revenues were allocated equally among all the
counties.
The Constitution requires county governments to exercise fiscal discipline
(Article 201(d)). To incentivize counties to optimize their fiscal capacity and
efficiency to raise revenues (Article 203 (1)(e) and (i)), the Commission
incorporated in the formula, a fiscal responsibility parameter that allocated all
counties equal amounts to enable them set up credible financial systems. The
county governments were formed after the general elections of 3rd March 2013,
long after the approval of the formula in November 2012.
The Commission observed in its first revenue sharing formula that counties with
large land area incur additional costs to provide a comparable level of service.
This is because the cost of providing services increases with the geographic size
of a county but at a decreasing rate. However, beyond a certain point,

13
incremental costs of larger distances become negligible. The formula used Land
area as a proxy for costs of service delivery. The Commission also observed that
some counties with small areas have to incur certain minimum costs in
establishing the framework of government machinery. In specific instance, the
costs of providing services in some small counties may be higher because of
terrain. The formula shared 8 per cent of the revenues based on the size of a
county as measured by the county‟s land area. The use of the land area parameter
was capped between one percent and ten per cent of the total land area for small
and big counties, respectively. This was important to ensure allocations take into
account the costs associated with terrain.
To achieve the redistributive objective, the Commission used poverty gap as a
measure of deprivation across counties. On the basis of a county‟s share of
poverty gap, 20 per cent of revenues was shared among the counties. The
revenues allocated to county governments for the financial years 2012/13;
2013/14; and 2014/15 and 2015/16 using the first revenue sharing formula are as
shown in Appendix I.
In accordance with the legislative provisions in Article 216 (1); Article 217 (1) and
the sixth schedule section 16, the second determination of the basis of the
division of revenue among counties (the second revenue sharing formula) need to
be in place for the sharing of revenues among counties for financial years
2016/17; 2017/18 and 2018/19.
THE FIRST REVENUE SHARING FORMULA
Source: Commission on Revenue Allocation 2016
POPULATION
EQUAL SHARE
LEVELS OF
POVERTY
LAND AREA
FISCAL RESPONSIBILITY
100%
45%
25% 20% 8%
2%

14
2.0 THE SECOND REVENUE SHARING FORMULA
2.1 Methodology for Preparation of the Second Revenue
Sharing Formula
In exercising the principle of openness and public participation in financial
matters (Article 201(a)), the Commission has used a participatory approach in
the preparation of the second revenue sharing formula. This involves
triangulation of information collected from review of the first revenue sharing
formula; review of international literature on intergovernmental transfers;
submissions of memoranda by various independent institutions and county
governments; focus group discussions with county governments and experts, and
analysis of information collected from online questionnaires and questionnaires
administered at county level.
2.2 Consultations with County Stakeholders
The Commission held discussions with the County Executive, County Assembly
Budget and Appropriations Committee members and other county stakeholders
composed of the public, religious organization, civil society organization, youth
organization, academia, professional bodies, and trade unions, among others, in
45 counties. A total of 2,880 participants attended the various forums. A total of
1,993 questionnaires were administered and analysed. The analysed data
revealed that 25 percent of the respondents recommended that the first revenue
sharing formula be used as is for the next three financial years. A total of 66 per
cent recommended review of the formula. The aggregate responses on individual
parameter weights are summarized in Table 4.
Table 4: Summary of Aggregate Responses from Counties on Review
of the First Revenue Sharing Formula
County
Recommendation Population Poverty
Land Area
Fiscal Responsibility
Basic Equal Share
Number of Counties making the Proposal
Increase 8 41 27 35 22
Retain 1 2 7 10 6
Decrease 36 2 11 0 17
Total Counties 45 45 45 45 45
Source: Commission on Revenue Allocation Survey Data, 2014

15
The county governments and stakeholders recommended retention of the five
parameters used in the first revenue sharing formula. They nonetheless,
recommended for review of the weights assigned to all the five parameters. In
addition, they recommended that additional parameters be considered for
inclusion into the second revenue sharing formula. The proposed parameters
include: infrastructure; terrain; population density; urbanisation; absorption
capacity of counties; dependency ratio; county contribution to gross domestic
product; land productivity, fiscal gap, level of marginalisation, and aridity, among
others. Given that it is not possible to consider inclusion of all these parameters
in one formula, a rationale for the choice of the parameters in the second
revenue sharing formula is provided in section 3.6 below.
2.3 Review of literature on Intergovernmental Transfers
The approach used for intergovernmental transfers is largely guided by the
general purpose of the transfer. Generally, most transfers are aimed at achieving
two objectives, the service delivery and redistribution objectives. The devolved
system of governance in Kenya is at the nascent stages and therefore the need to
learn from the experiences of both the developed and developing countries which
have implemented intergovernmental transfers over a period of time.
Experiences of four different countries are summarized below.
2.3.1 South Africa South Africa has three levels of government; national, provincial and local
authorities. The three levels of government have different tax assignment
responsibilities. The revenue sharing has been reviewed three times, with each
review having different objectives. Overall the revenue sharing formula in South
Africa uses a sector wide approach in determining the revenue allocated to the
three levels of government.
The provinces in South Africa depend on the equitable revenue transfers from
national revenue as their own revenue is not sufficient. The formula used is based
on a sectoral model and the weights assigned to each parameter depend on the
level of needs. The needs for each province is calculated and summed to arrive at
the share of the transfer.
In general, the South African model has three components: (i) Basic grant to
enable sub national governments to establish and maintain the institutions
necessary for the fulfillment of their constitutional obligations according to their
own priorities; (ii) The national standards grant to enable the sub national
government specifically to provide primary and secondary education and primary

16
health-care to their residents; and (iii) tax capacity equalization grant to
encourage provinces to take responsibility for raising their own revenue. This
component of the formula is an essential element in developing provincial
accountability for expenditures. In addition, the training hospitals get separate
conditional grants to supplement the funds they receive from the equitable share.
Education is fully devolved in South Africa and assigned the highest weight in all
the reviews of the formula. Over time the weight on the parameter has increased
from 38% in financial year 1997/98 to 41% in 1999/2000 to 48% in 2011/12. The
health parameter has also been used in all the reviews. A weight of 18% was
assigned to the health parameter in 1997/98, 19% in 1999/2000 and 27% in
2011/12. The social development parameter was assigned a weight of 18% in
1999/2000 and the basic services parameter was used in 2011/12 formula. The
social development parameter, which gives an allocation for every poor
household, was assigned a weight of 16%.
2.3.2 Ethiopia Ethiopia is a federal republic composed of 10 regional states and Addis Ababa,
which is a city administration. The Federal and Regional governments share the
expenditure and revenue tax base. In order to address the vertical and horizontal
fiscal imbalances, Ethiopia introduced Federal subsidy grants based on the
regional fiscal gaps. Fiscal gap is measured by Fiscal capacity (revenue capacity)
and the Fiscal needs (expenditure needs) of the regional states. Addis Ababa
being the capital city is not included in the federal grant allocation formula.
A block budget subsidy allocation formula is used to allocate revenues to states
depending on the expenditure needs and revenue raising capacities. The
allocation formula is adjusted for disability factors, price differences, dispersion
factors, slope, poverty, unemployment and economies of scale.
The main parameters used in the revenue allocation formulae include Population,
distance from highest per capita income, poverty, own revenue to budget ratio,
land area, expenditure needs, revenue raising effort and sectoral output
performance. The population parameter is a key parameter and has been used in
all the revenue allocation formulas. The weight assigned to the parameter
increased substantially from 33% in 1995/96 to 60% in 1997/98 before reducing
slightly to 50% in 2001/02. The level of expenditure needs which measures the
fiscal gap was assigned 33% in 1995/96, 25% in 1997/98 and 20% in 2001/02. To
encourage the sub national governments collect their own revenue, the country
used a parameter of own revenue to budget ratio and assigned it a weight of 20%

17
in 1995/96, 33% in 1997/98 and 15% in 2001/02. The third review of 2001/02
introduced a parameter on poverty with a weight of 10%.
2.3.3 Philippines Philippines has four levels of government, namely; provinces, cities,
municipalities and the village-level barangays. The revenue sharing criteria is
incorporated in the legislation and therefore is not reviewed periodically although
they have pre and post 1991 legislations. The sharing of revenue for Philippines is
based on the Government Code Acts which was enacted in 1991. The formula uses
three parameters namely population, land area and equal share to address both
service delivery and redistributive objectives of equitable sharing of revenue.
The population parameter was assigned a weight of 70% pre 1991, land area 20%
and equal share 10%. Post 1991 law reviewed the weights of the parameters and
assigned population 50%, land area 25% and equal share 25%.
2.3.4 India Devolution in India is in two levels, the national and states. The Finance
Commission which is responsible for revenue sharing is appointed every five
years to review the formula. The main parameters that were used in the 11th, 12th
and 13th commissions are population, land area, fiscal capacity distance, fiscal
discipline, revenue effort, per capita income, index of decentralization and index
of deprivation (poverty).
Population is one of the key parameters that has been used consistently over the
years and was assigned weights of 40%; 40%; and 25% in the 11th, 12th and 13th
commissions, respectively. The parameter of geographical land area was used to
cater for additional cost that the large areas incur to provide a comparable
standard of service in the states and was assigned a weight 0f 10% in the three
reviews. The fiscal responsibility is used to incentivize the states to collect their
own revenue. India mainly uses revenue effort, fiscal discipline and fiscal
distance to measure fiscal responsibility. The weight assigned to fiscal effort was
10% in the 11th and 20% in the 12th commissions. The fiscal capacity distance and
fiscal discipline were assigned weights of 47.5% and 17.5%, respectively in the 13th
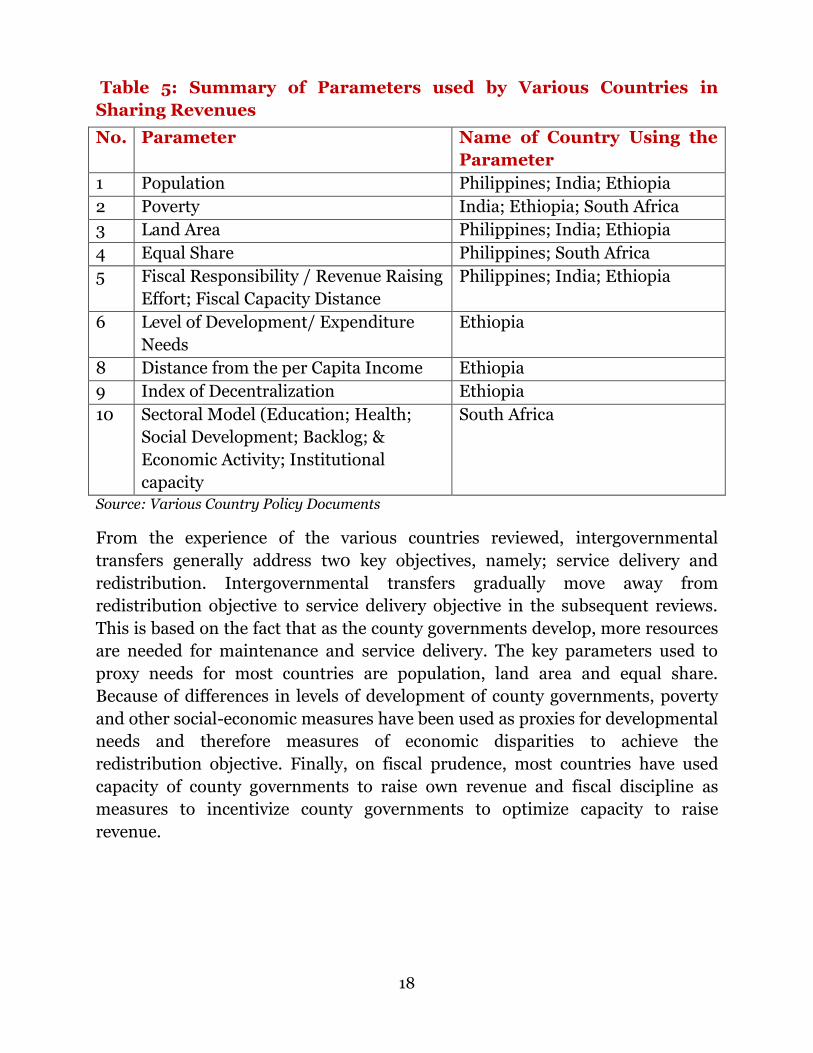
review commission. Table 5 provides a summary on Parameters used by different
countries.
18
Table 5: Summary of Parameters used by Various Countries in
Sharing Revenues
No. Parameter Name of Country Using the
Parameter
1 Population Philippines; India; Ethiopia
2 Poverty India; Ethiopia; South Africa
3 Land Area Philippines; India; Ethiopia
4 Equal Share Philippines; South Africa
5 Fiscal Responsibility / Revenue Raising
Effort; Fiscal Capacity Distance
Philippines; India; Ethiopia
6 Level of Development/ Expenditure
Needs
Ethiopia
8 Distance from the per Capita Income Ethiopia
9 Index of Decentralization Ethiopia
10 Sectoral Model (Education; Health;
Social Development; Backlog; &
Economic Activity; Institutional
capacity
South Africa
Source: Various Country Policy Documents
From the experience of the various countries reviewed, intergovernmental
transfers generally address tw0 key objectives, namely; service delivery and
redistribution. Intergovernmental transfers gradually move away from
redistribution objective to service delivery objective in the subsequent reviews.
This is based on the fact that as the county governments develop, more resources
are needed for maintenance and service delivery. The key parameters used to
proxy needs for most countries are population, land area and equal share.
Because of differences in levels of development of county governments, poverty
and other social-economic measures have been used as proxies for developmental
needs and therefore measures of economic disparities to achieve the
redistribution objective. Finally, on fiscal prudence, most countries have used
capacity of county governments to raise own revenue and fiscal discipline as
measures to incentivize county governments to optimize capacity to raise
revenue.

19
3.4. Consultations with Experts
A report on the consultations with the county governments, submissions of
memoranda and review of international literature on intergovernmental transfers
was subjected to further discussion with experts from different institutions. This
included representatives of county governments (Executive Committee Members
of Finance and the Chairmen of the County Assembly Budget and Appropriations
Committee); Kenya Institute of Public Policy Research Analysis (KIPPRA), Kenya
National Bureau of Statistics (KNBS), public and private universities, National
Treasury, Committee on Implementation of the Constitution, Law Society of
Kenya, Kenya Tax Payers Association, Kenya Association of Manufacturers, and
Development Partners, among others.
The experts agreed with the county government recommendation on the
retention of the five parameters used in the first formula with different weighting
to accommodate inclusion of two additional parameters, namely; infrastructure
and social development. To open up counties and reduce the cost of service
delivery, counties should be given additional funds for construction and
maintenance of roads and for provision of electricity. Further, to address social
economic disparities across counties, another parameter which captures the
social economic disparities among counties apart from poverty should also be
included in the second revenue sharing formula. A proposal was made that a
social development index be constructed based on education, health, and urban
settlement.
3.5. Consultations with Governors
A draft formula based on seven parameters, namely population, equal share,
poverty, land area, fiscal responsibility, infrastructure and social development
index was presented to the Governors for further consultations. Whereas the
Governors were in agreement with the use of the five parameters used in the first
revenue sharing formula, they recommended that infrastructure and the social
development factors be combined into one parameter, the development factor
index. In addition, a recommendation was made for inclusion of a new parameter
to cushion counties with high personnel emolument costs for a limited period as
both the national and county governments address the challenge of staff
rationalization.

20
3.6. CRA FIRST RECOMMENDATION ON THE SECOND BASIS
FOR REVENUE SHARING AMONG COUNTIES
Following extensive consultations, the commission made a recommendation on
the second basis for revenue sharing as summarized below:
Table 6: First CRA Submission on the Second Basis for Revenue
Sharing among counties
No. Parameter First Revenue Sharing Formula
First CRA Submission on the Second Basis for
Revenue Sharing among counties
1 Population 45 45
2 Equal Share 25 25
3 Poverty 20 18
4 Land Area 8 8
5 Fiscal Effort 2 1
6 Development Factor - 1 7 Personnel
Emolument -
2
Total 100 100 Source CRA 2015
The above recommendation on the second basis for revenue sharing among
county governments was adopted by the Senate Committee on Finance,
Commerce and Budget. However, it was rejected in the floor of the house in 2015
for the following reasons, among others:
1. The challenge of continuing to use the population census data of 2009
whose accuracy for a number of counties had been challenged,
2. A higher weight on the population parameter which ignores the fact that
demographic changes have taken place since 2009 when the census was
undertaken,
3. Preference for a sectoral needs based approach to revenue sharing as
opposed to a macro model to address the unique county developmental
needs,
4. Introduction of a parameter on Personnel Emolument to caution counties
with higher wage bill was considered a negative incentive. Senators
observed that the allocation could encourage county governments to hire
additional new staff, hence bloating the payroll further. A proposal was

21
made for a conditional allocations from the national government share to
the county governments that inherited a huge wage bill for a period of time
as the national government implemented a new policy to rationalizes the
wage bill in the country,
5. Fiscal Responsibility parameter should have been based on efficiency
margins in revenue collections rather than actual own revenue collections
per county.
6. A proposal was made for the introduction of a measure of county fiscal gap
into the formula to ensure counties with low revenue potential get
adequate revenue,
7. Marginalized counties need extra allocation to bring services in these areas
to the level currently enjoyed in other areas. The allocations through the
Equalization Fund are not sufficient,
8. Affirmative action parameters should be introduced into the formula to
ensure that the less populated and marginalized counties are adequate
resources for service delivery,
9. The formula should provide for an allocation to Senate from the equitable
share for purposes of monitoring and evaluation; capacity building and
entrenching of devolution,
10. The formula should adopt the Constituency Development Fund formula
and share at least 50 percent of the equitable share equally among all
counties,
11. The formula should consider the country‟s contribution to gross domestic
product in the sharing of resources. Those counties that contribute the
highest to GDP should be incentivized to maximize their potential, and
12. The high weight on poverty and land area over-compensates maginalised
counties at the expense of service delivery in the other counties. The weight
on these two parameters should be reduced and instead the weight on
population increased.

22
3.7. Revised Second Submission on the Second Basis for Revenue
Sharing Among County Governments
Following the rejection of the CRA submission on the second revenue sharing
formula by the Senate, the Commission held further discussions with various
stakeholders. The following observations were made:
1. To address over-redistribution, the weight on the parameter on poverty
should be reduced.
2. To reduce the variance on per capita allocation across various counties, the
weight of the equal share parameter should be increased slightly and the
weight on population retained.
3. A new parameter to capture economic inequalities across counties should
be considered in the revised formula. The parameter, to be based on access
to roads, electricity and water. This will ensure that the development index
is different from the poverty index used in the formula.
4. The Fiscal index should growth in revenues as opposed to absolute
revenue collection of counties. This will indirectly address the variations in
revenue potential of counties.
3.8. The Rationale for Choice of the Parameters
The Commission recommends the use of six parameters in the second revenue
sharing formula. These are: Population, Basic Equal Share, Land Area,
Poverty index, Fiscal index, and Development index. The rationale for
the choice of parameters is as summarised below:
3.8.1. Population Population is a good measure of the expenditure needs of a county. It is a simple,
objective and transparent measure that ensures predictability. Article 203 (1)(j)
provides for stable and predictable allocations of revenues to counties. The
Population parameter guarantees this predictability and also ensures equal per
capita transfers to all counties. The use of this parameter also ensures that people
are treated equally, irrespective of which county they belong to. The allocation to
counties based on this parameter is therefore intended to ensure that County
governments are able to perform the functions allocated to them in accordance
with Article 203(d).
The highly populated Counties, namely: Nairobi; Kakamega; Kiambu; Nakuru;
Bungoma; Meru, Murang‟a and Kilifi recommended that the weight assigned to
the population parameter on population be increased above 45 per cent to enable

23
counties with high population be able to get adequate resources to be able to
perform functions allocated to them. However, 36 other counties with average to
low population densities recommended a reduction of the weight on this
Parameter on account that those counties with high population also happened to
be the former provincial headquarters. Highly populated counties enjoy pull
factors such as good infrastructure and security, by virtue of having benefitted
from centralised allocation of resources perpetuated by the former centralized
system of government. These Counties also have good revenue potential from
property taxes, entertainment taxes and fees from services offered to their vast
populations. In addition, given that their populations are concentrated in small
areas, the costs of providing services in these counties are also low compared to
expensive counties which are sparsely populated due to economies of scale.
It is also important to appreciate the fact that there is merit in maintain the
service delivery levels in the high potential areas through adequate provision of
resources for maintenance of services such as health, road, water and electricity.
This will ensure that overall, as devolution addresses improvement of services
delivery in hitherto marginalised areas, services in the highly populated counties
are not compromised.
The Commission recommends that the weight of the parameter on
population be retained at 45 per cent in the revised second basis for
revenue sharing among county governments.
3.8.2. Basic Equal Share Provision of a basic equal share in a transfer system is meant to guarantee a
minimum funding for certain key functions, such as administrative costs of
setting up and a running a government. This is based on the assumption that a
number of expenditures, to a small extent, are similar for all county governments.
For instance, irrespective size and population, each county government has an
assembly and a governor.
However, use of the basic equal share is not without challenges. An exaggerated
use of equal shares (high criteria weight) may lead to bad incentives and
inefficiency in allocation as various county governments do not have the same
expenditure needs due to differences in size as defined by population size, land
area and geographical location.
Secondly, and more importantly, the use of equal shares as a factor in the
allocation formula raises a question of basic fairness. If the equal share system is

24
used as an allocation principle, regions with fewer residents would receive much
larger transfers per person. This violates a basic principle of fairness in a
democratic system of county government governance and may lead to pressure to
establish new and non-viable county government units.
Although 22 county governments, mainly comprising counties with low
population were of the opinion that the weight on equal share be increased, 17
counties with medium to high population recommended for a reduction of the
weight on this parameter. The experts also observed that the weight in this
parameter needs to be maintained at a lower level and should be based on actual
expenditure needs that are similar across counties.
The Commission recommends that the weight of the parameter on
basic equal share be increased slightly from 25 per cent to 26 percent
in the revised second basis for revenue sharing among county
governments.
3.8.3. Poverty A poverty index provides a measure of welfare of the citizens. It is therefore a
good proxy of developmental needs and economic disparities among counties.
Use of this parameter in the formula guarantees allocations of revenue to
disadvantaged areas which also happen to be the counties with the greatest need.
This is in line with Article 203 (1)(f)(g)(i). Basic principles of intergovernmental
fiscal transfers provide that more resources need to be given to counties with the
greatest need.
There are several measures of poverty. The poverty head count measures the
proportion of the population that is poor based on both the basic minimum food
calorific intake and ability to afford essential non-food needs. The poverty head
county does not measure the depth of poverty thereby treating all poor people as
a homogeneous group, when in actual sense, the intensity of poverty varies from
one county to another. The poor are confronted with the different challenges and
opportunities with varying outcomes.
Poverty Gap measures the extent to which individuals or households fall below
the poverty line. It measures depth of poverty. Therefore, the poverty gap
provides a measure of resources required to lift the poor out of poverty.
Poverty Severity is the square of the poverty gap. This measures the inequality
among the poor. The index is used to target resources to the poorest of the poor.

25
The poverty gap was the measure used in the first revenue sharing formula. This
was based on the Kenya Integrated Household Budget Survey conducted in
2005/06 by the Kenya National Bureau of Statistics. The poverty measurement
was estimated from very detailed data on individuals and households. The survey
covered 13,158 households with 55,263 individuals sampled from 1,339 clusters.
A cluster is either equivalent to a village/several villages or part of a village. The
data on poverty for 2005/06 and 2009 is presented in Appendix VII.
The poverty gap measure used in the revised second revenue sharing formula was
calculated using the Kenya Integrated Household Budget Survey 2005/06 and
the 2009 Kenya Population and Housing Census through small area estimation
model. The model uses survey data and census data to calculate per person
consumption expenditure for 8.7 million census households. Accordingly, the gap
represents the 2009 situation, but at 2006 prices. The estimated numbers of poor
is obtained based on the rural or urban poverty line. The poverty estimate is
derived using total population as opposed to sample population as in the case of
2005/06.
A large number of counties (41) recommended for the increase of the weight on
the poverty parameter. International experience has shown that this parameter
has been used at a maximum weight of 10 percent and below in India, Ethiopia
and South Africa. The experts recommended that the use of this parameter
should be reduced gradually with the intention of dropping it from the formula
because of its negative incentive to address poverty comprehensively and
susceptibility to data manipulation.
The Commission recommends that the weight of the parameter on
poverty gap be reduced slightly from 20 per cent to 18 per cent in the
revised second basis for revenue sharing among county governments.

26
3.8.4. Land Area Article 260 defines land to include the surface of water on or under the surface;
marine waters in the territorial sea and exclusive economic zone; natural
resources completely contained on or under the surface; and the air space above
the surface. In total, Kenya covers an area of 581,313 km2. The area is shared
among the 47 county governments as shown in Appendix VI.
The use of the size of a county (Land Area) as a parameter in the formula for
sharing of revenues is informed by the fact that a county with a larger area has to
incur additional administrative costs to deliver a comparable standard of service
to its citizens. However, it is important to note that the differences in the costs of
providing services may increase with the size of a county, but only at a decreasing
rate and that beyond a certain point, incremental costs may became negligible.
Further, it is important to note that even counties with small land areas, also
have to incur certain minimum costs in establishing government machinery and
the costs of providing services in some of these small counties may be higher
because of the terrain. In this regard, the Commission in the first revenue sharing
capped the maximum share on land at 10 percent and the minimum at one
percent. The recommendation on the second revenue sharing formula uncapped
the parameter on land area. This is because a parameter on development which
takes into account county developmental needs of a county in terms of; roads,
electricity and waters is introduced into the formula.
The allocation of revenues to counties based on the land parameter in the first
revenue sharing formula was meant to provide counties with adequate resources
to cater for costs related to service delivery and infrastructure development.
However, the Commission recognizes the fact that land area of a county is fixed is
a fixed parameter, making it impossible to assess the impact of the funds
allocated to Counties based on this parameter. In effect, this parameter makes
the revenue sharing formula a static formula. A formula needs to be dynamic to
enable periodic reviews to assess its impact in terms of achieving its specified
objectives.
More than 50 per cent of the counties (27) recommended that the weight on the
parameter on land area be increased above 8 per cent. Philippines, India and
Ethiopia have used land area as measure of cost of service delivery. Experts
recommended for the reduction of the weight on the parameter on land areas on
grounds that the allocation of revenues to counties on land area should be for
purposes of the differences across counties based on cost of service delivery.

27
Allocations to counties for infrastructure development should be based on an
infrastructure index of a composite development index. Inclusion of a parameter
on Infrastructure was recommended by both the county stakeholders and the
experts.
The Commission recommends that the parameter on land area be
uncapped and its weight be retained at 8 per cent in the second basis
for revenue sharing among county governments.
3.8.5. Fiscal Effort County governments receive transfers, collect and utilize public resources. Public
officers are required to ensure public finances entrusted to them are not only
used for the purposes they were meant for, but also used prudently. Fiscal
responsibility entails implementation of sound economic and budgetary
practices to ensure citizens get value for money. Achieving fiscal responsibility
requires deliberate measures to: strengthen the legal framework for anti-
corruption, ethics and integrity; promotion of results-based management
within the public service; allowing the public access to information and data;
introducing civilian oversight around the key legal, justice and security
institutions; and strengthening Parliament‟s legislative oversight capacity. The
first revenue sharing formula allocated equally to all counties an equivalent of
two percent of the equitable share to all counties to undertake fiscal reforms
needed to enhance revenue collection and utilization.
The revised second revenue sharing formula recommends the use of fiscal effort
as measured by the increase in county own revenue per capita for the financial
years 2013/14 and 2014/15. The Commission seeks to encourage fiscal prudence
in accordance with the provisions of Article 216 (3) (c) which provides for
provision of incentives for each county to optimize capacity to raise revenue. A
recommendation on fiscal effort requires reliable information on the
performance of Public Finance Management systems, processes and institutions
over time. This information besides being used to share resources
among county governments, will also inform the government reform
process by determining the extent to which reforms are yielding improved
performance and by increasing the ability to identify and learn from reform
success.
County governments are required to exercise fiscal prudence. The Public Finance
Management Act, 2012 sets out fiscal responsibility principles to both levels of

28
government. Section 107 (2) sets out the following fiscal responsibility principles
to be enforced by the County Treasury:
a) The County government's recurrent expenditure shall not exceed the county
government's total revenue;
b) Over the medium term a minimum of thirty per cent of the county
government's budget shall be allocated to the development expenditure;
c) The county government's expenditure on wages and benefits for its public
officers shall not exceed a percentage of the county government's total
revenue as prescribed by the County Executive member for finance in
regulations and approved by the County Assembly;
d) Over the medium term, the government's borrowings shall be used only for
the purpose of financing development expenditure and not for recurrent
expenditure;
e) The County debt shall be maintained at a sustainable level as approved by
County Assembly;
f) The fiscal risks be managed prudently; and
g) A reasonable degree of predictability with respect to the level of tax rates and
tax bases be maintained, taking into account any tax reforms that may be
made in the future.
It is on the basis of the foregoing constitutional and legislative provisions that the
Commission recommends that county governments need to be held responsible
on the use of public finances. An objective formula should in addition to
determining a basis for equitable sharing of resources contain a check
mechanism on fiscal responsibility by county governments. Although some
national and county stakeholders were of the view that this parameter be
dropped from the formula, there is adequate support for the retention of the
parameter in the formula. This parameter ensures that county governments take
responsibility to ensure that pubic resources are used prudently. The parameter
will institute timely preparation of budgets, withdrawals and absorption of funds.
It also promotes transparency, accountability and financial probity, and is an
incentive for counties to grow own revenue. The fiscal effort parameter should
provide an incentive to counties to optimize their capacity to raise revenue,
Article 203(1)(e) and (i).
Unlike in the first revenue sharing formula which used the parameter to allocate
equal revenues to all counties to set up financial management systems, the
Commission recommends that allocation to counties based on the fiscal effort

29
parameters be varied depending on a county‟s fiscal effort as measured by the
increase in revenue per capita. Data on revenues raised by counties for two
financial years is presented in Appendix II.
The Commission recommends that the weight on the fiscal effort
parameter in the second basis for revenue sharing among county
governments be retained at two per cent.
3.8.6. Development Factor This is one of the parameters suggested for inclusion by a large number of
stakeholders during CRA‟s extensive country-wide consultations. Ordinarily,
social economic development indicators as used in comparator countries such as
South Africa, Nigeria, Ethiopia, Philippines and India, include five key
components of: poverty, demographic dynamics, education, health and human
settlement.
However, since poverty (in money metric terms) is a stand- alone parameter in
this formula and demographic dynamics such as population growth rates and
density, total fertility and migration, are captured under population and land
area parameters, the development factor in the revised second revenue sharing
formula considered access to water, electricity and roads, to capture
infrastructure needs of counties.
Good infrastructure is a prerequisite for any county to realise meaningful
development. The parameter gives effect to the revenue sharing criteria as
articulated in Article 203 (1)(h) and (g), which requires county developmental
needs and economic disparities among counties be considered in revenue
allocation. Infrastructural disparities among counties include infrastructure for
roads, water, health and electricity.
Use of an index on infrastructure as part of the basis for sharing of revenues
among county governments will realize the twin objectives of service delivery and
redistribution. The measures selected to develop a development factor is based
on key devolved functions of county governments, namely water, roads and
electricity. The Commission developed a factor based on a county‟s share of
unpaved roads under category D, E, F, G, H, J, K, M, N, P; and proportion of
households without access to electricity and water. The construction of the a
development factor is detailed in Appendix II.
The Commission recommends for inclusion of the parameter on
development in the second basis for revenue sharing among county

30
governments as a redistributive parameter with a weight of one
percent.
3.8.7. The Second Recommendation on Revenue Sharing In accordance with the provisions of Article 216 (1)(b), read together with 217
(2)(b) and Sixth Schedule (16), the Commission on Revenue Allocation
recommends a new basis for sharing revenue among county governments. The
recommended basis has six parameters weighted as shown below.
Where:
is revenue allocation of the th County; is Population Factor; is
Equal Share Factor; is Poverty Gap; is Land Area Factor; is
Fiscal Effort Factor; and is Development Factor. The details of the
formula are presented in Appendix II.
No substantial change, in terms of economic disparities among counties, has
occurred in the last two and a half years to warrant a radical overhaul of the
formula. There are minimal changes in the formula: The weights on the
parameter on Population, Equal Share and Land Area are at 45 percent, 26 per
cent and 8 per cent, respectively in second revenue sharing formula. However, to
address the challenge of over-redistribution in the first generation revenue
sharing formula the weight on the parameter on poverty has been reduced from
20 per cent to 18 per cent. The weight on the parameter on fiscal effort weight at
two percent utilizes increase in revenue per capita across counties. A new
parameter, namely: development factor has been introduced with a weight of one
percent. The development factor is a measure of a county‟s developmental needs
as measured by a county‟s need for roads, electricity and water. Though the
changes in the formula seem to be minimal, the change of the underlying data on
the poverty gap for the 47 counties from the KIHBS 2005/06 to 2009 introduces
substantial variations in revenue allocated to counties.

31
THE SUMMARY OF SECOND REVENUE SHARING FORMULA

32
3.8.8. Other Parameters Considered but not Selected During the stakeholder consultations several new parameters were proposed for
inclusion in the second revenue sharing formula. However, the inclusion of all the
proposed parameters was not possible. The reasons behind these are as follows:
Population density: This is a measure of population per Kilometers square of
land area. Population density combines two measures currently used in the First
Revenue Sharing Formula, namely: population and land area. Use of population
density in any formula will negate the use of population and land area in the
same formula. The use of population and land area parameters in the first
revenue sharing formula was meant to achieve two objectives: One, population as
a proxy for County needs to ensure Counties are able to perform functions
allocated to them and two, land area was used as a proxy for County
infrastructure.
Use of population density will only benefit counties with high populations that
are concentrated in small areas thereby relegating the need to redistribute
resources to less developed counties which also happen to be the sparsely
populated areas.
Dependency ratio measures the proportion of the population under fifteen and
over sixty five as a proportion of the active population (between 15 and 65 years).
The active population is not necessarily equivalent to the working population,
given the high unemployment rate among the youth. For this reason, dependency
ratio is not a good measure of a population‟s purchasing power. An analysis of the
2009 population census reveals that the age structure across counties is almost
uniform. Therefore, there is no much variability between the Counties.
Sector Based Approach: Both the county stakeholders and the experts
recommended for a sectoral approach to the sharing of revenues among counties.
The sectoral approach to sharing revenues among counties should be based on
devolved functions as defined in the Constitution under fourth schedule and as
unbundled by the Transition Authority in Gazette notice 16 and 116 of 2013.
The devolved functions can be broadly grouped into the following key sectors:
health, infrastructure, agriculture, education and tourism. The use of a sector
based approach to revenue sharing requires the establishment of unit cost of
different services in different counties based on acceptable norms and standards.
The Commission on Revenue Allocation together with the Transition Authority
has commenced the process of commissioning a comprehensive study to
33
establish unit costs of key devolved functions in different counties based on
acceptable standards and norms in each sector. The Kenya National Bureau of
Statistics is also in the process of commencing collection of data and information
using county integrated household and budget surveys to measures various
outcome indictors. These processes of generating new information will take some
time to complete.
The alternative to the unit cost approach is the use of outcomes indicators in the
various sectors based on the 2009 census data. A service delivery index based on
outcome indicators in key sectors will see more resources going to the least
developed counties. This will make the approach to revenue allocation highly
redistributive which will compromise service delivery in most of the counties.
This is because the 47 counties are at different levels of development. Whereas
some counties enjoy good climatic conditions, roads, schools, hospitals, and
security, a number of counties are very remote with bad roads, ill equipped
schools and hospitals. Attracting qualified workers to this kind of latter counties
will cost the county governments more revenues due to harsh climatic conditions
and insecurity challenges. Therefore, even where a service delivery index is used
as a basis for sharing revenues, this should be used in addition to a parameter on
population to ensure the basis for the sharing of revenue is equitable.
It is important to note that the redistribution of revenues is a progressive process
which, the Constitution envisages will be achieved over a period of years. The
resources being redistributed are being collected from a few counties which enjoy
pull factors such as good security, infrastructure and markets. Majority of the
industries are also located in these counties and they also need provision of
services to be maintained. The Constitution provides that all counties should be
able to perform the functions allocated to them. Equity does not mean making
some counties better off by making others worse of. Therefore, the basis for
revenue sharing should strike a balance between service delivery and
redistribution. Due to lack of data on what should constitute acceptable levels of
service delivery, it is not possible to use the sector approach to revenue sharing
A multidimensional poverty Index: This measure encompasses a range of
deprivations that a household may suffer. The poor suffer from lack of good
health, education, housing, empowerment, and employment, among others.
Therefore, no one indicator such as income or consumption can uniquely capture
the multiple aspects that contribute to poverty.

34
The Kenya National Bureau of Statistics is in the process of domesticating a new
methodology to measure the multidimensional aspect of poverty referred to as
Multidimensional Poverty Index. The index identifies the poor based on the
intensity of deprivations they suffer. The current global Multidimensional
Poverty Index uses three dimensions with corresponding indicators as shown in
the Table 6 below.
Table 6: Measures of the Multidimensional Poverty Index
Dimensions of
poverty Indicator Deprived if...
Education
Years of Schooling No household member has completed five
years of schooling Child School
Attendance
Any school-aged child is not attending school
up to class 8+
Health
Child Mortality Any child has died in the family
Nutrition Any adult or child for whom there is
nutritional information is
malnourished
Living Standard
Electricity The household has no electricity
Improved
Sanitation
The household‟s sanitation facility is not
improved (according to MDG guidelines),
or it is improved but shared with other
household
Improved
Drinking Water
The household does not have access to
improved drinking water (according to
MDG guidelines) or safe drinking water is
more than a 30-minute walk from home,
round trip Flooring The household has a dirt, sand or dung floor
Cooking Fuel The household cooks with dung, wood or
charcoal
Assets ownership
The household does not own more than
one radio, TV, telephone, bike, motorbike
or refrigerator and does not own a car or
truck Source: Kenya National Bureau of Statistic, 2014
The index needs to be domesticated by adding more dimensions of poverty to suit
the need the parameter is intended to address in Kenya. The main objective of
poverty index parameter in the revenue sharing formula is to redistribute
resources with the aim of addressing the issue of inequality and welfare
improvement of the citizens. Article 203 (1)(g) and (h) specifies the need to
address economic disparities within and among Counties and the need to remedy

35
them; through affirmative action in respect of disadvantaged areas and groups.
The Commission together with Kenya National Bureau of Statistics and other
development partners are working together to have the index ready for
consideration in the third revenue sharing formula.
4.0 THE APPLICATION OF CRITERIA OF ARTICLE 203
Article 217 (2) provides that in determining the basis of revenue sharing among
counties, the criteria specified in Article 203 should be taken into account. The
Commission wishes to submit that the criteria in Article 203(1) can be divided
into two. The criteria specified in Article 203 (1) (a) to (c) are applicable in
determining the equitable shares between the national government and the
county governments and the criteria specified in Article 203 (1) (d) to (k) are
applicable in determining the equitable shares among the county governments.
The section below explains how the parameters selected for the second revenue
sharing formula meets the requirements of Article 203 (1) (d) to (k).
4.1. How CRA’s Revenue Sharing Formula Applies to Article 203.
Article 203 (1) (d) Ability of county governments to perform
functions allocated to them: This is well catered for by the constitutional
principle of „resources follow functions‟ under Article 187(2)(a) “If a function or
power is transferred from a government at one level to a government at the
other level – arrangements shall be put in place to ensure that the resources
necessary for the performance if the function or exercise of the power are
transferred”. The allocations recommended by the Commission uses population,
the basic equal share and personnel emolument factor to ensure that each county
receives adequate revenues to be able to offer service delivery to its citizenry.
Article 203 (1) (e) and (i) Fiscal capacity and efficiency of county
governments and the need to incentivize counties to optimize
capacity to raise revenue
The formula uses poverty gap, and the development factor to allocate more
revenues to counties with low tax capacity and greater fiscal needs. The formula
also takes into account the potential of counties in raising their own revenue. The
fiscal responsibility parameter uses a measure of fiscal effort to allocate more
revenues to those counties that have put in more effort to collect revenues due to
them.

36
Article 203 (1) (f) (g) and (h): Developmental needs and Economic
disparities within and among counties and the need to remedy them
through affirmative action
Three parameters in the second revenue sharing formula, namely; land area,
poverty gap and development factor are used to redistribute revenue to counties
so as to address development needs and economic disparities among counties.
The Land area parameter ensures that large counties which incur high
administrative costs in providing a comparable service are given more resources.
The poverty gap allocates more revenues to the disadvantaged counties which
exhibit higher levels of deprivation. The development factor provides more
resources to counties with low water and electricity connectivity, and those with
unpaved road.
Article 203 (1) (j): Desirability of stable and predictable allocations
of revenue
The recommended formula once approved will be used for a period of three
financial years before the next review. Therefore, revenues will remain stable and
predictable over this period of years to promote multi-year planning and overall
budget certainty.
Article 203 (1) (k): The need for flexibility in responding to
emergencies and other temporary needs, based on similar objective
criteria
The formula allocates a lump sum amount to various counties thereby preserving
budget autonomy at the county level. While there are sound policy arguments for
conditional or targeted transfers, the formula allocates a general purpose
transfers to be used in line with counties specific priorities. Therefore, county
governments have increased flexibility and spending discretion including
flexibility in responding to emergencies and other temporary needs.

37
Appendix I: Aggregate Annual Allocations to County Governments
Based on the First Revenue Sharing Formula (Ksh. Millions).
NO. County FINANCIAL YEARS
2012/20131 2013/2014 2014/2015 2015/16
1 Mombasa 196 3,802 4,535 5,198
2 Kwale 193 3,749 4,472 5,126
3 Kilifi 280 5,443 6,493 7,441
4 Tana-River 150 2,914 3,477 3,985
5 Lamu 77 1,501 1,790 2,052
6 Taita-Taveta 125 2,421 2,888 3,310
7 Garissa 217 4,221 5,036 5,772
8 Wajir 272 5,290 6,311 7,233
9 Mandera 337 6,550 7,814 8,956
10 Marsabit 195 3,796 4,528 5,189
11 Isiolo 115 2,236 2,667 3,057
12 Meru 245 4,750 5,666 6,494
13 Tharaka-Nithi
118 2,295 2,738 3,138
14 Embu 145 2,807 3,349 3,838
15 Kitui 274 5,315 6,341 7,267
16 Machakos 255 4,951 5,906 6,769
17 Makueni 225 4,366 5,209 5,970
18 Nyandarua 162 3,150 3,758 4,307
19 Nyeri 168 3,254 3,882 4,449
20 Kirinyaga 133 2,588 3,087 3,538
21 Murang'a 202 3,917 4,673 5,356
22 Kiambu 281 5,459 6,512 7,464
23 Turkana 395 7,664 9,143 10,479
24 West Pokot 162 3,155 3,764 4,314
1 The Allocation for financial year 2012/2013 only covered three months (March to June 2013)

38
NO. County FINANCIAL YEARS
2012/20131 2013/2014 2014/2015 2015/16
25 Samburu 134 2,598 3,099 3,552
26 Trans-Nzoia 192 3,730 4,450 5,100
27 Uasin-Gishu 195 3,797 4,529 5,191
28 Elgeyo-Marakwet
123 2,392 2,854 3,270
29 Nandi 179 3,478 4,149 4,755
30 Baringo 167 3,248 3,875 4,441
31 Laikipia 130 2,523 3,010 3,450
32 Nakuru 306 5,936 7,082 8,116
33 Narok 199 3,868 4,614 5,288
34 Kajiado 166 3,227 3,850 4,413
35 Kericho 170 3,295 3,931 4,487
36 Bomet 177 3,443 4,107 4,725
37 Kakamega 335 6,516 7,773 8,908
38 Vihiga 146 2,832 3,378 3,871
39 Bungoma 289 5,614 6,697 7,676
40 Busia 205 3,979 4,747 5,440
41 Siaya 188 3,654 4,359 4,995
42 Kisumu 214 4,155 4,957 5,681
43 Homa-Bay 212 4,121 4,917 5,635
44 Migori 220 4,269 5,093 5,837
45 Kisii 267 5,188 6,189 7,094
46 Nyamira 156 3,039 3,625 4,155
47 Nairobi City 489 9,506 11,340 12,997
Totals 9,784 190,000 226,660 259,775
Source: Commission on Revenue Allocation/County Allocation of Revenue Acts,
2013; 2014; & 2015

39
Appendix II: The Second Revenue Sharing Formula
Where:
is revenue allocation of the th County; is Population Factor; is
Basic Equal Share Factor; is Poverty Gap; is Land Area Factor;
is Fiscal Effort Factor; is and is Development Factor.
Where,
Population ( )
Basic Equal Share ( )
Poverty Index ( )
Land Area (
(
Fiscal Effort ( )
Where,

40
Development Factor ( )
(
∑ (
∑ (
(
∑
))
Where,
- Proportion of household with access to electricity of the County
- Proportion of household without access to improved water of the County
- Un-paved road network of class D, E, F, G, H, J, K, M, N & P of the
County

41
Appendix III: Revenue Sharing Formula Allocation Factors (%)
No County Population Basic Equal share
Poverty Gap
Land Area
Fiscal Respons
ibility
Development Factor
Combined Factor
1 Mombasa 2.43 2.13 3.15 0.04 10.57 1.20 2.44
2 Kwale 1.68 2.13 5.34 1.42 0.90 1.81 2.42
3 Kilifi 2.87 2.13 6.98 2.17 0.99 2.21 3.32
4 Tana-River
0.62 2.13 2.19 6.61 0.08 1.11 1.77
5 Lamu 0.26 2.13 0.31 1.08 3.29 0.35 0.88
6 Taita-Taveta
0.74 2.13 0.87 2.94 4.03 1.33 1.37
7 Garissa 1.61 2.13 1.74 7.60 1.95 1.40 2.25
8 Wajir 1.71 2.13 3.18 9.75 0.90 1.90 2.71
9 Mandera 2.66 2.13 6.12 4.47 0.00 1.91 3.23
10 Marsabit 0.75 2.13 1.41 12.21 2.33 1.48 2.18
11 Isiolo 0.37 2.13 0.97 4.36 0.77 0.83 1.27
12 Meru 3.51 2.13 1.56 1.19 1.84 3.46 2.58
13 Tharaka-Nithi
0.95 2.13 0.72 0.45 1.06 1.22 1.18
14 Embu 1.34 2.13 0.81 0.48 5.76 1.81 1.47
15 Kitui 2.62 2.13 3.23 5.25 0.82 4.08 2.79
16 Machakos 2.85 2.13 2.74 1.07 2.11 3.72 2.49
17 Makueni 2.29 2.13 2.95 1.38 0.38 3.59 2.27
18 Nyandarua
1.54 2.13 1.14 0.56 2.19 1.91 1.56
19 Nyeri 1.80 2.13 0.94 0.57 4.58 2.16 1.69
20 Kirinyaga 1.37 2.13 0.60 0.25 2.69 1.74 1.37
21 Murang'a 2.44 2.13 1.50 0.44 1.93 3.16 2.03
22 Kiambu 4.20 2.13 2.63 0.44 6.80 3.06 3.12
23 Turkana 2.22 2.13 4.53 11.81 0.00 2.20 3.33
24 West Pokot
1.33 2.13 1.54 1.58 1.12 1.47 1.59
25 Samburu 0.58 2.13 0.79 3.62 0.00 0.96 1.26
26 Trans-Nzoia
2.12 2.13 1.31 0.43 1.56 1.65 1.83

42
No County Population Basic Equal share
Poverty Gap
Land Area
Fiscal Respons
ibility
Development Factor
Combined Factor
27 Uasin-Gishu
2.32 2.13 1.28 0.58 3.39 1.52 1.95
28 Elgeyo-Marakwet
0.96 2.13 0.90 0.52 2.35 1.31 1.25
29 Nandi 1.95 2.13 1.12 0.50 2.84 2.13 1.75
30 Baringo 1.44 2.13 1.23 1.89 1.11 2.08 1.62
31 Laikipia 1.03 2.13 0.85 1.63 1.71 1.50 1.35
32 Nakuru 4.15 2.13 2.41 1.29 3.06 4.85 3.07
33 Narok 2.20 2.13 1.15 3.08 1.51 2.86 2.06
34 Kajiado 1.78 2.13 1.28 3.77 6.18 2.22 2.03
35 Kericho 1.95 2.13 1.25 0.37 0.72 1.57 1.71
36 Bomet 1.89 2.13 1.51 0.48 0.10 2.40 1.74
37 Kakamega 4.30 2.13 4.03 0.52 1.48 3.63 3.32
38 Vihiga 1.44 2.13 1.10 0.10 0.00 1.10 1.42
39 Bungoma 3.56 2.13 3.27 0.52 2.99 2.53 2.87
40 Busia 1.93 2.13 2.45 0.29 0.00 1.54 1.90
41 Siaya 2.18 2.13 1.34 0.44 0.66 2.44 1.85
42 Kisumu 2.51 2.13 2.36 0.36 4.60 2.36 2.25
43 Homa-Bay 2.50 2.13 2.14 0.55 0.30 2.64 2.14
44 Migori 2.38 2.13 2.52 0.45 1.62 2.57 2.17
45 Kisii 2.98 2.13 2.86 0.23 0.52 2.63 2.47
46 Nyamira 1.55 2.13 1.36 0.15 0.22 1.40 1.53
47 Nairobi City
8.13 2.13 4.33 0.12 6.00 3.01 5.15
Totals 100 100 100 100 100 100 100
Commission on Revenue Allocation, 2015

43
Appendix IV: Simulation Formula at Kshs. 259,775 Million
No. COUNTY Populati
on (45%)
Basic
Equal
share
(26%)
Poverty
Gap
(18%)
Land
Area
(8%)
Fiscal
Effort
(2%)
Development
Factor (1%)
Total
(100%)
1 Mombasa 2,844 1,437 1,472 8 549 31 6,342
2 Kwale 1,968 1,437 2,498 296 47 47 6,292
3 Kilifi 3,360 1,437 3,264 451 51 57 8,620
4 Tana-
River 727 1,437 1,026 1,374 4 29 4,597
5 Lamu 307 1,437 144 224 171 9 2,292
6 Taita-
Taveta 862 1,437 409 611 209 34 3,562
7 Garissa 1,886 1,437 812 1,579 101 36 5,852
8 Wajir 2,004 1,437 1,485 2,027 47 49 7,049
9 Mandera 3,106 1,437 2,863 929 - 50 8,385
10 Marsabit 882 1,437 661 2,537 121 38 5,676
11 Isiolo 434 1,437 455 906 40 21 3,294
12 Meru 4,106 1,437 729 248 96 90 6,706
13 Tharaka-
Nithi 1,106 1,437 337 94 55 32 3,061
14 Embu 1,563 1,437 379 101 299 47 3,826
15 Kitui 3,066 1,437 1,511 1,090 43 106 7,254
16 Machakos 3,326 1,437 1,282 222 110 97 6,473
17 Makueni 2,678 1,437 1,377 286 20 93 5,892
18 Nyandaru
a 1,805 1,437 534 116 114 50 4,056
19 Nyeri 2,100 1,437 437 119 238 56 4,387
20 Kirinyaga 1,599 1,437 282 53 140 45 3,556
21 Murang'a 2,854 1,437 702 91 100 82 5,267
22 Kiambu 4,915 1,437 1,230 91 354 79 8,105
23 Turkana 2,590 1,437 2,119 2,455 - 57 8,659
24 West
Pokot 1,552 1,437 721 328 58 38 4,135

44
No. COUNTY Populati
on (45%)
Basic
Equal
share
(26%)
Poverty
Gap
(18%)
Land
Area
(8%)
Fiscal
Effort
(2%)
Development
Factor (1%)
Total
(100%)
25 Samburu 678 1,437 369 752 - 25 3,261
26 Trans-
Nzoia 2,479 1,437 613 89 81 43 4,742
27 Uasin-
Gishu 2,707 1,437 597 120 176 39 5,077
28 Elgeyo-
Marakwet 1,120 1,437 423 108 122 34 3,244
29 Nandi 2,280 1,437 524 103 148 55 4,547
30 Baringo 1,682 1,437 576 394 58 54 4,201
31 Laikipia 1,209 1,437 396 338 89 39 3,508
32 Nakuru 4,854 1,437 1,128 268 159 126 7,972
33 Narok 2,576 1,437 537 641 79 74 5,344
34 Kajiado 2,081 1,437 597 783 321 58 5,277
35 Kericho 2,278 1,437 584 77 37 41 4,455
36 Bomet 2,211 1,437 704 100 5 62 4,519
37 Kakameg
a 5,028 1,437 1,883 108 77 94 8,627
38 Vihiga 1,679 1,437 512 20 - 29 3,677
39 Bungoma 4,163 1,437 1,531 108 155 66 7,461
40 Busia 2,252 1,437 1,147 61 - 40 4,937
41 Siaya 2,550 1,437 625 90 34 63 4,801
42 Kisumu 2,934 1,437 1,105 75 239 61 5,850
43 Homa-
Bay 2,918 1,437 999 114 16 68 5,552
44 Migori 2,777 1,437 1,179 93 84 67 5,637
45 Kisii 3,489 1,437 1,337 47 27 68 6,406
46 Nyamira 1,811 1,437 636 32 11 36 3,965
47 Nairobi 9,502 1,437 2,025 25 312 78 13,379
Totals 116,899 67,542 46,760 20,782 5,196 2,598 259,775
Source Commission on Revenue Allocation, 2015

45
Appendix V: Summary of Simulation at Ksh. 259,775 Million
No. County Population Total Allocation
(Ksh. Millions)
Revenue
Allocation
Factor
1 Mombasa 939,370 6,342 2.44
2 Kwale 649,931 6,292 2.42
3 Kilifi 1,109,735 8,620 3.32
4 Tana-River 240,075 4,597 1.77
5 Lamu 101,539 2,292 0.88
6 Taita-Taveta 284,657 3,562 1.37
7 Garissa 623,060 5,852 2.25
8 Wajir 661,941 7,049 2.71
9 Mandera 1,025,756 8,385 3.23
10 Marsabit 291,166 5,676 2.18
11 Isiolo 143,294 3,294 1.27
12 Meru 1,356,301 6,706 2.58
13 Tharaka-Nithi 365,330 3,061 1.18
14 Embu 516,212 3,826 1.47
15 Kitui 1,012,709 7,254 2.79
16 Machakos 1,098,584 6,473 2.49
17 Makueni 884,527 5,892 2.27
18 Nyandarua 596,268 4,056 1.56
19 Nyeri 693,558 4,387 1.69
20 Kirinyaga 528,054 3,556 1.37
21 Murang'a 942,581 5,267 2.03
22 Kiambu 1,623,282 8,105 3.12
23 Turkana 855,399 8,659 3.33
24 West Pokot 512,690 4,135 1.59
25 Samburu 223,947 3,261 1.26
26 Trans-Nzoia 818,757 4,742 1.83

46
No. County Population Total Allocation
(Ksh. Millions)
Revenue
Allocation
Factor
27 Uasin-Gishu 894,179 5,077 1.95
28 Elgeyo-
Marakwet 369,998 3,244 1.25
29 Nandi 752,965 4,547 1.75
30 Baringo 555,561 4,201 1.62
31 Laikipia 399,227 3,508 1.35
32 Nakuru 1,603,325 7,972 3.07
33 Narok 850,920 5,344 2.06
34 Kajiado 687,312 5,277 2.03
35 Kericho 758,339 4,455 1.71
36 Bomet 724,186 4,519 1.74
37 Kakamega 1,660,651 8,627 3.32
38 Vihiga 554,622 3,677 1.42
39 Bungoma 1,375,063 7,461 2.87
40 Busia 743,946 4,937 1.90
41 Siaya 842,304 4,801 1.85
42 Kisumu 968,909 5,850 2.25
43 Homa-Bay 963,794 5,552 2.14
44 Migori 917,170 5,637 2.17
45 Kisii 1,152,282 6,406 2.47
46 Nyamira 598,252 3,965 1.53
47 Nairobi City 3,138,369 13,379 5.15
Totals 38,610,097 259,775 100
Source Commission on Revenue Allocation, 2015

47
Appendix VI (a): Data for the Second Revenue Sharing Formula
No. County Population Poverty
Gap
Land Area
(Square Kms.)
Actual own Revenue
2013/2014-Millions
Actual own Revenue
2014/2015-Millions
1 Mombasa 939,370 10.0 219 1,716 2,493
2 Kwale 649,931 41.8 8,270 208 254
3 Kilifi 1,109,735 31.4 12,610 460 545
4 Tana-River 240,075 46.1 38,437 32 33
5 Lamu 101,539 15.6 6,273 36 62
6 Taita-Taveta
284,657 15.6 17,084 127 217
7 Garissa 623,060 18.7 44,175 36 131
8 Wajir 661,941 31.9 56,686 61 108
9 Mandera 1,025,756 32.4 25,992 90 88
10 Marsabit 291,166 22.9 70,961 46 99
11 Isiolo 143,294 19.0 25,336 125 134
12 Meru 1,356,301 6.0 6,936 344 539
13 Tharaka-Nithi
365,330 9.5 2,639 85 116
14 Embu 516,212 7.7 2,818 168 401
15 Kitui 1,012,709 16.8 30,497 255 321
16 Machakos 1,098,584 9.7 6,208 1,175 1,357
17 Makueni 884,527 16.8 8,009 189 215
18 Nyandarua 596,268 9.4 3,245 138 241
19 Nyeri 693,558 6.2 3,337 432 681
20 Kirinyaga 528,054 5.7 1,479 200 312
21 Murang'a 942,581 7.7 2,559 420 562
22 Kiambu 1,623,282 5.9 2,543 1,247 2,111
23 Turkana 855,399 29.0 68,680 133 127
24 West Pokot 512,690 16.2 9,169 59 104
25 Samburu 223,947 17.4 21,022 201 196

48
No. County Population Poverty
Gap
Land Area
(Square Kms.)
Actual own Revenue
2013/2014-Millions
Actual own Revenue
2014/2015-Millions
26 Trans-Nzoia 818,757 7.7 2,496 202 301
27 Uasin-Gishu 894,179 6.0 3,345 564 801
28 Elgeyo-Marakwet
369,998 12.2 3,030 61 129
29 Nandi 752,965 7.5 2,884 131 298
30 Baringo 555,561 11.4 11,015 202 250
31 Laikipia 399,227 10.5 9,462 347 400
32 Nakuru 1,603,325 6.1 7,495 1,817 2,200
33 Narok 850,920 7.1 17,933 1,539 1,639
34 Kajiado 687,312 7.8 21,901 453 786
35 Kericho 758,339 7.6 2,479 371 414
36 Bomet 724,186 10.4 2,471 201 206
37 Kakamega 1,660,651 12.0 3,051 325 517
38 Vihiga 554,622 8.8 531 123 116
39 Bungoma 1,375,063 11.7 3,593 183 505
40 Busia 743,946 16.8 1,134 329 315
41 Siaya 842,304 7.6 2,530 100 143
42 Kisumu 968,909 9.0 2,086 622 971
43 Homa-Bay 963,794 10.5 3,183 135 158
44 Migori 917,170 12.1 2,596 239 355
45 Kisii 1,152,282 11.7 1,318 250 297
46 Nyamira 598,252 11.3 899 94 104
47 Nairobi City 3,138,369 4.1 695 10,026 11,500
Source: Kenya National Bureau of Statistics/ Office of Controller of Budget

49
Appendix VI (b): Data for the Second Revenue Sharing Formula
No County
Total Unpaved
Roads (D, E, F, G,
H,J,K,M,N,P)
Percentage of
Households with access
to Electricity
Percentage of Households
with access to improved
water
1 Mombasa 481 59.0 75.0
2 Kwale 3,153 10.6 65.8
3 Kilifi 3,335 16.7 75.9
4 Tana-River 2,789 2.5 55.5
5 Lamu 754 17.0 89.3
6 Taita-Taveta 3,489 15.0 70.0
7 Garissa 2,504 11.6 75.8
8 Wajir 4,608 3.4 73.5
9 Mandera 2,831 2.5 51.9
10 Marsabit 3,968 7.5 77.6
11 Isiolo 2,555 18.5 84.6
12 Meru 4,317 13.1 65.0
13 Tharaka-Nithi 1,788 3.0 40.4
14 Embu 2,961 14.9 62.1
15 Kitui 7,942 4.8 50.8
16 Machakos 5,272 17.0 58.1
17 Makueni 7,375 5.9 56.9
18 Nyandarua 3,333 10.5 68.0
19 Nyeri 3,513 26.3 69.3
20 Kirinyaga 2,154 16.4 56.8
21 Murang'a 3,471 14.0 51.0
22 Kiambu 4,358 53.0 78.1
23 Turkana 4,189 2.4 74.3
24 West Pokot 1,842 2.6 37.2

50
No County
Total Unpaved
Roads (D, E, F, G,
H,J,K,M,N,P)
Percentage of
Households with access
to Electricity
Percentage of Households
with access to improved
water
25 Samburu 2,039 6.2 67.8
26 Trans-Nzoia 1,668 8.9 76.7
27 Uasin-Gishu 3,742 27.9 88.9
28 Elgeyo-Marakwet 1,566 7.2 44.2
29 Nandi 2,323 6.4 56.2
30 Baringo 2,559 9.6 35.1
31 Laikipia 2,821 17.7 62.7
32 Nakuru 9,137 34.0 66.4
33 Narok 4,034 5.9 33.6
34 Kajiado 5,235 39.8 72.3
35 Kericho 1,568 11.8 56.1
36 Bomet 1,934 4.3 40.8
37 Kakamega 3,508 5.6 76.1
38 Vihiga 664 7.0 76.4
39 Bungoma 2,661 4.5 88.9
40 Busia 1,401 6.0 82.9
41 Siaya 1,858 4.3 46.7
42 Kisumu 2,433 18.3 60.1
43 Homa-Bay 2,415 3.3 38.6
44 Migori 2,095 5.3 47.8
45 Kisii 2,188 7.8 67.9
46 Nyamira 961 6.4 68.6
47 Nairobi City 1,356 72.4 83.1
Totals 143,149
Source: Source: National Treasury, 2014; Ministry of Roads, 2014; Kenya
National Bureau of Statistic, 2009

51
Appendix VII: County Data on Poverty for 2005/2006 and 2009
No.
County
Poverty Head Count Difference
Poverty Gap Difference
2005/06 2009 2005/06 2009
A B A-B C D C-D
1 Mombasa 37.6 34.8 2.8 8.7 10.0 (1.3)
2 Kwale 74.9 70.7 4.2 28.4 41.8 (13.4)
3 Kilifi 71.4 58.4 13.0 25.8 31.4 (5.6)
4 Tana River 76.9 75.6 1.3 29.9 46.1 (16.2)
5 Lamu 32.7 32.3 0.4 6.3 15.6 (9.3)
6 Taita-Taveta
54.8 50.4 4.4 17.6 15.6 2.0
7 Garissa 49.2 58.9 (9.7) 20.3 18.7 1.6
8 Wajir 84.0 84.2 (0.2) 38.1 31.9 6.2
9 Mandera 87.8 85.8 2.0 45.7 32.4 13.3
10 Marsabit 83.2 75.8 7.4 42.2 22.9 19.3
11 Isiolo 72.6 65.3 7.3 28.4 19.0 9.4
12 Meru 28.3 31.0 (2.7) 6.2 6.0 0.2
13 Tharaka Nithi
48.7 41.0 7.7 12.0 9.5 2.5
14 Embu 42.0 35.3 6.7 14.2 7.7 6.5
15 Kitui 63.5 60.4 3.1 22.2 16.8 5.4
16 Machakos 59.6 42.6 17.0 19.8 9.7 10.1
17 Makueni 64.1 60.6 3.5 22.2 16.8 5.4
18 Nyandarua 46.3 38.8 7.5 17.5 9.4 8.1
19 Nyeri 32.7 27.6 5.1 11.6 6.2 5.4
20 Kirinyaga 25.2 25.9 (0.7) 5.9 5.7 0.2
21 Muranga 29.9 33.2 (3.3) 10.7 7.7 3.0
22 Kiambu 27.2 24.2 3.0 6.5 5.9 0.6
23 Turkana 94.3 87.5 6.8 67.5 29.0 38.5
24 West Pokot
69.8 66.3 3.5 25.8 16.2 9.6
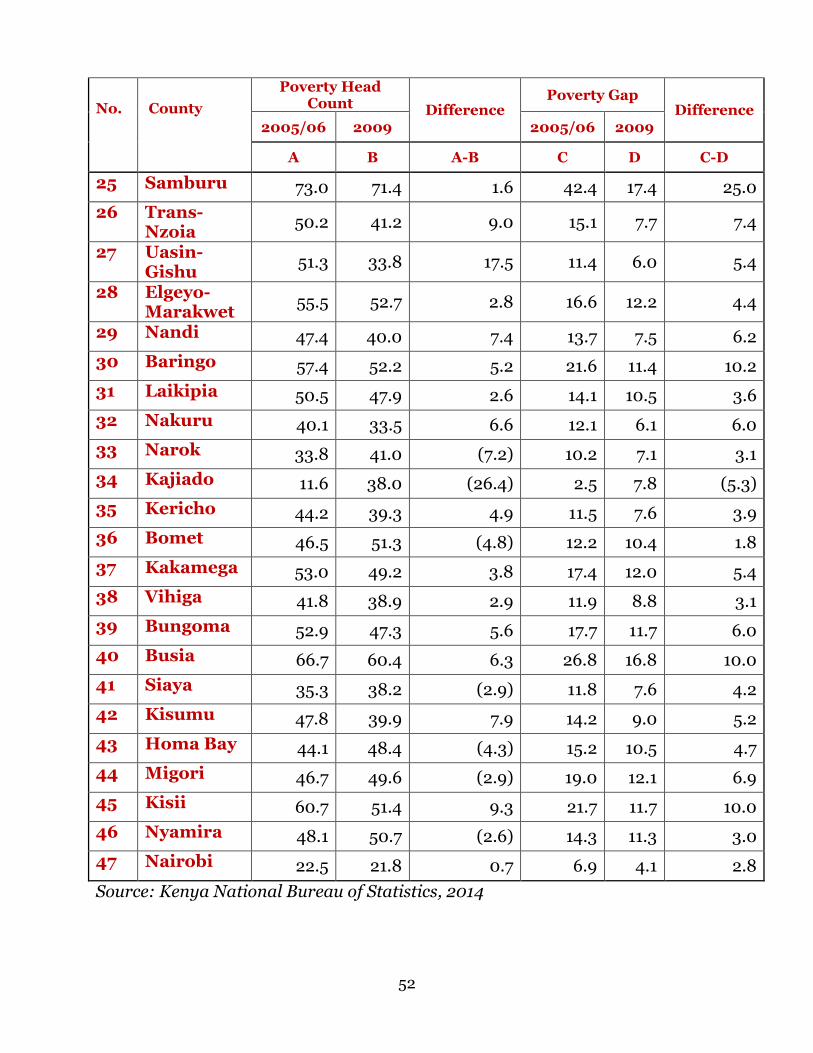
52
No.
County
Poverty Head Count Difference
Poverty Gap Difference
2005/06 2009 2005/06 2009
A B A-B C D C-D
25 Samburu 73.0 71.4 1.6 42.4 17.4 25.0
26 Trans-Nzoia
50.2 41.2 9.0 15.1 7.7 7.4
27 Uasin-Gishu
51.3 33.8 17.5 11.4 6.0 5.4
28 Elgeyo-Marakwet
55.5 52.7 2.8 16.6 12.2 4.4
29 Nandi 47.4 40.0 7.4 13.7 7.5 6.2
30 Baringo 57.4 52.2 5.2 21.6 11.4 10.2
31 Laikipia 50.5 47.9 2.6 14.1 10.5 3.6
32 Nakuru 40.1 33.5 6.6 12.1 6.1 6.0
33 Narok 33.8 41.0 (7.2) 10.2 7.1 3.1
34 Kajiado 11.6 38.0 (26.4) 2.5 7.8 (5.3)
35 Kericho 44.2 39.3 4.9 11.5 7.6 3.9
36 Bomet 46.5 51.3 (4.8) 12.2 10.4 1.8
37 Kakamega 53.0 49.2 3.8 17.4 12.0 5.4
38 Vihiga 41.8 38.9 2.9 11.9 8.8 3.1
39 Bungoma 52.9 47.3 5.6 17.7 11.7 6.0
40 Busia 66.7 60.4 6.3 26.8 16.8 10.0
41 Siaya 35.3 38.2 (2.9) 11.8 7.6 4.2
42 Kisumu 47.8 39.9 7.9 14.2 9.0 5.2
43 Homa Bay 44.1 48.4 (4.3) 15.2 10.5 4.7
44 Migori 46.7 49.6 (2.9) 19.0 12.1 6.9
45 Kisii 60.7 51.4 9.3 21.7 11.7 10.0
46 Nyamira 48.1 50.7 (2.6) 14.3 11.3 3.0
47 Nairobi 22.5 21.8 0.7 6.9 4.1 2.8
Source: Kenya National Bureau of Statistics, 2014

COMMISSION ON REVENUE ALLOCATION
14 Riverside Drive Grosvenor Bldg, 2nd Flr.
P.O BOX 1310 – 00200 NAIROBI
TEL: +254-(020) 4298000.
Email: [email protected]
Website: www.crakenya.org
CRA 24B