early holocene to present paleoenvironmental shifts and...
TRANSCRIPT

Early-Holocene to present palaeoenvironmentalshifts and short climate events from the tropical
wetland and lake sediments, Kukkal Lake,Southern India: Geochemistry and palynology
Item Type Article
Authors Rajmanickam, Vijayaraj; Achyuthan, Hema; Eastoe, Christopher;Farooqui, Anjum
Citation Early-Holocene to present palaeoenvironmental shifts and shortclimate events from the tropical wetland and lake sediments,Kukkal Lake, Southern India: Geochemistry and palynology 2017,27 (3):404 The Holocene
DOI 10.1177/0959683616660162
Publisher SAGE PUBLICATIONS LTD
Journal The Holocene
Rights Copyright © 2017, © SAGE Publications
Download date 02/07/2018 14:43:24
Link to Item http://hdl.handle.net/10150/624066
1
Early Holocene to Present Paleoenvironmental Shifts and Short Climate
Events Inferred from Tropical Wetland and Lake sediments, Kukkal
Lake, Southern India: Geochemistry and Palynology
Vijayaraj R
Department of Geology
Anna University, Chennai 600 025.
Email:[email protected]
Hema Achyuthan
Department of Geology
Anna University Chennai 600 025
Christopher Eastoe
Department of Geosciences
University of Arizona, Tucson, AZ 85721, USA
Anjum Farooqui
Birbal Sahni Institute of Paleobotany
Lucknow 226 007

2
Early Holocene to Present Paleoenvironmental Shifts and Short Climate
Events Inferred from Tropical Wetland and Lake sediments, Kukkal
Lake, Southern India: Geochemistry and Palynology
Vijayaraj R1, Hema Achyuthan1, Christopher Eastoe2 and Anjum
Farooqui3
1. Department of Geology, Anna University, Chennai 600 025
2. Department of Geosciences, University of Arizona, Tucson, AZ
85721
3. Birbal Sahni Institute of Paleobotany, Lucknow 226 007
Abstract
The Kukkal basin, Tamil Nadu, India, receives most of its rain from the
southwest monsoon. A sediment core from Kukkal Lake, preserves a
continuous sediment record from the Early Holocene to present (9000 yr BP
to present). The present lake is artificial, situated at an elevation of ~1887
m a.s.l.,, in a small basin that appears to have alternated between a and
wetland depositional environment. Climate proxies, including sediment
texture, TOC, Total Nitrogen (TN), C/N, pollen and geochemical
composition indicate a steady progression to wetter conditions, with two
stepwise changes at about 8000, and between 3200 and 1800 yr BP. The
change at 8000 yr BP appears to correspond to a brief (100-150 yr) dry spell
recorded elsewhere in India. The change at 3200-1800 yr BP consisted in a
rapid intensification of the southwest monsoon, and may correlate with the
initiation of the Roman Warm Period. There is no clear evidence of changes
at the times of the Medieval Warm Period and the Little Ice Age. A warm
period (1150-850 yr BP) and Little Ice Age (LIA) (550-150 yr BP) of wetter

3
conditions events are observed in the Kukkal lake. The C/N ratio of the
sediments ranges from 14.02 to 8.31 indicating that the organic matter
originated from a mixture of lacustrine algae and vascular plants. Chemical
weathering indices (CIA, CIW and PIA) are consistent with extreme silicate
weathering. Pollen data show a development from savanna vegetation prior
to about 8000 yr BP, followed by grassland with palms, the appearance of
ferns just prior to 3200 yr BP, and the establishment of forest between 3200
and about 1800 yr BP.
Key words: Tropical lake, tropical wetland, Holocene, monsoonal intensity,
pollen, radiocarbon dating, climate change
4
INTRODUCTION
During the last two decades scientific interest in the reconstruction of
the Asian monsoon variations particularly the South West Monsoon (SWM) since
the Late Quaternary to Holocene period has increased significantly. In particular, in
the Indian subcontinent many types of natural archives such as lake and marine
sediment cores, palynology, tree rings and corals (Mayewski et al., 2004) have been
used to restructure late Quaternary-Holocene paleoclimatic shifts. Such records
include fluvial archives of the Gujarat region (Chamyal et al., 2002), deep marine
sediment cores studied from the Arabian Sea, and the Bay of Bengal (Gupta et al.,
2003, 2005; Chauhan et al., 2010; Nagasundaram 2014; Achyuthan et al., 2015),
aeolian sediments from the Thar desert (Achyuthan et al., 2007a, b), lacustrine
sediments from Kerala (Farooqui and Sekhar 2011; Farooqui et al., 2010; Kumaran
et al., 2008; Veena et al., 2014), peat deposits from the foreland basin of the
Himalyas (Sharma et al., 2006; Rawat et al., 2015), glacial moraines and proglacial
deposits of the Ladakh region (Sant et al., 2011), speleothems (Narayana et al.,
2011) and tree rings (Esper et al., 2002 a, b, 2003; Yadav and Singh 2002; Shah and
Bhattacharya, 2009).
The Indian subcontinent is one of the largest monsoon-dominated regions
of the world and the climate is controlled primarily by the SWM. Lakes and
wetlands in this region function as repositories of sediment deposited in a closed
system, and may act as major sinks for organic carbon. Therefore, sediment cores
from such sites in the area affected by the SWM can provide a continuous, high-
resolution of paleoenvironmental record of the evolution of the SWM (Verschuren,
2003; Verschuren et al., 2000).
It is important to reconstruct past climate and to study paleoclimate
records with high resolution because the past performance of the monsoon may
provide vital input for projecting future climate change. Furthermore, an
understanding of climate change in the Indian subcontinent from the early Holocene
to the present potentially has profound implications for an understanding of human

5
development, because rain-fed agriculture and river valley civilisation were
established during this time interval (Possehl 1996; Allchin 1997; Gupta 2004,
Ponjtoon et al., 2014).
In the Asian region, paleoclimate records based on lake sediments
indicate that both southwest summer and northeast winter rains were stronger in the
early Holocene period (10,000 –7000 yr BP) than today, resulting in a wetter and
cooler climate over the Asian continent. But the Holocene Megathermal was a much
warmer phase in areas that received East Asian monsoon (An et al., 2000; Wang et
al., 2005; Sun and Li, 2011). Warming started around 8000 yr BP and the Holocene
Megathermal Maximum (HMM), occurred between 7200 and 6000 yr BP. After
3000 yr BP, climate in China area returned to a cold and dry state (Sun and Li,
2011). These conclusions are based on a wide variety of proxies, including pollen
and diatoms (Prell and Kutzbach, 1987; Van Campo et al., 1996), oxygen isotopes
from marine sediments (Sirocko et al., 1993, 1996), and Arabian Sea upwelling
intensities (Prell and Van Campo, 1986; Overpeck et al., 1996). Staubwasser et al.,
(2002, 2003) provided some insight in the climate variability in the SWM region
since the mid Holocene.
A history of flow volume of the Indus River over the past 5000 yr has been
reconstructed by von Rad et al. (1999 a, b). The Indus has a large catchment in a
region that is now partly semi-arid. Being fed by melting Himalayan ice as well as
precipitation in the semi-arid hinterland, its discharge is governed by a complex
interplay of phenomena. Information obtained to date shows a stronger SWM since
about 1500 yr BP.
Temperature indicators are less clear, except around the Medieval Warm
Period (MWP) ( ) and the Little Ice Age (LIA) (Crowley and Lowery 2000).
Chauhan and Vogelsang (2006) reported that the LIA had a large temporal and
spatial variability due to the variations in the intensity of SWM and had its impact
across the globe. A period of warming in Oman coeval with that in China, was
observed from the index fossil Globigerinoides bulloides, which indicates wind-
6
induced upwelling of ocean water, during the interval 1200 yr BP to 600 yr BP
(Gupta et al., 2003). However, in the northern hemisphere, the LIA was a mild
cooling event (Crowley and Lowery 2000; Crowley, 2000; Anderson et al., 2002;
Sighvi and Kale, 2008). Summarizing these studies, it is evident that a significant
variation of the SWM, encompassing several cycles of fluctuations, occurred during
the Holocene.
To date, the marine record from the Arabian Sea has proved to be the
most consistent and continuous record of the SWM fluctuations (Sirocko et al.,
1993, 1996, 2000; Kudrass et al., 2001; Lückge et al., 2001; Thamban et al., 2002;
Tiwari et al., 2005, 2006), whereas limited studies have been carried out in the Bay
of Bengal (Duplessy, 1982; Chauhan et al., 2004; Chauhan and Vogelsang, 2006;
Achyuthan et al., 2015). However, lakes of peninsular India preserve a great wealth
of paleoenvironmental and paleoclimate data spanning the last 6000 yr as described
by Limaye et al., (2010) and Veena et al., (2014). The lake and wetland archives of
Tamil Nadu have received so far little attention. Kukkal Lake, in the Palani Hills,
Dindigul District, Tamil Nadu State, lies in a basin affected by both the SWM and
NEM rains. Hence, the main objectives of the present study are to reconstruct the
Holocene paleomonsoon and paleoenvironmental shifts using the Kukkal lake
sediments.
STUDY AREA
Kukkal Lake (Figure 1) (lat and long ) is a small, irregular, fresh water
body covering an area of 18 ha, and situated at an altitude of 1887 m above sea
level. The present lake is impounded by a low dam at the northern end, and floods
an area that appears to have been a wetland similar to one about 300 m south of the
lake. Both features may have been lakes at times in the past. Presently, the lake has
an catchment area of 2 to 3 km2, that is forested and relatively undisturbed by human
activities; some abandoned paddies on the east side of the lake are the only evidence
of agriculture in the catchment. Sediment in the basin beneath the lake is therefore
suitable for carrying out paleoenvironment research. Bedrock underlying the
catchment is Precambrian charnockite associated with hornblende-biotite gneiss,
granite and quartzite, and is covered by a thin veneer of red vertisol and lateritic soil
7
(Bagyaraj and Gurugnanam, 2011). The geology and geomorphic observations in
and around the lakes reveal that the Kukkal Lake basin is structurally controlled by
faults and lineaments, as are the main tributary watercourses within the basin. The
catchment receives rainfall from both the SWM and NEM, the NEM being dominant
(Meher-Homji and Gupta 1999). The mean annual rainfall for Kodaikanal over a
four-year period (2001-2004) was 1690 mm (Bagyaraj and Gurugnanam, 2011).
The dry season is from December through March, and there is also a short dry
period in July. The climate is salubrious for most of the year with summer
temperatures reaching 19.8°C (max) and 11.3°C (min) and winter temperatures
between 17.3°C (max) and 8.3°C (min). Meher-Homji and Gupta (1999) state that
Kodaikanal experiences a bixeric climate regime receiving high rainfall from
ocotber to December (ie. NEM). The lake is surrounded by the ‘Shola’ forests (the
word ‘Shola’ derived from the tamil language word ‘cÕlai’ meaning grove or thick
vegetation cover (Meher-Homji 1967). The Sholas are patches of stunted tropical
montane forest found in the valleys in the midst of rolling grassland in the higher
montane regions of the Nilgiri Hills, South India. The soil texture varies from clay to
silty clay; soils are acidic in nature and contain a high percentage of iron oxide and
alumina. In the ‘Shola’ forests, accumulation of humus in the top layers of the soil
renders it a black color (Meher-Homji, 1967; Bera and Farooqui, 2000).The
dominant trees in the shola forest are represented by Michelia niligarica, Bischofia
javanica (bishop wood), Calophyllum tomentosa, Cedrela toona (Indian mahogany),
Eugenia (myrtle) spp., Ficus glomerata and Mallotus spp. and small trees such as
Pygeum gardneri, Schefflera racemosa, Linociera ramiflora, Syzygium spp.,
Rhododendron nilgiricum, Mahonia nepalensis, Elaeocarpus recurvatus, Ilex
denticulata, Michelia nilagirica, Actinodaphne bourdellonii, and Litsea wightiana.
These forests are interspersed with grasslands, characterized by frost and fire-
resistant grass species like the Chrysopogon zeylanicus, Cymbopogon flexuosus,
Arundinella ciliata, Arundinella mesophylla, Arundinella tuberculata, Themeda
tremula, and Sehima nervosum.
MATERIALS AND METHODS

8
Field methods
The field map was prepared using Survey of India toposheets, a Google Earth map,
and Satellite imagery data products IRS LISS III for delineating faults, lineaments
and channels draining into the lake. Faults and the rock types exposed around the
lake surroundings were also noted. An acid-washed 6.4 cm diameter and of nearly
94 cm in length PVC pipe sediment core was raised from the lake floor. The
sediment core sampled location was marked using a Garmin III Global Positioning
System (GPS) (Fig.1), subsampled at 2cm interval, stored in clean zip locked
polythene bag, marked and stored for further analyses.
Chemical and Physical analyses
For the sediment texture analyses, about of 5 g of the dried sediment was washed
following Carver (1971) through a 230 American standard testing machine (ASTM)
sieve mesh opening of 0.063 mm until the water passing through was clear (Tables
1, 2). This separted the sand from the silt and clay content. The sediments collected
in the 230 sieve mesh was calculated as sand content. Silt and clay percentage were
determined using the measuring jar and settling velocity experiment following
Carver (1971). Procedures of Loring and Rantala (1992) and Piper (1947) were
adopted for the determination of calcium carbonate content. The organic matter
(OM) in the sediment sample was determined following the procedure of Gaudette
et al., (1974). The Total Organic Carbon (TOC) and Total Nitrogen (TN) were
determined using about 1 g of sediment sample, decarbonated with a 1M solution of
hydrochloric acid, washed three times with deionized water, freeze-dried and then
analyzed in a Thermo Scientific FLASH 2000 CHNS-O Organic Elemental
Analyzer (OEA) at the Department of Geology, Anna University, Chennai (Table 3).
Major oxide and trace element analyses were carried out at the Central
Instrumentation Facility (CIF) at Pondicherry University, Pondicherry using a WD-
XRF Spectrometer with samples in powder form. The samples were analysed for
SiO2, Al2O3, Na2O, CaO, Fe2O3, K2O, TiO2, P2O5, MnO, MgO and Sr, Cr, Cu, Ni,
Co, Pb, Zn, V, Ba, and Zr (Tables 4 and 5, Figure 4). Results were normalized to Al
(Figure 4).

9
Calculation of chemical indices
The degree of rock alteration and weathering can be estimated quantitatively
using several geochemical indices (e.g., Duzgoren-Aydin et al., 2002; Maslov et al.,
2003; Price and Velbel, 2003; Yudovich and Ketris, 2011). However, for the
charnockite and gneisses exposed around the study area weathering indices till date
have not been calculated. Most of these indices are expressed in terms of molecular
or weight percentages of various oxides or groups of oxides. During chemical
weathering, more labile minerals, such as feldspar and plagioclase, are depleted in
Ca2+, K+ and Na+ and transformed into minerals that are more stable under surface
conditions. As the intensity of weathering increases, rocks and sediments become
enriched in Al, Ti, Fe, and Mn (Minyuk et al., 2014).
Chemical Index of Alteration (CIA): The CIA was defined as follows by
Nesbitt and Young (1982) using molecular proportions:
CIA = [Al2O3 / (Al2O3 + CaO + NaO + K2O)] × 100
with CaO being the amount of CaO incorporated in the silicate fraction of the rock.
The CIA measures the proportion of Al2O3 versus more labile oxides, and reflects
the relative amount of feldspars and clay minerals in a sample. A CIA value of 50
corresponds to unaltered albite, anorthite, and potassic feldspar. Typical values of
the CIA are 30 to 40 for basalt, 45 to 55 for granites and granodiorites, 75 to 85 for
illite, 75 for muscovite, and close to 100 for kaolinite and chlorite (Nesbitt and
Young, 1982).
Chemical Index of Weathering (CIW) This index was proposed by
Harnois (1988) and is calculated using the equation:
CIW = [Al2O3 / (Al2O3 + CaO + Na2O)] × 100
with Al2O3 treated as an immobile component and CaO and Na2O as mobile
elements. K, in contrast, is not included in this index, because it may be leached
and/or accumulated in the residual weathering products. Fedo et al., (1995)

10
suggested that Al in this index be used without any correction for its occurrence in
K-feldspar, and therefore, generally K-feldspar- rich rocks yield very high CIW
values. Potassic granite, for example, has a CIW value of 80 and fresh K-feldspar
has an index of 100, values that are similar to those of the residual products of
chemical weathering e.g., 80 for smectite, and 100 for kaolinite, illite and gibbsite.
Plagioclase Index of Alteration (PIA): This index (Fedo et al., (1995)
estimates the weathering intensity of plagioclase feldspar and is calculated as
follows :
PIA = [(Al2O3 − K2O) / (Al2O3 + CaO + Na2O + K2O)] × 100
Chemical Weathering Intensity (CWI): Oxides such as CaO, MgO, and
Na2O are considered more soluble and mobile, while Al2O3, SiO2, and TiO2 are
considered to be more insoluble and resistant (Mackereth, 1966a, b, Engstrom and
Wright, 1984). Sun et al., (2010) proposed the CWI as an alternative to the CIA in
order to understand the intensity of weathering and apparently wet or dry conditions.
The CWI was calculated as follows, using molecular proportions:
CWI = [(CaO + MgO + Na2O) / Al2O3] × 100
Palynology
Forty eight sediment samples (taken at 2 cm intervals) were analysed.
Ten grams of each sample was treated with warm 10% potassium hydroxide and
later sieved through 150 ASTM mesh (105 µm). The sieved fraction was allowed to
settle overnight and the supernatant was drained. The residue was treated with 40%
hydrofluoric acid. The sample was then acetolysed, following Faegri and Iversen
(1989). The 650 mesh (10 µm) fraction was collected and mounted on a glass slide
in glycerine jelly for palynological study under a light microscope (Olympus BX-
52).
Radiocarbon dating

11
Four organic carbon rich samples from the core were subjected to acid-
base-acid pre-treatment, and dated by liquid scintillation counting on benzene at the
Department of Geosciences, University of Arizona, Tucson, USA. The radiocarbon
ages were then calibrated using Calib 6.0 (Stuiver et al., 2010) following Stuiver and
Reimer (1993) method.
RESULTS
Lithology
Based on the colour and texture, three litho units were recognized in the
core. Litho unit I (100-47 cm) is represented by black coloured (10 Y 2/1) Munsell
color scale codes, fine sandy silt, clayey silt and silty sand, peaty layers, overlain by
lithological unit II (47-28 cm) which is brownish black (10 Y 2/3) in colour,
moderately sorted, sandy silt and silty sand, peat laminae, with sub angular to
angular grains. Lithological unit III (28-0 cm) is brownish black (10 Y 3/1) in
colour, and consists of sandy silt and silty sand laminae, peat with well rounded sand
grains. It contains coarse organic carbon pellets and abundant roots and root pores
(Table 1, Figures 2 and 3).
Chronology
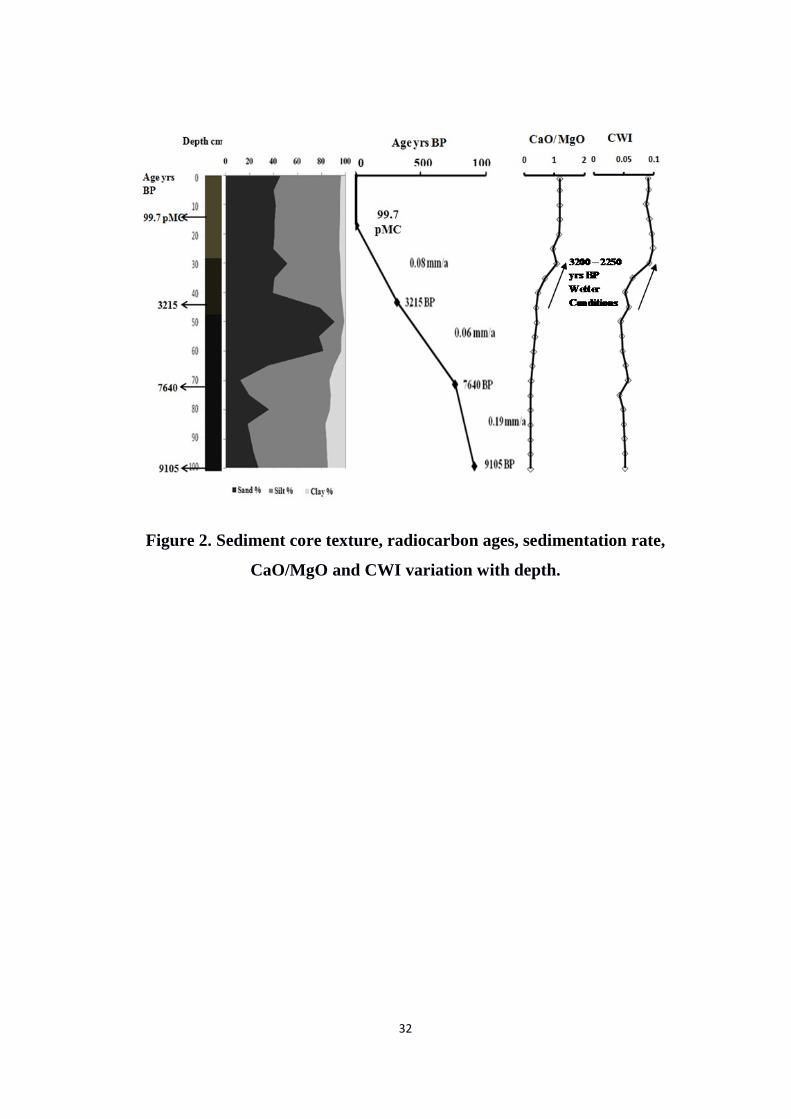
Radiocarbon dates (Figure 2), (Table 2 ) range from 9105 yr BP (99 cm
depth, ~ 9255 BC) to near modern (99.7 pMC at 17 cm depth, or ~ AD 1650-1955).
The plot of depth versus age indicates that the sedimentation rate from the early
Holocene to recent was low (0.11 mm/yr) throughout the time interval from 14 to
100 cm, with small variations as follows: 0.19 mm/yr from 9105 yr BP to 7640 yr
BP; 0.06 mm/yr from 7640 yr BP to 3215 yr BP (71-43 cm depth) and 0.08 mm/yr
from 3215 yr BP to about 150 yr BP. Above 14 cm, the deposition rate is higher,
with a minimum value, calculated by attributing an age of 300 yyr BP at 14 cm, of
0.4 mm/a.
Stable Carbon Isotopes

12
Values of δ13C of organic carbon in the sediment show a general upward
decrease from near -16‰ at 98-100 cm (9105 yr BP) to near -23‰ at present (Table
2). The transition can best be explained as the result of a decreasing proportion of
organic matter derived from C4 plants over time. Both C3 and C4 sedges grow at
present in a peat bog in a similar tropical montane environment in the Nilgiri Hills,
Tamil Nadu State, India (Rajagopalan et al., 1999).
Sediment texture
Textural analysis of clastic fraction of the Kukkal sediment core is
shown in Figure 3. The sand percentage ranges from 12.5% (depth 70 cm) to 92%
(depth 50 cm). The silt percentage ranges from 8% (depth 50 cm) to 75% (depth 70
cm), while the clay ranges from 0.5% (depth 50 cm) to 17% (depth 85 cm). Three
main zones are apparent: below about 65 cm, with silt > sand and clay > 10%;
fromabout 60 to 40 cm, sand predominant, clay < 5%; above 40 cm, sand and silt
about equal, and clay <5%. Most of the sediment core contains >25% organic matter
consistent with a lacustrine or wetland environment. Recurring peaty sediment
suggests that a wetland environment may have prevailed over much or all of the
interval represented by the sediment core, prior to construction of the dam.
Sediment chemistry
TOC content increases steadily up the section from about 3.5% at 85-100
cm to 15.8% at 1 cm (Figure 3, Table 3). Similarly, TN content increases gradually
from 0.4% (depth 85-100 cm) to 1.0-1.3%% (depth 0-30 cm) and the C/N ratio
increases gradually from about 8% (depth 85-100 cm) to 14% (depth 1 cm). A C/N
ratio 13-14 suggests a sub-equal mixture of algal and vascular plant contributions
(Meyers and Lallier-Vergès 1999). Intervals of low C/N ratio (< 9) occur at 12-14,
22-24, 30-34, 40-44 and 76-100 cm core depth (Figure 3). The sample at 2-4 cm
probably represents the present artificial lacustrine environment, and has a C/N ratio
of 14, indicating that vascular and algal plant material is deposited in shallow
standing water in this enviromnment. At the depth 40 to 35 cm a concurrent

13
decrease in OM, TOC, and TN is immediately follows a sharp decrease in sand
deposition.
The vertical profile of the major oxides versus depth (Table 4, Figure 4
and 5) shows that the lake sediments have SiO2 varying from 31 (depth 70 cm) to
47% (depth 35 cm), with Al2O3 from 13% (depth 20 cm) to 22% (depth 80 cm), and
Fe2O3 from 5 (depth 50cm) to 9% (depth 75 cm). TiO2 varies from 0.9% (depth 10
cm) to 1.3% (depth 40 cm). K2O, CaO, MgO, MnO and Na2O are present in small
(<2%) amounts. The relative concentrations of the major oxides in the sediment core
can be summarized as SiO2>Al2O3>Fe2O3>TiO2>MgO>CaO>
K2O>P2O5>MnO>Na2O. Most of the oxide trends show two prominent features:
decreases in SiO2, Al2O3, Fe2O3 nd TiO2 at 30-35 cm, accompanied by increases in
P2O5, MnO and CaO; and at 70-80 cm, decreases in SiO2, Al2O3, P2O5 and K2O
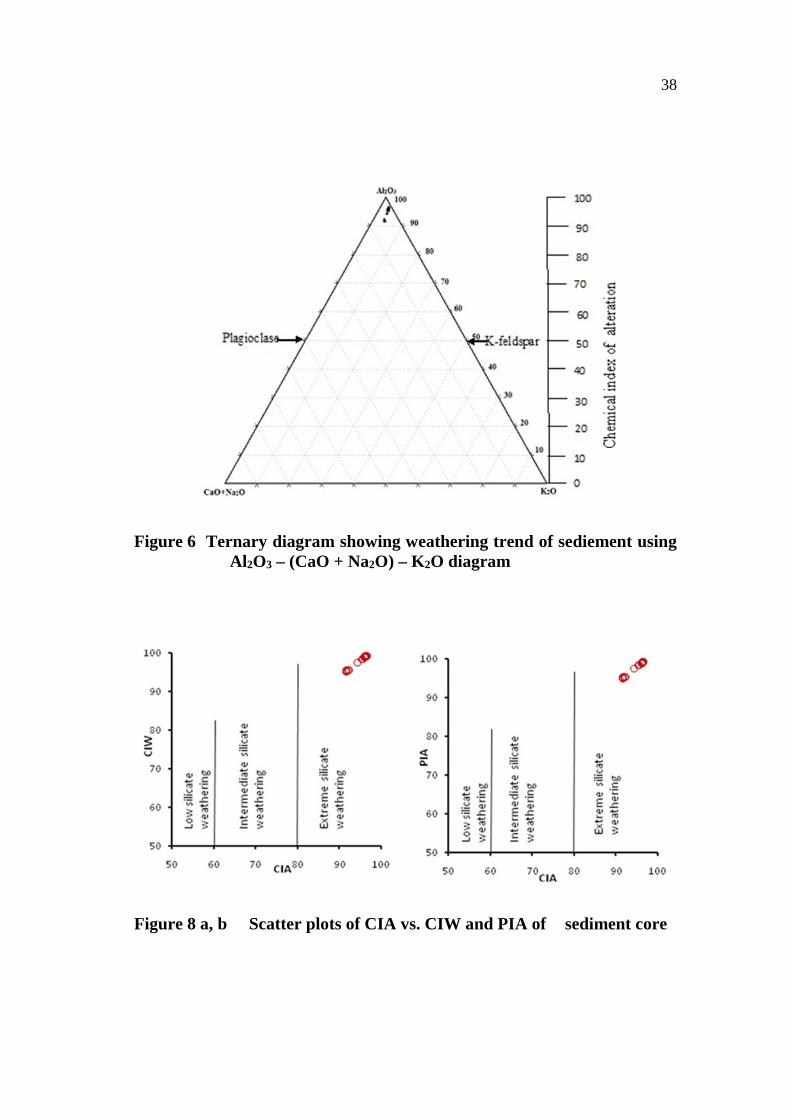
(Figure 5). Discriminant plots of major oxides point towards intense weathering of
exposed rocks around the catchment area (Figures 6, 7, 8a, b) accompanied by an
increase in Fe2O3. There is an overall significant decrease of Al2O3 (about 10%)
since 9105 yr BP (Figure 4).
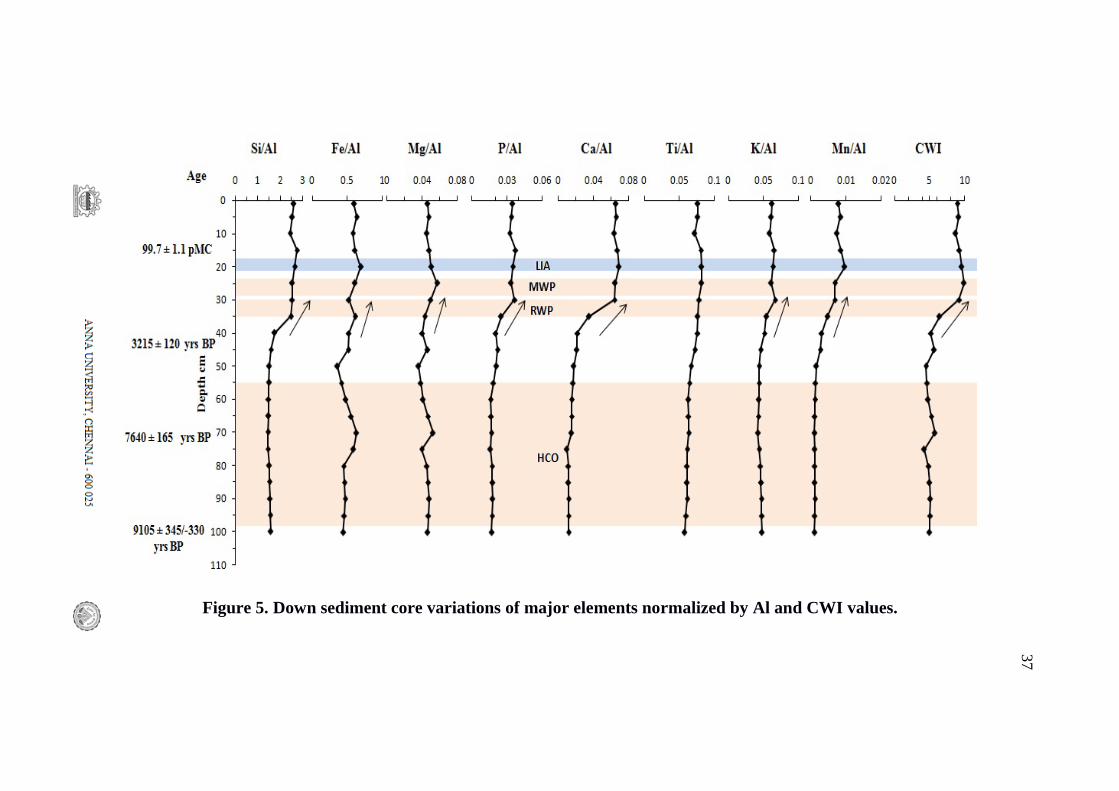
In the sediment sequence of the Kukkal lake core, the values of the CWI
increase from 4-6 (characteristic of depths below 40 cm) to 8-10 (characteristic of
depths above 30 cm) (Figure 9). Generally, higher values of CWI indicate stronger
weathering and presumably wetter conditions and a strong monsoon (Sun et al.,
2010). Concurrent decreases occur in the values of the CIA, PIA and CIW between
40 and 30 cm (Figure 9). The shifts in all four indices reflect an increase in CaO
concurrent with a decrease in Al2O3 between 40 and 30 cm.
Palynology
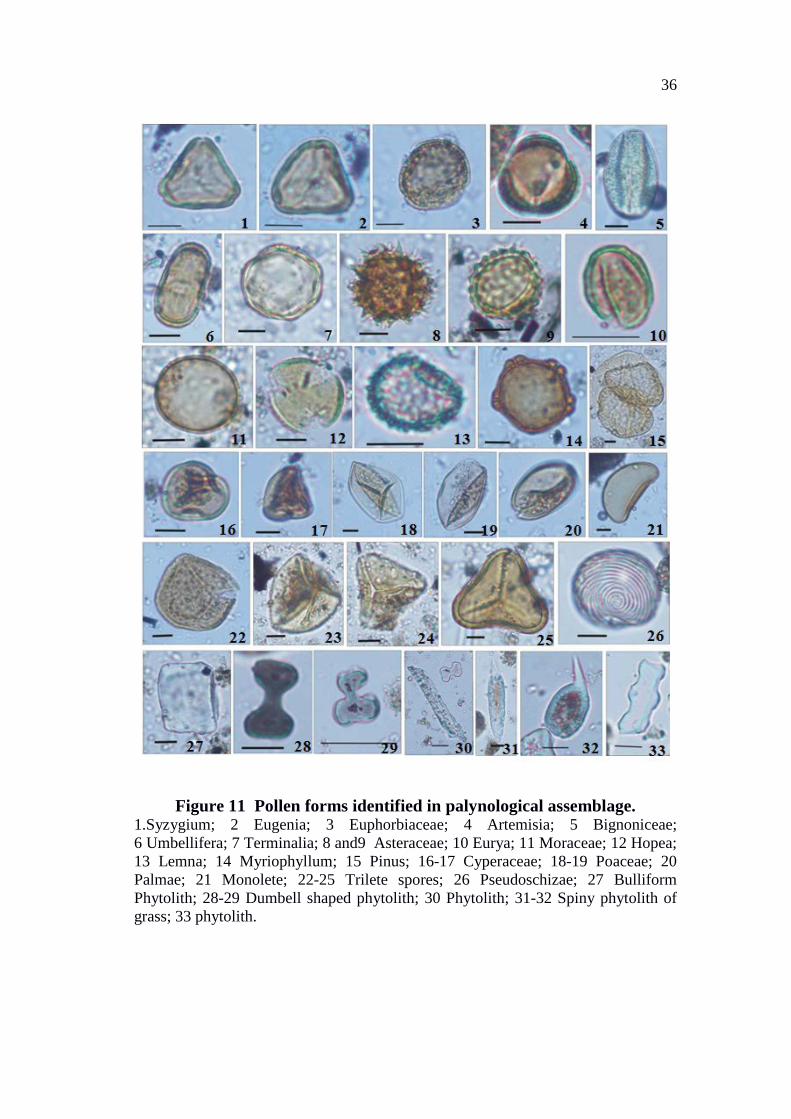
The pollen spectra are shown in Figure 10, and pollen types are illustrated in
Fig. 11. The best preservation of pollen is in the upper layer (0-27 cm). Arboreal
taxa appear above 27 cm and below 87 cm core depth, while grasses and palms are
prominent between 27 and 87 cm and sedges are most prominent above 27 cm.
Monolete and trilete fern spores are abundant above 28 cm.

14
Pollen is poorly preserved between 27 and 87 cm core depth, but grass pollen
is abundant. Grasses are also represented by phytoliths. On the basis of
palynological analysis four phases couldbe recognised. Phases I to III in general
correspond to a fluvial depositional environment (Figure 10, 11). However, phase-I
(87-100 depth cm) can be identified with low energy deposition and as a result,
sparse deposition and preservation of arboreal pollen such as Elaeocarpus, Hopea
and the non-arboreal taxa like the Euphorbiaceae, Lamiaceae, and Apiaceae.
Asteraceae along with Cyperaceae and Poaceae pollen were recorded. Phases II (41-
87 depth cm) and III (27-41 depth cm) are represented by dominance of the
Artemisia, Poaceae and Cyperaceae along with the pollen grains of Palmae. Overall,
the pollen counts in Phases 1-3 are low and reach maximally 40 to 50 per 10 g of
sediment (Figure 10, 11). Dumbbell shaped grass phytoliths and other forms of
phytoliths such as bulliform and spiny are quite common. Phase IV, shows
assemblage of both arboreal and non-arboreal pollen assemblage in (Figure 10, 11).
Discussion
Sedimentary environment
The chronology of the core, and inferred measurements of sedimentation
rate, indicates a sedimentary environment that has been continuous and close to
stable in this small basin for the past 9000 yr. However, highproportion of sand
deposited between 60to 45 cm internval indicate a faster accumulation rates. Peat-
like deposits of organic matter are consistent with a wetland environment like those
present elsewhere in montane valleys of the tropical Western Ghats. Variations in
the C/N ratio of organic matter may indicate changes in the abundance of algae in
the basin flora, and, by implication, changes in the amount of standing water in the
basin (Figure 3). The basin may have been lacustrine for relatively brief intervals
corresponding to 12-14, 22-24, 30-34, and 40-44 cm, in addition to a longer interval
corresponding to 76-100, cm in the core (Figures 4, 5). The present-day lacustrine
environment is due to damming. Superimposed on this sedimentary system are
15
changes revealed by our climate proxy measurements – both unidirectional steady
changes, and abrupt events.
Unidirectional changes
The chemistry of the OM in the core has evolved steadily over the past 9000
yr. TOC, TN and C/N all show an upward increase in the core (Figure 3). The
values of δ13C also suggest an increase. A progression from mainly C4 to mainly C3
species in the basin is indicated, and this is in support with an increasingly wet
climate. Increasing rainfall may also be responsible for the increasing amount of
organic matter over time, preservation being more likely when the basin sediments
remain wet for long periods. The CaO/MgO ratio in the silicate fraction also
increases towards the top of the core section, and Al2O3 decreases.
Step-wise changes
Several proxies show step-wise changes in the range 30-40 cm. Major oxide
measurements change in such a way that all four chemical weathering indices
calculated for this study shift to new values corresponding to more intense
weathering over that depth interval. Fe2O3, MnO and P2O5 also show shifts. The
changes in chemical indices are concurrent with increases in Ca/Al and Si/Al
(Figure 5), but there is no change in the relative abundance of clay (Figure 3).
Proportions of Asteraceae, Poaceae and palmae or Arecaceae decrease markedly in
the record over this depth interval (Figures 10, 11). These changes immediately
follow a change in the character of clastic sedimentation from sand-dominant to
sand and silt in approximately equal proportions. They are succeeded rapidly by a
further change in the pollen record, namely enhanced preservation of arboreal Ferns
increase in abundance earlier, at depths of 46 to 40 cm in the core. This change is at
ca 3000 yr BP (at 40 cm) to 1800 yr BP (at 30 cm). A step-wise change similar to
that reflected in enhanced preservation of pollen and the appearance of diatoms just
above 30 cm in the Kukkal core and occurred at 1500 yr BP in Pookode Lake,
Kerala, at an altitude of 770 ma.s.l (Veena et al., 2014).

16
As noted before, the shifts in the chemical indices appear to relate to
increased deposition of CaO as silicate minerals, and concurrent increase in Si/Al.
A change in clay mineralogy, with deposition of Ca-smectite above 30 cm, is a
possible way of accounting for the change. The increase in CWI indicates a greater
intensity of weathering, but deposition of sediment bearing this signature is likely to
have lagged behind the climate stimulus responsible for the change. Together, most
of the observations suggest a period of increasing rainfall. The changes may even
have begun as early as 6000 yr BP, when sand began to dominate the clastic
sediment, and have led to more abundant fern vegetation by 3500 yr BP, and forest
vegetation largely replacing grasslands with palms by1700 yr BP. This change
might account for the decrease in sand deposition at about 1700 yr BP, if the change
to forest vegetation led to less energetic runoff.
The increase in sand deposition near 6000 yr BP could be a separate step-
wise event, independent of the events beginning around 3500 yr BP. A further step-
wise event is indicated at 90 cm in the core, (about 8700 yr BP), prior to which some
arboreal pollen and fern spores were preserved. Above this horizon, the relative
abundances of sand, silt and clay change abruptly in the sediment core towards the
top. Major oxide trends show inflections at about 80 cm, possibly resulting from the
same event, with a lag reflecting the time required for weathering chemistry to
respond.
Human effects
The higher sediment deposition rate between 0 and 14 cm in the core
corresponds to events of the last 350 yr or less, and is the only evidence consistent
with human-caused changes in the lake catchment. As noted above, abandoned
paddy terraces are present along the east side of the catchment. Agriculture may
have become established in this montane site since the early 17th century. Cutting of
trees in the forested part of the catchment may also have contributed to the increased
sedimentation rate.

17
Regional and Global Correlations
The Kukkal lacustrine/wetland basin has responded to hydrological changes,
principally changes in the amount of precipitation from the SWM, over the 9000
year record presented here. Several other proxy records of similar length are
available for comparison in the region of the SWM and the East Asian Monsoon
(EAM). Oxygen isotope records from radiometrically-dated speleothems (Cheng et
al., 2009; Liu et al., 2013; Fleitmann et al., 2003, 2004, 2007; Morrill et al., 2013a,
2013b) show a general unidirectional decrease in δ18O since about 8000 yr BP (Fig.
12). The trend is interpreted by the authors, on the basis of the isotope amount
effect, as evidence for a gradual increase in intensity of the SWM and EAM, and is
consistent with the unidirectional changes at Kukkal, also interpreted as evidence of
an increase in monsoon intensity. Similar unidirectional changes occur in another
proxy, the abundance of Globigerina bulloides in seafloor sediment in the Arabian
Gulf near Oman (reference). The general increase in SWM rainfall is consistent
with the results of Yadava and Ramesh (2005), who interpreted a speleothem record
as indicating the highest rainfall around AD 1666 (LIA).
The speoleothem records also show a trough in the δ18O between 8500 and
8000 yr BP., interpreted in part as a decrease in monsoon intensity beginning at
8200 yr BP and lasting 100 to 150 yr. An event close to this time is present in the
Kukkal sediments at an interpolated age of 8700 yr BP, where it is marked by the
replacement of savanna vegetation by grassland assemblage, and inflections in the
curves of major oxide abundances. Given the uncertainties of the age interpolation,
the proxy records may all be recording the same event.

18
At Kukkal, the more pronounced stepwise event between stepwise event
between 3000 and 1800 yr BP has no clear counterpart in the speleothem or G.
bulloides records. Possible counterpart events in climate records from the Indian
subcontinent include the pollen-preservation event at 1500 yr BP at Pookode Lake,
Kerala (Veena et al., 2014) (discussed above) and a change of slope in a speleothem
δ18O record from Orissa, India (Yadava and Ramesh, 2005). In the case of the
latter, the authors interpret the record as indicating increasing rainfall up until 1500
yr BP, followed by a period of decreasing rainfall that is not evident at Kukkal. A
high-rainfall phase at 3000–2300 yr BP is recorded in the discharge of the Indus
River (von Rad et al., 1999 a, b). However, this is at variance with a long drought in
the Thar Desert, India, between 3600 and 2000 yr BP (Swain et al., 1983; Bryson
and Bryson, 1996) or aridity and weakening of the summer monsoon between 4500
and 2000 yr BP in the continental records (Swain et al., 1983).
Climatic events of global scale during the last 3000 yr include the Roman
Warm Period (RWP) (2500-1600 yr BP (Wang et al., 2012; Wang et al., 2013), the
Medieval Warm Period (MWP, 790-620 yr BP) and the (LIA, 330-80 yr BP)
(Bianchi and McCave, 1999). These phenomena have been proposed on the basis of
multi-proxy studies in records from higher latitudes, e.g. (Liu et al., 2007, 2013;
Zhou et al., 1991, 2011 ; Sukumar et al., 1993, Mazari et al., 1996; Lehmkuhl 1997;
von Rad et al., 1999 a, b; Denniston et al., 2000). Crowley and Lowery (2000)
described the LIA as a mild cooling event in the Northern Hemisphere. Hu et al.,
(2001, 2008) determined that the LIA led to ~ 1.7oC of cooling around Alaska
(Keigwin, 1996). The LIA, therefore, has a large temporal and spatial variability

19
across the globe (IPCC report 2001, ). The stepwise event at 3000 to 1800 yr BP in
the Kukkal proxies appear to anticipate the RWP by a few hundred years (Figs. 5
and 9), but the interpolated dates are only approximate; the inflections in the curves
may in fact correspond with the initiation of the RWP. There are no events at
Kukkal that correspond convincingly to the MWP and the LIA. Even though
Zonneveld et al., (1997) suggested a rapid teleconnection between the climates of
high latitude and the SWM, the only evidence of such relationships in the Kukkal
core is the stepwise event that may correspond to the beginning of the RWM.
A possible scenario for Kukkal
When comparing and contrasting climatic proxy records from different
environments, it must be borne in mind that each environment will have its own set
of responses to a particular climatic forcing. Terrestrial records involving plant
associations, in particular, may have much longer response times than caves and
marine sediments. In the case of the Kukkal record, it is possible to conceive of the
evolution of the basin as the protracted response to a century or two of dry climate at
about 8000 yr BP, followed by increasing rainfall. Savanna is initially replaced by
grassland with palms, sedges and ferns appear later, and all are eventually succeeded
by forest in a process that lasts several thousand yr. Evolving vegetation and rainfall
amount control weathering, and the character and availability of clastic sediment.
Eventual establishment of mature shola forest limits the energy of runoff and the
availability of coarser clastics. Pollen preservation is poor following the period of
dry climate, and recovers only when the SWM intensity increases more rapidly,
augmenting the amount of standing water in the wetland/lake basin.
20
The conclusions that emerge from this study are:
i) The Kukkal sediment core contains lacustrine or wetland sediments
representing deposition from the Early Holocene (9000 yr BP) to the
present Four radiocarbon ages indicate a slow average sedimentation rate
of 0.11 mm/a, except in the upper 14 cm of core, where the rate was 0.4
mm/a or greater. The rate increase may reflect human activity.
ii) Steady unidirectional climate change is indicated by the degree of
preservation of organic matter, and by evolution of its composition.
Superimposed on this trend are two stepwise changes, at about 8000 and
between about 3000 and 1800 yr BP. The former change appears to
correspond to a dry spell of 100-150 yr recorded elsewhere in India. The
latter corresponds to a local rapid intensification of the SWM, and may
correlate with the initiation of the Roman Warm Period. The Medieval
Warm Period and the Little Ice Age are not clearly represented in the record.
iii) The C/N ratio of Kukkal lake sediments ranges from 14.02 to 8.31
indicating that the organic carbon originates from a mixture of lacustrine
algae and vascular plants. Stable carbon isotope data suggest early
dominance of C4 plants such as sedges, and a progressive increase in the
ratio of C3 to C4 in deposited organic matter.
iv. Chemical weathering indices indicate extreme silicate weathering over
the past 9000 yr, with a step-wise increase in intensity beginning about 3000
yr BP. Palynological results reveal a succession of vegetation types,
beginning with savanna prior to about 8000 yr BP, succeeded by grassland
with palms and Asteraceae species. Spore-bearing plants beame abundant
just prior to 3200 yr BP and forest was established between 3200 and 1800
yr BP.
REFERENCES

21
Achyuthan H, Kar A and Eastoe C (2007a) Late Quaternary environmental changes and evolution of the Tal Chappar salt lakes, Rajasthan. Journal of Paleolimnology 38: 493-507.
Achyuthan H, Quade J, Roe L and Plazeck C (2007b) Stable isotopes of pedogenic carbonates from the eastern margins of the Thar Desert, Rajasthan. Quaternary International 162: 50-60.
Achyuthan H, Nagasundaram M, Gourlan AT, Eastoe C, Ahmad SM, and Veena MP (2014) Mid-Holocene Indian summer monsoon variability off the Andaman Islands, Bay of Bengal. Quaternary International 7: 41-53.
Allchin, B (1997). Origins of a Civilization: The Prehistory and Early Archaeology of South Asia. New York, Viking.
An ZS, Kutzbach JE, Wu XH, Wang SM, Liu XD, Li XQ, Zhou WJ, and Porter SC (2000) Asynchronous Holocene optimum of the East Asian monsoon. Quaternary Science Reviews 19: 743-762.
Anderson DM, Overpeck JT and Gupta AK (2002) Increase in the Asian, Southwest Monsoon during the past four centuries. Science 297 (5581): 596-599.
Bagyaraj M and Gurugnanam B (2011) Significance of morphometry studies, soil characteristics, erosion phenomena and landform processes using remote sensing and GIS for Kodaikanal Hills, A global biodiversity hotpot in Western Ghats, Dindigul District, Tamil Nadu, South India. Research Journal of Environmental and Earth Sciences 3(3): 221-233.
Bera SK and Farooqui A (2000) Mid-Holocene vegetation and climate of South Indian Montane. Journal Paleontological Society of India 45: 49-56.
Bianchi GG and McCave IN (1999) Holocene periodicity in North Atlantic
climate and deep-ocean flow south of Iceland. Nature 397: 515-517.
Bryson RU and Bryson RA (1996) Application of a global volcanicity time-
series on high-resolution paleoclimatic modeling of the eastern
Mediterranean. Water Science and Technology Library31: 1-19.
Carver RE (1971) Procedure in sedimentary petrology, Wiley Interscience,
Chicago.

22
Chamyal LS, Maurya DM, Bhandari S and Rachna R (2002) Late Quaternary
geomorphic evolution of the lower Narmada Valley, western India:
implications for neotectonic activity along the Narmada-Son Fault.
Geomorphology 46: 177-202.
Chauhan OS and Vogelang A (2006) Climate induced changes in the circulation and dispersal patters of fluvial sources during late Quaternary in the middle Bengal fan. Journal of Earth System Science 115: 379-386.
Chauhan OS, Shiva KP and Suneethi J (2004) Fluvial influx and weathering history of the Himalayas since Last Glacial Maximum - isotopic, sedimentological and magnetic records from the Bay of Bengal. Current Science 87: 509-515.
Chauhan OS, Vogelsang E, Basavaiah N and Syed Abdul Kader U (2010) Reconstruction of the variability of SW monsoon during the past 3 ka from the continental margin of the south eastern Arabian Sea. Journal of Quaternary Science 25(5): 798-807.
Cheng H, Fleitmann D, Edwards LR, Wang X, Cruz FW, Auler AS, Mangini A, Wang Y, Kong X, Burns SJ and Matter A (2009) Timing and structure of the 8.2 kyr BP event inferred from δ18O records of stalagmites from China, Oman and Brazil. Geology 37: 1007-1010.
Cronin TM, Dwyer GS, Kamiya T, Schwede S and Willard DA (2003) Medieval Warm Period, Little Ice Age and 20th century temperature variability from Chesapeake Bay. Global Planetary Change 36: 17-29.
Crowley TJ (2000) Causes of climatic change over the past 1000 yr. Science 289: 270-277.
Crowley TJ and Lowery TS (2000) How warm was the medieval warm period? Ambio 29: 51-54.
Denniston RF, Gonzalez LA, Asmerom Y, Sharma RH and Reagan MK (2000) Speleothem evidence for changes in Indian summer monsoon precipitation over the last similar to 2300 yr. Quaternary Research 53:196-202.
Duplessy JC (1982) Glacial to interglacial contrast in the northern Indian Ocean. Nature 295: 494-498.

23
Duzgoren-Aydin NS, Aydin A and Malpas J (2002) Re-assessment of chemical weathering indices: case study on pyroclastic rocks of Hong Kong. Engineering Geology 63: 99-119.
Engstrom, DR, Wright, HE, Haworth, EY, and Lund, JWG, Jr (Eds.) (1984), Chemical stratigraphy of lake sediments as a record of environmental change in lake sediments and environmental history, Leicester University Press: 11-69.
Esper J, Cook ER, and Schweingruber FH (2002a) Low-frequency signals in long tree-ring chronologies and the reconstruction of past temperature variability. Science 295: 2250-2253.
Esper J, Schweingruber FH and Winiger M (2002b) 1300 yr of climatic history for western Central Asia inferred from tree-rings. The Holocene 12: 267-277.
Esper J, Shiyatov SG, Mazepa VS, Wilson RJS, Graybill DA and Funkhouser
G (2003) Temperature-sensitive Tien Shan tree ring chronologies show multi-
centennial growth trends. Climate Dynamics 21: 699-706.
Fægri K and Iversen J (1989) Textbook of pollen analysis. Chichester, UK.
Farooqui A and Sekhar B (2011) Climate change and vegetation succession in Lalitpur area, Uttar Pradesh (India) during late Holocene. Tropical Ecology 52 (1): 69-77.
Farooqui, A, Ray, JG, Farooqui, SA and Khan, ZA 2010, Palynodiversity, sea level and climate prior to 40 ka in Indian Peninsula, Kerala. Quaternary International 213: 2-11.
Fedo CM, Nesbitt HW and Young GM (1995) Unravelling the effects of potassium metasomatism in sedimentary rocks and paleosols, with implications for paleoweathering conditions and provenance. Geology 23: 921-924.
Fleitmann D, Burns SJ, Mudelsee M, Neff U, Kramers J, Mangini A and Matter A (2003) Holocene forcing of the Indian monsoon recorded in a stalagmite from southern Oman. Science 300: 1737 -1739.
Fleitmann D, Burns SJ, Neff U, Mudelsee M, Mangini A and Matter A (2004) Palaeoclimatic interpretation of high-resolution oxygen isotope profiles

24
derived from annually laminated speleothems from southern Oman, Quaternary Science Reviews 23: 935-945.
Fleitmann, D, Burns, SJ, Mangini, A, Mudelsee, M, Kramers, J, Villa, I, Neff, Al-Subbary, AA, Buettner, A, Hippler and Matter, A 2007, Holocene ITCZ and Indian monsoon dynamics recorded in stalagmites from Oman and Yemen (Socotra). Quaternary Science Reviews 26: 170-188.
Gaudette H, Flight W, Toner L and Folger D (1974) An inexpensive titration method for the determination of organic carbon in recent sediments. Journal of Sedimentary Petrology 44: 249-253.
Gupta, A K (2004), Origin of agriculture and domestication of plants and animals linked to early Holocene climate amelioration. Current Science, 87 (1): .
Gupta AK, Anderson DM and Overpeck JT (2003) Abrupt changes in Asian southwest monsoon during the Holocene and their links to the North Atlantic Ocean. Nature 421: 354-356.
Gupta AK, Das M and Anderson DM (2005) Solar influence on the Indian summer monsoon during the Holocene. Geophysical Research Letters 32: 2-5
Harnois L (1988) The CIW index: A new chemical index of weathering Sediment. Geology 55: 319-322.
Hu SF, Ito E, Brown TA, Curry BB and Engstrom DR (2001) Pronounced climatic variations in Alaska during the last two millennia. Proceedings of the National Academy of Sciences 98 (19):10552-10556.
Hu C, Henderson GM, Huang J, Xie S, Sun Y and Johnson KR (2008) Quantification of Holocene Asian monsoon rainfall from spatially separated cave records. Earth and Planetary Science Letters 266 (3): 221-232.
IPCC Report (2001) Climate change 2001: The scientific basis. Cambridge University Press, Cambridge.
Keigwin LD (1996) The little ice age and medieval warm period in the Sargasso Sea., Science 274: 1504-1508.
Krishnamurthy TN (1985) Summer monsoon experiment-a review. Monthly Weather Review 113: 1590-1626.
Kudrass HR, Hofman A, Doose H, Emeis K and Erlenkeuser H (2001) Modulation and amplification of climatic changes in the Northern

25
Hemisphere by the Indian summer monsoon during the past 80 ky. Geology 29: 63-66.
Kumaran KPN, Limaye RB, Nair KM and Padmalal D (2008) Palaeoecological and palaeoclimate potential of subsurface palynological data from the late Quaternary sediments of south Kerala Sedimentary Basin, southwest India. Current Science 95(4): 515-526.
Lehmkuhl F (1997) Late Pleistocene, late glacial and Holocene glacier advances on the Tibetan Plateau. Quaternary International 38/39: 77-83.
Limaye RB, Kumaran KPN, Nair KM and Padmalal D (2010) Cyanobacteria as potential biomarkers of hydrological changes in the late Quaternary sediments of south Kerala Sedimentary Basin, India, Quaternary International 213: 79-90.
Liu YH, Henderson GM, Hu CY, Mason AJ, Charnley N, Johnson KR and Xie SC (2013) Links between the East Asian monsoon and North Atlantic climate during the 8200 year event. Nature Geosciences 6: 117-120.
Loring DH, and Rantala RTT (1992) Manual for the geochemical analyses of marine sediments and suspended particulate matter. Earth Science Reviews 32:235-283.
Lückge AH, Doose-Rolinski AA, Khan H, Schulz H and von Rad H (2001) Monsoonal variability in the northeastern Arabian Sea during the past 5000 yr: geochemical evidence from laminated sediments. Palaeogeography Palaeoclimatology Palaeoecology 167: 273-286.
Mackereth FJH (1966a) In Report, Freshwater Biology Assesment 34: 26-27.
Mackereth FJH (1966b) Some chemical observations on post glacial lake sediments. Philosophical Transactions of the Royal Society of the Biological Sciences 250: 165-213.
Maslov AV, Krupenin MT and Gareev EZ (2003) Lithological, lithochemical,
and geochemical indicators of paleoclimate: evidence from riphean of the
southern Urals. Lithological Mineral Resource 38: 427-446.
Mayewski PA, Rohling E, Stager JC, Karlen W, Maasch KA, Meeker LD, Meyerson EA, Gasse F, vanKreveld S, Holmgren K, Lee-Thorp J, Rosqvist G, Rack F, Staubwasser M, Schneider RR and Steig EJ (2004) Holocene climate variability. Quaternary Research 62: 243-255.

26
Mazari RK, Bagati TN, Chauhan MS and Rajagopalan G (1996) Palaeoclimatic record of last 2000 yr in trans-Himalayan Lahaul-Spiti region. In: Paleoclimate and environmental variability in Austral-Asian transect during the past 2000 years. Proceedings, IGBP-PAGES/PEP II Symposium, Nagoya, Japan: 262-269.
Meher-Homji VM (1967) Phytogeography of a south Indian Hill station, Bull. Torrey Botany Club 94: 230-242.
Meyers PA and Lallier VE (1999) Lacustrine sedimentary organic matter records of late Quaternary paleoclimate. Journal of Paleolimnology 21: 345-372.
Minyuk PS, Borkhodoevl VY and Wennrich V (2014) Inorganic geochemistry data from Lake Elgygytgyn sediments: marine isotope stages 6–11. Climate of the Past 10: 467-485.
Morrill C, Anderson DM, Bauer BA, Buckner R, Gille EP, Gross WS, Hartman M and Shah A (2013a) Proxy benchmarks for intercomparison of 8.2 ka simulations. Climate of the Past 9: 423-432.
Morrill C, LeGrande AN, Renssen H, Bakker P and Otto-Bliesner BL (2013b) Model sensitivity to North Atlantic freshwater forcing at 8.2 ka. Climate of the Past 9: 955-968.
Nagasundaram M (2014) Middle to late Holocene paleoenvironmental changes inferred from a marine sediment core off Landfall Island, Bay of Bengal. Unpublished Ph.D Thesis, Anna University, Chennai, India: 136 pp.
Narayana AC, Tiwari, CM, Yadava MG, Nguyen DC, Shen C, Belangaonkar SP and Ramesh R (2011) Stable Isotopic Variations of a Stalagmite from Belum Cave, India: Potential for Monsoon Reconstruction. American Geophysical Union, Fall Meeting, abstract: 31C-1886.
Nesbitt HW and Young GM (1982) Early Proterozoic climates and plate motions inferred from major element chemistry of lutites. Nature 199: 715-717.
Overpeck J, Anderson D, Trumbore S and Prell W (1996) The southwest Indian monsoon over the last 18,000 yr. Climate Dynamics 12: 213-225.
Piper CS (1947) Soil and plant analysis, University of Adelaide Press, Adelaide, 368 p.

27
Possehl, GL (1996), Mehrgarh, Oxford Companion to Archaeology Brian Fagan, (Ed.)Oxford University Press.
Prell WL and Kutzbach JE (1987) Monsoon variability over the past 150,000 yr. Journal of Geophysical Research 82: 8411-8425.
Prell WL and Van Campo E (1986) Coherent response of Arabian Sea upwelling and pollen transport to late Quaternary monsoonal winds. Nature 323: 526-528.
Price JR and Velbel MA (2003) Chemical weathering indices applied to
weathering profiles developed on heterogenous felsic metamorphic parent
rocks. Chemical Geology 202:397416.
Rajagopalan G, Ramesh R and Sukumar R (1999) Climatic implications of
δ13C and δ18O ratios from C3 and C4 plants growing in a tropical montane
habitat in southern India. Journal of Bioscience 24, 491-498.
Rawat S, Gupta AK, Sangode SJ, Srivastava P and Nainwal HC (2015) Late Pleistocene- Holocene vegetation and Indian summer monsoon record from the Lahaul, northwest Himalaya, India. Quaternary Science Reviews 114: 167-181.
Sant DA, Wadhavan SK, Ganjoo RK and Basavaiah N (2011) Linkage of Proglacial processes from Last glacial to recent inferred form spity sequence, Ley valley, Ladakh Himalaya. Journal of Geological Society of India 74: 147-156.
Shah SK, and Bhattacharya A (2009) Tree-ring analysis of sub-fossil woods of Pinus wallichiana from Ziro Valley, Arunachal Pradesh, northeast Himalaya. Journal of Geological Society of India 74: 503-508.
Sharma S, Joachimski MM, Tobschall HJ, Singh IB, Sharma C and Chauhan MS (2006) Correlative evidence of monsoon variability, vegetation change and human habitation in Senai Lake deposit, Ganga plain. Current Science 90: 973-978.
Singhvi AK and Kale VS (2008) Palaeoclimate studies in India: last ice age to the present. IGBP-WCRP-SCOPE Report Series: 4, Indian National Science Academy, New Delhi.
28
Sinha A, Cannariato KG, Stott LD, Cheng H, Edwards RL, Yadava MG, Ramesh R and Singh IB (2007) A 900-year (600 to 1500 A.D.) record of the Indian summer monsoon precipitation from the core monsoon zone of India. Geophysical Research Letters 34 (16):1-5.
Sirocko F, Sarnthein M, Erlenkeuser H, Lange H, Arnold M and Duplessy JC (1993) Century scale events in monsoon climate over the past 24,000 yr. Nature 364: 322-324.
Sirocko F, Garbe-Schösnberg D, Mclntyre A and Molfino B (1996) Teleconnections between the subtropical monsoons and high-latitude climates during the last deglaciation. Science 272: 526-529.
Sirocko F, Garbe-Schönberg D and Devey C (2000) Processes controlling trace element geochemistry of Arabian Sea sediments during the last 25,000 yr. Global and Planetary Change 26: 217-303.
Staubwasser M, Sirocko F, Grootes PM and Erlenkeuser H (2002) South Asian monsoon climate change and radiocarbon in the Arabian Sea during early and middle Holocene. Paleoceanography 17 (4): 1063.
Staubwasser M, Sirocko F, Grootes PM and Segl M (2003) Climate change at the 4.2 ka BP termination of the Indus valley civilization and Holocene south Asian monsoon variability. Geophysical Research Letters 30: 1425.
Stuiver M and Reimer PJ (1993) Extended 14C data base and revised CALIB 3.0 14C age calibration program. Radiocarbon 35: 215-230.
Stuiver M, Reimer PJ and Reimer R (2010) CALIB 5.0.2, WWW program and documentation.
Sukumar R, Ramesh R, Pant RK and Rajagopalan G (1993). A δ13C record of late Quaternary climate change from tropical peats in southern India. Nature 364: 703-706.
Sun N and Li XQ (2011) The quantitative reconstruction of the paleoclimate between 5200 and 4300 cal BP in the Tianshui Basin, NW China. Climate of the Past Discussions 7: 2741-2762.
Sun Y, Ding Y and Dai A (2010) Changing links between South Asian summer monsoon circulation and tropospheric land-sea thermal contrasts under a warming scenario. Geophysical Research Letters 37: L02704.
29
Swain AM, Kutzbach JE and Hastenrath S (1983) Estimates of Holocene precipitation for Rajasthan, India, based on pollen and lake-level data. Quaternary Research 19:1-17.
Thamban M, Rao, VP and Schneider RR (2002) Reconstruction of late Quaternary monsoon oscillations based on clay mineral proxies using sediment cores from the western margin of India. Marine Geology 186: 527-539.
Tiwari M, Ramesh R, Somayajulu BLK, Jull AJT and Burr GS (2005) Solar control of southwest monsoon on centennial time scales. Current Science 89(1): 583-1589.
Tiwari M, Ramesh R, Bhushan R, Somayajulu BLK, Jull AJT and Burr GS (2006) Paleoproductivity variations in the equatorial Arabian Sea: implications for east African and Indian summer rainfalls and the El Nino frequency. Radiocarbon 48:17-29.
Van Campo, E, Cour, P and Hang, S (1996) Holocene environmental changes in Bangong Co basin (western Tibet), Part 2: the pollen records. Paleogeography Paleoclimatology Paleoecology 120: 49-63.
Veena MP, Achyuthan H, Eastoe C and Farooqui A (2014) A multi-proxy reconstruction of monsoon variability in the late Holocene, south India. Quaternary International 325: 63-73.
Verschuren D 2003, Lake-based climate reconstruction in Africa: progress and challenges. Hydrobiologia 500: 315-330.
Verschuren D, Laird KR, and Cumming BF (2000) Rainfall and drought in equatorial east Africa during the past 1100 yr. Nature 403: 410-414.
von Rad, U, Schaaf, M, Michels, KH, Schulz, H, Berger, WH and Sirocko, F (1999a) A 5000-yr record of climate change in varved sediments from the oxygen minimum zone off Pakistan, northeastern Arabian Sea. Quaternary Research 51: 39-53.
von Rad, U, Schulz, H, Riech, V, den Dulk, M, Berner, U and Sirocko, F (1999b) Multiple monsoon controlled breakdown of oxygen-minimum conditions during the past 30,000 yr documented in laminated sediments off Pakistan. Palaeogeography Palaeoclimatology Palaeoecology 152: 129-161.
Wang T, Surge D and Walker KJ (2013) Seasonal climate change across the Roman Warm period/Vandal Minimum transition using isotope

30
sclerochronology in archaeological shells and otoliths, southwest Florida, USA. Quaternary International 308-309: 230-241.
Wang T, Surge D and Mithen S (2012) Seasonal temperature variability of the Neoglacial (3300–2500 BP) and Roman Warm Period (2500–1600 BP) reconstructed from oxygen isotope ratios of limpet shells (Patella vulgata), northwest Scotland. Paleogeography Paleoclimatology Paleoecology 317/318:104-113.
Wang, Y, Cheng, H, Edwards, RL, He, Y, Kong, X, An, Z, Wu, J, Kelly, MJ, Dykoski, CA and Li, X (2005) The Holocene Asian monsoon: links to solar changes and North Atlantic climate. Science 308: 854-857.
Xia, Yu-mei, and Wang, Pei-fang, (2001) Peat record of climate change for the last 3000 yr in Yangmu, Mishan region of Sanjiang plain. Journal of Geographical Sciences 11(4): 454-460.
Yadav, RR and Singh, J (2002) Tree-ring-based spring temperature patterns over the past four centuries in western Himalaya. Quaternary Research 57: 299-305.
Yadava, MG, and Ramesh, R, (2005) Monsoon reconstruction from radiocarbon dated tropical Indian speleothems. The Holocene 15: 48-59.
YudovichYE and Ketris MP (2006) Selenium in coal: a review. International Journal of Coal Geology 67 (2006), pp. 112–126.
Zhou, WJ, An, ZS, Head, J, Donhaue, DJ, Ren, JZ, Lin, BH, Zhou, MF, Yan, YS, and Zhang, JZ (1991) 14C dating and measurements of climatic proxy indices of loess sequence to record paleomonsoon variation on the Loess Plateau of China during the last 16000 yr (abstr). Radiocarbon 33: 259.
Zhou T, Li B, Man W, Zhang L and Zhang J (2011) A comparison of the Medieval Warm Period, Little Ice Age and 20th century warming simulated by the FGOALS climate system model, Chinese Science Bulletin 56 (28): 3028-3041.
Zonneveld, KAF, Ganssen, G, Troelstra, S, Versteegh, GJM and Visscher, H (1997) Mechanisms forcing abrupt fluctuations of the Indian Ocean summer monsoon during the last deglaciation. Quaternary Science Reviews 16: 187-201.

31
Figure 1 Location map of Kukkal Lake and the coring site.
32
Figure 2. Sediment core texture, radiocarbon ages, sedimentation rate,
CaO/MgO and CWI variation with depth.

33
Figure 3. Down sediment core variations of texture, OM, TOC, TN percentage and C/N ratio.

34
Figure 4 Depth versus major oxide variation observed in the sediment core

35
Figure 10. Pollen spectrum of sediment core. Note that there is a significant shift in the abundance of Poaceae, Cyperaceae and Palmae
36
Figure 11 Pollen forms identified in palynological assemblage. 1.Syzygium; 2 Eugenia; 3 Euphorbiaceae; 4 Artemisia; 5 Bignoniceae; 6 Umbellifera; 7 Terminalia; 8 and9 Asteraceae; 10 Eurya; 11 Moraceae; 12 Hopea; 13 Lemna; 14 Myriophyllum; 15 Pinus; 16-17 Cyperaceae; 18-19 Poaceae; 20 Palmae; 21 Monolete; 22-25 Trilete spores; 26 Pseudoschizae; 27 Bulliform Phytolith; 28-29 Dumbell shaped phytolith; 30 Phytolith; 31-32 Spiny phytolith of grass; 33 phytolith.
37
Figure 5. Down sediment core variations of major elements normalized by Al and CWI values.
38
Figure 6 Ternary diagram showing weathering trend of sediement using Al2O3 – (CaO + Na2O) – K2O diagram
Figure 8 a, b Scatter plots of CIA vs. CIW and PIA of sediment core

39
Figure 7. Paleoenvironment discrimination of sediment core exhibiting deposition of highly weathered sediments in arid and dry conditions.

40
Figure 9. Down sediment core variations showing CIA, CIW , PIA and CWI values
Since the last 9200 yr BP.

Figure 12 A comparison of various proxies and geochemical data patterns as observed from various sites such as ODP site 723A (G. bulloides %) Arabian Sea, Hematite% (in MC52-VM29-191) from North Atlantic site, δ18O‰ (Dongee Cave), δ18O‰ (Hongyuan site), Qunf cave site, Berijam and Kukkal parameters (after Bond et al., 2001 and Gupta et al., 2003). Vertical grey bars indicate periods of weak SWM.

Table 1. Lithology of the Kukkal lake sediment core
Litho unit (Depth cm)
Description Munsells color
III (28-0 )
Brownish black (10 Y 3/1) in colour and the sediment type was sandy silt and silty sand laminae, with the coarse organic carbon pellets with rootlets and root pores.
Brownish black 10 YR 3/1
II (47-28 )
brownish black (10 Y 2/3) in colour moderately sorted sandy silt and silty sand quartz, fine clear coarse quartz, angular to sub angular with ferruginous nodules, and peat 3.5 mm in length
Brownish black 10 YR/2/3
I (100-47 ) Peaty layer, dark black, clay with few roots, organic rich layer, fine sandy silt, clayey silt and silty sand layers
Black 10YR 2/1
Table 2. Radiocarbon dates of the lake sediment core collected from the Kukkal lake
S.No Lab ID Depth (cm) 14 C age (yr BP)
Calibrated date δ 13C‰
1 -22.6
2 A16345 16-18 99.7 ± 1.1 pMC AD 1650 - 1955 -23.3
3 -22.8 4 A16346 42-44 3215 ± 120 1862 - 1131 BC -20.6
5 A16347 70-72 7640 ± 165 7028 – 6110 BC -17.7
6 A16311 98-100 9105 ± 345/-330 9255 – 7526 BC -16.1
43
43
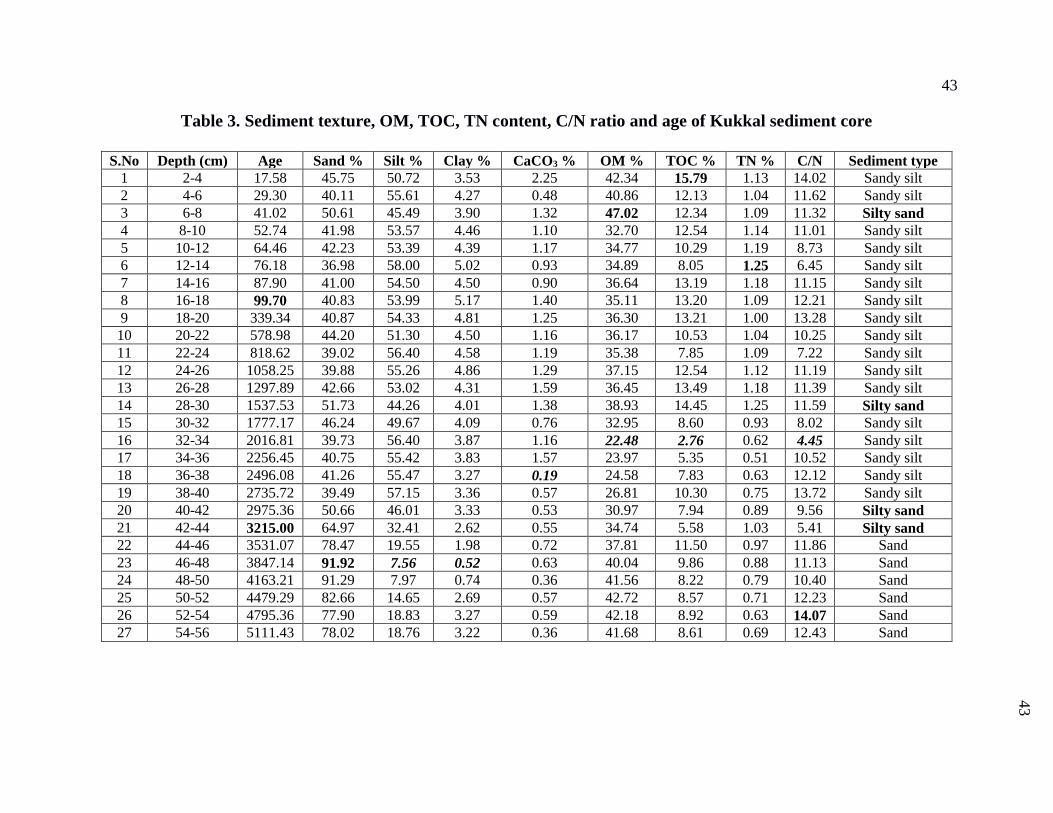
Table 3. Sediment texture, OM, TOC, TN content, C/N ratio and age of Kukkal sediment core
S.No Depth (cm) Age Sand % Silt % Clay % CaCO3 % OM % TOC % TN % C/N Sediment type 1 2-4 17.58 45.75 50.72 3.53 2.25 42.34 15.79 1.13 14.02 Sandy silt 2 4-6 29.30 40.11 55.61 4.27 0.48 40.86 12.13 1.04 11.62 Sandy silt 3 6-8 41.02 50.61 45.49 3.90 1.32 47.02 12.34 1.09 11.32 Silty sand 4 8-10 52.74 41.98 53.57 4.46 1.10 32.70 12.54 1.14 11.01 Sandy silt 5 10-12 64.46 42.23 53.39 4.39 1.17 34.77 10.29 1.19 8.73 Sandy silt 6 12-14 76.18 36.98 58.00 5.02 0.93 34.89 8.05 1.25 6.45 Sandy silt 7 14-16 87.90 41.00 54.50 4.50 0.90 36.64 13.19 1.18 11.15 Sandy silt 8 16-18 99.70 40.83 53.99 5.17 1.40 35.11 13.20 1.09 12.21 Sandy silt 9 18-20 339.34 40.87 54.33 4.81 1.25 36.30 13.21 1.00 13.28 Sandy silt
10 20-22 578.98 44.20 51.30 4.50 1.16 36.17 10.53 1.04 10.25 Sandy silt 11 22-24 818.62 39.02 56.40 4.58 1.19 35.38 7.85 1.09 7.22 Sandy silt 12 24-26 1058.25 39.88 55.26 4.86 1.29 37.15 12.54 1.12 11.19 Sandy silt 13 26-28 1297.89 42.66 53.02 4.31 1.59 36.45 13.49 1.18 11.39 Sandy silt 14 28-30 1537.53 51.73 44.26 4.01 1.38 38.93 14.45 1.25 11.59 Silty sand 15 30-32 1777.17 46.24 49.67 4.09 0.76 32.95 8.60 0.93 8.02 Sandy silt 16 32-34 2016.81 39.73 56.40 3.87 1.16 22.48 2.76 0.62 4.45 Sandy silt 17 34-36 2256.45 40.75 55.42 3.83 1.57 23.97 5.35 0.51 10.52 Sandy silt 18 36-38 2496.08 41.26 55.47 3.27 0.19 24.58 7.83 0.63 12.12 Sandy silt 19 38-40 2735.72 39.49 57.15 3.36 0.57 26.81 10.30 0.75 13.72 Sandy silt 20 40-42 2975.36 50.66 46.01 3.33 0.53 30.97 7.94 0.89 9.56 Silty sand 21 42-44 3215.00 64.97 32.41 2.62 0.55 34.74 5.58 1.03 5.41 Silty sand 22 44-46 3531.07 78.47 19.55 1.98 0.72 37.81 11.50 0.97 11.86 Sand 23 46-48 3847.14 91.92 7.56 0.52 0.63 40.04 9.86 0.88 11.13 Sand 24 48-50 4163.21 91.29 7.97 0.74 0.36 41.56 8.22 0.79 10.40 Sand 25 50-52 4479.29 82.66 14.65 2.69 0.57 42.72 8.57 0.71 12.23 Sand 26 52-54 4795.36 77.90 18.83 3.27 0.59 42.18 8.92 0.63 14.07 Sand 27 54-56 5111.43 78.02 18.76 3.22 0.36 41.68 8.61 0.69 12.43 Sand

44
44
Table 3. (Continued)
S.No Depth (cm) Age Sand % Silt % Clay % CaCO3 % OM % TOC % TN % C/N Sediment type 28 56-58 5427.50 78.91 17.91 3.18 1.00 42.20 8.13 0.63 12.84 Sand 29 58-60 5743.57 81.84 14.80 3.36 0.78 42.02 7.64 0.58 13.25 Sand 30 60-62 6059.64 82.38 13.63 4.00 0.76 40.65 7.57 0.55 13.66 Sand 31 62-64 6375.71 57.92 34.06 8.02 0.77 38.85 7.50 0.53 14.07 Silty sand 32 64-66 6691.79 35.73 54.99 9.28 1.48 37.55 6.96 0.73 9.50 Sandy silt 33 66-68 7007.86 21.26 67.64 11.10 0.98 36.20 6.39 0.60 11.10 Sandy silt 34 68-70 7323.93 12.25 74.56 13.20 1.00 36.25 5.82 0.46 12.70 Clayey silt 35 70-72 7640.00 17.91 69.41 12.68 1.67 31.80 5.49 0.47 11.61 Sandy silt 36 72-74 7744.64 20.52 67.08 12.40 1.00 31.67 5.16 0.49 10.52 Sandy silt 37 74-76 7849.29 19.68 68.12 12.20 1.64 30.06 4.25 0.47 9.03 Sandy silt 38 76-78 7953.93 24.78 61.25 13.96 2.44 30.96 4.38 0.51 8.69 Sandy silt 39 78-80 8058.57 36.44 50.75 12.81 2.28 30.71 4.51 0.54 8.34 Sandy silt 40 80-82 8163.21 23.12 60.79 16.09 2.38 32.14 4.51 0.55 8.28 Sandy silt 41 82-84 8267.86 22.61 63.39 14.01 2.79 32.27 4.52 0.55 8.21 Sandy silt 42 84-86 8372.50 18.41 64.90 16.69 3.19 28.69 3.58 0.40 8.89 Sandy silt 43 86-88 8477.14 14.97 69.91 15.12 2.79 29.74 3.86 0.42 9.10 Clayey silt 44 88-90 8581.79 20.99 63.20 15.81 2.40 30.80 4.15 0.45 9.30 Sandy silt 45 90-92 8686.43 24.33 61.45 14.22 2.46 32.17 4.91 0.56 8.77 Sandy silt 46 92-94 8791.07 23.57 61.10 15.33 3.16 31.62 4.90 0.56 8.76 Sandy silt 47 94-96 8895.71 19.65 64.20 16.15 4.08 30.10 4.90 0.56 8.75 Sandy silt 48 98-100 9105.00 27.50 57.93 14.57 0.92 30.28 4.42 0.53 8.31 Sandy silt
Average 43.87 48.77 7.36 1.37 34.87 8.07 0.77 10.44
Minimum 12.25 7.56 0.52 0.19 22.48 2.76 0.40 4.45 Maximum 91.92 74.56 16.69 4.08 47.02 15.79 1.25 14.07
Ages: measured interpolated Compositions: Maximum bold, minimum bold

45
45
Table 4. Major Oxides (%) and weathering index of the sediments from the Kukkal sediment core
S.No Depth (cm) Age SiO2 Al2O3 Fe2O3 TiO2 MgO K2O P2O5 CaO MnO Na2O CIA CIW PIA CWI 1 2-4 17.58 41.01 14.06 6.29 0.94 0.57 0.55 0.59 0.68 0.08 0.01 91.88 91.96 95.13 8.99 2 4-6 29.30 40.06 14.02 6.71 0.94 0.58 0.54 0.57 0.68 0.08 0.01 91.88 91.96 95.08 9.14 3 8-10 52.74 40.52 14.73 6.46 0.93 0.58 0.55 0.58 0.69 0.07 0.01 92.17 92.25 95.27 8.73 4 14-16 87.90 41.50 13.39 6.13 0.95 0.56 0.56 0.60 0.67 0.08 0.01 91.56 91.65 94.97 9.26 5 18-20 339.34 39.59 13.31 6.95 0.95 0.59 0.54 0.56 0.68 0.09 0.01 91.56 91.65 94.87 9.59 6 24-26 1058.25 40.18 14.14 6.47 1.01 0.71 0.55 0.57 0.68 0.07 0.01 91.96 92.05 95.17 9.90 7 28-30 1537.53 39.35 13.77 5.38 0.94 0.60 0.58 0.61 0.65 0.06 0.01 91.67 91.75 95.19 9.21 8 34-36 2256.45 46.65 16.77 7.75 1.13 0.63 0.57 0.50 0.43 0.05 0.01 94.29 94.37 97.34 6.42 9 38-40 2735.72 36.65 18.73 7.38 1.25 0.66 0.61 0.46 0.30 0.04 0.01 95.31 95.38 98.31 5.19
10 44-46 3531.07 31.66 17.73 6.87 1.13 0.71 0.52 0.47 0.27 0.03 0.02 95.65 95.73 98.34 5.66 11 48-50 4163.21 32.30 19.01 5.09 1.12 0.60 0.53 0.47 0.25 0.02 0.01 96.03 96.10 98.61 4.50 12 54-56 5111.43 32.16 19.16 6.01 1.09 0.64 0.53 0.42 0.23 0.02 0.01 96.11 96.18 98.70 4.64 13 58-60 5743.57 32.01 19.31 6.93 1.06 0.69 0.53 0.37 0.22 0.01 0.01 96.20 96.26 98.79 4.77 14 64-66 6691.79 31.68 19.30 8.03 1.07 0.79 0.52 0.38 0.21 0.01 0.01 96.26 96.33 98.80 5.26 15 68-70 7323.93 31.35 19.28 9.14 1.08 0.89 0.51 0.38 0.21 0.01 0.01 96.33 96.39 98.82 5.75 16 74-76 7849.29 34.11 21.00 9.30 1.13 0.73 0.58 0.39 0.15 0.01 0.01 96.58 96.64 99.22 4.22 17 78-80 8058.57 37.63 22.21 7.50 1.19 0.88 0.64 0.46 0.18 0.02 0.01 96.38 96.44 99.10 4.85 18 84-86 8372.50 37.65 22.05 7.63 1.18 0.90 0.65 0.47 0.18 0.02 0.01 96.31 96.37 99.09 4.99 19 88-90 8581.79 37.67 21.89 7.76 1.18 0.92 0.65 0.47 0.19 0.02 0.01 96.25 96.31 99.07 5.13 20 92-94 8791.07 37.49 21.48 7.37 1.12 0.89 0.64 0.45 0.18 0.02 0.02 96.22 96.29 99.05 5.06 21 98-100 9105.00 37.31 21.06 6.98 1.07 0.85 0.63 0.43 0.18 0.01 0.02 96.20 96.27 99.04 5.00
Average 37.07 17.92 7.05 1.07 0.71 0.57 0.49 0.38 0.04 0.01 94.61 94.68 97.52 6.49 Minimum 31.35 13.31 5.09 0.93 0.56 0.51 0.37 0.15 0.01 0.01 91.56 91.65 94.87 4.22 Maximum 46.65 22.21 9.30 1.25 0.92 0.65 0.61 0.69 0.09 0.02 96.58 96.64 99.22 9.90
Maximum bold minimum Italic

46
46
Table 5. Trace elements content of the sediments from the Kukkal sediment core
S.No Depth (cm) Age Sr Y Zr V Cr Ni Cu Zn Rb Nb Pb Th U Ba 1 2-4 17.58 78.75 15.75 222.95 66.50 69.65 54.95 33.35 78.75 38.80 8.90 40.75 20.25 0.60 498.50 2 4-6 29.30 79.35 15.50 236.25 72.00 70.25 55.80 33.40 79.95 41.30 9.40 37.95 20.10 0.65 516.50 3 8-10 52.74 76.70 16.10 209.20 76.00 72.40 54.50 33.40 75.50 37.80 8.70 40.00 20.80 0.30 468.00 4 14-16 87.90 80.80 15.40 236.70 57.00 66.90 55.40 33.30 82.00 39.80 9.10 41.50 19.70 0.90 529.00 5 18-20 339.34 82.00 14.90 263.30 68.00 68.10 57.10 33.40 84.40 44.80 10.10 35.90 19.40 1.00 565.00 6 24-26 1058.25 74.30 15.20 257.50 79.00 69.00 54.70 31.90 80.50 46.30 8.40 36.10 19.90 0.90 464.00 7 28-30 1537.53 79.30 15.30 277.60 92.00 61.40 59.60 33.20 84.30 46.90 8.90 42.70 20.90 0.80 483.00 8 34-36 2256.45 59.70 16.20 297.10 100.00 70.60 62.60 35.10 74.70 41.70 11.70 27.30 22.10 1.00 350.00 9 38-40 2735.72 61.40 17.90 325.90 95.00 97.80 67.70 50.50 90.40 45.90 12.70 42.80 29.10 1.40 331.00 10 44-46 3531.07 53.40 20.10 226.40 106.00 103.20 60.80 48.20 74.60 36.80 13.30 36.40 30.00 1.50 283.00 11 48-50 4163.21 51.70 24.30 277.20 92.00 96.00 62.70 54.60 72.90 36.00 12.90 38.60 34.00 1.60 277.00 12 54-56 5111.43 50.85 26.35 246.65 94.00 92.15 65.80 51.90 70.80 37.80 11.85 34.10 35.35 1.90 272.00 13 58-60 5743.57 50.00 28.40 216.10 96.00 88.30 68.90 49.20 68.70 39.60 10.80 29.60 36.70 2.20 267.00 14 64-66 6691.79 48.60 28.65 223.20 121.00 94.00 71.55 47.25 71.90 42.90 12.00 29.40 33.80 1.60 283.50 15 68-70 7323.93 47.20 28.90 230.30 146.00 99.70 74.20 45.30 75.10 46.20 13.20 29.20 30.90 1.00 300.00 16 74-76 7849.29 51.10 30.20 257.60 174.00 103.90 83.20 44.40 78.20 51.50 13.00 37.70 33.10 1.00 303.00 17 78-80 8058.57 52.40 31.80 234.60 93.00 105.10 89.50 50.00 93.20 55.10 14.30 36.20 35.00 1.20 314.00 18 84-86 8372.50 52.00 31.10 249.10 120.50 107.80 91.55 50.40 98.95 59.50 14.45 37.55 32.45 1.10 319.50 19 88-90 8581.79 51.60 30.40 263.60 148.00 110.50 93.60 50.80 104.70 63.90 14.60 38.90 29.90 1.00 325.00 20 92-94 8791.07 50.15 31.40 235.55 119.50 108.95 89.95 50.10 103.05 64.55 13.70 35.25 27.05 1.35 322.50 21 98-100 9105.00 48.70 32.40 207.50 91.00 107.40 86.30 49.40 101.40 65.20 12.80 31.60 24.20 1.70 320.00
Average 60.95 23.15 247.35 100.31 88.72 69.54 43.29 83.05 46.78 11.66 36.17 27.37 1.18 371.02 Minimum 47.20 14.90 207.50 57.00 61.40 54.50 31.90 68.70 36.00 8.40 27.30 19.40 0.30 267.00 Maximum 82.00 32.40 325.90 174.00 110.50 93.60 54.60 104.70 65.20 14.60 42.80 36.70 2.20 565.00
Maximum bold, minimum bold italic.

47
47