early learning coalition of broward county, inc. … minutes/executive 2017 1...early learning...
TRANSCRIPT
Early Learning Coalition of Broward County, Inc.
Executive Committee Meeting Agenda 6301 NW 5th Way, Suite 3400,
Fort Lauderdale, FL 33309
Wednesday, January 25, 2017 5:00 pm
Members are reminded of conflict of interest provisions. In declaring a conflict, please refrain from voting or discussion and declare the following information: 1) Your name and position on the Board, 2) The nature of the conflict and 3) Who will gain or lose as a result of the conflict. Please also fill out form 8B prior to the meeting.
I.
II.
III.
Call to Order
Roll Call
Chair Report
Laurie Sallarulo, Board Chair
Irene Ramos, Executive Assistant
Laurie Sallarulo, Board Chair
IV. Consent Agenda
Renee Jaffe, CEO
a. Approve November 30, 2016 Executive Committee Minutes
b. DCF Contract Amendment
(Tab 1) pgs. 3-9 (Tab 2) pg. 10
Doreen Moskowitz, Contract Manager
V. CEO Report
(Tab 3) pgs.11 - 15
Renee Jaffe, CEO
VI Finance Committee Report a. Finance Report Cover b. Utilization c. Waitlist Enrollments Update
(Tab 4) pg. 16
(Tab 5) pgs. 17 - 18 (Tab 6) pgs. 19 - 16
Renee Podolsky, Finance Chair Christine Klima, CAO Reinier Potts, Financial Analyst Doreen Moskowitz, Contract Manager
d. Data Dashboard e. Interim financial statements dated
August 2016 – November 2016 f. Initial Administrative Department
Assessment
(Tab 7) pgs. 21 - 27 (Tab 8) pgs. 28 - 67 (Tab 9) pgs. 68 - 71
Christine Klima, CAO Christine Klima, CAO
VII.
CEO Evaluation
Evaluation Tool and CEO upcoming goals form
(Tab 10) pg. 72 - 74
Laurie Sallarulo, Board Chair
VIII.
Staff Reports a. CCEP Mid-Year Proposal
(Tab 11) pgs.75 – 77
Leticia Strasser, COO
IX.
Governance Committee Report
Fabienne Fahnestock, Governance Chair X. Audit Committee Report
Mike Asseff, Audit Chair
XI.XII.
For Your Information (FYI) – This section is for noteworthy items that Coalition staff wants to make the Board aware of, including requests for letters of support, upcoming trainings and events, staffing changes, contracts with costs at or below $5,000.00 (approved by the CEO), State or Federal policy changes, etc.
Page 1 of 82
FYI a. Legislative Priorities from AELCb. Strategic Plan Updatec. New Board Member Orientation,
January 30, 2017d. New Phone System Updatee. Revised Org Chartf. Board Member Attendance Sheet
(Tab 12) pg.78 (Tab 13) pg.79
(Tab 14) pg. 80 (Tab 15) pg. 81
(Tab 16) pg. 82
XIII. Unfinished Business New Business Matters from the Board Matters from the CEO Public Comment Next Meeting: February 22, 2017 Adjourn
Please Note: Agenda subject to revisions and additions per the discretion of the Chair of the Coalition. Notification will be sent of any such revisions or additions. Members of the Public: Please sign up at the entry desk for public comments to be made on particular agenda items no later than five minutes after the Coalition meeting has been called to order.
Page 2 of 82

TAB 1
Early Learning Coalition of Broward County Executive Committee Meeting Minutes
November 30, 2016 – 5:00 pm 6301 NW 5th Way, Suite 3400, Fort Lauderdale, FL 33309
Members in Attendance: Laurie Sallarulo, Michael Assef, Renee Podolsky, Alfreda Coward, Cindy Arenberg Seltzer
Members Absent:
Staff in Attendance: Renee Jaffe, Leticia Strasser, Janice Carter, Amy Ungor, Gordia Ross, Carmen Nicholas, Sandra Paul, Hubert Cesar, Irene Ramos
Others in Attendance: Jacob Jackson, General Counsel, Michelle Rosiere, Cristy Kozla, Al Murray (from sign-in sheet)
Item Follow-up
Welcome and Call to Order
Laurie Sallarulo called the meeting to order at 5:15 pm Self-introductions were made. A quorum was established.
Minutes Motion made by Alfreda Coward to approve the minutes of November 7, 2016. Seconded by Michael Assef. Unanimously approved
CEO’s Report Renee reported on new staff additions to the ELC - Debbie Kay- Inclusion Specialist, Suwenda Louis – Early Care and Education Specialist, Angie Palomino- Receptionist and Christine Klima – Chief Administrative Officer. The ELC is still looking for the Director of Education and Quality Initiative. Interviews have been conducted but a decision has not been made as of yet.
Debbie Bainton – Office Manager’s last day was October 26, 2016. Micah Mitchell – Provider Relations Specialist will be moving on from ELC Dec. 9, 2016.
An updated Organizational Chart to include aforementioned new staff has been
Page 3 of 82

included in the Executive Packet for review. Renee stated that the Wait List Enrollments would be discussed later on in the meeting.
The ELC was awarded an additional $2.1m from State. Use of the additional funds from State include plans in collaboration of BRHPC to enroll at minimum 210 children with the process starting as early as tomorrow where parents will be contacted.
At the next Board meeting ELC will be acknowledging Quality Initiative PFP Program providers whom have obtained a benchmark in the program.
The ELC will be bringing forward in the next few months more information on our participating and use of the School District’s K Transition (preschool to kindergarten) program which helps families in the community transition their child from preschool to kindergarten. The program will be offered to the community and our contracted School Readiness and VPK Program Providers. Future events to include Kindergarten Day at Parker Playhouse are being coordinated. These events will start to take place in April.
School Board is funding the majority of this program and the ELC has funding allotted in the Road To Child Care Outcome School District Contract. There are a couple of partners involved as well as School District Grants.
Renee stated that a Board Survey was sent to members to see if there is a more favorable day and time to conduct Board Meetings. Another reminder Survey will be sent out to allow the opportunity for the Board members who have not yet responded.
Renee reported that the ELC has started a Provider Advisory Council. Advisement of this new Council was made at the PLAN meetings. The ELC received a good response of 20 Providers who were interested in being a part of the Council. The Providers represent all different size centers to include faith based centers and family home centers. The First Provider Advisory Council meeting will be in January.
Send invites to Board Members
Page 4 of 82

Organizational Chart
CEO Evaluation
Alfreda requested that Board Members be on the front end regarding any major changes made whether they are changes that need to be approved by the Board or not.
Renee responded that changes to the internal structure of ELC was presented to the Board and organizational chart hand out was provided and discussed at length at September meeting. The organizational chart provided in today’s packet has not been changed in a major fashion since that time. Additionally, consultation with legal and Board Chair was made and confirm that an approval from the Board for internal organizational changes are not needed. Chair commented for the record that when in consultation with the CEO regarding matters to be brought to the Board, it is always advised transparency with Board Members and/or individual consultation with Board Members and/or public forum. Officially, organization structure does not need to be voted on. The concern expressed is to ensure that the Organization Chart is the correct set up to move ELC forward.
Chair reminded members that the CEO’s evaluation is approaching and Board Members have the opportunity to include specific performance goals for the upcoming year along with standard evaluation.
The CEO’s evaluation will include the CEO’s self-evaluation and accomplishments. Staff input should be regarded in the CEO’s accomplishments which will provide a clearer view of goals that are being met.
Cindy Motioned to incorporate a self-evaluation tool along with job description into the current standing evaluation tool and submit to the Executive committee which will then meet with the CEO and then make recommendations to the Board for any salary adjustments or performance pay as well as solidify goals for the coming year. Seconded by Michael Assef. Motion Opposed by Alfreda regarding member’s evaluation based on the CEO’s self-evaluation. Clarification that the CEO self-evaluation describes the CEO’s accomplishments and not a grading scale. Majority of Motion Approval Carries.
Ensure Handouts provided at Board/Committee meetings are provided to members not present
Detail CEO Reports
CEO to create an outline on accomplishments up to date (include staffs input)
Page 5 of 82

Accomplishments
Executive Committee Approval of Priority Items - PFP
Renee reported that Performance Funding Project went to Emergency Exec meeting on November 7th and was approved to be brought directly to the Board but the scheduled Board meeting following the Exec meeting did not occur due to quorum not met. Due to the time sensitivity of the contractual requirements, the Chair was asked to execute the PFP agreement. Today’s packet includes the resumes and credentials requested at last Exec meeting.
Motion made by Michael Assef to authorize Chair to execute the contract. Seconded by Renee P. Unanimously approved.
Move Forward to Board
Page 6 of 82
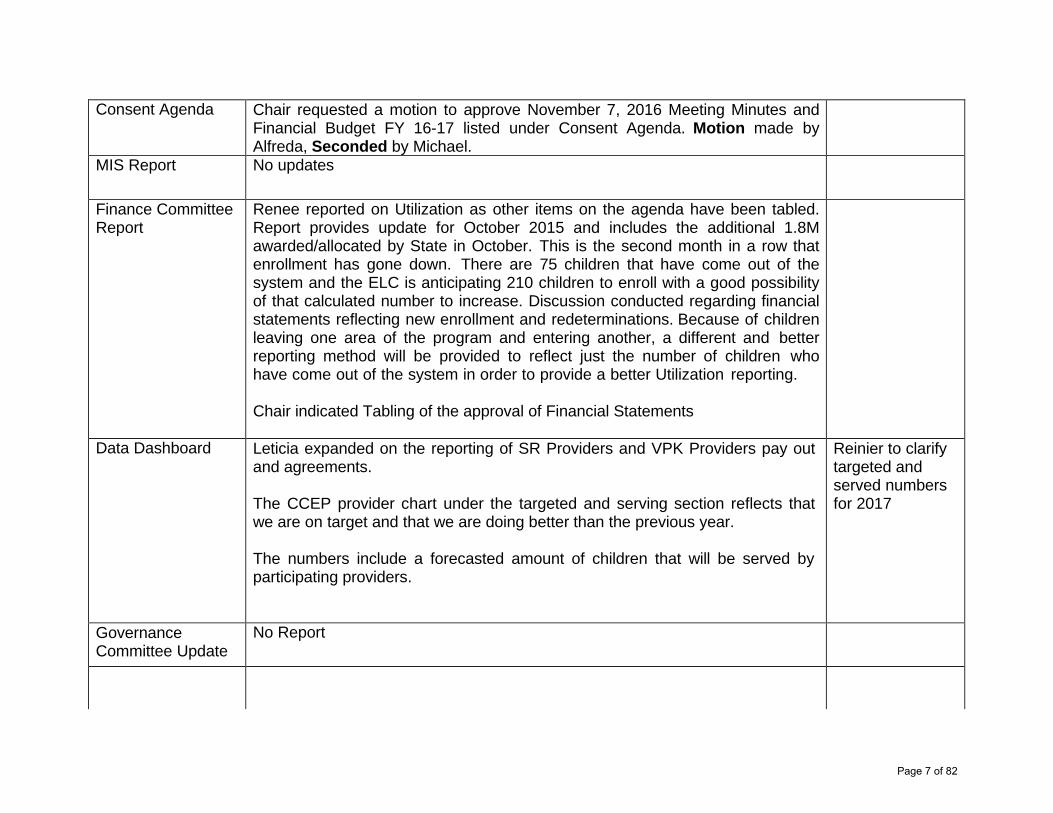
Consent Agenda Chair requested a motion to approve November 7, 2016 Meeting Minutes and Financial Budget FY 16-17 listed under Consent Agenda. Motion made by Alfreda, Seconded by Michael.
MIS Report No updates
Finance Committee Report
Renee reported on Utilization as other items on the agenda have been tabled. Report provides update for October 2015 and includes the additional 1.8M awarded/allocated by State in October. This is the second month in a row that enrollment has gone down. There are 75 children that have come out of the system and the ELC is anticipating 210 children to enroll with a good possibility of that calculated number to increase. Discussion conducted regarding financial statements reflecting new enrollment and redeterminations. Because of children leaving one area of the program and entering another, a different and better reporting method will be provided to reflect just the number of children who have come out of the system in order to provide a better Utilization reporting.
Chair indicated Tabling of the approval of Financial Statements
Data Dashboard Leticia expanded on the reporting of SR Providers and VPK Providers pay out and agreements.
The CCEP provider chart under the targeted and serving section reflects that we are on target and that we are doing better than the previous year.
The numbers include a forecasted amount of children that will be served by participating providers.
Reinier to clarify targeted and served numbers for 2017
Governance Committee Update
No Report
Page 7 of 82

Nominating Committee Update
No Report
Audit Committee Michael reported that he will be meeting with the auditors regarding non material recommendations made and he will report back to the Exec Committee with a report on the recommendations made.
He will also meet with the Auditors regarding the reserve and he will report back. No Audit issues to report on.
A committee meeting will be set up to discuss the Auditors meeting and then it will be reported at the Exec Committee.
Schedule an Audit Committee Meeting
Staff Report Wait List Enrollment
Doreen reported on Waitlist Enrollment Timeline. Non recurring State funding amount of $2.1m has been received of which $1.68m should be used for SR slots. Projections show that the monies will be used to enroll 210 children initially. A full plan of how that will be rolled out is included in the packet with enrollment starting tomorrow Dec. 1, 2016. After initial enrollment an evaluation and then determination of how many additional children can be enrolled.
Discussion conducted on funding amount and projection of SR slots.
Close observation of numbers will be made to ensure that even if monies are not again received from the State that no children will need to be dropped or that a deficit would occur.
A 2 year plan with a 7 month outlook will be included in the future reports.
VPK Assessment – No Report, Tab 8 BECE Conference Update – No Report Tab 10
Total Slot Cost column to be broken down to reflect where monies are coming from
Unfinished Business New Business Leticia reported BRHPC has been very proactive in Quality Assurance
activities, identified fraud and brought it to the ELC’s attention. This information is being presented as part of transparency and also part of refining the Anti-
Add Bullets on CEO Report
Page 8 of 82

Fraud protocol.
Leticia commented that any materials that are handed out at meetings will be posted on the ELC Web Calendar to make it publicly available.
Matters from the Chair
None
Matters from the CEO
None
Public Comment None
Next Meeting Date January 25, 2017
Adjourn Motion to adjourn meeting made by Cindy. The meeting adjourned at 6:37 pm.
These minutes contain the action items of the meeting of the Executive Committee of the Early Learning Coalition. They do not include all the Committee’s discussions or comments on each matter or issue raised during the meeting. A tape recording of the meeting is held in the Coalition office. Corrections from the Committee will be taken prior to approval at the next meeting. Submitted by Irene Ramos
Page 9 of 82

TAB 2
Early Learning Coalition of Broward County, Inc. Executive Committee Meeting
January 25, 2017
Subject: Amendment #002 to DCF Contract XK048 The purpose of Amendment #002 is to increase the contract budget as follows:
SFY16-17: $83,324.00 SFY17-18: $83,324.00 TOTAL (for remaining contract period) $166,648.00
Background Information
The Department of Children and Families (DCF) contracts with the ELC for the provision of subsidized child care services to children of eligible refugee/entrant participants. The contract is currently in the second year of a (3) year term. The ELC subcontracts the services with BRHPC.
Current Status
At the present time, there is a wait list for services for eligible children of refugees/entrants. In order to address the need of the eligible children, DCF is proposing to amend the contract to include additional funding of $83,324.00, for the current (FY 2016-2017) and next (FY 2017-2018) fiscal years, for a total contract increase of $166,648.00.
Recommendation Brought Forth By:
Staff is requesting that, pending legal approval, the Executive Committee authorizes the Chair to sign the amendment to allow services to start, as soon as possible. This action will be reported to the full Board at the next (February 10, 2016) Board meeting.
Supporting Documentation Attached:
None
Financial Impact:
Increases of $83,324.00 for fiscal years 2016-2017 and 2017-2018, for a total increase of $166,648.00, to the contract budget over the remaining two (2) year contract period.
Page 10 of 82
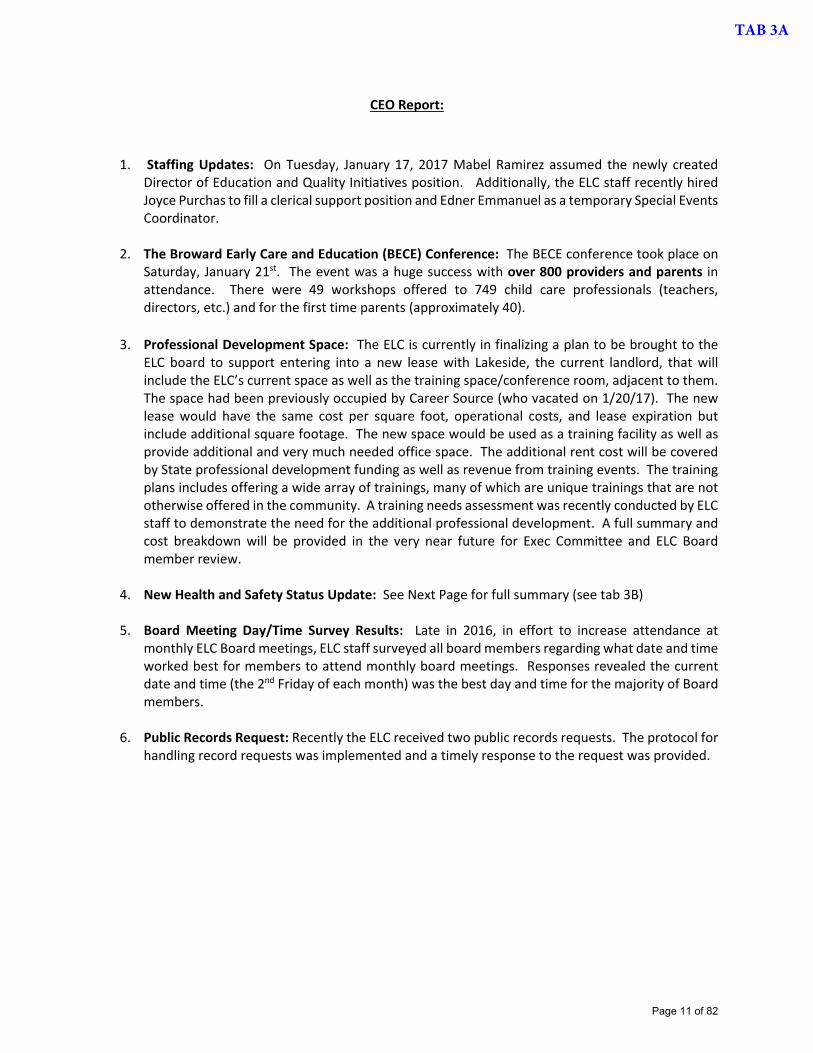
CEO Report:
1. Staffing Updates: On Tuesday, January 17, 2017 Mabel Ramirez assumed the newly createdDirector of Education and Quality Initiatives position. Additionally, the ELC staff recently hiredJoyce Purchas to fill a clerical support position and Edner Emmanuel as a temporary Special EventsCoordinator.
2. The Broward Early Care and Education (BECE) Conference: The BECE conference took place onSaturday, January 21st. The event was a huge success with over 800 providers and parents inattendance. There were 49 workshops offered to 749 child care professionals (teachers,directors, etc.) and for the first time parents (approximately 40).
3. Professional Development Space: The ELC is currently in finalizing a plan to be brought to theELC board to support entering into a new lease with Lakeside, the current landlord, that willinclude the ELC’s current space as well as the training space/conference room, adjacent to them.The space had been previously occupied by Career Source (who vacated on 1/20/17). The newlease would have the same cost per square foot, operational costs, and lease expiration butinclude additional square footage. The new space would be used as a training facility as well asprovide additional and very much needed office space. The additional rent cost will be coveredby State professional development funding as well as revenue from training events. The trainingplans includes offering a wide array of trainings, many of which are unique trainings that are nototherwise offered in the community. A training needs assessment was recently conducted by ELCstaff to demonstrate the need for the additional professional development. A full summary andcost breakdown will be provided in the very near future for Exec Committee and ELC Boardmember review.
4. New Health and Safety Status Update: See Next Page for full summary (see tab 3B)
5. Board Meeting Day/Time Survey Results: Late in 2016, in effort to increase attendance atmonthly ELC Board meetings, ELC staff surveyed all board members regarding what date and timeworked best for members to attend monthly board meetings. Responses revealed the currentdate and time (the 2nd Friday of each month) was the best day and time for the majority of Boardmembers.
6. Public Records Request: Recently the ELC received two public records requests. The protocol forhandling record requests was implemented and a timely response to the request was provided.
TAB 3A
Page 11 of 82

TAB 3B
Early Learning Coalition of Broward County, Inc. Executive Committee Meeting
January 25, 2017
Subject: Enhanced Health and Safety Inspection Requirements of School Readiness Programs, Rule 6M-4.620
Background Information
The School Readiness program is funded primarily by the federal Child Care and Development Fund Block Grant (CCDBG). The recent CCDBG Reauthorization of 2014 represents a historic re-envisioning of the Child Care Development Fund (CCDF) program. The new law made significant advancements to the protection of children in child care settings by requiring states to define minimum health and safety standards for child care providers, and establishing inspection and monitoring requirements for all providers receiving CCDF funds, including license-exempt providers. Additionally, the revised rules establish certain health and safety, training, and inspection standards for providers of the School Readiness Program pursuant to statutory mandate.
The revised rule now requires that all School Readiness providers must have an annual inspection. This includes providers that were previously not required to be monitored Also, four (4) additional health and safety requirements were created, which are briefly described as follows:
1. Establish standards for emergency preparedness plans for school readinessprogram providers;
2. Establish group sizes, as required;3. Meet pre-service training requirements; and4. Establish written policies and procedures regarding discipline and expulsion of
children in care
As the designated CCDF lead agency for the state of Florida, the Office of Early Learning (OEL) administers the School Readiness Program at the state level. Pursuant to section 1002.82(1), Florida Statutes (F.S.), OEL is required to comply with all lead agency responsibilities pursuant to federal law.
The Department of Children and Families Office of Child Care Regulation (DCF) is the child care licensing authority for 62 of the 67 counties in Florida. The department regulates and sets standards for licensed child care facilities, family day care homes, large family child care homes, and mildly ill facilities in these counties. Five counties: Broward, Hillsborough, Palm Beach, Pinellas, and Sarasota have decided by statute or by the adoption of a local ordinance or resolution to designate a local licensing authority to regulate child care providers in their areas. Local licensing standards must be determined by the state to meet or exceed DCF’s minimum licensing standards.
Page 12 of 82
To prevent duplication of interagency activities, including health and safety inspections and monitoring, OEL is required to enter into a memorandum of understanding with DCF and each of the local licensing agencies for inspections of school readiness program facilities.
All providers who provide School Readiness (SR) services are required to comply with the health and safety standards defined in Rule 6M-4.620, which became effective October 24, 2016. The local licensing agency in Broward County, Broward County Child Care Licensing and Enforcement (BCCCLE), conducts inspections for all licensed and most exempt facilities. Currently, based on the updated regulations, providers who are currently required to be inspected by the local licensing agency, the ELC can enter into a new SR contract with them as long as they have no outstanding violations. However, during the next fiscal year, as providers are inspected, the additional health and safety standards will need to be implemented.
In Broward there are currently less than ten (10) School Readiness providers (with 17 children enrolled) categorized as exempt providers, who were not required to have an inspection by licensing. Typically, these are school aged programs where the only children that attend the program are children who attend school at the same location. Under the new regulations these facilities are now required to be inspected by BCCLE in order for them to obtain a School Readiness contract.
Current Status
The Department of Children and Families Office of Child Care Regulation (DCF), the Office of Early Learning (OEL) and Broward County Child Care Licensing and Enforcement (BCCCLE), the local licensing agency, have met several times in efforts to come to an agreement regarding the new additional standards. BCCLE is prepared to support OEL with the new School Readiness Safety and Health Inspections and assist DCF in successful implementation. In order to do so they have requested DCF provide additional funding in the amount of $104,561.25, for 1.75 additional full time employees (FTEs) to address the additional workload. At this time, DCF has not approved any additional funding for BCCCLE. Funding for this would require approval in the DCF legislative budget. It is the ELC’s understanding that DCF has not included BCCCLE’s request for additional funding in their legislative funding recommendations.
Until the end of the current fiscal year, School Readiness contracts will not be greatly affected and new programs (non-School Readiness) applying for a School Readiness contract can be approved if they have a current inspection by BCCCLE and have no outstanding violations. However, the ELC will not be able to enter into contracts with new programs (non-School Readiness) that have not been previously inspected. So we cannot take any new exempt providers, without inspections. At this time our system currently reflects only seven (7) providers in this status. These providers will continue to receive School Readiness funding until the expiration of their contracts on June 30, 2017.
Should DCF and BCCCLE not come to an agreement (which means the new additional standards would not be implemented) by July 1, 2017, t h e i m p a c t w o u l d b e h u g e . A s new and current S c h o o l R e a d i n e s s providers require new annual inspections, without the four new additional standards (l isted above) being
Page 13 of 82

implemented the ELC will not be able to enter into new School Readiness agreements with these providers. Each month anywhere between five and 200 programs are required to have their annual inspection.
For our part, the ELC staff has and will continue to explore all perspectives and clarify exactly how the additional activities required under this mandate affect the current BCCCLE caseload and staffing time. The ELC will also explore alternative solutions. The ELC has and will continue discussion with BCCCLE regarding the status and potential efforts to move BCCCLE and DCF closer to solidifying an agreement. ELC Broward has been in conversation with representatives at OEL, as well our counterparts (that have local licensing agencies) in Hillsborough, Pinellas and Palm Beach Counties to get additional perspective and ideas that might facilitate a resolution. ELC remains deeply concerned about this impasse and the impact it may have on services in Broward County.
Considerations
BCCCLE had been performing background screening activities. Effective July 1, 2016, these functions are no longer the responsibility of BCCCLE. All background screenings are now completed through the Care Provider Background Screening Clearing House or better known as, the “Clearinghouse.”
BCCCLE has submitted an analysis of the financial impact it anticipates will be incurred as a result of the additional monitoring activities.
At the present time, it is unknown, if additional funding will be afforded to BCCCLE at the state level (DCF or OEL).
Supporting Documentation Attached: None at this time
Financial Impact: Unknown at the present time
Page 14 of 82

PROVIDER LICENSE/INSPECTION DATES MONTH # DUE January 11
February 8 March 191 April 7 May 8 June 170 July 8
August 9 September 138
October 8 November 88 December 136
2017
Page 15 of 82

TAB 4
Interim Financial Statements Utilization Report and Projections
Interim Financial Statements for the months of September, October and November 2016 are attached for your review and approval. Updated financial statements covering the month of August are also attached with corrections to the Monthly Budget to Actual report (noted in blue) that were made at the request of the Executive Committee in November 2016.
In addition to the financial statements, a plan to expend a one-time award from OEL for $2.1M over a two-year period by enrolling new children in January-February 2017 is enclosed with corrections and updates subsequent to feedback received at the December 9, 2016 Board meeting.
The November Monthly Utilization Report is also included.
Beginning in January 2017, ELC staff will work with the Finance Committee to review the financial statement and utilization package format overall and identify ways to improve clarity and content going forward. ELC staff have already begun the process of analyzing and modifying how financial and other data is recorded and tracked to improve the transparency, accuracy and timeliness of presentation to the Board. A summary of initial findings and suggested remedies is attached at the end of this packet.
A summary of the major financial highlights of the November Statements include:
Revenues:
• As of November 30, 2016 ELC has earned approximated $37.7M in total revenue, which is 40% of the total annual budget and nearly on pace with the expected quarter end rate of 42%.
• OEL State/Federal-CCEP revenues are below target at 30% because matching funds from the County that would normally be designated for the first quarter of the ELC fiscal year were applied to the prior year in order to cover an unexpected deficit. For the remainder of the year ELC anticipates enrollments to increase significantly in the third and fourth quarters based on new commitments received from providers and OEL has approved an additional funding request but the final amount awarded remains pending.
• Children’s Services Council revenues are also below target at 26% because funds normally designated for the first quarter of the ELC fiscal year were applied to the prior year in order to cover an unexpected deficit. Revenues have begun to ramp up for FY17with the start of new CSC contract year beginning October 1, 2016 as the revenue earning pattern returns to normal.
Expenditures:
• Overall expenditures are on pace with revenues with a year to date actual of$37.1 million at the quarter end with program services and administration expenditures at 37% and 40% respectively.
Page 16 of 82
Total Actual/Projected Expenditures
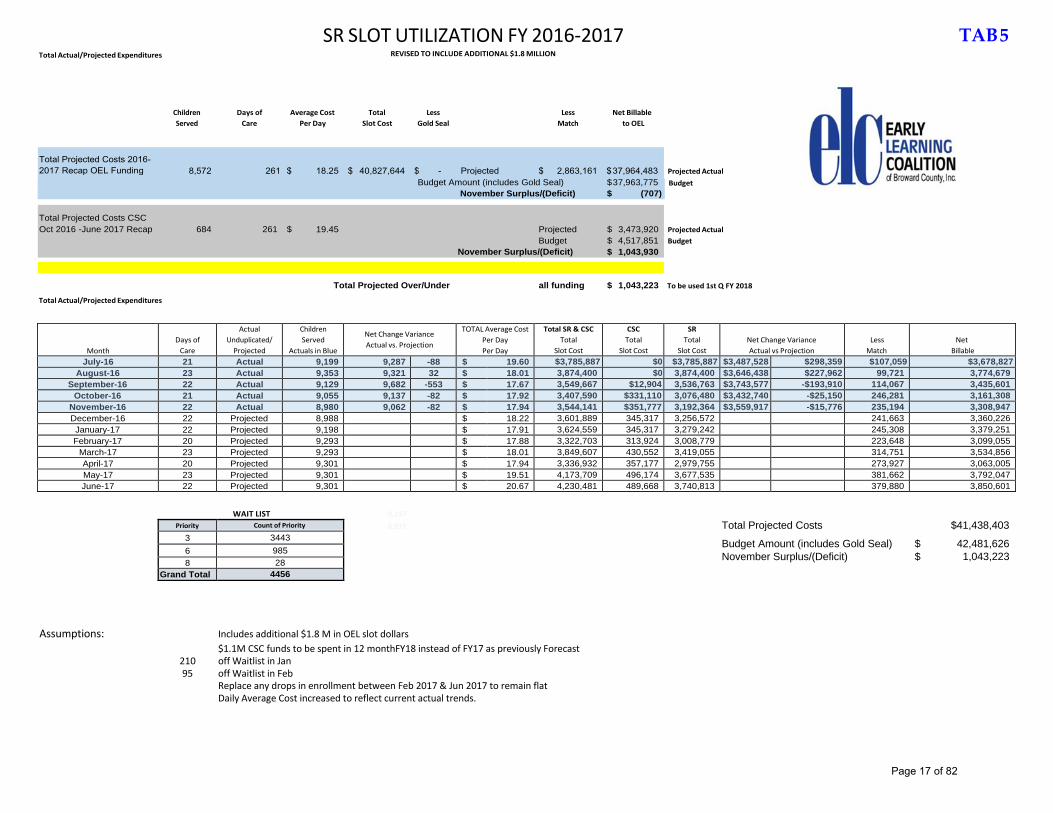
SR SLOT UTILIZATION FY 2016‐2017 REVISED TO INCLUDE ADDITIONAL $1.8 MILLION
TAB 5
Children Days of Served Care
Average Cost Per Day
Total Less Less Net Billable Slot Cost Gold Seal Match to OEL
Projected Actual Budget Amount (includes Gold Seal) $ 37,963,775 Budget
November Surplus/(Deficit) $ (707)
Total Projected Costs CSC Oct 2016 -June 2017 Recap 684 261 $ 19.45 Projected
Budget November Surplus/(Deficit)
$ 3,473,920 $ 4,517,851 $ 1,043,930
Projected Actual Budget
Total Actual/Projected Expenditures
Total Projected Over/Under all funding $ 1,043,223 To be used 1st Q FY 2018
Month Days of
Care
Actual Unduplicated/
Projected
Children Served
Actuals in Blue
Net Change Variance Actual vs. Projection
TOTAL Average Cost Per Day Per Day
Total SR & CSC Total
Slot Cost
CSC Total
Slot Cost
SR Total
Slot Cost Net Change Variance Actual vs Projection
Less Match
Net Billable
July-16 21 Actual 9,199 9,287 -88 $ 19.60 $3,785,887 $0 $3,785,887 $3,487,528 $298,359 $107,059 $3,678,827 August-16 23 Actual 9,353 9,321 32 $ 18.01 3,874,400 $0 3,874,400 $3,646,438 $227,962 99,721 3,774,679
September-16 22 Actual 9,129 9,682 -553 $ 17.67 3,549,667 $12,904 3,536,763 $3,743,577 -$193,910 114,067 3,435,601 October-16 21 Actual 9,055 9,137 -82 $ 17.92 3,407,590 $331,110 3,076,480 $3,432,740 -$25,150 246,281 3,161,308
November-16 22 Actual 8,980 9,062 -82 $ 17.94 3,544,141 $351,777 3,192,364 $3,559,917 -$15,776 235,194 3,308,947 December-16 22 Projected 8,988 $ 18.22 3,601,889 345,317 3,256,572 241,663 3,360,226 January-17 22 Projected 9,198 $ 17.91 3,624,559 345,317 3,279,242 245,308 3,379,251 February-17 20 Projected 9,293 $ 17.88 3,322,703 313,924 3,008,779 223,648 3,099,055
March-17 23 Projected 9,293 $ 18.01 3,849,607 430,552 3,419,055 314,751 3,534,856 April-17 20 Projected 9,301 $ 17.94 3,336,932 357,177 2,979,755 273,927 3,063,005 May-17 23 Projected 9,301 $ 19.51 4,173,709 496,174 3,677,535 381,662 3,792,047 June-17 22 Projected 9,301 $ 20.67 4,230,481 489,668 3,740,813 379,880 3,850,601
WAIT LIST 9,197 8,939 Total Projected Costs $41,438,403
Budget Amount (includes Gold Seal) $ November Surplus/(Deficit) $
42,481,626 1,043,223
Assumptions: Includes additional $1.8 M in OEL slot dollars $1.1M CSC funds to be spent in 12 monthFY18 instead of FY17 as previously Forecast
210 off Waitlist in Jan 95 off Waitlist in Feb
Replace any drops in enrollment between Feb 2017 & Jun 2017 to remain flat Daily Average Cost increased to reflect current actual trends.
Priority Count of Priority
3 3443 6 985 8 28
Grand Total 4456
Page 17 of 82

Early Learning Coalition of Broward County Additional Slot Dollars from OEL FY16-17
January 2017 Enrollment - 210 Children Initial Projection Using September 2016 Utilization
Additional OEL Award $ 2,123,416 ( a ) Slot Revenue:
Slot Dollars Required by OEL 78.00% 1,724,544 ( b )
Additional Slot Dollars Included by ELC 0.23% 102,324 ( c )
New Slot Dollars Total 78.23% $ 1,826,868 ( d )=( b )+( c )
Slot Dollar Expenses: Quarter 1 FY 18 (Offsets Accelerated use of CSC funds in FY17) $ (372,186) per month for 3 months July, Aug, Sep, 2018 (See Schedule Below) * $ 1,116,558 ( e )
Est Deficit on Sept 30th Utilization 112,899 ( f )
Average Daily Cost Adjustment 9,264 X Children 195 X Days $ 0.0880 /Day = 158,880 ( g )
Net for Slots FY17 Required 161 X Children 132 X Days $ 15.82 /Day = 336,207 ( h )
Additional Slot Dollars 49 X Children 132 X Days $ 15.82 /Day = 102,324 ( i )
Revised Net for Slots FY17 210 X Children 132 X Days $ 15.82 /Day = 438,530 ( j ) = ( h ) + ( i )
Total Slot Dollars Total Expense 78.23% $ 1,826,868 (k ) = ( e )+( f )+( g )+( j )
February 2017 Enrollment - 95 Children Additional Enrollement Based on November 2016 Utilization
New Projected Surplus Nov Utilization: 95 X Children 108 X Days $ 14.92 /Day = $ 153,079 Updated 1/17
Total New Children January & February: 305 * CSC8 Annualization Detail for $1.1 Million
5
Days of Daily Cost Year Month Care of Care
Original FY17 Forecast Children Total Served Slot Cost
Revised FY17 Forecast Children Total Served Slot Cost
Revised FY18 Forecast Children Total Served Slot Cost
2016 July 21 20.31 2016 August 23 19.31 2016 September 22 19.31 2016 October 21 16.40 2016 November 22 16.40 2016 December 22 16.40 2017 January 22 16.40 2017 February 20 16.40 2017 March 23 16.40 2017 April 20 16.40 2017 May 23 16.65 2017 June 22 17.43
‐ ‐ ‐ ‐
27 12,904 1,453 500,550 1,387 500,550 1,387 500,550 1,387 500,550 1,526 500,550 1,327 500,550 1,526 500,550 1,307 500,550 1,305 500,550
‐ ‐
27 12,904 1,093 376,488 1,044 376,488
938 376,488 938 376,488
1,079 376,488 877 376,488
1,079 376,488 838 376,488 846 376,488
2018 July 21 20.31 2018 August 23 19.31 2018 September 22 19.31
‐ ‐ ‐
873 372,186 838 372,186 876 372,186
Total Projected Costs 10/15 ‐ 6/16
Projected Budget Over/Under July ‐ Sept
4,517,851 4,517,850
(1) ‐
3,401,292 4,517,850 1,116,558
372,186
1,116,558
Per Month
Assumes all drops replaced from Feb 2017 to keep enrollment flat.
Page 18 of 82

TAB 6
Early Learning Coalition of Broward County, Inc. Executive Committee Meeting
January 25, 2017
Subject: Wait List Enrollment Update
Background Information
As previously reported, the Legislative Budget Commission (LBC) awarded $20 million dollars to the Office of Early Learning (OEL) in non-recurring funding for the current fiscal year (2016-2017). As a result of the additional funding to OEL, the Early Learning Coalition (ELC) of Broward County was allocated an additional $2.1 million dollars.
Based on the October 2016 utilization, calculations and projections for the remainder of the fiscal year, an initial determination was made to enroll 251 children from the waitlist. ELC and BRHPC met and, in partnership, developed a plan (including a timeline) for the enrollment of the wait list children, which is now being implemented.
During December 2016, invitations were sent to 267 families representing 376 children, as follows:
December 5-9: 312 December 27-29: 64
Invitations were sent based on the child’s wait list date and priority category. Children were called off the waitlist from the income eligible (BG8 working families) category (Priority 3). The invitations included the details and process for eligibility determination and placement into services.
The response rate to the invitations was 86%, or 323 responses. And, as of January 12, 2017, 212 children, or 66% of the 323 who responded, have been determined eligible and placed into services.
Based on the updated timeline (see attached), it is anticipated that the initial impact of the enrollments will be seen in February 2017, after January attendance has been submitted.
A copy of the updated timeline is included.
PROPOSED ACTION
Based on utilization numbers and updated projections from November 2016, it is now proposed that a total of 305 children can be enrolled utilizing the additional OEL funding.
Page 19 of 82
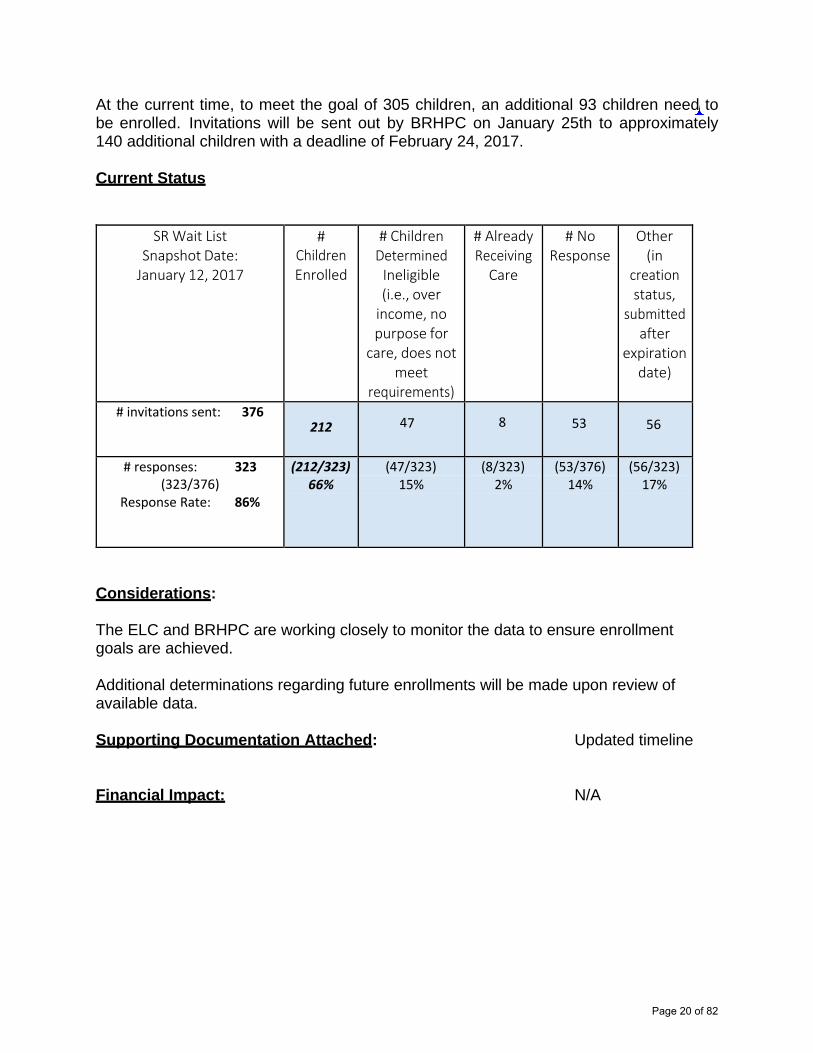
At the current time, to meet the goal of 305 children, an additional 93 children need to be enrolled. Invitations will be sent out by BRHPC on January 25th to approximately 140 additional children with a deadline of February 24, 2017.
Current Status
SR Wait List Snapshot Date:
January 12, 2017
# Children Enrolled
# Children Determined
Ineligible (i.e., over
income, no purpose for
care, does not meet
requirements)
# Already Receiving
Care
# No Response
Other (in
creation status,
submitted after
expiration date)
# invitations sent: 376 212 47 8 53 56
# responses: 323 (323/376)
Response Rate: 86%
(212/323) 66%
(47/323) 15%
(8/323) 2%
(53/376) 14%
(56/323) 17%
Considerations:
The ELC and BRHPC are working closely to monitor the data to ensure enrollment goals are achieved.
Additional determinations regarding future enrollments will be made upon review of available data.
Supporting Documentation Attached: Updated timeline
Financial Impact: N/A
Page 20 of 82
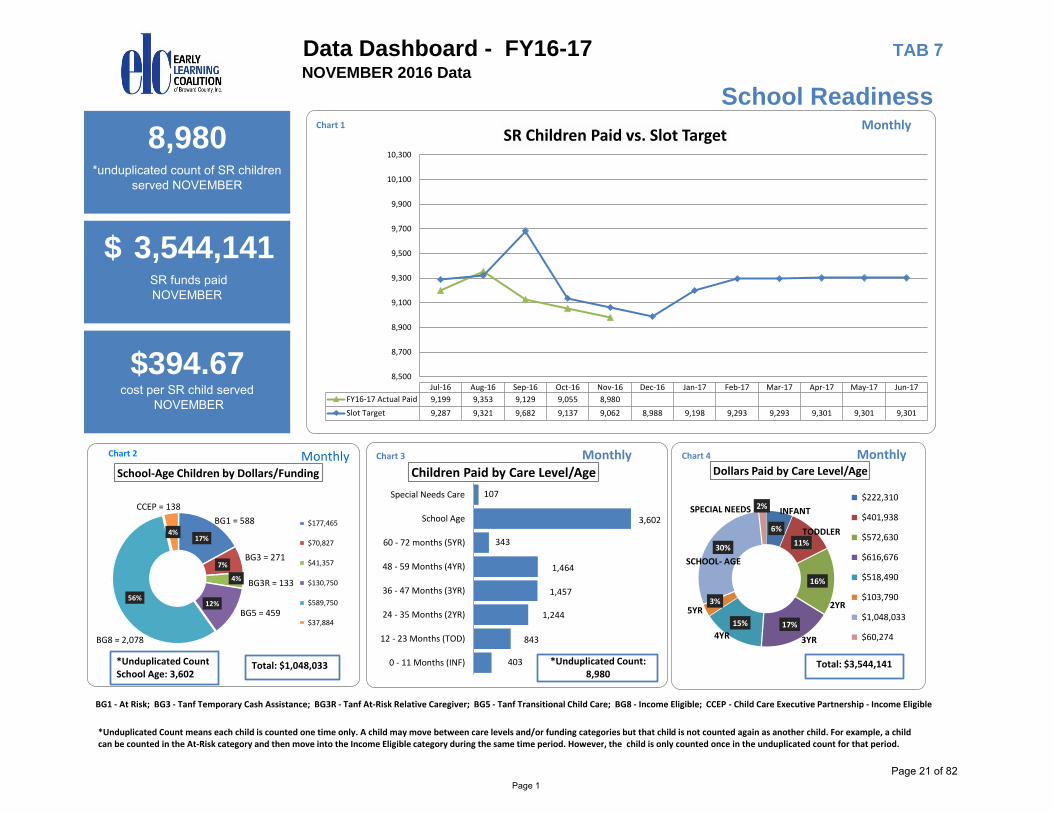
Data Dashboard - FY16-17 TAB 7NOVEMBER 2016 Data
School Readiness
8,980*unduplicated count of SR children
served NOVEMBER
3,544,141$ SR funds paidNOVEMBER
$394.67cost per SR child served
NOVEMBER
6%
11%
16%
17%15%
3%
30%
2%
Dollars Paid by Care Level/Age
$222,310
$401,938
$572,630
$616,676
$518,490
$103,790
$1,048,033
$60,274
MonthlyChart 4
Total: $3,544,141
SCHOOL- AGE
SPECIAL NEEDS INFANT
TODDLER
2YR
3YR4YR
5YR
403
843
1,244
1,457
1,464
343
3,602
107
0 - 11 Months (INF)
12 - 23 Months (TOD)
24 - 35 Months (2YR)
36 - 47 Months (3YR)
48 - 59 Months (4YR)
60 - 72 months (5YR)
School Age
Special Needs Care
Children Paid by Care Level/Age
MonthlyChart 3
8,500
8,700
8,900
9,100
9,300
9,500
9,700
9,900
10,100
10,300
Jul-16 Aug-16 Sep-16 Oct-16 Nov-16 Dec-16 Jan-17 Feb-17 Mar-17 Apr-17 May-17 Jun-17
FY16-17 Actual Paid 9,199 9,353 9,129 9,055 8,980
Slot Target 9,287 9,321 9,682 9,137 9,062 8,988 9,198 9,293 9,293 9,301 9,301 9,301
SR Children Paid vs. Slot Target Chart 1 Monthly
*Unduplicated Count:8,980
*Unduplicated Count means each child is counted one time only. A child may move between care levels and/or funding categories but that child is not counted again as another child. For example, a child can be counted in the At-Risk category and then move into the Income Eligible category during the same time period. However, the child is only counted once in the unduplicated count for that period.
17%
7%
4%
12%56%
4%
School-Age Children by Dollars/Funding
$177,465
$70,827
$41,357
$130,750
$589,750
$37,884
BG8 = 2,078
BG1 = 588
BG3 = 271
BG3R = 133
BG5 = 459
CCEP = 138
Total: $1,048,033
Chart 2 Monthly
*Unduplicated CountSchool Age: 3,602
BG1 - At Risk; BG3 - Tanf Temporary Cash Assistance; BG3R - Tanf At-Risk Relative Caregiver; BG5 - Tanf Transitional Child Care; BG8 - Income Eligible; CCEP - Child Care Executive Partnership - Income Eligible
Page 1Page 21 of 82

Data Dashboard - FY16-17 NOVEMBER 2016 Data School Readiness
Definitions:BG1: At-Risk Populations. Child in a family that is: referred for investigation by Broward Sherriff's Office (BSO); under the supervision of ChildNet (in home, foster care or relative placement); in the custody of a parent who is homeless, as verified in law; in the custody of a parent who is the victim of domestic violence, residing in a certified DCF shelter or; family actively participating in a diversion program, as required in law.BG3: Families who are receiving Temporary Cash Assistance (TCA), and subject to the federal work requirements. TCA is also referred to as Temporary Assistance for Needy Families (TANF).BG3R: Child who is in receipt of the Relative Caregiver (RCG) payment, who is adjudicated by a Florida court and placed in the home of a relative through ChildNet.BG5: Family that is transitioning from the receipt of TCA (from a workforce program) into employment, as defined by law. BG8: Income Eligible. Family that is economically disadvantaged. Parent must meet income and work requirements, which include employment, educational activities or disability.CCEP: Child Care Executive Partnership. This program provides a dollar for dollar match from employers, local government and other contributions to offer subsidies to economically disadvantaged families. Income and work requirements apply.NOTE: Variances can occur within billing groups which may not be fully detailed. CSC: Children’s Services Council. Eligibility mirrors the Income Eligible (BG8) criteria. Other conditions may be set by CSC, on an as needed (case by case) basis. BGCSD/O/Q: Contracted Slots - This program provides SR children with a steady, high quality learning environment while also providing incentives and financialstability to Providers serving income eligible and at-risk populations and participating in quality improvement activities.
26%
2%
8%
14%
28%
10%
10% 2%
Percentage of Children Paid in Various Categories during the month
BG1 $910,663
BG3R $74,014
BG3 $292,365
BG5 $487,178
BG8 $980,095
CCEP $360,327
CSC $351,777
BGCSD/O/Q $87,722
CSC: 830 = 10% Income Eligible and SSI BG1: 2,105 = 26%
At-Risk Populations served by BSO, ChildNet, Homeless , Domestic Violenceand Diversion Agencies
BG8: 2,991 = 28% Income Eligible and SSI
CCEP: 913 = 10% Child Care Executive Partnership
BG5: 1,251 = 14% TANF, TCC employed Parentstransitioning off from cash assistance
BG3: 795 = 8% TANF, TCA, Active cash assistance recipient
NOVEMBER Dollars Expended: $3,544,141
Chart 5
*Unduplicated Count: 8,980
BG3R: 202 = 2%Relative Care Giver
BGCSD/O/Q: 98 = 2% Contracted Slots
At-RiskCareerSource
IncomeEligible
Contracted Slots
Unduplicated Count 2,297 1,966 4,710 98
Net Cost $984,677 $779,543 $1,692,199 $87,722
2,297 1,966 4,710 98
$984,677
$779,543
$1,692,199
$87,722
0
200,000
400,000
600,000
800,000
1,000,000
1,200,000
1,400,000
1,600,000
1,800,000
Children and Dollars by Categories
Monthly
can be counted in the At-Risk category and then move into the Income Eligible category during the same time period. However, the child is only counted once in the unduplicated count for that period.
Monthly Chart 6
*Unduplicated Count means each child is counted one time only. A child may move between care levels and/or funding categories but that child is not counted again as another child. For example, a child can be counted in the At-Risk category and then move into the Income Eligible category during the same time period. However, the child is only counted once in the unduplicated count for that period.
Page 2Page 22 of 82
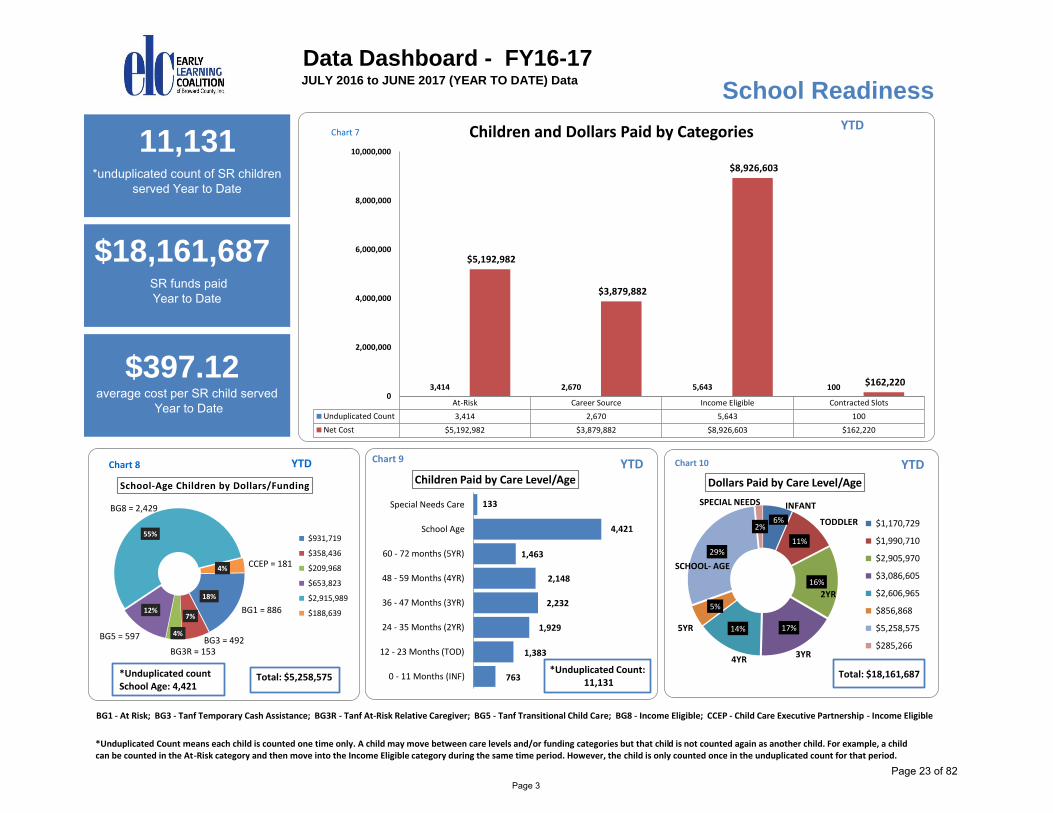
Data Dashboard - FY16-17 JULY 2016 to JUNE 2017 (YEAR TO DATE) Data
School Readiness
11,131*unduplicated count of SR children
served Year to Date
$18,161,687 SR funds paid Year to Date
$397.12average cost per SR child served
Year to Date At-Risk Career Source Income Eligible Contracted Slots
Unduplicated Count 3,414 2,670 5,643 100
Net Cost $5,192,982 $3,879,882 $8,926,603 $162,220
3,414 2,670 5,643 100
$5,192,982
$3,879,882
$8,926,603
$162,220
0
2,000,000
4,000,000
6,000,000
8,000,000
10,000,000
Children and Dollars Paid by CategoriesChart 7
763
1,383
1,929
2,232
2,148
1,463
4,421
133
0 - 11 Months (INF)
12 - 23 Months (TOD)
24 - 35 Months (2YR)
36 - 47 Months (3YR)
48 - 59 Months (4YR)
60 - 72 months (5YR)
School Age
Special Needs Care
Children Paid by Care Level/Age YTDChart 9
*Unduplicated Count:11,131
6%
11%
16%
17%14%
5%
29%
2%
Dollars Paid by Care Level/Age
$1,170,729
$1,990,710
$2,905,970
$3,086,605
$2,606,965
$856,868
$5,258,575
$285,266
YTDChart 10
Total: $18,161,687
SCHOOL- AGE
SPECIAL NEEDS INFANT
TODDLER
2YR
3YR4YR
5YR
YTD
*Unduplicated Count means each child is counted one time only. A child may move between care levels and/or funding categories but that child is not counted again as another child. For example, a child can be counted in the At-Risk category and then move into the Income Eligible category during the same time period. However, the child is only counted once in the unduplicated count for that period.
18%
7%
4%
12%
55%
4%
School-Age Children by Dollars/Funding
$931,719
$358,436
$209,968
$653,823
$2,915,989
$188,639
BG5 = 597
BG8 = 2,429
*Unduplicated countSchool Age: 4,421
Chart 8
Total: $5,258,575
BG1 = 886
BG3 = 492BG3R = 153
CCEP = 181
YTD
BG1 - At Risk; BG3 - Tanf Temporary Cash Assistance; BG3R - Tanf At-Risk Relative Caregiver; BG5 - Tanf Transitional Child Care; BG8 - Income Eligible; CCEP - Child Care Executive Partnership - Income Eligible
Page 3Page 23 of 82
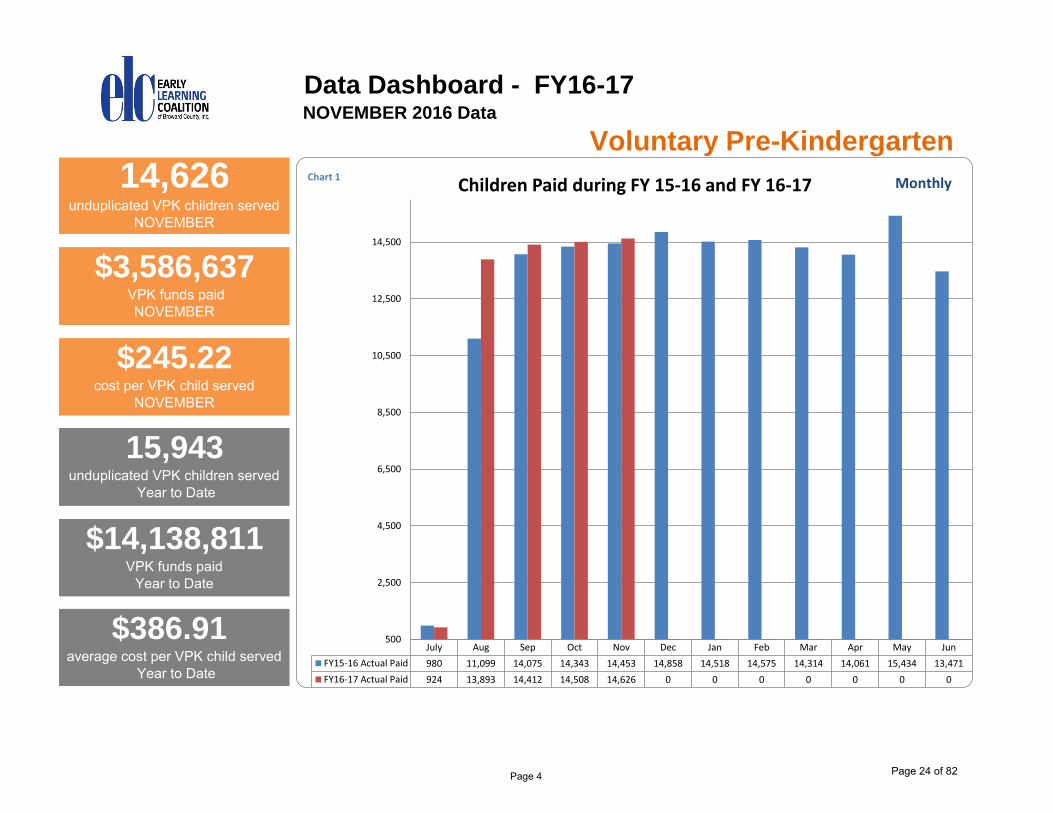
Data Dashboard - FY16-17 NOVEMBER 2016 Data
Voluntary Pre-Kindergarten
14,626unduplicated VPK children served
NOVEMBER
$3,586,637 VPK funds paid
NOVEMBER
$245.22cost per VPK child served
NOVEMBER
15,943unduplicated VPK children served
Year to Date
$14,138,811VPK funds paid
Year to Date
$386.91average cost per VPK child served
Year to Date
July Aug Sep Oct Nov Dec Jan Feb Mar Apr May Jun
FY15-16 Actual Paid 980 11,099 14,075 14,343 14,453 14,858 14,518 14,575 14,314 14,061 15,434 13,471
FY16-17 Actual Paid 924 13,893 14,412 14,508 14,626 0 0 0 0 0 0 0
500
2,500
4,500
6,500
8,500
10,500
12,500
14,500
Children Paid during FY 15-16 and FY 16-17Chart 1 Monthly
Page 4 Page 24 of 82

Data Dashboard - FY16-17
NOVEMBER 2016 Data
Voluntary Pre-Kindergarten
July Aug Sep Oct Nov Dec Jan Feb Mar Apr May Jun
FY15-16 Dollars $1,074,861 $1,018,024 $3,797,786 $4,238,194 $3,431,798 $2,890,436 $3,668,872 $4,059,734 $3,490,933 $4,064,335 $3,836,728 $1,881,280
FY16-17 Dollars $942,303 $1,716,346 $4,164,827 $3,728,699 $3,586,637 $- $- $- $- $- $- $-
$-
$1,000,000
$2,000,000
$3,000,000
$4,000,000
$5,000,000
Dollars Expended for VPK Children for FY 15-16 and FY 16-17 Chart 2 Monthly
Page 5 Page 25 of 82

Data Dashboard - FY16-17
Providers Relations
527 SR Providers Paid
NOVEMBER
100CCEP Providers
NOVEMBER
156Gold Seal Providers
NOVEMBER
647SR Providers Agreements
NOVEMBER
516VPK Providers Paid
NOVEMBER
534VPK Providers Agreements
NOVEMBER
NOVEMBER 2016 Data
0
100
200
300
400
500
600
Jul-16 Aug-16 Sep-16 Oct-16 Nov-16 Dec-16 Jan-17 Feb-17 Mar-17 Apr-17 May-17 Jun-17
Centers 443 470 475 477 472
Homes 60 62 57 55 55
School Readiness Providers Paid Monthly
0
50
100
150
200
250
300
350
400
450
500
Jul-16 Aug-16 Sep-16 Oct-16 Nov-16 Dec-16 Jan-17 Feb-17 Mar-17 Apr-17 May-17 Jun-17
Jul-16 Aug-16 Sep-16 Oct-16 Nov-16 Dec-16 Jan-17 Feb-17 Mar-17 Apr-17 May-17 Jun-17
Centers 85 451 465 471 475
Public Schools 4 33 36 38 38
Homes 0 2 3 3 3
VPK Providers Paid MonthlyChart 2
Chart 1
The difference between the Provider Agreements and the Providers Paid is that providers may have a "Provider Agreement" and not have any children enrolled or did not submit children attendance for the reporting month. Payments are made to providers for children attendance submitted during the reporting month.
Page 6 Page 26 of 82

Data Dashboard - FY16-17 NOVEMBER 2016 Data
211 - CCRR
2,069Telephone calls received
NOVEMBER
9.5 minsAverage minutes per call
NOVEMBER
9.17 minsLength of time caller is on hold
NOVEMBER
1,225Number of Callers Served
NOVEMBER
2,083Monthly Callers Goal
(25,000 FY16-17 Goal)
59%Percent of Goal Achieved
3,470
6,440
3,536
2,3452,069
2,472
3219
19621568
1380
622
1883
991458 406
0
1,000
2,000
3,000
4,000
5,000
6,000
7,000
Jul-16 Aug-16 Sep-16 Oct-16 Nov-16 Dec-16
Calls Received 3,470 6,440 3,536 2,345 2,069
Calls Answered 2,472 3219 1962 1568 1380
Left Messages 622 1883 991 458 406
Calls Received vs Calls AnsweredChart 1 Monthly
0 500 1,000 1,500 2,000 2,500 3,000 3,500
Jul-16
Aug-16
Sep-16
Oct-16
Nov-16
Dec-16
511
643
484
361
390
1,707
3,230
778
344
293
576
705
677
456
558
Resource and Referral Support Data
Families Screened for SRProgram
Families receiving SR/VPKListing
Parent packets provided
Chart 2Monthly
Families screened - Parents calling for assistance for child care services are screened for wait list eligibility.
Each parent is provided a listing of providers requested by parent that is customized based on need, i.e., location, cost, language, zip codes, etc.
Parent packets provided includes community services, financial assistance program, child health care, abuse/welfare and special needs services.
Page 7Page 27 of 82

INTERIM FINANCIAL STATEMENTS
For The Second Month Ended August 31, 2016FISCAL YEAR 2016-2017
TAB 8
Page 28 of 82

Page
Financial Summary……………………………………………………………………………… 2
Statement of Financial Position……………………………………………………………… 3
Statement of Activities…………………………………………………………………………… 4
Budget to Actual (Budgetary Basis) - Monthly and Year to Date ………………………………………………………………… 5-6
Budget to Actual (Budgetary Basis) - Annualized Fiscal Year End……………………………………………………………… 7-8
Notes to the Financial Statements…………………………………………………………… 9
Early Learning Coalition of Broward County, Inc.Table of Contents
For The Second Month Ended August 31, 2016
Page 29 of 82

CHART 1
Annual Revenues YTDBudget To Date %
OEL - SR 42,566,103$ 8,455,184$ 34,110,919$ 19.9%OEL - CCEP 2,551,079 197,547 2,353,532 7.7%OEL - VPK 40,306,029 3,788,762 36,517,267 9.4%CSC 5,092,850 18,587 5,074,263 0.4%OTHER GRANTS / FUNDS 928,363 49,101 879,262 5.3%
91,444,424$ 12,509,180$ 78,935,244$ 78,935,244$
-
CHART 2
Annual Budget
Expended To Date Remaining YTD Projected **Variance
%
211 Broward593,639$ 86,708$ 506,931$ 14.6% 593,639$ - 48,077 7,053 41,024 14.7% 48,077 -
641,716$ 93,761$ 547,955$ 641,716$ - Broward Regional Health Planning Co.
3,100,789$ 325,212$ 2,775,577$ 10.5% 3,100,789$ - 961,097 106,068 855,029 11.0% 961,097 -
4,061,886$ 431,280$ 3,630,606$ 10.6% 4,061,886$ - -
40,646,622$ 7,465,189$ 33,181,433$ 18.4% 40,759,521$ 112,899 38,662,955 3,580,900 35,082,055 9.3% 38,662,955 -
105,651 21,058 84,593 19.9% 105,651 - 79,415,228$ 11,067,147$ 68,348,081$ 13.9% 79,528,127$ 112,899
Family Central, Inc.993,503$ 149,644$ 843,859$ 15.1% 993,503$ -
Nova Southeastern Univ.919,316$ 144,031$ 775,285$ 15.7% 919,316$ -
Broward County Public Schools843,157$ 55,299$ 787,858$ 6.6% 843,157$ -
Children's Forum448,587$ 89,754$ 358,833$ 20.0% 448,587$ -
4,121,031 476,380 3,644,651 11.6% 4,121,031 -
TOTAL 91,444,424$ * 12,507,296$ * 78,937,128$ 13.7% 91,557,323$ 112,899 * 1,884$ * 1,884$
ELC2 VPK Slot Payments
ELC2 SR Slot Management (includes
For The Second Month Ended August 31, 2016
Early Learning Coalition of Broward County, Inc.
ELC1 Resource & ReferralELC1 VPK Outreach
ELC EXPENDITURES
* NOTE: Variances due to miscellaneous revenue received for general administrative expenses. Revenue is generated from contributions, small grants and donations for ELC trainings/meetings, conferences and special project $1,884
ELC4-2 Road To Child Outcomes
Preliminary Financial Summary
Remaining
ELC2 SR Slot Payments
ELC7 WAGES
Slot Payment (BRHPC)
ELC Admin/Grants/Services
ELC4-3 Road To Child Outcomes
ELC2 DCF - Entrant
ELC2 VPK Slot Management
ELC REVENUES / FUND SOURCE
ELC4-1 Road To Child Outcomes
$42,566,103
$2,551,079
$40,306,029
$5,092,850
$928,363
$8,455,184
$197,547
$3,788,762
$18,587
$49,101
19.9%
7.7%
9.4%
0.4%
5.3%
$(2,000,000) $3,000,000 $8,000,000 $13,000,000 $18,000,000 $23,000,000 $28,000,000 $33,000,000 $38,000,000 $43,000,000
OEL - SR
OEL - CCEP
OEL - VPK
CSC
OTHER GRANTS / FUNDS
YTD % YTD FY17 Budget FY17
$641,716.00
$4,061,886.00
$993,503.00
$919,316.00
$843,157.00
$448,587.00
$4,121,031.07
$93,760.80
$431,280.13
$149,643.84
$144,030.90
$55,298.72
$89,754.42
$476,380.28
14.6%
10.6%
15.1%
15.7%
6.6%
20.0%
11.6%
$- $500,000.00 $1,000,000.00 $1,500,000.00 $2,000,000.00 $2,500,000.00 $3,000,000.00 $3,500,000.00 $4,000,000.00 $4,500,000.00
211 BROWARD
BROWARD REGIONAL HEALTH PLANNING CO.
FAMILY CENTRAL, INC.
NOVA SOUTHEASTERN UNIV.
BROWARD COUNTY PUBLIC SCHOOLS
CHILDREN'S FORUM
ELC ADMIN/GRANTS/SERVICES
YTD % YTD FY17 Budget FY17Page 30 of 82

Summary:Cash Balance 6,878,642$ Total Assets 10,812,874 Total Liabilities 10,456,543 Total Fund Equity 356,331$
August 31, 2016 August 31, 2015
ASSETS
Current Assets:Cash 6,878,642$ 5,423,011$ Petty Cash - 100 Advance, Interest & Accounts Receivable 160,161 10,152,614 Due From Other Agencies 3,800,000 4,013,325 Prepaid Expenses (25,929) 38,668
Property & Equipment, Net - 20,170 Total Current Assets 10,812,874$ 19,647,888$
Submitted to the September 28, 2016 Finance Committee MeetingLiabilities:
Accounts Payable (11,708)$ 166,318$ Salary & Fringe Benefits Payable 5,516 - Due to 211 Broward (33,130) 45,272 Due to Broward County School Board (92,540) 84,852 Due to Broward Regional Health Planning Council 3,920,267 9,489,090 Due to Children's Forum 83,317 67,545 Due to Family Central, Inc. (7,725) 2,293,172 Due to NSU (24,983) 160,527 Due to Other Agencies 1,305.71 2,564.67 Deferred Revenue 6,616,223 6,987,851
Total Liabilities 10,456,543$ 19,297,191$
Fund Equity: (Note 3)Designated for Program Enhancement - - Designated for eligible child care slots 114,994$ 114,994$ Equity in Fixed Assets 22,277 22,277 Fund Balance Undesignated 219,060 213,426
Total Fund Balance 356,331$ 350,697$
Total Liabilities and Fund Equity 10,812,874$ 19,647,888$
Notes on page 9 are an integral part of this Financial Statement.
Early Learning Coalition of Broward County, Inc.FY 2016-2017 Statement of Financial Position
As Of August 31, 2016
Page 31 of 82

August 2016 Actual
FY 2017 YTD Actual
FY 2016 YTD Actual
Revenues & supportGrants and other income
Federal grants 4,439,300$ 8,673,291$ 44,618,953$ State grants 2,471,244 3,788,762 38,158,329 Children's Services Council of Broward 5,219 18,587 4,395,576 Miscellaneous 9,068 28,541 213,078
Total grants and other income 6,924,831 12,509,180 87,385,936 Interest on Investments - - (86)
Total revenues & support 6,924,831.3 12,509,180 87,385,850
Expenses:Program services:
School Readiness 3,990,745 7,790,401 42,437,880 Voluntary Pre-kindergarten (Note 4) 2,419,276 3,686,968 37,819,117 Entrant Refugee Services BRHPC 11,357 21,058 - Program support and administration 277,723 532,489 4,518,731 Community Transformation Grants/PFPP 5,876 20,709 80,796 Quality Enhancement Programs 90,356 199,922 836,617
Total program services 6,795,333 12,251,547 85,693,141
SuSupporting services:General and administrative 127,763 255,749 1,722,285
Total supporting services 127,763 255,749 1,722,285
Total expenses 6,923,096 12,507,296 87,415,426
Change in net assets 1,735 1,884$ (29,576)$
Net assets, beginning of year 353,491 381,912
Net assets, end of the period 355,375$ 352,336
Notes on page 9 are an integral part of this Financial Statement.
Early Learning Coalition of Broward County, Inc.FY 2016-2017 Statement of Activities
4
For The Month Ended August 31, 2016
Page 32 of 82

ANNUAL BUDGET August Budget August Actuals Variance % of Monthly
Budget
Revenues:Local Sources:
Florida Department of Children & Familie -$ -$ 13,039$ (13,039)$ N/A OEL State/Federal - SR 42,566,103 3,751,036 4,331,045 (580,009) 115%OEL State/Federal - CCEP 2,551,079 224,808 95,217 129,591 42%OEL State - VPK 35,155,653 2,098,008 1,836,941 261,066 88%OEL State - VPK Prepayment (Note 4) 5,150,376 658,104 634,303 23,801 96%Children's Services Council 5,092,850 448,795 5,219 443,576 1%Other Grants 882,363 77,756 5,876 71,880 8%Miscellaneous/Match 46,000 4,054 3,192 862 78.7%
Total Revenue 91,444,424$ 7,262,560$ 6,924,831$ 337,729$ 75.90%
Expenditures:Program:
Resource & Referral - 211 593,639$ 52,313$ 58,999$ 6,686$ 113%VPK Resource & Referral - 211 48,077 4,237 5,180 944 122%SR Eligibility - DCF 12,046 1,062 997 (65) 94%SR Eligibility - BRHPC 3,088,743 272,188 215,069 (57,119) 79%VPK Eligibility - BRHPC 961,097 84,694 68,628 (16,067) 81%SR Slots 40,646,622 3,581,886 3,774,679 192,793 105%VPK Slots 38,662,955 3,407,080 2,350,648 (1,056,432) 69%DCF-Entrants Services 105,651 9,310 11,357 2,047 122%
Sub-Total Direct Services & Slots 84,118,830$ 7,412,770$ 6,485,557$ (927,213)$ 87%
Road To Child Outcomes - FCI 993,503 87,550 74,617 (12,933) 85%Road To Child Outcomes - NOVA 919,316 81,013 77,419 (3,593) 96%Road To Child Outcomes - BCSB 843,157 74,301 38,508 (35,793) 52%WAGES - Children's Forum 448,587 39,531 23,000 (16,530) 58%ELC ProviderMgmt & Screening 3IN 412,878 36,384 35,361 (1,023) 97%ELC Provider Quality CASI 288,588 25,431 29,613 4,182 116%ELC PQI & Data Mgmt 245,075 21,597 25,382 3,785 118%ELC Other Grants (UF/PFPP) 1,242,354 109,479 5,876 (103,603) 5%
Sub-Total Quality & Grants 5,393,458 475,286 309,776 (165,509) 65%
Total Program Expenses 89,512,288$ 7,888,056$ 6,795,333$ (1,092,723)$ 86%
Note: Year to Date (YTD) budget amounts are adjusted to reflect actual and planned 5
Early Learning Coalition of Broward County, Inc.FY 2016 - 2017 BUDGET TO ACTUALFor The Month Ended August 31, 2016
Page 33 of 82

ANNUAL BUDGET August Budget August Actuals Variance % of Monthly
Budget
Early Learning Coalition of Broward County, Inc.FY 2016 - 2017 BUDGET TO ACTUALFor The Month Ended August 31, 2016
Administration:Employee Salaries 1,027,504$ 90,546$ 56,472$ (34,074)$ 62%Employee Fringes 431,820 38,053 20,888 (17,165) 55%Legal Fees 62,250 5,486 4,513 (973) 82%Auditors 31,000 2,732 (2,732) 0%Accreditation Cost 400 35 (35) 0%Other Consultants 40,800 10,595 11,168 572 105%Insurance 11,081 976 787 (190) 81%Travel 18,891 1,665 169 (1,496) 10%Repairs/Maint & Utilities 5,912 521 256 (265) 49%Rental - Equip & Facility 155,110 13,669 12,882 (786) 94%Communications 39,232 3,457 2,066 (1,391) 60%Advertising and Printing 18,000 1,586 4,938 3,352 311%Other: Supplies/Subscription, etc. 49,723 4,382 13,624 9,243 311%Depreciation 11,040 973 (973) 0%
Sub-Total Expenditures 1,902,763$ 174,676$ 127,763$ (46,914)$ 73.14%
Capital Outlay:Computer Hardware/Software 26,923 2,373 - (2,373) 0.0%Furniture/ Equipment 2,450 216 - (216) 0.0%
Total Capital Outlay 29,373 2,588 - (2,588) 0.0%
Total ELC Administration Expense 1,932,136 177,265 127,763 (49,502) 72.07%
Total Expenditures 91,444,424$ 8,065,321$ 6,923,096$ (1,142,225)$ 85.84%
(*) Note: Line Item re-allocated in accordance to Fiscal PoliciesNote: Year to Date (YTD) budget amounts are adjusted to reflect actual and planned activity.Notes on page 9 are an integral part of this Financial Statement.
6
The Variance column in the previously released Financial reports was referencing the wrong column to compare to the August actutals, making the variance column show the incorrect calculation. The formula has been fixed to reference the correct budget column and the spreadsheet will be revised in the future to avoid these kinds of errors.
Page 34 of 82
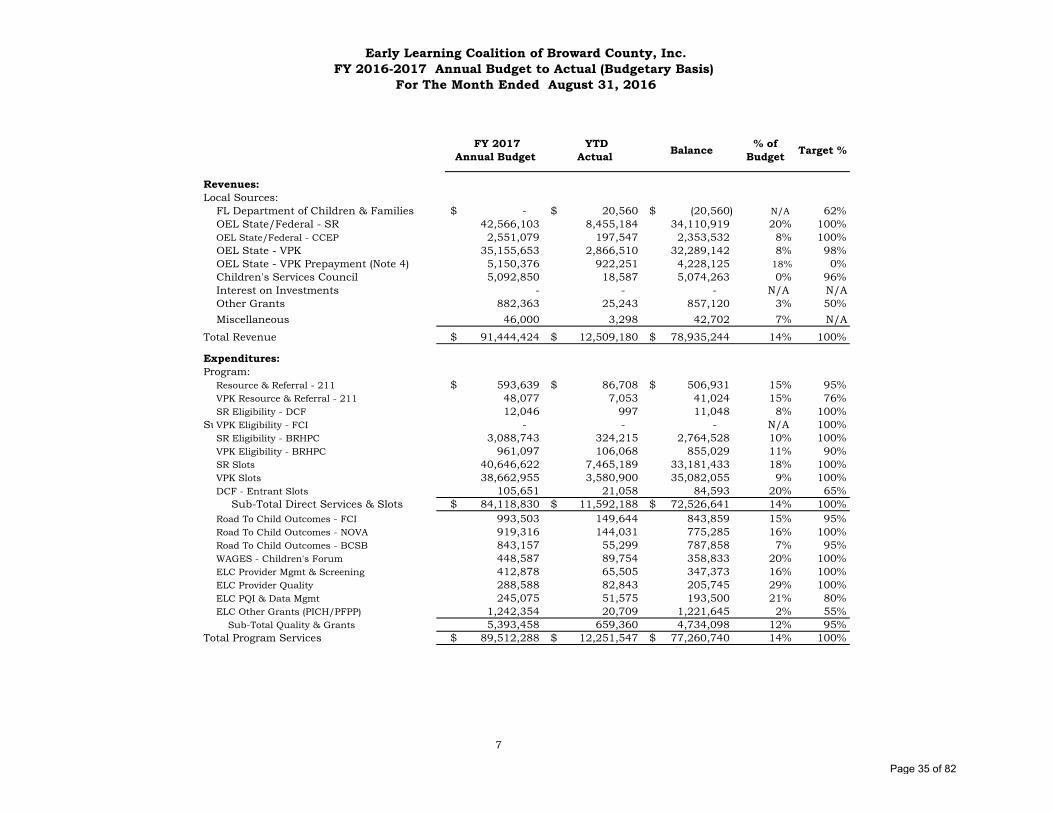
FY 2017 Annual Budget
YTD Actual Balance % of
Budget Target %
Revenues:Local Sources:
FL Department of Children & Families -$ 20,560$ (20,560)$ N/A 62%OEL State/Federal - SR 42,566,103 8,455,184 34,110,919 20% 100%OEL State/Federal - CCEP 2,551,079 197,547 2,353,532 8% 100%OEL State - VPK 35,155,653 2,866,510 32,289,142 8% 98%OEL State - VPK Prepayment (Note 4) 5,150,376 922,251 4,228,125 18% 0%Children's Services Council 5,092,850 18,587 5,074,263 0% 96%Interest on Investments - - - N/A N/AOther Grants 882,363 25,243 857,120 3% 50%Miscellaneous 46,000 3,298 42,702 7% N/A
Total Revenue 91,444,424$ 12,509,180$ 78,935,244$ 14% 100%
Expenditures:Program:
Resource & Referral - 211 593,639$ 86,708$ 506,931$ 15% 95%VPK Resource & Referral - 211 48,077 7,053 41,024 15% 76%SR Eligibility - DCF 12,046 997 11,048 8% 100%
SuVPK Eligibility - FCI - - - N/A 100%SR Eligibility - BRHPC 3,088,743 324,215 2,764,528 10% 100%VPK Eligibility - BRHPC 961,097 106,068 855,029 11% 90%SR Slots 40,646,622 7,465,189 33,181,433 18% 100%VPK Slots 38,662,955 3,580,900 35,082,055 9% 100%DCF - Entrant Slots 105,651 21,058 84,593 20% 65%
Sub-Total Direct Services & Slots 84,118,830$ 11,592,188$ 72,526,641$ 14% 100%Road To Child Outcomes - FCI 993,503 149,644 843,859 15% 95%Road To Child Outcomes - NOVA 919,316 144,031 775,285 16% 100%Road To Child Outcomes - BCSB 843,157 55,299 787,858 7% 95%WAGES - Children's Forum 448,587 89,754 358,833 20% 100%ELC Provider Mgmt & Screening 412,878 65,505 347,373 16% 100%ELC Provider Quality 288,588 82,843 205,745 29% 100%ELC PQI & Data Mgmt 245,075 51,575 193,500 21% 80%ELC Other Grants (PICH/PFPP) 1,242,354 20,709 1,221,645 2% 55%
Sub-Total Quality & Grants 5,393,458 659,360 4,734,098 12% 95%Total Program Services 89,512,288$ 12,251,547$ 77,260,740$ 14% 100%
Early Learning Coalition of Broward County, Inc.FY 2016-2017 Annual Budget to Actual (Budgetary Basis)
7
For The Month Ended August 31, 2016
Page 35 of 82
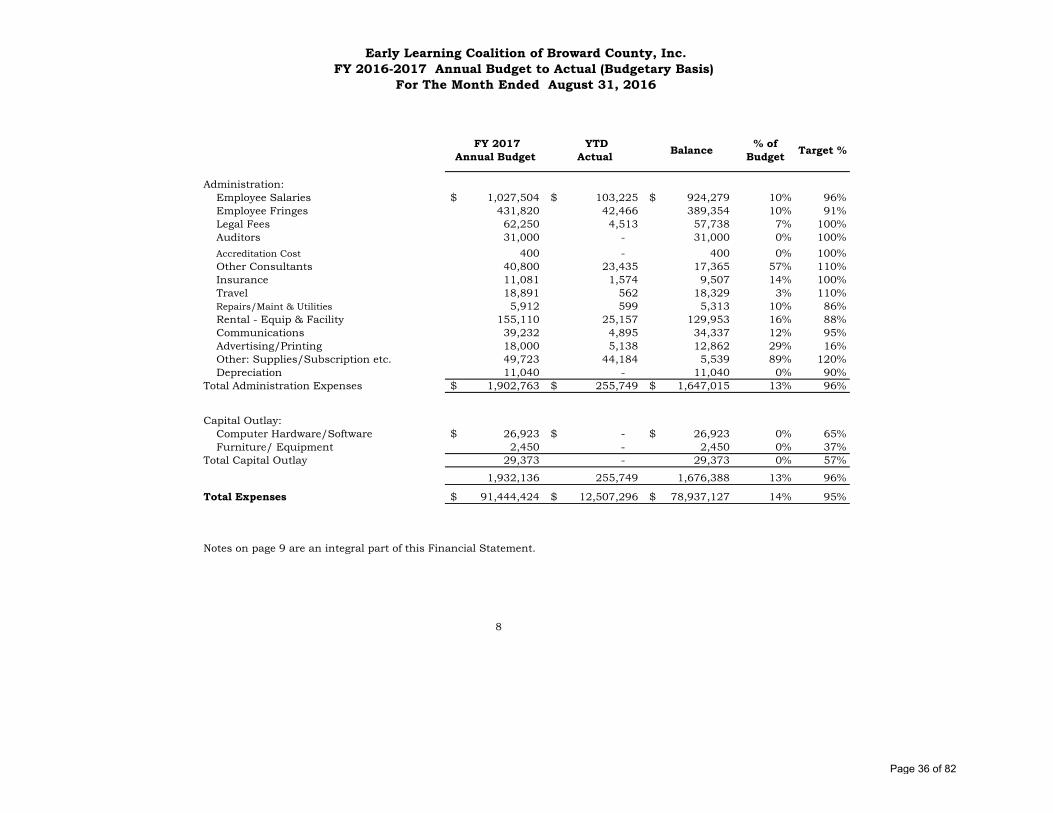
FY 2017 Annual Budget
YTD Actual Balance % of
Budget Target %
Early Learning Coalition of Broward County, Inc.FY 2016-2017 Annual Budget to Actual (Budgetary Basis)
For The Month Ended August 31, 2016
Administration:Employee Salaries 1,027,504$ 103,225$ 924,279$ 10% 96%Employee Fringes 431,820 42,466 389,354 10% 91%Legal Fees 62,250 4,513 57,738 7% 100%Auditors 31,000 - 31,000 0% 100%Accreditation Cost 400 - 400 0% 100%Other Consultants 40,800 23,435 17,365 57% 110%Insurance 11,081 1,574 9,507 14% 100%Travel 18,891 562 18,329 3% 110%Repairs/Maint & Utilities 5,912 599 5,313 10% 86%Rental - Equip & Facility 155,110 25,157 129,953 16% 88%Communications 39,232 4,895 34,337 12% 95%Advertising/Printing 18,000 5,138 12,862 29% 16%Other: Supplies/Subscription etc. 49,723 44,184 5,539 89% 120%Depreciation 11,040 - 11,040 0% 90%
Total Administration Expenses 1,902,763$ 255,749$ 1,647,015$ 13% 96%
Capital Outlay:Computer Hardware/Software 26,923$ -$ 26,923$ 0% 65%Furniture/ Equipment 2,450 - 2,450 0% 37%
Total Capital Outlay 29,373 - 29,373 0% 57%
1,932,136 255,749 1,676,388 13% 96%
Total Expenses 91,444,424$ 12,507,296$ 78,937,127$ 14% 95%
8
Notes on page 9 are an integral part of this Financial Statement.
Page 36 of 82

(1)
(2)
(3)
(4)
Early Learning Coalition of Broward County, Inc.
The full accrual basis of accounting is utilized by ELC. Under the accrual basis,
revenues are recognized in the accounting period in which they are earned. Expenses
are recognized in the accounting period in which the liability is incurred.
Notes to the Financial Statements
The Early Learning Coalition of Broward County ("ELC") budgets, as revenue, 100% ofthe OEL Funding Agreement. Revenue from the Office of Early Learning (OEL)comprises both federal and state funds.
For The Second Month Ended August 31, 2016
State law requires that VPK providers receive a prepayment at the beginning of eachmonth. During the fiscal year, these expenditures are reported as revenue and expensewhen they are incurred. At year end, any outstanding balances will be recorded to thecorresponding asset and liability account.
The Net Assets Undesignated represents .24% of the total Operating Budget.
Page 37 of 82

Submitted to the November 30, 2016 Finance Committee Meeting
INTERIM FINANCIAL STATEMENTS
For The Third Month Ended September 30, 2016FISCAL YEAR 2016-2017
Page 38 of 82
Page
Financial Summary……………………………………………………………………………… 2
Statement of Financial Position……………………………………………………………… 3
Statement of Activities…………………………………………………………………………… 4
Budget to Actual (Budgetary Basis) - Monthly and Year to Date ………………………………………………………………… 5-6
Budget to Actual (Budgetary Basis) - Annualized Fiscal Year End……………………………………………………………… 7-8
Notes to the Financial Statements…………………………………………………………… 9Submitted to the November 30, 2016 Finance Committee Meeting
Early Learning Coalition of Broward County, Inc.Table of Contents
For The Third Month Ended September 30, 2016
Page 39 of 82
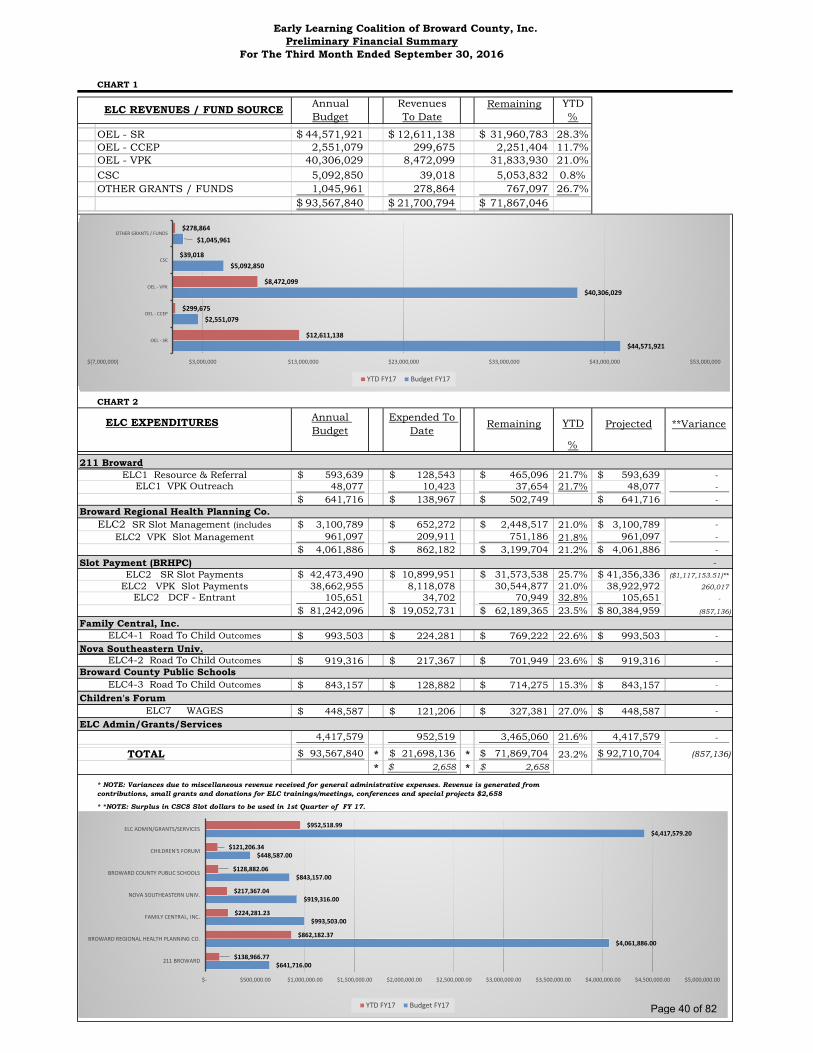
CHART 1
Annual Revenues YTDBudget To Date %
OEL - SR 44,571,921$ 12,611,138$ 31,960,783$ 28.3%OEL - CCEP 2,551,079 299,675 2,251,404 11.7%OEL - VPK 40,306,029 8,472,099 31,833,930 21.0%CSC 5,092,850 39,018 5,053,832 0.8%OTHER GRANTS / FUNDS 1,045,961 278,864 767,097 26.7%
93,567,840$ 21,700,794$ 71,867,046$ 71,867,046$
-
CHART 2
Annual Budget
Expended To Date
Remaining YTD Projected **Variance
%
211 Broward593,639$ 128,543$ 465,096$ 21.7% 593,639$ - 48,077 10,423 37,654 21.7% 48,077 -
641,716$ 138,967$ 502,749$ 641,716$ - Broward Regional Health Planning Co.
3,100,789$ 652,272$ 2,448,517$ 21.0% 3,100,789$ - 961,097 209,911 751,186 21.8% 961,097 -
4,061,886$ 862,182$ 3,199,704$ 21.2% 4,061,886$ - -
42,473,490$ 10,899,951$ 31,573,538$ 25.7% 41,356,336$ ($1,117,153.51)**
38,662,955 8,118,078 30,544,877 21.0% 38,922,972 260,017
105,651 34,702 70,949 32.8% 105,651 -
81,242,096$ 19,052,731$ 62,189,365$ 23.5% 80,384,959$ (857,136)
Family Central, Inc.993,503$ 224,281$ 769,222$ 22.6% 993,503$ -
Nova Southeastern Univ.919,316$ 217,367$ 701,949$ 23.6% 919,316$ -
Broward County Public Schools843,157$ 128,882$ 714,275$ 15.3% 843,157$ -
Children's Forum448,587$ 121,206$ 327,381$ 27.0% 448,587$ -
4,417,579 952,519 3,465,060 21.6% 4,417,579 -
TOTAL 93,567,840$ * 21,698,136$ * 71,869,704$ 23.2% 92,710,704$ (857,136) * 2,658$ * 2,658$
For The Third Month Ended September 30, 2016
Early Learning Coalition of Broward County, Inc.Preliminary Financial Summary
*
ELC2 SR Slot Payments
ELC7 WAGES
Slot Payment (BRHPC)
ELC Admin/Grants/Services
ELC4-3 Road To Child Outcomes
ELC2 DCF - Entrant
ELC4-1 Road To Child Outcomes
ELC2 VPK Slot Payments
* *NOTE: Surplus in CSC8 Slot dollars to be used in 1st Quarter of FY 17.
* NOTE: Variances due to miscellaneous revenue received for general administrative expenses. Revenue is generated from contributions, small grants and donations for ELC trainings/meetings, conferences and special projects $2,658
ELC4-2 Road To Child Outcomes
Remaining
ELC2 VPK Slot Management
ELC REVENUES / FUND SOURCE
ELC2 SR Slot Management (includes
ELC1 Resource & ReferralELC1 VPK Outreach
ELC EXPENDITURES
$44,571,921
$2,551,079
$40,306,029
$5,092,850
$1,045,961
$12,611,138
$299,675
$8,472,099
$39,018
$278,864
$(7,000,000) $3,000,000 $13,000,000 $23,000,000 $33,000,000 $43,000,000 $53,000,000
OEL - SR
OEL - CCEP
OEL - VPK
CSC
OTHER GRANTS / FUNDS
YTD FY17 Budget FY17
$641,716.00
$4,061,886.00
$993,503.00
$919,316.00
$843,157.00
$448,587.00
$4,417,579.20
$138,966.77
$862,182.37
$224,281.23
$217,367.04
$128,882.06
$121,206.34
$952,518.99
$- $500,000.00 $1,000,000.00 $1,500,000.00 $2,000,000.00 $2,500,000.00 $3,000,000.00 $3,500,000.00 $4,000,000.00 $4,500,000.00 $5,000,000.00
211 BROWARD
BROWARD REGIONAL HEALTH PLANNING CO.
FAMILY CENTRAL, INC.
NOVA SOUTHEASTERN UNIV.
BROWARD COUNTY PUBLIC SCHOOLS
CHILDREN'S FORUM
ELC ADMIN/GRANTS/SERVICES
YTD FY17 Budget FY17 Page 40 of 82

Summary:Cash Balance 7,941,077$ Total Assets 20,836,649 Total Liabilities 20,481,904 Total Fund Equity 354,744$
September 30, 2016 September 30, 2015
ASSETS
Assets:Cash 7,941,077$ 2,434,513$ Petty Cash 100 100 Advance, Interest & Accounts Receivable 9,024,201 13,834,921 Due From Other Agencies 3,813,325 3,813,325 Prepaid Expenses 47,188 40,790
Property & Equipment, Net 10,758 19,193 Assets 20,836,649$ 20,142,843$
Liabilities:Accounts Payable 235,286$ 27,951$ Salary & Fringe Benefits Payable 74,387 2,561 Due to 211 Broward 109,385 53,819 Due to Broward County School Board 112,091 69,851 Due to Broward Regional Health Planning Council 12,580,769 12,528,515 Due to Children's Forum 54,452 31,450 Due to Family Central, Inc. 156,395 1,270 Due to NSU 150,755 72,626 Due to Other Agencies 16,623.49 13,369.80 Deferred Revenue 6,991,759 6,976,916
Total Liabilities 20,481,904$ 19,778,327$
Net Assets: (Note 3)Designated for Program Enhancement - - Designated for eligible child care slots 114,994$ 114,994$ Equity in Fixed Assets 22,277 22,277 Fund Balance Undesignated 217,473 227,244
Net Assets 354,744$ 364,515$
Total Liabilities and Fund Equity 20,836,649$ 20,142,843$
Notes on page 9 are an integral part of this Financial Statement.
Early Learning Coalition of Broward County, Inc.FY 2016-2017 Statement of Financial Position
As Of September 30, 2016
Page 41 of 82

September 2016 Actual
FY 2017 YTD Actual
FY 2016 YTD Actual
Revenues & supportGrants and other income
Federal grants 4,273,621$ 12,946,912$ 12,063,605$ State grants 4,683,337 8,472,099 7,691,732 Children's Services Council of Broward 20,432 39,018 1,999,158 Miscellaneous 214,328.18 242,765 38,648
Total grants and other income 9,191,718 21,700,794 21,793,143 Interest on Investments - - 63
Total revenues & support 9,191,718$ 21,700,794$ 21,793,206$
Expenses:Program services:
School Readiness 3,761,822$ 11,552,223$ 12,888,414$ Voluntary Pre-kindergarten (Note 4) 4,641,021 8,327,989 7,528,786 Entrant Refugee Services BRHPC 13,643 34,702 Program support and administration 298,214.76 830,703 772,915 Community Transformation Grants/PFPP 213,014.98 233,724 22,267 Quality Enhancement Programs 70,642.20 270,564 157,171
Total program services 8,998,359$ 21,249,906$ 21,369,553$
SuSupporting services:General and administrative 192,482$ 448,230$ 412,629$
Total supporting services 192,482.00 448,230 412,629
Total expenses 9,190,840.61 21,698,136 21,782,182
Change in net assets 877.44$ 2,658$ 11,025$
Net assets, beginning of year 352,086 353,491
Net assets, end of the period 354,744$ 364,515$
Notes on page 9 are an integral part of this Financial Statement.
Early Learning Coalition of Broward County, Inc.FY 2016-2017 Statement of Activities
4
For The Third Month Ended September 30, 2016
Page 42 of 82

ANNUAL BUDGET September Budget
September Actuals Variance % of Monthly
Budget
Revenues:Local Sources:
Florida Department of Children & Fa -$ -$ 15,539$ 15,539$ N/A OEL State/Federal - SR 44,571,921 3,757,020 4,155,954 398,934 111%OEL State/Federal - CCEP 2,551,079 215,033 102,128 (112,905) 47%OEL State - VPK 35,155,653 4,030,603 4,318,127 287,525 107%OEL State - VPK Prepayment (Note 4 5,150,376 434,131 365,210 (68,922) 84%Children's Services Council 5,092,850 429,282 20,432 (408,851) 5%Other Grants 999,961 84,288 213,015 128,727 253%Miscellaneous/Match 46,000 3,877 1,313 (2,564) 33.9%
Total Revenue 93,567,840$ 8,954,236$ 9,191,718$ 237,483$ 102.65%
Expenditures:Program:
Resource & Referral - 211 593,639$ 50,039$ 41,835$ 8,203$ 84%VPK Resource & Referral - 211 48,077 4,052 3,371 682 83%SR Eligibility - DCF 12,046 1,015 1,495 (480) 147%SR Eligibility - BRHPC 3,088,743 260,354 325,565 (65,211) 125%VPK Eligibility - BRHPC 961,097 81,012 103,842 (22,830) 128%SR Slots 42,473,490 3,422,697 3,434,763 (12,066) 100%VPK Slots 38,662,955 4,164,827 4,537,178 (372,351) 109%DCF-Entrants Services 105,651 8,905 13,643 (4,738) 153%
Sub-Total Direct Services & Slots 85,945,698$ 7,992,902$ 8,461,693$ (468,791)$ 106%Road To Child Outcomes - FCI 993,503 83,744 74,637 9,106 89%Road To Child Outcomes - NOVA 919,316 77,490 73,336 4,154 95%Road To Child Outcomes - BCSB 843,157 71,071 73,583 (2,513) 104%WAGES - Children's Forum 448,587 37,812 31,452 6,360 83%ELC ProviderMgmt & Screening 3IN 543,010 45,771 42,653 3,118 93%ELC Provider Quality CASI 342,128 28,838 7,520 21,318 26%ELC PQI & Data Mgmt 224,107 18,890 20,469 (1,579) 108%ELC Other Grants (UF/PFPP) 1,387,792 116,979 213,015 (96,036) 182%
Sub-Total Quality & Grants 5,701,600 480,595 536,666 (56,071) 112%
Total Program Expenses 91,647,298$ 8,473,496$ 8,998,359$ (524,862)$ 106%
Note: Year to Date (YTD) budget amounts are adjusted to reflect actual and 5
Early Learning Coalition of Broward County, Inc.FY 2016 - 2017 BUDGET TO ACTUAL
For The Month Ended September 30, 2016
Page 43 of 82

ANNUAL BUDGET September Budget
September Actuals Variance % of Monthly
Budget
Early Learning Coalition of Broward County, Inc.FY 2016 - 2017 BUDGET TO ACTUAL
For The Month Ended September 30, 2016
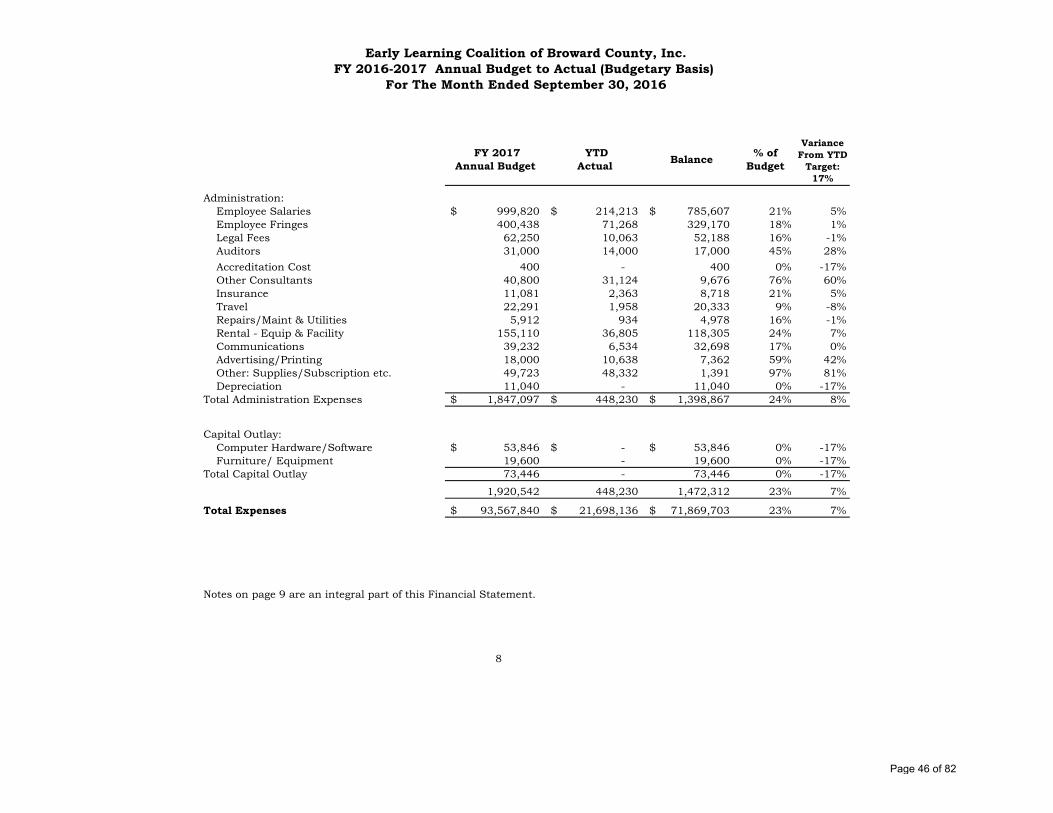
Administration:Employee Salaries 999,820$ 84,276$ 110,988$ (26,712)$ 132%Employee Fringes 400,438 33,753 28,802 4,951 85%Legal Fees 62,250 5,247 5,550 (303) 106%Auditors 31,000 14,613 14,000 613 96%Accreditation Cost 400 34 - 34 0%Other Consultants 40,800 7,339 7,688 (349) 105%Insurance 11,081 934 789 145 84%Travel 22,291 1,879 1,396 483 74%Repairs/Maint & Utilities 5,912 498 334 164 67%Rental - Equip & Facility 155,110 13,074 11,648 1,426 89%Communications 39,232 3,307 1,638 1,669 50%Advertising and Printing 18,000 5,317 5,500 (183) 103%Other: Supplies/Subscription, etc. 49,723 4,191 4,148 43 99%Depreciation 11,040 931 - 931 0%
Sub-Total Expenditures 1,847,097$ 175,394$ 192,482$ (17,088)$ 110%
Capital Outlay:Computer Hardware/Software 53,846 4,539 - 4,539 0.0%Furniture/ Equipment 19,600 1,652 - 1,652 0.0%
Total Capital Outlay 73,446 6,191 - 6,191 0.0%
Total ELC Administration Expense 1,920,542 181,585 192,482 (10,897) 106%
Total Expenditures 93,567,840$ 8,655,081$ 9,190,841$ (535,759)$ 106%
(*) Note: Line Item re-allocated in accordance to Fiscal PoliciesNote: Year to Date (YTD) budget amounts are adjusted to reflect actual and planned activity.Notes on page 9 are an integral part of this Financial Statement.
6
Page 44 of 82

FY 2017 Annual Budget
YTD Actual Balance % of
Budget
Variance From YTD
Target: 17%
Revenues:Local Sources:
FL Department of Children & Families -$ 36,099$ 36,099$ N/A 0%OEL State/Federal - SR 44,571,921 12,611,138 (31,960,783) 28% 12%OEL State/Federal - CCEP 2,551,079 299,675 (2,251,404) 12% -5%OEL State - VPK 35,155,653 7,184,638 (27,971,015) 20% 4%OEL State - VPK Prepayment (Note 4) 5,150,376 1,287,461 (3,862,915) 25% 8%Children's Services Council 5,092,850 39,018 (5,053,832) 1% -16%Other Grants 999,961 238,258 (761,703) 24% 7%Miscellaneous 46,000 4,507 (41,493) 10% -7%
Total Revenue 93,567,840$ 21,700,794$ (71,867,046)$ 23% 7%
Expenditures:Program:
Resource & Referral - 211 593,639$ 128,543$ 465,096$ 22% 5%VPK Resource & Referral - 211 48,077 10,423 37,654 22% 5%SR Eligibility - DCF 12,046 2,492 9,553 21% 4%SR Eligibility - BRHPC 3,088,743 649,780 2,438,963 21% 4%VPK Eligibility - BRHPC 961,097 209,911 751,186 22% 5%SR Slots 42,473,490 10,899,951 31,573,538 26% 9%VPK Slots 38,662,955 8,118,078 30,544,877 21% 4%DCF - Entrant Slots 105,651 34,702 70,949 33% 16%
Sub-Total Direct Services & Slots 85,945,698$ 20,053,880$ 65,891,816$ 23% 7%Road To Child Outcomes - FCI 993,503 224,281 769,222 23% 6%Road To Child Outcomes - NOVA 919,316 217,367 701,949 24% 7%Road To Child Outcomes - BCSB 843,157 128,882 714,275 15% -1%WAGES - Children's Forum 448,587 121,206 327,381 27% 10%ELC Provider Mgmt & Screening 543,010 108,158 434,852 20% 3%ELC Provider Quality 342,128 90,363 251,765 26% 10%ELC PQI & Data Mgmt 224,107 72,044 152,063 32% 15%ELC Other Grants (PICH/PFPP) 1,387,792 233,724 1,154,068 17% 0%
Sub-Total Quality & Grants 5,701,600 1,196,026 4,505,574 21% 4%Total Program Services 91,647,298$ 21,249,906$ 70,397,391$ 23% 7%
Early Learning Coalition of Broward County, Inc.FY 2016-2017 Annual Budget to Actual (Budgetary Basis)
7
For The Month Ended September 30, 2016
Page 45 of 82
FY 2017 Annual Budget
YTD Actual Balance % of
Budget
Variance From YTD
Target: 17%
Early Learning Coalition of Broward County, Inc.FY 2016-2017 Annual Budget to Actual (Budgetary Basis)
For The Month Ended September 30, 2016
Administration:Employee Salaries 999,820$ 214,213$ 785,607$ 21% 5%Employee Fringes 400,438 71,268 329,170 18% 1%Legal Fees 62,250 10,063 52,188 16% -1%Auditors 31,000 14,000 17,000 45% 28%Accreditation Cost 400 - 400 0% -17%Other Consultants 40,800 31,124 9,676 76% 60%Insurance 11,081 2,363 8,718 21% 5%Travel 22,291 1,958 20,333 9% -8%Repairs/Maint & Utilities 5,912 934 4,978 16% -1%Rental - Equip & Facility 155,110 36,805 118,305 24% 7%Communications 39,232 6,534 32,698 17% 0%Advertising/Printing 18,000 10,638 7,362 59% 42%Other: Supplies/Subscription etc. 49,723 48,332 1,391 97% 81%Depreciation 11,040 - 11,040 0% -17%
Total Administration Expenses 1,847,097$ 448,230$ 1,398,867$ 24% 8%
Capital Outlay:Computer Hardware/Software 53,846$ -$ 53,846$ 0% -17%Furniture/ Equipment 19,600 - 19,600 0% -17%
Total Capital Outlay 73,446 - 73,446 0% -17%
1,920,542 448,230 1,472,312 23% 7%
Total Expenses 93,567,840$ 21,698,136$ 71,869,703$ 23% 7%
8
Notes on page 9 are an integral part of this Financial Statement.
Page 46 of 82

(1)
(2)
(3)
(4)
The full accrual basis of accounting is utilized by ELC. Under the accrual basis,
revenues are recognized in the accounting period in which they are earned. Expenses
are recognized in the accounting period in which the liability is incurred.
Early Learning Coalition of Broward County, Inc. Notes to the Financial Statements
For The Third Month Ended September 30, 2016
The Early Learning Coalition of Broward County ("ELC") budgets, as revenue, 100% ofthe OEL Funding Agreement. Revenue from the Office of Early Learning (OEL)comprises both federal and state funds.
State law requires that VPK providers receive a prepayment at the beginning of eachmonth. During the fiscal year, these expenditures are reported as revenue and expensewhen they are incurred. At year end, any outstanding balances will be recorded to thecorresponding asset and liability account.
The Net Assets Undesignated represents .24% of the total Operating Budget.
Page 47 of 82

INTERIM FINANCIAL STATEMENTSFISCAL YEAR 2016-2017
For The Fourth Month Ended October 31, 2016
Page 48 of 82

Page
Financial Summary……………………………………………………………………………… 2
Statement of Financial Position……………………………………………………………… 3
Statement of Activities…………………………………………………………………………… 4
Budget to Actual (Budgetary Basis) - Monthly and Year to Date ………………………………………………………………… 5-6
Budget to Actual (Budgetary Basis) - Annualized Fiscal Year End……………………………………………………………… 7-8
Notes to the Financial Statements…………………………………………………………… 9
Early Learning Coalition of Broward County, Inc.Table of Contents
For The Fourth Month Ended October 31, 2016
Page 49 of 82
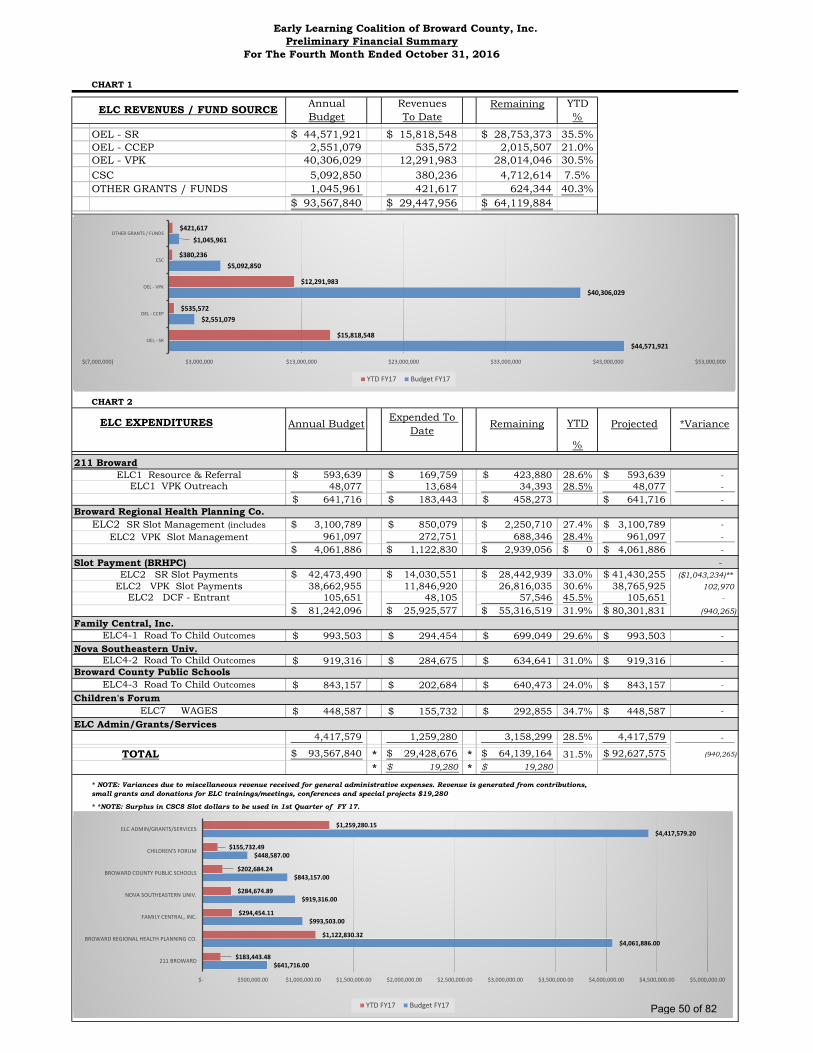
CHART 1
Annual Revenues YTDBudget To Date %
OEL - SR 44,571,921$ 15,818,548$ 28,753,373$ 35.5%OEL - CCEP 2,551,079 535,572 2,015,507 21.0%OEL - VPK 40,306,029 12,291,983 28,014,046 30.5%CSC 5,092,850 380,236 4,712,614 7.5%OTHER GRANTS / FUNDS 1,045,961 421,617 624,344 40.3%
93,567,840$ 29,447,956$ 64,119,884$ 64,119,884$
-
CHART 2
Annual Budget Expended To Date
Remaining YTD Projected *Variance
%
211 Broward593,639$ 169,759$ 423,880$ 28.6% 593,639$ - 48,077 13,684 34,393 28.5% 48,077 -
641,716$ 183,443$ 458,273$ 641,716$ - Broward Regional Health Planning Co.
3,100,789$ 850,079$ 2,250,710$ 27.4% 3,100,789$ - 961,097 272,751 688,346 28.4% 961,097 -
4,061,886$ 1,122,830$ 2,939,056$ 0$ 4,061,886$ - -
42,473,490$ 14,030,551$ 28,442,939$ 33.0% 41,430,255$ ($1,043,234)**38,662,955 11,846,920 26,816,035 30.6% 38,765,925 102,970
105,651 48,105 57,546 45.5% 105,651 -
81,242,096$ 25,925,577$ 55,316,519$ 31.9% 80,301,831$ (940,265) Family Central, Inc.
993,503$ 294,454$ 699,049$ 29.6% 993,503$ - Nova Southeastern Univ.
919,316$ 284,675$ 634,641$ 31.0% 919,316$ - Broward County Public Schools
843,157$ 202,684$ 640,473$ 24.0% 843,157$ - Children's Forum
448,587$ 155,732$ 292,855$ 34.7% 448,587$ -
4,417,579 1,259,280 3,158,299 28.5% 4,417,579 -
TOTAL 93,567,840$ * 29,428,676$ * 64,139,164$ 31.5% 92,627,575$ (940,265)
* 19,280$ * 19,280$
For The Fourth Month Ended October 31, 2016
Early Learning Coalition of Broward County, Inc.Preliminary Financial Summary
*
ELC2 SR Slot Payments
ELC7 WAGES
Slot Payment (BRHPC)
ELC Admin/Grants/Services
ELC4-3 Road To Child Outcomes
ELC2 DCF - Entrant
ELC4-1 Road To Child Outcomes
ELC2 VPK Slot Payments
* *NOTE: Surplus in CSC8 Slot dollars to be used in 1st Quarter of FY 17.
* NOTE: Variances due to miscellaneous revenue received for general administrative expenses. Revenue is generated from contributions,small grants and donations for ELC trainings/meetings, conferences and special projects $19,280
ELC4-2 Road To Child Outcomes
Remaining
ELC2 VPK Slot Management
ELC REVENUES / FUND SOURCE
ELC2 SR Slot Management (includes
ELC1 Resource & ReferralELC1 VPK Outreach
ELC EXPENDITURES
$44,571,921
$2,551,079
$40,306,029
$5,092,850
$1,045,961
$15,818,548
$535,572
$12,291,983
$380,236
$421,617
$(7,000,000) $3,000,000 $13,000,000 $23,000,000 $33,000,000 $43,000,000 $53,000,000
OEL - SR
OEL - CCEP
OEL - VPK
CSC
OTHER GRANTS / FUNDS
YTD FY17 Budget FY17
$641,716.00
$4,061,886.00
$993,503.00
$919,316.00
$843,157.00
$448,587.00
$4,417,579.20
$183,443.48
$1,122,830.32
$294,454.11
$284,674.89
$202,684.24
$155,732.49
$1,259,280.15
$- $500,000.00 $1,000,000.00 $1,500,000.00 $2,000,000.00 $2,500,000.00 $3,000,000.00 $3,500,000.00 $4,000,000.00 $4,500,000.00 $5,000,000.00
211 BROWARD
BROWARD REGIONAL HEALTH PLANNING CO.
FAMILY CENTRAL, INC.
NOVA SOUTHEASTERN UNIV.
BROWARD COUNTY PUBLIC SCHOOLS
CHILDREN'S FORUM
ELC ADMIN/GRANTS/SERVICES
YTD FY17 Budget FY17 Page 50 of 82

Summary:Cash Balance 10,014,747$ Total Assets 21,652,508 Total Liabilities 21,281,142 Total Fund Equity 371,366$
October 31, 2016 October 31, 2015
ASSETS
Assets:Cash 10,014,747$ 9,006,943$ Petty Cash 100 100 Advance, Interest & Accounts Receivable 7,764,341 8,942,107 Due From Other Agencies 3,811,758 3,813,325 Prepaid Expenses 50,804 44,110
Property & Equipment, Net 10,758 18,256 Assets 21,652,508$ 21,824,841$
Liabilities:Accounts Payable 135,606$ 8,051$ Salary & Fringe Benefits Payable 2,355 (43) Due to 211 Broward 89,683 93,498 Due to Broward County School Board 147,386 141,195 Due to Broward Regional Health Planning Council 13,554,144 13,946,146 Due to Children's Forum 65,978 31,652 Due to Family Central, Inc. 151,952 157,250 Due to NSU 140,644 72,553 Due to Other Agencies 16,636.34 33,306.43 Deferred Revenue 6,976,759 6,976,916
Total Liabilities 21,281,142$ 21,460,524$
Net Assets : (Note 3)Designated for Program Enhancement - - Designated for eligible child care slots 114,994$ 114,944$ Equity in Fixed Assets 22,277 22,277 Fund Balance Undesignated 234,095 227,096
Net Assets 371,366$ 364,317$
Total Liabilities and Fund Equity 21,652,508$ 21,824,841$
Notes on page 9 are an integral part of this Financial Statement.
Early Learning Coalition of Broward County, Inc.FY 2016-2017 Statement of Financial Position
As Of October 31, 2016
Page 51 of 82

October 2016 Actual
FY 2017 YTD Actual
FY 2016 YTD Actual
Revenues & supportGrants and other income
Federal grants 3,457,870$ 16,409,188$ 15,930,217$ State grants 3,819,884 12,291,983 11,954,014 Children's Services Council of Broward 341,218 380,236 2,578,210 Miscellaneous 126,867.68 366,549 46,853
Total grants and other income 7,745,840 29,447,956 30,509,294 Interest on Investments - - 81
Total revenues & support 7,745,840$ 29,447,956$ 30,509,374$
Expenses:Program services:
School Readiness 3,328,407$ 14,880,630$ 16,862,802$ Voluntary Pre-kindergarten (Note 4) 3,791,683 12,119,671 11,732,037 Entrant Refugee Services BRHPC 13,404 48,105 - Program support and administration 290,285.77 1,120,989 1,087,936 Community Transformation Grants/PFPP 108,758.93 342,483 30,362 Quality Enhancement Programs 59,056.86 329,621 229,396
Total program services 7,591,595$ 28,841,501$ 29,942,532$
Supporting services:General and administrative 137,623$ 587,175$ 556,016$
Total supporting services 137,622.85 587,175 556,016
Total expenses 7,729,217.82 29,428,676 30,498,548
Change in net assets 16,621.71$ 19,280$ 10,826$
Net assets, beginning of year 352,086 353,491
Net assets, end of the period 371,366$ 364,317$
Notes on page 9 are an integral part of this Financial Statement.
Early Learning Coalition of Broward County, Inc.FY 2016-2017 Statement of Activities
.
4
For The Month Ended October 31, 2016
Page 52 of 82
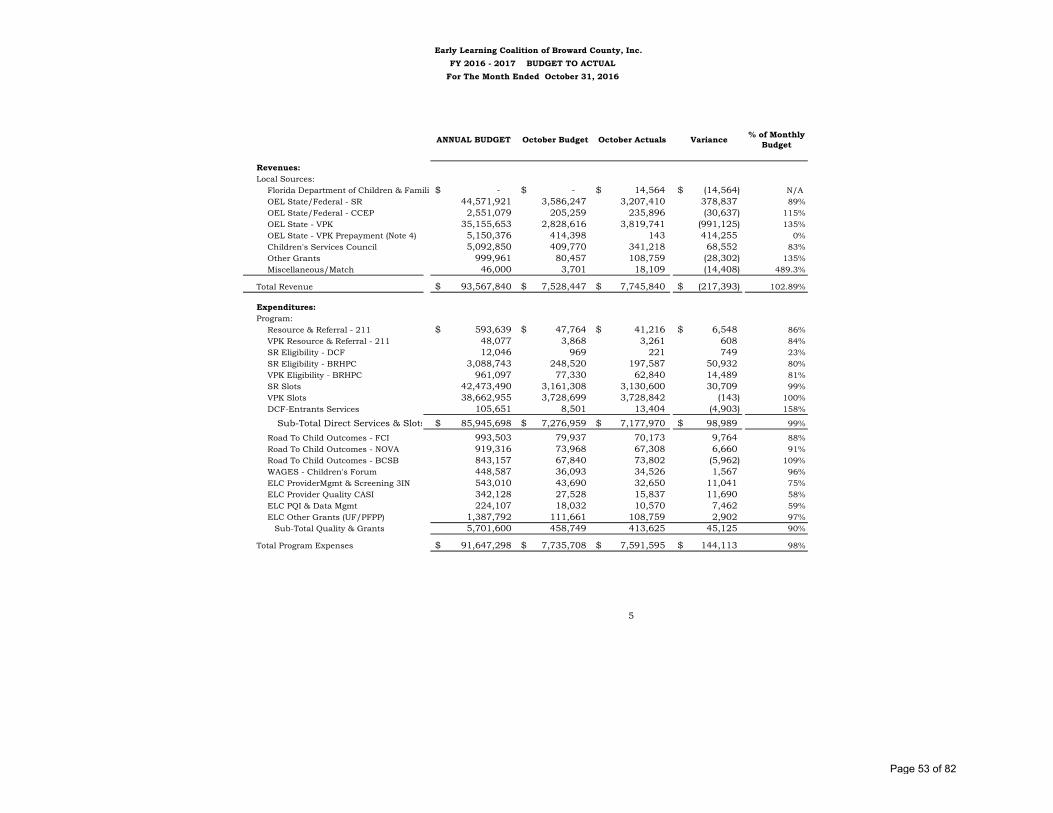
ANNUAL BUDGET October Budget October Actuals Variance % of Monthly Budget
Revenues:Local Sources:
Florida Department of Children & Familie -$ -$ 14,564$ (14,564)$ N/A OEL State/Federal - SR 44,571,921 3,586,247 3,207,410 378,837 89%OEL State/Federal - CCEP 2,551,079 205,259 235,896 (30,637) 115%OEL State - VPK 35,155,653 2,828,616 3,819,741 (991,125) 135%OEL State - VPK Prepayment (Note 4) 5,150,376 414,398 143 414,255 0%Children's Services Council 5,092,850 409,770 341,218 68,552 83%Other Grants 999,961 80,457 108,759 (28,302) 135%Miscellaneous/Match 46,000 3,701 18,109 (14,408) 489.3%
Total Revenue 93,567,840$ 7,528,447$ 7,745,840$ (217,393)$ 102.89%
Expenditures:Program:
Resource & Referral - 211 593,639$ 47,764$ 41,216$ 6,548$ 86%VPK Resource & Referral - 211 48,077 3,868 3,261 608 84%SR Eligibility - DCF 12,046 969 221 749 23%SR Eligibility - BRHPC 3,088,743 248,520 197,587 50,932 80%VPK Eligibility - BRHPC 961,097 77,330 62,840 14,489 81%SR Slots 42,473,490 3,161,308 3,130,600 30,709 99%VPK Slots 38,662,955 3,728,699 3,728,842 (143) 100%DCF-Entrants Services 105,651 8,501 13,404 (4,903) 158%
Sub-Total Direct Services & Slots 85,945,698$ 7,276,959$ 7,177,970$ 98,989$ 99%
Road To Child Outcomes - FCI 993,503 79,937 70,173 9,764 88%Road To Child Outcomes - NOVA 919,316 73,968 67,308 6,660 91%Road To Child Outcomes - BCSB 843,157 67,840 73,802 (5,962) 109%WAGES - Children's Forum 448,587 36,093 34,526 1,567 96%ELC ProviderMgmt & Screening 3IN 543,010 43,690 32,650 11,041 75%ELC Provider Quality CASI 342,128 27,528 15,837 11,690 58%ELC PQI & Data Mgmt 224,107 18,032 10,570 7,462 59%ELC Other Grants (UF/PFPP) 1,387,792 111,661 108,759 2,902 97%
Sub-Total Quality & Grants 5,701,600 458,749 413,625 45,125 90%
Total Program Expenses 91,647,298$ 7,735,708$ 7,591,595$ 144,113$ 98%
Note: Year to Date (YTD) budget amounts are adjusted to reflect actual and planned 5
Early Learning Coalition of Broward County, Inc.FY 2016 - 2017 BUDGET TO ACTUAL
For The Month Ended October 31, 2016
Page 53 of 82
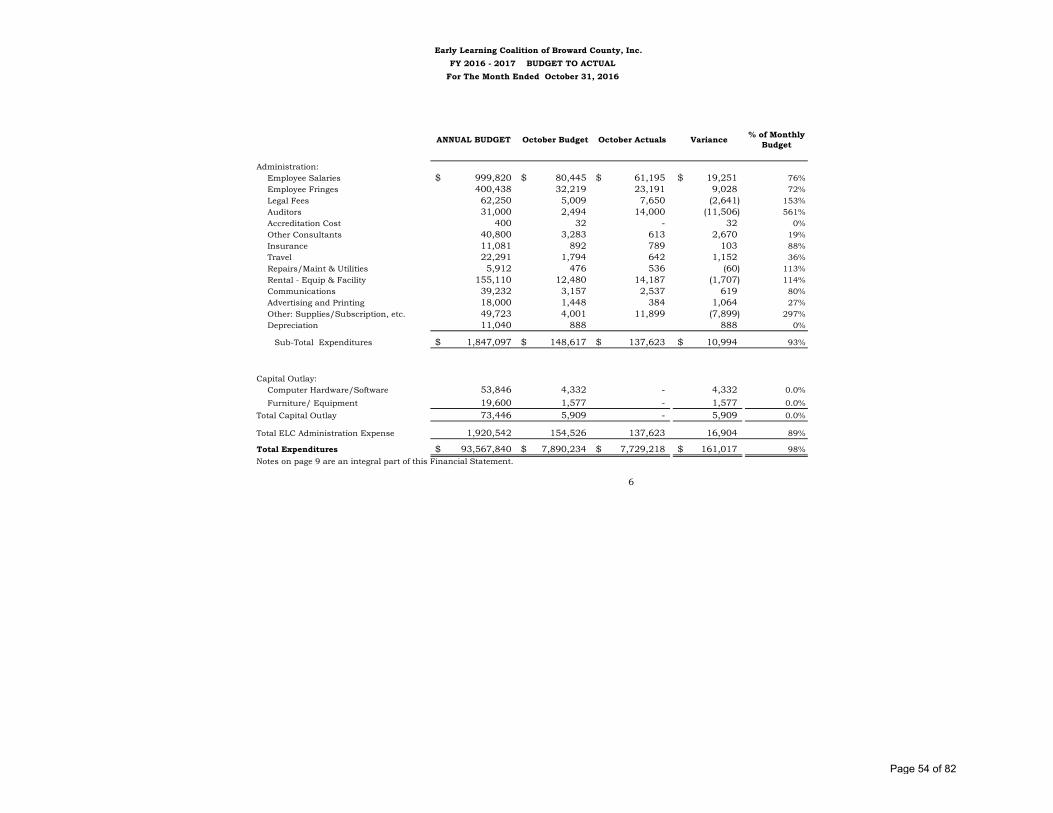
ANNUAL BUDGET October Budget October Actuals Variance % of Monthly Budget
Early Learning Coalition of Broward County, Inc.FY 2016 - 2017 BUDGET TO ACTUAL
For The Month Ended October 31, 2016
Administration:Employee Salaries 999,820$ 80,445$ 61,195$ 19,251$ 76%Employee Fringes 400,438 32,219 23,191 9,028 72%Legal Fees 62,250 5,009 7,650 (2,641) 153%Auditors 31,000 2,494 14,000 (11,506) 561%Accreditation Cost 400 32 - 32 0%Other Consultants 40,800 3,283 613 2,670 19%Insurance 11,081 892 789 103 88%Travel 22,291 1,794 642 1,152 36%Repairs/Maint & Utilities 5,912 476 536 (60) 113%Rental - Equip & Facility 155,110 12,480 14,187 (1,707) 114%Communications 39,232 3,157 2,537 619 80%Advertising and Printing 18,000 1,448 384 1,064 27%Other: Supplies/Subscription, etc. 49,723 4,001 11,899 (7,899) 297%Depreciation 11,040 888 888 0%
Sub-Total Expenditures 1,847,097$ 148,617$ 137,623$ 10,994$ 93%
Capital Outlay:Computer Hardware/Software 53,846 4,332 - 4,332 0.0%Furniture/ Equipment 19,600 1,577 - 1,577 0.0%
Total Capital Outlay 73,446 5,909 - 5,909 0.0%
Total ELC Administration Expense 1,920,542 154,526 137,623 16,904 89%
Total Expenditures 93,567,840$ 7,890,234$ 7,729,218$ 161,017$ 98%Notes on page 9 are an integral part of this Financial Statement.
6
Page 54 of 82
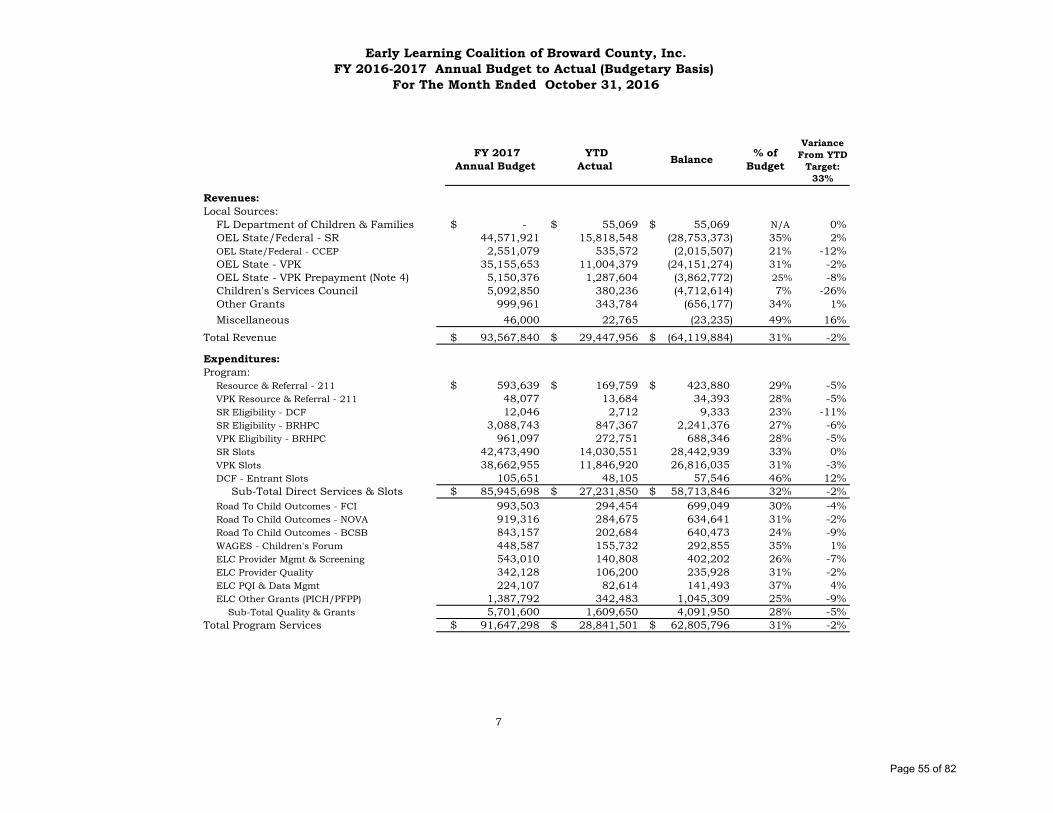
FY 2017 Annual Budget
YTD Actual Balance % of
Budget
Variance From YTD
Target: 33%
Revenues:Local Sources:
FL Department of Children & Families -$ 55,069$ 55,069$ N/A 0%OEL State/Federal - SR 44,571,921 15,818,548 (28,753,373) 35% 2%OEL State/Federal - CCEP 2,551,079 535,572 (2,015,507) 21% -12%OEL State - VPK 35,155,653 11,004,379 (24,151,274) 31% -2%OEL State - VPK Prepayment (Note 4) 5,150,376 1,287,604 (3,862,772) 25% -8%Children's Services Council 5,092,850 380,236 (4,712,614) 7% -26%Other Grants 999,961 343,784 (656,177) 34% 1%Miscellaneous 46,000 22,765 (23,235) 49% 16%
Total Revenue 93,567,840$ 29,447,956$ (64,119,884)$ 31% -2%
Expenditures:Program:
Resource & Referral - 211 593,639$ 169,759$ 423,880$ 29% -5%VPK Resource & Referral - 211 48,077 13,684 34,393 28% -5%SR Eligibility - DCF 12,046 2,712 9,333 23% -11%SR Eligibility - BRHPC 3,088,743 847,367 2,241,376 27% -6%VPK Eligibility - BRHPC 961,097 272,751 688,346 28% -5%SR Slots 42,473,490 14,030,551 28,442,939 33% 0%VPK Slots 38,662,955 11,846,920 26,816,035 31% -3%DCF - Entrant Slots 105,651 48,105 57,546 46% 12%
Sub-Total Direct Services & Slots 85,945,698$ 27,231,850$ 58,713,846$ 32% -2%Road To Child Outcomes - FCI 993,503 294,454 699,049 30% -4%Road To Child Outcomes - NOVA 919,316 284,675 634,641 31% -2%Road To Child Outcomes - BCSB 843,157 202,684 640,473 24% -9%WAGES - Children's Forum 448,587 155,732 292,855 35% 1%ELC Provider Mgmt & Screening 543,010 140,808 402,202 26% -7%ELC Provider Quality 342,128 106,200 235,928 31% -2%ELC PQI & Data Mgmt 224,107 82,614 141,493 37% 4%ELC Other Grants (PICH/PFPP) 1,387,792 342,483 1,045,309 25% -9%
Sub-Total Quality & Grants 5,701,600 1,609,650 4,091,950 28% -5%Total Program Services 91,647,298$ 28,841,501$ 62,805,796$ 31% -2%
Early Learning Coalition of Broward County, Inc.FY 2016-2017 Annual Budget to Actual (Budgetary Basis)
7
For The Month Ended October 31, 2016
Page 55 of 82

FY 2017 Annual Budget
YTD Actual Balance % of
Budget
Variance From YTD
Target: 33%
Early Learning Coalition of Broward County, Inc.FY 2016-2017 Annual Budget to Actual (Budgetary Basis)
For The Month Ended October 31, 2016
Administration:Employee Salaries 999,820$ 275,408$ 724,412$ 28% -6%Employee Fringes 400,438 94,459 305,979 24% -10%Legal Fees 62,250 17,713 44,538 28% -5%Auditors 31,000 28,000 3,000 90% 57%Accreditation Cost 400 - 400 0% -33%Other Consultants 40,800 31,736 9,064 78% 44%Insurance 11,081 3,152 7,929 28% -5%Travel 22,291 2,600 19,691 12% -22%Repairs/Maint & Utilities 5,912 1,470 4,442 25% -8%Rental - Equip & Facility 155,110 50,993 104,117 33% 0%Communications 39,232 9,071 30,161 23% -10%Advertising/Printing 18,000 11,022 6,978 61% 28%Other: Supplies/Subscription etc. 49,723 61,553 (11,830) 124% 90%Depreciation 11,040 - 11,040 0% -33%
Total Administration Expenses 1,847,097$ 587,175$ 1,259,921$ 32% -2%
Capital Outlay:Computer Hardware/Software 53,846$ -$ 53,846$ 0% -33%Furniture/ Equipment 19,600 - 19,600 0% -33%
Total Capital Outlay 73,446 - 73,446 0% -33%
1,920,542 587,175 1,333,367 31% -3%
Total Expenses 93,567,840$ 29,428,676$ 64,139,163$ 31% -2%
8
Notes on page 9 are an integral part of this Financial Statement.
Page 56 of 82

(1)
(2)
(3)
(4)
The full accrual basis of accounting is utilized by ELC. Under the accrual basis,
revenues are recognized in the accounting period in which they are earned. Expenses
are recognized in the accounting period in which the liability is incurred.
Early Learning Coalition of Broward County, Inc. Notes to the Financial Statements
For The Fourth Month Ended October 31, 2016
The Early Learning Coalition of Broward County ("ELC") budgets, as revenue, 100% ofthe OEL Funding Agreement. Revenue from the Office of Early Learning (OEL)comprises both federal and state funds.
State law requires that VPK providers receive a prepayment at the beginning of eachmonth. During the fiscal year, these expenditures are reported as revenue and expensewhen they are incurred. At year end, any outstanding balances will be recorded to thecorresponding asset and liability account.
The Net Assets Undesignated represents .24% of the total Operating Budget.
Page 57 of 82

Submitted to the January 25, 2017 Finance Committee Meeting
INTERIM FINANCIAL STATEMENTS
For The Fifth Month Ended November 30, 2016FISCAL YEAR 2016-2017
Page 58 of 82

Page
Financial Summary……………………………………………………………………………… 2
Statement of Financial Position……………………………………………………………… 3
Statement of Activities…………………………………………………………………………… 4
Budget to Actual (Budgetary Basis) - Monthly and Year to Date ………………………………………………………………… 5-6
Budget to Actual (Budgetary Basis) - Annualized Fiscal Year End……………………………………………………………… 7-8
Notes to the Financial Statements…………………………………………………………… 9
Early Learning Coalition of Broward County, Inc.Table of Contents
For The Fifth Month Ended November 30, 2016
Page 59 of 82

CHART 1
Annual Revenues YTDBudget To Date %
OEL - SR 44,571,921$ 19,203,544$ 25,368,377$ 43.1%OEL - CCEP 2,551,079 758,612 1,792,467 29.7%OEL - VPK 40,306,029 15,931,597 24,374,432 39.5%CSC 5,092,850 784,163 4,308,687 15.4%OTHER GRANTS / FUNDS 1,045,961 458,594 587,367 43.8%
93,567,840$ 37,136,511$ 56,431,329$ 56,431,329$
-
CHART 2
Annual Budget Expended To Date
Remaining YTD Projected *Variance
%
211 Broward593,639$ 208,874$ 384,765$ 35.2% 593,639$ - 48,077 16,995 31,082 35.3% 48,077 -
641,716$ 225,869$ 415,847$ 641,716$ - Broward Regional Health Planning Co.
3,100,789$ 1,105,869$ 1,994,920$ 35.7% 3,100,789$ - 961,097 354,198 606,899 36.9% 961,097 -
4,061,886$ 1,460,067$ 2,601,819$ 35.9% 4,061,886$ - -
42,473,490$ 17,339,498$ 25,133,992$ 40.8% 41,430,255$ ($1,043,234)**38,662,955 15,377,597 23,285,358 39.8% 38,765,925 102,970
105,651 61,861 43,790 58.6% 105,651 -
81,242,096$ 32,778,956$ 48,463,140$ 40.3% 80,301,831$ (940,265) Family Central, Inc.
993,503$ 367,708$ 625,795$ 37.0% 993,503$ - Nova Southeastern Univ.
919,316$ 354,639$ 564,677$ 38.6% 919,316$ - Broward County Public Schools
843,157$ 283,563$ 559,594$ 33.6% 843,157$ - Children's Forum
448,587$ 178,089$ 270,498$ 39.7% 448,587$ -
4,417,579 1,453,811 2,963,768 32.9% 4,417,579 -
TOTAL 93,567,840$ * 37,102,701$ * 56,465,139$ 39.7% 92,627,575$ (940,265)
* 33,809$ * 33,809$
For The Fifth Month Ended November 30, 2016
Early Learning Coalition of Broward County, Inc.Preliminary Financial Summary
*
ELC2 SR Slot Payments
ELC7 WAGES
Slot Payment (BRHPC)
ELC Admin/Grants/Services
ELC4-3 Road To Child Outcomes
ELC2 DCF - Entrant
ELC4-1 Road To Child Outcomes
ELC2 VPK Slot Payments
* *NOTE: Surplus in CSC8 Slot dollars to be used in 1st Quarter of FY 17.
* NOTE: Variances due to miscellaneous revenue received for general administrative expenses. Revenue is generated from contributions,small grants and donations for ELC trainings/meetings, conferences and special projects $33,809
ELC4-2 Road To Child Outcomes
Remaining
ELC2 VPK Slot Management
ELC REVENUES / FUND SOURCE
ELC2 SR Slot Management (includes
ELC1 Resource & ReferralELC1 VPK Outreach
ELC EXPENDITURES
$44,571,921
$2,551,079
$40,306,029
$5,092,850
$1,045,961
$19,203,544
$758,612
$15,931,597
$784,163
$458,594
$(7,000,000) $3,000,000 $13,000,000 $23,000,000 $33,000,000 $43,000,000 $53,000,000
OEL - SR
OEL - CCEP
OEL - VPK
CSC
OTHER GRANTS / FUNDS
YTD FY17 Budget FY17
$641,716.00
$4,061,886.00
$993,503.00
$919,316.00
$843,157.00
$448,587.00
$4,417,579.20
$225,868.97
$1,460,066.70
$367,708.17
$354,638.66
$283,563.03
$178,088.90
$1,453,810.73
$- $500,000.00 $1,000,000.00 $1,500,000.00 $2,000,000.00 $2,500,000.00 $3,000,000.00 $3,500,000.00 $4,000,000.00 $4,500,000.00 $5,000,000.00
211 BROWARD
BROWARD REGIONAL HEALTH PLANNING CO.
FAMILY CENTRAL, INC.
NOVA SOUTHEASTERN UNIV.
BROWARD COUNTY PUBLIC SCHOOLS
CHILDREN'S FORUM
ELC ADMIN/GRANTS/SERVICES
YTD FY17 Budget FY17 Page 60 of 82
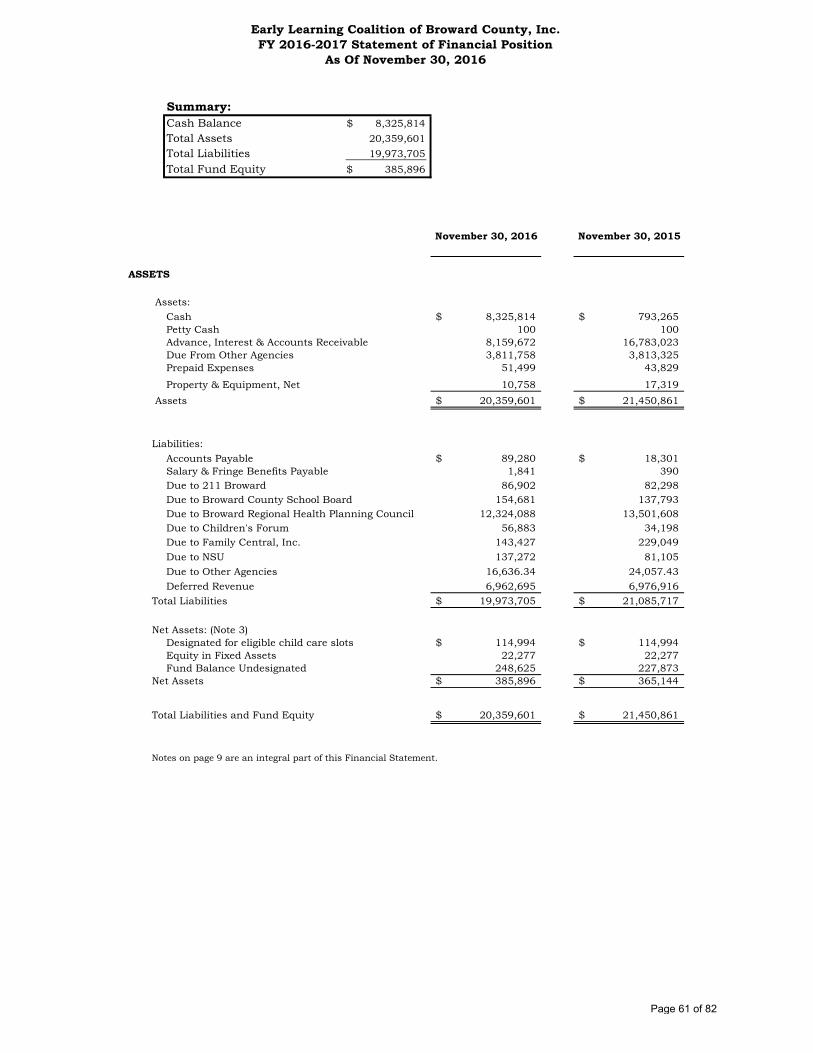
Summary:Cash Balance 8,325,814$ Total Assets 20,359,601 Total Liabilities 19,973,705 Total Fund Equity 385,896$
November 30, 2016 November 30, 2015
ASSETS
Assets:Cash 8,325,814$ 793,265$ Petty Cash 100 100 Advance, Interest & Accounts Receivable 8,159,672 16,783,023 Due From Other Agencies 3,811,758 3,813,325 Prepaid Expenses 51,499 43,829
Property & Equipment, Net 10,758 17,319 Assets 20,359,601$ 21,450,861$
Liabilities:Accounts Payable 89,280$ 18,301$ Salary & Fringe Benefits Payable 1,841 390 Due to 211 Broward 86,902 82,298 Due to Broward County School Board 154,681 137,793 Due to Broward Regional Health Planning Council 12,324,088 13,501,608 Due to Children's Forum 56,883 34,198 Due to Family Central, Inc. 143,427 229,049 Due to NSU 137,272 81,105 Due to Other Agencies 16,636.34 24,057.43 Deferred Revenue 6,962,695 6,976,916
Total Liabilities 19,973,705$ 21,085,717$
Net Assets: (Note 3)Designated for eligible child care slots 114,994$ 114,994$ Equity in Fixed Assets 22,277 22,277 Fund Balance Undesignated 248,625 227,873
Net Assets 385,896$ 365,144$
Total Liabilities and Fund Equity 20,359,601$ 21,450,861$
Notes on page 9 are an integral part of this Financial Statement.
Early Learning Coalition of Broward County, Inc.FY 2016-2017 Statement of Financial Position
As Of November 30, 2016
Page 61 of 82

November 2016 Actual
FY 2017 YTD Actual
FY 2016 YTD Actual
Revenues & supportGrants and other income
Federal grants 3,624,155$ 20,033,343$ 19,628,208$ State grants 3,639,614 15,931,597 15,570,015 Children's Services Council of Broward 403,927 784,163 3,099,841 Miscellaneous 20,858.11 387,407 64,283
Total grants and other income 7,688,554 37,136,511 38,362,347 Interest on Investments - - 107
Total revenues & support 7,688,554$ 37,136,511$ 38,362,455$
Expenses:Program services:
School Readiness 3,564,737$ 18,445,367$ 20,661,037$ Voluntary Pre-kindergarten (Note 4) 3,612,123 15,731,795 15,304,470 Entrant Refugee Services BRHPC 13,756 61,861 Program support and administration 288,878.52 1,409,868 1,385,375 Community Transformation Grants/PFPP 2,301.95 344,785 45,061 Quality Enhancement Programs 68,142.06 397,763 301,731
Total program services 7,549,938$ 36,391,439$ 37,697,673$
Supporting services:General and administrative 124,087$ 711,262$ 653,128$
Total supporting services 124,086.57 711,262 653,128
Total expenses 7,674,024.75 37,102,701 38,350,801
Change in net assets 14,529.62$ 33,809$ 11,654$
Net assets, beginning of year 352,086 353,491
Net assets, end of the period 385,896$ 365,144$
Notes on page 9 are an integral part of this Financial Statement.
Early Learning Coalition of Broward County, Inc.FY 2016-2017 Statement of Activities
4
For The Month Ended November 30, 2016
Page 62 of 82

ANNUAL BUDGET November Budget
November Actual Variance % of Monthly
Budget
Revenues:Local Sources:
Florida Department of Children & Fa -$ -$ 16,118$ 16,118$ N/A OEL State/Federal - SR 44,571,921 3,757,020 3,384,996 (372,024) 90%OEL State/Federal - CCEP 2,551,079 215,033 223,041 8,007 104%OEL State - VPK 35,155,653 2,963,312 3,639,614 676,303 123%OEL State - VPK Prepayment (Note 4) 5,150,376 434,131 (434,131) 0%Children's Services Council 5,092,850 429,282 403,927 (25,355) 94%Other Grants 999,961 84,288 2,302 (81,986) 3%Miscellaneous/Match 46,000 3,877 18,556 14,679 478.6%
Total Revenue 93,567,840$ 7,886,944$ 7,688,554$ (198,390)$ 97.48%
Expenditures:Program:
Resource & Referral - 211 593,639$ 50,039$ 39,115$ 10,924$ 78%VPK Resource & Referral - 211 48,077 4,052 3,311 742 82%SR Eligibility - DCF 12,046 1,015 1,158 (143) 114%SR Eligibility - BRHPC 3,088,743 260,354 254,632 5,722 98%VPK Eligibility - BRHPC 961,097 81,012 81,447 (435) 101%SR Slots 42,473,490 3,308,947 3,308,947 - 100%VPK Slots 38,662,955 3,744,115 3,530,676 213,439 94%DCF-Entrants Services 105,651 8,905 13,756 (4,850) 154%
Sub-Total Direct Services & Slots 85,945,698$ 7,458,440$ 7,233,041$ 225,399$ 97%Road To Child Outcomes - FCI 993,503 83,744 73,254 10,489 87%Road To Child Outcomes - NOVA 919,316 77,490 69,964 7,526 90%Road To Child Outcomes - BCSB 843,157 71,071 80,879 (9,808) 114%WAGES - Children's Forum 448,587 37,812 22,356 15,456 59%ELC ProviderMgmt & Screening 3IN 543,010 45,771 51,236 (5,465) 112%ELC Provider Quality CASI 342,128 28,838 12,291 16,547 43%ELC PQI & Data Mgmt 224,107 18,890 4,615 14,276 24%ELC Other Grants (UF/PFPP) 1,387,792 116,979 2,302 114,677 2%
Sub-Total Quality & Grants 5,701,600 480,595 316,897 163,698 66%
Total Program Expenses 91,647,298$ 7,939,035$ 7,549,938$ 389,097$ 95%
5
Early Learning Coalition of Broward County, Inc.FY 2016 - 2017 BUDGET TO ACTUAL
For The Month Ended November 30, 2016
Page 63 of 82

ANNUAL BUDGET November Budget
November Actual Variance % of Monthly
Budget
Early Learning Coalition of Broward County, Inc.FY 2016 - 2017 BUDGET TO ACTUAL
For The Month Ended November 30, 2016
Administration:Employee Salaries 999,820$ 84,276$ 69,762$ 14,514$ 83%Employee Fringes 400,438 33,753 28,398 5,356 84%Legal Fees 62,250 5,247 6,163 (915) 117%Auditors 31,000 2,613 2,613 0%Accreditation Cost 400 34 400 (366) 1186%Other Consultants 40,800 3,439 3,125 314 91%Insurance 11,081 934 789 145 84%Travel 22,291 1,879 364 1,515 19%Repairs/Maint & Utilities 5,912 498 304 195 61%Rental - Equip & Facility 155,110 13,074 1,595 11,479 12%Communications 39,232 3,307 2,767 540 84%Advertising and Printing 18,000 1,517 - 1,517 0%Other: Supplies/Subscription, etc. 49,723 4,191 10,420 (6,229) 249%Depreciation 11,040 931 931 0%
Sub-Total Expenditures 1,847,097$ 155,694$ 124,087$ 31,607$ 80%
Capital Outlay:Computer Hardware/Software 53,846 4,539 - 4,539 0.0%Furniture/ Equipment 19,600 1,652 - 1,652 0.0%
Total Capital Outlay 73,446 6,191 - 6,191 0.0%
Total ELC Administration Expense 1,920,542 161,885 124,087 16,904 77%
Total Expenditures 93,567,840$ 8,100,920$ 7,674,025$ 406,000$ 95%
(*) Note: Line Item re-allocated in accordance to Fiscal PoliciesNote: Year to Date (YTD) budget amounts are adjusted to reflect actual and planned activity.Notes on page 9 are an integral part of this Financial Statement.
6
Page 64 of 82

FY 2017 Annual Budget
YTD Actual Balance % of
Budget
Variance From YTD
Target: 42%
Revenues:Local Sources:
FL Department of Children & Families -$ 71,187$ (71,187)$ N/A 0%OEL State/Federal - SR 44,571,921 19,203,544 25,368,377 43% 1%OEL State/Federal - CCEP 2,551,079 758,612 1,792,467 30% -12%OEL State - VPK 35,155,653 14,643,993 20,511,660 42% 0%OEL State - VPK Prepayment (Note 4) 5,150,376 1,287,604 3,862,772 25% -17%Children's Services Council 5,092,850 784,163 4,308,687 15% -26%Other Grants 999,961 346,086 653,875 35% -7%Miscellaneous 46,000 41,321 4,679 90% 48%
Total Revenue 93,567,840$ 37,136,511$ 56,431,329$ 40% -2%
Expenditures:Program:
Resource & Referral - 211 593,639$ 208,874$ 384,765$ 35% -6%VPK Resource & Referral - 211 48,077 16,995 31,082 35% -6%SR Eligibility - DCF 12,046 3,870 8,175 32% -10%SR Eligibility - BRHPC 3,088,743 1,101,999 1,986,744 36% -6%VPK Eligibility - BRHPC 961,097 354,198 606,899 37% -5%SR Slots 42,473,490 17,339,498 25,133,992 41% -1%VPK Slots 38,662,955 15,377,597 23,285,358 40% -2%DCF - Entrant Slots 105,651 61,861 43,790 59% 17%
Sub-Total Direct Services & Slots 85,945,698$ 34,464,892$ 51,480,805$ 40% -2%Road To Child Outcomes - FCI 993,503 367,708 625,795 37% -5%Road To Child Outcomes - NOVA 919,316 354,639 564,677 39% -3%Road To Child Outcomes - BCSB 843,157 283,563 559,594 34% -8%WAGES - Children's Forum 448,587 178,089 270,498 40% -2%ELC Provider Mgmt & Screening 543,010 192,044 350,966 35% -6%ELC Provider Quality 342,128 118,491 223,637 35% -7%ELC PQI & Data Mgmt 224,107 87,228 136,879 39% -3%ELC Other Grants (PICH/PFPP) 1,387,792 344,785 1,043,007 25% -17%
Sub-Total Quality & Grants 5,701,600 1,926,547 3,775,053 34% -8%Total Program Services 91,647,298$ 36,391,439$ 55,255,858$ 40% -2%
Early Learning Coalition of Broward County, Inc.FY 2016-2017 Annual Budget to Actual (Budgetary Basis)
7
For The Month Ended November 30, 2016
Page 65 of 82

FY 2017 Annual Budget
YTD Actual Balance % of
Budget
Variance From YTD
Target: 42%
Early Learning Coalition of Broward County, Inc.FY 2016-2017 Annual Budget to Actual (Budgetary Basis)
For The Month Ended November 30, 2016
Administration:Employee Salaries 999,820$ 345,170$ 654,649$ 35% -7%Employee Fringes 400,438 122,857 277,581 31% -11%Legal Fees 62,250 23,875 38,375 38% -3%Auditors 31,000 28,000 3,000 90% 49%Accreditation Cost 400 400 - 100% 58%Other Consultants 40,800 34,861 5,939 85% 44%Insurance 11,081 3,941 7,140 36% -6%Travel 22,291 2,964 19,327 13% -28%Repairs/Maint & Utilities 5,912 1,773 4,139 30% -12%Rental - Equip & Facility 155,110 52,588 102,522 34% -8%Communications 39,232 11,838 27,394 30% -11%Advertising/Printing 18,000 11,022 6,978 61% 20%Other: Supplies/Subscription etc. 49,723 71,974 (22,251) 145% 103%Depreciation 11,040 - 11,040 0% -42%
Total Administration Expenses 1,847,097$ 711,262$ 1,135,835$ 39% -3%
Capital Outlay:Computer Hardware/Software 53,846$ -$ 53,846$ 0% -42%Furniture/ Equipment 19,600 - 19,600 0% -42%
Total Capital Outlay 73,446 - 73,446 0% -42%
1,920,542 711,262 1,209,280 37% -5%
Total Expenses 93,567,840$ 37,102,701$ 56,465,138$ 40% -2%
8
Notes on page 9 are an integral part of this Financial Statement.
Page 66 of 82
(1)
(2)
(3)
(4)
Early Learning Coalition of Broward County, Inc.
The full accrual basis of accounting is utilized by ELC. Under the accrual basis,
revenues are recognized in the accounting period in which they are earned. Expenses
are recognized in the accounting period in which the liability is incurred.
Notes to the Financial Statements
The Early Learning Coalition of Broward County ("ELC") budgets, as revenue, 100% ofthe OEL Funding Agreement. Revenue from the Office of Early Learning (OEL)comprises both federal and state funds.
For The Fifth Month Ended November 30, 2016
State law requires that VPK providers receive a prepayment at the beginning of eachmonth. During the fiscal year, these expenditures are reported as revenue and expensewhen they are incurred. At year end, any outstanding balances will be recorded to thecorresponding asset and liability account.
The Net Assets Undesignated represents .24% of the total Operating Budget.
Page 67 of 82

TAB 9
Early Learning Coalition of Broward County, Inc. Finance Committee Meeting
January 25, 2017
Subject: Initial Administrative Department Assessment
Background Information
In an effort to create a more efficient environment and fill operational gaps, ELC underwent a comprehensive reorganization. During that process, the CEO expressed concerns related to fiscal and contract operations and placed a high priority on making an assessment of risks and control issues and developing a plan for corrective action. An initial review of fiscal and contract operations conducted in December 2016 by the incoming Chief Administrative Officer at ELC has demonstrated the need for a comprehensive update and revision of the fiscal policy manual as well as the procedures related to it. It is expected to take six months to implement changes and present a finalized revision to the Governance Committee.
In particular, the following areas would benefit from improvements:
1. Cash and purchasing account control:
Cash disbursements and purchases are currently managed on an irregular, ad hoc schedule that allows little time for planning and careful review of the full cash in and outflow picture prior to deadlines or invoice due dates. Improvements will include (but will not be limited to):
• A structured cash “events” calendar,• A detailed monthly cash flow projection,• Better and more timely record-keeping in the financial database, and• A stronger culture of transparency and control, including staff training.
In the meantime, employee access to online cash transmission and purchasing portals has already been re-structured to:
• Implement dual custody and workflow authorization levels where ever possible;• Clean up user lists and permissions and develop a map that lists employee access
rights, identifies super-users and provides instructions for removing super-userswhen necessary for business continuity.
2. Purchasing, invoice and payment review/ authorization process:
The internal review and authorization process also lacks transparency and clear guidelines that staff need to ensure informed decision-making and efficiency at every
Page 68 of 82

level. The purchase order process is paper driven, poorly understood by staff, difficult to match against budgeting tools, difficult to track and sometimes results in partial, inaccurate or duplicate requests getting submitted hurriedly against looming deadlines. Invoice approval responsibilities are not formally assigned or well- understood by staff which creates a bureaucratic, sometimes chaotic collection of unnecessary forms and signatures. Cash disbursement authorization batches are not routinely scheduled with advance notice to signatories to ensure availability. Suggested improvements to these processes include:
• Updates to policies and procedures to clarify authorization thresholds, delegationof responsibilities, workflow and steps required for varying types of items.
• Staff training on the policies, purpose and best practices for each step in thepurchasing process;
• Implementation of existing electronic purchase order software with workflowauthorization and online tracking;
• Direct coordination between purchase order system and budget line item trackingtools with periodic review and updates;
• Clearer standards for back up documentation that accompanies requests includingbetter background information and context; and
• Fewer forms and coversheets to reduce confusing clutter.
3. Accounting, payroll processing and reporting:
In the inefficient environment created by the transaction bottlenecks described above, the task of recording transactions in the financial database has been relegated to a low priority and is frequently delayed at length, which in turn causes additional delays in financial reporting, budget/actual review, and cash flow analysis. Biweekly payroll, moreover, is processed twice using two separate, but parallel systems that require a lengthy manual reconciliation with one another; which particularly slows entry in the financial system and adds lag time to financial reporting. The pressure to complete reports on time, finally, leaves staff little or no opportunity to conduct routine monthly account reconciliations that are vital to catching errors and ensuring quality.
Suggested remedies to these problems include:
• Comprehensive one-time clean-up of entry errors found for the entire fiscal year.• Systematic requirement to record transactions in the financial database close to
real time, within one business day of the triggering event, with particular emphasison recording invoices due, cash events and invoices receivable;
• Cross-train staff in more than one portfolio of duties to ensure coverage andbusiness continuity when individuals are on leave or behind schedule;
• Eliminate redundant payroll processing system and maximize capability of livesystem to automate payroll data transfer;
Page 69 of 82

• Implement monthly closing procedures to create fixed dates after which financialstatements can be produced;
• Realign task distribution to improve segregation of duties and make logicalassignments of reconciliation responsibilities;
• Upload and maintain annual budgets and reforecasts directly into the financialsystem;
• Create financial statement templates in the financial software to facilitate ad hocanalysis and automate monthly statement production;
• Allow program staff to view reports on demand using executive view access topromote organization wide engagement with financial data.
4. Contract tracking and compliance:
Prior to the recent reorganization at ELC, staff who were responsible for maintaining contract files did not coordinate or share records with staff who processed financial transactions related to contracts, and it was difficult for either party to know to the full compliance status of the record when making decisions. On the fiscal side in particular, this led to payments issued beyond the maximum payment limit of agreements, incomplete purchase orders, and difficulty creating contract performance reports for the Board and other customers.
• Creation of a user-friendly, systematic contract financial status tracker within thecontract file that lists transactions and captures up to date information on the statusof deliverables, invoices, payments, advances and deferred revenue all within thefinancial constraints of the contract term;
• Integration of contract tracking with the invoice approval process to ensuredisbursements are within contract parameters;
• Integration of contract tracking with the budgeting process to ensure that allappropriate staff participate in estimating revenues, cash flows, and expenses;
• Integration of contract performance data collection and analysis with contractcompliance records;
• Cross training contract and fiscal staff in compliance matters from the perspectiveof their counterpart to synchronize and improve communication with each other aswell as subcontractors.
5. Budget development and tracking
In addition to creating a more user-friendly and structured process for generating financial statements, ELC’s internal budget process will better assist the organizational decision making process if it is more systematically updated,
Page 70 of 82

transparent and better integrated with all other financial and contract management procedures. Proposed steps to be taken toward that goal include the following:
• A firm and transparent annual budget development and approval calendarestablished at the beginning of each fiscal year.
• A firm and transparent schedule for submission of first, second and third quarterforecasts to better inform development of the annual budget in the following year.
• A more transparent, user-friendly internal budgeting tool that allows for easy ad-hoc scenario modeling, detailed allocation by a variety of filters and integration withthe financial database, purchase order tracking system, and contract monitoringtools.
• Development of a simplified and transparent financial performance dashboard tocomplement presentation of utilization and other performance metrics in monthlyreporting.
• Development of a transparent, user-friendly annual cash flow budgets with monthlyreforecasting to reflect updates and actuals.
• Development of annual staffing plan budget with quarterly reforecasts as part ofthe overall budget package, including justifications for new positions, annualcompensation increase proposals, and reserve pools set aside for merit pay, asappropriate.
• Updates to the chart of accounts to simplify tracking of overall staff costs andimprove transparency on consulting and other service-related line items.
• Update the annual cost allocation methodology among state OCA codes to betterreflect level of effort on contracts and improve meaningfulness of staff time andattendance tracking.
Proposed Action: For Information Purposes Only
Supporting Documentation Attached: None
Financial Impact:
Page 71 of 82

Early Learning Coalition of Broward County, Inc.Board of Directors - CEO Evaluation Scoring Summary
For Years 2015-2016
Section Titles
Relationship w
ith th
e board
Administrativ
e/management skills
and ability
Services t
o people served
Fiscal m
anagement
Personal a
nd professional a
ttributes
Community and public
relations
Effectiv
e leadership of s
taff
Total AverageBoard of Directors 1 2 3 4 5 6 7
1 Laurie Sallarulo, Chair 4 4 4 4 5 4 4 29.00 4.14 2 Fabienne Fahnestock, Esq. 5 4 5 4 5 5 4 32.00 4.57 3 Cindy Arenberg Seltzer, MPA., JD 4 3 5 3 5 5 3 28.00 4.00 4 Renee Podolsky, MBA 4 4.5 4.8 4.6 5 5 4.8 32.70 4.67 6 Michael Asseff 5 5 4 4 4 3 4 29.00 4.14 9 Jeffrey Dwyer 3 4 3 4 5 3 4 26.00 3.71
10 Deborah Meidinger Hosey 5 4 4 4 5 5 4 31.00 4.43 11 Schmeka Lyons 4 5 5 5 5 5 4 33.00 4.71 12 Silvia C. Beebe * NEI 3 NEI 3 4 3 3 16.00 3.20 13 Dolly Rump 5 5 5 5 5 5 5 35.00 5.00 14 Mason Jackson 4 4 4 4 5 4 3 28.00 4.00 16 Kenickay Prendergast 5 5 5 4 5 5 5 34.00 4.86 17 Dr. Avis Proctor 3 4 4 4 5 5 3 28.00 4.00 19 Twan Russell 4.5 4.8 4.6 4.5 5 4.6 4.6 32.60 4.66 20 Ellie Schrot 5 4 3 5 5 5 4 31.00 4.43 22 Jody Miller * NEI 4 4 NEI 5 5 NEI 18.00 4.50
Section Averages 4.32 4.21 4.29 4.14 4.88 4.48 3.96 463.30 4.32
Overall Average 30.27 1486%
5 Barrington Russell, Sr. Did Not Respond7 Alfreda Coward, Esq. Did Not Respond8 Ashley Davis Did Not Respond
15 Nicholas Kaniaris Did Not Respond12 Silvia C. Beebe Weighted average is used due to NEI in the areas (1 and 3).18 Laurie Rich Levinson NEI (Not Enough Information to evaluate CEO)21 Howard Bakalar NEI (Not Enough Information to evaluate CEO)22 Jody Miller Weighted average is used due to NEI in the areas (1, 4, and 7).
Comments
*Averages for Miller and Beebe only include cells with score responses
TAB 10
Page 72 of 82
Early Learning Coalition of Broward County, Inc. CEO Upcoming Goals –
ELC Board Responses January 2017-January 2018
What goals, if any, do you believe the CEO should concentrate on in the upcoming months?
Please note: each grouping below represents the response from an individual board member.
I concur with the goals that have been identified by the CEO under “Next Steps” in the CEO Accomplishments: Year 1 document that was included in the Evaluation e-mail.
Organization-The ELC needs to be more organized in the way information is delivered and when it is delivered. For instance, Committee and Board Packets should be sent out in a timely manner to allow a thorough review. Staff-I would like to see Renee bring the staff together. I know she started this in 2016. I would like to see these efforts to have one unified ELC.
Better communication among staff and the Board in relation to the planning and scheduling of Providers who will present their work in the Board meeting.
Continue to tighten the financial/utilization reports, identify and secure additional funding for special initiatives, enhance communications with providers, parents, community including a new user friendly website that can serve as a learning portal for parents and providers, Implement board workshops on various contract areas to help board members gain a more thorough understanding of revenue flows, policies and legislation increase legislative information and advocacy efforts.
Continue to monitor the children/families income to ensure that the SR program is offered to those families that need it and not the ones who abuse the system. Continue to build community relations with ECE providers participating in SR and VPK programs. Continue strategizing effective ways to decrease the ELC deficit, through community partnerships and fundraising opportunities.
Improve the ASQ developmental screening component with monthly data that supports provider compliance and reporting. Focus on developing robust inclusion procedures in order to identify and support children with special needs. Strengthen the relationship with the Part C Early Steps and Part B PreK ESE Programs. Finalize the procedure for providers to apply for the Special Needs Rate and monitor child outcomes for children receiving this increased rate.
Page 73 of 82
A. How can this evaluation process be improved?
Please consider developing a form that allows for the CEO to list all related accomplishments for each category being evaluated.
Please consider developing a survey component that would provide feedback from specific key stakeholders such as staff, providers and community partners
Possibly using Survey Monkey tool Include room for comments
Page 74 of 82
Early Learning Coalition of Broward County, Inc. Executive Committee Meeting
January 25, 2017
Subject: CCEP Waiver and Additional Funding Reallocation
TAB 11
Background Information
The Child Care Executive Partnership ( C C E P ) is a statewide program that has the ability to allocate matching dollars to business, non-profit and government dollars (in that priority order) who provide dollars for child care to eligible employees and/or income eligible children in the community in need of care.
The Child Care Executive Partnership’s Board i s appointed by the Governor and responsible for oversight. The goal of the CCEP board is to maximize CCEP funding. The board reviews expenditures each quarter to assess the status of existing funding levels and to plan for maximum funding utilization. The CCEP board meets mid- year to consider the possible reallocation of dollars that are projected to be under-spent by Coalitions. During this mid-year process Coalitions utilizing less than the 85%, of their targeted expenditure rate are required to submit a formal waiver request or de-obligate funds.
As of November, Broward was below target at 71% of the expected 85%. This under- expenditure rate occurred because during last fiscal year there was lower-than-expected provider participation, so most of the county funds along with some United Way dollars were used to match the state funds at 50%. As a result, there were only $132K remaining in County funds to match the non-provider portion of the purchasing pool for this fiscal year. Once the new contract year started in Oct 2016, the Coalition was able to ramp up the CCEP spending. The attached CCEP utilization chart illustrates how the Coalition is on track to spend its entire initial allocation.
Since September, the Coalition obtained commitments from an additional 18 local businesses who agreed to assist their eligible employees with the cost of child care. Therefore, on January 10, 2017, the Coalition submitted a formal waiver request, as well as a reallocation request to the Office of Early Learning for $200,000 in order to serve an additional 125 children for the remaining contract period.
On January 12, 2017, the CCEP Board approved the Coalition’s waiver request, as well as a reallocation of funding. However, confirmation of the amount approved is still pending as of this date. In the event the full $200,000 is approved, the new total funding allocation from CCEP for fiscal year 2016-2017 will be $2,751,079. The CCEP dollars must be used for slots and slot related costs.
PROPOSED ACTION
Allocate the additional amount approved (pending final confirmation) by the OEL CCEP Board to Broward Regional Health Planning Council, Inc. (BRHPC) for use in slots and related costs.
Page 75 of 82

Supporting Documentation Attached: FY17 CCEP Utilization
Financial Impact: Addition of up to $200,000 to ELC Revenue (pending confirmation).
Addition of up to $200,000 in ELC’s allocation to BRHPC’s ELC2 Contract. (pending confirmation)
Action Taken: No net impact on ELC budget.
Page 76 of 82

Broward County Subsidized Child CareSpending Analysis for Inter-Related ContractsJuly 2016 - June 2017 11 10 9 8 7 6 5 4 3 2 1
Match Jul-16 Aug-16 Sep-16 Oct-16 Nov-16 Dec-16 Jan-17 Feb-17 Mar-17 Apr-17 May-17 Jun-17 TOTALCounty 52,651$ 41,098$ 48,187$ 139,813$ 125,796$ 131,909$ 131,909$ 131,909$ 131,909$ 131,909$ 131,909$ 131,909$ 1,330,908$ Participating Provid 49,680$ 54,119$ 53,942$ 55,544$ 54,367$ 57,025$ 57,025$ 51,841$ 59,617$ 51,841$ 71,598$ 70,228$ 686,826$ CSC -$ -$ -$ -$ -$ 80$ 55,871$ 38,800$ 64,407$ 38,800$ 70,010$ 66,148$ 334,115$ Total 102,330$ 95,217$ 102,128$ 195,357$ 180,164$ 189,014$ 244,805$ 222,550$ 255,933$ 222,550$ 273,516$ 268,285$ 2,351,850$ Served 511 478 521 1,007 913 945 1,211 1,211 1,211 1,211 1,211 1,211
Broward ELC Purchasing Pool by Match Source (SLOTS Only)
County$52,651
$41,098 $48,187
$139,813 $125,796
$131,909 $131,909 $131,909 $131,909 $131,909 $131,909 County$131,909
Participating Providers$49,680
$54,119 $53,942
$55,544
$54,367
$57,025 $57,025 $51,841 $59,617
$51,841
$71,598 Participating Providers$70,228
CSC$55,871 CSC
$38,800
CSC$64,407
CSC$38,800
CSC$70,010 CSC
$66,148
Total$102,330 Total
$95,217
Total$102,128
Total$195,357
Total$180,164
Total$189,014
Total$244,805
Total$222,550
Total$255,933
Total$222,550
Total$273,516 Total
$268,285
Served511 478
521
1,007
913945
1,211
1,211
1,211
1,211 1,211Served1,211
-
200
400
600
800
1,000
1,200
1,400
$-
$50,000
$100,000
$150,000
$200,000
$250,000
Jul-16 Aug-16 Sep-16 Oct-16 Nov-16 Dec-16 Jan-17 Feb-17 Mar-17 Apr-17 May-17 Jun-17
Serv
ed
Slot
$
Month
Broward ELC Purchasing Pool by Match Source
County Participating Providers CSC Total Served Page 77 of 82

TAB 13
State Legislative Priorities 2017
Increase School Readiness funding to support the economic stability of working families, kindergarten readiness for children, and performance increases for providers
There are over 37,000 children on the waiting list; performance funding has demonstrated increases in program quality
Increase Voluntary Prekindergarten Program per-child funding by $50 for the school year and $43 for the summer
This change increases the school year base student allocation from $2,437 (2015-16) to $2,487; still below the $2,677 allocated in 2007-08
Support local flexibility and decision-making to meet local needs and maximize the leveraging of local resources
Allow greater flexibility in Coalition Board membership while maintaining that at least one-third of members are business representatives (e.g., allow community members
such as those representing law enforcement and higher education to serve)
Restore greater flexibility in determining eligibility categories based on local needs, returning to eligibility categories in Florida Statutes prior to 2012 legislative changes
Ensure local flexibility in reviewing School Readiness and Voluntary Prekindergarten contract violations and determining appropriate penalties and termination periods
(e.g., allow terminations ‘up to five years’ rather than requiring all terminations to be for 5 years)
Florida’s economic growth strategy starts at birth by investments in early childhood; Lack of investment in the productivity of the next generation is a deficit strategy, not a growth strategy
Association of Early Learning Coalitions Alisa S. Ghazvini, Ph.D., Executive Director/ [email protected]/ 850-545-7716
Page 78 of 82
TAB 14
Early Learning Coalition of Broward County, Inc. Executive Committee Meeting
January 25, 2017
Subject: Strategic Plan Update
Current Status
At the May 20, 2016 ELC Board Retreat, board members tasked the ELC staff with continuing to update the ELC’s Strategic Plan based upon recommendations made (by both board members and ELC senior staff members). Since the retreat the ELC Staff has met several times to review the Strategic Plan and revise goals and objectives based on feedback from the retreat session.
Due to the Coalition restructuring in September 2016 that resulted in staffing and structure changes, priorities needed to be shifted. Now that new staff have been hired, and staff affected by the structure changes have been trained, efforts can once again be focused on updating the Strategic Plan.
Next Steps
Recently members of the ELC senior team met to review the progress of the updates that had been made and explored the option of bringing on the facilitator that previously led the Board Retreat to assist in finalizing the goals and measurement tools appropriately includes the board recommendations previously made at the retreat.
A decision regarding next steps and the use of the facilitator will be made at the January 23rd Senior Staff meeting. Once all recommended updates have been made to the Strategic Plan, the document will be presented to the Governance Committee and then to the Board for approval.
Supporting Documentation Attached: FYI
Financial Impact: None
Page 79 of 82
Early Learning Coalition of Broward County, Inc. Executive Committee Meeting
January 25, 2017
Subject: New Phone System Update
TAB 15
Background Information
ELC Broward will implement the MITEL phone sys tem, which is a worldwide cloud-based solution. The kick off meeting has occurred and infrastructure changes have started. Since this is a cloud based implementation, the bulk of the work will be handled by MITEL.
As of January 18, 2017, MITEL shipped 10 phones for proof of concept which will arrive on or before January 23, 2017. The next phase of the implementation process on our end is testing the new phones. As soon as testing is completed early next week, training will be scheduled. The training date at the moment is tentatively set for January 27, 2017. The phones arrive next week; they will be configured and distributed to a selected number of ELC staff. All staff participating in the proof of concept will receive a new IP Telephone and basic instructions on call handling.
The Coalition will “Go-Live” by the end of February 2017. An official “Go Live” date will be announced as soon as MITEL reaches an agreement with our current service provider.
Page 80 of 82

Early Learning Coalition of Broward County, Inc.Organizational Chart
ACCOUNTINGMANAGER
Judy Samuels
HR COORDINATOR/ PAYROLL MANAGER
Ros Descroches
FINANCIAL ANALYST
Reinier Potts
BOARD OF DIRECTORS
CHIEF EXECUTIVE OFFICERRenee Jaffe
INCLUSION SPECIALISTDebbie Kay
EARLY EDUCATIONSPECIALISTS (3)Carmen Nicholas
Gordia RossSuwenda Louis
Executive Assistant
Irene Ramos
CHIEF ADMINISTRATIVE OFFICER
Christine Klima
IT MANAGERHubert Cesar
CLERK/ASSISTANT(Admin/Board)
Vacant
CHIEF OPERATING OFFICERLeticia Strasser
DIRECTOR OF EDUCATION AND QUALITY INITIATIVES
Mabel Ramirez
CONTRACT COORDINATOR
Brian Guerdat
PROVIDER RELATIONS MANAGERAmy Ungor
PROVIDER RELATIONS
SPECIALISTS (7)Felicia Walker
Inez WebbMicah MitchellLeidy Correal
Jeanette LindorLucia RodriguezLinsey Brewster
CONTRACT MANAGER
Doreen Moskowitz
CLERICALASSISTANT/
RECEPTIONISTAngie Palomino
DATA COORDINATOR
Sandra Paul
COMMUNITYRELATIONS &
RESOURCE DEVELOPMENT
DIRECTORJanice Carter
TAB 16
Revised 1-17-17 Page 81 of 82

Early Learning Coalition of Broward County Attendance Chart
FY 2016-2017Member Term Exp Jul Aug Sep Oct Nov Dec Jan Feb Mar Apr May June
1 Alfreda Coward 4/1/17 ABS X2 Ashley Davis* 10/1/19 X MTG MTG X3 Barrington Russell 11/1/17 X ABS4 Cindy Arenberg Seltzer None ABS C C X5 Deborah Meidinger Hosey
None X A A X6 Dolly Rump4/1/18 ABS N N X7 Dr. Avis ProctorNone ABS C C ABS9 Ellie Schrot*6/1/18 X L L X10 Fabienne Fahnestock*2/1/20 ABS L L X11 Jeffrey Dwyer*6/1/18 X E E X12 Kenickay Prendergast*
10/1/19 X D D ABS13 Silvia Beebe/ effective 10/2016None X14 Laurie Rich LevinsonNone ABS X15 Laurie Sallarulo4/1/17 X X16 Mason JacksonNone X X17 Michael Asseff4/1/16 X X18 Nicholas Kaniaris*
5/1/19 X X19 Renee Podolsky
None X X20 Schmeka Lyons*
10/1/19 X ABS21 Twan Russell
None X X X Present at meeting ABS - Absent from Meeting
FM First Meeting LM Last MeetingShaded areas - no meeting scheduled
TAB 17
Page 82 of 82