early learning network year 1 results
TRANSCRIPT

Early Learning Network Year 1 Results:
Preschool Educational Practices and Child Outcomes
Society for Research on Educational Effectiveness
February 28, 2018
The Early Learning Network is funded by the Institute of Education Sciences.
@earlylearnnet

The Early Learning Network aims to advance the understanding of policies and practices that narrow
the achievement gap and maintain early learning success
as children transition from preschool to elementary school
and beyond.

♦ Five Research Teams ♦ One Assessment Team
♦ Network Lead

Complementary Research Studies• Descriptive study:
Identify systems-level policies and practices that support early learning
• Classroom observation study:Identify teaching practices and other classroom-level malleable factors associated with children’s school readiness and achievement in preschool and early elementary school
• Longitudinal study:Identify malleable factors associated with early learning and school achievement over time from preschool through the early elementary school grades

Symposium Agenda• Paper 1: Pre-Kindergarten Classroom Characteristics and Pre-Kindergarten Gains of Children
Living in Rural AreasUniversity of North Carolina – Chapel Hill (Irina Mokrova, Margaret Burchinal, Mary Bratsch-Hines, & Ellen Peisner-Feinberg)
• Paper 2: How Does Quality of Curricular Implementation Support Diverse Children’s Skills in Pre-Kindergarten? Evidence from Boston
MDRC/University of Michigan (Meghan McCormick, Michelle Maier, Christina Weiland, JoAnn Hsueh, Jason Sachs, & Catherine Snow)
• Paper 3: Understanding the Effects of Classroom Processes on Child Outcomes in Pre-Kindergarten
University of Virginia (Robert Pianta, Jessica Whittaker, Virginia Vitiello, Erik Ruzek, Arya Ansari, & Tara Hofkens)
• Paper 4: Classroom Quality and Classroom Network Structure Predicting Student OutcomesOhio State University (Jessica Logan Kelly Purtell, Tzu-Jung Lin, & Laura Justice)
• DiscussantCarol Connor (University of California-Irvine)

Irina MokrovaPeg Burchinal
Mary Bratsch-HinesEllen Peisner-Feinberg
University of North Carolina at Chapel Hill

ECE can reduce achievement gap State and federal pre-kindergarten (Pre-K)
programs But – questions remain: ◦ which dimensions of ECE experiences relate to
which Pre-K skills

Process quality◦ Widely examined; modest associations
Verbal interactions with adults◦ Associations with language and literacy skills◦ Basis for teacher scaffolding
Instruction time Setting◦ Small groups help young children learn
Curriculum Wide-scale belief in whole child curricula Evidence for domain-specific curricula

Academic skills◦ Increasing attention in Pre-K classrooms
Phonemic skills and letter-word recognition Early numeracy
Cognitive skills◦ Higher-order cognitive skills
Language Executive functioning

Domain specificity Instruction time in that domain Use of domain-specific curriculum
Academic skills related to Classroom process quality Small group settings
Cognitive skills related to Classroom process quality Complex conversations with teacher Small group settings

Cohort study of rural NC◦ 6 NC rural counties ◦ 63 randomly selected NC Pre-K classrooms
Pre-K children ◦ 351randomly selected children 34% Spanish-English dual language learners
Classroom quality, observed 2 days◦ CLASS◦ Boston Pre-K “fidelity” checklist◦ Language Interactions Snapshot (LISn)◦ Teacher report of curriculum

Factor analysis of classroom observation measures1. Process Quality CLASS Domains - ES, CO, IS Boston pre-K “fidelity” checklist
2. Complex conversations with adults - LISn any adult elicited, elaborated, and had sustained
conversation3. Instruction – LISn Literacy activities (print, writing, sound) Math activities

4. Curriculum: teacher report Creative Curriculum used in 78% classrooms
5. Setting: LISn large group small group

Process Quality
Complexconver-sation
Literacy Activities
Sounds Activities
Math Activities
Small Group
Whole Group
Creative Curric.
Process quality
.27* .16 -.04 .13 -.10 .25* .20
Complexconver-sation
.34** .24+ .47*** .35** .07 -.18
Literacy Activities
.63*** .05 .01 .21+ -.24+
Sounds Activities
.12 .00 .05 -.37**
Math Activities
.50*** .06 -.34**
Small group
-.27* -.24+
Whole group
-.13

Children assessed fall and spring – gain scores Academic skills◦ Literacy WJ Letter-word ID DIBELS First sound fluency DIBELS Phonemic fluency
◦ Numeracy WJ Applied problems
Cognitive skills◦ Language Expressive One Word (English and Spanish) WJ Picture vocabulary
◦ Executive function Inhibitory control (Flanker) Cognitive Flexibility (Card sort)

Children nested in classrooms First model: All quality dimensions and
controls Subsequent models: Taking out quality
dimensions one at a time Reduced model: One or more dimensions
became significant

Letter-Word ID
AppliedProblems
1st Sound Fluency
Phoneme Fluency
Picture Vocab
EOW English
EOWSpan.
InhibitoryControl
CognitiveFlexibility
Process Quality
.23***
Complex Conversation
.18*
Literacy Activities
.26**
MathActivities
Sound Activities
.16** .14*
Small Group Setting
.14*
Whole Group -.13* -.17*
Creative curriculum
-.21*** -.14*
n 351 349 350 349 334 240 103 273 227

All but one outcome related to at least one quality dimension◦ No clear pattern Most outcomes related to a single dimension No single quality dimension dominated
Predictors of academic skills are not clearly different from cognitive skills

Focus on other dimensions in addition to process quality may be warranted◦ Time in content-related instruction◦ Type of setting◦ Language as a tool for scaffolding
Whole child curriculum negatively related to some academic or cognitive gains◦ Scaffolding needs to be a process behind any
curriculum

To all participating families, teachers, and school administrators
To all research assistants and project staff To the Institute of Education Sciences

How Does Quality of Curricular Implementation Support Diverse
Children’s Skills in Prekindergarten?:Evidence from Boston
Meghan McCormickMichelle Maier
Christina WeilandJoAnn HsuehJason Sachs
Catherine Snow
February 28th, 20182018 Society for Research on Educational Effectiveness
Washington, DC
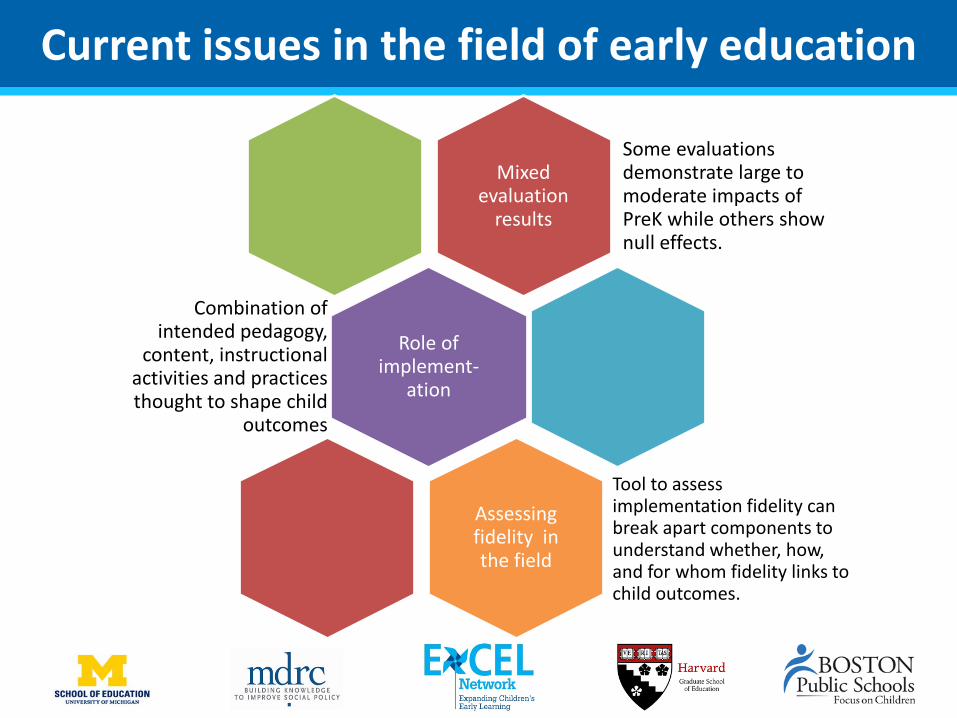
Current issues in the field of early education
Mixed evaluation
results
Some evaluations demonstrate large to moderate impacts of PreK while others show null effects.
Role of implement-
ation
Combination of intended pedagogy,
content, instructional activities and practices thought to shape child
outcomes
Assessing fidelity in the field
Tool to assess implementation fidelity can break apart components to understand whether, how, and for whom fidelity links to child outcomes.

The BPS Model as a Case Study for Examining Fidelity of Implementation
Curriculum in place
Example components adapted from OWL
Example Building Blocks components
Example district-developedcomponents
Focus on K1 (district-adaptedversion of Opening the World of Learning & Building Blocks). Thematic curriculum that cuts across ELA, math, science, social study, and arts.
Centers & Introduction to Centers
Building Blocks centers
Thinking & feedback
Read Aloud Building Blocks whole group activities
Storytelling
Small Groups to support language/literacy
Building Blocks small group activities
Storyacting

Research questions1. What does fidelity look like across prekindergarten
public school classrooms in BPS?– Does fidelity vary systematically by classroom composition?
2. What measures of fidelity are most closely associated with CLASS?
3. Is fidelity to the BPS PreK model associated with children’s language and math scores in the Spring of PreK?
– For which groups of students does fidelity appear most predictive of Spring outcomes (e.g., dual language learners, racial/ethnic minority students)?

Schools participating in study (N = 20 public schools with prekindergarten program)
School-level characteristic % for study schools
% for school district
School structure: PreK – 5th grade 30% 50%
School structure: PreK – 1st grade 5% 8%
School structure: PreK – 8th grade 55% 32%
% Students economically disadvantaged 48.38% 51.05%
% Students Black 25.59% 31.60%
% Students White 15.70% 16.17%
% Students Hispanic 46.43% 42.37%
% Students Asian 8.50% 5.99%
% Students whose first language is not English 49.15% 41.90%
% Met or exceeded expectations on 2015 – 2016 ELA exam 39.74% 35.95%
% Met or exceeded expectations on 2015 – 2016 math exam 44.47% 41.48%

Classroom & teacher participants (N = 41 public school classrooms across 20 schools)
Teacher characteristic %age/Mean
Teacher age 43.95 (SD = 9.37)
Years teaching 14.79 (SD = 9.25)
Years teaching prekindergarten 8.6 (SD = 7.37)
Years teaching at current school 7.79 (SD = 8.01)
Teacher has master’s degree 90%
Teacher female 100%
Teacher Black 22%
Teacher White 49%
Teacher Hispanic 13%
Teacher Asian or other race 16%
Classrooms per school 1.35 (SD = .42)

Student sample (N = 299 BPS prekindergarten students)
0%
10%
20%
30%
40%
50%
60%
70%
80%
90%
100%
EligibleFRPL
White Black Hispanic Asian DLL
Study sample
All BPS prekindergartenstudents
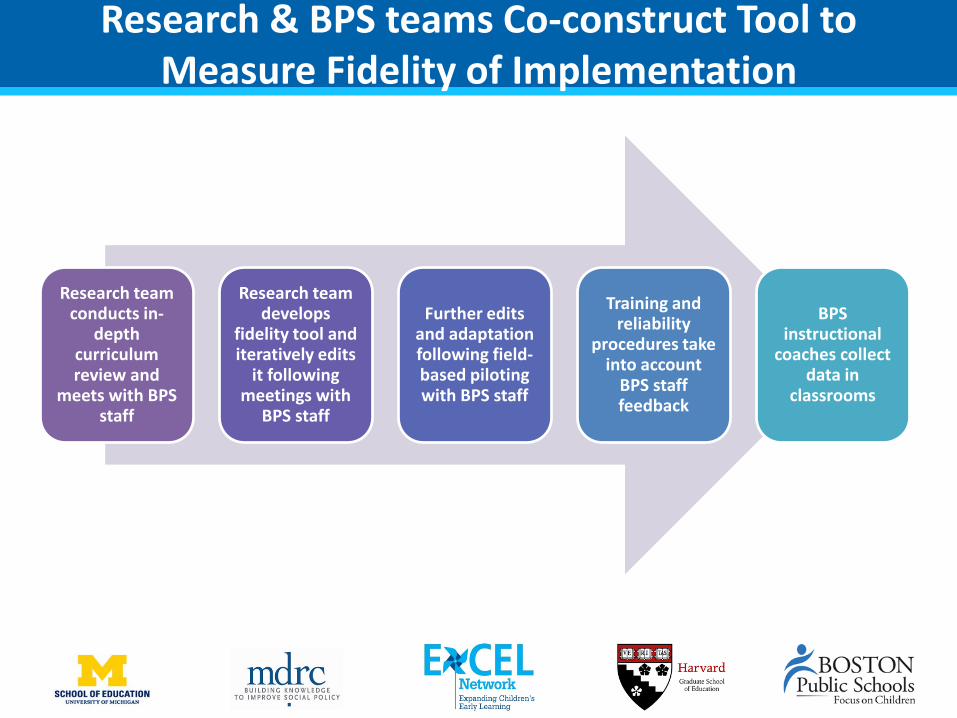
Research & BPS teams Co-construct Tool to Measure Fidelity of Implementation
Research team conducts in-
depth curriculum review and
meets with BPS staff
Research team develops
fidelity tool and iteratively edits
it following meetings with
BPS staff
Further edits and adaptation following field-based piloting with BPS staff
Training and reliability
procedures take into account
BPS staff feedback
BPS instructional
coaches collect data in
classrooms

Fidelity Data in Public School Classrooms
N = 41 classrooms
in 20 schools
41 total public prekindergarten classrooms participated (97% of teachers in participating schools)
Classrooms observed
2x
Each classroom observed on two
separate days for 2 – 3 hours/obs.
Observation data averaged across days.
Reliability
20% of observational visits were coded by two BPS coaches; Reliability analysis suggests high agreement.

Procedure (thus far) for analyzing fidelity data
1. Examine dosage, adherence, and quality of implementation
2. Examine fidelity scores within curriculum components
3. Consider variation within and across components
4. In order to make fidelity relevant to district -create measures that cut across components and operationalize core practices that are central to curriculum

Cross-component fidelity measures
Vocabulary(α = .91)
Extending/Building(α = .91)
Summary/ Reflection/Making
Connections(α = .79)
Scaffolding/ Differentiation
(α = .82)

What does fidelity look like overall in BPS public school prekindergarten classrooms?
11.5
22.5
33.5
44.5
5
Fide
lity
scor
e (1
-5)
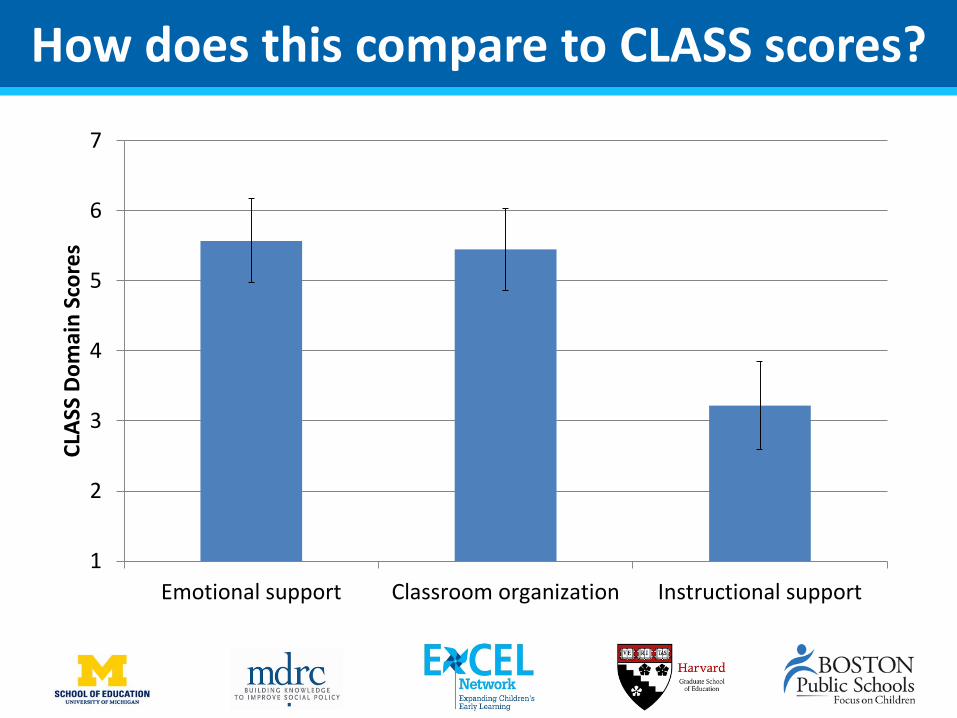
How does this compare to CLASS scores?
1
2
3
4
5
6
7
Emotional support Classroom organization Instructional support
CLAS
S D
omai
n Sc
ores

How does implementation vary depending on classroom composition?
• There are some differences in implementation between classrooms. On average:– Classrooms with higher percentages of white
students have higher quality of implementation
– Classrooms with higher percentages of black and Hispanic students have lower quality of implementation
– Classrooms with higher percentages of DLLs have similar quality of implementation as classrooms with fewer DLLs, but more variation across classrooms.

Example of variation in fidelity by classroom composition: Eligibility for free/reduced price lunch
0%10%20%30%40%50%60%70%80%90%
100%
Study sample
All BPS prekindergartenstudents

How do fidelity measures relate with CLASS?
Instructional support
Emotional support
Classroom org.
Instructional support 1.0
Emotional support .67 1.0
Classroom org. .69 .85 1.0
Extending/Building .18 .16 .10
Summary/Reflection .22 .10 .14
Vocabulary .01 .01 -.07
Scaffolding/Differentiation .35 .21 .22
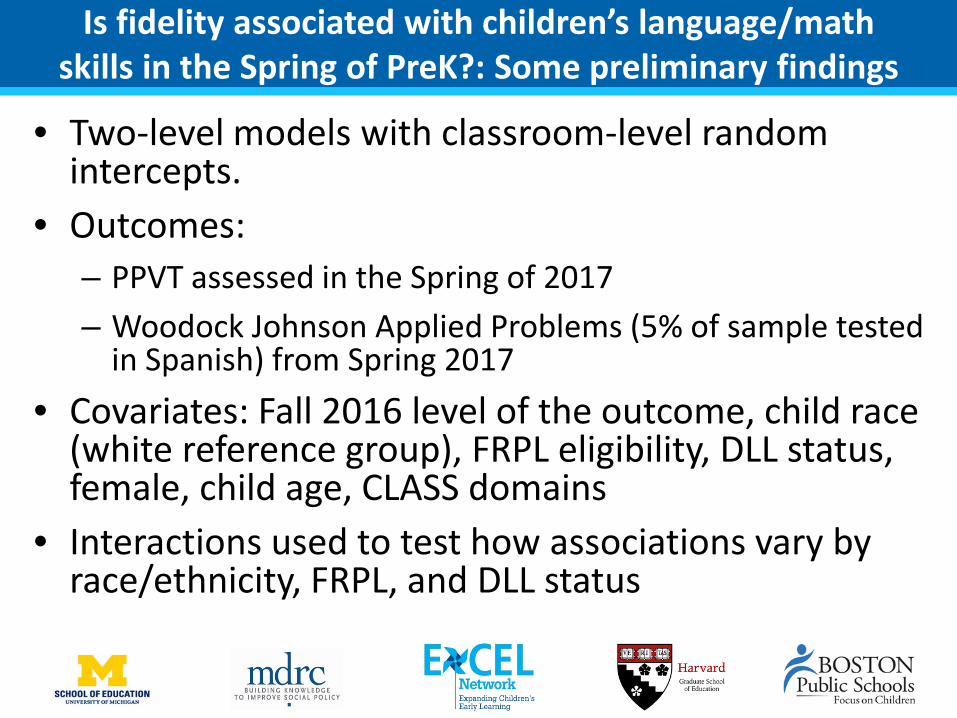
Is fidelity associated with children’s language/math skills in the Spring of PreK?: Some preliminary findings
• Two-level models with classroom-level random intercepts.
• Outcomes:– PPVT assessed in the Spring of 2017– Woodock Johnson Applied Problems (5% of sample tested
in Spanish) from Spring 2017• Covariates: Fall 2016 level of the outcome, child race
(white reference group), FRPL eligibility, DLL status, female, child age, CLASS domains
• Interactions used to test how associations vary by race/ethnicity, FRPL, and DLL status

Student math skills across the prekindergarten year
95
97
99
101
103
105
107
109
111
113
115
Fall 2016 Spring 2017
WJA
P St
anda
rdize
d Sc
ore Full sample
White studentsBlack studentsHispanic studentsAsian studentsFRPL eligibleNot FRPL eligibleDLLs

Links between fidelity of implementation and improvements in language and math across prekindergarten year
• Full sample of students - no significant associations between cross-component fidelity measures and gains in language or math across prekindergarten year
• No significant associations detected in this preliminary work using cross-component fidelity constructs to predict PPVT outcomes
• Statistically significant interactions between fidelity of implementation, Hispanic and DLL status, and math outcome

Example of Predicted Math Skills for Hispanic Students at End of Prekindergarten Year
95
96
97
98
99
100
101
102
103
104
Extending/building Summary/reflection
WJ A
pplie
d Pr
oble
ms S
tand
ard
Scor
e
High fidelityLow fidelity

Example of Predicted Math Skills for White Students at End of Prekindergarten Year
95
100
105
110
115
120
Extending/building Summary/reflection
WJ A
pplie
d Pr
oble
ms S
tand
ard
Scor
e
High fidelityLow fidelity
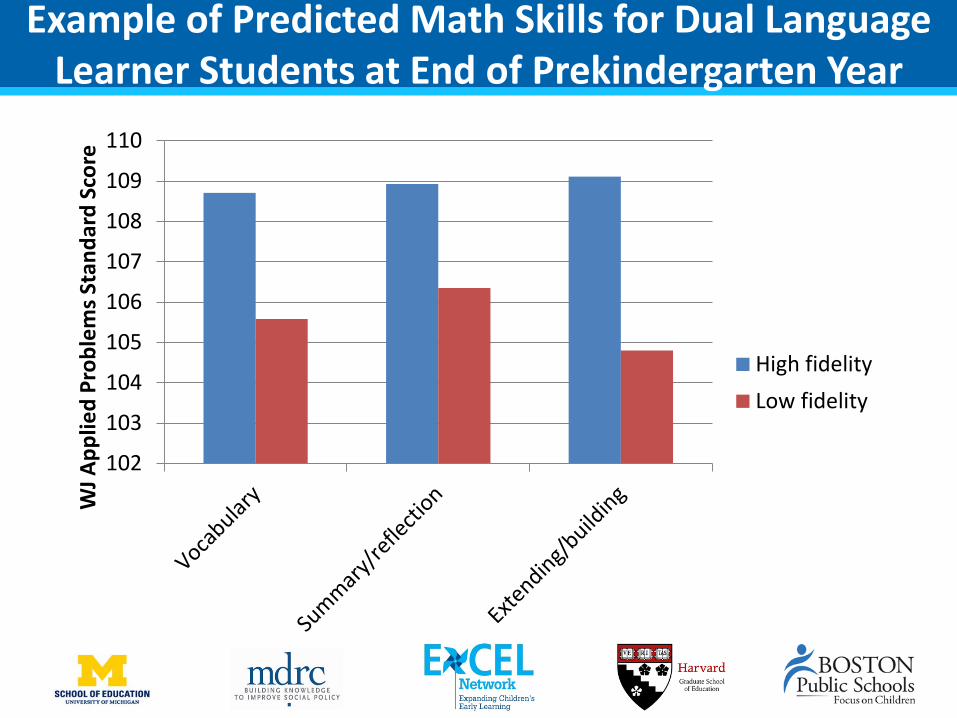
Example of Predicted Math Skills for Dual Language Learner Students at End of Prekindergarten Year
102
103
104
105
106
107
108
109
110
WJ A
pplie
d Pr
oble
ms S
tand
ard
Scor
e
High fidelityLow fidelity

Limitations & Next Steps• Work is very preliminary and in early stages
– Future models will include more rigorous work to determine covariates and alternative model fits.
• More measurement work needed to operationalize fidelity constructs and consider any within-component measures of adherence, dosage, quality
• Data are correlational across one school year• Sample is fairly small in Year 1 study (particularly for
subgroups); future years will include larger samples for subgroup examination

Some preliminary conclusions
Reliable fidelity data can be collected by district staff.
Systematic variation in fidelity across classrooms.
Fidelity may predict math outcomes (on a small magnitude) but story is likely in the subgroups for a diverse sample with varying skill levels at baseline and follow-up.

AcknowledgmentsMDRCMarissa StrassbergerRama HagosSharon HuangJared SmithDesiree AldersonIlana BlumKelly TerlizziMirjana Pralica
BPSBrian GoldAbby MoralesMarina BoniMelissa LucDavid RamseyBPS Dept. of Early Childhood Staff
University of MichiganDeborah BallLillie MoffettPaola RosadoAmanda KetnerHarvardNonie LesauxSibyl HollandMaia GokhaleData collection team
Funding Acknowledgment
The research reported here was supported by the Institute of Education Sciences, Department of Education, through Grant R305N160018 – 17 to
MDRC. The opinions expressed are those of the authors
and do not represent views of the Institute or U.S. Department of Education.

Questions?Meghan McCormick
Michelle MaierMDRC
Christina WeilandUniversity of [email protected]
JoAnn HsuehMDRC
Jason SachsBoston Public Schools
Catherine SnowHarvard Graduate School of Education

July 17, 2017
48
Understanding the effects of classroom processes on child outcomes in pre-kindergarten
Robert C. Pianta, PhD
February 28, 2018

Research Team Robert PiantaJessica WhittakerGinny VitielloErik RuzekMarcia Kraft-SayerBrittany KerrLaura HelferstayMarianna LyulchenkoArya AnsariTara HofkensPartners: School district, IES, ELN
49

FP3 – Pre-K Year Early Results
• Sample information
• Descriptions of classroom practices and opportunity
• Early results from outcome analyses
50

Study Context• Large county in urban ring• Economically, ethnically, racially, linguistically diverse
• 15+ years experience operating two pre-k program types• Programs for 4-year-olds in public schools, run by schools• Programs operated in community-based centers, including HS
and community child care
• Experienced teaching staff• Mean years of education: 16.8• 39% have a major in EC• Mean years teaching experience: 15.6• 43% of teaching staff non-white
51

Pre-k – K Procedures
• Recruited teachers, schools, families
• Assess children’s skills fall and spring
• Observe classrooms
• Recruit all eligible children in any pre-k classroom with more than five such children
• Teachers/classrooms enrolled: 115
• Children/families enrolled: 1,575
• Exclude children with IEPs
52
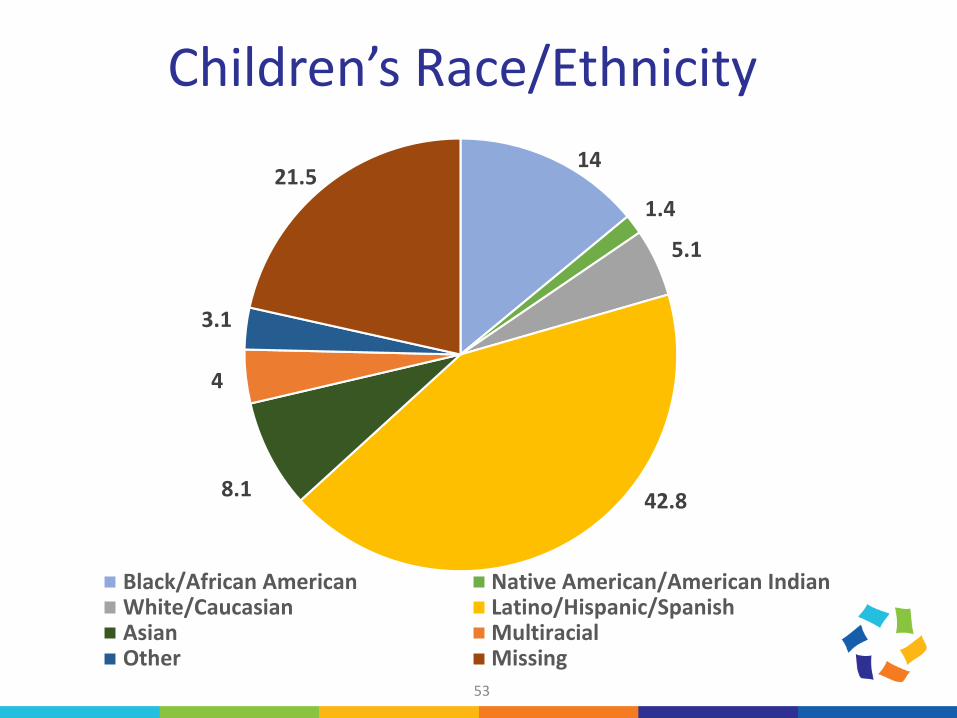
Children’s Race/Ethnicity
53
14
1.4
5.1
42.88.1
4
3.1
21.5
Black/African American Native American/American IndianWhite/Caucasian Latino/Hispanic/SpanishAsian MultiracialOther Missing

Primary Language Spoken at Home
54
36.5
37
8.1
18.4
English Spanish Other Missing

Characteristics by Program Public School Pre-K Community-Based
Mean/Percent Mean/Percent
Hispanic 16% 26%
Black 55% 52%
Asian American 11% 5%
Mixed Race 4% 9%
Other Race 4% 2%
English Language 18% 34%
Spanish Language 56% 47%
Other Language 26% 19%
Percent LEP 71% 24%
Income/Needs 0.84 0.97
55

Classroom Observations
56
• Teacher-Child Interactions - Classroom Assessment Scoring System Overall total score
• Content, Dosage, and Activity Setting – Behavioral Coding System adapted from the NICHD SECCYD Classroom Observation System and the Observational Record of the Caregiving Environment (NICHD Early Child Care Research Network, 2003)
• Rigor of Literacy and Mathematics Instruction – ECLS-K teacher survey items (x 1.522; 1.88 respectively); reflect teaching at preK –K level
• Observed time spent on teaching analysis, inference, and basic skills- Behavioral Coding System

57
Activity Settings in Public Pre-K Programs
Notes. ** p < .01

Activities in Public Pre-K Programs
58
Notes. ** p < .01
59
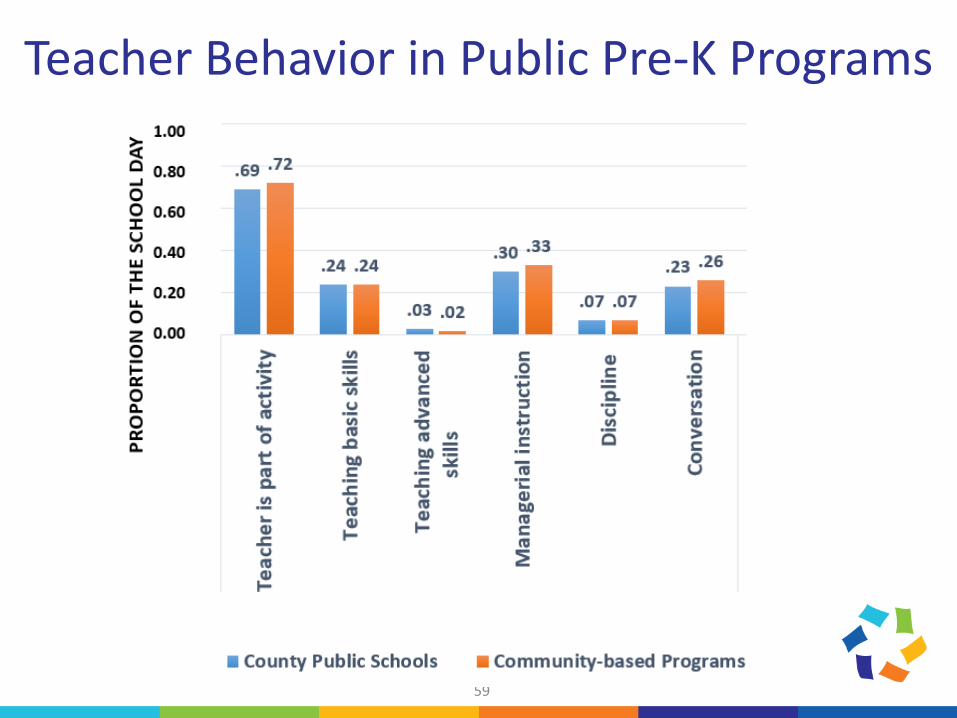
Teacher Behavior in Public Pre-K Programs

60
Child Behavior in Public Pre-K Programs

Differences in Classroom Process and Practices in Public Pre-K Programs
61
• Very few differences emerged in the classroom processes across public and community-based programs
• Community programs spent less time in small group and art
• Few teacher and classroom characteristics were predictive of classroom processes, but:
• More educated and experienced teachers spent more time teaching and in teacher-directed instruction (+5-6% of the day)
• Teachers’ adult centered beliefs were associated with greater time spent in managerial instruction (+6% of the day)

Are malleable classroom factors (teacher-child
interactions, instructional content and dosage of
instruction, activity setting, and rigor of instruction)
positively associated with changes in the quality of
children’s relationships with teachers, social skills, and
executive function skills over the pre-k year?
62

63
Measures – Child Outcomes
• Teacher-Child Relationships – Student Teacher Relationship Scale (Pianta, 2001)
• Social Skills and Conduct Problems – Teacher Child Rating Scale (Hightower et al., 1986)
• Executive Function• Head, Toes, Knees, Shoulders (McClelland et al., 2007)• Pencil Tap (Smith-Donald, Raver, Hayes, & Richardson, 2007)• Backward Digit Span• Woodcock Johnson – Literacy (2), Math (2) subtests

AnalysesHierarchical linear models (nesting students in classrooms)
Models control for:- Baseline measure of each outcome in the fall- Student characteristics (gender, age, race/ethnicity, SES, language)- Classroom characteristics (aggregated student gender, age,
race/ethnicity, income, special needs, - Teacher characteristics (race, education, experience, beliefs about
children) - Program type
64

Teacher-Child Relationships
65
Closeness Conflict
Estimate p S.E. Estimate p S.E.
Fall Pretest .675 *** .026 .715 *** .020
Teacher-Child Interactions Overall Quality -0.38 ** 0.11
Content DosageProportion Academics
Proportion SEL
Activity SettingProportion Teacher-Structured
Proportion Routines
RigorLiteracy Level
Math Level
*p<.10, **p<.05, ***p<.01
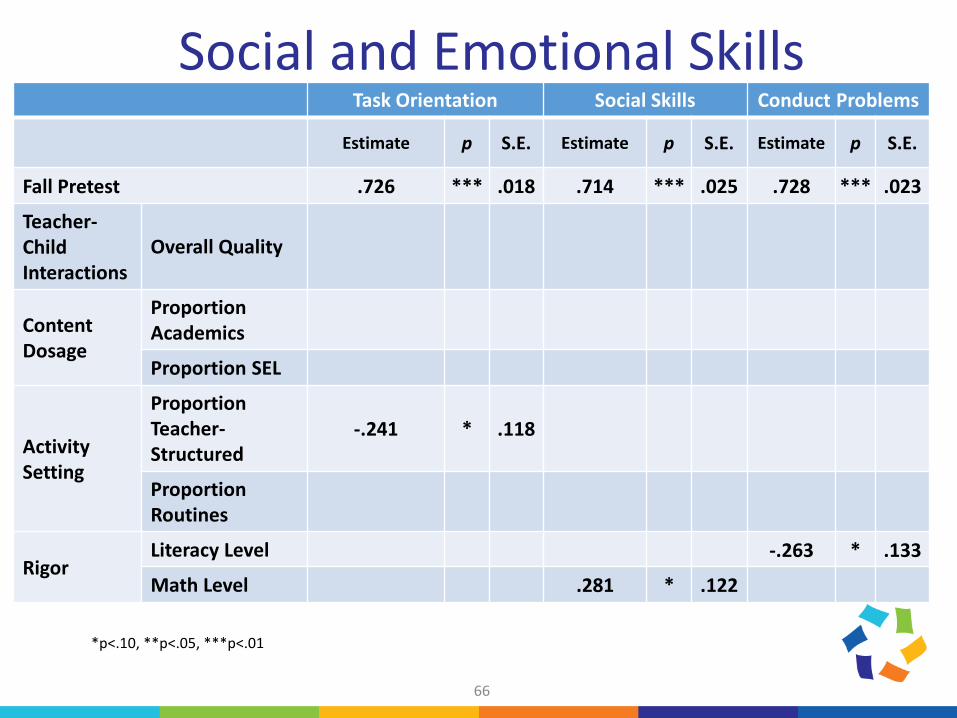
Social and Emotional Skills
66
*p<.10, **p<.05, ***p<.01
Task Orientation Social Skills Conduct Problems
Estimate p S.E. Estimate p S.E. Estimate p S.E.
Fall Pretest .726 *** .018 .714 *** .025 .728 *** .023
Teacher-Child Interactions
Overall Quality
Content Dosage
Proportion Academics
Proportion SEL
Activity Setting
Proportion Teacher-Structured
-.241 * .118
ProportionRoutines
RigorLiteracy Level -.263 * .133
Math Level .281 * .122

Executive Function Skills
67
*p<.10, **p<.05, ***p<.01
Backward Digit Span HTKS Pemcil Tap
Estimate p S.E. Estimate p S.E. Estimate p S.E.
Fall Pretest .200 .152 .579 *** .092 .644 *** .094
Teacher-Child Interactions
Overall Quality .334 * .154
Content Dosage
Proportion Academics
Proportion SEL
Activity Setting
Proportion Teacher-Structured
ProportionRoutines
RigorLiteracy Level
Math Level
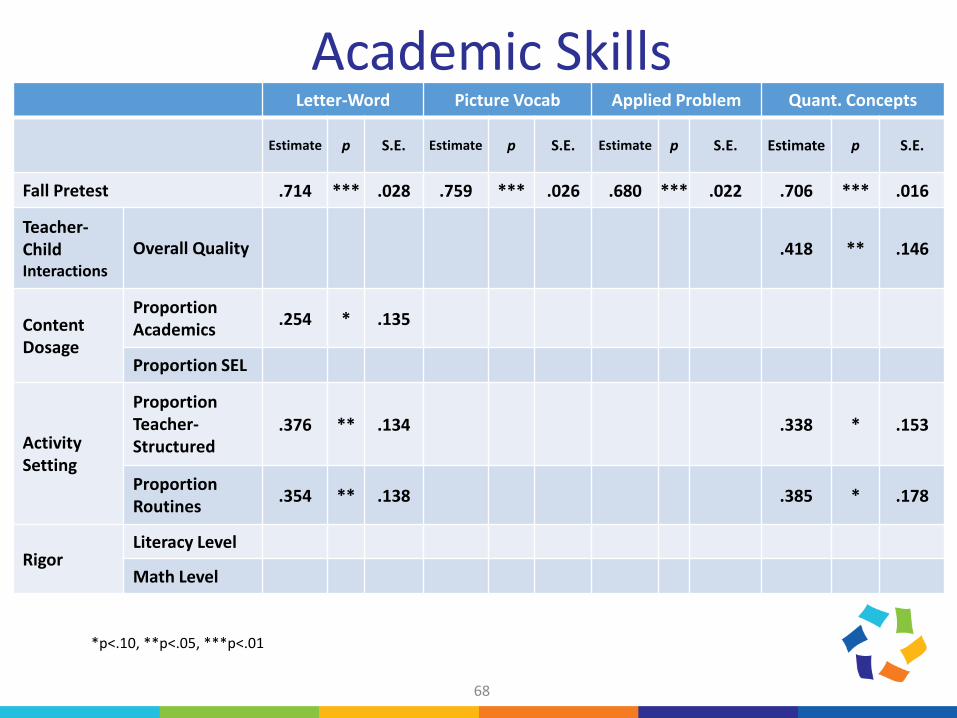
Academic Skills
68
*p<.10, **p<.05, ***p<.01
Letter-Word Picture Vocab Applied Problem Quant. Concepts
Estimate p S.E. Estimate p S.E. Estimate p S.E. Estimate p S.E.
Fall Pretest .714 *** .028 .759 *** .026 .680 *** .022 .706 *** .016
Teacher-Child Interactions
Overall Quality .418 ** .146
Content Dosage
Proportion Academics .254 * .135
Proportion SEL
Activity Setting
Proportion Teacher-Structured
.376 ** .134 .338 * .153
ProportionRoutines .354 ** .138 .385 * .178
RigorLiteracy Level
Math Level

Conclusions • Classroom practice and process findings remarkably similar to those
from NCEDL Multi-State Study• ~40% time in management, and routines; or no content-focused activity• Teachers: teaching basic skills and managerial (50%)• Some rise in exposure to academic content; teaching focused on basic skills
• Still sorting out how best to design and deliver programs that are both educational and developmental
• Curriculum use still highly varied
• Some early evidence that exposures to effective teacher-child interaction and educational content and structured setting promote greater performance in EF and academic skills
• Focus on examining moderated effects
• In Kindergarten, increase observation of child experience
69

70
Classroom quality and classroom network structure:
Interplay and prediction of student outcomes
Jessica Logan, Jing Chen, Laura Justice, Tzu-Jung Lin, Kelly Purtell
The Ohio State University
SREE Meeting
2/28/2018
Early Learning Ohio TeamPrincipal Investigator: Dr. Laura Justice
Co-Investigators:Dr. Tzu-Jung LinDr. Jessica LoganDr. Kelly Purtell
Some Key Project Staff:Jennifer BosticAllie HamiltonJanelle WilliamsonKatie FilibeckLauren BarnesAnna Rhoad-DrogalisHui JiangJing Chen

Early Learning Ohio
Broad goal: Expand our understanding of classroom ecologyA comprehensive examination of the classroom ecology and its relations with children’s learning PreK– grade three.

Classroom Network• Children’s language and social skills are shaped by who is around them
• Complexity of teacher talk (e.g., Justice et al., 2013)
• The skills of their peers (e.g., Justice, Logan, Lin, & Kaderavek, 2016)
• Classroom social networks directly measure who children spend time with, and can be characterized
• Children’s academic growth is likely affected by both classroom quality and the nature of the social network created by their peers (Gest et al., 2014)
• Children’s language is significantly predictive of classroom density in preschool (Chen et al., 2017).
• Higher language scores more dense classrooms

Classroom Density

ELO: Cross-Sectional Study NumbersStudy Year 1 (2016-2017 school year)
• One school district• Private PreK programs
• 79 classrooms in five grades: (Prek – 3rd Grade)• Attempted to enroll all children in each classroom
• 1,142 students with active and passive consent • 80% consent rate• Used for social network measures
• 915 with active consent• Used for child outcomes• 58% white, 78% speak fluent English, 60% moms have HS degree or less

Quality• Classroom quality rated by the CLASS (Pianta, La Paro, & Hamre, 2008)
• Live coded by trained observers, 2 cycles per classroom
Density• Rated per classroom in two ways:
• Students: Viewed a class roster and asked them who they like to play with.
• Teachers: Asked to rate how frequently each pair of students in their class play or work together
• Network density generated using SNA package in R (Butts 2016)

Capturing the classroom network
Stella D’Andre Poppy Lake Destiny Dylan Serenity
Stella X X X X X X X
D’Andre 0 X X X X X X
Poppy 2 0 X X X X X
Lake 0 2 1 X X X X
Destiny 1 1 1 2 X X X
Dylan 1 1 0 0 1 X X
Serenity 1 0 0 1 2 1 X

Results: Student Ratings• This is the network of a randomly
selected Preschool Classroom• Children were asked: “who do you
like to play with the most” • Children with no paths didn’t select
anyone and no one selected them.• Bi-directional arrows are reciprocal
friendships.• Directional arrows show child A
likes to play with child B. girl
boy
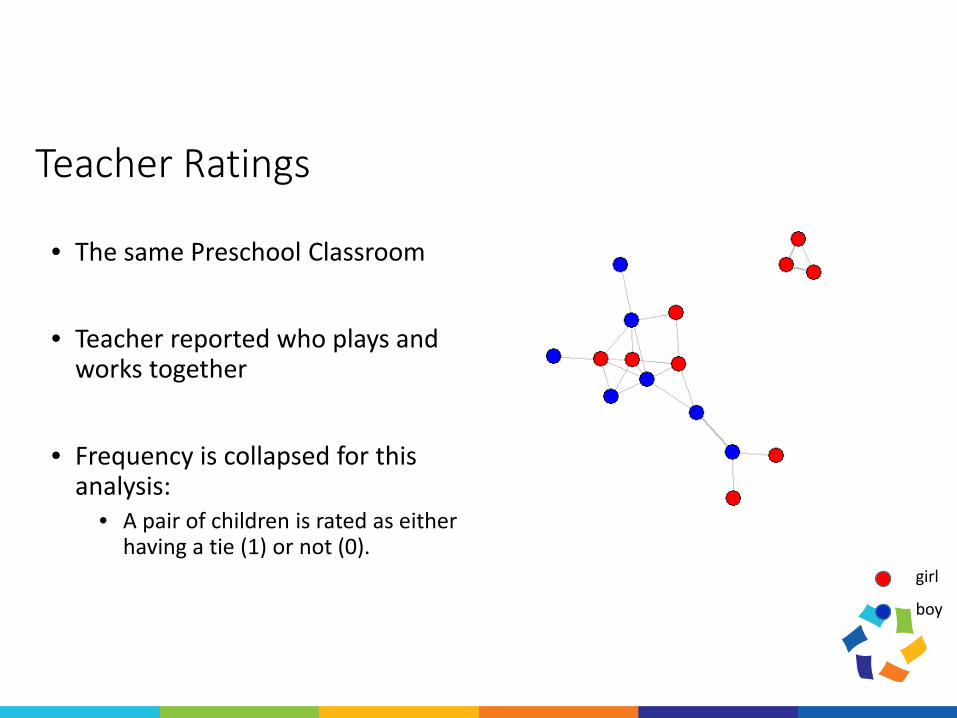
Teacher Ratings
• The same Preschool Classroom
• Teacher reported who plays and works together
• Frequency is collapsed for this analysis:
• A pair of children is rated as either having a tie (1) or not (0).
girl
boy

girl
boy
Pre-K KG1 G3
On average, density is significantly higher in PreK compared to all other grades.
Results: Teacher Ratings of Density
No information

Results: Child Report vs Teacher ReportPre-K K G1
Child
Teacher
girl
boy
No information

Child Report vs Teacher Report
PreK
G2 /G3
Child
rate
d de
nsity
Teacher rated density
K / G1

PreK: r = - .44
G2 /G3: r = .14
K / G1: r = .04
CLASS
Teac
her r
ated
den
sity
Teacher Report vs CLASS

Predicting Student Outcomes: Model building• HLM models nesting students within classrooms.• Outcomes (raw scores):
• Social Skills, Problem Behaviors: TCRS (Hightower, 1986)• Vocabulary, Reading, Math: Woodcock Johnson III
(Woodcock, McGrew, & Mather, 2007)• Covariates: Pretest, Gender, Age, Grade, Class size• Predictors of interest:
1) CLASS composite, Child-rated density, Teacher rated density2) Interaction between pretest and density3) Interaction between CLASS and density

Results: Main Effects
SS* PB* PV* LW* AP*Intercept -7.08* -0.42* 3.06* -12.88* 4.88*
Pretest 1.03* 0.88* 0.74* 0.88* 0.78*CLASS 0.08* 0.14* 0.23* 1.29* -0.25*
Child Density 13.91* 7.89* -1.94* 19.68* 5.43*Teacher Density 3.53* 0.64* 0.00* 1.12* 0.004
*p < .05, HLMs also included several covariates not pictured here.

Results: Pretest Interaction
SS PB PV LW APIntercept -7.08 -0.42 3.06 -12.88 4.88
Pretest 1.03* 0.88* 0.74* 0.88* 0.78*CLASS 0.08 0.14 0.23 1.29* -0.25
Child Density 13.91 7.89 -1.94 19.68 5.43Teacher Density 3.53* 0.64 0.00 1.12 0.004
Pretest*Teacher Interaction -0.14* -0.01 -0.02 0.02 -0.07*p < .05, HLMs also included several covariates not pictured here.
Q3: Interactions of CLASS with density: None were significantly different from zero.
Denser classrooms matter more for children with a low pretest

Conclusions• This is a preliminary look at these data.
• Another 90 classrooms are currently being collected.• For academic outcomes, will use W-scores (not yet all calculated)
• Only one of several proposed network-based predictors• Classroom hierarchical vs egalitarian• Norms (social and academic)
• Will also examine student-level network information• Number of ties a child has• Position within the network• Victimization
girlboy

Future Directions• We are also simultaneously conducting a longitudinal
study• 240 preschool children• 160 non-preschool attending peers (recruited in K)
• Does the classroom ecology look different for students who attended PreK and those who did not?
• Does the classroom ecology play a special role in students’ transitions to Kindergarten?

Thank you!
Pre-K K G1