early life environments and long term outcomes
TRANSCRIPT

Early Life Environments and Long Term
Outcomes
by
Corneliu Bolbocean
M.A. (Economics), Simon Fraser University, 2010 MPPM, University of Southern Maine, 2007
B.A., A.I.Cuza University, 2003
Thesis Submitted in Partial Fulfillment of the
Requirements for the Degree of
Doctor of Philosophy
in the
Department of Economics
Faculty of Arts and Social Sciences
Corneliu Bolbocean 2015
SIMON FRASER UNIVERSITY
Summer 2015

ii
Approval
Name: Corneliu Bolbocean
Degree: Doctor of Philosophy (Economics)
Title: Early Life Environments and Long Term Outcomes
Examining Committee: Chair: Bertille Antoine Associate Professor
Krishna Pendakur Senior Supervisor Professor
Kenneth Kasa Supervisor Professor
Hitoshi Shigeoka Supervisor Assistant Professor
Bohdan Nosyk Internal Examiner Associate Professor/Faculty of Health Sciences
Christopher Auld External Examiner Associate Professor Department of Economics University of Victoria
Date Defended/Approved: May 20, 2015

iii
Ethics Statement

iv
Abstract
A large literature has linked “in utero” environment to health and socio-economic
outcomes in adulthood. We consider the effect of early life environments on health and
skill formation outcomes. We first evaluate the impact of perinatal-neonatal level of
technology at birth, which varies across delivery institutions, on the long-term
neurodevelopmental outcomes of children with Cerebral Palsy. The level of technology
at delivery determines the type of therapy newborns receive immediately after birth. The
type of therapy is critical to prevent or treat adverse events around labor and delivery
which determine later neurological and neurocognitive impairments such as CP. We
evaluate the relationship between availability of neonatal technology, which is
associated with levels of care at delivery hospitals, and CP nonambulatory status, using
data from the Canadian Multi-Regional Cerebral Palsy Registry. In a follow-up paper we
further explore the efficiency of neonatal transfers across Quebec neonatal system. We
find robust evidence that there is no statistical significant relationship between level of
neonatal care at birth and CP severity. This finding means that differences in levels of
neonatal care and associated technology available at delivery are not associated at the
margin with the risk of a non-ambulatory CP phenotype among children with CP. Overall
we conclude that, in the Quebec regionalized neonatal care system, there is no gain to
increasing the level of care assigned to mothers at risk of CP.
We estimate the effect of mothers’ participation in the Supplementary Nutrition
Assistance Program and the Special Supplemental Nutrition Program for Women,
Infants, and Children on early cognitive and non-cognitive developmental outcomes as
measured by the Bayley Scales of Infant Development. Our data are from a large,
prospective, community-based panel study of mother-infant pairs. In this rich data set we
can directly identify the change in neurodevelopmental outcomes associated with
changes in food programs uptake. In a model where unobserved heterogeneity only
affects the level of neurodevelopmental outcomes this can be interpreted as a causal
effect. Our results suggest that brief prenatal investments may be more cost effective
than traditional educational interventions in improving early childhood developmental
outcome.

v
Keywords: Economics of human development, capacities, maternal and fetal nutrition, neonatal health, “in utero” environment.

vi
Dedication
To my dad and mom.
“Then you will know the truth, and the truth will set you free” John 8:32

vii
Acknowledgements
I want to thank my senior supervisor Krishna Pendakur who taught me the rigor,
discipline and gave me enough freedom required for quality research work. I am truly
grateful for all his contributions of time, ideas and funding that made my Ph.D.
experience a productive one. I would also like to thank my other supervisor Kenneth
Kasa for his unconditional support when I needed it the most and his generous time and
advice. I am grateful to Hitoshi Shegeoka for his openness, availability, and support, and
my co-authors Fran Tylavsky, Teresa Waters, Michael Shevell. My thanks also go to
Bertille Antoine, Simon Woodcock, Christoph Luelfesmann, Chris Muris, Fernando
Martin, Dan Goldowitz, Doug Swanson, Kristian Thorlund, Alexander Vedrashko, David
Andolfatto, Stephen Easton, Brian Krauth, Fernando Aragon, Christoph Luelfesmann,
Very Reverent Archpriest Serge Overt, Pavel Lapeshin, Gwen Wild, Kathleen Vieira-
Ribeiro, and Chris Richarson. My family, friends and relatives played an important role in
the realization of this work. I am indebted to my parents Vasile and Eugenia. I am
thankful to my love Anna who brought sunshine into the tough days of my job market
experience. My thoughts also go to my brother Andrei. I am thankful to Ion Vrabie, Priest
Igor, Marina Caliga, Lorne Prupas, Igor and Tatiana Macovei, Evelina Ghergheligiu,
Jacob Smith, Kate Correll, Barbara Fraumeni, AbouEl-Makarim Aboueissa, Richard
Barringer, Denis and Nova Maack. I gratefully acknowledge financial support from the
NeuroDevNet and Open Society Foundation and the academic and technical support of
the SFU department of Economics.

viii
Table of Contents
Approval .......................................................................................................................... ii Ethics Statement ............................................................................................................ iii Abstract .......................................................................................................................... iv Dedication ...................................................................................................................... vi Acknowledgements ....................................................................................................... vii Table of Contents .......................................................................................................... viii List of Tables ................................................................................................................... x
Chapter 1. The impact of Level of Care at Birth on Long Term Health Outcomes: Evidence from Children with Cerebral Palsy Introduction ............................................................................................. 1
Background ............................................................................................................ 4 1.1.1. Cerebral Palsy (CP) ................................................................................... 4 1.1.2. Perinatal Regionalization ........................................................................... 5
Material and Methods ............................................................................................. 6 1.2.1. Data ........................................................................................................... 6
Empirical Strategy .................................................................................................. 9 1.3.1. Overview ................................................................................................... 9 1.3.2. Model and Assumptions ............................................................................ 9 1.3.3. Implementation under Exogeneity ........................................................... 11
Propensity Score Matching (PSM) ......................................................................... 11 Ordinary Least Squares (OLS) .............................................................................. 13 Robustness - Alternative Estimation Strategies ..................................................... 14
1.3.4. Results - Analysis under Exogeneity ........................................................ 14 1.3.5. Implementation under Endogeneity ......................................................... 15
Instrumental Variables and Generalized Method of Moments ............................... 15 Endogenous Bivariate Probit Model....................................................................... 16
1.3.6. Results - Analysis under Endogeneity ..................................................... 17 Conclusion ............................................................................................................ 18
Chapter 2. Interhospital Transfers and Long Term Health Outcomes within a Regionalized Neonatal-Perinatal System. Evidence from a Population based Cerebral Palsy Registry. ............................. 32
Introduction ........................................................................................................... 32 Material and Methods ........................................................................................... 33
2.2.1. Data ......................................................................................................... 33 Empirical Strategy Overview ................................................................................. 35
2.3.1. Model and Assumptions .......................................................................... 36 2.3.2. Implementation under Exogeneity ........................................................... 37
Propensity Score Matching (PSM) ......................................................................... 37 Ordinary Least Squares (OLS) and Propensity score matching ............................ 37
Results ................................................................................................................. 38 Conclusion ............................................................................................................ 39

ix
Chapter 3. Nutrition assistance programs Early Skills Formation: Evidence from a Community Based Large Pregnant Cohort ............. 41
Introduction ........................................................................................................... 41 Early skill formation .............................................................................................. 45 Nutrition and Early Skill Formation ........................................................................ 45 Material and Methods ........................................................................................... 47
3.4.1. Data ......................................................................................................... 47 3.4.2. Measures of infant cognitive and noncognitive development ................... 48
Empirical Strategy ................................................................................................ 50 3.5.1. Overview ................................................................................................. 50 3.5.2. The Estimation Strategy - Panels ............................................................ 50
Results ................................................................................................................. 53 Conclusion ............................................................................................................ 54
References ................................................................................................................ 64 Appendix. Definitions of the levels of the neonatal care used in Quebec ...................... 73

x
List of Tables
Table 1-1. General Characteristics of the Population .............................................. 22
Table 1-2. Propensity Score Matching Results ........................................................ 23
Table 1-3. Linear Probability Model Results ............................................................ 24
Table 1-4. Instrumental Variables Results (Level II vs Level I) ................................ 25
Table 1-5. First Stage (Level II vs Level I) ............................................................... 26
Table 1-6. Instrumental Variables Results (Level III vs Level I) ............................... 27
Table 1-7. First Stage (Level III vs Level I) .............................................................. 28
Table 1-8. Instrumental Variables Results (Levels III and II vs Level I) .................... 29
Table 1-9. First Stage (Level III vs Level II) ............................................................. 30
Table 2-1. First Stage (Level III vs Level II) ................ ........................................... ..40
Table 2-2 Linear Probability Model Results ............................................................ 40
Table 2-3 Linear Probability Model Results ............................................................ 40
Table 3-1 Summary statistics of BSID-III raw scores .............................................. 55
Table 3-2 Summary of food programs uptake ........................................................ 56
Table 3-3 Summary of infant measures.................................................................. 57
Table 3-4 Summary of sociodemographic measures for mothers .......................... 58
Table 3-5 Overall Effect of participation in Federal Nutrition Assistance Programs (SNAP or WIC) ...................................................................... 60
Table 3-6 Adjusted Overall Effect of participation in Federal Nutrition Assistance Programs (SNAP or WIC) .................................................... 61
Table 3-7 Robustness checks more controls .......................................................... 62
Table 3-8 Regression results of predicted fixed effects on time-invariant controls .................................................................................................. 63

1
Chapter 1. The impact of Level of Care at Birth on Long Term Health Outcomes: Evidence from Children with Cerebral Palsy Introduction
The adoption and diffusion of new technological advances in fetal diagnostics
and therapy has changed the way doctors deliver care to neonates in North America and
around the world. These innovations have resulted in the ability to save lives of the
majority of even the sickest and smallest newborns (23 to 25 weeks of gestational age),
which thirty years ago were not considered viable. However, improvements in neonatal
health outcomes have come at an increasing cost to health care systems. Perinatal
regionalization, meaning the tiered provision of neonatal care, emerged over time as a
strategy to balance this fundamental tradeoff and provide optimal, risk-appropriate
maternal child services for a geographically dispersed population[1]. These systems of
regional perinatal services are now common across North America and around the
world, and are linked to improved outcomes for high-risk infants born either preterm or
with serious medical or surgical conditions [2], [3].
Regionalization of perinatal care has facilitated the diffusion of newly-developed
neonatal technologies and improved access of newborns in the community to innovative
interventions. Evidence from existing clinical and health research links perinatal
regionalization with improved neonatal outcomes for infants born preterm and with low
birth weight [1]. The impact of improved neonatal interventions in early childhood on later
life outcomes is documented in a growing economics literature. In particular, Bharadwaj
et al. show that children who receive extra medical care at birth have lower mortality
rates and higher test scores and better grades in school [4]. Moreover, the effects of

2
poor neonatal health on adult outcomes are set very early [5]. However, there are
growing concerns about the high costs of neonatal intensive care as well as the
substantial financial burden survivors of neonatal intensive care might pose on their
families and health care system [6], [7]. While the overall efficacy of specific advances in
neonatal-perinatal medicine has been established in the literature [8]–[10], limited
evidence exists on the overall effectiveness of technological change in neonatal care
and its impact on long-term health outcomes.
This study evaluates the impact of perinatal-neonatal level of technology, which
varies across delivery institutions, on the long-term neurodevelopmental outcomes of
children with Cerebral Palsy (CP). The level of technology at delivery determines the
type of therapy newborns receive immediately after birth. The type of therapy is critical to
prevent or treat adverse events around labor and delivery which determine later
neurological and neurocognitive impairments such as CP[11]. Specifically, we evaluate
the relationship between availability of neonatal technology, which is associated with
levels of care at delivery hospitals, and CP non-ambulatory status, using data from the
Canadian Multi-Regional Cerebral Palsy Registry (CCPR).
The challenge of examining this relationship is that the level of technology
available at delivery is not randomly assigned. We aim to remove selection bias
(confounding by indication) which originates as a result of high-risk pregnancies and
births being assigned to hospitals with better levels of care and associated medical
technology (levels II, III). To deal with this bias, we use controls for biological risk factors
for CP. Additionally, we consider an instrumental variables strategy to deal with possible
unobserved risk factors.
Our empirical approach relies upon propensity score-matching (PSM) and
multivariate regression methods using high-quality observables. We motivate the
selection on observables assumption because CCPR contains all known prenatal,
neonatal and postnatal risk factors associated with CP. We have made use of all known
causal and correlated risk factors associated with CP as reported in the medical
literature, including selected maternal behaviours, such as drug addiction and smoking.
However, there may be other, unknown causes of CP related to maternal behaviours

3
that are correlated with decisions regarding choice of delivery hospital. To account for
these potential unknown factors, we use instrumental variables methods.
To preview our main results, we find robust evidence that there is no statistical
significant relationship between level of neonatal care at birth and CP severity (non-
ambulatory status). This finding means that differences in levels of neonatal care and
associated technology available at delivery are not associated at the margin with the risk
of a non-ambulatory CP phenotype among children with CP. We conclude that, in the
Quebec regionalized neonatal care system, there is no gain to increasing the level of
care assigned to mothers at risk of CP.
This paper makes three main important contributions to the economics and
health services research literature which links advances in medical technology to
improved health outcomes. First, we estimate the effect of neonatal-perinatal technology
availability at delivery on long-term neurodevelopmental outcomes. Second, we use
uniform definitions of level of care (consistent with the American Academy of Pediatrics
standards) across the province of Quebec, Canada and what we believe is the best
feasible case-mix adjustment (aka: good observed control variables) between the three
groups of hospitals. Third, we are the first to study the effect of neonatal care-level and
technology at delivery on long-term health outcomes using instrumental variables
methods.
The paper proceeds as follows. Section 1 provides the background and an
outline of our identification strategy using a potential outcomes framework. We also
describe here our main regression model. Details regarding our data sources, sample
inclusion, and exclusion criteria as well as relevant medical background, are provided in
Section 2. Section 3 begins by outlining our empirical framework and details the
estimation strategies. In this section we also report our main estimates and explore
robustness of these results. We offer conclusions in Section 4.

4
Background
1.1.1. Cerebral Palsy (CP)
CP is a set of variable clinical symptoms which result from either an anomaly
and/or early damage to the motor regions of the brain, causing graded levels of
observable motor dysfunction [12]. CP remains the largest single cause of childhood
physical disability in the developed world [13] and it is estimated to affect approximately
2.0-2.5 infants per 1,000 live births [14]. CP is believed to be caused by congenital brain
abnormalities or acquired brain injuries [11]. However, little is known regarding the
factors that determine the severity of CP and whether the level of neonatal care
available at the site of birth might influence the eventual severity of the condition.
Although onset is at birth or in early childhood, CP persists throughout an
individual’s life and implies a significant economic burden. The US Center for Disease
Control (CDC) and Prevention estimated the lifetime costs of CP per individual to be
$921,000 in 2003, [15]. A more recent Danish study reports the approximate lifetime cost
of CP was 860,000 Euros for men and 800,000 Euros for women. The largest
component of these expenditures was social care costs, particularly during childhood
[16]; however the lifetime costs of CP depend on the severity of the condition and
specifically on non-ambulatory status.
The International CP Task Force recognized that some cases of CP probably
originate in labour; however, it is now widely accepted that most CP cases are not the
result of intrapartum events, and in particular of substantial intrapartum hypoxia [17].
However, allegations of causation of CP in obstetrical clinical negligence claims are
common and usually focus on the obstetrical care provided in the intrapartum period
[18], [19]. Past studies have explored the relation between the quality of care given to a
mother during labour and delivery and later CP, and an association between suboptimal
care and CP was found in only a small proportion of CP cases [20]. However, past
research did not control for the level of immediate postnatal care available subsequent to
labor and delivery. Moreover, the relationship between the level of neonatal care

5
available at birth, the severity of CP, and the impact of perinatal and neonatal factors on
later severity is presently unknown.
1.1.2. Perinatal Regionalization
Following some initial recommendations for the regional development of maternal
and perinatal health services made by the Committee on Perinatal Health (March of
Dimes) in a 1976 report, the American Academy of Pediatrics (AAP) Committee on
Fetus and Newborn issued two policy statements on levels of neonatal care [21], [22].
The 2012 policy statement recommended regionalized systems of perinatal care “to
ensure that each newborn infant is delivered and cared for in a facility appropriate for his
or her health care needs and to facilitate the achievement of optimal outcomes.” (p.
1346).
In North America, the concept of perinatal regionalization emerged in North
America, first in Canada [23], followed in the U.S. in 1971 by the American Medican
Association's House of Delegates' report [24]. Delivery hospitals were classified into one
of three levels according to the degree of complexity of maternal and perinatal care each
was capable of providing. European countries had implemented decentralized maternity
services as well to ensure good access to necessary care independent of place of
residence [25].
A large body of clinical literature documents that high-risk infants have better
health outcomes in deliveries with neonatal care (typically level II or III hospitals). In a
comprehensive review of 41 published studies conducted between 1979 and 2008,
involving the use of different research designs (including randomized, clinically-
controlled trials, cohort, and case-control studies), Lasswell in [1] conclude: “for VLBW
(birth weight <1,500 g) and VPT [very preterm] (less than 32 weeks’ gestation) infants,
birth outside of a level III hospital is significantly associated with increased likelihood of
neonatal or predischarge death.” However, more recent economics literature has linked
neonatal care to longer-term outcomes, including educational achievement and long-
term health status.

6
Due to its size and relatively sparse population, Canada has a highly regionalized
neonatal-perinatal care system and nearly all deliveries take place in public
hospitals[26]. Low-risk deliveries are carried out at level I facilities (well newborn
nurseries), while medium and high-risk deliveries are referred to level II (specialty care)
or level III (subspecialty care) hospitals, according to hospitals’ catchment areas. This
classification reflects differences in the level of perinatal resources and obstetric
competence available at a specific delivery hospital.
High risk deliveries are identified based on unified national medical guidelines
[27], [28] and are referred to central or regional hospitals which each have their own
neonatal department for dealing with high-risk deliveries [29]. Prediction of the infant’s
state at birth determines referrals to level II and III hospitals; however, there are no
formal guidelines in Canada for the referral of deliveries to level II or III hospitals.
Material and Methods
1.2.1. Data
The study was conducted using Quebec provincial data from the Canadian Multi-
Regional Cerebral Palsy Registry (CCPR). A detailed description of this unique registry
can be found in [14]. Utilizing the framework of the regionalization of pediatric
rehabilitation service delivery, children with CP born in 1999 or later were enrolled within
six of the province’s 17 administrative health regions, capturing approximately half of the
province’s population within the CCPR. Once cases are identified, parental consent is
obtained and maternal medical and obstetric records, as well as the child’s neonatal,
medical, and rehabilitation records, are reviewed. These data are supplemented by a
standardized parental interview and physical examination of the child by a pediatric
neurologist, developmental pediatrician, or child physiatrist. For each enrolled child,
more than 120 variables are collected and entered into a Research Electronic Database
Capture database. In populating the CCPR, local ethics board approval was obtained
from each participating institution. The Research Ethics Board at the McGill University
Health Center Research Institute provided central approval for CCPR data storage,
analysis, and overall operations. To be enrolled in CCPR, a child must be at least two

7
years of age and meet diagnostic criteria for CP, including a clinical diagnosis of a non-
progressive motor impairment resulting from a presumably early insult to the developing
brain [12]. A follow-up at 5 years of age is used to confirm the diagnosis and update
functional outcome variables.
Children within the CCPR included for analysis in this study were born between
1999 and 2008 in the province of Quebec, which ensured that all participants had a five-
year follow-up and confirmation of status available. Children with CP diagnosis linked to
any identified post-neonatal cause or cases born outside the province of Quebec were
excluded from our investigation.
For our analysis, we classified children according to level of neonatal care
available where delivery was carried out [21]. In Quebec maternity care is regionalized
and nearly all deliveries take place in public hospitals or birthing centers. Low-risk
deliveries are carried out at level I hospitals (well newborn nurseries), level II hospitals
(specialty care) or level III hospitals (subspecialty). We used clear, uniform definitions
and consistent standards to classify level of neonatal care across the study sites, and
appropriate adjustment for differences in case mix between the three groups of
hospitals. We classified each delivery unit according to its level of neonatal care using
the policy statement on this topic provided by the American Academy of Pediatrics [21]
(Appendix 1). This classification reflects differences in the level of obstetric and neonatal
competences available at the hospital, outlined in more detail in Appendix 1. In brief,
level I centers care for newborns 34 sweeks gestation or more, and can offer
intravenous therapy, phototherapy and gavage feeding. Level II centers care for
newborns 30 weeks gestation or more, and in addition to level I services can offer
ventilation by nasal passage or endotracheal intubation. Level III centers care for
newborns regardless of gestational age and in addition to the above services offer nitric
oxide therapy, immediate access to pediatric subspecialties, imaging, and surgeries.
The outcome used for this analysis was CP non-ambulatory status, as defined by
a Gross Motor Function Classification System (GMFCS) level IV or level V [30]. The
major challenge for our research was to control for case-mix differences between types
of hospitals. In particular, level II and level III hospitals have a higher proportion of

8
medium and high-risk pregnancies compared with level I hospitals. We used a quasi-
experimental study design [31], controlling for relevant covariates in order to remove
selection bias (confounding by indication) that could originate from the differences in
case mix between the three groups of hospitals. Our rich dataset allowed us to control
for all known biological CP risk factors.
Our data contained a large number of variables about mother and child, allowing
us to make appropriate adjustments for differences in case mix between hospitals using
propensity score matching. We used current clinical practice guidelines in obstetrics and
gynecology [29], perinatal surveillance literature [27] and CP risk factors [32] to choose
explanatory variables and make proper adjustments for differences in case mix between
hospitals. The following covariates were used to control for risk factors (and deal with
selection bias/confounding by indication): birth weight, gestational age, preeclampsia,
gestational diabetes, bleeding during pregnancy, severe illness during pregnancy,
accident or trauma during pregnancy, preterm birth, a family history of CP, low maternal
education (lacking a high school diploma), maternal age, and history of drug use[32],
[33]. We also controlled for perinatal asphyxia, which was defined as neonatal
encephalopathy with at least three of the following criteria: an Apgar score < 6 at 5
minutes, a cord pH of < 7.0, a cord base excess > 12, an abnormal fetal heart rate such
as tachycardia (>160 beats per minute) or bradycardia (<120 beats per minute),
presence of meconium, need for intubation, delay in spontaneous respiration, need for
resuscitation of the newborn, multisystem involvement in the neonatal period, or
abnormal imaging results consistent with hypoxic ischemic injury. We also tested for
effect modification relationship between perinatal asphyxia and level of care at delivery.
However, the interaction was not statistically significant and post-estimation tests
suggested that it did not significantly improve the model’s performance. We therefore did
not include this interaction term in any subsequent analyses.
Our cohort of 360 children with CP without any post-neonatal cause were born in
Quebec between 1999 and 2008. Forty-six percent were born in birth sites with Level III
neonatal care, 20% with Level II and the remainder (34%) with Level I neonatal care.
Non-ambulatory status (Gross Motor Function Classification System level IV and level V)

9
was reported in 27% of the cases. The other characteristics of the sample are presented
in Table 1.
Empirical Strategy
1.3.1. Overview
Our empirical objective is to isolate the causal effect of level of neonatal care
available at delivery on CP non-ambulatory status. The challenge in examining this
research question is that level of neonatal care at delivery is not randomly assigned. We
therefore offer an identification strategy that does not rely on random assignment. In
particular, we first conduct the analysis assuming that selection on observables holds.
Given that we have very rich covariates including all known biological risk factors (which
are used by referring doctors), we are rely on selection on observables assumption.
However, as a robustness check we also isolate the causal effect of interest under
selection on unobservables using instrumental variables.
1.3.2. Model and Assumptions
Let 𝑌𝑗 = {𝑌𝑗0, 𝑌𝑗
1 } equal the potential outcome of a child with CP, whose birth
was carried out depending on the level of care available at delivery 𝐷𝑗 = {0,1 }, where
𝐷 = 1 indicates that birth occurred in a delivery with a superior level of care. For each
child we observe only one set of potential outcomes as a function of level of care at
delivery:
𝑌𝑗 = 𝑌𝑗0 + (𝑌𝑗
1 − 𝑌𝑗0)𝐷𝑗.
In general, we expect potential outcomes of each child to differ as a function of
level of care available at delivery. This implies that the absence of random assignment of
level of care at delivery means that we cannot obtain a valid causal estimate of the effect
of level of care on non-ambulatory CP status. To see why, consider the non-

10
experimental comparison between the outcomes of children born in deliveries with
different levels of neonatal care. This comparison is:
𝐸(𝑌𝑗|𝐷 = 1) − 𝐸(𝑌𝑗|𝐷 = 0)
= {𝐸(𝑌𝑗1|𝐷 = 1) − 𝐸(𝑌𝑗
1|𝐷 = 0)} + {𝐸(𝑌𝑗1|𝐷 = 0) − 𝐸(𝑌𝑗
0|𝐷 = 0)}
where {𝐸(𝑌𝑗1|𝐷 = 1) − 𝐸(𝑌𝑗
1|𝐷 = 0)}
is the average causal effect of level of care available at delivery on outcome 𝑌
and the second bracketed term is the bias term, originating from differences in potential
outcomes between children who are born in deliveries with different levels of neonatal
care. Previous research suggests that this bias term might not be non-zero. Children
born within deliveries with higher levels of neonatal care differ greatly in terms of
mothers` characteristics, health status and later outcomes. Thus, we can learn little
about the causal effect of level of care on children`s CP outcomes by contrasting the
outcomes of CP children from birth who received different levels of neonatal care.
To solve this identification problem we invoke the following identifying
assumption:
𝑌𝑗1, 𝑌𝑗
0 ⊥ 𝐷𝑗|𝑋𝑗,
meaning that we assume that potential outcomes in children with CP are
conditionally independent of the level of care available at delivery. This assumption
states that potential outcomes is as good as randomly assigned to level of care available
at delivery given observables. If so, any observed difference in the outcome across level
of care available at delivery will reflect the causal effect of neonatal care level on CP
non-ambulatory status. Formally we can estimate the causal effect of level of care at
delivery on CP non-ambulatory status:
𝐸(𝑌𝑗|𝑋𝑖, 𝐷 = 1) − 𝐸(𝑌𝑗|𝑋𝑖, 𝐷 = 0) = {𝐸(𝑌𝑗1|𝑋𝑖, 𝐷 = 1) − 𝐸(𝑌𝑗
1|𝑋𝑖, 𝐷 = 0)} +
{𝐸(𝑌𝑗1|𝑋𝑖, 𝐷 = 0) − 𝐸(𝑌𝑗
0|𝑋𝑖, 𝐷 = 0)} = {𝐸(𝑌𝑗1|𝑋𝑖, 𝐷 = 1) − 𝐸(𝑌𝑗
1|𝑋𝑖, 𝐷 = 0)},

11
where the last equality follows from conditional independence assumption.
Is this strategy for identifying the casual effect of type of neonatal care at delivery
on CP non-ambulatory status plausible? Our assumption requires that there is no
differential effect of neonatal care level at delivery on the latent CP non-ambulatory
status. This assumption cannot be directly tested given the fundamental problem of
causal inference. However, we can partially assess its validity by testing whether CP
non-ambulatory status differs across neonatal level of care at delivery given covariates.
We find no evidence that these gaps vary with the level of care at delivery, which lends
credibility to the assumption.
1.3.3. Implementation under Exogeneity
Propensity Score Matching (PSM)
We use propensity score matching (PSM) to estimate the effect of level of care at
delivery on later CP non-ambulatory status. Along with selection on observables
assumption this requires that for all values of the covariates the probability of receiving a
treatment (delivery at level II or level III) is strictly positive. Formally this means:
𝑃(𝑇 = 1|𝑋 = 𝑥) = 𝑒(𝑥),
and we assume that 0 < 𝑒(𝑥) < 1.
This permits the estimation of the causal effect of interest via matching strategies
as opposed to regression. The first step in conducting the propensity score and
subsequent doubly robust estimation is to choose the variables that describe the
treatment equation. The treatment equation is defined as the probability of birth within
level II or level III care.
Our choice of covariates that would satisfy conditional independence assumption
and subsequently specify the treatment equation specification is determined by clinical
guidelines published by the Society of Obstetricians and Gynaecologists of Canada,

12
obstetrical policy documents, the prevailing medical and epidemiological literature as
well as informed by clinical judgment[32]–[35]. To our knowledge, there are no
guidelines in Canada that outline the decision-making process used to determine
whether a birth should be assigned to a specific level of care. We believe that after
controlling for covariates listed in Section 2.0, little unobserved heterogeneity is left that
is systematically correlated with CP ambulatory status and the treatment assignment.
However, the propensity score estimation also requires that the stable unit
treatment value assumption holds. Our data satisfy the stable unit treatment value
assumption given that treatment of one birth does not affect the potential CP severity of
another individual. We choose a logistic specification for the propensity score model and
in particular:
𝑃(𝑇 = 1|𝑋 = 𝑥) =exp (𝑥′𝛾)
1+exp (𝑥′𝛾),
where 𝑋 contains covariate set described in Section 2.0. We conduct formal
analysis to test the balancing property of the propensity score. Our tests suggest that the
balancing property is satisfied and the computation algorithm was restricted to common
support under logit model.
The matching process. There are number of approaches to perform propensity
score estimations of the casual effect of interest. The use of each method implies a
particular tradeoff in terms of bias and efficiency; however, asymptotically all matching
algorithms yield the same results. Heckman et al [36] suggest that kernel and local
linear matching estimators have the advantage of reduction of the asymptotic mean
squared error versus pairwise matching. Kernel matching uses several comparison
group members, pairing a treatment case with the weighted average score of all control
cases within a certain distance (kernel is the name of the weighting function, and the
distance is determined by the bandwidth of the kernel). We implement one-to-one
nearest neighborhood, radius matching, kernel matching and local linear regression
matching algorithms. We restricted the estimation of average treatment effect on the
treated (ATT) on the common support for all matching algorithms. The implementation of
different matching algorithms should yield different average treatment effects on the

13
treated. However, we used bootstrapping, which was repeated 300 times, to derive the
bootstrapped standard errors for ATT.
Assessing the common support. We checked common support condition using
the density distributions of the propensity scores for births occurred across levels of
care. We restricted the analysis to common support condition, and treated individuals
who fall outside the common support region were discarded from the analysis.
Evaluation of matching quality. We use several methods to assess whether the
distribution of the baseline covariates is similar between different treatment groups such
as: standardized bias, Pseudo-R2 and likelihood ratio tests. For each covariate 𝑋 we
compute the standardized bias as suggested by Rosenbaum et al [37].
Assessing the Unconfoundedness Assumption. Our identification framework
requires orthogonality between level of neonatal care at delivery and potential CP
outcomes given observables. This means that conditional on observed regressors, the
selection process into treatment is not related to unmeasured variables that affect the
outcome variable, or that confounding by indication can be completely eliminated using
the propensity score method. The validity of this assumption cannot be directly tested.
We implement several empirical established approaches in the literature to
assess the credibility of this assumption. In particular, we implement Rosenbaum
bounds [38] and mhbounds module for Stata [39] to estimate the extent to which the
departure from selection on observables may alter reported propensity score estimates.
We had also assessed the robustness of the result using several OLS specifications with
and without controls.
Ordinary Least Squares (OLS)
We bring this conceptual framework to the data by estimating the following
baseline model using OLS:
𝑌𝑖 = 𝛽0 + 𝛽1𝐷𝑗 + 𝑋𝑖′𝛾 + 𝑒𝑖.

14
Here, 𝑌𝑖 represents CP outcome for child 𝑖, 𝐷𝑗 is an indicator for level of care at
delivery where the child was born. The omitted category is therefore level I care. Vector
𝑋𝑖 of controls defined in Section 2.0 The coefficient of interest is 𝛽1 which represents the
casual effect of level of care at delivery on CP non-ambulatory status relative to the
omitted category of level I care. One concern with the estimation approach is that we
may potentially bias estimates of 𝛽1 if unobservable factors have a causal impact on the
level of care at delivery; then it may be invalid to treat level of care as good as randomly
assigned given the covariates.
Robustness - Alternative Estimation Strategies
We further investigated the robustness of propensity score results using a doubly
robust estimation of average treatment effect on the treated. A doubly robust estimation
combines outcome regression with weighting by propensity score such that the causal
effect of interest is robust to misspecification of one of these models [40], [41]. An
estimator is doubly robust if it remains consistent when either a model for the treatment
assignment mechanism or a model for the distribution of the counterfactual data is
correctly specified.
1.3.4. Results - Analysis under Exogeneity
PSM estimates (average treatment effect on the treated), standard errors and
associated 95% confidence intervals are displayed in Table 2. PSM estimates generally
pointed to no effect of the level of neonatal care at delivery and later CP non-ambulatory
status. There was no statistical significant evidence that delivery carried out in level II or
level III hospitals vs level I hospital had any effect on the incidence of CP non-
ambulatory status. We found risk estimates for Level II vs Level I, and for Level III vs
Level I, to be weakly negative and not statistically significant. A positive and statistically
significant risk estimate was found for the Level III vs Level II comparison, suggesting
presence of unobserved selection effects. However, the propensity score matching
substantially reduced the case-mix differences between the groups of hospitals; absolute
standardized bias after adjustments was less than 5% for most risk factors. We reached

15
similar conclusions via linear probability model, doubly robust estimation and probit
model.
A linear probability model did show that several point estimates were statistically
significant at conventional levels and are noteworthy (Table 3). These models found a
statistically significant association between CP non-ambulatory status and perinatal
asphyxia (p<0.01), low maternal education (p<0.1) and preterm birth (p<0.1).
Asphyxia was present in 15% of these children in our cohort; 15.5 % were born
at sites with level I neonatal care, 18.6 % of those born at sites with level II neonatal care
and 12.6 % born at sites with level III neonatal care. We find that asphyxiated versus
non-asphyxiated kids have 2.86 (95% CI 1.57, 5.21) the unadjusted odds of developing
a CP non-ambulatory status, while the linear probability model suggests that presence of
perinatal asphyxia increases the probability of non-ambulatory status by 27% all else
being equal. Preterm birth is found to increase the chances of later CP non-ambulatory
status by 9% all else being equal, and low maternal education increased the risk of CP
non-ambulatory status by 2%.
1.3.5. Implementation under Endogeneity
Instrumental Variables and Generalized Method of Moments
We implement instrumental variable estimation as robustness check not relying
on conditional identifying assumption. Therefore we used multivariate instrumental
variables regression along with generalized method of moments, which allows for
unobserved risk factors that affect the referral to hospital type and outcomes conditional
on that referral, but which often suffers from imprecise estimates. Instrumental variables
estimation uses covariates that influence hospital type but which do not influence CP
severity. We utilize the mother’s residence at birth, using the following indicator
variables: indicators for greater Montreal, city of Quebec, Gatineau, Sherbrooke, or
indicator for a census metropolitan area. We used Statistics Canada classification of

16
census metropolitan areas to construct a central metropolitan area indicator as well as
Population and Dwellings Counts for Canada.
In other words using instrumental variables we estimate the following first stage
equation:
𝐷𝑖 = 𝜋0 + 𝜋1𝑍𝑖 + 𝑋𝑖′𝜋 + 𝜀𝑖.
The second stage uses as an instrument the predicted probability 𝐷�̂� the main
estimating equation is the following (variables where defined above):
𝑌𝑖 = 𝛽0 + 𝛽1𝐷�̂� + 𝑋𝑖′𝛾 + 𝑒𝑖
Here the first-stage relationship estimates whether the residence at birth
influences level of neonatal care at hospital where the delivery was carried out. In order
for the IV approach to deliver consistent estimates we need to assume exogeneity and
excludability of the instrument. While we had empirically tested both requirements and
our results suggest that instruments are very strong and relevant, here we provide the
intuition behind our IV approach.
Our expectation is that residence of the mother is a significant factor to influence
choice of delivery hospital. In particular, we expect pregnant residing within census
metropolitan areas to be more likely to deliver in hospitals with level II, or level III
neonatal care as this type of hospitals are located in metropolitan areas. However, we
expect type of residence to be orthogonal to unobserved components of CP non-
ambulatory status as the type of residence is not systematically related to known
determinants of this neurological diseases.
Endogenous Bivariate Probit Model
We also estimate this model using bi-variate probit regression. The first stage
can be written:

17
𝐷𝑖 = 𝐼[𝜋0 + 𝜋1𝑍𝑖 + 𝑋𝑖′𝜋 > 𝜀𝑗],
where I[.] is the indicator function, and the outcome is determined by:
𝑌𝑖 = 𝐼[𝛽0 + 𝛽1𝐷𝑖 + 𝑋𝑖′𝛾 > 𝑒𝑖].
The correlation between 𝑒𝑖, 𝜀𝑖 is the source of omitted variable bias. The
identification requires that excluded instruments 𝑍𝑖 is independent of 𝑒𝑖, 𝜀𝑖, which are
assumed to be normally distributed. Given the distributional assumptions imposed on
error terms this model can be estimated using maximum likelihood estimation.
1.3.6. Results - Analysis under Endogeneity
We used instrumental variables methods to produce estimates of the causal
effect of secondary care on ambulatory status in children with CP allowing for the non-
random assignment into level of care given observable. Our instrumental variables (IV)
estimation confirmed no effect relationship between the level of care available at time of
delivery and CP non-ambulatory status (Appendices 2-4).
In addition to the causal effect estimate tables includes a number of test statistics
assessing the specification of the various models. We report p-values from Hansen J
test for overidentifying restrictions, the Anderson-Rubin Wald test of joint significance of
the program effects that is robust to weak identification, as well as we report Angrist-
Pischke multivariate F-test of excluded instruments. A high F-test and strong rejection
failure of the null of valid overidentifying restrictions are signs of strong and valid
instruments.
A few patterns emerged in terms of the specification tests. Our instruments are
very strong as the F-test is four times above the rule of thumb of 10. We fail to reject the
null in the test of overidentification, moreover the instruments are jointly significant.
However, the test of endogeneity does not reject the null hypothesis that treatment
variable can actually be treated as exogenous regressor. We were satisfied with the
overall performance of the instrumental variables models.

18
We extended the instrumental regression baseline model in two directions in
order to assess the sensitivity of the prior findings and to provide additional evidence of
the causal effects of treatment on CP ambulatory status. In particular we implemented
bivariate endogenous probit model. However, endogenous bivariate probit estimates
identified the absence of a relationship between the level of care at birth and CP non-
ambulation with the highest precision.
Conclusion
In Quebec, maternity care is regionalized and nearly all deliveries take place in
public hospitals. Low-risk deliveries are carried out at level I hospitals including birthing
centres, while medium and high-risk deliveries are referred to level II or level III facilities.
Prediction of the infant’s state at birth determines referrals to level I, II or III hospitals.
High-risk deliveries are identified based on unified national medical guidelines [27], [28],
[42]. Our study demonstrated that the majority of children developing CP for perinatal
reasons were born in birth sites with level III neonatal care. It reflects that, despite the
current high level of technology and obstetric and neonatal competencies, outcome of
high-risk deliveries referred to birth sites with level III neonatal care, still leads to
significant long-term complications. Interestingly, 34% of children developing CP for
perinatal reasons were born in sites with Level I neonatal care.
We have shown that differences in the level of neonatal care, and associated
medical technology available at the time of delivery, do not seem to be associated with
the risk of CP non-ambulatory status. This finding is consistent and robust across
methods and empirical specifications used. PSM models showed no statistical significant
relationship between the level of neonatal care available at hospital where delivery was
carried out and risk of CP non-ambulatory status. This lack of effect was observed for
both Level II vs Level I and Level III vs Level I comparisons. Positive coefficients were
evident across the Level III vs Level II comparison, which might suggest level II centers
are protective; however, this finding reflects the inability of PSM to eliminate unobserved
selection effects (unobserved heterogeneity between the two groups of hospitals).
Instrumental variables estimation allowed us to control for possible unobserved selection
effects and consistently found no relationship between the level of neonatal care at

19
hospital where delivery was carried out and CP non-ambulatory status. To our
knowledge, this is the first study where case mix adjustment was used to study the
effects of perinatal regionalization on long-term outcomes using instrumental variables
methods.
The lack of incremental impact of the level of neonatal care at the time of delivery
on the risk of CP non-ambulatory status likely demonstrates the benefit of the
development and generalization of the neonatal resuscitation program (NRP). The NRP
educational program for North American healthcare providers working in the delivery
rooms and nurseries is designed to aid in learning the cognitive and technical skills
required for resuscitation of newborn babies and appropriate referral to specialized
centers as soon as possible [43], [44]. Neonatal resuscitation was shown to reduce
mortality from intrapartum related events [17], [45], [46], such as perinatal asphyxia, and
might explain the lack of effect found in our study. However, the absence of a
relationship between CP non-ambulatory status and level of service at delivery might be
due to the fact that, within Quebec regionalized maternity service, high-risk deliveries are
identified in advance and are subsequently referred to hospitals with an appropriate level
of service. This finding is consistent with existing evidence that a regionalized maternity
service within a publically-owned and -financed health system does not lead to
increased infant morbidity [47], and suggests that medical technology within Quebec’s
regionalized neonatal-perinatal system is used effectively.
Perinatal asphyxia was highlighted as a significant risk factor for CP non-
ambulatory status since asphyxiated versus non-asphyxiated kids have 2.86 the odds of
developing a CP non-ambulatory status. In our cohort, the percentage of children with
perinatal asphyxia born in each of the three neonatal care levels were approximately
equal, being 15.5%, 18.6% and 12.6% in levels I, II and III respectively. However, non-
ambulatory status was more unevenly distributed, present in 28.5% of kids born in level
I, 20.0% of kids born in level II, and 29.3% of kids born in deliveries with level III care.
Perinatal asphyxia cannot be predicted before birth, and thus has to be acutely managed
in hospitals with different levels of technology and obstetric and neonatal competencies
available for neonatal care. The type of therapy the child receives immediately after birth
is an important determinant of later CP severity. Newborns with perinatal asphyxia born

20
in level I hospitals are usually transferred to level II or III hospitals, with the capacity to
provide an increased level of further care such therapeutic hypothermia. It is important to
note that therapeutic hypothermia became widely available in Quebec as of 2009, so the
birth cohort included in this study did not have this therapeutic option available at the
time of their delivery. Failure to recognize the patients that could potentially benefit from
this treatment remains a challenge, since there is a narrow window of opportunity to act.
As the proportion of births complicated by perinatal asphyxia among children with CP
was evenly distributed among levels of neonatal care available at birth sites, it would be
of interest to study the impact of lack of local availability of therapeutic hypothermia in
level I centers on later risk of non-ambulatory status. Our results also indicate that
preterm birth and low maternal education may constitute important independent risk
factors for CP non-ambulatory status which deserve further investigation. We believe
that our study has strong external validity and that these results might apply to many
countries with regionalized systems of perinatal care such as the U.S., Norway and other
European countries.
Our study has several limitations. The methods employed cannot replace a
randomized controlled trial (RCT), and may not have fully controlled for selection effects
or unobserved covariates. However, an RCT that would assess the impact of levels of
neonatal care available at hospitals where delivery was carried out on CP ambulatory
status is likely not to be undertaken given ethical and pragmatic concerns. Our study
does not discusses differences in other measures that might be important as well for
determination of outcomes of regionalized perinatal care such as fine motor skills,
cognition, language, or behaviour.
In conclusion, our study implies that the level of technology available at delivery
does not incrementally affect the distribution of CP non-ambulatory cases. The success
of the neonatal resuscitation program and referral of high risk births to regional hospitals
with sufficient obstetric and perinatal competence and resources may contribute to this
lack of relationship. This suggests that level of care and associated medical technology
within the Quebec regionalized neonatal-perinatal system, is used effectively, since it
does not offer any further marginal benefit in the reduction of severe CP outcomes. The
system works well as it is and this is supportive of the perinatal regionalization. Further

21
research is needed to understand the causal links and associated mechanisms between
prenatal risk factors, perinatal asphyxia and CP severity.

22
Table 1-1. General Characteristics of the Population
VARIABLES n = 360 children with CP
Level of Service at Delivery
Level I, n (%) 123 (34.17)
Level II, n (%) 70 (19.44)
Level III, n (%) 167 (46.39)
Non-Ambulatory Status (GMFCS IV-V), n(%) 98 (27.22)
Maternal Age, mean ± SD 29.64 ± 5.05
Mother's ethnic group
Caucasian 292(81.11)
Other 68 (18.89)
Education
High school or more education 319 (88.6)
Less than high school education 41 (11.4)
Family History of CP, n (%) 17 (4.72)
History of Stillbirths, n (%) 27 (7.50)
Type of Pregnancy
Single foetus 319 (88.61)
Pre-eclampsia, n (%) 27 (7.50)
Gestational Diabetes, n (%) 52 (14.44)
Bleeding during Pregnancy, n (%) 98 (27.22)
Severe Illness during Pregnancy, n (%) 78 (21.67)
Accident or Trauma during Pregnancy, n (%) 58 (16.11)
Birth weight (gram), mean ± SD 2594.78 ±1039.17
Gestational age (weeks), mean ± SD 35.5 ± 0.27
Prematurity (<37 weeks), n (%) 151(41.94)
Perinatal Asphyxia, n (%) 53 (14.72)

23
Table 1-2. Propensity Score Matching Results
LLR LLR
LEVELS Radius: caliper=0.1 Kernel EpanK NormalK
II vs I -0.104 -0.081 -0.085 -0.082
[0.071] [0.070] [0.217] [0.071]
III vs I -0.054 -0.072 -0.024 -0.086
[0.069] [0.078] [1.238] [0.076]
III, II vs I -0.037
[0.06]
-0.06
[0.06]
-0.04 [0.05]
-0.06
[0.06]
Note. *** p<0.01, ** p<0.05, * p<0.1. Bootstrapped Standard Errors in brackets (300 repetitions). LLR – local linear regression.
EpanK - The Epanechnikov Kernel. NormalK - The Gaussian Kernel. In all models less than 10% observations were excluded due to
imposition of the common support condition.

24
Table 1-3. Linear Probability Model Results
VARIABLES Linear regression
Level II -0.072
[0.063]
Level III -0.012
[0.057]
Pre-eclampsia 0.030
[0.073]
Gestational diabetes -0.031
[0.067]
Bleeding during pregnancy -0.033
[0.054]
Severe illness during pregnancy -0.037
[0.054]
Accident/ trauma during pregnancy 0.017
[0.057]
Preterm birth 0.092*
[0.05]
Birth weight .0001
[.001]
Family history of CP 0.041
[0.089]
Maternal education -0.024*
[0.013]
Maternal age 0.003
[0.005]
Drugs 0.061
[0.113]
Observations 358
Note. *** p<0.01, ** p<0.05, * p<0.1. Level I hospitals are the base category. Robust standard errors in brackets. Join F-test
of level II and level III being excludable p-value=0.394. Statistical Power=0.76.

25
Table 1-4. Instrumental Variables Results (Level II vs Level I)
LEVELS 2-Step GMM Endogenous
bivariate probit
II vs I -0.0073 0.006
[0.134] [0.031]
Observations 192 192
Overid 0.215
Overid P-val 0.889
F-test 58.91
AR 0.061
AR P-val 0.979
Endog 0.258
Endog P-val 0.612
Rho -0.704
[0.611]
Chi-sq 0.001
F-analog 12.31
Exon P-val 0.914
Note. *** p<0.01, ** p<0.05, * p<0.1. Table presents reduced form estimates of the effects of interest from two stage least squares, generalized method of moments, endogenous bivariate probit. Robust standard errors in brackets. Over is the Hansen J test for overidentification; AR is the Anderson-Rubin (1949) Wald test of the joint significance of the endogenous regressors; Endog is a test for endogeneity of exposure variable; F-test is Angrist-Pischke multivariate F-test of excluded instruments; Chi-sq is Wald test of Rho=0. F-analog is the test of joint significance of instrumental variables. Exon P-val is the smallest p-value of the excluded instrument in the regression of residuals on covariates and instrumental variables. 2SLS estimates are numerically equivalent 2-Step GMM up to two decimal places.

26
Table 1-5. First Stage (Level II vs Level I)
VARIABLES Linear regression
Census Metropolitan Area Indicator 0.696***
[0.079]
Montreal Indicator 0.576***
[0.091]
City of Quebec Indicator
0.956***
[0.069]
Pre-eclampsia -0.097
[0.093]
Gestational diabetes -0.056
[0.097]
Bleeding during pregnancy -0.326
[0.161]
Severe illness during pregnancy 0.019
[0.082]
Accident/ trauma during pregnancy 0.102
[0.086]
Preterm birth 0.033
[0.121]
Birth weight -0.205
[0.186]
Family history of CP -0.026
[0.128]
Maternal education 0.006
[0.041]
Maternal age -0.012
[0.006]
Drugs -0.213
[0.188]
Observations 192
Note. *** p<0.01, ** p<0.05, * p<0.1. Robust standard errors in brackets. Centered R-squared=0.31.

27
Table 1-6. Instrumental Variables Results (Level III vs Level I)
LEVELS 2-Step GMM Endogenous
bivariate probit
III vs I 0.04 0.0039
[0.127] [0.026]
Observations 287 287
Overid 0.541
Overid P-val 0.763
F-test 39
AR 0.22
AR P-val 0.889
Endog 0.264
Endog P-val 0.607
Rho -0.188
[0.2327]
Chi-sq 0.639
F-analog
Exon P-val
480
0.240
Note. Table presents reduced form estimates of the effects of interest from two stage
least squares, generalized method of moments, endogenous bivariate probit. Robust standard
errors in brackets. *** p < 0.01, ** p < 0.05. Over is the Hansen J test for overidentification; AR is
the Anderson-Rubin (1949) Wald test of the joint significance of the endogenous regressors;
Endog is a test for endogeneity of exposure variable; F-test is Angrist-Pischke multivariate F-test
of excluded instruments; Chi-sq is Wald test of Rho=0. F-analog is the test of joint significance of
instrumental variables. Exon P-val is the smallest p-value of the excluded instrument in the
regression of residuals on covariates and instrumental variables. 2SLS estimates are numerically
equivalent 2-Step GMM up to two decimal places.

28
Table 1-7. First Stage (Level III vs Level I)
VARIABLES Linear regression
Census Metropolitan Area Indicator 0.611***
[0.069]
Montreal Indicator 0.287 ***
[0.064]
City of Quebec Indicator 0.165***
0.007
Pre-eclampsia -0.032
[0.071]
Gestational diabetes -0.027
[0.088]
Bleeding during pregnancy -0.083
[0.070]
Severe illness during pregnancy -0.025
[0.061]
Accident/ trauma during pregnancy -0.040
[0.058]
Preterm birth -0.072
[0.1035]
Birth weight -0.148
[0.119]
Family history of CP 0.058
[0.070]
Maternal education -0.012
[0.027]
Maternal age 0.131
[0.110]
Drugs -0.065
[0.102]
Observations 287
Note. *** p<0.01, ** p<0.05, * p<0.1. Robust standard errors in brackets. Centered R-squared=0.34.

29
Table 1-8. Instrumental Variables Results (Levels III and II vs Level I)
LEVELS 2-Step GMM Endogenous
bivariate probit
III vs II 0.012 0.001
[0.105] [0.020]
Observations 235 235
Overid 0.280
Overid P-val 0.97
F-test 63.80
AR 0.59
AR P-val 0.67
Endog 0.821
Endog P-val 0.365
Rho 0.20
[0.57]
Chi-sq 0.7342
F-analog 61.06
Exon P-val
0.389
Note. Table presents reduced form estimates of the effects of interest from two stage
least squares, generalized method of moments, endogenous bivariate probit. Robust standard errors in brackets. *** p < 0.01, ** p < 0.05. Over is the Hansen J test for overidentification; AR is the Anderson-Rubin (1949) Wald test of the joint significance of the endogenous regressors; Endog is a test for endogeneity of exposure variable; F-test is Angrist-Pischke multivariate F-test of excluded instruments; Chi-sq is Wald test of Rho=0. F-analog is the test of joint significance of instrumental variables. Exon P-val is the smallest p-value of the excluded instrument in the regression of residuals on covariates and instrumental variables. 2SLS estimates are numerically equivalent 2-Step GMM up to two decimal places.

30
Table 1-9. First Stage (Level III vs Level II)
VARIABLES Linear regression
Montreal Indicator 0.649***
[0.054]
City of Quebec Indicator 0.942**
[0.108]
Sherbrook Indicator
Perinatal asphyxia
0.951***
[0.050]
0.045
[0.085]
Pre-eclampsia 0.050
[0.069]
Gestational diabetes -0.027
[0.088]
Bleeding during pregnancy 0.025
[0.085]
Severe illness during pregnancy -0.054
[0.060]
Accident/ trauma during pregnancy -0.067
[0.062]
Preterm birth -0.109
[0.107]
Birth weight 0.036
[0.111]
Family history of CP 0.169*
[0.089]
Maternal education 0.175
[0.098]
Maternal age 0.009*
[0.004]
Drugs 0.046
[0.165]
Observations 235

31
Note. *** p<0.01, ** p<0.05, * p<0.1. Robust standard errors in brackets. . Centered R-squared=0.44.

32
Chapter 2. Interhospital Transfers and Long Term Health Outcomes within a Regionalized Neonatal-Perinatal System. Evidence from a Population based Cerebral Palsy Registry.
Introduction
The transport of critically ill neonates has always been seen to be an integral part
of a regionalized perinatal-neonatal system. An optimal neonatal transport system
should be able to rapidly deliver critical care to the patient’s bedside at the referring
hospital and of maintaining that level of care during transport to the receiving
hospital[48]. However, in Canada it has long been recognized that not all such
movements have occurred under optimal circumstances`[49].
In our previous paper we found that controlling for observed and unobserved risk
factors, differences in the levels of care at birth sites, and associated complexity of
available neonatal-perinatal technology, are not associated with differences in Cerebral
Palsy (CP) severity. The success of the neonatal resuscitation program and referral of
high-risk births to regional hospitals with sufficient obstetric and perinatal competence
may help to explain this finding. Thus, our aim in this study was to further investigate this
result by looking at the effect of interthospital transfers in the context of Quebec
regionalized neonatal-perinatal system. Specifically, we aimed to answer the following
question: do interhospital transfers reduce the incidence of the most sever CP cases?
This study evaluates the impact of interhospital neonatal transfers on the long-
term neurodevelopmental outcomes of children with CP. The level of care at delivery
hospital determines the type of therapy newborns receive immediately after birth. The

33
type of therapy is critical to prevent or treat adverse events around labor and delivery
which determine later neurological and neurocognitive impairments such as CP and its
severity. Critically ill newborn patients are transported to alternate hospitals to obtain
additional care, whether technical, professional or procedural care, that is not available
at the existing location. Specifically, we sought to evaluate the relationship between
neonatal transfers and later CP non-ambulatory status, using data from the Canadian
Multi-Regional Cerebral Palsy Registry (CCPR).
Material and Methods
2.2.1. Data
The study was conducted using Quebec provincial data from the CCPR. A
detailed description of this unique registry can be found in [14]. Children within the
CCPR included for analysis in this study were born between 1999 and 2008 in the
province of Quebec, which ensured that all participants had a five-year follow-up and
confirmation of status available. Children with CP diagnosis linked to any identified post-
neonatal cause or cases born outside the province of Quebec were excluded from our
investigation.
For our analysis, we were interested in postnatal interhospital transfers, we thus
ignored the intrahospital movements. We classified children according to whether the kid
had been transferred to a different hospital after birth (level I to level II, or level I to level
III). In Quebec maternity care is regionalized and nearly all deliveries take place in public
hospitals or birthing centers. Low-risk deliveries are carried out at level I hospitals (well
newborn nurseries), level II hospitals (specialty care) or level III hospitals (subspecialty).
We used clear, uniform definitions and consistent standards to classify level of neonatal
care across the study sites, and appropriate adjustment for differences in case mix
between the three groups of hospitals. We classified each delivery unit according to its
level of neonatal care using the policy statement on this topic provided by the American
Academy of Pediatrics [21]. This classification reflects differences in the level of obstetric
and neonatal competences available at the birth hospital.

34
This classification reflects differences in the level of obstetric and neonatal
competences available at the hospital. In brief, level I centers care for newborns 34
weeks gestation or more, and can offer intravenous therapy, phototherapy and gavage
feeding. Level II centers care for newborns 30 weeks gestation or more, and in addition
to level I services can offer ventilation by nasal passage or endotracheal intubation.
Level III centers care for newborns regardless of gestational age and in addition to the
above services offer nitric oxide therapy, immediate access to pediatric subspecialties,
imaging, and surgeries.
Interfacility transport of neonatal patients for advanced or specialty medical care
is an integral part of North America health care delivery system[50]. Critically ill
newborns are transported to alternate locations to obtain additional care, whether
technical, cognitive, or procedural, that is not available at the existing location[50]–[52].
However, the decision to transport critically ill newborns to another facility, is
based on a comprehensive assessment of the potential risks inherent during transport
and follows specific American Academy of Pediatrics recommendations for pediatric
transport systems[48] and Canadian Association of Paediatric Health Centres
recommendations for a minimum set of standards[50]. Critically ill newborns are at
increased risk of morbidity and mortality during transport[52]–[54]. Risk can be
minimized and outcomes improved with careful planning, the use of appropriately
qualified personnel, and availability of equipment [51], [55]. The expected benefits of
transport must be weighed against the possible risks during the transport. However,
financial considerations are not a factor when contemplating moving a critically ill
newborn in Canada.
The outcome used for this analysis was CP non-ambulatory status, as defined by
a Gross Motor Function Classification System (GMFCS) level IV or level V [30]. The
major challenge for our research was to control for case-mix differences between types
of hospitals. In particular, level II and level III hospitals have a higher proportion of
medium and high-risk pregnancies compared with level I hospitals. We used a quasi-
experimental study design [31], controlling for relevant covariates in order to remove
selection bias (confounding by indication) that could originate from the differences in

35
case mix between the three groups of hospitals. Our rich dataset allowed us to control
for all known biological CP risk factors.
Our data contained a large number of variables about mother and child, allowing
us to make appropriate adjustments for different clinical needs using methods based on
selection on observables. We used current clinical practice guidelines in obstetrics and
gynecology [29], perinatal surveillance literature [27] , CP risk factors [32], the American
Academy of Pediatrics recommendations for pediatric transport systems[48] and
Canadian Association of Paediatric Health Centres recommendations for a minimum set
of standards[50] to choose explanatory variables to describe the decision to transport a
critically ill newborns to another facility. The following covariates were used to control for
risk factors (and deal with selection bias/confounding by indication): neonatal
encephalopathy, assisted delivery, multiple fetuses, preterm birth, intrauterine infection,
toxic exposure, maternal illness.
Our cohort of 322 children with CP without any post-neonatal cause were born in
Quebec between 1999 and 2008. Forty-six percent were born in birth sites with Level III
neonatal care, 20% with Level II and the remainder (34%) with Level I neonatal care.
Non-ambulatory status (Gross Motor Function Classification System level IV and level V)
was reported in 27% of the cases. 18% out of 322 children with CP had an interhospital
transfer, meaning that these were born in level I hospital and transferred after birth to a
level II or level III facility.
Empirical Strategy Overview
Our empirical objective is to isolate the causal effect of interhospital transfers on
later CP non-ambulatory status. The challenge in examining this research question is
that neonatal transfers are not randomly assigned. Neonatal transfers’ decision follow
clinical consensus guidelines. We therefore offer an identification strategy that does not
rely on random assignment. In particular, we conduct the analysis assuming that
selection on observables holds. Given that we have very rich covariates including all
known biological risk factors used by referring clinicians, selection on observables
assumption can be invoked.

36
2.3.1. Model and Assumptions
Let 𝑌𝑗 = {𝑌𝑗0, 𝑌𝑗
1 } equal the potential outcome of a child with CP, who might have
been transferred 𝐷𝑗 = {0,1 }, where 𝐷 = 1 indicates that child had been transferred.
For each child we observe only one set of potential outcomes as a function of transfer
decision: 𝑌𝑗 = 𝑌𝑗0 + (𝑌𝑗
1 − 𝑌𝑗0)𝐷𝑗.
In general, we expect potential outcomes of each child to differ as a function of
interhospital transfer. This implies that the absence of random assignment of neonatal
transfer means that we cannot obtain a valid causal estimate of the effect of transfer on
non-ambulatory CP status. To see why, consider the non-experimental comparison
between the outcomes of transferred and non-transferred children. This comparison is:
𝐸(𝑌𝑗|𝐷 = 1) − 𝐸(𝑌𝑗|𝐷 = 0)
= {𝐸(𝑌𝑗1|𝐷 = 1) − 𝐸(𝑌𝑗
1|𝐷 = 0)} + {𝐸(𝑌𝑗1|𝐷 = 0) − 𝐸(𝑌𝑗
0|𝐷 = 0)}
where {𝐸(𝑌𝑗1|𝐷 = 1) − 𝐸(𝑌𝑗
1|𝐷 = 0)} is the average causal effect of level of
care available at delivery on outcome 𝑌 and the second bracketed term is the bias term.
Previous clinical research suggests that this bias term might not be non-zero. Children
transferred after birth might differ greatly in terms of neonatal health status and later CP
outcomes. Thus, we can learn little about the causal effect of transfer on children`s CP
outcomes by contrasting the outcomes of CP children from whose who had been and
had not been transferred.
To solve this identification problem we invoke the following identifying
assumption:
𝑌𝑗1, 𝑌𝑗
0 ⊥ 𝐷𝑗|𝑋𝑗,
meaning that we assume that potential outcomes in children with CP are
conditionally independent of the neonatal transfer. This assumption states that potential
outcomes is as good as randomly assigned to transfers given observables. If so, any

37
observed difference in the outcome will reflect the causal effect of neonatal transfer on
CP non-ambulatory status. Formally we can estimate the causal effect of transfer at
delivery on CP non-ambulatory status:
𝐸(𝑌𝑗|𝑋𝑖, 𝐷 = 1) − 𝐸(𝑌𝑗|𝑋𝑖, 𝐷 = 0) = {𝐸(𝑌𝑗1|𝑋𝑖, 𝐷 = 1) − 𝐸(𝑌𝑗
1|𝑋𝑖, 𝐷 = 0)} +
{𝐸(𝑌𝑗1|𝑋𝑖, 𝐷 = 0) − 𝐸(𝑌𝑗
0|𝑋𝑖, 𝐷 = 0)} = {𝐸(𝑌𝑗1|𝑋𝑖, 𝐷 = 1) − 𝐸(𝑌𝑗
1|𝑋𝑖, 𝐷 = 0)},
where the last equality follows from conditional independence assumption.
Is this strategy for identifying the casual effect of neonatal transfer on CP non-
ambulatory status plausible? Our assumption requires that there is no differential effect
of neonatal transfer on the latent CP non-ambulatory status. This assumption cannot be
directly tested given the fundamental problem of causal inference[56].
2.3.2. Implementation under Exogeneity
Propensity Score Matching (PSM)
We use propensity score matching (PSM) to estimate the effect of transfers on
later CP non-ambulatory status. Along with selection on observables assumption this
requires that for all values of the covariates the probability of receiving a neonatal
transfer is strictly positive.
Ordinary Least Squares (OLS) and Propensity score matching
We estimate the following baseline model using OLS:
𝑌𝑖 = 𝛽0 + 𝛽1𝐷𝑗 + 𝛽2𝑃(𝑋) + 𝑒𝑖.
Here, 𝑌𝑖 represents CP outcome for child 𝑖, 𝐷𝑗 is an indicator for neonatal
transfer. Vector 𝑋𝑖 of controls and 𝑃(𝑋) is the propensity score. The coefficient of
interest is 𝛽1 which represents the casual effect of neonatal transfer.

38
However, we also estimate an alternative model:
𝑌𝑖 = 𝛽0 + 𝛽1𝐷𝑗 + 𝛽2𝑃(𝑋) + 𝛽3𝐼𝑗 + 𝑒𝑖.
Here, 𝐼𝑗 represents the interaction term transfers on the overlap region. This
estimation circumvents the comparison between transferred and non-transferred on the
region where propensity scores for the two groups overlap.
Results
18% out of 322 children with CP had an interhospital transfer, meaning that these
were born in level I hospital and transferred after birth to a level II or level III facility. PSM
estimates (average treatment effect on the treated), standard errors and associated 95%
confidence intervals are displayed in Table 2. PSM estimates generally pointed to no
statistical effect of neonatal transfers and later CP non-ambulatory status. However, the
propensity score matching estimates are negative and the standards errors are large.
The two linear probability models show that neonatal transfers’ estimates while
negative were not statistically significant at conventional levels (Table 3). However,
model 2 identifies no effect with a slighter smaller standard errors suggestive that effect
identification might not possible because of a small sample size.
We further investigated the relationship by computing time travel by car between
inborn and out born facilities. We found that total travel time for all children who were
transferred immediately after birth were less than the critical period of five hours, and for
95% of all transfers the total travel time was less than one and a half hours. This implies
that the effect of transfers in principle cannot be detected by default given that all
neonates who needed a transfer did got transferred.

39
Conclusion
Interthospital transfers are an integral part of the Quebec regionalized neonatal-
perinatal system. The decision to transport a critically ill newborn or to another facility, is
based on an assessment of the potential benefits of transport weighed against the
potential risks and follows clinical practice guidelines and recommendations for a
minimum set of standards[48], [50], [54], [51].
The interhospital transfer point estimates were negative and not statistically
significant. Further investigation had shown that the effect of transfers cannot be
detected given that all neonates who needed a transfer did get one. The identification of
the interhospital transfers would require a richer dataset which would contain data on the
outcomes of kids who required a transfer but never got one.

40
Table 2-1 Linear Probability Model Results
VARIABLES Linear regression
Transfer -0.08
[0.12]
P(X) 0.47
[0.68]
Observations 322
Note. *** p<0.01, ** p<0.05, * p<0.1. Level I hospitals are the base category. Robust standard errors in brackets. Join F-test of level II and level III being excludable p-value=0.39.
Table 2-2 Linear Probability Model Results
VARIABLES Linear regression
Interaction -0.087
[0.11]
P(X) 0.29
[0.70]
Observations 322
Note. *** p<0.01, ** p<0.05, * p<0.1. Level I hospitals are the base category. Robust standard errors in brackets. Join F-test of level II and level III being excludable p-value=0.38. Statistical Power=0.70.

41
Chapter 3. Nutrition assistance programs Early Skills Formation: Evidence from a Community Based Large Pregnant Cohort
Introduction
Human capital is an essential source of long term economic growth [57], [58].
Building upon seminal contributions by Schultz and Becker [59], [60], Cunha and
Heckman [61] have argued that human capital production and skill formation is a life
cycle process which begins in the womb and continues throughout life. An increasingly
interdisciplinary body of evidence shows that gaps in skills originating from birth through
the age of five determine the lifetime skill formation process, and long term economic,
health and social outcomes [62]–[65]. The economics, psychological and clinical
literature offers some guidance toward the causal relationships underlying early skills
formation; however, the mechanisms of cognitive and non-cognitive skill formation
outcomes remains to be been established. A central question of interest is whether skill
formation technology depends on improved nutrition in early childhood. If so, it is
conceivable that policymakers can reduce ability gaps between children from various
socioeconomic groups and ultimately raise the productivity of society at large through
nutrition interventions at an early age.
A large body of research shows that skill formation is a highly complex process
influenced by environmental, genetic, and epigenetic factors in perinatal and postnatal
periods [66], [67]. Understanding the role and related mechanisms of nutritional
interventions on early skills formation is critical. The existing scientific literature, using
evidence from animal models, demonstrates that early nutrient deficiencies have
substantial, long-lasting negative effects on early brain development [68]–[70]. Some

42
nutrients appear to be more important than others for brain development; however,
evidence that there are critical and sensitive periods in brain synaptic plasticity is
overwhelming[63].
The study of skill formation through the nutritional channel is even more
important in human beings due to dynamic complementarity of the skills formation
process [61]. Thus, if a child does not receive appropriate nutrients during early
childhood, it may be very difficult or even impossible to appropriately support brain
plasticity [71] which ultimately results in poor neurocognitive outcomes at a later age.
Better nutrition during childhood is also associated with better health and educational
outcomes in children [72]–[75]. However, there is compelling evidence that the first two
years of a child’s life is thought to be the critical period when nutrition has the greatest
effect on child health, growth and development [71], [76]. The study reported here is to
our knowledge the first to use detailed data on prenatal, perinatal and postneonatal
nutritional exposures and developmental outcomes during these critical years.
The literature establishes that in the United States food and nutrition assistance
programs are linked to improved neonatal outcomes [77]–[80] and long term outcomes
[81]. However, virtually no evidence exists regarding whether federal or local food
programs in the U.S. are associated with early developmental outcomes. We are aware
of only one study that has assessed the direct of WIC on IQ and cognitive test scores in
early childhood [82]. These authors reported positive effects of prenatal WIC on
cognitive development. We address this gap by analyzing data from a large prospective,
community-based study of mother-infant pairs to estimate the effect of participation in
federal funded nutrition assistance programs on early cognitive and non-cognitive
developmental outcomes.
In this paper, we estimate the effect of mothers’ participation in the
Supplementary Nutrition Assistance Program (SNAP) and the Special Supplemental
Nutrition Program for Women, Infants, and Children (WIC) on early cognitive and non-
cognitive developmental outcomes as measured by the Bayley Scales of Infant
Development (BSID-III). Our data are from a large, prospective, community-based panel
study of mother-infant pairs. In this rich data set we can directly identify the change in

43
neurodevelopmental outcomes associated with changes in food programs uptake. In a
model where unobserved heterogeneity only affects the level of neurodevelopmental
outcomes this can be interpreted as a causal effect.
The challenge of identifying the causal effect in question is that mothers’
participation in nutrition assistance programs is not assigned randomly. The main
limitation of most food programs research is the inability to remove the selection bias
resulting from mothers choosing whether or not to participate in federal food assistance
programs. In particular the literature has struggled to find credible and strong
instrumental variables for participation in food programs [79]. This paper addresses
these methodological limitations and aims to remove selection bias by employing fixed
effects models. Our unique dataset allows us to control for known early development risk
factors in the analysis and previously unavailable biological risk factors, anthropometric
measures and parental environments.
We take advantage of the panel structure of the data and a rich set of time-
varying control variables on child, caregiver, home and other contextual variables to
estimate the effect of interest using fixed effects models. In particular, to deal with the
selection problem we use mother-infant fixed-effects (FE) models, which compare child
outcomes over time among mothers who participate in federal food assistance programs
and those who do not participate. This technique uses variation in program participation
status over time and it controls for unobserved mother-infant pair characteristics, and for
family and environmental background attributes that are time-invariant. In addition, we
control for a wide range of time-varying mother, family background and child
characteristics. The causal relationship between federal assistance programs’ uptake
and child outcomes is identified under the assumption that the differences in uptake are
exogenous to cognitive and non-cognitive outcomes after controlling for these time-
varying characteristics. We build on previous research which has found a positive
relationship between participation in federal nutrition assistance programs and health
outcomes [77]–[81], [83].
We find that mothers’ participation in SNAP and WIC during pregnancy and in
early childhood has a direct effect on cognitive and noncognitive skill formation in early

44
age. We find that participation in food assistance programs leads to a significant
increase in receptive communication as measured by Bayley scales. Our results are
robust, and the inclusion of a rich set of possible confounding factors further supports
the validity of the research design.
This paper makes important contributions to both the economics literature on skill
formation and to the body of research which links the expansion of resources in utero
and during childhood to health and socio-economic outcomes. First, the literature to date
has not considered the effect of participation in food assistance programs during
pregnancy and early childhood on cognitive and noncognitive skill formation in the early
years. Rather, it has focused on the impact of food assistance programs on neonatal
and long-term outcomes. We show that uptake of food assistance programs is
associated with improved Bayley scores for children. Second, we explore the biological
mechanisms which may underlie our findings, a completely novel approach to the
literature as far as we are aware. We show that mothers’ participation in food assistance
programs increases intake of those nutrients associated with early childhood
development such as iron, zinc and omega-3.
We use the Bayley Scales of Infant Development (BSID-III), a set of standardized
measures commonly used within the field of developmental science for analyzing short-
to medium-term outcomes of babies. The BSID’s main use is to detect delays in
neurodevelopment [84]. The BSID-III is a widely-accepted developmental assessment
instrument for children ages birth to 42 months [85]. The BSID is a global measure of
developmental status in infancy that assesses and aggregates the timely attainment of
relatively crude milestones in infancy and early childhood.
The remainder of our paper is as follows. In Section 2 we summarize the
economic literature on the long term effects of early skill formation interventions. In
Section 3 we summarize the biological science literature in order to provide guidance for
econometric model building. In Section 4 we provide background information on the US
federal and community food assistance programs. In Section 5 we describe our data. In
Section 6 we present our econometrics framework and motivate the empirical strategy
and in Section 7 our results. We conclude in Section 8.

45
Early skill formation
Evidence on the importance of ability in determining long term socio-economic
success is overwhelming. Interdisciplinary research have shown the existence of critical
and sensitive periods in the formation of skills [86], [87]. Persistent and substantial gaps
in non-cognitive and cognitive abilities determine a variety of outcomes and have a direct
effect on wages, schooling, teen pregnancies and other socio-economic outcomes [88].
However, early skill formation is critical as numerous studies in economics, human
development have documented that cognitive and non-cognitive skills are produced in
the early years of childhood [61], [65], [89]–[92].
Existing research documents that the technology of skill formation is self-
productive and complementary. Self-productivity means that the formation of skills has a
higher return if the higher the stock of skills at the previous period is available, while
complementary implies that early investment facilitates the productivity of later
investment, as skills beget skills in a complementary and dynamic way [61]. However,
complementarity, self-productivity means no equity-efficiency trade-off for early
investments [61]. This implies that returns to late childhood investment and remediation
in later years are low. If a child does not receive the appropriate stimulation during early
childhood period, it may be very difficult to develop certain functions at a later age
associated with improved socio-economics outcomes.
Nutrition and Early Skill Formation
Fetal, neonatal and postnatal period is a time of rapid brain development
(neuroplasticity), and of critical acquisition of cognitive development, and interpersonal
skills [93], [94]. Evidence that nutrition is a direct biological and a mediation factor in
brain growth and development is abundant in scientific literature. A range of in vitro and
in vivo animal models have been used to characterize the mechanistic linkages between
nutritional deficiencies to structural and/or functional alterations in neurodevelopment
and impact on behavior [68]. More recently, the epigenetic effects of nutrients had been
documented in emergent genetic literature [95], [96].

46
Extensive epidemiological, economics, health sciences literature has explored
the role of nutrition, early childhood, and its relationship to health outcomes in adulthood.
Given the fundamental role of nutrients in supporting all aspects of structural and
functional brain development, food assistance programs provide essential nutrients that
must be introduced by diet since they cannot be synthesized by the organism. Lack of
nutrition would have a negative influence on all aspects of development and can lead to
adaptive physiologic responses that impair development with long-term consequences
[97], [98].
Supplemental Assistance for Needy Families (SNAP) and The Special
Supplemental Nutrition Program for Woman, Infants, and Children (WIC) are the two
fundamental safety net federally funded programs with combined spending of $82.85
billions per year[99]. SNAP is the only public assistance program that is available to all
income eligible families was rolled out between 1962 and 1975, providing low-income
families vouchers that could be used at grocery stores to purchase food. WIC program
aims to increase nutritional well-being among low-income pregnant/post-partum women,
infants and young children. Established in 1972, the program offers three types free of
charge benefits to participants: a supplemental food package, nutrition education, and
referrals to health care and other services [100]. These packages included combinations
of the following foods: iron-fortified infant formula; iron-fortified infant and adult cereal;
vitamin C-rich fruit juice and/or vegetable juice; eggs; milk; cheese; peanut butter and/or
dried beans or peas; tuna; and carrots. Special infant formulas and certain medical
foods could also be provided by the WIC food package when prescribed by a physician
or health professional for a specific medical condition. Existing research links
participation in SNAP or WIC to health outcomes. The literature has focused on critical
birth outcomes, such as low birthweight, preterm delivery, and infant mortality [77], [79],
[81], [101].
Much of the research on SNAP’s and WIC’s effect on participants’ health face a
number of methodological challenges, in addition to issues of selection bias. Many
outcomes develop over a long period and may require to control for the complex
interplay of diet, and environment. Furthermore, economic theory suggests that
relationship between federal, or local programs, associated eligibility criteria would

47
induce individuals to optimize decisions related to participation in different programs. For
example, a majority of WIC participants also use other assistance programs, such as
Medicaid, SNAP. Moreover, the impact of local food programs on health or
developmental outcomes is largely unknown. This requires to ascertain whether
observed effect is due to WIC or SNAP or to other programs.
Material and Methods
3.4.1. Data
The study was conducted using data from Conditions Affecting Neurocognitive
Development and Learning in Early Childhood study (CANDLE). CANDLE is a
prospective longitudinal study of early cognitive development which extends from the
second trimester of pregnancy until the child reaches age 4 [102]. CANDLE recruited
1,503 healthy pregnant women between 16.0 and 28.0 weeks of gestation, who had
normal singleton fetal pregnancies and lived in Shelby County, TN [102]. The selection
criteria for our study included the inclusion criteria for the CANDLE study.
While the primary focus of the CANDLE study is child cognitive development, it
has collected detailed information on parental environments; maternal psychosocial
status; caregiver functioning; caregiver-child interaction; maternal, newborn, and
postnatal anthropometric measures; and clinical information. Maternal and family data
were collected at the second and third trimesters of pregnancy. During a home visit at 4
weeks postpartum (home visit 1 or HV1), CANDLE study personnel collect child health
updates. The mother and the child make annual visits to the study clinics for cognitive,
psychosocial, and clinical assessments. Additional health information from participants
and other updates are collected using telephone interviews, which are regularly
scheduled between annual visits. Demographic and phenotypic data on the mothers and
newborns were also abstracted from clinical records. This research was approved by the
Institutional Review Board of the University of Tennessee Health Science Center, and
informed consent was obtained from all mothers.

48
Table 1 provides an overview of our data. In the full sample, 62% of the mothers
were of African American race, 48% of mothers were on Medicaid of TennCare
insurance, 47% with annual reported income is less than $24999, 47% married, 9%
reported tobacco use and 49 had a high school diploma. 50% of mothers report
participation in WIC and 44% participation in SNAP, however, uptake in WIC declines
over time much more than in SNAP. In particular, at second home visit participation in
SNAP is virtually unchanged while, only 28% of women participate in WIC. Very few
mothers report uptake in local food assistance programs during pregnancy (around 1%),
however, enrolment in home visitation programs is reported by 6% during pregnancy.
The cohort has an average Apgar score at 5 min of 9, and an average gestational age of
39 weeks.
Consistent with findings from previous literature children born to mothers enrolled
federal assistance programs are more likely to be low birth weight, to have low APGAR
scores small for date [77], [78]. Also consistent with Currie-Rajani’s observations [80] we
find that mothers of the WIC infants are younger, less likely to be married, much less
educated, and more likely to smoke. They also are more likely to have complications of
labor and delivery as well as more likely to be on Medicare.
3.4.2. Measures of infant cognitive and noncognitive development
Evaluation of neurodevelopmental dysfunction or delay is a central aspect of
developmental psychology. The literature on standardized, developmental screening
measures and associated instruments, particularly in the care of at-risk populations is
vast [103]–[105]. Overall the field of developmental psychology and clinical pediatrics
require that these instruments should have good concurrent and predictive properties
and be readily employed in clinical settings or large studies where highly detailed
assessment is not feasible.
We have chosen Bayley Scales of Infant Development which are standard
measures for analyzing short to medium term outcomes of babies commonly used within
the field of developmental science. The Bayley-III is a widely accepted developmental
assessment instrument for children ages birth to 42 months [85]. The BSID is a global

49
measure of developmental status in infancy that assesses and aggregates the timely
attainment of relatively crude milestones in infancy and early childhood. It is based on
assumptions of a model of general intelligence that assumes that the more rapid
attainment of such milestones reflects higher intellectual ability[106].
Thus, to assess cognitive outcomes at the child’s CV1 (at approximately one
year of age; Table 3), we used the Bayley-III [84]. The Bayley-III includes items
psychometrically selected from the more comprehensive Bayley Scales of Infant
Development (Bayley 2006). Internal consistency and test–retest reliability coefficients of
the Bayley-III for infants’ Cognitive, Receptive Communication, and Expressive
Communication subtests are high to very high [107], ranging from 0.76 to 0.93 [84]. The
validity of the Bayley-III, examined by determining its classification accuracy with the
Bayley Scales of Infant Development, Third Edition scaled scores, showed correlations
between the Bayley-III Cognitive, Receptive Communication, Expressive Communication
subtests and the Bayley Scales of Infant Development, Third Edition comprehensive
scales of 0.93, 0.95, and 0.95, respectively [84].
For this study, the Bayley-III was utilized to minimize infant and parent fatigue.
Although the Bayley-III has five subtests, we selected the Cognitive (nonverbal),
Receptive Communication, and Expressive Communication subtests as phenotypic
outcomes in this study[84]. These subtests were chosen due to content similarity with
other measures of cognitive development which are used later in childhood. Subtest
scores are used to determine if the child’s scoring is in the lowest risk or competent
category, the Emerging Risk category, or the At Risk category. At 1 year of age, the
Bayley-III Cognitive items focus primarily on short term visual memory, functional play,
and nonverbal problem solving. Receptive Communication items include pointing to
common objects or pictures of actions in a picture book, as well as responding to
commands, while expressive communication items quantify emitted sound and sound
combinations at 1 year of age.
A rigorous training was established to maintain Bayley-III reliability. After
graduate coursework in preschool assessment and child development, the cognitive
examiners attended didactic instruction on the Bayley-III. Inter-rater reliability attained

50
through direct observation of test administration and scoring yielded reliability
coefficients equal to or greater than 0.90 on all subtests. Summary of cognitive,
receptive communication and expressive communication tests for each year can be
found in Tables.
Empirical Strategy
3.5.1. Overview
Our empirical objective is to isolate the causal effect of participation in WIC,
SNAP on Baley scales of infant development. The challenge in answering this research
question is that participation in food assistance programs is not randomly assigned. We
offer an identification strategy that does not rely on this random assignment.
3.5.2. The Estimation Strategy - Panels
The analysis of how participation in federal food assistance programs affect
cognitive and non-cognitive outcomes in children cannot be performed using simple
comparisons between participants and non-participant women because participation is
not randomly assigned. Mothers who report participation in WIC or SNAP might be
systematically different in terms of both observed and unobserved characteristics
compared to mothers who do not report participation. For instance, mothers who
received WIC during pregnancy tend to be less educated, more likely to be of minority
race, less likely to be married and more likely to be teen mothers [79], [101]. Thus, in
general we expect potential outcomes of each child to differ as a function of mother’s
characteristics. Therefore, a selection problem arises if mothers’ unobserved
characteristics are correlated with both cognitive and non-cognitive outcomes in children
and mothers’ participation status in federal food assistance programs.
To deal with the selection problem, we relied on mother-infant fixed-effects (FE)
models, which compare children outcomes among mothers who participate in federal
food assistance programs and who do not participate over time. This technique uses
variation in program participation status over time. In particular, it controls for

51
unobserved mother-infant pair characteristics, family and environmental background
attributes that are time invariant. In addition, we controlled for a wide range of time-
varying mother, family background characteristics, and children’s characteristics.
The estimated model is
𝑌𝑖𝑡 = 𝛽1𝐹𝑖t + 𝑋𝑖t′ 𝛾 + α𝑖 + 𝜀𝑖t
Where 𝑖, and 𝑡 denote child, and survey year respectively. 𝑌 denotes the
outcome of child 𝑖 at first and second test respectively, 𝐹 denotes mother’s reported
participation in WIC or SNAP at time 𝑡, 𝑋 is a vector of mother-infant specific
determinants of the outcome, α denotes unobservable determinants of the outcome
which are specific to the mother and the child, and 𝜀 is an error term.
Our outcome, denoted 𝑌 , is a BSID test score — which is standardized within to
have mean zero and standard deviation one in the entire population of children in our
sample. For ease of presentation, we average standardized BSID scores for our
dependent variable. Our results are not changed if instead we measure the BSID in its
unstandardized scale score format. The regressor of interest 𝐹 is an indicator for
uptake of WIC or SNAP.
Ordinary least squares (OLS) estimation of (1) would produce biased estimates
of β if 𝜀𝑖t were correlated with 𝐹𝑖t. In other words, if there were unobservable
determinants of outcome/ability correlated with unobservables. To address the potential
bias due to correlation between 𝜀𝑖t and 𝐹𝑖t, we estimate a fixed effect model relying on a
rich dataset of time-varying covariates (𝑋𝑖𝑡).
Time-varying control variables (𝑋𝑖𝑡) include a rich set of child, caregiver, home
and other contextual variables which can influence the primary developmental child
outcomes including child socio-demographics, maternal characteristics, and household
characteristics that may be correlated with both mothers’ participation decision in food

52
assistance programs and children’ developmental outcomes. Our choice of covariates is
theory driven and heavily draws upon literature from developmental psychology [108]–
[111], and economics [77]–[80], [101]. The following time varying covariates were used
in the basic model: child age, child’s health status, mother’s maternal status,
employment, knowledge of infant development, Medicaid status, and neighborhood
safety. However, we used a longer covariates list to test the robustness of our results
such as participation in community based programs, neighborhood quality and child’s
anthropometric measures.
In this model, the causal relationship between federal assistance programs
uptake and child’s outcomes is identified under the assumption that the differences in
the uptake are exogenous to BSID scores after controlling for background
characteristics. The fixed effect model uses the changes over time in the federal food
assistance programs uptake within a unit of analysis as the source of variation to identify
the parameter of interest. Our fixed-effects model also deals with measurement error in
the outcome so long as it is caregiver family specific and time invariant.
This model does not control for the possibility that the mother-infant time-specific
error term 𝜀𝑖t is correlated with the participation in food assistance programs 𝐹𝑖t. For
instance, if mothers’ uptake decisions over time differ in some unobserved way that
cannot be controlled for and is correlated with the children’ outcomes, then family fixed
effects estimates will be biased. Similarly, changes in unobserved time-varying factors of
the family when related to a child outcome could also confound the estimates. However,
our rich dataset allows to control for all risk factors are important determinant of early
developmental outcomes. We recognize that there might be some unobserved factors,
but we believe that they should not affect our estimates.
One way to show the identification is to use differencing as a strategy to deal with
heterogeneity parameters. Thus, consider the following model with an integrated error
term
𝑌𝑖𝑡 = 𝛽1𝐹𝑖t + 𝛽2𝐿𝑖t + 𝑋𝑖t′ 𝛾 + α𝑖 + 𝜀𝑖t, 𝜀𝑖t = 𝜀𝑖t−1 + 𝑢𝑖 and 𝐸[𝑢𝑖𝑢′
𝑖] = 𝜎2𝐼𝑁.

53
Let Δ denote difference operator such that ΔX = 𝑋𝑡 − 𝑋𝑡−1. This implies that
Δ𝑌𝑖𝑡 = Δ𝛽1𝐹𝑖t + Δ𝛽2𝐿𝑖t + Δ𝑋𝑖t′ 𝛾 + 𝑢𝑖.
Thus, first differencing solves the problem of heterogeneity parameters.
Results
This section presents the estimates of federally funded nutritional programs
uptake on three early childhood development outcomes: standardized receptive, and
expressive communication, and cognition outcomes. In Table 3-5, each column presents
the estimates of the overall effect from fixed effects estimation. The fixed effect
estimates in Table 3-6 show that after controlling for observable child and mother
characteristics, the effect of SNAP/WIC was statistically significant only for receptive
communication outcomes.
We next performed robustness checks with additional controls and present the
results in Table 3-7. Specifications 1-4 show the fixed effects estimations adding
neighborhood quality, participation in community programs and the addition of
anthropometric variables decreased the magnitude of the effect of interest but did not
substantially changed the results.
The estimated effect of ever participation in SNAP/WIC on child’s receptive
communication scores is now statistically significant and it is equal to 0.32 SDs. All
specifications additionally controls for family characteristics that are both time varying
(child’s age, health status, marital status, employment status, knowledge of infant
development, neighborhood safety) and time invariant represented by the mother-infant
fixed effects and year fixed effects.
We further investigate the load of time-invariant covariates on the predicted fixed
effects. Table 3-8 shows that race, marital status and income group all are statistically

54
significant predictors of unexplained variation from time-varying controls. This justifies
the use of fixed effect models.
Conclusion
In this paper, we estimated the effect of mothers’ participation in the
Supplementary Nutrition Assistance Program (SNAP) and the Special Supplemental
Nutrition Program for Women, Infants, and Children (WIC) on early cognitive and non-
cognitive developmental outcomes as measured by the Bayley Scales of Infant
Development (BSID-III). In our rich data set we were able to directly identify the change
in neurodevelopmental outcomes associated with changes in food programs uptake.
We found that mothers’ participation in SNAP and WIC during pregnancy and in
early childhood has a direct effect on cognitive and noncognitive skill formation in early
age. We find that participation in food assistance programs leads to a significant
increase in receptive communication as measured by Bayley scales. Our results are
robust, and the inclusion of a rich set of possible confounding factors further supports
the validity of the research design. Overall, our results suggest that food assistance
programs improve BSID-III scores and that such programs may decrease the gaps in
child ability across families of different socio-economic status.

55
Table 3-1 Summary statistics of BSID-III raw scores
VARIABLES Mean at year 1 Mean at year 2
Cognitive subtest 16.97 62.31
[2.03] [5.82]
Receptive communication subtest 11.77 25.83
[2.09] [5.45]
Expressive communication subtest 12.65 29.88
[2.09] [5.68]
Observations 1,131 1093
Note: Data from CANDLE study. Standard deviations in parentheses.

56
Table 3-2 Summary of food programs uptake
VARIABLES Mean/SD
WIC during pregnancy 0.58
[0.49]
Supplemental programs 0.013
[0.11]
SNAP 0.46
[0.50]
School programs 0.24
[0.43]
Home visitation program 0.06
[0.23]
Observations 1,131
Note: Data from CANDLE study. Standard deviations in parentheses.
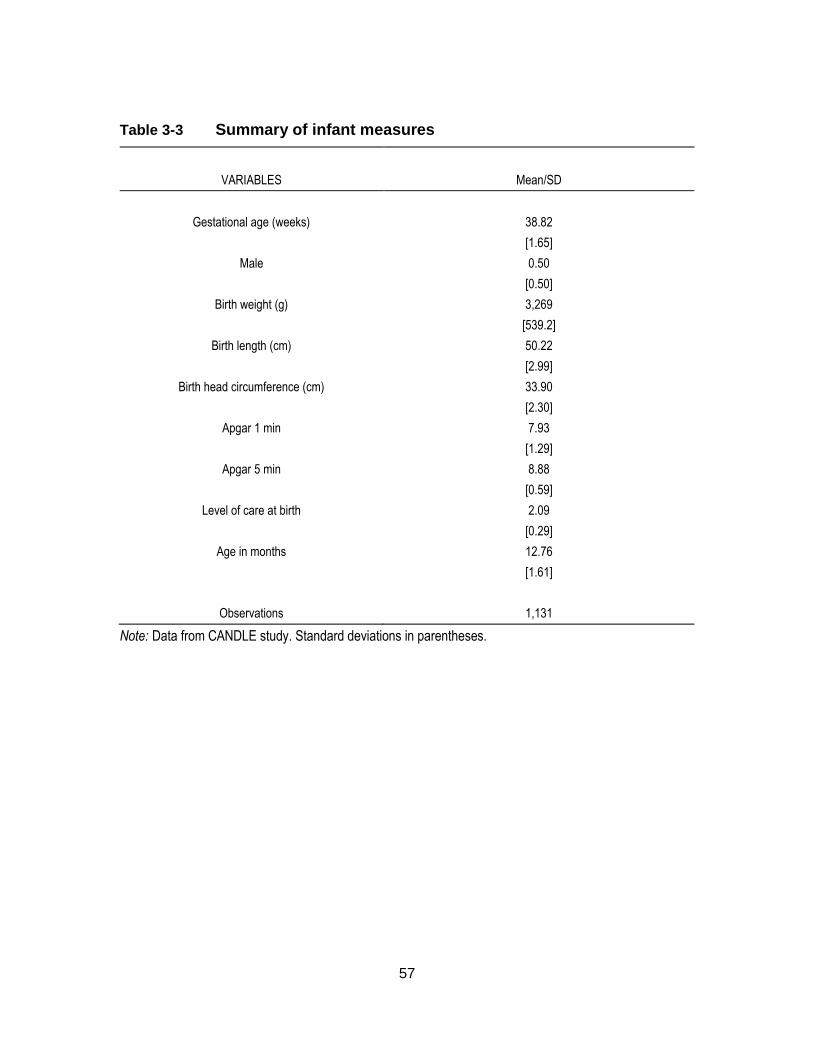
57
Table 3-3 Summary of infant measures
VARIABLES Mean/SD
Gestational age (weeks) 38.82
[1.65]
Male 0.50
[0.50]
Birth weight (g) 3,269
[539.2]
Birth length (cm) 50.22
[2.99]
Birth head circumference (cm) 33.90
[2.30]
Apgar 1 min 7.93
[1.29]
Apgar 5 min 8.88
[0.59]
Level of care at birth 2.09
[0.29]
Age in months 12.76
[1.61]
Observations 1,131
Note: Data from CANDLE study. Standard deviations in parentheses.

58
Table 3-4 Summary of sociodemographic measures for mothers
VARIABLES Mean/SD
Age 26.94
[5.40]
BMI 27.78
[7.73]
White 0.39
[0.49]
African American 0.62
[0.49]
Less than high school 0.05
[0.21]
High school diploma or GED 0.43
[0.50]
Technical school 0.116
[0.31]
College degree 0.25
[0.43]
Married 0.47
[0.49]
Living with a Partner 0.144
[0.35]
Never married 0.35
[0.47]
$5000-24999 0.33
[0.47]
$25000-44999 0.16
[0.37]
$45000-64999 0.13
[0.33]
>$65000 0.24
[0.42]
Tobacco use 0.09
[0.28]
Medicaid of TennCare insurance 0.48
[0.50]
Observations 1,131

59
Note: Data from CANDLE study. Standard deviations in parentheses.

60
Table 3-5 Overall Effect of participation in Federal Nutrition Assistance Programs (SNAP or WIC)
Receptive Expressive Cognitive
WIC/SNAP 0.25** 0.10 -0.08
[0.13] [0.12] [0.15]
Observations 1,226 1,226 1,226
Adj R-squared 0.01 0.00 0.00
Number of studyid 688 688 688
Note: Robust standard errors in parentheses *** p<0.01, ** p<0.05, * p<0.1.

61
Table 3-6 Adjusted Overall Effect of participation in Federal Nutrition Assistance Programs (SNAP or WIC)
Receptive Expressive Cognitive
WIC/SNAP 0.34** 0.10 -0.09
[0.16] [0.14] [0.19]
Child Age 0.01 0.01 0.01
[0.01] [0.01] [0.01]
Health status 0.43*** 0.11 0.21
[0.14] [0.13] [0.16]
Marital status -0.04 -0.05 -0.03
[0.08] [0.06] [0.07]
Employment -0.33*** -0.16* -0.05
[0.09] [0.09] [0.10]
Knowledge of Infant Development 0.01 0.01 0.01***
[0.00] [0.01] [0.00]
Medicaid 0.00 0.07 0.05
[0.14] [0.12] [0.16]
Neighborhood safety 0.16** 0.11* 0.09
[0.07] [0.06] [0.09]
Observations 1,061 1,061 1,061
Adj R-squared 0.07 0.03 0.02
Number of studyid 650 650 650
Note: Robust standard errors in parentheses *** p<0.01, ** p<0.05, * p<0.1.

62
Table 3-7 Robustness checks more controls
(1) (2) (3) (4)
Neighborhood Quality
Community Programs
Average Height
Average Weight
DepVar: Receptive
0.34** 0.31* 0.29* 0.32*
[0.16] [0.16] [0.17] [0.17]
DepVar:
Expressive
0.10 0.08 0.08 0.09
[0.14] [0.14] [0.14] [0.14]
DepVar:
Cognitive -0.08 -0.10 -0.10 0.02
[0.19] [0.19] [0.20] [0.17]
Neighborhood Quality
˟ ˟ ˟ ˟
Community Programs
˟ ˟ ˟
Average Height ˟ ˟
Average Weight ˟
Adj R-squared 0.07 0.07 0.07 0.07
F-test for extra-controls (P-val)
0.76 0.74 0.08 0.09
Time Varying Controls
˟ ˟ ˟ ˟
Mother-Infant FE ˟ ˟ ˟ ˟
Year FE ˟ ˟ ˟ ˟
Sample Size 650 650 647 646
Note: Robust standard errors in parentheses *** p<0.01, ** p<0.05, * p<0.1.

63
Table 3-8 Regression results of predicted fixed effects on time-invariant controls
(1) (2) (3)
Receptive FE Expressive FE Cognitive FE
Race 0.06*** 0.03*** 0.001
[0.02] [0.01] [0.01]
Marital Status 0.13*** 0.15*** 0.12***
[0.02] [0.01] [0.01]
Income -0.05*** -0.02*** -0.01
[0.0001] [0.0001] [0.01]
Observations 1,574 1,574 1,574
Adj R-squared 0.23 0.19 0.17
Note: Robust standard errors in parentheses *** p<0.01, ** p<0.05, * p<0.1.

64
References
[1] S. M. Lasswell, W. D. Barfield, R. W. Rochat, and L. Blackmon, “Perinatal regionalization for very low-birth-weight and very preterm infants: a meta-analysis.,” JAMA, vol. 304, no. 9, pp. 992–1000, Sep. 2010.
[2] M. M. Bode, T. M. O’shea, K. R. Metzguer, and A. D. Stiles, “Perinatal regionalization and neonatal mortality in North Carolina, 1968-1994.,” Am. J. Obstet. Gynecol., vol. 184, no. 6, pp. 1302–7, May 2001.
[3] M. S. Clement, “Perinatal care in Arizona 1950-2002: a study of the positive impact of technology, regionalization and the Arizona perinatal trust.,” J. Perinatol., vol. 25, no. 8, pp. 503–8, Aug. 2005.
[4] P. Bharadwaj, K. V. Løken, and C. Neilson, “Early Life Health Interventions and Academic Achievement,” Am. Econ. Rev., vol. 103, no. 5, pp. 1862–1891, Aug. 2013.
[5] D. N. Figlio, J. Guryan, K. Karbownik, and J. Roth, “The Effects of Poor Neonatal Health on Children’s Cognitive Development,” Feb. 2013.
[6] S. J. Kilpatrick, M. A. Schlueter, R. Piecuch, C. H. Leonard, M. Rogido, and A. Sola, “Outcome of infants born at 24-26 weeks’ gestation: I. Survival and cost.,” Obstet. Gynecol., vol. 90, no. 5, pp. 803–8, Nov. 1997.
[7] S. Bohin, E. S. Draper, and D. J. Field, “Impact of extremely immature infants on neonatal services.,” Arch. Dis. Child. Fetal Neonatal Ed., vol. 74, no. 2, pp. F110–3, Mar. 1996.
[8] F. Khurshid, K.-S. Lee, P. J. McNamara, H. Whyte, and W. Mak, “Lessons learned during implementation of therapeutic hypothermia for neonatal hypoxic ischemic encephalopathy in a regional transport program in Ontario.,” Paediatr. Child Health, vol. 16, no. 3, pp. 153–6, Mar. 2011.
[9] J. C. Sinclair, “Effectiveness of intensive care of very low birth-weight infants.,” Mead Johnson Symp. Perinat. Dev. Med., no. 20, pp. 23–8, Jan. 1982.
[10] J. Cifuentes, J. Bronstein, C. S. Phibbs, R. H. Phibbs, S. K. Schmitt, and W. A. Carlo, “Mortality in low birth weight infants according to level of neonatal care at hospital of birth.,” Pediatrics, vol. 109, no. 5, pp. 745–51, May 2002.

65
[11] T. M. O’Shea, “Diagnosis, treatment, and prevention of cerebral palsy.,” Clin. Obstet. Gynecol., vol. 51, no. 4, pp. 816–28, Dec. 2008.
[12] P. Rosenbaum, N. Paneth, A. Leviton, M. Goldstein, M. Bax, D. Damiano, B. Dan, and B. Jacobsson, “A report: the definition and classification of cerebral palsy April 2006.,” Dev. Med. Child Neurol. Suppl., vol. 109, pp. 8–14, Feb. 2007.
[13] G. Surman, K. Hemming, M. J. Platt, J. Parkes, A. Green, J. Hutton, and J. J. Kurinczuk, “Children with cerebral palsy: severity and trends over time.,” Paediatr. Perinat. Epidemiol., vol. 23, no. 6, pp. 513–21, Nov. 2009.
[14] M. Oskoui, L. Joseph, L. Dagenais, and M. Shevell, “Prevalence of cerebral palsy in Quebec: alternative approaches.,” Neuroepidemiology, vol. 40, no. 4, pp. 264–8, Jan. 2013.
[15] CDC, “Economic costs associated with mental retardation, cerebral palsy, hearing loss, and vision impairment--United States, 2003.,” MMWR. Morb. Mortal. Wkly. Rep., vol. 53, no. 3, pp. 57–9, Jan. 2004.
[16] M. Kruse, S. I. Michelsen, E. M. Flachs, H. Brønnum-Hansen, M. Madsen, and P. Uldall, “Lifetime costs of cerebral palsy.,” Dev. Med. Child Neurol., vol. 51, no. 8, pp. 622–8, Aug. 2009.
[17] A. C. C. Lee, S. Cousens, S. N. Wall, S. Niermeyer, G. L. Darmstadt, W. A. Carlo, W. J. Keenan, Z. A. Bhutta, C. Gill, and J. E. Lawn, “Neonatal resuscitation and immediate newborn assessment and stimulation for the prevention of neonatal deaths: a systematic review, meta-analysis and Delphi estimation of mortality effect.,” BMC Public Health, vol. 11 Suppl 3, p. S12, Jan. 2011.
[18] F. A. Sloan, K. Whetten-Goldstein, E. M. Stout, S. S. Entman, and G. B. Hickson, “No-fault system of compensation for obstetric injury: winners and losers.,” Obstet. Gynecol., vol. 91, no. 3, pp. 437–43, Mar. 1998.
[19] A. MacLennan, K. B. Nelson, G. Hankins, and M. Speer, “Who will deliver our grandchildren? Implications of cerebral palsy litigation.,” JAMA, vol. 294, no. 13, pp. 1688–90, Oct. 2005.
[20] G. Gaffney, S. Sellers, V. Flavell, M. Squier, and A. Johnson, “Case-control study of intrapartum care, cerebral palsy, and perinatal death,” BMJ, vol. 308, no. 6931, pp. 743–750, Mar. 1994.
[21] COMMITTEE ON FETUS AND NEWBORN, “Levels of neonatal care.,” Pediatrics, vol. 130, no. 3, pp. 587–97, Sep. 2012.
[22] A. R. Stark, “Levels of neonatal care.,” Pediatrics, vol. 114, no. 5, pp. 1341–7, Nov. 2004.

66
[23] Department of National Health and Welfare., “Recommended standards for maternity and newborn care,” Ottawa, 1968.
[24] AMA House of Delegates, “Centralized community or regionalized perinatal intensive care,” Atlantic City, New Jersey, 1971.
[25] V. Y. H. Yu and P. M. Dunn, “Development of regionalized perinatal care.,” Semin. Neonatol., vol. 9, no. 2, pp. 89–97, Apr. 2004.
[26] “Giving Birth in Canada. The Costs,” 2006. [Online]. Available: https://secure.cihi.ca/free_products/Costs_Report_06_Eng.pdf. [Accessed: 24-May-2015].
[27] R. Liston, D. Sawchuck, and D. Young, “Fetal health surveillance: antepartum and intrapartum consensus guideline.,” J. Obstet. Gynaecol. Can., vol. 29, no. 9 Suppl 4, pp. S3–56, Sep. 2007.
[28] N. L. Gilbert, D. B. Fell, K. S. Joseph, S. Liu, J. A. León, and R. Sauve, “Temporal trends in sudden infant death syndrome in Canada from 1991 to 2005: contribution of changes in cause of death assignment practices and in maternal and infant characteristics.,” Paediatr. Perinat. Epidemiol., vol. 26, no. 2, pp. 124–30, Mar. 2012.
[29] SOGO, “Attendance at Labour and Delivery Guidelines for Obstetrical Care,” Ottawa, 2000.
[30] R. Palisano, P. Rosenbaum, S. Walter, D. Russell, E. Wood, and B. Galuppi, “Development and reliability of a system to classify gross motor function in children with cerebral palsy.,” Dev. Med. Child Neurol., vol. 39, no. 4, pp. 214–23, Apr. 1997.
[31] Shi L, Health Services Research Methods, 2nd ed. Clifton Park, NY: Thomson, 2008.
[32] H. Trønnes, A. J. Wilcox, R. T. Lie, T. Markestad, and D. Moster, “Risk of cerebral palsy in relation to pregnancy disorders and preterm birth: a national cohort study.,” Dev. Med. Child Neurol., Mar. 2014.
[33] J. M. Freeman and K. B. Nelson, “Intrapartum asphyxia and cerebral palsy.,” Pediatrics, vol. 82, no. 2, pp. 240–9, Aug. 1988.
[34] E. M. Graham, K. A. Ruis, A. L. Hartman, F. J. Northington, and H. E. Fox, “A systematic review of the role of intrapartum hypoxia-ischemia in the causation of neonatal encephalopathy.,” Am. J. Obstet. Gynecol., vol. 199, no. 6, pp. 587–95, Dec. 2008.

67
[35] V. Y. Yu, L. Downe, J. Astbury, and B. Bajuk, “Perinatal factors and adverse outcome in extremely low birthweight infants.,” Arch. Dis. Child., vol. 61, no. 6, pp. 554–8, Jun. 1986.
[36] J. J. Heckman, H. Ichimura, and P. E. Todd, “Matching as an Econometric Evaluation Estimator: Evidence from Evaluating a Job Training Programme,” Rev. Econ. Stud., vol. 64, no. 4, pp. 605–654, Oct. 1997.
[37] P. R. Rosenbaum and D. B. Rubin, “Constructing a Control Group Using Multivariate Matched Sampling Methods That Incorporate the Propensity Score,” Am. Stat., vol. 39, no. 1, pp. 33–38, Feb. 1985.
[38] P. Rosenbaum, Observational Studies. New York: Springer, 2002.
[39] S. Becker and Caliendo, M., “Sensitivity analysis for average treatment effects,” Stata J., vol. 7, no. 1, pp. 71–83, 2007.
[40] H. Bang and J. M. Robins, “Doubly robust estimation in missing data and causal inference models.,” Biometrics, vol. 61, no. 4, pp. 962–73, Dec. 2005.
[41] J. M. Robins, A. Rotnitzky, and L. P. Zhao, “Estimation of Regression Coefficients When Some Regressors are not Always Observed,” Feb. 2012.
[42] “Attendance at Labour and Delivery Guidelines for Obstetrical Care,” 2000.
[43] Health Canada, “Family-centred maternity and newborn care: national guidelines.,” Ottawa.
[44] J. Kattwinkel, Textbook of Neonatal Resuscitation, 5th ed. Elk Grove Village, IL: Of, Ed American Academy Association, Pediatrics and American Heart, 2006.
[45] A. T. Bang, R. A. Bang, S. B. Baitule, H. M. Reddy, and M. D. Deshmukh, “Management of birth asphyxia in home deliveries in rural Gadchiroli: the effect of two types of birth attendants and of resuscitating with mouth-to-mouth, tube-mask or bag-mask.,” J. Perinatol., vol. 25 Suppl 1, pp. S82–91, Mar. 2005.
[46] C. J. Gill, G. Phiri-Mazala, N. G. Guerina, J. Kasimba, C. Mulenga, W. B. MacLeod, N. Waitolo, A. B. Knapp, M. Mirochnick, A. Mazimba, M. P. Fox, L. Sabin, P. Seidenberg, J. L. Simon, and D. H. Hamer, “Effect of training traditional birth attendants on neonatal mortality (Lufwanyama Neonatal Survival Project): randomised controlled study.,” BMJ, vol. 342, p. d346, Jan. 2011.
[47] J. Grytten, L. Monkerud, I. Skau, and R. Sørensen, “Regionalization and Local Hospital Closure in Norwegian Maternity Care-The Effect on Neonatal and Infant Mortality.,” Health Serv. Res., Jan. 2014.
68
[48] Committee on Hospital Care, “Guidelines for Air and Ground Transportation of Pediatric Patients,” Pediatrics, vol. 78, no. 5, pp. 943–950, Nov. 1986.
[49] S. H. Y. Eliason, H. Whyte, K. Dow, C. M. Cronin, and S. Lee, “Variations in transport outcomes of outborn infants among Canadian neonatal intensive care units.,” Am. J. Perinatol., vol. 30, no. 5, pp. 377–82, May 2013.
[50] “Interfacility Critical Care Transport of Maternal, Neonatal and Paediatric Patients,” 2012. [Online]. Available: http://static.squarespace.com/static/50056474c4aa4387b4e629ea/t/505893fc24acf7cfaa552d15/1347982332733/. [Accessed: 02-Apr-2015].
[51] K. A. McCloskey and C. Johnston, “Critical care interhospital transports: predictability of the need for a pediatrician.,” Pediatr. Emerg. Care, vol. 6, no. 2, pp. 89–92, Jun. 1990.
[52] R. K. Kanter and J. M. Tompkins, “Adverse events during interhospital transport: physiologic deterioration associated with pretransport severity of illness.,” Pediatrics, vol. 84, no. 1, pp. 43–8, Jul. 1989.
[53] J. Insel, C. Weissman, M. Kemper, J. Askanazi, and A. I. Hyman, “Cardiovascular changes during transport of critically ill and postoperative patients.,” Crit. Care Med., vol. 14, no. 6, pp. 539–42, Jun. 1986.
[54] C. M. Olson, M. S. Jastremski, J. P. Vilogi, C. M. Madden, and K. M. Beney, “Stabilization of patients prior to interhospital transfer.,” Am. J. Emerg. Med., vol. 5, no. 1, pp. 33–9, Jan. 1987.
[55] D. H. Kruse, “Interhospital transfer. How to prepare your patient.,” Nursing (Lond)., vol. 21, no. 2, p. 41, Feb. 1991.
[56] J. D. Angrist and J.-S. Pischke, “Mostly harmless econometrics: An empiricist’s companion,” An empiricist’s companion, no. March, p. 392, 2008.
[57] R. E. Lucas, “On the mechanics of economic development,” J. Monet. Econ., vol. 22, no. 1, pp. 3–42, Jul. 1988.
[58] P. M. Romer, “Endogenous Technological Change,” J. Polit. Econ., vol. 98, no. 5, pp. S71–S102, Oct. 1990.
[59] T. W. Schultz, “Investment in Human Capital,” Am. Econ. Rev., vol. 51, no. 1, pp. 1–17 CR – Copyright © 1961 American Economic, Mar. 1961.
[60] G. S. Becker, Human capital: a theoretical and empirical analysis, with special reference to education, vol. 24. 1964.

69
[61] F. Cunha and J. Heckman, “The Technology of Skill Formation,” Am. Econ. Rev., vol. 97, no. 2, pp. 31–47, May 2007.
[62] J. Hoddinott, J. A. Maluccio, J. R. Behrman, R. Flores, and R. Martorell, “Effect of a nutrition intervention during early childhood on economic productivity in Guatemalan adults.,” Lancet, vol. 371, no. 9610, pp. 411–6, Feb. 2008.
[63] T. H. Equation, “The Heckman Equation Invest in early childhood development : Reduce deficits , strengthen the economy . The Heckman Equation Make greater investments in young children to see greater returns in education , health and productivity .,” 2012.
[64] F. Cunha, J. J. Heckman, and D. V Masterov, “No Title,” 2005.
[65] F. Cunha, J. Heckman, and S. Schennach, “No Title,” 2010.
[66] C. M. A. Haworth and R. Plomin, “Quantitative genetics in the era of molecular genetics: learning abilities and disabilities as an example.,” J. Am. Acad. Child Adolesc. Psychiatry, vol. 49, no. 8, pp. 783–93, Aug. 2010.
[67] K. Stromswold, “Why aren’t identical twins linguistically identical? Genetic, prenatal and postnatal factors.,” Cognition, vol. 101, no. 2, pp. 333–84, Sep. 2006.
[68] M. K. Georgieff, “Nutrition and the developing brain: nutrient priorities and measurement.,” Am. J. Clin. Nutr., vol. 85, no. 2, p. 614S–620S, Feb. 2007.
[69] W. H. Meck and C. L. Williams, “Metabolic imprinting of choline by its availability during gestation: implications for memory and attentional processing across the lifespan.,” Neurosci. Biobehav. Rev., vol. 27, no. 4, pp. 385–99, Sep. 2003.
[70] S. Salvati, L. Attorri, C. Avellino, A. Di Biase, and M. Sanchez, “Diet, lipids and brain development.,” Dev. Neurosci., vol. 22, no. 5–6, pp. 481–7, Jan. .
[71] F. J. Rosales, J. S. Reznick, and S. H. Zeisel, “Understanding the role of nutrition in the brain and behavioral development of toddlers and preschool children: identifying and addressing methodological barriers.,” Nutr. Neurosci., vol. 12, no. 5, pp. 190–202, Oct. 2009.
[72] P. Glewwe, H. G. Jacoby, and E. M. King, “Early childhood nutrition and academic achievement: a longitudinal analysis,” J. Public Econ., vol. 81, no. 3, pp. 345–368, Sep. 2001.
[73] J. Winicki and K. Jemison, “Food Insecurity and Hunger in the Kindergarten Classroom: Its Effect on Learning and Growth,” Contemp. Econ. Policy, vol. 21, no. 2, pp. 145–157, Apr. 2003.

70
[74] H. Alderman, “Long term consequences of early childhood malnutrition,” Oxf. Econ. Pap., vol. 58, no. 3, pp. 450–474, Apr. 2006.
[75] C. G. Victora, L. Adair, C. Fall, P. C. Hallal, R. Martorell, L. Richter, and H. S. Sachdev, “Maternal and child undernutrition: consequences for adult health and human capital.,” Lancet, vol. 371, no. 9609, pp. 340–57, Jan. 2008.
[76] J. Hoddinott, J. R. Behrman, and R. Martorell, “Labor force activities and income among young Guatemalan adults.,” Food Nutr. Bull., vol. 26, no. 2 Suppl 1, pp. S98–109, Jun. 2005.
[77] H. W. Hoynes, M. E. Page, and A. H. Stevens, “Is a WIC Start a Better Start? Evaluating WIC’s Impact on Infant Health Using Program Introduction,” Dec. 2009.
[78] D. Almond, H. W. Hoynes, and D. W. Schanzenbach, “Inside the War on Poverty: The Impact of Food Stamps on Birth Outcomes,” Rev. Econ. Stat., vol. 93, no. 2, pp. 387–403, May 2011.
[79] M. P. Bitler and J. Currie, “Does WIC work? The effects of WIC on pregnancy and birth outcomes.,” J. Policy Anal. Manage., vol. 24, no. 1, pp. 73–91, Jan. 2005.
[80] J. Currie and I. Rajani, “Within-Mother Estimates of the Effects of WIC on Birth Outcomes in New York City,” Aug. 2014.
[81] H. W. Hoynes, D. W. Schanzenbach, and D. Almond, “Long Run Impacts of Childhood Access to the Safety Net,” Nov. 2012.
[82] L. E. Hicks, R. A. Langham, and J. Takenaka, “Cognitive and health measures following early nutritional supplementation: a sibling study.,” Am. J. Public Health, vol. 72, no. 10, pp. 1110–8, Oct. 1982.
[83] J. and E. M. Currie, Making Americans Healthier: Social and Economic Policy as Health Policy. New York: Russell Sage Press, 2008.
[84] N. Bayley, Bayley scales of infant and toddler development. San Antonio: Pearson Education, Inc, 2006.
[85] J. Sattler, Assessment of children: cognitive foundations. San Diego: Jerome M. Sattler Publisher Inc, 2008.
[86] J. P. and D. A. P. Shonkoff, Ed., From Neurons to Neighborhoods:: The Science of Early Childhood Development, vol. 13. Washington, D.C.: National Academies Press, 2000.
[87] E. I. Knudsen, “Sensitive periods in the development of the brain and behavior.,” J. Cogn. Neurosci., vol. 16, pp. 1412–1425, 2004.

71
[88] F. Cunha and J. J. Heckman, “The Economics and Psychology of Inequality and Human Development,” Jan. 2009.
[89] C. A. Herrnstein, Richard J. and Murray, The Bell Curve: Intelligence and Class Structure in American Life. New York: Free Press, 1994.
[90] M. C. Auld and N. Sidhu, “Schooling, cognitive ability and health.,” Health Econ., vol. 14, no. 10, pp. 1019–34, Oct. 2005.
[91] J. J. Heckman, J. Stixrud, and S. Urzua, “The Effects of Cognitive and Noncognitive Abilities on Labor Market Outcomes and Social Behavior,” Feb. 2006.
[92] P. Carneiro, J. J. Heckman, and D. V Masterov, “Labor Market Discrimination and Racial Differences in Premarket Factors,” Nov. 2003.
[93] M. S. Burrage, C. C. Ponitz, E. A. McCready, P. Shah, B. C. Sims, A. M. Jewkes, and F. J. Morrison, “Age- and schooling-related effects on executive functions in young children: a natural experiment.,” Child Neuropsychol., vol. 14, no. 6, pp. 510–24, Nov. 2008.
[94] G. Kochanska, K. C. Coy, and K. T. Murray, “The development of self-regulation in the first four years of life.,” Child Dev., vol. 72, no. 4, pp. 1091–111, Jan. .
[95] A. Bouchard-Mercier, A.-M. Paradis, I. Rudkowska, S. Lemieux, P. Couture, and M.-C. Vohl, “Associations between dietary patterns and gene expression profiles of healthy men and women: a cross-sectional study.,” Nutr. J., vol. 12, no. 1, p. 24, Jan. 2013.
[96] R. S. Levi and I. R. Sanderson, “Dietary regulation of gene expression.,” Curr. Opin. Gastroenterol., vol. 20, no. 2, pp. 139–42, Mar. 2004.
[97] Z. A. Bhutta, “Micronutrient needs of malnourished children.,” Curr. Opin. Clin. Nutr. Metab. Care, vol. 11, no. 3, pp. 309–14, May 2008.
[98] and M. H. Gluckman, Peter, The Fetal Matrix: Evolution, Develop-ment and Disease. Cambridge: Cambridge University Press, 2005.
[99] USDA, “Supplemental Nutrition Assistance Program (SNAP) | Food and Nutrition Service,” 2013. [Online]. Available: http://www.fns.usda.gov/pd/supplemental-nutrition-assistance-program-snap. [Accessed: 25-Aug-2014].
[100] USDA, “WIC Program | Food and Nutrition Service,” 2013. [Online]. Available: http://www.fns.usda.gov/pd/wic-program. [Accessed: 25-Aug-2014].
[101] M. P. Bitler, J. Currie, and J. K. Scholz, “WIC Eligibility and Participation,” J. Hum. Resour., vol. 38, pp. 1139–1179, Jan. 2003.

72
[102] F. B. Palmer, K. J. S. Anand, J. C. Graff, L. E. Murphy, Y. Qu, E. Völgyi, C. R. Rovnaghi, A. Moore, Q. T. Tran, and F. A. Tylavsky, “Early adversity, socioemotional development, and stress in urban 1-year-old children,” J. Pediatr., vol. 163, 2013.
[103] M. H. Johnson, T. Gliga, E. Jones, and T. Charman, “Annual Research Review: Infant development, autism, and ADHD - early pathways to emerging disorders.,” J. Child Psychol. Psychiatry., Sep. 2014.
[104] P. L. Woods, I. Rieger, C. Wocadlo, and A. Gordon, “Predicting the outcome of specific language impairment at five years of age through early developmental assessment in preterm infants.,” Early Hum. Dev., vol. 90, no. 10, pp. 613–9, Oct. 2014.
[105] L. Visser, S. A. J. Ruiter, B. F. Van der Meulen, W. A. J. J. M. Ruijssenaars, and M. E. Timmerman, “Validity and suitability of the Bayley-III Low Motor/Vision version: a comparative study among young children with and without motor and/or visual impairments.,” Res. Dev. Disabil., vol. 34, no. 11, pp. 3736–45, Nov. 2013.
[106] J. Colombo, Infant Cognition: Predicting Later Intellectual Functioning. SAGE Publications, 1993.
[107] Nunnally JC and B. IH, Psychometric theory. New York: McGraw- Hill, Inc, 1994.
[108] G. W. Evans, “Child Development and the Physical Environment,” Nov. 2005.
[109] E. Hoff, “The specificity of environmental influence: socioeconomic status affects early vocabulary development via maternal speech.,” Child Dev., vol. 74, no. 5, pp. 1368–78, Jan. .
[110] N. Watt, A. Wetherby, and S. Shumway, “Prelinguistic predictors of language outcome at 3 years of age.,” J. Speech. Lang. Hear. Res., vol. 49, no. 6, pp. 1224–37, Dec. 2006.
[111] M. Westerlund and D. Lagerberg, “Expressive vocabulary in 18-month-old children in relation to demographic factors, mother and child characteristics, communication style and shared reading.,” Child. Care. Health Dev., vol. 34, no. 2, pp. 257–66, Mar. 2008.

73
Appendix. Definitions of the levels of the neonatal care used in Quebec
1A: basic care + phototherapy
1B: greater or equal to 34 weeks of gestation, intravenous therapy, gavage feeding
2A:greater or equal to 32 weeks of gestation, intravenous therapy, gavage feeding
2B:greater or equal to 32 weeks of gestation, intravenous therapy, gavage feeding and ventilation via nasal passage
2B+: greater or equal to 30 weeks of gestation, intravenous therapy, gavage feeding and ventilation via nasal passage or endotracheal ventilation
3A-: greater or equal to 29 weeks of gestation, endotracheal ventilation + NO. Immediate access to all specialists.
3A: care provided to all babies regardless of their gestational age or birth weight. Endotracheal ventilation + NO. Immediate access to all specialists.
3B: level 3A care and complete access to specialists. Imaging tests carried out and interpretation of results done. Surgeries done except for severe cardiac malformations requiring extracorporeal circulation.
3C: Level 3B care + surgical repair of severe cardiac malformations requiring extracorporeal circulation.