early stopping rules: interim analyses elizabeth s. garrett [email protected] oncology biostatistics may...
TRANSCRIPT

Early Stopping Rules:Interim Analyses
Elizabeth S. Garrett
Oncology Biostatistics
May 8, 2002
Clinical Trials in 20 Hours

5/8/2002 Clinical Trials in 20 Hours
References S. Piantadosi (1997) “Data Dependent Stopping”, in Clinical Trials: A
Methodologic Perspective. Chapter10. New York: John Wiley and Sons.
• Souhami and Whitehead, eds. (1994) Workshop on Early Stopping Rules in Cancer Clinical Trials, Robinson College, Cambridge, UK, 13-15 April, 1993. Statistics in Medicine, 13: 1289-1500.
• Gail (1982) “Monitoring and Stopping Clinical Trials,” in Statistics in Medical Research, (eds. Mike and Stanley), New York: John Wiley and Sons.
• Pocock (1993) Statistical and Ethical Issues in Monitoring Clinical Trials, Statistics in Medicine, 12: 1459-1469.
Jones & Lewis, “Data and Safety Monitoring” in Biostatistics in Clinical Trials (ed. Redmond & Colton).

5/8/2002 Clinical Trials in 20 Hours
Goals for Today
• Describe what interim analysis means
• Understand why they need to be done
• Understand why “multiple looks” are frowned upon by many
• Consider some common analyses and designs that incorporate early stopping.
5/8/2002 Clinical Trials in 20 Hours
Interim Analyses• Also called “data-dependent stopping” or “early stopping”• Continuing a trial: there needs to be active monitoring so that a
trial is not continued simply because it was begun.• Some issues involved in stopping:
– ethics– precision of results– data quality– resource availability
• Usually, we use accumulated data to decide what to do• Sometimes outside information is provided to encourage us to stop
a trial (e.g. a trial using same drug had very bad/good effects elsewhere)
• Early stopping can be due to efficacy but also to other reasons (e.g. accrual too slow).

5/8/2002 Clinical Trials in 20 Hours
Some Examples of Why a Trial May Be Terminated*
• Treatments found to be convincingly different• Treatments found to be convincingly not different• Side effects or toxicities are too severe• Data quality is poor• Accrual is slow• Definitive information becomes available from an outside source making
trial unnecessary or unethical• Scientific question is no longer important• Adherence to treatment is unacceptably low• Resources to perform study are lost or diminished• Study integrity has been undermined by fraud or misconduct
* From S Piantadosi

5/8/2002 Clinical Trials in 20 Hours
Interim Analyses
• Example: Cancer Center Trials
• Yearly review
• We consider:
Accrual
Eligibility
Answering Primary Question
Adheres to Statistical Plan
Safety
Data Quality
Investigator Report
Overall Scientific Progress
5/8/2002 Clinical Trials in 20 Hours
Data Safety and Monitoring Committees
• Most comparative/phase III clinical trials have Data Safety and Monitoring Committees
• Their goal is to ensure that the trial is safe and warrants continuation.
• A qualitative review of adverse events is performed.
5/8/2002 Clinical Trials in 20 Hours
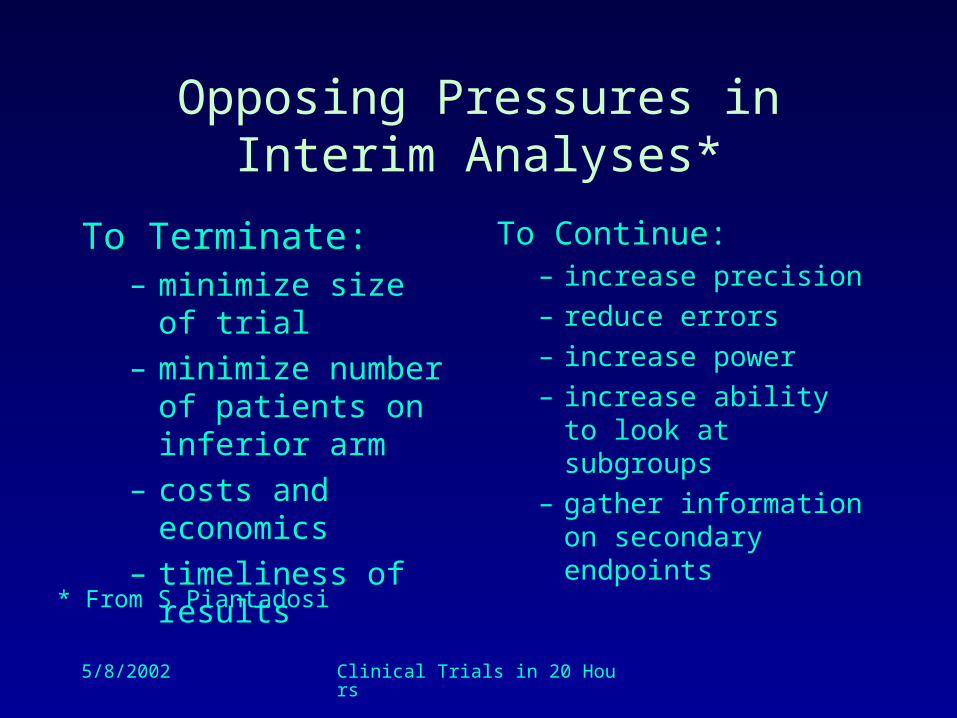
Opposing Pressures in Interim Analyses*
To Terminate:– minimize size of trial
– minimize number of patients on inferior arm
– costs and economics
– timeliness of results
To Continue:– increase precision
– reduce errors
– increase power
– increase ability to look at subgroups
– gather information on secondary endpoints
* From S Piantadosi

5/8/2002 Clinical Trials in 20 Hours
Statistical Considerations in Interim Analyses
• Consider a safety/efficacy study (phase II)
• “At this point in time, is there statistical evidence that….”– The treatment will not be as efficacious as we
would hope/need it to be?– The treatment is clearly dangerous/unsafe?– The treatment is very efficacious and we should
proceed to a comparative trial?
5/8/2002 Clinical Trials in 20 Hours
Statistical Considerations in Interim Analyses
• Consider a comparative study (phase III)
• “At this point in time, is there statistical evidence that….”– One arm is clearly more effective than the
other?– One arm is clearly dangerous/unsafe?– The two treatments have such similar responses
that there is no possibility that we will see a significant difference by the end of the trial?

5/8/2002 Clinical Trials in 20 Hours
Statistical Considerations in Interim Analyses
• We use interim statistical analyses to determine the answers to these questions.
• It is a tricky business:– interim analyses involve relatively few data points
– inferences can be imprecise
– we increase chance of errors.
– if interim results are conveyed to investigators, a bias may be introduced
– in general, we look for strong evidence in one or another direction.
5/8/2002 Clinical Trials in 20 Hours
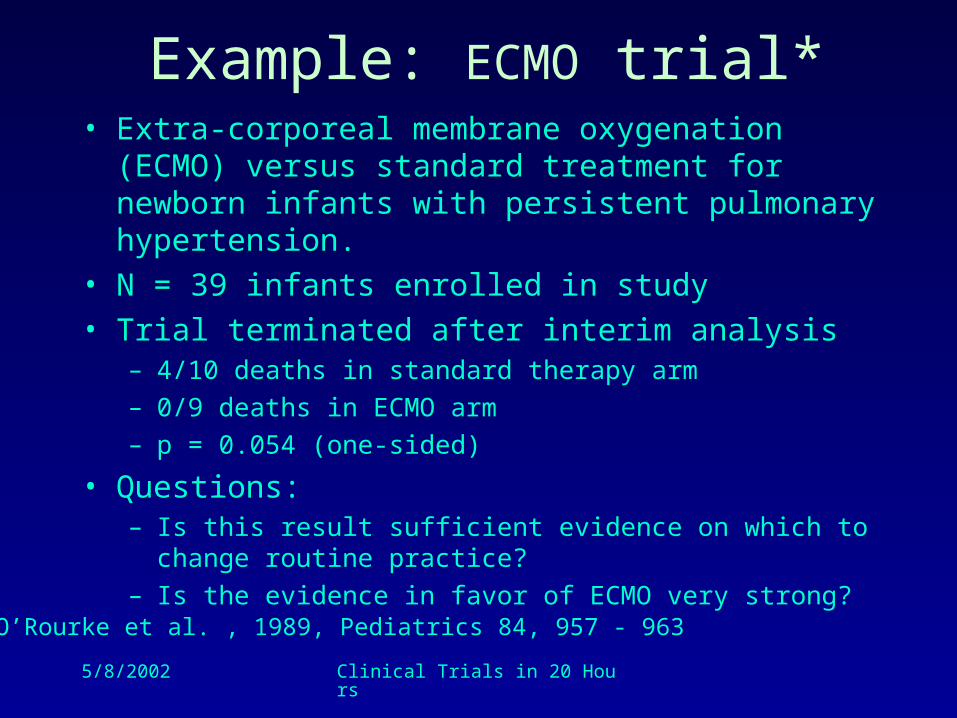
Example: ECMO trial*• Extra-corporeal membrane oxygenation (ECMO) versus
standard treatment for newborn infants with persistent pulmonary hypertension.
• N = 39 infants enrolled in study
• Trial terminated after interim analysis– 4/10 deaths in standard therapy arm
– 0/9 deaths in ECMO arm
– p = 0.054 (one-sided)
• Questions:– Is this result sufficient evidence on which to change routine
practice?
– Is the evidence in favor of ECMO very strong?
* O’Rourke et al. , 1989, Pediatrics 84, 957 - 963

5/8/2002 Clinical Trials in 20 Hours
Example: ISIS-2 trial*
• The Second International Study of Infarct Survival (ISIS-2)
• Five week study of streptokinase versus placebo based on 17,187 patients with myocardial infarction.
• Trial continued until– 12% death rate in placebo group
– 9.2% death rate in streptokinase group
– p < 0.000001
• Issues:– strong evidence in favor of streptokinase was available early on
– impact would be greater with better precision on death rate, which would not be possible if trial stopped early
– earlier trials of streptokinase has similar results, yet little impact.
* ISIS-2 Collaborative Group, 1988, Lancet ii, 349-360

5/8/2002 Clinical Trials in 20 Hours
Statistical Schools of Thought
• Three main philosophic views– Likelihood Theory– Bayesian Theory– Frequentist Theory
• All differ in their approach
• Frequentist is most commonly seen (but not necessarily best!)
• All treat interim analyses quite differently

5/8/2002 Clinical Trials in 20 Hours
Outline• Frequentist Issues:
– Multiple Looks– Group Sequential Designs
• Stopping Boundaries
• Alpha Spending Functions
– Two Stage Designs
• Likelihood Issues
• Bayesian Issues

5/8/2002 Clinical Trials in 20 Hours
An Example of “Multiple Looks:” Why you aren’t allowed to look at your data
• Consider planning a comparative trial in which two treatments are being compared for efficacy (response rate).
H0: p1 = p2
H1: p1 = 0.30, p2 = 0.50
• A standard design says that for 80% power and with alpha of 0.05, you need about 100 patients per arm.
• So what happens if we find p < 0.05 before all patients are enrolled?
• Why can’t we look at the data a few times in the middle of the trial and conclude that one treatment is better if we see p < 0.05?
5/8/2002 Clinical Trials in 20 Hours
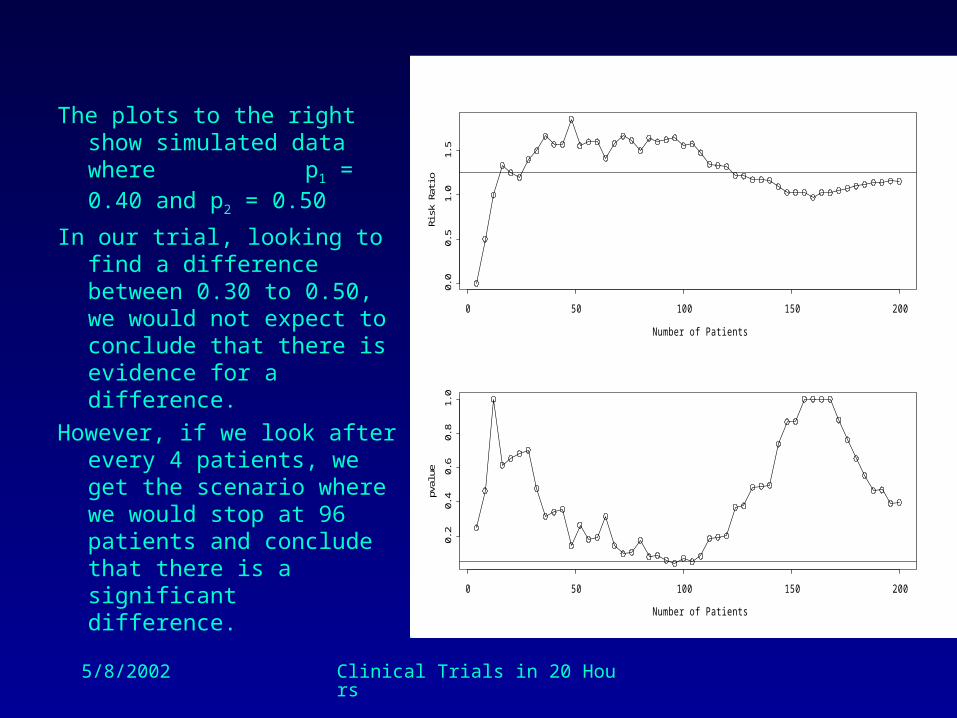
The plots to the right show simulated data where p1 = 0.40 and p2 = 0.50
In our trial, looking to find a difference between 0.30 to 0.50, we would not expect to conclude that there is evidence for a difference.
However, if we look after every 4 patients, we get the scenario where we would stop at 96 patients and conclude that there is a significant difference.
Number of Patients
Ris
k R
atio
0 50 100 150 200
0.0
0.5
1.0
1.5
Number of Patients
pval
ue
0 50 100 150 200
0.2
0.4
0.6
0.8
1.0
• H 1

5/8/2002 Clinical Trials in 20 Hours
If we look after every 10 patients, we get the scenario where we would not stop until all 200 patients were observed and would could that there is not a significant difference (p =0.40)
Number of Patients
Ris
k R
atio
50 100 150 200
1.0
1.2
1.4
1.6
Number of Patients
pval
ue
50 100 150 200
0.2
0.4
0.6
0.8
1.0
• H 1

5/8/2002 Clinical Trials in 20 Hours
If we look after every 40 patients, we get the scenario where we would don’t stop either.
If we wait until the END of the trial (N = 200), then we estimate p1 to be 0.45 and p2 to be 0.52. The pvalue for testing that there is a significant difference is 0.40.
Number of Patients
Risk
Rat
io
50 100 150 200
1.0
1.2
1.4
Number of Patients
pval
ue
50 100 150 200
0.2
0.4
0.6
0.8
1.0
• H 1
5/8/2002 Clinical Trials in 20 Hours
Why would we have messed up if we looked early on?
• Every time we look at the data and consider stopping, we introduce the chance of falsely rejecting the null hypothesis.
• In other words, every time we look at the data, we have the chance of a type 1 error.
• If we look at the data multiple times, and we use alpha of 0.05 as our criterion for significance, then we have a 5% chance of stopping each time.
• Under the true null hypothesis and just 2 looks at the data, then we “approximate” the error rates as:– Probability stop at first look: 0.05
– Probability stop at second look: 0.95*0.05 = 0.0475 Total probability of stopping 0.0975
5/8/2002 Clinical Trials in 20 Hours
Group Sequential Designs: (1) Traditional Stopping Boundaries
• Formalize stopping rules and keep error rates low.
• Heuristically, we set up a “statistical boundary” and stop if it is crossed.
• Simplest case: perform interim tests at a very stringent level of significance and then test at the ‘nominal’ level at the end of the study if trial has not terminated early.
• Examples:
– Do two interim analyses and only stop if p < 0.01. Then at end of trial, use nominal 0.05 rate. Total type 1 error rate = 0.07
– Do 5 interim analyses at 0.002 level. Then do final analysis at 0.04. Total type 1 error rate = 0.05.
5/8/2002 Clinical Trials in 20 Hours
Most commonly used error boundaries
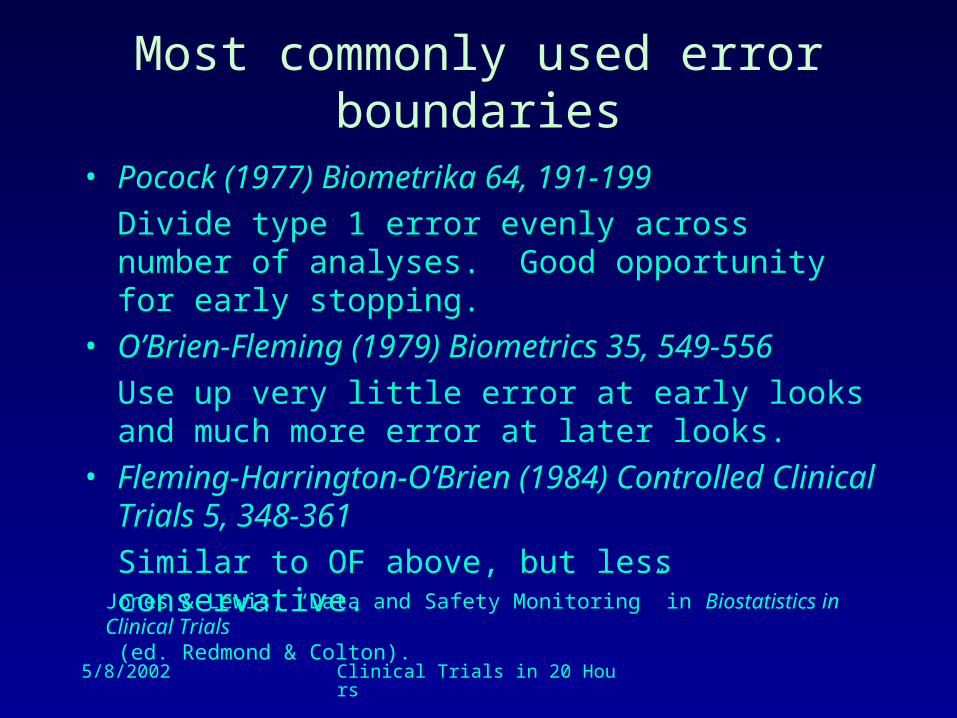
• Pocock (1977) Biometrika 64, 191-199
Divide type 1 error evenly across number of analyses. Good opportunity for early stopping.
• O’Brien-Fleming (1979) Biometrics 35, 549-556
Use up very little error at early looks and much more error at later looks.
• Fleming-Harrington-O’Brien (1984) Controlled Clinical Trials 5, 348-361
Similar to OF above, but less conservative.
Jones & Lewis, “Data and Safety Monitoring” in Biostatistics in Clinical Trials (ed. Redmond & Colton).

5/8/2002 Clinical Trials in 20 Hours
Nominal Pvalues for Three Most Commonly Used Boundaries
Look
No
min
al P
valu
e
0.0
0.0
10
.03
0.0
5
1 2
2 Looks
o pococko ob+fleo fle+har+ob
Look
No
min
al P
valu
e
0.0
0.0
10
.03
0.0
5
1 2 3
3 Looks
Look
No
min
al P
valu
e
0.0
0.0
10
.03
0.0
5
1 2 3 4
4 Looks
Look
No
min
al P
valu
e
0.0
0.0
10
.03
0.0
5
1 2 3 4 5
5 Looks
NOTE: type 1 error at kth test is NOT the same as the nominal pvalue for the kth test

5/8/2002 Clinical Trials in 20 Hours
Problems with These Stopping Boundaries
• Pocock: Can result in awkward situation when at the final look of the study, nominal pvalue is less than 0.05 but is not sufficiently small to achieve significance based on design. Requires largest sample size to achieve specified power.
• O’Brien-Fleming: May be desirable in its conservatism for keeping trials going. Some see very small boundaries at first test too extreme.
• Fleming-Harrington-O’Brien: Middle ground between other two, but more similar to OF. Nice characteristic that type I error is held constant for each interim test.
• Generally: Two assumptions– number of interim tests which will be conducted is specified in
advance
– equal number of individuals enrolled between interim analyses (not realistic, as many DSMC reviews are based on calendar time and not accrual).

5/8/2002 Clinical Trials in 20 Hours
Group Sequential Designs: (2) Alpha Spending Function
Stopping boundaries as continuous function of accrual
Do not need to have equal spacing as assumed by previously discussed.
Do not need to specify when or how many will occur
Percent Accrued
Cum
ulat
ive
Type
I E
rror
Rat
e
0 L1 L2 100
0
a1
a2
0.05
Lan & DeMets (1983) Biometrika 70, 659-663

5/8/2002 Clinical Trials in 20 Hours
Two Stage Designs:Simon Two-Stage for Safety/Efficacy Trials
• Different in approach, but related
• A priori, decide sample size for Stage 1 and sample size for Stage 2.
• If reasonable evidence of efficacy is seen by end of Stage 1, then continue to stage 2.
• Minimizes overall sample size.
• Can terminate at end of stage 1 either because
– treatment very efficacious
– treatment not at all efficacious
• Usually, termination is due to lack of efficacy
5/8/2002 Clinical Trials in 20 Hours
Example of Two Stage Design
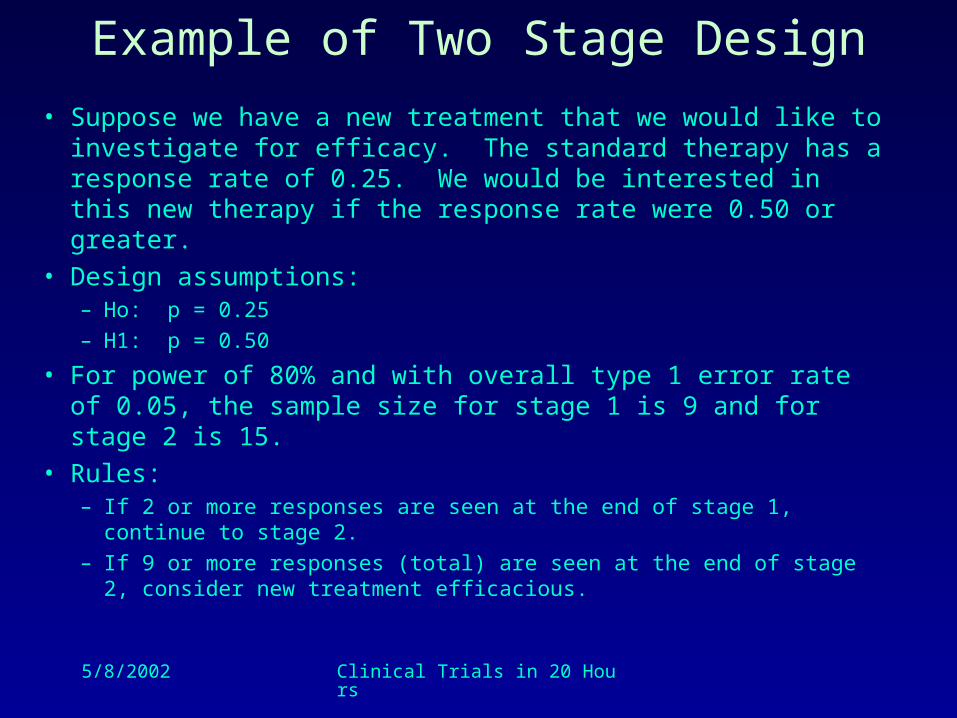
• Suppose we have a new treatment that we would like to investigate for efficacy. The standard therapy has a response rate of 0.25. We would be interested in this new therapy if the response rate were 0.50 or greater.
• Design assumptions:– Ho: p = 0.25
– H1: p = 0.50
• For power of 80% and with overall type 1 error rate of 0.05, the sample size for stage 1 is 9 and for stage 2 is 15.
• Rules:– If 2 or more responses are seen at the end of stage 1, continue to stage 2.
– If 9 or more responses (total) are seen at the end of stage 2, consider new treatment efficacious.
5/8/2002 Clinical Trials in 20 Hours
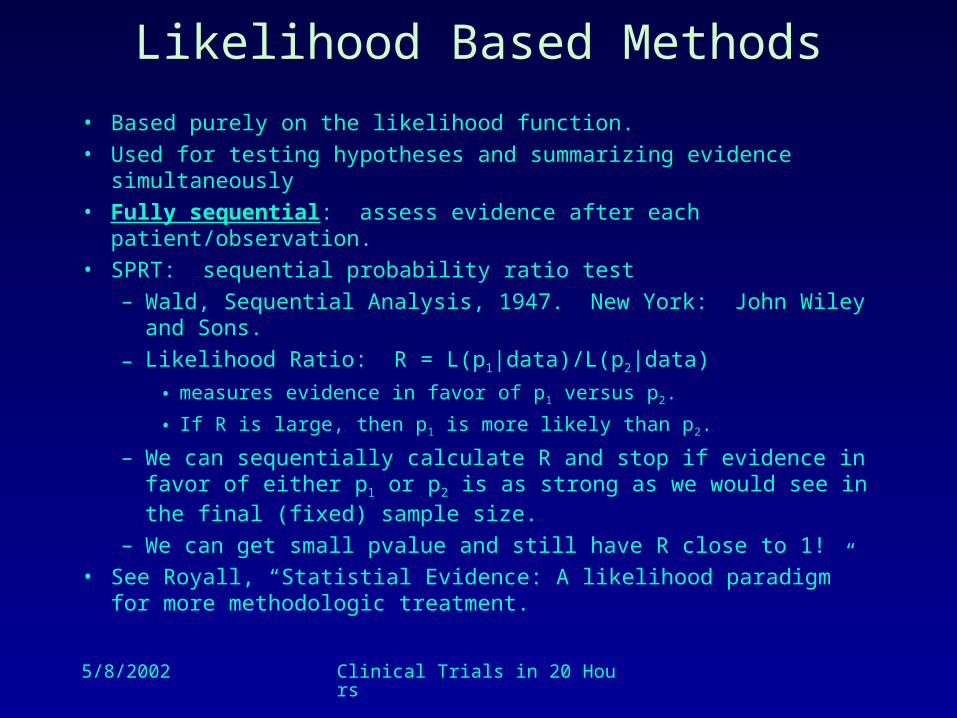
Likelihood Based Methods
• Based purely on the likelihood function.• Used for testing hypotheses and summarizing evidence simultaneously• Fully sequential: assess evidence after each patient/observation.• SPRT: sequential probability ratio test
– Wald, Sequential Analysis, 1947. New York: John Wiley and Sons.
– Likelihood Ratio: R = L(p1|data)/L(p2|data)
• measures evidence in favor of p1 versus p2.
• If R is large, then p1 is more likely than p2.
– We can sequentially calculate R and stop if evidence in favor of either p1 or p2 is as strong as we would see in the final (fixed) sample size.
– We can get small pvalue and still have R close to 1!• See Royall, “Statistial Evidence: A likelihood paradigm” for more
methodologic treatment.
5/8/2002 Clinical Trials in 20 Hours
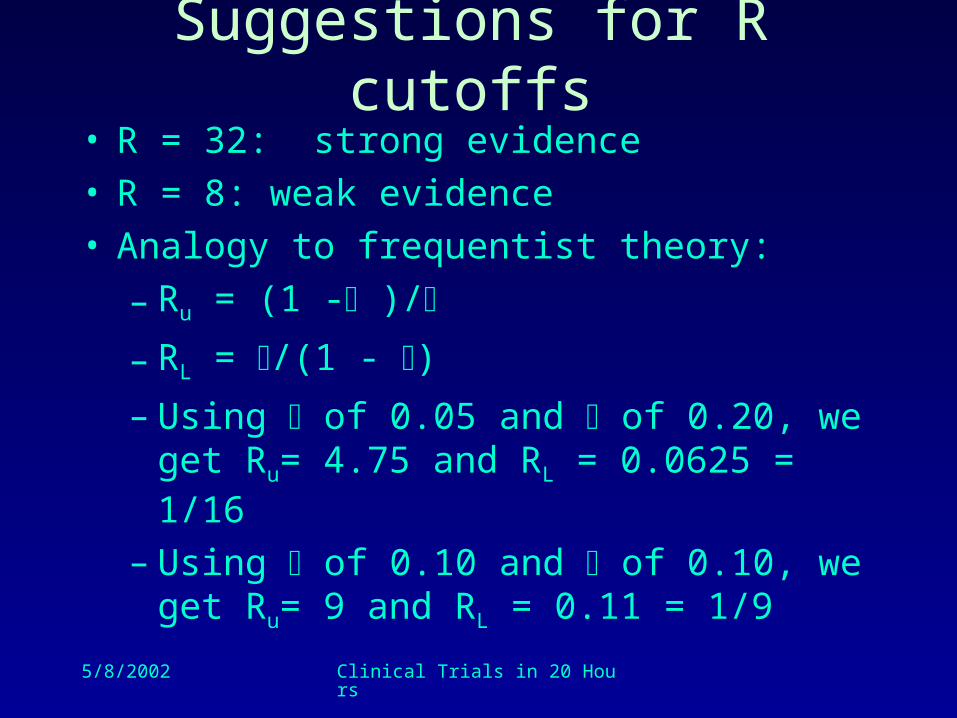
Suggestions for R cutoffs• R = 32: strong evidence• R = 8: weak evidence• Analogy to frequentist theory:
– Ru = (1 - )/
– RL = /(1 - )
– Using of 0.05 and of 0.20, we get Ru= 4.75 and RL = 0.0625 = 1/16
– Using of 0.10 and of 0.10, we get Ru= 9 and RL = 0.11 = 1/9

5/8/2002 Clinical Trials in 20 Hours
Back to Simulated Example
Number of Patients
R =
Lik
elih
oo
d R
atio
50 100 150 200
05
10
15
20
25
30
Number of Patients
pva
lue
0 50 100 150 200
0.2
0.4
0.6
0.8
1.0
• H 1

5/8/2002 Clinical Trials in 20 Hours
Bayesian Methods
• Well suited for interim analyses
• By nature, Bayesians ‘prior’ knowledge to make current decisions and designs
• They allow different scenarios and “weight” of evidence.
• S. Piantadosi (1997) “Data Dependent Stopping”, in Clinical Trials: A Methodologic Perspective. Chapter10. New York: John Wiley and Sons.