early years update. june 2015. simon francis – services for young children
TRANSCRIPT

Early Years update.June 2015.
Simon Francis – Services for Young Children

Comparative data analysis of EYFS data between Hampshire and England
2013 and 2014
% achieving GLD (C)
2013 2014 Difference
England 52% 60% +8%
Hampshire 59% 67% +8%
Difference +7% +7%
% gap between the lowest 20% of children and the mean (C)
2013 2014 Difference
England 36.6% 33.9% -2.7%
Hampshire 28.9% 25.8% -3.1%
Difference -7.7% -8.1%
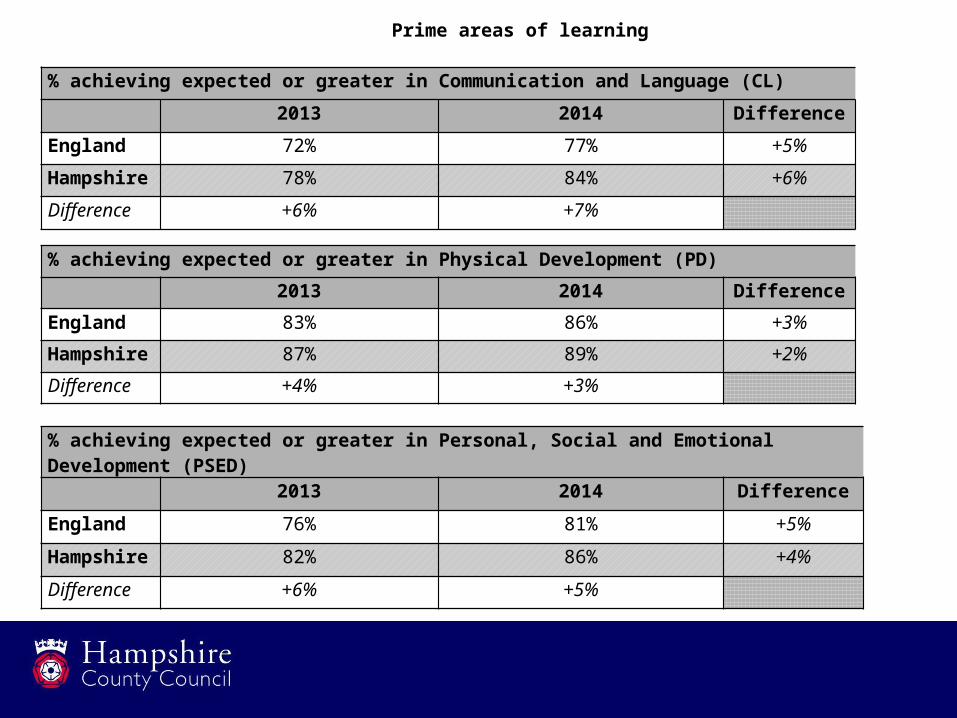
% achieving expected or greater in Personal, Social and Emotional Development (PSED)
2013 2014 Difference
England 76% 81% +5%
Hampshire 82% 86% +4%
Difference +6% +5%
% achieving expected or greater in Physical Development (PD)
2013 2014 Difference
England 83% 86% +3%
Hampshire 87% 89% +2%
Difference +4% +3%
% achieving expected or greater in Communication and Language (CL)
2013 2014 Difference
England 72% 77% +5%
Hampshire 78% 84% +6%
Difference +6% +7%
Prime areas of learning
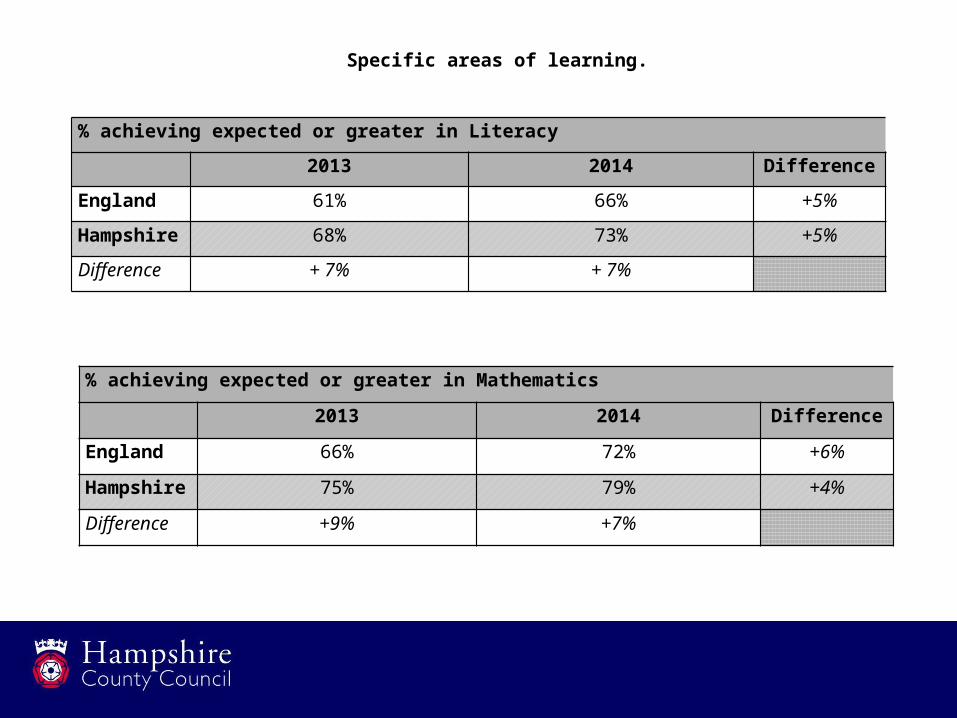
% achieving expected or greater in Literacy
2013 2014 Difference
England 61% 66% +5%
Hampshire 68% 73% +5%
Difference + 7% + 7%
% achieving expected or greater in Mathematics
2013 2014 Difference
England 66% 72% +6%
Hampshire 75% 79% +4%
Difference +9% +7%
Specific areas of learning.

% of children, by gender, achieving a GLD
2013 2014
Boys Girls Difference Boys Girls Difference
England 44% 60% +16% 52% 69% +17%
Hampshire 51% 67% +16% 58% 76% +18%
Difference +7% +7% +6% +7%
% of children, by FSM6, achieving a GLD
2013 2014 Difference
England 36% 45% +9%
Hampshire 38% 47% + 9%
Difference +2% +2%
% of children, by EAL, achieving a GLD
2013 2014 Difference
England 44% 53% +9%
Hampshire 53% 59% +6%
Difference +9% +6%
Groups
These results place Hampshire in the top 15 Local Authorities in the country.
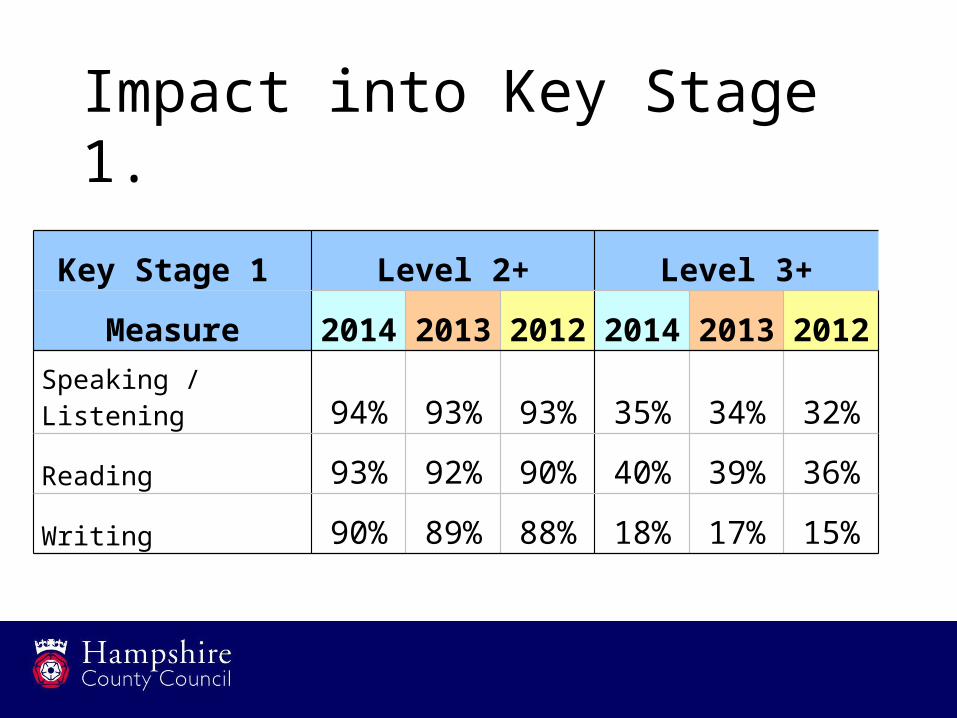
Impact into Key Stage 1.
Key Stage 1 Level 2+ Level 3+
Measure 2014 2013 2012 2014 2013 2012
Speaking / Listening 94% 93% 93% 35% 34% 32%
Reading 93% 92% 90% 40% 39% 36%
Writing 90% 89% 88% 18% 17% 15%
Baseline.
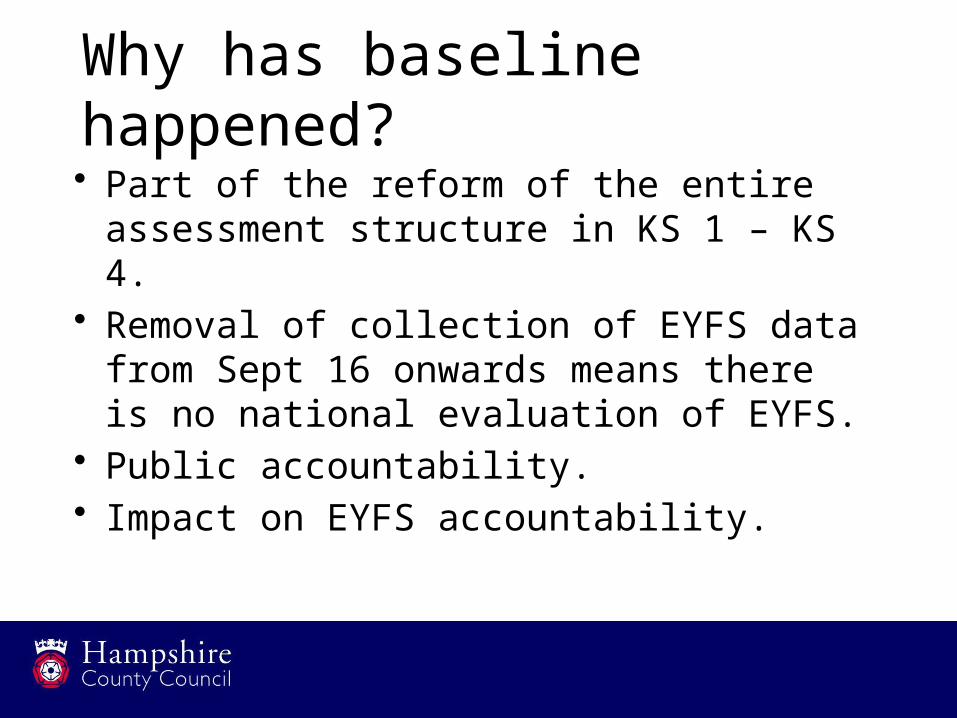
Why has baseline happened?• Part of the reform of the entire
assessment structure in KS 1 – KS 4.• Removal of collection of EYFS data
from Sept 16 onwards means there is no national evaluation of EYFS.
• Public accountability. • Impact on EYFS accountability.

What is baseline?
• An assessment of a child’s starting point made during the first six weeks of the child starting school.
• This assessment will ‘produce’ a score that will be then used as the starting point to judge progress when those children reach the end of KS 2.

Baseline assessmentGuidance published 4 February 2015
To measure primary schools’ progress• Can use from September 2015 so 2022 progress
can be measured from reception to KS2 or KS1 to KS2, whichever is most favourable.
• From September 2016 progress will only be able to be measured from reception baseline to KS2 (for 2023 onwards).
• If you choose not to use a reception baseline then from 2023 you will be held to account by KS2 attainment only.
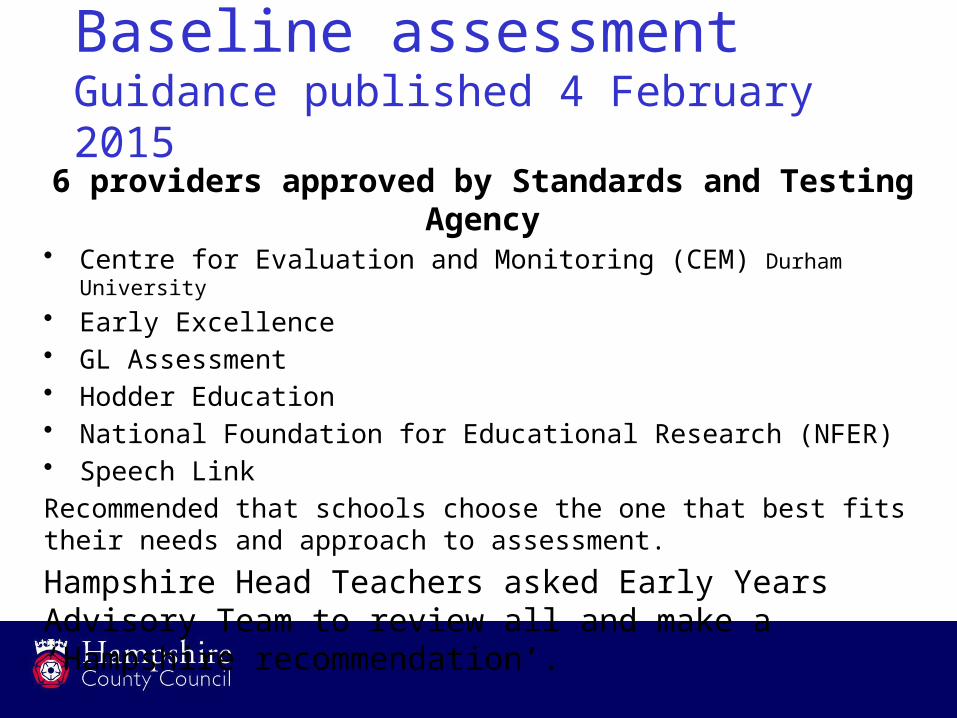
6 providers approved by Standards and Testing Agency• Centre for Evaluation and Monitoring (CEM) Durham University
• Early Excellence• GL Assessment• Hodder Education• National Foundation for Educational Research (NFER)• Speech Link
Recommended that schools choose the one that best fits their needs and approach to assessment.
Hampshire Head Teachers asked Early Years Advisory Team to review all and make a ‘Hampshire recommendation’.
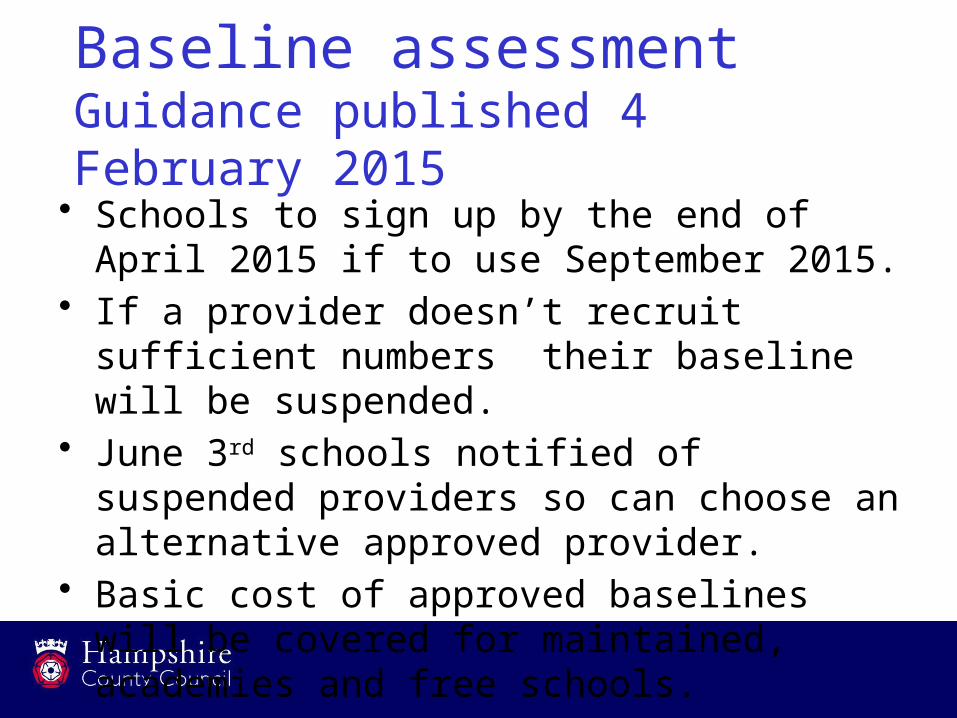
Baseline assessmentGuidance published 4 February 2015
Baseline assessmentGuidance published 4 February 2015
• Schools to sign up by the end of April 2015 if to use September 2015.
• If a provider doesn’t recruit sufficient numbers their baseline will be suspended.
• June 3rd schools notified of suspended providers so can choose an alternative approved provider.
• Basic cost of approved baselines will be covered for maintained, academies and free schools.

The Hampshire recommended model.

How did we reach our recommendation• 15 x Headteachers/Yr R
practitioners• Reviewed all 6 baseline models• Clear criteria used to assess• External evaluations of each also
reviewed• Each model scored against
criteria.• Decision reached.

Why did we recommend Early Excellence Baseline (EExBA)?• It is based upon good Early Years
assessment practice.• It is supported by observations and
information from parents and other practitioners.
• No time away from the children.• It takes account of all areas of learning.• The other five models were all ‘tests’.

How are judgements recorded?
• 47 statements – Yes/No– 9 x Characteristics of Effective
Learning – 4 x Physical Development– 6 x Personal, Social and Emotional
Development– 12 x Communication and Language– 8 x Literacy– 8 x Maths
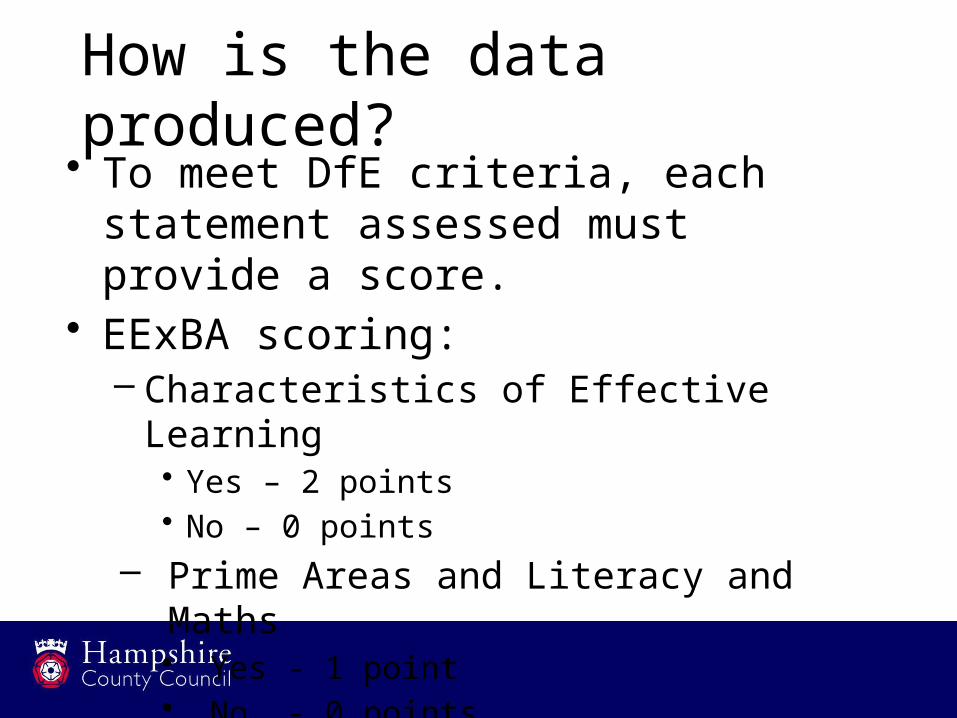
How is the data produced?• To meet DfE criteria, each
statement assessed must provide a score.
• EExBA scoring:– Characteristics of Effective Learning
• Yes – 2 points• No – 0 points
– Prime Areas and Literacy and Maths• Yes - 1 point• No - 0 points

Recording judgements

How does EExBA help demonstrate progress?

Questions.
Thank you.