earmarking and the political support of fat taxesftp.iza.org/dp9335.pdf · earmarking and the...
TRANSCRIPT
Forschungsinstitut zur Zukunft der ArbeitInstitute for the Study of Labor
DI
SC
US
SI
ON
P
AP
ER
S
ER
IE
S
Earmarking and the Political Support of Fat Taxes
IZA DP No. 9335
September 2015
Helmuth CremerCatarina GoulãoKerstin Roeder
Earmarking and the Political Support of Fat Taxes
Helmuth Cremer Toulouse School of Economics (GREMAQ, IDEI, IUF)
and IZA
Catarina Goulão
Toulouse School of Economics (GREMAQ, INRA)
Kerstin Roeder University of Augsburg
Discussion Paper No. 9335 September 2015
IZA
P.O. Box 7240 53072 Bonn
Germany
Phone: +49-228-3894-0 Fax: +49-228-3894-180
E-mail: [email protected]
Any opinions expressed here are those of the author(s) and not those of IZA. Research published in this series may include views on policy, but the institute itself takes no institutional policy positions. The IZA research network is committed to the IZA Guiding Principles of Research Integrity. The Institute for the Study of Labor (IZA) in Bonn is a local and virtual international research center and a place of communication between science, politics and business. IZA is an independent nonprofit organization supported by Deutsche Post Foundation. The center is associated with the University of Bonn and offers a stimulating research environment through its international network, workshops and conferences, data service, project support, research visits and doctoral program. IZA engages in (i) original and internationally competitive research in all fields of labor economics, (ii) development of policy concepts, and (iii) dissemination of research results and concepts to the interested public. IZA Discussion Papers often represent preliminary work and are circulated to encourage discussion. Citation of such a paper should account for its provisional character. A revised version may be available directly from the author.
IZA Discussion Paper No. 9335 September 2015
ABSTRACT
Earmarking and the Political Support of Fat Taxes* A fat and a healthy good provide immediate gratification, and cause health costs or benefits in the long run, which are misperceived. Additionally, the fat good (healthy good) increases (decreases) health care costs by increasing (decreasing) the probability of suffering from a chronic disease in the future. Individuals differ in income and in their degree of misperceptions concerning the health effects of the consumption of fat and of healthy goods. The level of the fat tax is determined through majority voting. Individuals vote according to their misperceived utility function. Consequently, excessive fat consumption is not due to a self-control problem but due to information deficiencies or cognitive inability to process information. A fraction of the fat tax proceeds is “earmarked” to reduce health insurance premiums while the remaining fraction finances a subsidy on the healthy good. This earmarking rule is determined at a constitutional stage to maximize utilitarian or Rawlsian welfare, anticipating the induced political equilibrium. We show that the fat tax in the political equilibrium is always lower than the utilitarian fat tax. This is no longer necessarily true with a Rawlsian objective. The determination of the optimal earmarking rule is quite complex. Even in the utilitarian case, it is not just used to boost political support for the fat tax. Instead, it may involve a tradeoff between the fat tax and the healthy good subsidy. JEL Classification: I12, I18, D72 Keywords: obesity, fat tax, misperception, voting, earmarking Corresponding author: Helmuth Cremer Toulouse School of Economics 21 Allée de Brienne 31015 Toulouse France E-mail: [email protected]
* We thank Pierre Pestieau and all participants of the EHEW in Toulouse for their helpful comments and suggestions. Financial support from the Chaire “Marché des risques et creation de valeur” of the FdR/SCOR is gratefully acknowledged.
1 Introduction
Worldwide obesity has more than doubled since the 1980s. In 2014, 33% of the US
and 23% of the European populations were obese. More than 70% of the US and UK
population are overweight, and worldwide there are examples of similar patterns even
among developing countries such as Argentina and Chile, or middle eastern countries
such as Kuwait, Qatar, and Saudi Arabia.1 Because of such high prevalence rates,
obesity is considered an epidemic despite being non-infectious.
The statistics on the prevalence of obesity are worrying because, along with tobacco
consumption, overweight and obesity are risk factors of non-communicable chronic dis-
eases (NCDs), which are presently the leading cause of deaths worldwide. Examples of
NCDs are heart disease, stroke, diabetes, musculoskeletal disorders like osteoarthritis,
and some sorts of cancer. According to the WHO, NCDs account for over 60% of the
total deaths in the world, and half of these deaths occurred in low- and middle-income
countries before age 70.2
In addition to being a main factor in premature mortality, NCDs are also responsible
for extended periods of morbidity and dependency. These impediments may dramatic-
ally reduce individuals’ quality of life. Additionally, they lead to a significant increase in
present health care costs worldwide even if an individual’s full lifetime is accounted for.
For example, Cawley and Meyerhoefer (2012) estimate obesity medical costs of 2,741
USD, which translates in 20% of the US health expenditure. Finkelstein et al. (2008)
find that the severely obese white women have the highest full lifetime health care cost
of 29,460 USD.3
There are many factors put forward as reasons for the obesity spread (Cutler et al.,
2003), but in the end it typically boils down to unbalanced caloric intakes compared
to energy needs. Consequently, a policy intervention aiming at eradicating, or at least
slowing down the epidemics has to affect diet and physical activity choices. Of course
obesity also has a genetic component. However, genetics cannot explain the dramatic
increase in obesity rates over the last three decades (Hill and Peters, 1998).
In this paper we analyze the political support of a “fat tax”, imposed on fattening
1Overweight and obesity prevalence rates statistics available from the World Health Organization
(WHO), : 2461? = accessed on June 26, 2015.2http://www.who.int/mediacentre/factsheets/fs355/en/, accessed on June 26, 2015.3See as well Finkelstein et al., 2003; Finkelstein et al., 2011; Finkelstein and Yang, 2011; Thorpe et
al., 2004; Wang et al., 2008; and Wang et al., 2011; among others.
1
food and beverages, combined with a subsidy on healthy goods. These are amongst
the policy instruments with the potential to slow down the obesity epidemics. We also
examine how the government can affect this political support by “earmarking” the tax
revenue.
In reality fat taxes exist, but remain relatively rare and their level is not very sig-
nificant. A fat tax was first introduced in Denmark in October 2011, yet withdrawn
one year later. Currently, fat taxes are being discussed in several countries such as the
UK or France.4 In 2009, 33 states in the USA taxed soft drinks, and more recently
France, Norway and Mexico have imposed similar taxes (Brownell et al., 2009). The re-
lative scarcity of fat taxes in practice suggests that such a policy may not be sufficiently
attractive from a political perspective.
Intuitively, one can expect the following factors to affect the political support of fat
taxes. First, they are likely to be regressive. Low-income individuals consume more
fattening food and beverages, in particular, because they often misperceive the effects
of diet and physical activity in the short and the long run (see Vereecken and Maes,
2010; and Bauman et al., 2012; among others).5 Consequently, the median income
individual bears a larger than average burden of the tax; this may lead to a lower than
optimal level of the fat tax in a voting equilibrium. Second, irrespective of distributional
considerations, misperception in itself may imply that individuals underestimate the
benefits of the tax which undermines its political support. Third, in countries with
SHI (Social Health Insurance) or NHS (National Health System), individuals may not
properly account for the social health care costs caused by their unhealthy lifestyle.
In this paper we study the political determination of fat taxes in a simple setting. We
show that the equilibrium is typically not optimal, neither from a utilitarian nor from a
Rawlsian perspective. More precisely, the equilibrium level of the fat tax is always lower
than the utilitarian optimum, but it may be lower or higher than the Rawlsian solution.
However, this is just a prelude to the main question we ask, namely if and how the
government can affect the political support for fat taxes through “an accompanying”
policy of earmarking to bring the voting solution closer to the optimum.
4See “UK could introduce a fat tax, says David Cameron", theguardian.com, Tuesday 4 October 2011
13.50 BST, : 201104−−−−,
accessed on June 26, 2014 and IGF (2008); Bonnet et al. (2009); and Allais et al. (2010).5However the regressive nature of a fat tax may be compensated by the health benefits it induces
through the improvement of diet.
2
We consider an economy wherein agents differ in their income and in their degree of
misperceptions concerning the health effects of fat and of healthy goods. Consumption
of the fat good gives rise to immediate satisfaction but also causes adverse health effects,
which are misperceived. In turn, the consumption of the healthy good has beneficial
health effects, which are misperceived as well.6
The fat good consumption increases the probability of suffering from NCDs in the
future. We assume that all sick individuals are treated within a national health system,
which is financed by a uniform capitation fee. Therefore, individuals’ fat consumption
imposes higher taxes on all due to the need to balance the budget of the national health
system. In such a setup, we investigate the role of a fat tax aiming to correct: (i)
individuals’ misperceptions concerning health effects, and (ii) the negative effect of an
increase in the health care costs. Since a fat tax constitutes a new source of financing
the capitation fee can be cut down. Additionally, the capitation fee can be reduced
further because health care expenses decrease with a decrease in fat consumption.
We consider the possibility that the fat tax proceeds are used either to contribute to
the financing of the health care system or to subsidize the consumption of some healthy
good or activity (see Cremer et al., 2010; and Goulão and Pérez-Barahona, 2014). In
other words, the proceeds of the fat tax are earmarked so that some fraction is used
to finance health care while the remaining part finances a subsidy on the healthy good
consumption (for the later see Yaniv et al., 2009).7 This earmarking rule is determined
by a welfare maximizing (utilitarian or Rawlsian) government at a constitutional stage
which precedes the vote over the fat tax. It is by now well known that earmarking is at
best useless in a purely normative setting. However, it has interesting effects when all
or part of the policy instruments are determined by a political process. In particular,
we show how earmarking of the fat tax revenues can be used to boost the political
support of a more welfare enhancing fat tax. The voting equilibrium tax rate increases
as the fraction of tax revenues devoted to the financing of health insurance increases.
6There seems to exist a consensus that the population is generally poorly informed about the attrib-
utes of a healthy diet (Vereecken and Maes, 2010; Grimes et al., 2009; and Schwartz et Byrd-Bredbenner,
2005) and there is evidence that greater nutritional knowledge is related to better nutrition (Pollard et
al., 2010; and Vereecken and Maes, 2010).7This is pretty much in line with the allocation of fat tax suggested by Leicester and Windmeijer
(2004, page 10) who argue that “ Funds from a ‘fat tax’ could be used to finance healthy eating advice
in schools or on television, for the NHS, etc. Alternatively, the income could be used to reduce other
taxes or provide subsidies on healthy foods or exercise equipment.”
3
Consequently, one might expect that a utilitarian government would choose to devote
a larger share of tax revenue to health expenses than otherwise optimal. We show that
this is not necessarily true because an increase in this share tends to decrease the subsidy
on the healthy good (which is also too low at the utilitarian solution). Similar effects
are at work in the Rawlsian case with the added complexity that the voting equilibrium
tax level may then actually exceed the optimal level.
Our paper contributes to a growing literature on sin taxes. O’Donoghue and Rabin
(2003; 2006) study precisely the relevance of sin taxes in view of correcting individuals
misperceptions. They conclude that they may even be Pareto improving since they help
people with self-control problems without imposing losses to fully rational people.
Some political economy aspects of sin taxes have been studied by Haavio and Ko-
takorpi (2011). They show how voting over a sin tax can work as a commitment device
for individuals with self-control problems. Our approach departs from theirs in two
main directions. First, we consider that individuals vote according to their misper-
ceived utility function. In other words, we assume that excessive fat consumption is not
due to a self-control problem. Instead, an individual’s misperception of health effects is
due to information deficiencies or cognitive inability to process information. Moreover,
we suppose that higher income individuals have lower misperception levels. Second, we
consider the impact of fat consumption on the costs of the health care system. This
feature together with the possibility of earmarking the funds of the fat tax to subsidize
a healthy activity make the political problem more complex but generates interesting
equilibria.
The remainder of the paper is organized as follows. Section 2 describes our economic
environment. Then, from a normative perspective, the optimal fat tax and budgetary
rule are analyzed in Section 3. The political fat tax is determined in Section 4. The
constitutional stage is analyzed in Section 5 and Section 6 provides some concluding
remarks.
2 The economic environment
The economy consists of individuals who differ in income which is distributed on the
support [ ] ∈ R+ according to the cumulative distribution function (). Popula-
tion size is normalized at one. Individual’s utility depends on the consumption of an
4

unhealthy, high fat or sugar good , (e.g., potato chips or sodas), a healthy good
(e.g., vegetables), and a numeraire good (e.g., leisure). To simplify the exposition we
will often refer to the unhealthy commodity as “fat good”, but our analysis applies just
as well to high sugar products. All producers’ prices are normalized at one. Fat goods
are taxed at a rate ≥ 0 and healthy goods are subsidized at a rate ≥ 0.The satisfaction (and health benefits) individuals obtain from the fat good is reflected
by () with 0() 0 and 00() 0. In the long run, however, higher consumption
of fat causes overweigh or obesity and comes with health problems. These negative
effects of fat good consumption are captured by the harm function () with 0() 0
and 00() 0. In the short run, individuals may ignore part of these negative long-run
effects. Their perceived harm function is given by () where ∈ [0 1]. We assumethat ≡ () decreases with income, i.e.,
0() 0. The empirical support for this
correlation is broad; see, e.g., Devaux et al., (2011), and McLaren (2011) for evidence
on the negative association of socio-economic status/education and obesity/nutritional
knowledge.
The healthy good provides a utility of () with 0() 0 and 00() 0. In
line with the empirical evidence these benefits are also misperceived by some agents
implying (), where ∈ [0 1]. Once again the degree of misperception depends onincome, ≡ (), and is higher the lower individuals’ income: 0() 0. Finally,
utility is linear in the numeraire good.
Consumption of fat and healthy goods determines the probability that an individual
will develop a chronic disease, ( ). This probability is increasing in the fat good
consumption and decreasing in the healthy good consumption. For simplicity we assume
2 = 0. The government supplies “free” health care to those suffering from
a chronic disease. The health care scheme provides universal and full coverage and is
financed by capitation fees . The cost of treating patients is normalized to one.
In sum, individual ’s perceived utility, b, is given by
b = + () + ()− () (1)
while the individual’s true utility, , amounts to
= + () + ()− () (2)
Since all patients are treated and cured ( ) does not directly appear in individuals’
5

utilities, but it of course affects utility indirectly through the taxes levied to finance
health care expenditure.
2.1 Individual optimization problem
Individuals choose their consumption of the fat and the healthy goods by maximizing
perceived utility specified by equation (1), subject to their budget constraint, i.e.
max
b = + () + ()− ()
s.t. = − − (1 + ) − (1− ) (3)
The first order conditions (FOCs) are given by
b
=− (1− ) +
0() = 0 (4)
b
=− (1 + ) + 0()−
0() = 0 (5)
These equations determine the demand functions ∗ ≡ ( ) and ∗ ≡ ( ).
The comparative statics with respect to the tax and subsidy, and with respect to the
misperception parameters are as follows:
∗
=− 1
00() 0 (6)
∗
=− 0()00()
0 (7)
∗
=1
00()− 00()
0 (8)
∗
=− −0()00()−
00() 0 (9)
Not surprisingly, a higher subsidy on healthy goods and a lower misperception of their
health benefits increase their consumption. Similarly, a higher tax on fat goods and
a lower misperception of their negative health effects decrease an individual’s fat good
consumption. Since low-income individuals suffer from a higher misperception they tend
to consume more fat and less healthy goods than individuals with higher income and
lower misperception.
2.2 Equilibrium
In an equilibrium, public budgets need to be balanced. Health care costs are given byZ
[( ()) ( ())]d () ≡ ( ) (10)
6
They are financed by capitation fees and the revenue raised from the tax on the fat
good. The fat tax revenue is given byZ
( ())d () ≡ ()
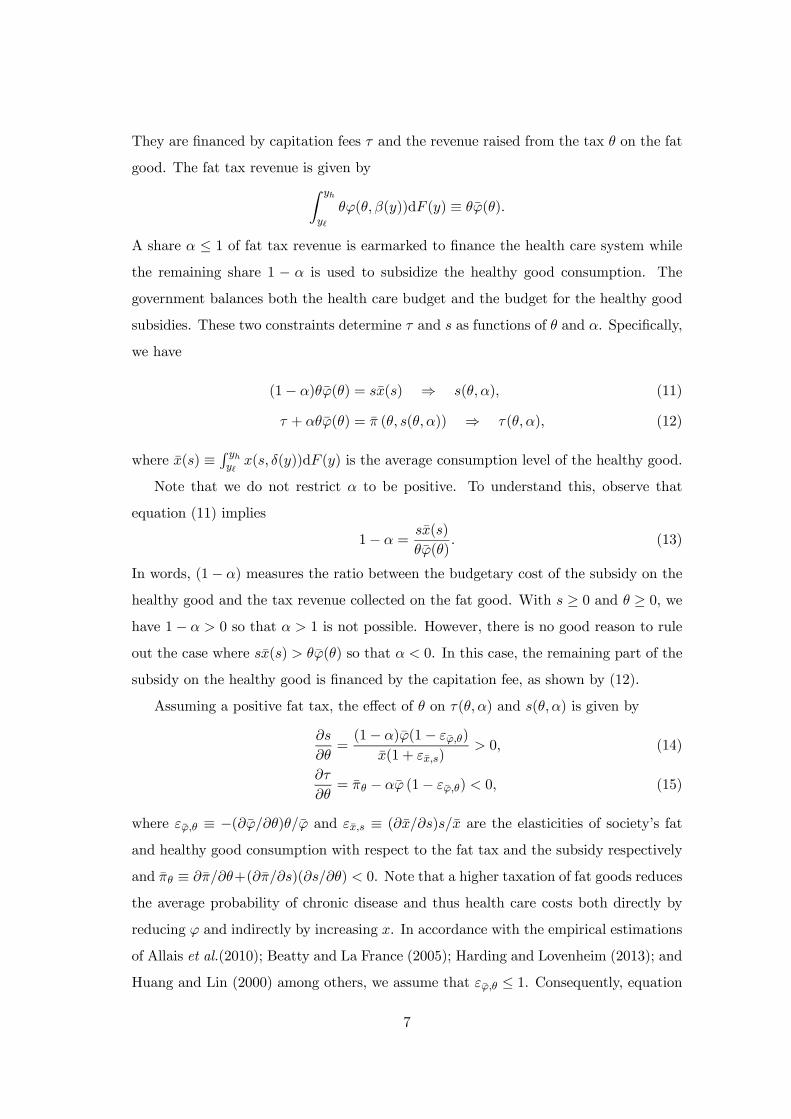
A share ≤ 1 of fat tax revenue is earmarked to finance the health care system while
the remaining share 1 − is used to subsidize the healthy good consumption. The
government balances both the health care budget and the budget for the healthy good
subsidies. These two constraints determine and as functions of and . Specifically,
we have
(1− )() = () ⇒ ( ) (11)
+ () = ( ( )) ⇒ ( ) (12)
where () ≡ R
( ())d () is the average consumption level of the healthy good.
Note that we do not restrict to be positive. To understand this, observe that
equation (11) implies
1− =()
() (13)
In words, (1− ) measures the ratio between the budgetary cost of the subsidy on the
healthy good and the tax revenue collected on the fat good. With ≥ 0 and ≥ 0, wehave 1− 0 so that 1 is not possible. However, there is no good reason to rule
out the case where () () so that 0. In this case, the remaining part of the
subsidy on the healthy good is financed by the capitation fee, as shown by (12).
Assuming a positive fat tax, the effect of on ( ) and ( ) is given by
=(1− )(1− )
(1 + ) 0 (14)
= − (1− ) 0 (15)
where ≡ −() and ≡ () are the elasticities of society’s fatand healthy good consumption with respect to the fat tax and the subsidy respectively
and ≡ +()() 0. Note that a higher taxation of fat goods reduces
the average probability of chronic disease and thus health care costs both directly by
reducing and indirectly by increasing . In accordance with the empirical estimations
of Allais et al.(2010); Beatty and La France (2005); Harding and Lovenheim (2013); and
Huang and Lin (2000) among others, we assume that ≤ 1. Consequently, equation
7

(14) is positive and equation (15) is negative. In words, capitation fees decrease with the
fat tax rate, whereas the subsidy on the healthy good increases with it. The intuition
behind it is straightforward. If a 1% increase in the fat tax leads to a decrease in the
aggregate fat good consumption by less than 1%, a positive revenue from taxation is
generated. This revenue can be used to reduce capitation fees and increase the subsidy
on healthy activities.
The comparative static effects with respect to are given by
=
−(1 + )
0 (16)
= − ≶ 0 (17)
where ≡ ()() 0. The more of fat tax revenue is devoted to the healthcare scheme the lower are the subsidies on healthy goods. However, the impact of on
is ambiguous. The direct effect, measured by the second term in (17), is of course
negative, because a larger share of the fat tax proceeds is devoted to the financing of the
health insurance scheme. But there is also an indirect effect which goes in the opposite
direction. This is because the decrease in subsidies on the healthy good will tend to
increase health care cost.
For future reference, it is useful to express type- agents’ perceived and true utility
level by their indirect utility functions. Substituting ( ) and ( ), as defined by
equations (11) and (12), into the perceived and true utility functions, (1) and (2), yields
b( ) = − ( )− (1 + )()− (1− ( ))(( )) + ((( )))
+ (())− (()) (18)
( ) = − ( )− (1 + )()− (1− ( ))(( )) + ((( )))
+ (())− (()) (19)
Before analyzing the voting on the fat tax, we determine the socially optimal fat tax
and budgetary rule, which provide a benchmark against which the properties of the
political outcome can be assessed.
3 Normative benchmark
Since the public health care system is a prime ingredient of our setup, a “pure” laissez-
faire (LF ) solution is ruled out by definition. The situation which comes closest to a
8
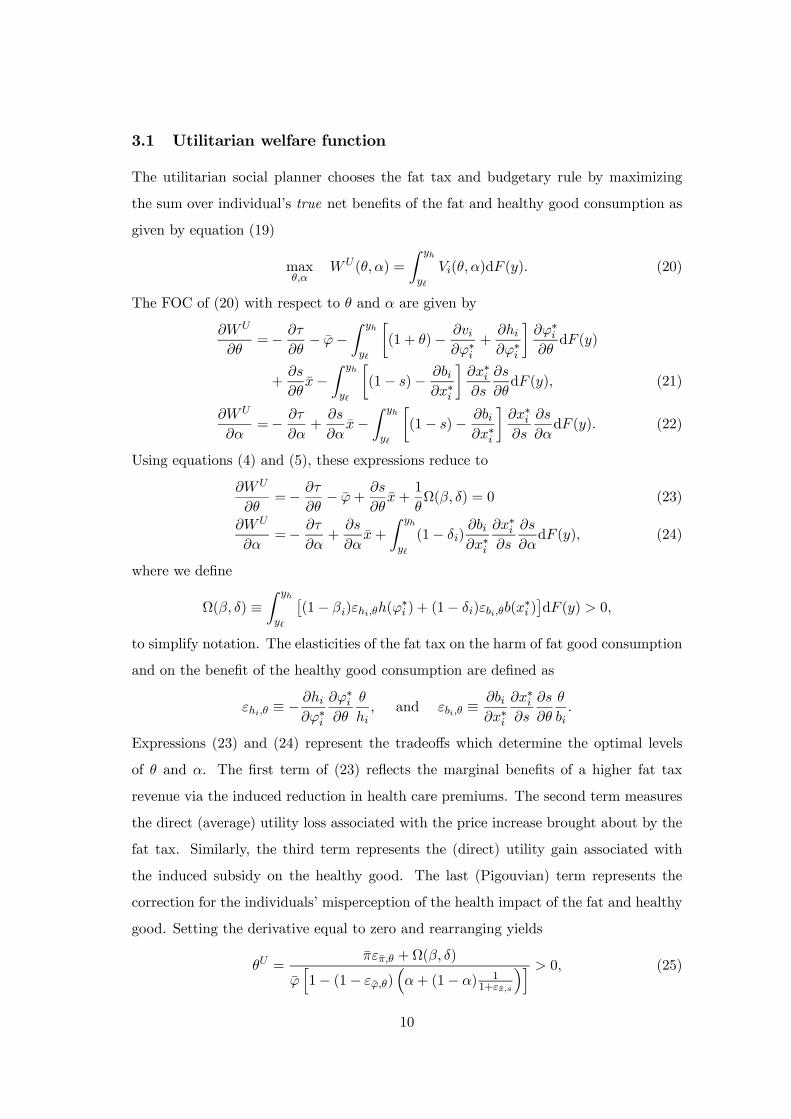
conventional LF corresponds to the case where = 0 which (through the earmarking
rule) also implies = 0. It is plain that this solution is not efficient. To be more precise
there are two sources of inefficiency. The first one is the individuals’ misperception
of the long-term effects of the fat and healthy good consumption. In addition, with a
continuum of individuals health care costs are formally like an “atmosphere externality”.
Any given individual neglects the impact of his fat and healthy consumption on .
Interestingly, this externality occurs even when aggregate health damages are correctly
perceived by individuals. In other words, even when individuals are aware of equation
(10) their consumption decisions will neglect its impact on health care cost.
We also know from standard textbook theory that in a world of perfect information
these inefficiencies could be addressed through a system of individualized Pigouvian
taxes (on ) and subsidies (on ). We assume that such individualized taxes are not
feasible, for instance because of asymmetries of information. Instead, as shown in the
previous section, we restrict the government’s instruments to linear taxes and subsidies
with the same rate applied to all individuals.
Within this context we first examine the utilitarian solution. It is constrained by the
linear instruments ( ), but they are both under the control of the welfare maximizing
government. Note that with quasi-linear preferences, redistributive considerations do
not matter for the utilitarian government. Yet, a common concern with fat taxes is
their regressive nature; see, Allais et al. (2010); Frazão et al. (2007); Leicester and
Windmeijer (2004); and Powell and Chaloupka (2009); among others.8 To address the
redistributive nature of a fat tax we consider as well a Rawlsian government.
These solutions represent an interesting benchmark against which the political out-
come considered in the subsequent sections can be assessed. This is the reason why we
optimize with respect to and , the variable used in our political model, rather than
with respect to and . In a normative setting the change of variable is of no relevance.
Using and as decision variable would effectively be simpler and more intuitive. In
the utilitarian case this amounts to determining a Pigouvian tax and subsidy and the
is then determined purely mechanically from equation (13); see Appendix A.1.
8As noted by Katakorpi (2008), if low-income individuals have more elastic demand than high-income
individuals a fat tax may even be progressive.
9
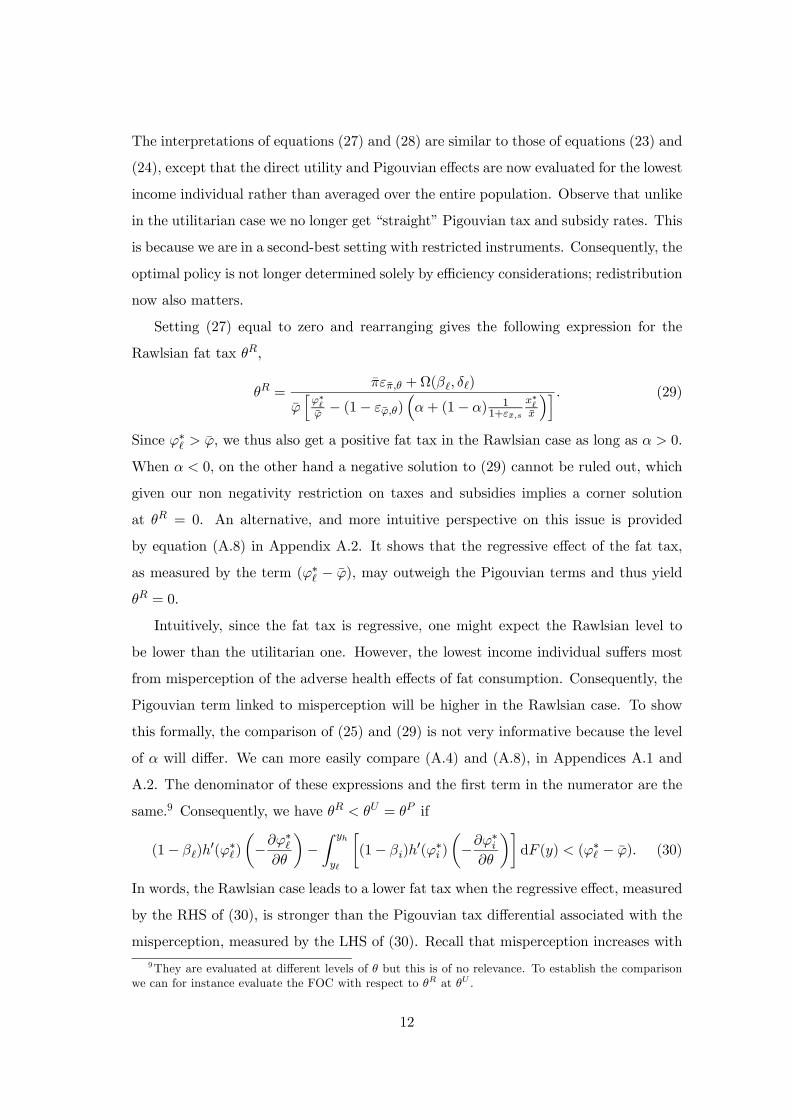
3.1 Utilitarian welfare function
The utilitarian social planner chooses the fat tax and budgetary rule by maximizing
the sum over individual’s true net benefits of the fat and healthy good consumption as
given by equation (19)
max
( ) =
Z
( )d () (20)
The FOC of (20) with respect to and are given by
=−
− −
Z
∙(1 + )−
∗+
∗
¸∗d ()
+
−
Z
∙(1− )−
∗
¸∗
d () (21)
=−
+
−
Z
∙(1− )−
∗
¸∗
d () (22)
Using equations (4) and (5), these expressions reduce to
=−
− +
+
1
Ω( ) = 0 (23)
=−
+
+
Z
(1− )
∗
∗
d () (24)
where we define
Ω( ) ≡Z
£(1− )(
∗ ) + (1− )(
∗ )¤d () 0
to simplify notation. The elasticities of the fat tax on the harm of fat good consumption
and on the benefit of the healthy good consumption are defined as
≡ −
∗
∗
and ≡
∗
∗
Expressions (23) and (24) represent the tradeoffs which determine the optimal levels
of and . The first term of (23) reflects the marginal benefits of a higher fat tax
revenue via the induced reduction in health care premiums. The second term measures
the direct (average) utility loss associated with the price increase brought about by the
fat tax. Similarly, the third term represents the (direct) utility gain associated with
the induced subsidy on the healthy good. The last (Pigouvian) term represents the
correction for the individuals’ misperception of the health impact of the fat and healthy
good. Setting the derivative equal to zero and rearranging yields
= +Ω( )
h1− (1− )
³+ (1− ) 1
1+
´i 0 (25)
10

where ≡ − 0. In words, the utilitarian level of the fat tax is positive. This
is true even when there is no misperception of the health effects so that Ω( ) = 0.
In that case, any given individual still neglects the impact of his fat and healthy good
consumption on and this calls for a corrective tax.
Turning to (24), the first term measures the impact of on health care costs and
thus on the capitation fee. Its sign is ambiguous; see equation (17). The second and
third term are both negative. An increase in lowers which has a negative direct effect
on utility and also lowers the corrective (Pigouvian) effect of . When increases with
it is clear that increasing has only negative effects: it decreases and increases .
If instead decreases with , the solution trades off the negative effect of the decrease
in against the positive effect of a decrease in .
For the rest, equation (24) is not very informative about the sign of . This issue can,
however, be addressed in a simple way by taking a detour via the Pigouvian solution
described in Appendix A.1. Recall that the utilitarian objective yields precisely this
solution so that = and = . It then follows from equation (13) that 0
when ( ) ( ) and negative otherwise. In words, is positive if the proceeds
from the Pigouvian fat tax exceed the budgetary cost of the Pigouvian subsidy on the
healthy good.
3.2 Rawlsian welfare function
A Rawlsian social planner maximizes utility as given by (19) of the worst-off individual
in society, namely the one with the lowest income . The optimization problem then
amounts to
max
( ) = ( ) (26)
Proceeding as in the previous section, we use equations (4) and (5) to simplify the FOCs
of (26) with respect to and . They can be written as
=−
− ∗ +
∗ +
1
Ω( ) (27)
=−
+
∗ + (1− )
∗
∗
(28)
where
Ω( ) ≡ (1− )(∗) + (1− )(
∗) 0
11
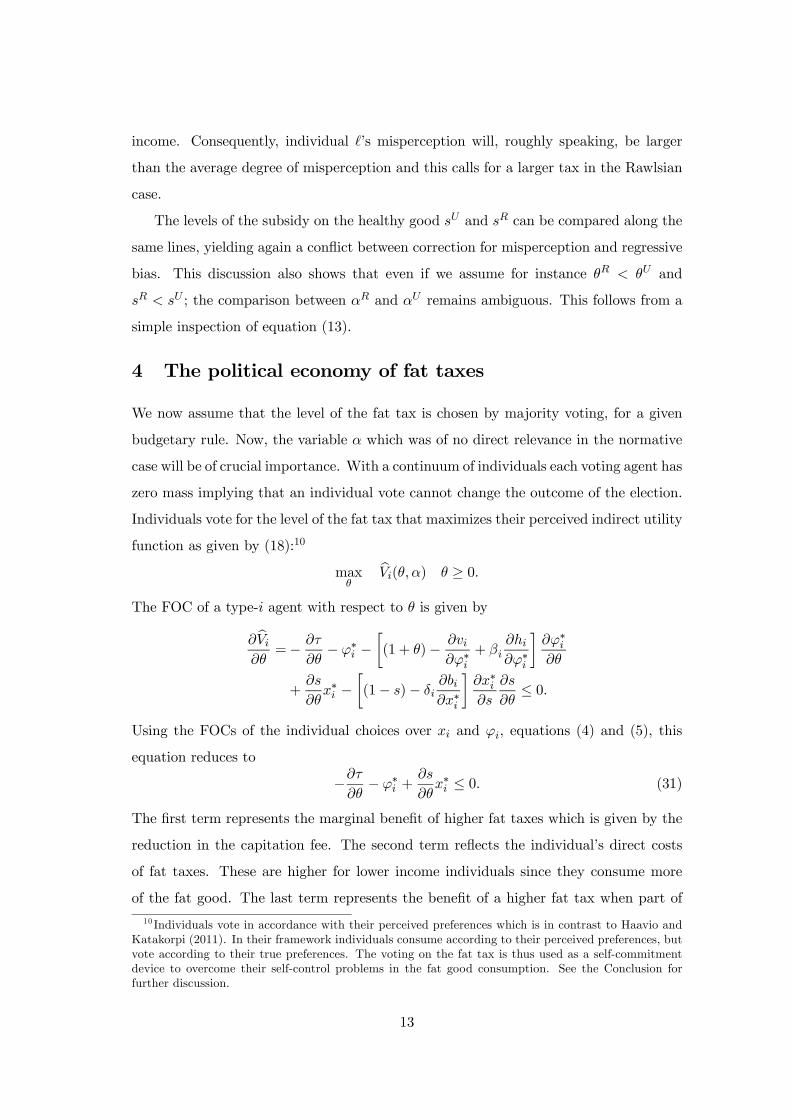
The interpretations of equations (27) and (28) are similar to those of equations (23) and
(24), except that the direct utility and Pigouvian effects are now evaluated for the lowest
income individual rather than averaged over the entire population. Observe that unlike
in the utilitarian case we no longer get “straight” Pigouvian tax and subsidy rates. This
is because we are in a second-best setting with restricted instruments. Consequently, the
optimal policy is not longer determined solely by efficiency considerations; redistribution
now also matters.
Setting (27) equal to zero and rearranging gives the following expression for the
Rawlsian fat tax ,
= +Ω( )
h∗
− (1− )
³+ (1− ) 1
1+
∗
´i (29)
Since ∗ , we thus also get a positive fat tax in the Rawlsian case as long as 0.
When 0, on the other hand a negative solution to (29) cannot be ruled out, which
given our non negativity restriction on taxes and subsidies implies a corner solution
at = 0. An alternative, and more intuitive perspective on this issue is provided
by equation (A.8) in Appendix A.2. It shows that the regressive effect of the fat tax,
as measured by the term (∗ − ), may outweigh the Pigouvian terms and thus yield
= 0.
Intuitively, since the fat tax is regressive, one might expect the Rawlsian level to
be lower than the utilitarian one. However, the lowest income individual suffers most
from misperception of the adverse health effects of fat consumption. Consequently, the
Pigouvian term linked to misperception will be higher in the Rawlsian case. To show
this formally, the comparison of (25) and (29) is not very informative because the level
of will differ. We can more easily compare (A.4) and (A.8), in Appendices A.1 and
A.2. The denominator of these expressions and the first term in the numerator are the
same.9 Consequently, we have = if
(1− )0(∗)
µ−
∗
¶−Z
∙(1− )
0(∗ )µ−
∗
¶¸d () (∗ − ) (30)
In words, the Rawlsian case leads to a lower fat tax when the regressive effect, measured
by the RHS of (30), is stronger than the Pigouvian tax differential associated with the
misperception, measured by the LHS of (30). Recall that misperception increases with
9They are evaluated at different levels of but this is of no relevance. To establish the comparison
we can for instance evaluate the FOC with respect to at .
12
income. Consequently, individual ’s misperception will, roughly speaking, be larger
than the average degree of misperception and this calls for a larger tax in the Rawlsian
case.
The levels of the subsidy on the healthy good and can be compared along the
same lines, yielding again a conflict between correction for misperception and regressive
bias. This discussion also shows that even if we assume for instance and
; the comparison between and remains ambiguous. This follows from a
simple inspection of equation (13).
4 The political economy of fat taxes
We now assume that the level of the fat tax is chosen by majority voting, for a given
budgetary rule. Now, the variable which was of no direct relevance in the normative
case will be of crucial importance. With a continuum of individuals each voting agent has
zero mass implying that an individual vote cannot change the outcome of the election.
Individuals vote for the level of the fat tax that maximizes their perceived indirect utility
function as given by (18):10
max
b( ) ≥ 0
The FOC of a type- agent with respect to is given by
b
=−
− ∗ −
∙(1 + )−
∗+
∗
¸∗
+
∗ −
∙(1− )−
∗
¸∗
≤ 0
Using the FOCs of the individual choices over and , equations (4) and (5), this
equation reduces to
−− ∗ +
∗ ≤ 0 (31)
The first term represents the marginal benefit of higher fat taxes which is given by the
reduction in the capitation fee. The second term reflects the individual’s direct costs
of fat taxes. These are higher for lower income individuals since they consume more
of the fat good. The last term represents the benefit of a higher fat tax when part of
10 Individuals vote in accordance with their perceived preferences which is in contrast to Haavio and
Katakorpi (2011). In their framework individuals consume according to their perceived preferences, but
vote according to their true preferences. The voting on the fat tax is thus used as a self-commitment
device to overcome their self-control problems in the fat good consumption. See the Conclusion for
further discussion.
13

its revenue is employed to subsidize the healthy good consumption. Since low income
individuals consume less of the healthy good they also profit less from its subsidization.
For preferences to be single peaked we assume that the second-order condition is
always non-positive, i.e. ≤ 0.11 To determine the median voter, we need to knowhow the most preferred fat tax rate changes with income. Differentiating (31) we get
= −−
+
0 (32)
That is, the most preferred fat tax rate is increasing in an individual’s income. This is
intuitive: higher income individuals consume less fat goods and are thus affected less
by their taxation. In addition, high income agents profit more if some fat tax revenue
is employed to subsidize healthy good consumption. Since is a monotonic increasing
function of , the median voter is simply the individual with median income, . With
single-peaked preferences, the equilibrium fat tax corresponds to the most preferred
level of the median individual and is implicitly determined by
−− ∗ +
∗ = 0 (33)
where ∗ and ∗ are the fat and healthy good consumption of the median voter.
How does the fat tax in the political equilibrium compare to the socially optimal
level? For a utilitarian objective we have to evaluate the FOC of the social planner,
equation (23) at , i.e.
W
¯=
= (∗ − )| z 0
+(− ∗)
| z 0
+1
Ω( )| z 0
0 (34)
Assuming that the income distribution satisfies the standard property that , we
have ∗ and ∗ if is a concave function while is a convex function of .12
11Specifically, the second order condition is given by
≡ 2
2= −2
2− ∗
+
2
2∗ +
∗
≤ 0 ∀
12To see this observe that the concavity of , the property that decreases with and imply
that
≡
( ()) () ≤ ( ()) ≤ ( ()) ≡ ∗
Similarly, the convexity of and the property that is increasing in implies
≡
( ()) () ≥ ( ()) ( ()) ≡ ∗
14

Under these assumptions, the fat tax in the political equilibrium is always lower than
the social optimal fat tax, . Intuitively, this result can be understood as follows.
First, the median voter suffers more from taxation of fat goods since his consumption
is above average consumption. Additionally, he profits less from the subsidization of
healthy goods since his healthy good consumption is below average. Third, the median
voter does not take into consideration the sum of all (negative) long-run effects of fat
good consumption on society, nor the additional benefits of increased healthy good
consumption when a share of the fat tax revenue is earmarked to subsidize healthy
goods.
Turning to the Rawlsian case, evaluating the FOC for the maximization of welfare,
equation (27), at yields
W
¯=
= (∗ − ∗)| z 0
+(∗ − ∗)
| z 0
+1
Ω( )| z 0
(35)
Since ∗ ∗ , ∗ ∗, and 0, the first two terms on the RHS are negative,
whereas Ω( ) 0. Consequently, the sign of (35) is ambiguous and it is not clear
how the political fat tax compares to the socially optimal level. Unlike in the utilitarian
case, the equilibrium tax rate can be smaller than the social optimal fat tax.
Intuitively, this ambiguity arises for two reasons. First, the worst-off individual
consumes more of the fat good than the median voter and thus also suffers more from
its taxation. Second, the worst-off individual has the lowest healthy good consumption
and profits the least from its subsidization. At the same time, however, the worst-off
individual has the highest misperception with respect to the health effects of the fat and
healthy good consumption. He is thus the one who profits most from the positive health
effects that come along with a lower consumption of fat goods due to their taxation.
And this effect may drag the Rawlsian social optimal fat tax above the political fat tax.
So far, we have studied the voting equilibrium for a given level of . To study
the constitutional stage we need to know how the fat tax relates to the budgetary
rule. Earmarking fat tax revenue to the health care scheme or to the healthy good
consumption may then open up the possibility to draw the political fat tax closer to its
social optimum. The derivative of wrt is
= −−
2
+ 2
∗ +
∗
15
Rearranging yields
=
+ (1− )h∗
1(1+)
− 1 + (1−)[(1+)]
2
∗
i
= + (1− )
h∗
11+
³1 +
1+
´− 1i
(36)
Assume that 0. Roughly speaking this means that healthy consumption (or
physical activity) is more beneficial (at the margin) for individuals who consume more
fat. In other words, a heavy consumption of fat goods makes the compensation by an
otherwise healthy diet more effective. Then, a sufficient condition for (36) to be positive
is that1 + +
(1 + )2
∗
For isoelastic demand, i.e. = , this condition is satisfied and we have
0, a property we shall assume for the remainder of the paper.
5 Earmarking of fat tax revenue
So far, we have studied the voting equilibrium fat tax for a given level of . Together
with the budget constraint this also determines , the subsidy on the healthy good. We
have shown that the voting equilibrium tax is always lower than the utilitarian solution,
but that it may be lower or higher than the Rawlsian level. Furthermore, this tax
increases with . We now turn to the constitutional stage at which the earmarking rule
is determined by a welfare maximizing (utilitarian or Rawlsian) government anticipating
the induced voting equilibrium. We study if and how the earmarking rule can be used to
bring about the “best” possible political equilibrium. Intuitively, one would expect that
a utilitarian government sets a higher than otherwise optimal level of in order to boost
the political support for the fat tax.13 However, we show that the determination of the
earmarking rule is more complex than this first intuition would suggest. Specifically,
the setting of the earmarking rule may involve a conflict between the fat tax and the
healthy good subsidy.
13This intuition is in line with Casamatta et al. (2000) who deal with a problem of pension design. The
generosity is determined by voting, but the degree to which the system redistributes within generations
(the Bismarckian factor) is set at the constitutional stage. They show that it may be desirable to make
the system more Bismarckian (less redistributive) in order to boost political support.
16
5.1 Utilitarian objective
With a utilitarian objective, the constitutional problem consists in maximizing the sum
of all utilities, evaluated at the induced voting equilibrium with respect to . Formally,
the solution of is defined as
= arg max
½ () =
Z
(() )d () s.t. ≤ 1¾
Differentiating () with respect to , we have
d
d=
Z
d () +
Z
d () (37)
Since the political fat tax is too low for all possible ’s and with increasing in one
might expect that the level of set at the constitutional stage would be higher than
. In other words, we devote a higher proportion of tax proceeds to the financing of
health care (the reduction of ) than otherwise optimal. Put differently, a smaller than
optimal share would be devoted to the subsidization of the healthy good. To verify this
conjecture we have to evaluate (37) at . We know from our earlier results that the first
term on the RHS is positive and it represents the intuitive argument we just described.
Boosting will bring the supported by the median voter closer to its optimal level. In
other words, is used to boost political support for the fat tax. However, this intuition
has to be qualified because the second term on the RHS is negative. To see this, observe
that from equation (A.3) in the Appendix it follows thatZ
d () =
Z
∙−− + (1− )
0()¸
d ()
(38)
Now, we know from (16) that 0. The remainder of the RHS of (38) is simply
dWd, where W is utilitarian welfare as defined by (A.1). Now with = and
= we must have from (11) that , which from the second order condition
implies that dWd 0. Putting these elements together shows that the second term
on the RHS of (37) is negative at . Consequently, the entire expression does not
appear to have an unambiguous sign. Intuitively, this is because the increase in also
has a negative effect, namely that it further decreases which is already too low.
To sum up, while the voting equilibrium tax is always too low and while increasing
over and above the utilitarian level does boost political support for the fat tax and
increase its level, it is not necessarily optimal to do so. This is because the optimal policy
17

may involve a tradeoff between the (political equilibrium) fat tax and the healthy good
subsidy. Increasing the share of tax proceed devoted to health insurance may further
decrease the subsidy which is already too low.
5.2 Rawlsian objective
With a Rawlsian objective, the constitutional problem consists in maximizing the utility
of the worst-off individual with respect to . Formally, the solution of is defined as
= argmax
© = (() ) s.t. ≤ 1ª
Differentiating (), we get
d
d=
+
(39)
To study whether it is optimal to set below or above the Rawlsian level obtained in
the normative benchmark, we have to evaluate (39) at . Recall that unlike in the
utilitarian case, the voting equilibrium level () can now be smaller or larger than
. When () , the first term on the RHS of (39) is once again positive. And
an argument which is exactly similar to the one used in the previous subsection (using
equation (A.7) rather than (A.3) in the Appendix) can be used to show that the second
term is negative. Consequently, the sign of the overall expression is ambiguous. On the
other hand, when () , the first term on the RHS of (39) is negative. And using
once again the same argument for the second term it follows that it is now positive. To
sum up, while the respective signs of the two terms may be reversed, they always go in
opposite directions. Intuitively, this is essentially due to a simple accounting argument,
based on expression (11). Given = , when is too low, is also too low (so
that the second term is negative). But when is too large, is also too large and the
second term is positive (because an increase in brings about a decrease in the level of
in the voting equilibrium).
6 Conclusion
This paper has studied the determination of a fat tax and a subsidy on a healthy good
through majority voting. The voting procedure is preceded by a constitutional stage in
which a welfare maximizing (utilitarian or Rawlsian) government sets the earmarking
18

rule, which specifies the share of fat tax proceeds that is used to contribute to the funding
of the health care system, while the remaining revenue is used to finance the subsidy on
the healthy good. Both the long-run costs of fat consumption and the long-run benefits
of the healthy good are misperceived. In addition, individuals choose their consumption
levels without taking into account their impact on health care costs. Voting behavior is
based on the misperceived utility. In other words, the problem is not one of self-control
but one of inadequate information.
We show that the equilibrium fat tax is always lower than at the utilitarian bench-
mark, while it may be lower or higher than the Rawlsian level. Furthermore, the equi-
librium tax increases with , the share of tax proceeds devoted to health insurance.
Roughly speaking this is the case because increasing makes the overall tax policy
less regressive. Indeed, a larger subsidy on the healthy good makes the policy more
regressive.
In the utilitarian case we show that even though the earmarking rule can be used
to boost the political support for the fat tax, it is not necessarily optimal to do so.
This is because there is a conflict between the fat tax and the healthy good subsidy.
The latter is also too low at the voting equilibrium and may be further decreased as
increases. To sum up, the level of set at the constitutional stage may be lower as well
as higher than the utilitarian (full control) benchmark. Similar effects are at work in
the Rawlsian case with the added complexity that the voting equilibrium tax level may
then actually exceed the optimal level.
To sum up, earmarking is an effective tool to influence the voting equilibrium
tax/subsidy policy and bring it closer to the optimum. However, the determination
of the optimal earmarking rule is more complex then on would have expected at first.
It is not simply used to boost political support for the fat tax. Instead, it may involve a
tradeoff between the (political equilibrium) fat tax and the healthy good subsidy. Con-
sequently, the optimal level of may actually be lower than the utilitarian benchmark
in order to ensure an more adequate level of the healthy good subsidy.
We have assumed that individuals vote according to their misperceived preferences.
Haavio and Kotakorpi (2011) investigate a problem of self-control over sin goods and
consequently assume that the median voter votes accordingly to his long-term utility
function. In our setup this translates into assuming that individuals vote based on
19

preferences with = = 1. In this case the median voter chooses the fat tax while
being aware of his own misperception of the utility costs and benefits of fat and healthy
goods.14 In other words he uses the tax policy as a commitment devise to mitigate
his “self-control” problem. Consequently the first of the two externalities described
in Section 3 is accounted for, at least in part.15 The second, health insurance cost,
externality remains however relevant. Overall we can thus expect to be further
away from the utilitarian choice when individuals vote according to their misperceived
utility function. On that account we believe that understanding if individuals are af-
fected by misperception–and vote accordingly to their misperceived preferences–or
by temptation–and vote accordingly to the true effects–has important policy implic-
ations.
14The analogous of (33) would be
−
−
∗(1− )
∗
∗
+
∗ − (1− )
∗
∗
= 0 (40)
It comes out that the third term in (34) would be partially corrected by the median voter’s misperception
terms.15To be more precise the commitment benefit is mitigated by the tax revenue effect which arises
because the median voter does not get a full refund of his tax payments.
20

References
[1] Abegunde, D., Stanciole, A., “An Estimation of the Economic Impact of
Chronic Non-Communicable Disease in Selected Countries,”World Health Or-
ganization Department of Chronic Diseases and Health Promotion (CHP), 2006,
http://www.who.int/chp
[2] Allais, O., Bertail, P. and Nichèle, V., “The Effects of a Fat Tax on French
Households’ Purchases: A Nutritional Approach ”American Journal of Agricultural
Economics, 2010, 92 (1), 228—245.
[3] Beatty,T., and LaFrance, J., “United States Demand for Food and Nutrition
in the Twentieth Century, ”American Journal of Agricultural Economics, 2005, 87
(11), 59—66.
[4] Bauman, A., Reis R., Sallis, J., Wells, J., Loos R. and Martin, B.,
“Correlates of physical activity: why are some people physically active and others
not?,”The Lancet, 2012, 380, 258—271.
[5] Casamatta, G., Cremer, H. and Pestieau, P. “Political Sustainability and
the Design of Social Insurance,” Journal of Public Economics, 2000, 75, 341—364.
[6] Cawley, J., Meyerhoefer, C., “The Medical Care Costs of Obesity: An Instru-
mental Variables Approach,”Journal of Health Economics, 2012, 31, 219—230.
[7] Cremer, H., De Donder, P., Maldonado, D., Pestieau, P., “Taxing Sin
Goods and Subsidizing Health Care,”The Scandinavian Journal of Economics,
2003, 114 (1), 101—123.
[8] Cutler, D.M., Glaeser, E.L., Shapiro, J.M., “Why American Become More
Obese?,”Journal of Economic Perspectives, 2003, 17 (3), 93—118.
[9] Devaux, M., Sassi, F., Church, J., Cecchini, M., Borgonovi, F., “Explor-
ing the Relationship Between Education and Obesity,”OECD Journal: Economic
Studies, 2011, 2011/1, 121—159.
[10] Finkelstein, E.A., Fiebelkorn, I.C., Wang, G., “National Medical Expendit-
ures Attributable to Overweight and Obesity: How Much, and Who is Pay-
ing?,”Health Affairs, 2003, W3, 219—226.
21
[11] Finkelstein, E., Yang, H.K., “Obesity and Medical Costs,The Oxford Handbook
of the Social Science of Obesity,”, Ed. John Cawley, New York: Oxford University
Press, 2011. 496—501.
[12] Finkelstein, E. A., Trogdon, J. G., Brown, D. S., Allaire, B. T., Dellea,
P. S. and Kamal-Bahl, S. J., ”The Lifetime Medical Cost Burden of Overweight
and Obesity: Implications for Obesity Prevention,”Obesity, 2008, 16, 1843—1848.
[13] Finkelstein, E.A., Trogdon, J.G., Cohen, J.W., Dietz, W., “Annual
Medical Spending Attributable to Obesity: Payer and Service-Specific Estim-
ates,”Health Affairs, 2009, w822—w831.
[14] Goulão, C., Pérez-Barahona, A., “Intergenerational Transmission of Non-
Communicable Chronic Diseases", Journal of Public Economic Theory, 2014, 16
(3), 467—490.
[15] Grimes, C., Riddell, L., Nowson, C., “Consumer Knowledge and Attitudes to
Salt Intake and Labelled Salt Information,”Appetite, 2009, 53, 189—194.
[16] Haavio, M., Kotakorpi, K., “The Political Economy of Sin Taxes,”European
Economic Review, 2011, 55 (4), 575—594.
[17] Harding, M., Lovenheim, M., “The Effect of Prices on Nutrition: Comparing
the Impact of Product- and Nutrient-Specific Taxes,”NBER Working Paper No.
19781, January 2014.
[18] Huang, K., and Lin, B., “Estimation of Food Demand and Nutrient Elasticities
from Household Survey Data,”USDA, ERS, 2000, Technical Bulletin No. 1887.
[19] Katakorpi, K., “The Incidence of Sin Taxes,”Economics Letters, 2008, 98, 95—99.
[20] Leicester, A., andWindmeijer, F., (2004) “The ’Fat Tax’: Economic Incentives
to Reduce Obesity, ”IFS Briefing Notes BN49, Institute for Fiscal Studies: London,
UK.
[21] McLaren, Lindsay, “Socioeconomic Status and Obesity,”, Ed. John Cawley, New
York: Oxford University Press, 2011. 276—288.
22
[22] O’Donoghue, T., Rabin, M., “Studying Optimal Paternalism, Illustrated by a
Model of Sin Taxes”American Economic Review: Papers and Proceedings, 2003, 92
(2), 186—191.
[23] O’Donoghue, T., Rabin, M., “Optimal Sin Taxes,”Journal of Public Economics,
2006, 90, 1825—1849.
[24] Pollard, C., Miller, M., Woodman, R., Meng, R., Binns, C., “Changes
in Knowledge, Beliefs, and Behavior Related to Fruit and Vegetable Consumption
Among Western Australian Adults from 1995 to 2004,”American Journal of Public
Health, 2009, 99 (2), 355—361.
[25] Powell, L. M., Chaloupka, F. J., “Food Prices and Obesity: Evidence and
Policy Implications for Taxes and Subsidies,”Milbank Quarterly, 2009, 87 (1), 229—
257.
[26] Schwartz, J., Byrd-Bredbenner, C., “Young Adults’ Knowledge of Standard
Serving Sizes and Their Ability to Estimate Servings in Typical Portions,”Journal
of the American Dietetic Association, 2005, 105 (8), Supplement, 59—59.
Spasojevic 2003
[27] Thorpe, K.E., Curtis, S.F., Howard, D.H., Joski, P.., “Trends: The Impact
of Obesity on Rising Medical Spending,”Health Affairs, 2004, W4, 480—486.
[28] Vereecken, C., Maes, L., “Young Children’s Dietary Habits and Associations
with the Mother’s Nutritional Knowledge and Attitudes,”Appetite, 2010, 54, 44—51.
[29] Yaniv, G., Rosin, O., Tobol, Y., “Junk-Food, Home Cooking, Physical Activity
and Obesity: The effect of the Fat Tax and the Thin Subsidy,”Journal of Public
Economics, 2009, 93, 823—830.
[30] Wang, Y., Beydoun, M.A., Liang, L., Caballero, B., Kumanyika, “Will
All Americans Become Overweight or Obese? Estimating the Progression and Cost
of the US Obesity Epidemic,”Obesity, 2008, 16(10), 2323—2330.
[31] Wang, Y.C., McPherson, K., Marsh, T., Gortmaker, S.L., Brown, M.,
“Health and Economic Burden of the Projected obesity Trends in the USA and the
UK,”The Lancet, 2011, 378, 815—825.
23

[32] WHO Global Infobase, https://apps.who.int/infobase/comparestart.aspx, ac-
cessed on November 1, 2009.
A Appendix
A.1 Pigouvian taxes and subsidies
To obtain the Pigouvian levels and , we solve
max
W( ) =Z
[ − − (1 + )∗ − (1− )∗ + (∗ ) + (∗ )− (∗ )]d ()
s.t. + () = ( ) + ()
substituting from the budget constraint and adding and subtracting (∗ )− (
∗ ),
W can be rewritten as
W =
Z
[ − ( )− () + ()− (1 + )∗ − (1− )∗ + (∗ ) + (∗ )
−(∗ ) + (1− )(∗ )− (1− )(
∗ )]d () (A.1)
Differentiating and rearranging by making use of the envelope theorem yieldsZ
∙−
∗+ − (1− )
0(∗ )¸∗d () =0 (A.2)Z
∙−
∗− + (1− )
0(∗ )¸∗d () =0 (A.3)
rearranging and “solving” yields
=
∗
+(1−)0(∗ )
−∗
d ()
−
0 (A.4)
=
−∗∗
+(1−)0(∗ )
∗d ()
0 (A.5)
A.2 Rawlsian taxes and subsidies
To obtain the Rawlsian solution by using taxes and subsidies as decision variables we
determine and , by
max
W( ) = [ − − (1 + )∗ − (1− )∗ + (∗) + (∗)− (∗)]
s.t. + () = ( ) + ()
24
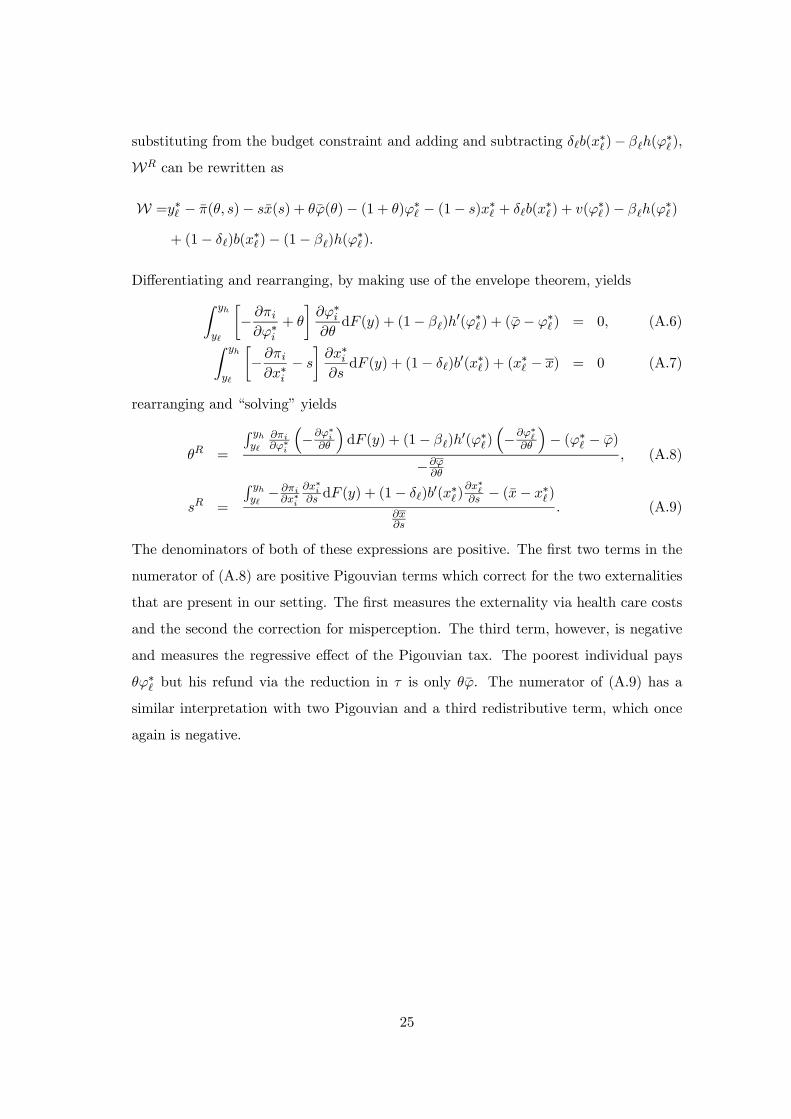
substituting from the budget constraint and adding and subtracting (∗)− (
∗),
W can be rewritten as
W =∗ − ( )− () + ()− (1 + )∗ − (1− )∗ + (∗) + (∗)− (
∗)
+ (1− )(∗)− (1− )(
∗)
Differentiating and rearranging, by making use of the envelope theorem, yieldsZ
∙−
∗+
¸∗d () + (1− )
0(∗) + (− ∗) = 0 (A.6)Z
∙−∗−
¸∗d () + (1− )
0(∗) + (∗ − ) = 0 (A.7)
rearranging and “solving” yields
=
R
∗
³−∗
´d () + (1− )
0(∗)³−∗
´− (∗ − )
−
(A.8)
=
R −
∗∗d () + (1− )
0(∗)∗
− (− ∗)
(A.9)
The denominators of both of these expressions are positive. The first two terms in the
numerator of (A.8) are positive Pigouvian terms which correct for the two externalities
that are present in our setting. The first measures the externality via health care costs
and the second the correction for misperception. The third term, however, is negative
and measures the regressive effect of the Pigouvian tax. The poorest individual pays
∗ but his refund via the reduction in is only . The numerator of (A.9) has a
similar interpretation with two Pigouvian and a third redistributive term, which once
again is negative.
25