earnings call robinson9 august 2019 s
TRANSCRIPT

Robinsons
2Q/1HCY19 Earnings Call
9 August 2019

Business Portfolio
LIFESTYLE CENTERS(from 49 as of end 1HCY18)
OFFICE DEVELOPMENTS(from 18 as of end 1HCY18)
RESIDENTIAL BUILDINGS(from 71 as of end 1HCY18)
HOTELS(from 17 as of 1HCY18)
MIXED-USE DEVELOPMENTS(from 18 as of 1HCY18)
51HOUSING
SUBDIVISIONS
7538201919
-2-

Strong Cash Flows Driven by Diversified Business Model
Investment Portfolio Development Portfolio
CY16 CY17 CY18 1HCY18 1HCY19
REVENUES (in Php B) EBITDA (in Php B)
EBIT (in Php B)
22.81
CY16 CY17 CY18 1HCY18 1HCY19
CY16 CY17 CY18 1HCY18 1HCY19
66%
34%
22%
78%
22.5212.48
8.27 8.56
70%
30%
78%
22%
76%
24%
70%
54%
NET INCOME (in Php B)
71%
66%
62%
34%
85%
15%
74%
26%
29.4416.20
11.74
80%
20%
64%
36%30%
46%
CY16 CY17 CY18 1HCY18 1HCY19
5.88
8.23
5.76
70%
30%
58%
42%67%
13.1071%
29%
62%
38%
7.00
81%
19%
InvestmentPortfolio+14% YoY
InvestmentPortfolio+14% YoY
12.05
85%
15%
InvestmentPortfolio+17% YoY
3.33
27%
68%
76%
24%
73%
4.84
32%
InvestmentPortfolio+19% YoY
33%
8.02
18%
82%
5.66
73%
27%
4.00
33%
DevelopmentPortfolio+10% YoY
DevelopmentPortfolio+17% YoY
DevelopmentPortfolio+17% YoY
DevelopmentPortfolio+22% YoY
67%
14.79
-3-

Strong Business Performance and Sound Financial Position
TOTAL ASSETS (in Php B)
SHAREHOLDERS’ EQUITY (in Php B)
EARNINGS PER SHARE NET DEBT TO EQUITY
RLC has a sound financial position and capital base, and exhibits prudence in debt management
148.1174.2 180.6
CY2017 CY2018 1HCY19
₱1.44₱1.62
₱0.77
CY2017 CY2018 1HCY19
74%
37% 34%
CY2017 CY2018 1HCY19
67.4
93.9 95.5
CY2017 CY2018 1HCY19
-4-

Financial Performance Highlights 2Q/1H19
OFFICES
HOTELS
RESIDENTIAL
TOTAL RLC
MALLS
IID
1HCY2019% to RLC
YoY 1HCY2019 % to RLC YoY 1HCY2019% to RLC
YoY
14,786 100% 13% 8,018 100% 15% 5,662 100% 17%
6,447 44% 11% 4,241 53% 12% 2,471 43% 17%
2,315 16% 29% 1,927 25% 23% 1,529 27% 25%
1,080 7% 11% 301 4% (6%) 150 3% (29%)
4,675 31% 5% 1,420 17% 8% 1,391 25% 8%
269 2% 369% 129 1% 1,683% 121 2% 2,231%
Note: Unaudited financial numbers
Net income increased by 20% YoY to Php 4.0 B
REVENUE EBITDA EBIT
-5-

COMMERCIAL CENTERS DIVISION
▪ 2nd largest mall operator in the
Philippines with 51 malls nationwide, 9within Metro Manila and 42 in otherurban areas
▪ 1,502,868 sqm in Gross Leasable Area
▪ 2,829,363 sqm in Gross Floor Area
▪ 95% latest system-wide occupancy
▪ Over 9,000 retailers
Partners
5,8176,447
1HCY18 1HCY19
+11%
3,7864,241
1HCY18 1HCY19
+12%
2,1112,471
1HCY18 1HCY19
+17%
REVENUES (Php Mn)
EBITDA (Php Mn)
EBIT (Php Mn)
-6-

COMMERCIAL CENTERS DIVISION
Robinsons Galleria SouthGLA: 48,000 sqmDate Opened: July 19,2019Occupancy rate 91.3%
-7-
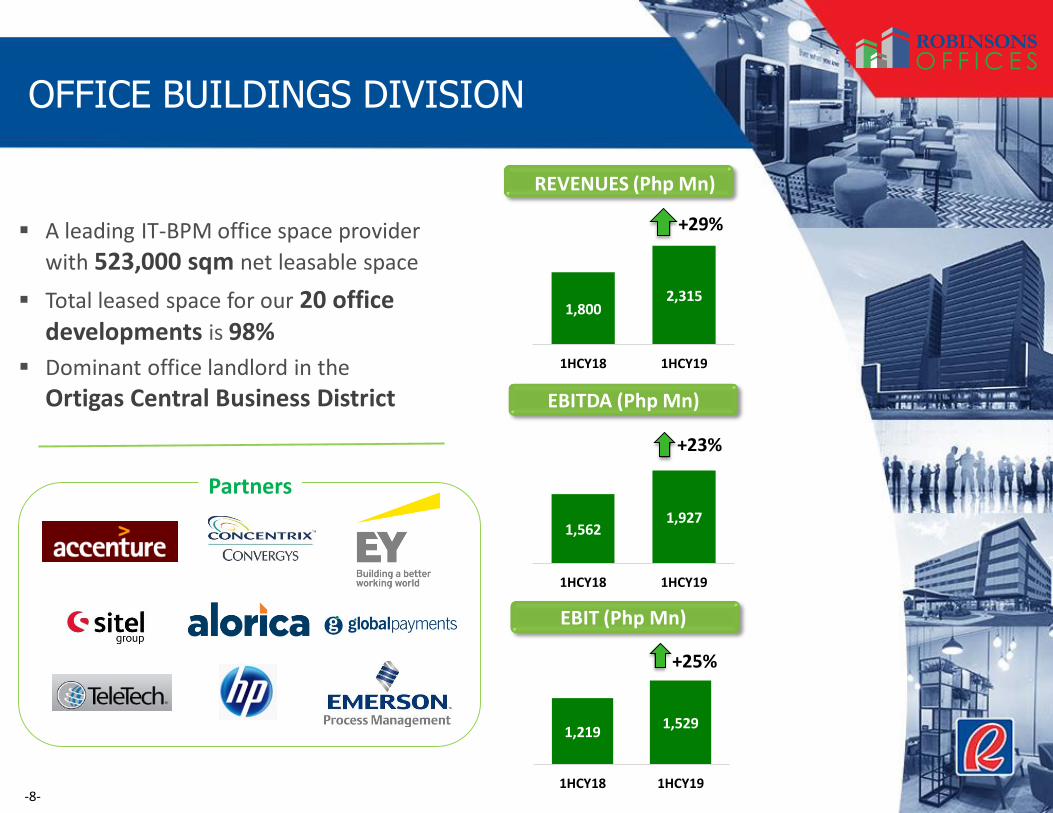
OFFICE BUILDINGS DIVISION
▪ A leading IT-BPM office space provider
with 523,000 sqm net leasable space
▪ Total leased space for our 20 office developments is 98%
▪ Dominant office landlord in the
Ortigas Central Business District
Partners
REVENUES (Php Mn)
EBITDA (Php Mn)
EBIT (Php Mn)
865
1,124
1,5621,927
1HCY18 1HCY19
1,2191,529
1HCY18 1HCY19
1,8002,315
1HCY18 1HCY19
+29%
+25%
+23%
-8-

HOTELS AND RESORTS DIVISION
▪ Multi-branded hotel portfolio spanning essential service hotels to standard deluxe hotels.
▪ Continuous expansion of all brand segments
▪ 19 hotel properties with 2,941 rooms across all segments
International Brands
Company-owned Brands
REVENUES (Php Mn)
EBITDA (Php Mn)
EBIT (Php Mn)
9771,080
1HCY18 1HCY19
321 301
1HCY18 1HCY19
-6%
210150
1HCY18 1HCY19
-29%
+11%
-9-

HOTELS AND RESORTS DIVISION
Dusit Thani MactanCebu ResortRooms: 272 rooms Soft Opening: March 29, 2019
-10-

RESIDENTIAL DIVISION
4,4464,675
1HCY18 1HCY19
954 1,193
4,107
5,699 1,769
2,199 599
560
1HCY18 1HCY19
7,429
9,651
NET SALES TAKE-UP (Php Mn)
REALIZED REVENUES (Php Mn)
EBITDA (Php Mn) EBIT (Php Mn)
+30%
+5%
1,3201,420
1HCY18 1HCY19
1,2921,391
1HCY18 1HCY19
+8%+8%
-11-

2Q PROJECT LAUNCHES
The Sapphire Bloc EastLocation: Pasig CityProject Launch: Q2CY19No. of Units: 665Sales Value: P5.23B
Galleria Residences Cebu Tower 3Location: Cebu CityProject Launch: Q2CY19No. of Units: 299Sales Value: P2.18B
-12-

2Q NEW PROJECT LAUNCHES
Cirrus in BridgetowneLocation: Pasig CityProject Launch: Q2CY19No. of Units: 1,371Sales Value: P5.26B
-13-

INDUSTRIAL AND INTEGRATED DEVELOPMENTS DIVISION
Warehouse Facility – RLX Sucat
Location Muntinlupa City
GLA 33,000 sq.m.
Property Type Warehouse
Completion 1st quarter of 2018
Turned Over in Q1CY18
REVENUES (Php Mn)
EBITDA (Php Mn)
EBIT (Php Mn)
57 52
217
1HCY18 1HCY19
120
1HCY18 1HCY19
+1683%
92
119
1HCY18 1HCY19
+369%
7
5
+2,231%
9
Investment Portfolio Development Portfolio
269
129
121
-14-

INDUSTRIAL AND INTEGRATED DEVELOPMENTS DIVISION
Location Laguna
GLA 35,000 sq.m.
Property Type Warehouse
Completion 2nd Half of 2019
Under Construction
Warehouse Facility – Calamba
-15-

Robust Growth Prospects
Investment Capex
Development Capex
Land Acquisition
CAPITAL EXPENDITURE (Philippines) in PHPm
RLC will continue to scout for strategic land bank across the country
LAND BANK as of 30 June 2019 (Philippines)
ESTIMATED VALUE In Php B
Metro Manila 19.9
Luzon 18.2
Visayas 3.5
Mindanao 2.9
TOTAL 44.48
Capital expenditure program in line with overall corporate strategy
AREA In Has.
Metro Manila 25.9
Luzon 529.6
Visayas 137.7
Mindanao 72.8
TOTAL 766
1,682 955 4,798
1,971 5,734
9,467 4,000
4,376 5,382
3,849 4,244
3,528
3,251
7,100 7,251 7,068
7,555 10,769
13,245 10,658 15,900
CY2013 CY2014 CY2015 CY2016 CY2017 CY2018 CY2019B 1HCY19
13,309 13,405
22,507
16,202 16,984
27,00023,376
9,3756,531
2,055
788
-16-

CHENGDU BAN BIAN JIEWe have secured license to sell for
condominium unitsWe have sold 100% of the units as
of March 2019
Plot LocationGroup 2/5/6 Ban Bian Jie Ji
Tou town, Wuhou District
Plot Area 8.5 hectares
Plot Ratio 2.6x
Gross Floor Area 220,000 sqm
Planned Development Mainly residential
Total Land Price* RMB 1.31 B(USD 207.36 M; PHP 9.63 B)
Nature of Acquisition Acquired from government through public auction
Pre-selling Schedule 2018
* Excludes transactional fees
Note:USD/RMB = 6.3561 and RMB/PHP = 7.31 as of 05 Oct 2015
Robust Growth Prospects
-17-

FUTURE PLANS
+4%
1,389
+8%1,502
1,569
+4%
GLA
(th
ou
san
d s
qm
)
-RP Iligan-RP Naga-RP North Tacloban-RP Antique Exp.-RP Butuan Exp.
-RP Ormoc-RP Pavia-RP Tuguegarao-RP Valencia
-RP Galleria South-RP Magnolia Exp.-Starmills Exp. Ph. 1
-Dumaguete Exp. Ph. 1-La Union--RP Antipolo Exp.-Gapan
1,636
GLA
(th
ou
san
d s
qm
)
-Cyber Sigma-Cybergate Delta One-Robinsons Luisita Office-Cybergate Naga One
-Exxa Tower-Zeta Tower-Cyberscape Gamma
-Cybergate Magnolia-Giga Tower-Luisita Two
- Cybergate Galleria Cebu-Starmills-Omega- Delta Tower Two
405523
+29%+12%588
677+15%
-18-

FUTURE PLANS
-Summit Galleria Cebu
-Summit Tacloban-GoH Iligan
-GoH-LanangDavao
*5 GoH Franchises
-Dusit Thani Mactan Cebu
-GoH Naga-Goh Tuguegarao
-Summit Naga-Summit Greenhills
-Summit Galleria Cebu -Summit Tacloban-GoH Iligan
-Dusit ThaniMactan Cebu--Summit Naga-Summit Greenhills
No
. of
Ho
tel r
oo
ms
-Summit Gen. Santos -Westin-GoH Naga-GoH Tuguegarao
2,736+9%
+19%
3,2482,516
+19%3,857
CY2018 CY2019 CY2020
GLA
(th
ou
san
ds
sqm
) +133%77
+31%101
33
Sucat, Muntinlupa Calamba, LagunaSierra Valley, Cainta
Sucat, Muntinlupa Exp.Calamba, Laguna Exp.
CY2015 CY2016 CY2017 CY2018 1HCY19
Sale
s Ta
ke-U
p
9,099 8,72310,255
15,318
9,651
-19-

1. Strong Earnings Growth: Net income up by 20% to P4.0B for 1HCY19.
2. Stable Growth from Investment Portfolio:
a. Investment revenues increased by 14% to P9.9B:
• Malls Division revenues increased by 11%
• Office Buildings Division revenues increased by 29%
• Hotel and Resorts Division revenues increased by 11%
• Industrial and Integrated Developments Division revenues increased by 369% b. Development revenues increased by 10% to P4.9B due to the ff:
• Residential realized revenues recovered and improved by 5% YoY
• Commercial lot sale amounted to P217M
3. Sales Take-up: Surged by 30%YoY to P9.7B due to 3 new project launches amounted to P12.0B
4. CAPEX: Utilized P9.38B on Investment & Development Portfolios and Land Acquisition. Expect acceleration in CAPEX spending in next 2 Quarters of 2019.
IN SUMMARY
-20-

2Q/1HCY19 Earnings Call