earnings conference call slide deck · 21 | 3rd quarter 2016 earnings conference call consolidated...
TRANSCRIPT

Third Quarter 2016 Earnings Conference Call
19 August 2016

| 3rd Quarter 2016 Earnings Conference Call 2
Safe Harbor Statement & Disclosures
The earnings call and accompanying material include forward-looking comments and information concerning the company’s plans and projections for the future, including estimates and assumptions with respect to economic, political, technological, weather, market acceptance and other factors that impact our businesses and customers. They also may include financial measures that are not in conformance with accounting principles generally accepted in the United States of America (GAAP). Words such as “forecast,” “projection,” “outlook,” “prospects,” “expected,” “estimated,” “will,” “plan,” “anticipate,” “intend,” “believe,” or other similar words or phrases often identify forward-looking statements. Actual results may differ materially from those projected in these forward-looking statements based on a number of factors and uncertainties. Additional information concerning factors that could cause actual results to differ materially is contained in the company’s most recent Form 8-K and periodic report filed with the U.S. Securities and Exchange Commission, and is incorporated by reference herein. Investors should refer to and consider the incorporated information on risks and uncertainties in addition to the information presented here. Investors should consider non-GAAP financial measures in addition to, and not as a substitute for, financial measures prepared in accordance with GAAP. The company, except as required by law, undertakes no obligation to update or revise its forward-looking statements whether as a result of new developments or otherwise. The call and accompanying materials are not an offer to sell or a solicitation of offers to buy any of the company’s securities.

| 3rd Quarter 2016 Earnings Conference Call 3
Third Quarter Overview
(in millions of dollars exceptper share amounts) Q3 2016 Q3 2015 Change
Net Sales and Revenues $6,724 $7,594 -11%
Net Sales $5,861 $6,840 -14%
Net IncomeAttributable to Deere & Company
$489 $512 -4%
Diluted EPS $1.55 $1.53 +1%

| 3rd Quarter 2016 Earnings Conference Call 4
Third Quarter OverviewNet Sales
Equipment operations net sales: Down 14% in Q3 2016 vs. Q3 2015
• Price realization: +2 points
• Currency translation: (2) points

| 3rd Quarter 2016 Earnings Conference Call 5
Worldwide Agriculture & TurfThird Quarter Overview
*Q3 2016 operating profit impacted by:
(in millions of dollars) Q3 2016 Q3 2015 Change
Net Sales $4,704 $5,308 -11%
Operating Profit* $571 $472 +21%
Favorable Unfavorable• Price Realization • Shipment Volumes• Gain on sale of partial interest in SiteOne • Foreign-Currency Exchange• Production Costs • Selling, Administrative & General Expenses

| 3rd Quarter 2016 Earnings Conference Call
Global Agriculture Industry Tailwinds Still Robust
Source: IMF, July 2016; United Nations, 2014 and 2015
6
Global GDP Global Population
Urbanization
1990
1995
2000
2005
2010
2015
2020
Ann
ual C
hang
e
World
Advanced
Emerging
0
2
4
6
8
10
1950
1960
1970
1980
1990
2000
2010
2020
2030
2040
2050
Bill
ions
Less developed regions (excluding LDCs)
Least developed countries
More developed regions
0
2
4
6
8
1950 1960 1970 1980 1990 2000 2010 2020 2030 2040 2050
Bill
ions
Urban PopulationRural Population
10%
8%
6%
4%
2%
0%
-2%
-4%

| 3rd Quarter 2016 Earnings Conference Call
Production/Consumption Balance Stable But Still Sensitive
Source: USDA, August 2016
7
Global Grains
1,700
1,900
2,100
2,300
2,500
2000
/01
2001
/02
2002
/03
2003
/04
2004
/05
2005
/06
2006
/07
2007
/08
2008
/09
2009
/10
2010
/11
2011
/12
2012
/13
2013
/14
2014
/15
2015
/16
2016
/17F
Mill
ion
Met
ric
Tons
Production Consumption

| 3rd Quarter 2016 Earnings Conference Call
Production/Consumption Balance Stable But Still Sensitive
Source: USDA, August 2016
8
Global Grains
300
350
400
450
500
550
600
65020
00/0
1
2001
/02
2002
/03
2003
/04
2004
/05
2005
/06
2006
/07
2007
/08
2008
/09
2009
/10
2010
/11
2011
/12
2012
/13
2013
/14
2014
/15
2015
/16
2016
/17F
Mill
ion
Met
ric
Tons
Ending Stocks S/U Ratio
10 Yr. Avg. = 21%
30%
25%
20%
15%
10%

Jan-16 Feb-16 Mar-16 Apr-16 May-16 Jun-16 Jul-16 Aug-16
$ pe
r Bus
hel
Jan-16 Feb-16 Mar-16 Apr-16 May-16 Jun-16 Jul-16 Aug-16
$ pe
r Bus
hel
| 3rd Quarter 2016 Earnings Conference Call
Production/Consumption Balance Stable But Still Sensitive
Source: Bloomberg, 12 August 2016
9
U.S. Corn Prices
U.S. Soybean Prices
Jan – Apr avg. = $3.65
Jan – Apr avg. = $9.01
4.35
4.10
3.85
3.60
3.35
3.10
12.25
11.50
10.75
10.00
9.25
8.50

| 3rd Quarter 2016 Earnings Conference Call
2016 Increased Planted Acres Explained by Pared but Positive Farmer Margins
10
United States
• Market prices
• Farm program subsidies
• Revenue insurance
• Production cost declines
Other Exporting Countries
• Currency values
• Policy shifts

| 3rd Quarter 2016 Earnings Conference Call
U.S. Farm SectorStrong Balance Sheet
11
Source: USDA ERS, February 2016
0
500
1,000
1,500
2,000
2,500
3,000
1960 1970 1980 1990 2000 2010 2016F
$ Bill
ions
(N
omin
al)
Farm Sector Debt Farm Sector Equity Debt/equity ratio Debt/asset ratio
2011 = $2T
2000 = $1T
30%
25%
20%
15%
10%
5%
0%

| 3rd Quarter 2016 Earnings Conference Call
Summary Observations
12
Global Ag Sector
• Supplies fully adequate to meet needs• Risk premia recently erased from grain markets
• Planted acres: Minimal farmer response to lower prices• Aberrational factors at play
• Fourth consecutive favorable global weather year nearing completion
• Barring adverse weather events, little near-term improvement in ag market conditions anticipated
• Long-term drivers (population and income growth, urbanization) still intact

| 3rd Quarter 2016 Earnings Conference Call
Summary Observations
13
U.S. Ag Sector
• Farmer financial conditions remain solid
• Farmer margins explain higher planted acres despite lower prices • Production cost decreases
• Yield expectations
• Farm bill subsidies
• Revenue insurance risk reduction

| 3rd Quarter 2016 Earnings Conference Call
What to Watch
14
Short Term
• Weather: Now the major market disruptor, outlook still one year at a time
• Next: Southern Hemisphere planting/growing season
• Then: Attention returns to Northern Hemisphere spring (2017) conditions
Longer Term Disruptors
• Geopolitical hot spots: Potential drag on GDP growth
• U.S. dollar relative to other currency values
• Fed actions, U.S. politics, central bank behavior
• China economy, Brexit fallout, EU
• Nationalism: Future of globalization

| 3rd Quarter 2016 Earnings Conference Call 15
Agriculture & Turf Retail SalesIndustry Outlook – Fiscal 2016
2016 Forecast Previous Forecast
U.S. and Canada Ag Down 15-20%
No change between Previous Forecast and
Current Forecast
EU 28 Ag Flat to down 5%
South America Ag(Tractors and Combines)
Down 15-20%
Asia Ag Flat to down slightly
U.S. and Canada Turf and Utility Equipment Flat to up 5%
Deere & Company Forecast as of 19 August 2016 (Previous Forecast as of 20 May 2016)

| 3rd Quarter 2016 Earnings Conference Call 16
Worldwide Agriculture & TurfDeere & Company Outlook
Fiscal Year 2016 Forecast• Net sales: Down ~ 8%
• Currency translation: ~ (2) points
• No change from previous forecast
Deere & Company Forecast as of 19 August 2016 (Previous Forecast as of 20 May 2016)

| 3rd Quarter 2016 Earnings Conference Call 17
Worldwide Construction & ForestryThird Quarter Overview
(in millions of dollars) Q3 2016 Q3 2015 Change
Net Sales $1,157 $1,532 -24%
Operating Profit* $54 $129 -58%
*Q3 2016 operating profit impacted by:Favorable Unfavorable• Production Costs • Shipment Volumes• Selling, Administrative & General Expenses• Price Realization
• Product Mix

U.S. Economic Indicators2016
ForecastPrevious Forecast
GDP Growth (annual percentage rate)* +1.9% +2.1%Housing Starts (thousands) 1,181 1,161Total Construction Investment (annual percentage rate)* +2.8% +3.2%Government Construction Investment (annual percentage rate)* +3.6% +4.1%
| 3rd Quarter 2016 Earnings Conference Call 18
Worldwide Construction & ForestryDeere & Company Outlook
Source: IHS Global Insight, Calendar Year Estimates, July 2016* Change from prior year in real dollars
Fiscal Year 2016 Forecast• Net sales: Down ~ 18%
• Currency translation: ~ (1) point
• Previous forecast: Down ~ 13%• Currency translation: ~ (1) point
Deere & Company Forecast as of 19 August 2016 (Previous Forecast as of 20 May 2016)

| 3rd Quarter 2016 Earnings Conference Call 19
Worldwide Financial ServicesCredit Loss History
Provision for Credit Losses / Average Owned Portfolio
0.0%
0.5%
1.0%
1.5%
2.0%
1992 1994 1996 1998 2000 2002 2004 2006 2008 2010 2012 2014 2016*
10 Year Average
0.24%
15 Year Average
* Annualized provision for credit losses as of 31 July 2016

| 3rd Quarter 2016 Earnings Conference Call 20
Worldwide Financial Services
Third Quarter 2016• Net income attributable to Deere & Company
• $126 million in Q3 2016 vs. $153 million in Q3 2015
Fiscal Year 2016 Forecast• Net income attributable to Deere & Company of ~ $480 million
• No change from previous forecast
Deere & Company Forecast as of 19 August 2016 (Previous Forecast as of 20 May 2016)
| 3rd Quarter 2016 Earnings Conference Call 21
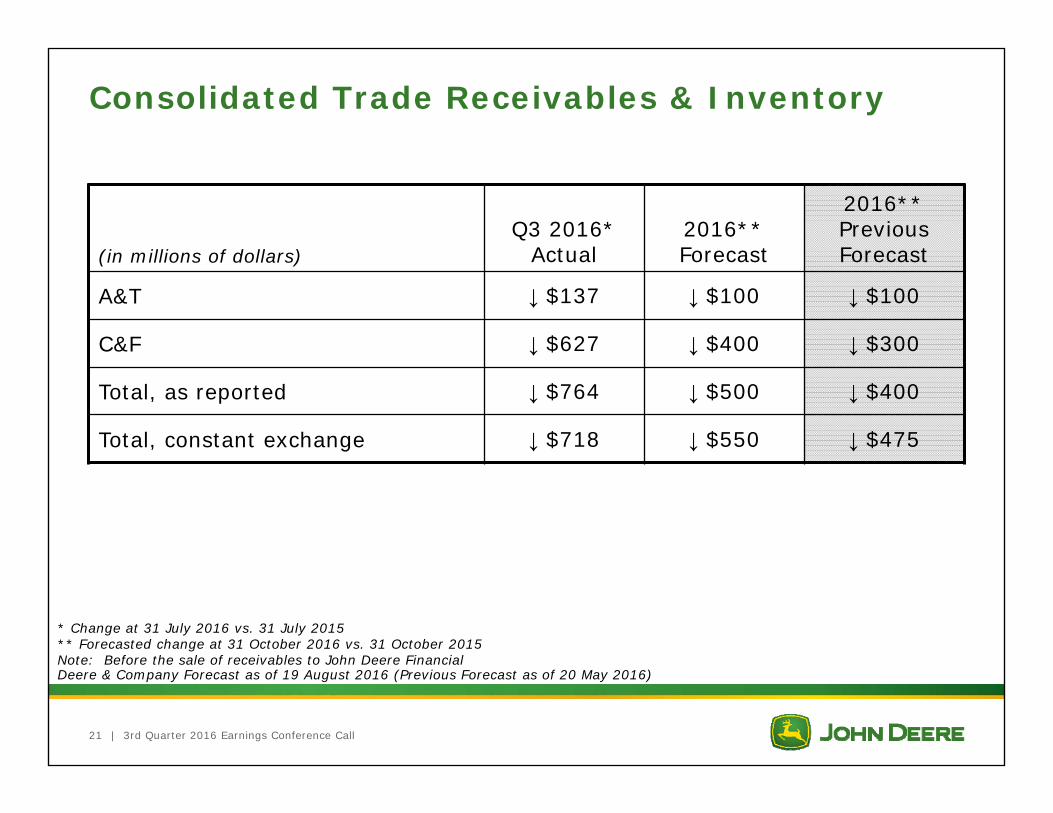
Consolidated Trade Receivables & Inventory
(in millions of dollars)Q3 2016*
Actual2016** Forecast
2016** Previous Forecast
A&T ↓ $137 ↓ $100 ↓ $100
C&F ↓ $627 ↓ $400 ↓ $300
Total, as reported ↓ $764 ↓ $500 ↓ $400
Total, constant exchange ↓ $718 ↓ $550 ↓ $475
* Change at 31 July 2016 vs. 31 July 2015** Forecasted change at 31 October 2016 vs. 31 October 2015Note: Before the sale of receivables to John Deere FinancialDeere & Company Forecast as of 19 August 2016 (Previous Forecast as of 20 May 2016)

| 3rd Quarter 2016 Earnings Conference Call 22
Cost of Sales as a Percent of Net SalesEquipment Operations
Deere & Company Forecast as of 19 August 2016
Third Quarter 2016• 76.7%
Fiscal Year 2016 Forecast• ~ 78.7%

| 3rd Quarter 2016 Earnings Conference Call 23
Research & Development ExpenseEquipment Operations
Third Quarter 2016• Down 2% vs. Q3 2015
Fiscal Year 2016 Forecast• Down ~ 1% vs. FY 2015
• Currency translation: ~ (1) point
• No change from previous forecast
Deere & Company Forecast as of 19 August 2016 (Previous Forecast as of 20 May 2016)

| 3rd Quarter 2016 Earnings Conference Call 24
Selling, Administrative & General ExpenseEquipment Operations
Third Quarter 2016• Down 10% vs. Q3 2015
• Incentive compensation: ~ (4) points• Commissions paid to dealers: ~ (2) points• Pension/OPEB: ~ (2) points• Currency translation: ~ (1) point

| 3rd Quarter 2016 Earnings Conference Call 25
Selling, Administrative & General ExpenseEquipment Operations
Deere & Company Forecast as of 19 August 2016 (Previous Forecast as of 20 May 2016)
Fiscal Year 2016 Forecast• Down ~ 5% vs. FY 2015
• Incentive compensation: ~ (2) points• Currency translation: ~ (2) points• Pension/OPEB: ~ (2) points
• Previous forecast: Down ~ 4% vs. FY 2015• Incentive compensation: ~ (3) points• Currency translation: ~ (2) points• Pension/OPEB: ~ (2) points

| 3rd Quarter 2016 Earnings Conference Call 26
Pension and OPEB Expense
Third Quarter 2016• Down $53 million vs. Q3 2015
Fiscal Year 2016 Forecast• Down ~ $210 million vs. FY 2015• Previous forecast: Down ~ $200 million vs. FY 2015
Deere & Company Forecast as of 19 August 2016 (Previous Forecast as of 20 May 2016)

| 3rd Quarter 2016 Earnings Conference Call 27
Income TaxesEquipment Operations
Third Quarter 2016• Effective tax rate: 31%
Fiscal Year 2016 Forecast• Effective tax rate: 29-31%
• Previous forecast: 31-33%
Deere & Company Forecast as of 19 August 2016 (Previous Forecast as of 20 May 2016)

| 3rd Quarter 2016 Earnings Conference Call 28
Strong Operating PerformanceEquipment Operations
Fiscal Year Cash Flows from Operations
* No change from previous forecastDeere & Company Forecast as of 19 August 2016 (Previous Forecast as of 20 May 2016)
$2.4
$1.4
$2.5
$3.0 $2.9
$4.7 $4.5
$3.1
2008 2009 2010 2011 2012 2013 2014 2015 2016Forecast*
$ Bill
ions
~ $2.1

| 3rd Quarter 2016 Earnings Conference Call 29
2016 Company Outlook
Fourth Quarter 2016 Forecast• Net sales: Down ~ 8% vs. Q4 2015
• Price realization: ~ +1 point• Currency translation: ~ +1 point
Deere & Company Forecast as of 19 August 2016

| 3rd Quarter 2016 Earnings Conference Call 30
2016 Company Outlook
Fiscal Year 2016 Forecast• Net sales: Down ~ 10% vs. FY 2015
• Price realization: ~ +1 point• Currency translation: ~ (2) points
• Previous forecast: Down ~ 9% vs. FY 2015• Price realization: ~ +1 point• Currency translation: ~ (2) points
• Net income attributable to Deere & Company of ~ $1.35 billion• Previous forecast ~ $1.2 billion
Deere & Company Forecast as of 19 August 2016 (Previous Forecast as of 20 May 2016)

| 3rd Quarter 2016 Earnings Conference Call 31
Appendix

| 3rd Quarter 2016 Earnings Conference Call 32
The John Deere Strategy

Deere Use-of-Cash Priorities
| 3rd Quarter 2016 Earnings Conference Call 33
Manage the balance sheet, including liquidity, to support a rating that provides access to low-cost and readily available short- and long-term funding mechanisms
Reflects the strategic nature of our financial services operation
Committed to “A” Rating
Cash from Operations
Fund Operating and Growth Needs
Common Stock Dividend
Share Repurchase
Fund value-creating investments in our businesses
Consistently and moderately raise dividend targeting a 25%-35% payout ratio of mid-cycle earnings
Consider share repurchase as a means to deploy excess cash to shareholders, once above requirements are met and repurchase is viewed as value-enhancing

| 3rd Quarter 2016 Earnings Conference Call 34
Sources and Uses of Cash Fiscal 2004–2015Equipment Operations
Source: Deere & Company SEC filings
= Source of Cash= Use of Cash
(1) Other includes proceeds from maturities and sales of marketable securities and purchases of marketable securities and reconciliation for non-cash items including excess tax benefits from share-based compensation and the effect of exchange rates on cash and cash equivalents
$4,287
$31,582
$953
$9,419
$1,297$2,239
$6,323
$14,257
$387
$0
$3,000
$6,000
$9,000
$12,000
$15,000
$18,000
$21,000
$24,000
$27,000
$30,000
$33,000
$36,000
$39,000
BeginningCash & CashEquivalents(10/31/03)
Cash FromOperations
Divestitures,net of
Acquisitions
CapitalExpenditures
Investment inFinancialServices
Net Change inDebt and
IntercompanyBalances
Dividends ShareRepurchase,
net ofCommon
StockIssuances
Other Ending Cash &Cash
Equivalents(10/31/15)
(1)
$ M
illio
ns
$2,900
~65% of cash from operations returned to shareholders

$0.11$0.14
$0.16$0.20
$0.22$0.25
$0.28 $0.30$0.35
$0.41
$0.46
$0.51
$0.60
$0.00
$0.10
$0.20
$0.30
$0.40
$0.50
$0.60
$0.70
2003 2004 2005 2006 2007 2008 2009 2010 2011 2012 2013 2014 2015 2016
| 3rd Quarter 2016 Earnings Conference Call
Deere Quarterly Dividends Declared* Q1 2003 – Q3 2016
* Adjusted for 2 for 1 stock split on 26 November 2007** See revised John Deere Strategy in Appendix
35
Dividend raised 114% since launch of the revised John Deere Strategy in 2010**

| 3rd Quarter 2016 Earnings Conference Call 36
Share RepurchaseAs Part of Publicly Announced Plans
Cumulative cost of repurchases 2004-3Q2016: ~ $16.4 billionAmount remaining on December 2013 authorization of $8 billion: ~ $3.3 billion31 July 2016 period ended basic shares: ~ 314.4 million3Q2016 average diluted shares: ~ 315.7 millionShares repurchased 2004-3Q2016: ~ 245.0 millionAverage repurchase price 2004-3Q2016: $66.96
* All shares adjusted for two-for-one stock split effective 26 November 2007
$0.0
$0.5
$1.0
$1.5
$2.0
$2.5
$3.0
0.0
5.0
10.0
15.0
20.0
25.0
30.0
35.0
40.0
2004 2005 2006 2007 2008 2009 2010 2011 2012 2013 2014 2015 2016YTD
$ Billions
Sha
res
Rep
urch
ased
* (i
n m
illio
ns) ~37% Net Share Reduction 2004-3Q2016
Shares Repurchased Amount Spent

| 3rd Quarter 2016 Earnings Conference Call 37
Other InformationEquipment Operations
Fiscal Year 2016 Forecast• Capital Expenditures: ~ $650 million
• Previous forecast: ~ $725 million
• Depreciation and Amortization: ~ $800 million• Previous forecast: ~ $825 million
• Pension/OPEB Contributions: ~ $105 million• Previous forecast: ~ $100 million
Deere & Company Forecast as of 19 August 2016 (Previous Forecast as of 20 May 2016)

| 3rd Quarter 2016 Earnings Conference Call 38
Deere & Company Forecast as of 19 August 2016
Economic UpdateEU 28 – Fiscal 2016
Continued modest economic growth; increased uncertainty due to non-economic risks
Arable income remains under pressure
Continued weakness in dairy sector
Beef prices remain above average; pork prices at low levels

| 3rd Quarter 2016 Earnings Conference Call 39
Deere & Company Forecast as of 19 August 2016
Economic UpdateOther Selected Markets – Fiscal 2016
China • Slower economic growth continues• Value of agricultural production expected to be stable• Uncertainty due to recent policy announcements
India• Economy growing, driven by strong consumer demand• Government continues to support the agricultural sector• Value of agricultural production expected to increase• Monsoon above average, following two consecutive below normal
seasons

| 3rd Quarter 2016 Earnings Conference Call 40
Crop Value of Agricultural Production Brazil
Source: IHS Global Insight, May 2016
Crop Value of Agricultural Production
Expected to decrease ~ 2% in 2016 over prior season
2015 Mix by Crop
$0
$20
$40
$60
$80
$100
$120
2004 2006 2008 2010 2012 2014 2016F
US$
Bill
ions
44%
29%
17%
10%
SoybeansSugarcaneCornOther Grains

Farmers with Annual Revenues <R$90M Farmers with Annual Revenues >R$90M
2011 2012 2013 2014 2015* 2016**
12%
10%
8%
6%
4%
2%
0%
All Farmers
Eligible Finance Rates for Agricultural EquipmentBrazil
| 3rd Quarter 2016 Earnings Conference Call 41
Source: ABIMAQ (Brazilian Association of Machinery and Equipment) and BNDESPSI-FINAME was the key credit line for machinery acquisition from 2011 – 2014; Moderfrota is currently the most attractive credit line
* Moderfrota suspended September – November 2015** Rate change effective July 2016

| 3rd Quarter 2016 Earnings Conference Call 42
U.S. Farm Commodity Prices
Deere & Company Forecast as of 19 August 2016 (Previous Forecast as of 20 May 2016)
(dollars per bushel, except cotton, which is dollars per pound) 2014/15
2015/16 Estimate
Previous 2015/16
2016/17 Projection
Previous 2016/17
Corn $3.70 $3.60 $3.60 $3.15 $3.35
Wheat $5.99 $4.89 $4.90 $3.75 $4.10
Soybeans $10.10 $8.95 $8.85 $9.30 $9.10
Cotton $0.61 $0.58 $0.58 $0.62 $0.57

| 3rd Quarter 2016 Earnings Conference Call 43
U.S. Acres Harvested and Crop Yields
Deere & Company Forecast as of 19 August 2016
(Yield in bushels per acre, except cotton, which is pounds per acre)
Acres Harvested(millions)
Yield
2015/16 Estimate
2016/17 Projection
2015/16 Estimate
2016/17 Projection
Corn 80.7 86.6 168.4 175.1
Wheat 47.1 44.1 43.6 52.6
Soybeans 81.8 83.0 48.0 48.9
Cotton 8.1 9.5 766 800

| 3rd Quarter 2016 Earnings Conference Call 44
U.S. Farm Cash Receipts
Deere & Company Forecast as of 19 August 2016 (Previous Forecast as of 20 May 2016)
(in billions of dollars) 20142015
ForecastPrevious
20152016
ForecastPrevious
2016
Crops $209.3 $191.3 $191.3 $188.2 $184.1
Livestock $212.2 $185.7 $185.7 $171.3 $177.1
Government Payments $9.8 $10.6 $10.6 $13.9 $13.9
Total Cash Receipts $431.3 $387.6 $387.6 $373.4 $375.1

| 3rd Quarter 2016 Earnings Conference Call
U.S. Farm Cash Receipts
$0
$50
$100
$150
$200
$250
$300
$350
$400
$450
$500
2000 2001 2002 2003 2004 2005 2006 2007 2008 2009 2010 2011 2012 2013 2014 2015F 2016F
$ Bill
ions
Crops Livestock Government Payments
Source: 2000 – 2014: USDA, 9 February 20162015F – 2016F: Deere & Company Forecast as of 19 August 2016
45

| 3rd Quarter 2016 Earnings Conference Call 46
U.S. Net Farm Cash Income
Deere & Company Forecast as of 19 August 2016 (Previous Forecast as of 20 May 2016)
(in billions of dollars) 20142015
ForecastPrevious
20152016
ForecastPrevious
2016
Total Cash Receipts $431.3 $387.6 $387.6 $373.4 $375.1
Other Farm-Related Income $35.4 $33.8 $33.8 $34.9 $34.1
Gross Cash Income $466.7 $421.4 $421.4 $408.3 $409.2
Cash Expenses ($338.6) ($328.2) ($328.2) ($323.0) ($322.0)
Net Cash Income $128.1 $93.2 $93.2 $85.3 $87.2

| 3rd Quarter 2016 Earnings Conference Call 47
Retail SalesU.S. and Canada Ag Industry* Deere**
2WD Tractors (< 40 PTO hp) ↓ 7% ↑ single digit2WD Tractors (40 < 100 PTO hp) ↓ 23% ↓ in line with the industry2WD Tractors (100+ PTO hp) ↓ 26% ↓ less than the industry4WD Tractors ↓ 43% ↓ more than the industryCombines ↓ 23% ↓ more than the industry
July 2016 Retail Sales and Dealer Inventories
* As reported by the Association of Equipment Manufacturers** As reported to the Association of Equipment Manufacturers*** At 31 July – in units as a % of trailing 12 months retail sales, as reported to the Association of Equipment Manufacturers
Deere Dealer Inventories***U.S. and Canada Ag 2016 2015
2WD Tractors (100+ PTO hp) 37% 25%Combines 20% 19%

| 3rd Quarter 2016 Earnings Conference Call 48
July 2016 Retail Sales
EU 28 Deere*Tractors ↓ double digitsCombines ↑ single digit
U.S. and Canada Deere*Selected Turf & Utility Equipment ↓ single digit
* Based on internal sales reports
U.S. and Canada – Construction & Forestry Deere*First-in-the-Dirt ↓ double digitsSettlements ↓ single digit

Deere’s fourth quarter 2016 conference call is scheduled for 9:00 a.m. central time
on Wednesday, November 23, 2016