earnings insight template 2016 - factset section...these two hurricanes contributed to the recent...
TRANSCRIPT

Copyright © 2017 FactSet Research Systems Inc. All rights reserved. FactSet Research Systems Inc. www.factset.com 1
All data published in this report is available on FactSet. Please contact [email protected] or 1-877-FACTSET for more information.
Key Metrics • Earnings Growth: For Q3 2017, the estimated earnings growth rate for the S&P 500 is 4.5%. Eight sectors are expected to
report earnings growth for the quarter, led by the Energy sector.
• Earnings Revisions: On June 30, the estimated earnings growth rate for Q3 2017 was 7.5%. Ten sectors have lower growth rates today (compared to June 30) due to downward revisions to earnings estimates, led by the Energy sector.
• Earnings Guidance: For Q3 2017, 73 S&P 500 companies have issued negative EPS guidance and 43 S&P 500 companies have issued positive EPS guidance.
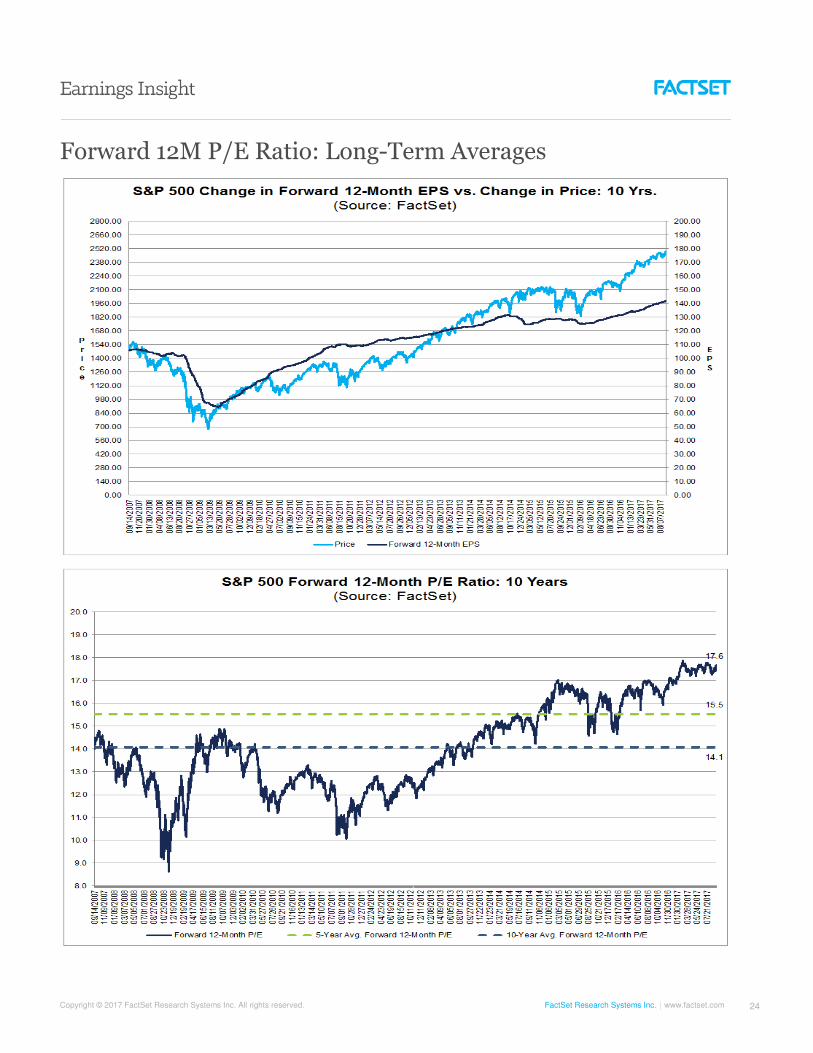
• Valuation: The forward 12-month P/E ratio for the S&P 500 is 17.6. This P/E ratio is above the 5-year average (15.5) and above the 10-year average (14.1).
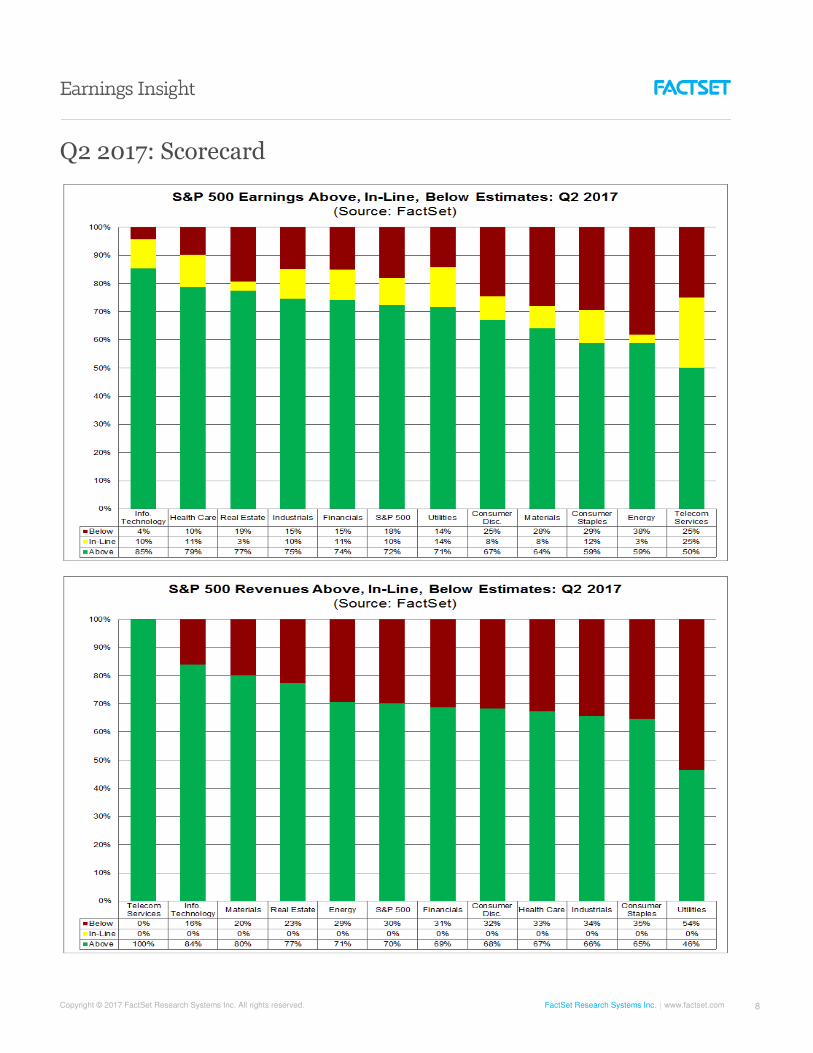
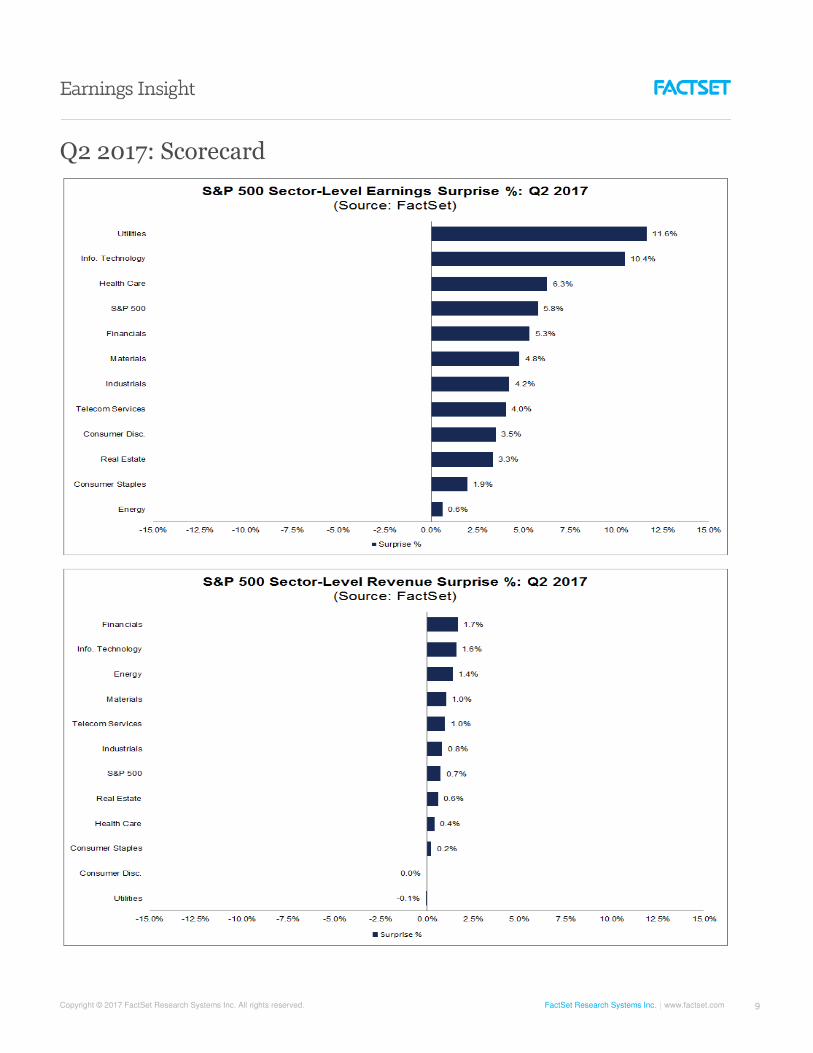
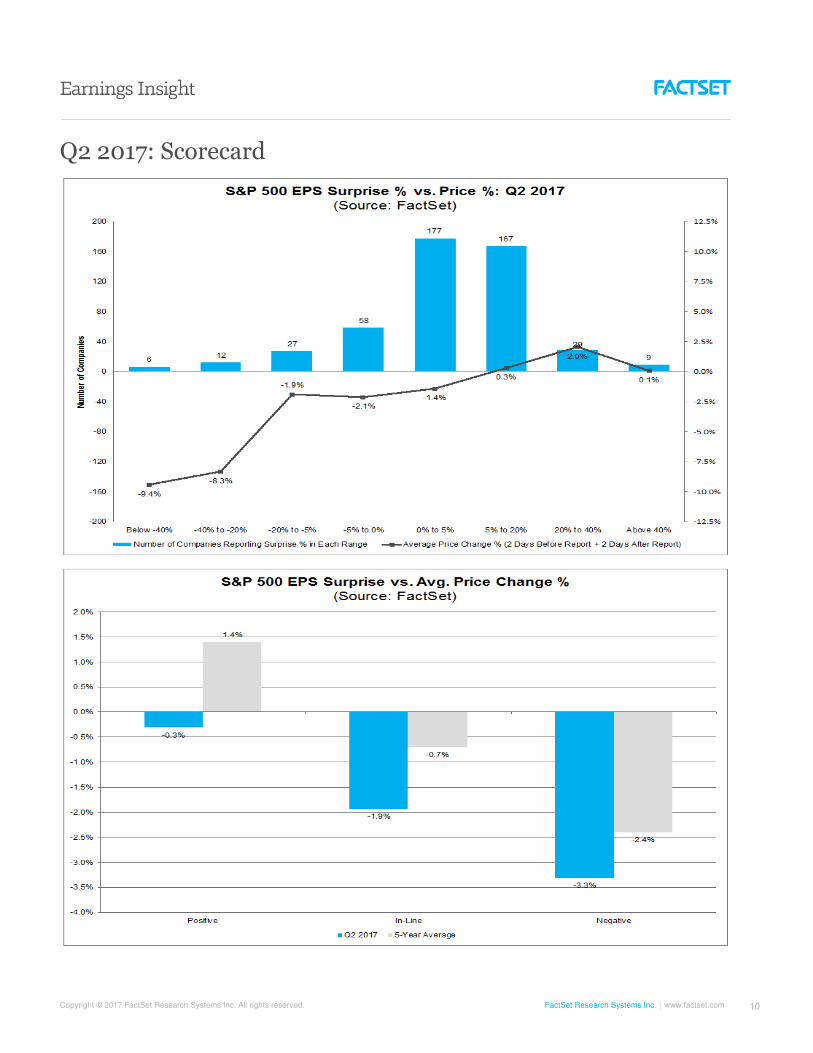
• Earnings Scorecard: For Q2 2017 (with 100% of the companies in the S&P 500 reporting actual results for the quarter), 73% of S&P 500 companies reported positive EPS surprises and 70% reported positive sales surprises.
To receive this report via e-mail, please go to www.factset.com/data/news_research/researchdesk
To view other market stories with FactSet content, please go to www.factset.com/insight
John Butters, Senior Earnings Analyst
September 15, 2017
Media Questions/Requests
Copyright © 2017 FactSet Research Systems Inc. All rights reserved. FactSet Research Systems Inc. www.factset.com 2
Topic of the Week:
Have Hurricanes Negatively Impacted S&P 500 Earnings Expectations for Q3?
Hurricanes Harvey and Irma caused significant property damage and business losses across the Gulf Coast region of the country in late August and early September. Since Labor Day weekend (September 5), the estimated earnings growth rate for the S&P 500 for Q3 2017 has declined by just over half a percentage point (to 4.5% from 5.1%). Have these two hurricanes contributed to the recent decline in expected earnings growth for the index?
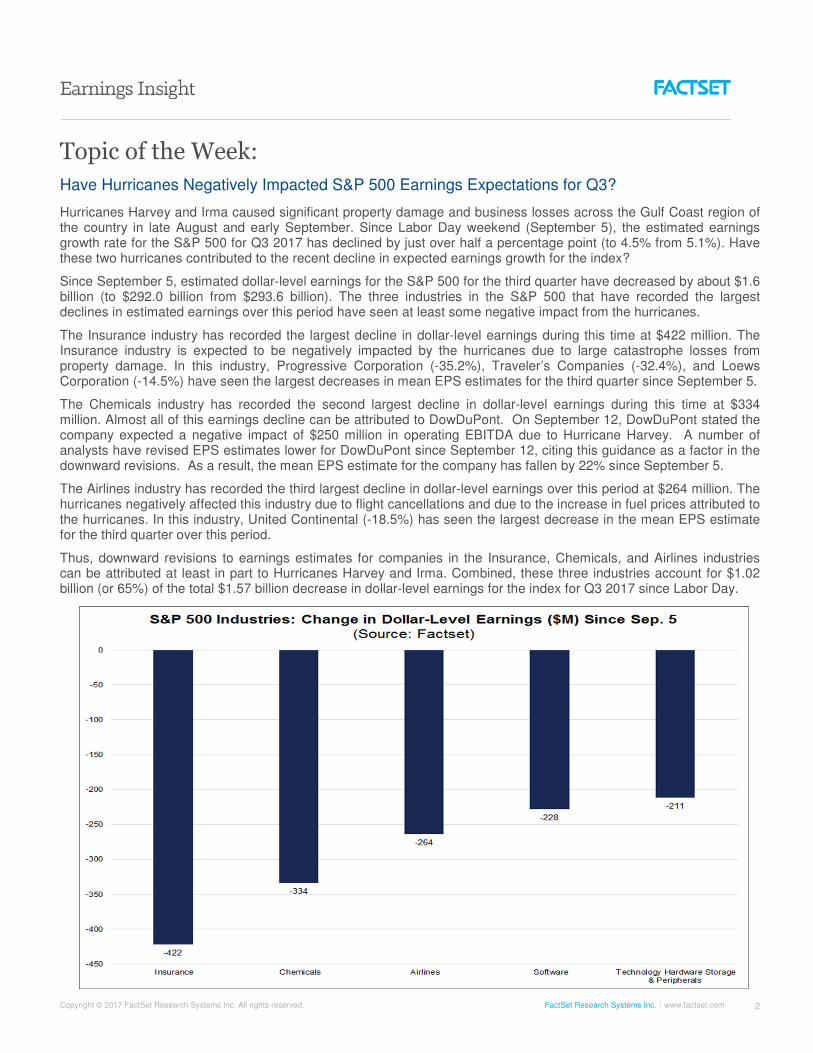
Since September 5, estimated dollar-level earnings for the S&P 500 for the third quarter have decreased by about $1.6 billion (to $292.0 billion from $293.6 billion). The three industries in the S&P 500 that have recorded the largest declines in estimated earnings over this period have seen at least some negative impact from the hurricanes.
The Insurance industry has recorded the largest decline in dollar-level earnings during this time at $422 million. The Insurance industry is expected to be negatively impacted by the hurricanes due to large catastrophe losses from property damage. In this industry, Progressive Corporation (-35.2%), Traveler’s Companies (-32.4%), and Loews Corporation (-14.5%) have seen the largest decreases in mean EPS estimates for the third quarter since September 5.
The Chemicals industry has recorded the second largest decline in dollar-level earnings during this time at $334 million. Almost all of this earnings decline can be attributed to DowDuPont. On September 12, DowDuPont stated the company expected a negative impact of $250 million in operating EBITDA due to Hurricane Harvey. A number of analysts have revised EPS estimates lower for DowDuPont since September 12, citing this guidance as a factor in the downward revisions. As a result, the mean EPS estimate for the company has fallen by 22% since September 5.
The Airlines industry has recorded the third largest decline in dollar-level earnings over this period at $264 million. The hurricanes negatively affected this industry due to flight cancellations and due to the increase in fuel prices attributed to the hurricanes. In this industry, United Continental (-18.5%) has seen the largest decrease in the mean EPS estimate for the third quarter over this period.
Thus, downward revisions to earnings estimates for companies in the Insurance, Chemicals, and Airlines industries can be attributed at least in part to Hurricanes Harvey and Irma. Combined, these three industries account for $1.02 billion (or 65%) of the total $1.57 billion decrease in dollar-level earnings for the index for Q3 2017 since Labor Day.

Copyright © 2017 FactSet Research Systems Inc. All rights reserved. FactSet Research Systems Inc. www.factset.com 3
Q3 2017 Earnings Season: By the Numbers
Overview
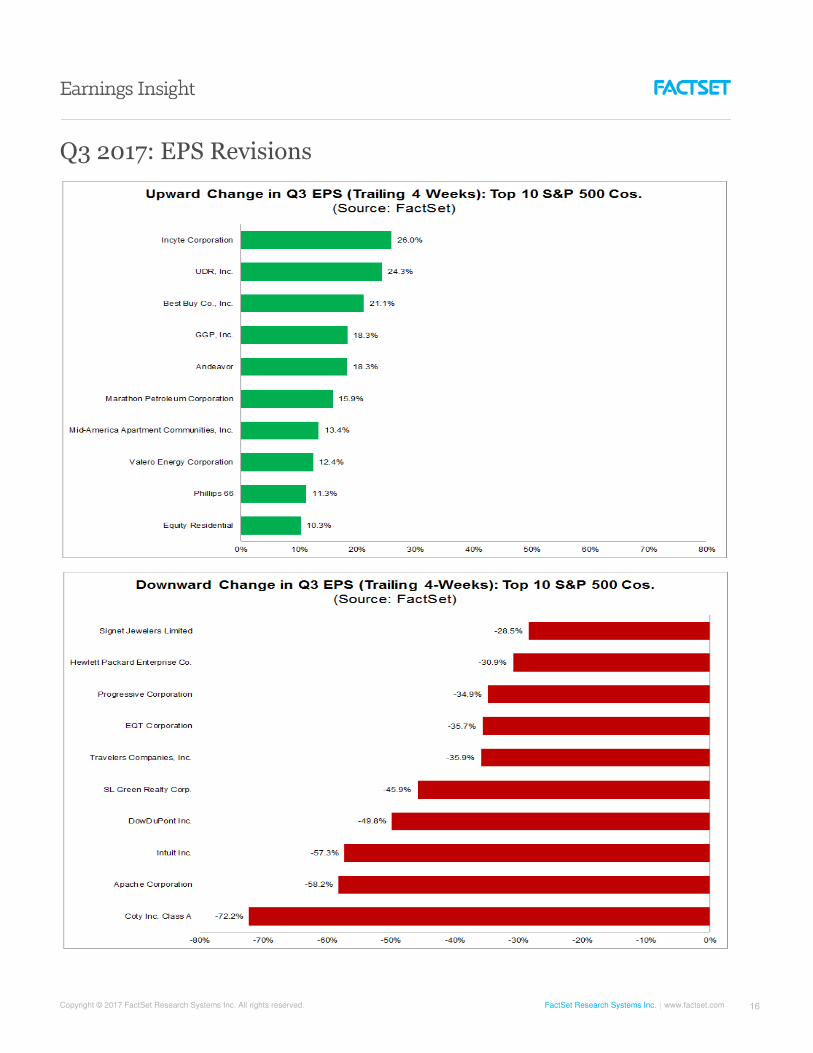
In terms of estimate revisions, analysts have made smaller cuts than average to earnings estimates for companies in the S&P 500 for Q3 2017 to date. On a per-share basis, estimated earnings for the third quarter have fallen by 2.6% since June 30. This percentage decline is smaller than the trailing 5-year average (-3.5%) and the trailing 10-year average (-4.3%) for the first two months of a quarter.
In addition, a smaller percentage of S&P 500 companies have lowered the bar for earnings for Q3 2017 relative to recent averages. Of the 116 companies that have issued EPS guidance for the third quarter, 73 have issued negative EPS guidance and 43 have issued positive EPS guidance. The percentage of companies issuing negative EPS guidance is 63% (73 out of 116), which is below the 5-year average of 75%.
Because of the downward revisions to earnings estimates, the estimated year-over-year earnings growth rate for Q3 2017 has fallen from 7.5% on June 30 to 4.5% today. Eight sectors are predicted to report year-over-year earnings growth, led by the Energy, Information Technology, and Real Estate sectors. Three sectors are projected to report a year-over-year decline in earnings, led by the Consumer Discretionary sector.
The estimated year-over-year sales growth rate for Q3 2017 is 5.2% today, which is equal to the estimate of 5.2% on June 30. Ten sectors are projected to report year-over-year growth in revenues, led by the Energy, Materials, and Information Technology sectors. The only sector predicted to report a year-over-year decline in revenues is the Telecom Services sector.
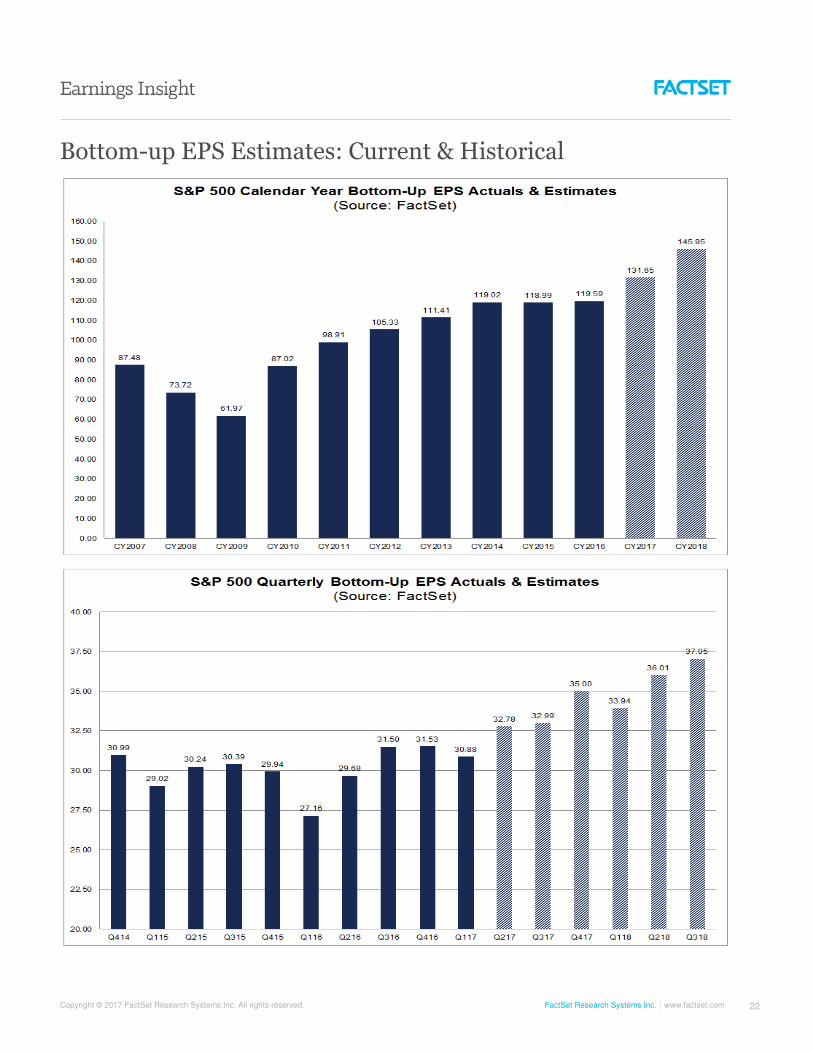
Looking at future quarters, analysts currently project earnings growth to rebound to double-digit levels starting in Q4 2017.
The forward 12-month P/E ratio is 17.6, which is above the 5-year average and the 10-year average.
During the upcoming week, seven S&P 500 companies are scheduled to report results for the third quarter.
Earnings Revisions: Energy Sector Has Recorded Largest Drop in Expected Earnings Growth
Decrease in Estimated Earnings Growth Rate for Q3 This Week Due to Multiple Sectors
The estimated earnings growth rate for the third quarter is 4.5% this week, which is below the estimated earnings growth rate of 4.8% last week. Downward revisions to EPS estimates for companies in the Materials, Financials, Information Technology, and Industrials sectors were mainly responsible for the decrease in the overall earnings growth rate for the index during the week. For more details on recent estimate revisions, please see page 2.
Overall, the estimated earnings growth rate for Q3 2017 of 4.5% today is below the estimated earnings growth rate of 7.5% at the start of the quarter (June 30). Ten sectors have recorded a decline in expected earnings growth since the beginning of the quarter due to downward revisions to earnings estimates, led by the Energy and Materials sectors.
Energy: Largest Decline in Expected Earnings Growth since June 30, led by Exxon Mobil and Chevron
The Energy sector has recorded the largest decrease in expected earnings growth since the start of the quarter (to 108.7% from 157.3%). Despite the decrease in estimated earnings, this sector has witnessed an increase in price of 1.8% since June 30. Overall, 25 of the 32 companies (78%) in the Energy sector have seen a decline in their mean EPS estimate during this time. Of these 25 companies, 22 have recorded a decrease in their mean EPS estimate of more than 10%, led by Anadarko Petroleum (to -$0.53 from -$0.09), Marathon Oil (to -$0.16 from -$0.05), and Apache Corporation (to $0.02 from $0.25). However, the declines in the mean EPS estimates for Exxon Mobil (to $0.84 from $0.99) and Chevron (to $0.86 from $1.14) have been the largest contributors to the decrease in expected earnings for this sector since June 30. While the stock price of Exxon Mobil has fallen by 1.2% (to $79.79 from $80.73) since June 30, the stock price of Chevron has actually increased by 9.4% (to $114.14 from $104.33) during the same period.
Copyright © 2017 FactSet Research Systems Inc. All rights reserved. FactSet Research Systems Inc. www.factset.com 4
Materials: 2nd Largest Decrease in Expected Earnings Growth, led by DowDuPont
The Materials sector has recorded the second largest decrease in expected earnings growth since the start of the quarter (to 3.1% from 24.0%). Despite the decrease in estimated earnings, this sector has witnessed an increase in price of 4.2% since June 30. Overall, 17 of the 25 companies (68%) in this sector have seen a decline in their mean EPS estimate during this time. Of these 17 companies, 5 have recorded a drop in their mean EPS estimate of more than 10%, led by CF Industries Holdings (to -$0.57 from -$0.29), and DowDuPont (to $0.47 from $0.95). The decline in the mean EPS estimates for DowDuPont has been the largest contributor to the decrease in expected earnings for this sector since June 30. On September 1, analysts converted EPS estimates from standalone Dow Chemical ($0.94) to the combined DowDuPont entity ($0.60) after the completion of the merger. On September 12, analysts lowered EPS estimates after DowDuPont provided some pro forma guidance (including hurricane impacts) for the quarter.
Index-Level (Bottom-Up) EPS Estimate: Below Average Decline to Date
Downward revisions to earnings estimates in aggregate for the third quarter to date have been below recent averages. The Q3 bottom-up EPS estimate (which is an aggregation of the earnings estimates for all 500 companies in the index and can be used as a proxy for the earnings for the index) has fallen by 2.6% (to $32.99 from $33.87) since June 30. This decline in the EPS estimate for Q3 2017 is below the trailing 5-year average (-3.5%) and the trailing 10-year average (-4.3%) for the bottom-up EPS estimate for the first two months of a quarter.
Earnings Guidance: Fewer Companies Issuing Negative EPS Guidance for Q3 than Average
The term “guidance” (or “preannouncement”) is defined as a projection or estimate for EPS provided by a company in advance of the company reporting actual results. Guidance is classified as negative if the estimate (or mid-point of a range estimates) provided by a company is lower than the mean EPS estimate the day before the guidance was issued. Guidance is classified as positive if the estimate (or mid-point of a range of estimates) provided by the company is higher than the mean EPS estimate the day before the guidance was issued.
At this point in time, 116 companies in the index have issued EPS guidance for Q3 2017. Of these 116 companies, 73 have issued negative EPS guidance and 43 have issued positive EPS guidance. The percentage of companies issuing negative EPS guidance is 63% (73 out of 116), which is below the 5-year average of 75%.
In the Health Care sector, more companies have issued positive EPS guidance (11) than negative EPS guidance (9) to date for the third quarter.
Earnings Growth: 4.5%
The estimated (year-over-year) earnings growth rate for Q3 2017 is 4.9%. Eight sectors are expected to report year-over-year growth in earnings, led by the Energy, Information Technology, and Real Estate sectors. On the other hand, three sectors are expected to report a year-over-year decline in earnings, led by Consumer Discretionary sector.
Energy: Highest Earnings Growth on Easy Comparison to Low Year-Ago Earnings
The Energy sector is projected to report the highest (year-over-year) earnings growth of all eleven sectors at 108.7%. The unusually high growth rate for the sector is mainly due to unusually low earnings in the year-ago quarter. On a dollar-level basis, the Energy sector is predicted to report earnings of $9.5 billion in Q3 2017, compared to earnings of 4.6 billion in Q3 2016. If this sector were excluded, the estimated earnings growth rate for the remaining ten sectors would fall to 2.8% from 4.5%.
At the sub-industry level, all six sub-industries in the sector are projected to report earnings growth: Oil & Gas Exploration & Production (N/A due to year-ago loss), Oil & Gas Drilling (N/A due to year-ago loss), Oil & Gas Equipment & Services (253%), Oil & Gas Refining & Marketing, (60%), Integrated Oil & Gas (37%), and Oil & Gas Storage & Transportation (14%).

Copyright © 2017 FactSet Research Systems Inc. All rights reserved. FactSet Research Systems Inc. www.factset.com 5
Information Technology: Semiconductor Industry Leads Growth
The Information Technology sector is expected to report the second highest (year-over-year) earnings growth of all eleven sectors at 8.3%. At the industry level, four of the seven industries in this sector are predicted to report earnings growth. Only one of these four industries is projected to report double-digit earnings growth: Semiconductor & Semiconductor Equipment (29%). The Semiconductor & Semiconductor Equipment industry is also expected to be the largest contributor to earnings growth for the sector. If this industry were excluded, the estimated earnings growth rate for the Information Technology sector would fall to 3.5% from 8.3%. At the company level, Micron Technology is expected to be the largest contributor to earnings growth for the sector. The mean EPS estimate for the company for Q3 2017 is $1.82, compared to year-ago EPS of -$0.05. If Micron Technology alone were excluded, the estimated earnings growth rate for the Information Technology sector would fall to 4.6% from 8.3%.
Real Estate: Specialized REITs and Retail REITs Lead Growth
The Real Estate sector is expected to report the third highest (year-over-year) earnings (FFO) growth of all eleven sectors at 7.1%. At the sub-industry level, four of the eight sub-industries in this sector are predicted to report FFO growth. Two of these four industries are projected to report double-digit FFO growth: Specialized REITs (17%) and Retail REITs (13%).
Consumer Discretionary: General Motors Leads Decline
The Consumer Discretionary sector is expected to report the largest (year-over-year) decline in earnings for the quarter at -3.2%. At the industry level, six of the twelve industries in this sector projected to report a decline in earnings, led by the Automobiles (-23%) and Textiles, Apparel, & Luxury Goods (-20%) industries. At the company level, General Motors is expected to be the largest contributor to the earnings decline for the sector. The mean EPS estimate for the company for Q3 2017 is $1.13, compared to year-ago EPS of $1.72. If General Motors were excluded, the estimated earnings growth rate for the Consumer Discretionary sector would rise to 0.1% from -3.2%
Revenue Growth: 5.2%
The estimated (year-over-year) revenue growth rate for Q3 2017 is 5.2%. Ten sectors are expected to report year-over-year growth in revenues, led by the Energy, Materials, and Information Technology sectors. The only sector that is expected to report a decline in revenues is the Telecom Services sector.
Energy: Highest Revenue Growth
The Energy sector is expected to report the highest (year-over-year) revenue growth of all eleven sectors at 20.0%. At the sub-industry level, five of the six sub-industries in the sector are predicted to report revenue growth: Oil & Gas Equipment & Services (56%), Oil & Gas Drilling (47%), Oil & Gas Refining & Marketing (34%), Integrated Oil & Gas (11%), and Oil & Gas Storage & Transportation (8%). On the other hand, the Oil & Gas Exploration & Production (-3%) sub-industry is the only sub-industry that is expected to report a year-over-year decline in earnings.
This sector is also expected to be the largest contributor to revenue growth for the S&P 500. If the Energy sector were excluded, the estimated revenue growth rate for the index would fall to 4.0% from 5.2%.
Materials: DowDuPont Leads Growth on Easy Comparison to Standalone Revenue for Dow Chemical
The Materials sector is expected to report the second highest (year-over-year) revenue growth of all eleven sectors at 13.2%. At the industry level, all four industries in this sector are predicted to report revenue growth, led by the: Chemicals (17%) industry. At the company level, DowDuPont is expected to be the largest contributor to revenue growth for the sector. However, the mean revenue estimate for Q3 2017 ($18.0 billion) reflects the combined DowDuPont company, while the year-ago revenue actual for Q3 2016 ($12.5 billion) reflects the standalone Dow Chemical company. This apples-to-oranges comparison is the main reason DowDuPont is expected to be the key driver of revenue growth for the sector. If DowDuPont were excluded, the estimated revenue growth rate for the sector would fall to 6.8% from 13.2%.

Copyright © 2017 FactSet Research Systems Inc. All rights reserved. FactSet Research Systems Inc. www.factset.com 6
Information Technology: Internet Software & Services Leads Growth
The Information Technology sector is expected to report the third highest (year-over-year) revenue growth of all eleven sectors at 8.0%. At the industry level, five of the seven industries in this sector are predicted to report revenue growth. Three of these five industries are projected to report double-digit earnings growth: Internet Software & Services (22%), Semiconductor & Semiconductor Equipment (13%), and IT Services (11%).
Telecom Services: 2 of 4 Companies to Report Sales Decline
The Telecom Services sector is the only sector that is expected to report a (year-over-year) decline in revenues at -0.6%. Two of the four companies in the sector are projected to report a sales decline for the quarter, led by CenturyLink (-7%).
Copyright © 2017 FactSet Research Systems Inc. All rights reserved. FactSet Research Systems Inc. www.factset.com 7
Looking Ahead: Forward Estimates and Valuation
Growth Expected to Rebound to Double-Digit Levels after Q3
For the third quarter, companies are expected to report earnings growth of 4.5% and revenue growth of 5.2%. Analysts currently expect earnings to rebound to double-digit levels over the next few quarters.
For Q4 2017, analysts are projecting earnings growth of 11.2% and revenue growth of 5.7%.
For Q1 2018, analysts are projecting earnings growth of 10.3% and revenue growth of 6.2%.
For Q2 2018, analysts are projecting earnings growth of 10.2% and revenue growth of 5.9%.
For all of 2017, analysts are projecting earnings growth of 9.6% and revenue growth of 5.7%.
Valuation: Forward P/E Ratio is 17.6, above the 10-Year Average (14.1)
The forward 12-month P/E ratio is 17.6. This P/E ratio is above the 5-year average of 15.5, and above the 10-year average of 14.1. It is also above the forward 12-month P/E ratio of 17.4 recorded at the start of the third quarter (June 30). Since the start of the third quarter, the price of the index has increased by 3.0%, while the forward 12-month EPS estimate has increased by 1.6%.
At the sector level, the Energy (29.1) sector has the highest forward 12-month P/E ratio, while the Telecom Services (12.4) sector has the lowest forward 12-month P/E ratio. Nine sectors have forward 12-month P/E ratios that are above their 10-year averages, led by the Energy (29.1 vs. 18.7) sector. One sector (Telecom Services) has a forward 12-month P/E ratio that is below the 10-year average (12.4 vs. 14.2). Historical averages are not available for the Real Estate sector.
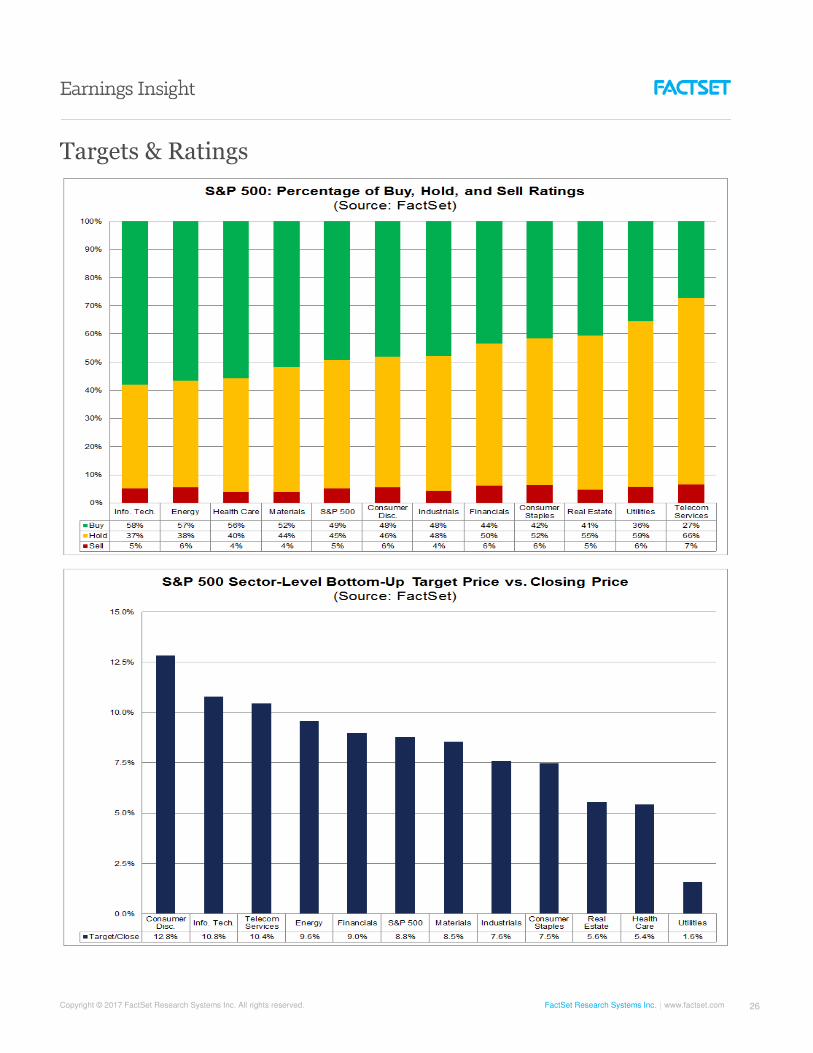
Targets & Ratings: Analysts Project 9% Increase in Price Over Next 12 Months
The bottom-up target price for the S&P 500 is 2714.66, which is 8.8% above the closing price of 2495.62. At the sector level, the Consumer Discretionary (+12.8%), Information Technology (+10.8%), and Telecom Services (+10.4%) sectors have the largest upside differences between the bottom-up target price and the closing price, while the Utilities (+1.6%) sector has the smallest upside difference between the bottom-up target price and the closing price.
Overall, there are 10,984 ratings on stocks in the S&P 500. Of these 10,984 ratings, 49.4% are Buy ratings, 45.4% are Hold ratings, and 5.2% are Sell ratings. At the sector level, the Information Technology (58%), Energy (57%), and Health Care (56%) sectors have the highest percentages of Buy ratings, while the Telecom Services (7%) sector has the highest percentage of Sell ratings.
Companies Reporting Next Week: 7
During the upcoming week, seven S&P 500 companies are scheduled to report results for the third quarter.
Copyright © 2017 FactSet Research Systems Inc. All rights reserved. FactSet Research Systems Inc. www.factset.com 8
Q2 2017: Scorecard
Copyright © 2017 FactSet Research Systems Inc. All rights reserved. FactSet Research Systems Inc. www.factset.com 9
Q2 2017: Scorecard
Copyright © 2017 FactSet Research Systems Inc. All rights reserved. FactSet Research Systems Inc. www.factset.com 10
Q2 2017: Scorecard
Copyright © 2017 FactSet Research Systems Inc. All rights reserved. FactSet Research Systems Inc. www.factset.com 11
Q2 2017: Scorecard
Copyright © 2017 FactSet Research Systems Inc. All rights reserved. FactSet Research Systems Inc. www.factset.com 12
Q2 2017: Projected EPS Surprises (Sharp Estimates)

Copyright © 2017 FactSet Research Systems Inc. All rights reserved. FactSet Research Systems Inc. www.factset.com 13
Q2 2017: Growth

Copyright © 2017 FactSet Research Systems Inc. All rights reserved. FactSet Research Systems Inc. www.factset.com 14
Q2 2017: Net Profit Margin

Copyright © 2017 FactSet Research Systems Inc. All rights reserved. FactSet Research Systems Inc. www.factset.com 15
Q3 2017: Guidance
Copyright © 2017 FactSet Research Systems Inc. All rights reserved. FactSet Research Systems Inc. www.factset.com 16
Q3 2017: EPS Revisions

Copyright © 2017 FactSet Research Systems Inc. All rights reserved. FactSet Research Systems Inc. www.factset.com 17
Q3 2017: Growth

Copyright © 2017 FactSet Research Systems Inc. All rights reserved. FactSet Research Systems Inc. www.factset.com 18
CY 2017: Growth
Copyright © 2017 FactSet Research Systems Inc. All rights reserved. FactSet Research Systems Inc. www.factset.com 19
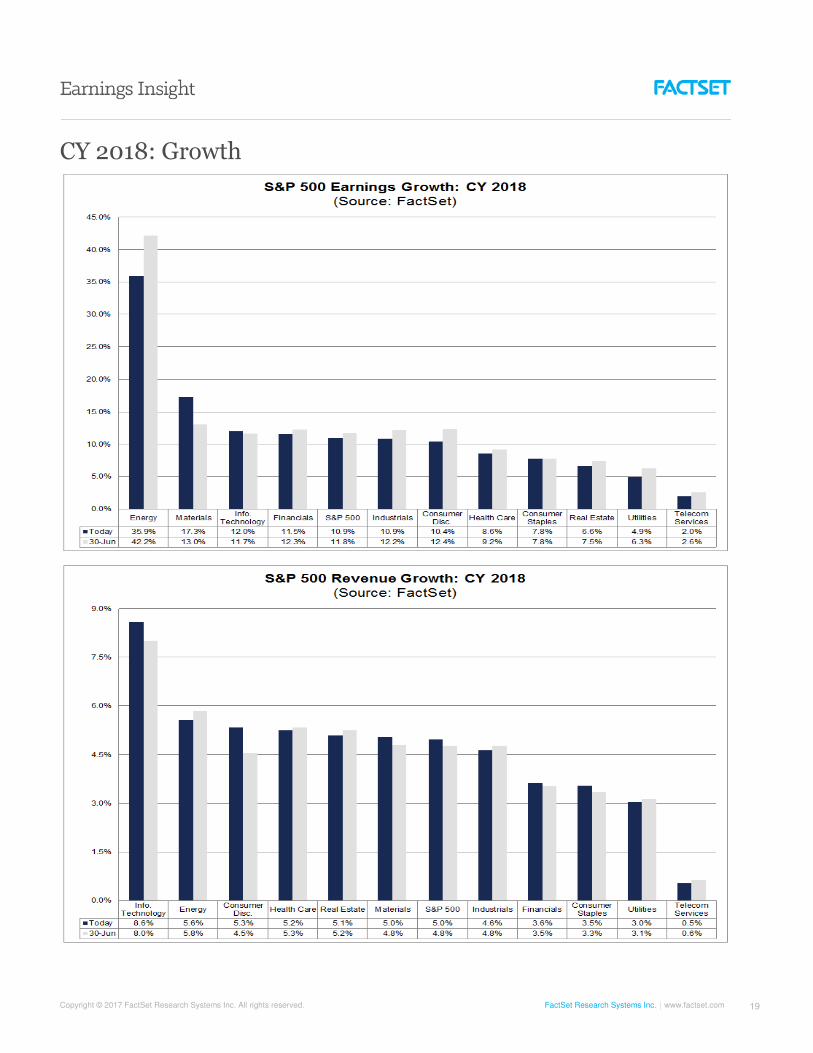
CY 2018: Growth

Copyright © 2017 FactSet Research Systems Inc. All rights reserved. FactSet Research Systems Inc. www.factset.com 20
Geographic Revenue Exposure

Copyright © 2017 FactSet Research Systems Inc. All rights reserved. FactSet Research Systems Inc. www.factset.com 21
Bottom-up EPS Estimates: Revisions
Copyright © 2017 FactSet Research Systems Inc. All rights reserved. FactSet Research Systems Inc. www.factset.com 22
Bottom-up EPS Estimates: Current & Historical

Copyright © 2017 FactSet Research Systems Inc. All rights reserved. FactSet Research Systems Inc. www.factset.com 23
Forward 12M P/E Ratio: Sector Level
Copyright © 2017 FactSet Research Systems Inc. All rights reserved. FactSet Research Systems Inc. www.factset.com 24
Forward 12M P/E Ratio: Long-Term Averages
Copyright © 2017 FactSet Research Systems Inc. All rights reserved. FactSet Research Systems Inc. www.factset.com 25
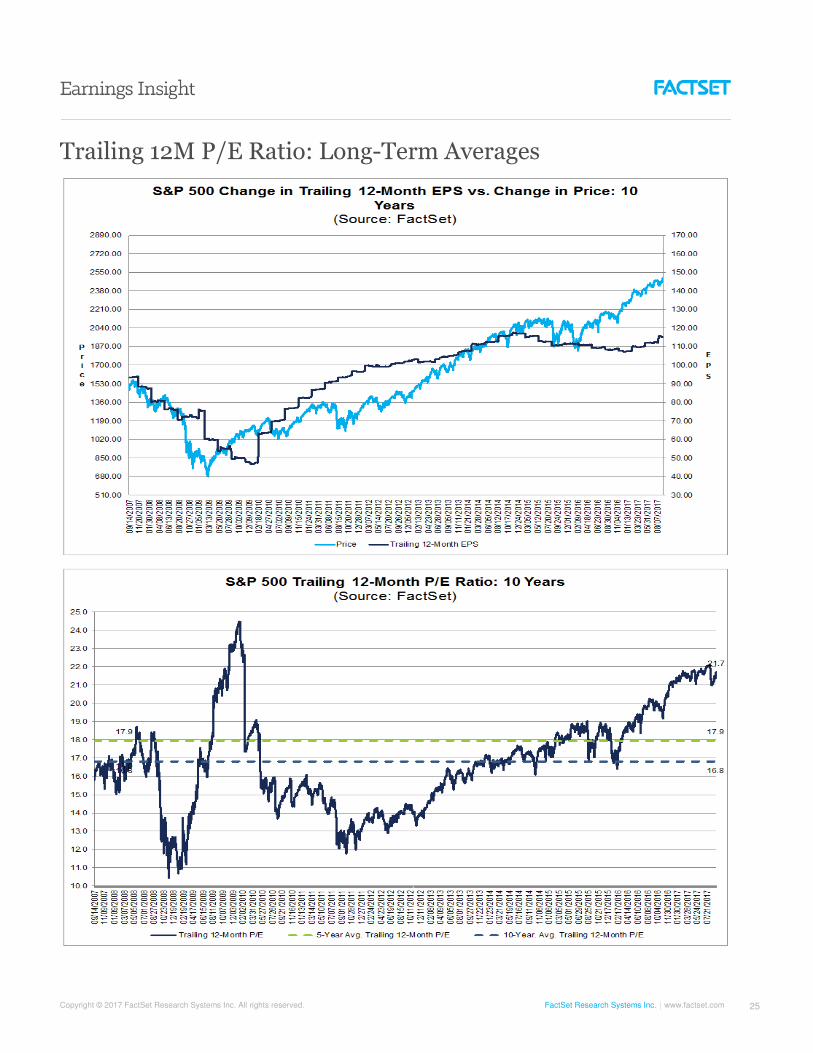
Trailing 12M P/E Ratio: Long-Term Averages
Copyright © 2017 FactSet Research Systems Inc. All rights reserved. FactSet Research Systems Inc. www.factset.com 26
Targets & Ratings

Copyright © 2017 FactSet Research Systems Inc. All rights reserved. FactSet Research Systems Inc. www.factset.com 27
Important Notice
The information contained in this report is provided “as is” and all representations, warranties, terms and conditions, oral or written, express or implied (by common law, statute or otherwise), in relation to the information are hereby excluded and disclaimed to the fullest extent permitted by law. In particular, FactSet, its affiliates and its suppliers disclaim implied warranties of merchantability and fitness for a particular purpose and make no warranty of accuracy, completeness or reliability of the information. This report is for informational purposes and does not constitute a solicitation or an offer to buy or sell any securities mentioned within it. The information in this report is not investment advice. FactSet, its affiliates and its suppliers assume no liability for any consequence relating directly or indirectly to any action or inaction taken based on the information contained in this report.
About FactSet
FactSet (NYSE:FDS | NASDAQ:FDS) delivers superior analytics, service, content, and technology to help more than 66,000 users see and seize opportunity sooner. We are committed to giving investment professionals the edge to outperform, with fresh perspectives, informed insights, and the industry-leading support of our dedicated specialists. We're proud to have been recognized with multiple awards for our analytical and data-driven solutions and repeatedly ranked as one of Fortune's 100 Best Companies to Work For and a Best Workplace in the United Kingdom and France. Subscribe to our thought leadership blog to get fresh insight delivered daily at insight.factset.com. Learn more at www.factset.com and follow on Twitter: www.twitter.com/factset.