earnings management and dividend policy: empirical
TRANSCRIPT
Earnings Management and Dividend Policy:
Empirical Evidence from Major Sectors of Pakistan Farhan Ahmed
1 Neha Advani
2 Muhammad Kashif
3
ABSTRACT
This paper means to inspect the regression between Price earning (P/E) ratio as a proxy of
earning management and payout proportion that is dividend policy. This paper utilises
multivariate analysis to examine the relationship between price-earnings ratio and dividend
policy. Using 10 years annual data from 2006-2016, this paper delivers new confirmation
demonstrating that when the return on equity is more prominent than the required rate of return,
the P/E ratio and dividend payout ratio shows a negative relationship and positive convexity or
vice versa. This study helps the corporate superintendents and stock financial experts to focus on
decreasing payout ratio than the increasing payout ratio. No past review has handled the issue of
the contingent relationship between P/E proportion and payout proportion in Pakistani Industry
and specifically on Fertilizers, Cement, Food and Oil & Gas sectors.
Keywords: Dividend Per Share, Price Earnings Ratio, Returns on Equity, Earning per share
JEL: C10, G12, G35
1 Department of Management Sciences, Shaheed Zulfikar Ali Bhutto Institute of Science & Technology (SZABIST)
2 Institute of Bankers Pakistan
3 Department of Management Sciences, Shaheed Zulfikar Ali Bhutto Institute of Science & Technology (SZABIST)
INTRODUCTION
Dividend Policy (DP) is one of the three important choices of financial management. The
selection of the firm on the basis of income level that could be paid as profit and the degree that
could be held by the firm is the concern of Dividend Policy. In short, dividend refers to profit
earned by the investor on their investment. A specific amount of profit is distributed to
shareholders of listed companies on a particular date after the closing of accounting records. As
it was, the Dividend Policy figures out what proportion of profit is to be paid to shareholders on
their investment and what amount is ploughed back in the firm itself for its reinvestment
purposes. Over the prior decades, the practices of various organisations for paying the dividends
to shareholders has changed essentially. The number of companies may not be able to adhere to
their objective for distribution of dividends and showing the earnings are particularly low in the
specific year, in this way organisations earn a higher percentage of income and paying a lesser
amount of dividend to shareholders. This will create the negative impact in the eyes of
shareholders for investing their equity in the same company or sector.
The motivation behind this review is to research the relationship between dividend policy and
earning management. In economic condition, a number of financial consultant and financial
experts are worried about profits and dividends policy of the organisations. Dividend policy is
the most questionable theme among the experts. It is talked about people that majority of
individuals which have the wrong idea about profit strategy means dividend policy and share
value relationship to expand the shareholder’s capital that is earning management mechanisms.
Dividend policy is the most discussed question in the world of business. Many of the financial
specialists are figured with expanded free factors like management strengthens, future
productivity, and proprietorship yet at the same time we can't have any predictable justification
for the experiential conduct of profit/dividend of various organisations. (Ahmed & Javed, 2009)
The level of a dividend of firm specifically reflects the variability in income rank of the
enterprises. Financing choices of Finance workforce of the organisation, for example, dividend
payout proportion can have an impact on the association's net operating income scale. Retained
Earnings of a firm portrayed the volume of financing that the firm can work without motivated
against different firms in the capital market. For the most part, the dividend is considered as the
straight method for communication to outside financial experts as well as investors about the
performance of the organisation. (Naceur, Goard, & Belanes, 2006)
It is observed that capital market and the economy of Pakistan has various fundamental
structures for investigating the changing parts of dividend policy. To begin with that the Pakistan
is moving toward advance progress, improvement and change of financial circumstances since
1980 in the world. Now a day Pakistani market discovered impressively developed rather than a
capital market in later years.
It is determined through various previous studies that due to in generous corporate control of
proprietorship structure of listed companies in Pakistan, the habitually set through the control of
single principle title holder who try to deal with a huge gathering of related firms with slight
volume of shares or bargain that outcome, which surely create conflict among the shareholders
and the proprietors. Where representing or main shareholders seize an incentive from lesser
shareholders which fit the effect of dividend policy method without any trouble.
There are a couple of variables through which organisations centre in forming their profit
approach like productivity, dedication, the devotion to the organisation and so on. In the US,
choice of top administration with respect to dividend policy is overstated by behavioural
condition and administrative (Juma & & Pacheco, 2008).They encouraged that occasionally it
happens that economically and financially stable organisations do not pay dividends on their
profits and the organisations with small development area pay dividends on the net income they
earn, either it will be the very undersized amount. They are of perspectives that the organisations,
which pay dividends, are the ones who are typically huge in size, returns, in liquidity proportion
and more concentration in innovative work as a contrast with the organisations, which frequently
pay profits.
RESEARCH PROBLEM
Firms for the most focus about whether to pay a small, large or zero rates of their profit as
dividends or to keep them for future ventures. Since the management of organisations, make an
effort to fulfil the requirements of shareholders. An organisation ought to attempt to pay profit
yet in the meantime keep up adequate held profit to abstain from raising a new fund. This study
aims to assess the impact of dividend policy on the price-earnings ratio.
RESEARCH QUESTIONS
Is decrease in payout ratio has more influence in price-earnings ratio than the increase in a
payout ratio of equal magnitude?
Is there any impact of payout dividends and earnings in the Recession and Economic
Recovery Session?
OBJECTIVES OF STUDY
To identify the distinct effect of payout proportion on dividend policy.
To concentrate the relationship amongst DP and Price earnings ratio on major areas of
Pakistan by deciding the presence of co-coordinating of size, leverage and profitability ratios
To help the financial specialists and portfolio supervisors in their basic leadership and
decision making.
JUSTIFICATION
Presently a-days financial specialists or investors require quick decision making for expanding
their profits so that is the reason this research makes less demanding for the investors to take
their choices. This Research represents four Pakistani sectors through which investors have an
extraordinary clear thought regarding firm's performance, dividend payout, their profitability and
leverage terms. By distinguishing investors point of view this research is able to provide the clear
image of the sector’s dividend policy that either they should manage those dividends or reinvest
in the same sector.
LIMITATIONS
In view of the restricted period, we orbited our parameters and work on main four sectors of
Pakistan and the information will be gathered from the website of State Bank of Pakistan. (State
Bank of Pakistan, 2017). Through this site, information is easily accessible which help us to
distinguish the impact of dividend policy on the different variables like payout ratio, Market
Capitalization, Debt to Assets and many others, in order to make a quantitative analysis on the
sectors of Pakistan. Along with time constraint, there is an issue of budget constraint as it is a
student project so it is funded less otherwise meetings will be conducted with the financial
specialist to understand the clear image of Pakistani markets
SCOPE
This study determines concrete sectors of Pakistan by examining the 10 accounting years of the
financial statements from 2006 till 2016 of the 4 sectors of Pakistan whom data is easily
accessible. All the data of 4 Sectors will be accessible from the SBP Website along with the
individual financial statements of the companies. Another source from where the data is
collected is through Thomas Reuters DataStream, which provides the data daily, monthly, or on
yearly basis.
ASSUMPTIONS
Perfect Capital Market: This hypothesis has confidence in the presence of 'flawless capital
markets'. It accepts that financial experts are balanced and rational, they have right to use free
data, there are no floatation or exchange costs and no expensive speculator to affect the market
cost of the share.
No Taxes: There is no presence of taxation. On the other hand, both profits and capital gains are
implementing on a similar rate.
Fixed Investment Policy: This implies new speculations that are financed through retained
earning do not change the risk or hazard and the rate of required return of the firm.
No Risk of Uncertainty: Every one of the financial specialists is sure about the future market
costs and the profits. This implies a similar discount rate is relevant for a wide range of stocks in
unequalled periods.
This paper is classified into different sections. The first section consists of introduction and
objectives. The second section or chapter is of review from national and international studies
under dividend policy and earning management domain. In the third section, data and
methodology have been discussed. The fourth and fifth sections of this paper consist of analysis
and major findings and conclusion and future research directions respectively.
LITERATURE REVIEW
Many of the theories analysed the relationship between corporate leverage and DP of the
organisations crosswise over parts in India on board information of 73 firms for a period 1996-
2007. The review demonstrated that there was a noteworthy effect of chose indicator factors on
profit conduct; the DP of little size, medium size and huge size firms and general corporate firms
all over in India was subject to the obligation on debt to equity ratio that is financial leverage
(Azhagaiah & Veeramuthu, 2010).
Another review looks into the concentrated the relationship between financial performance and
dividend payout among the recorded firms in Nigeria for a time of five years i.e. 2005-2010 and
found that there was a huge positive co-productive of the execution of firms and the dividend
payout; ownership structure and company’s size on profit payout of the organisations. (Uwuigbe,
J, & A, 2012)
Different observational investigations of 11signalling Asquith and Mullins (1983) have tried
hypothesis, Healy and Palepu (1988), Michaely, Thaler, and Womack (1995), DeAngelo et al
(1996) and (Stacescu, 2006) works on the same strategy. The exact outcomes of this theory are,
nevertheless, conflicting and inconsistent. To conclude, despite decades of studies, researchers
have not come to a common consensus on the rationale of dividend payment by firms. In order to
analyse and investigate the causality between price earning proportion and cost of value capital,
a review was directed by (Rahman, 2010).The specimens of 50 firms were chosen listed in KSE
that is Karachi Stock Exchange that time from the period of 2001 till 2006. The strategy they
have embraced was Fixed Effect Model and Hausman test. The outcome uncovered that there
was a negative connection between price-earnings ratio and the equity of the firm. On the other
hand, control variable MR affected a positive connection with the value of the firms. They
identify barrier that time period of study depended on just 6 years which could be upgraded
along with slacked impact can likewise be checked that ROE and Growth would be connected to
the cost of value of the firms in order to analyse the effects of the above proportions on the
overall industry rather than a single firm. (Khan & I., 2009), investigated the impacts of
budgetary proportions on stock returns by utilising 30 centre firms in the textile sector of Karachi
Stock Exchange from 2001 to 2006. In addition, for that research, the organisations were chosen
on the premise of their firm size only.
Examination of inconsistency and discrepancies connected alongside different regression and
correlation strategies, which were utilised to check the relationship among dependent and
independents factors. The outcomes discovered that stock return is free of price earning
proportion and book to market proportion. Each situation implies that there was a low rate of
progress in stock return by independent factors. The effect of firm size on stock cost amid the
income declaration was analysed by (Fan-fah, Shamsher, & Annuar., 2008).The day and age they
utilised from 1988 to 1997 from Kuala Lumpur Stock trade (KLSE). They utilised different
regression and correlation strategies. Examination of the outcome demonstrated the negative
connection between’s the size of the organisation that is market capitalization and it's procuring
which likewise shows that the strange or abnormal returns are essentially clarified by the profit
declarations. They additionally clarified that the share cost of large organisations has no less than
8 percent less valuation as contrasted and less significant firms, despite the fact that the
distinction was unimportant.
The soul of hypothesis worked by Baker and Wurgler alludes to the point financial or monetary
director’s gives shareholders that are required at the season of investing. When it’s about profits,
hypothesis alludes that fund people of organisation start profits when financial specialists
contribute nearly more share as an incentive on profits instalments as well as profits expenditures
(Baker & Wurgler, 2005)
Shareholders Patterns and Dividend Payout
Another analyst analysed the impact of a shareholding example of the Indian corporate hotels.
Information was gathered from 152 Indian firms (both listed and unlisted) in lodging industry
from the electronic corporate database called CMIE and CATALINE database. Settled impact
firm model estimation uncovered that there was a positive relationship between dividend,
earnings, debt-equity ratio, the size of sales, the age of the firm and institutional shareholding.
(Devaki & D., 2012).
There is ample of literature demonstrating P/E proportions are helpful in esteeming stocks. One
of the researchers straightforwardly demonstrates that organisations with low price to earning
proportion beat firms with a high price to earning proportion. (Basu, 1983).
(Liu, Nissim, & Thomas, 2007), find that the price to earning proportion is the most imperative
evaluating different apparatus in surveying the estimation and value of the firm, much more on
the basis of cash flows measurements or profits.
The firm is obliged to be exceptionally in decision making in settling on a choice of the
assignment of income to these two destinations that are retaining and profit distribution. When
the firm has no inconvenience in meeting its fleeting necessities for cash, the firm is usually
working for payout dividends, or else, it’s held retaining income has moreover diminished
payout and thus dividend yield for the year have continuously decreased. (Okpara & Chigozie,
2010)
It is the regular observation that there is an industry standard for distribution of dividends. Firms
simply take some unique trademark in a specific industry represents their dividend strategy. The
relationship of dividend payout designs as indicated by industry have been considered by (Chin-
Bun, 2005) in light of UK listed organisations highlighted in the FTSE. Nonetheless, he finds no
solid or strong proof that payout examples are influenced by industry. He contends that profit
arrangement is specially chosen at individual firm level.
Function of Expected Earnings Growth and Expected Rate of Return
Valuation models, for example, the Gordon Growth show and the Ohlson and Jeuttner-Nauroth
(OJ) demonstrate, recommend that the P/E proportion is a component of expected profit
development and expected the rate of return. In particular, the hypotheses anticipate that P/E
proportion is positively associated with the expected development and negatively corresponded
with an expected rate of return. A few reviews find that P/E proportion is preferably clarified by
forecasted growth than realised growth (Beaver & & Morse, 1978) (Zarowin, 1990). (Thomas &
Zhang, 2006), demonstrate that supplanting the trailing P/E proportion with the forward P/E
proportion yields comes about that is more steady with the theoretical predictions.
Effects of Dividend Policy in companies
Malaysian Companies
Zulkifli et al. (2012) in their review demonstrated the effect of dividend strategy in share cost
unpredictability and instability in development organisations of Malaysia. A specimen of 106
development and textile organisations’ and 77 construction and textile organisations for the time
of six years was chosen. Instability share value used as the dependent variable and dividend
yield. Dividend payout proportion use, development and growth, size and income as the
independent variables. Variables were utilised. The least square regression model is utilised to
translate or interpret the consequences of this review. The outcomes demonstrate that the
dividend yields have a beneficial outcome that is a positive relationship between the share price.
Indian Companies
Bawa and Kaur (2013), chose 308 firms, which have posting banner in National stock trade and
Bombay stock trade with the goal to concentrate the effect of DP on SW (Dividend Policy on
shareholders wealth). Factors viz., dividend per share (DPS), retained earnings (REPS), price
earning proportion (PER) per share market price (MPS) were considered as independent factors
and market cost per share (MPS) was considered as a dependent variable. Panel data
methodology was connected to concentrate the effect of DP on market estimation of value. The
outcomes demonstrated that over the longer period of time, shareholders’ abundance of profit
paying IT firms had been expanded fundamentally when contrasted with the expansion in SW of
nonprofit paying IT firms. (Bawa & Kaur, 2013)
Nigerian Companies
Chidinma et al. (2013), in their review titled “Shareholders’ value and firms’ along with profit
arrangement, utilised secondary information of 216 open restricted firms recorded on Nigerian
stock trade for the time period of 11 years from 2000-2011. Per-share dividend (DPS) was
considered as reaction variable, while income per share (EPS) and market cost per share (MPS)
were considered as independent factors. The review found that dividend per share and market
cost per share had a noteworthy effect on SW; a high-profit payout builds the market estimation
of shares and in this way the SW. (Chidinma, Okaro, & Pius, 2013)
Sri Lanka Companies
(Kumaresan, 2014), in his review concentrated on main ten firms in Sri Lanka amid the period of
5 years from 2008 to 2012. Shareholders’ wealth or earning per share (EPS) was considered as
reaction variable which is generally known as dependent factors while independent factors were
profit for value (ROE), profit payout proportion (DPR), profit per share (DPS) and maintenance
proportion (RR). The researchers utilized connection by correlation and regression models to
evaluate and analyze information, and found that there was a positive connection between return
on equity (ROE), dividend per share (DPS) and profit payout proportion (DPO) and
shareholder’s wealth (SW) of the chose firms under hotels and travel areas in Sri Lanka; and
ultimately there was a negative connection between retention ration and wealth of the
shareholders.
Reinvestment in Assets and Earning Management
The investigation of Hafeez Ahmed and Aliya Y.Javid in 2009 watches the elements of dividend
payout strategy of 320 non-monetary firms recorded in Karachi Stock Exchange (PSX, Pakistan
Stock Exchange, 2006)aid the period of 2001 until 2006. The outcomes demonstrate the non-
money related a firm of Pakistan relies on the on acquiring per share and the past per share profit
with a specific end goal to choose the future profits instalments. In addition, it is watched that the
productive firms with more steady net income can think of the cash for bigger cash flow streams
and therefore pay higher profits to shareholders. In like manner, the financial specialist’s
prediction and use affect the strategy of profit payout negatively. The market capitalization and
the size of the firm have an unfriendly impact on profit payout approach, which exhibits that
organisations put resources into their benefits or the long-term assets relative to paying profits to
the shareholders. The aftereffects of the review Ahmed and Javid demonstrates that the recorded
firms of Pakistan generally depend on the current gain instead of past-pronounced profits to
ensure their profits instalments. (Ahmed & Javid, 2009)
Dewet and Mpinda (2013) concentrated the effect of profit instalments on SW with a specimen
of 46 firms recorded on the Johannesburg Securities trade (JSE) for the period of 15 years from
1995 to 2010, which is a long time period to analyse the effect of dividends on the earning per
share. The Johansen co-combination and Granger causality test was utilised to portray the short –
run and long-run elements of the factors viz., Market per share (MPS), profit per share (EPS) and
per share dividend (DPS). The outcomes demonstrated that over the long haul, dividend per
share (DPS) was positively identified with market cost per share (MPS), while profit per share
(EPS) don’t have a noteworthy effect available on per share market price(MPS).JSE company
focuses on the reinvestment of the dividends rather pay to the shareholders this will increase the
efficiency of the company.
RESEARCH METHODOLOGY
The research is based on the positivist philosophy as it is based on the quantitative research
approach, which is deductive from general to specific by outfitting only the Pakistani Market.
The research configuration is settled on the basis of the secondary information of 4 sectors of
Pakistan gathered from the site of SBP (State Bank of Pakistan, 2017). Taking the Balance Sheet
Analysis (BSA) and the Thomas Reuters DataStream of 10 years from 2006-2016 which is
effectively and easily understandable by the financial specialists. In this way, quantitative
approach is reasonable to analyse the financial related structure of the organisations.
After chosen the sectors on the premise of earning management, which is given below:
Cement Sector, 23 companies are listed in Pakistan Stock Exchange(PSX) but due to
unavailability of data 14 companies are to be taken for further analysis.
Fertilizers Sector is now a day is very famous in the while distributing their dividends
among the shareholders. And due to availability of data, we have taken all the 7 companies
which are listed on Pakistan Stock Exchange (PSX)
Food Sector, 7 companies are taken for analysis
Oil and Gas Sector all the companies to be taken based on dividend distribution as well as
retention ratio. So, all the 4 companies are to be taken for analysis in order to find out the
effect on the overall sector.
Along with this in this research, I include the Panel Least Square model for analysis the
regression and the F-Statistics which is given below:
1 2 3 4 5 6 7 8 9( )it i t it it it it it it it it it itPE y dpr roa roe dy dte mcap eps mtb erp
Where i is the i industry, t denotes the time period in years, i is the fixed effect of industry, ty
is the fixed effect of time, 1 to 9 shows the symbol of parameters, it is simply the error term?
Other than that, there all other are independent variables, which is supportive and reassuring to
analyse the effect on the price earning of the particular sector of Pakistan.
The fixed effect controls of the industry are basically the time-invariant characteristics of the
which are not directly observed by the researchers which directly or partially influence the PE
ratio of the industry.
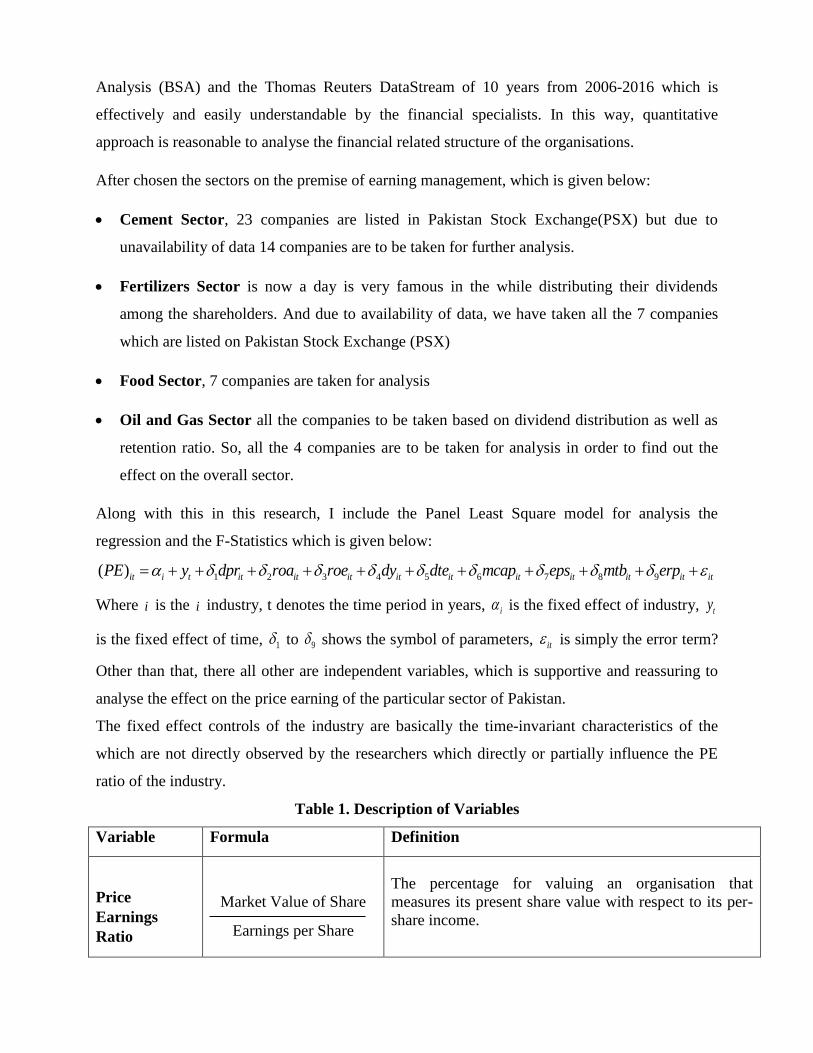
Table 1. Description of Variables
Variable Formula Definition
Price
Earnings
Ratio
Market Value of Share
Earnings per Share
The percentage for valuing an organisation that
measures its present share value with respect to its per-
share income.
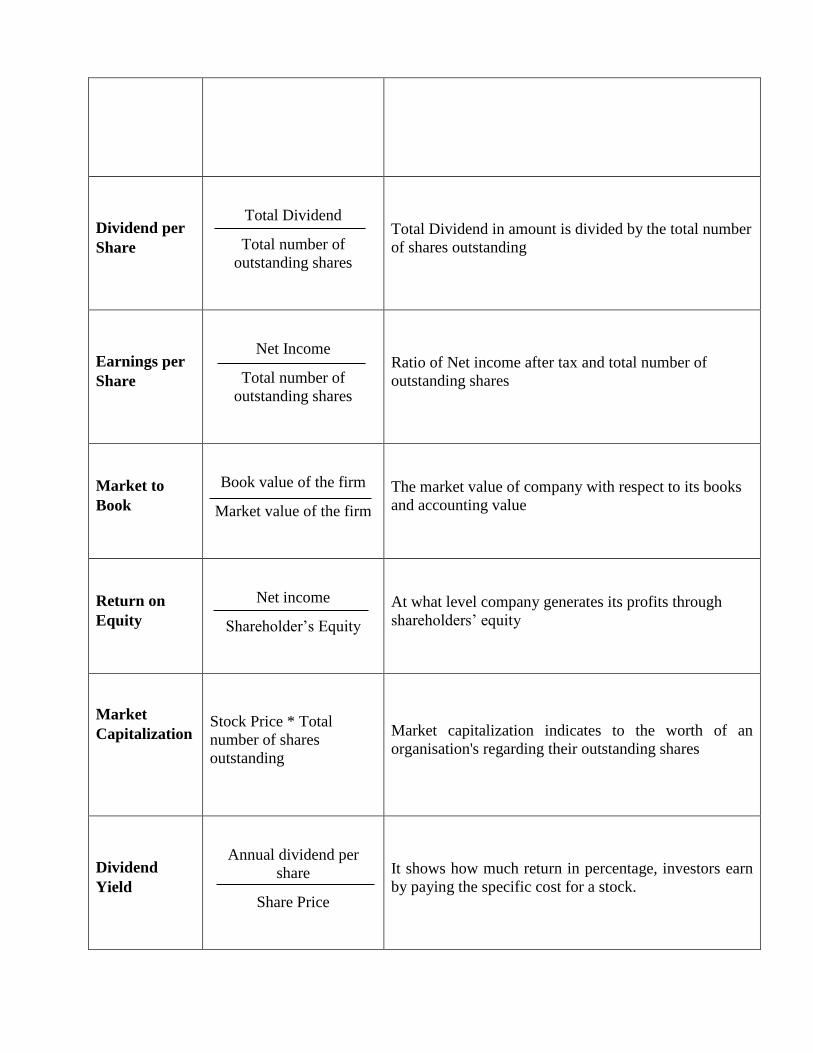
Dividend per
Share
Total Dividend
Total number of
outstanding shares
Total Dividend in amount is divided by the total number
of shares outstanding
Earnings per
Share
Net Income
Total number of
outstanding shares
Ratio of Net income after tax and total number of
outstanding shares
Market to
Book
Book value of the firm
Market value of the firm
The market value of company with respect to its books
and accounting value
Return on
Equity
Net income
Shareholder’s Equity
At what level company generates its profits through
shareholders’ equity
Market
Capitalization
Stock Price * Total
number of shares
outstanding
Market capitalization indicates to the worth of an
organisation's regarding their outstanding shares
Dividend
Yield
Annual dividend per
share
Share Price
It shows how much return in percentage, investors earn
by paying the specific cost for a stock.
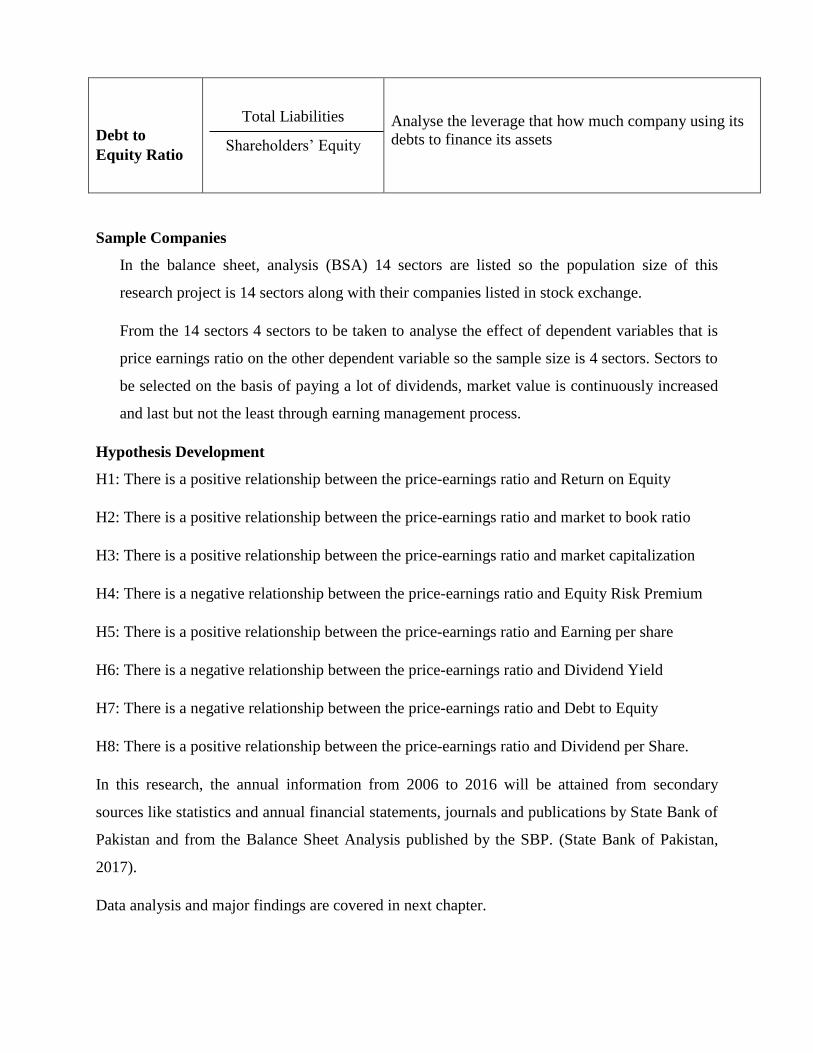
Debt to
Equity Ratio
Total Liabilities
Shareholders’ Equity
Analyse the leverage that how much company using its
debts to finance its assets
Sample Companies
In the balance sheet, analysis (BSA) 14 sectors are listed so the population size of this
research project is 14 sectors along with their companies listed in stock exchange.
From the 14 sectors 4 sectors to be taken to analyse the effect of dependent variables that is
price earnings ratio on the other dependent variable so the sample size is 4 sectors. Sectors to
be selected on the basis of paying a lot of dividends, market value is continuously increased
and last but not the least through earning management process.
Hypothesis Development
H1: There is a positive relationship between the price-earnings ratio and Return on Equity
H2: There is a positive relationship between the price-earnings ratio and market to book ratio
H3: There is a positive relationship between the price-earnings ratio and market capitalization
H4: There is a negative relationship between the price-earnings ratio and Equity Risk Premium
H5: There is a positive relationship between the price-earnings ratio and Earning per share
H6: There is a negative relationship between the price-earnings ratio and Dividend Yield
H7: There is a negative relationship between the price-earnings ratio and Debt to Equity
H8: There is a positive relationship between the price-earnings ratio and Dividend per Share.
In this research, the annual information from 2006 to 2016 will be attained from secondary
sources like statistics and annual financial statements, journals and publications by State Bank of
Pakistan and from the Balance Sheet Analysis published by the SBP. (State Bank of Pakistan,
2017).
Data analysis and major findings are covered in next chapter.
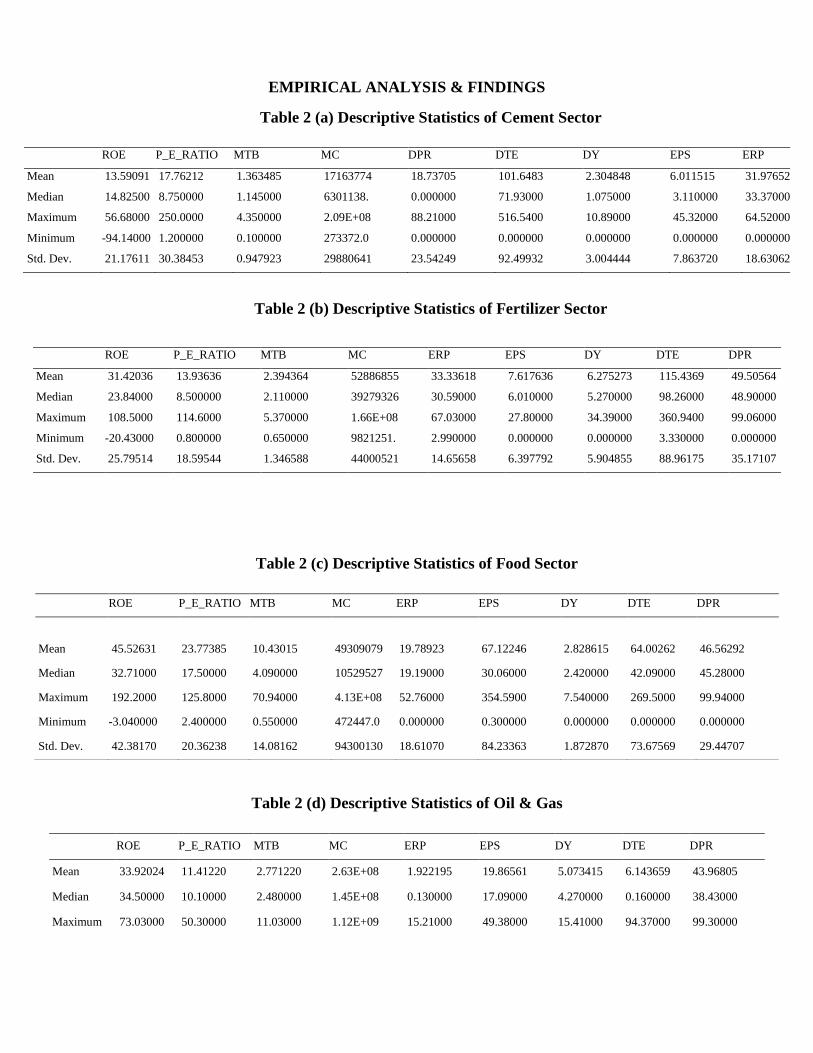
EMPIRICAL ANALYSIS & FINDINGS
Table 2 (a) Descriptive Statistics of Cement Sector
Table 2 (b) Descriptive Statistics of Fertilizer Sector
ROE P_E_RATIO MTB MC ERP EPS DY DTE DPR
Mean 31.42036 13.93636 2.394364 52886855 33.33618 7.617636 6.275273 115.4369 49.50564
Median 23.84000 8.500000 2.110000 39279326 30.59000 6.010000 5.270000 98.26000 48.90000
Maximum 108.5000 114.6000 5.370000 1.66E+08 67.03000 27.80000 34.39000 360.9400 99.06000
Minimum -20.43000 0.800000 0.650000 9821251. 2.990000 0.000000 0.000000 3.330000 0.000000
Std. Dev. 25.79514 18.59544 1.346588 44000521 14.65658 6.397792 5.904855 88.96175 35.17107
Table 2 (c) Descriptive Statistics of Food Sector
Table 2 (d) Descriptive Statistics of Oil & Gas
ROE P_E_RATIO MTB MC DPR DTE DY EPS ERP
Mean 13.59091 17.76212 1.363485 17163774 18.73705 101.6483 2.304848 6.011515 31.97652
Median 14.82500 8.750000 1.145000 6301138. 0.000000 71.93000 1.075000 3.110000 33.37000
Maximum 56.68000 250.0000 4.350000 2.09E+08 88.21000 516.5400 10.89000 45.32000 64.52000
Minimum -94.14000 1.200000 0.100000 273372.0 0.000000 0.000000 0.000000 0.000000 0.000000
Std. Dev. 21.17611 30.38453 0.947923 29880641 23.54249 92.49932 3.004444 7.863720 18.63062
ROE P_E_RATIO MTB MC ERP EPS DY DTE DPR
Mean 45.52631 23.77385 10.43015 49309079 19.78923 67.12246 2.828615 64.00262 46.56292
Median 32.71000 17.50000 4.090000 10529527 19.19000 30.06000 2.420000 42.09000 45.28000
Maximum 192.2000 125.8000 70.94000 4.13E+08 52.76000 354.5900 7.540000 269.5000 99.94000
Minimum -3.040000 2.400000 0.550000 472447.0 0.000000 0.300000 0.000000 0.000000 0.000000
Std. Dev. 42.38170 20.36238 14.08162 94300130 18.61070 84.23363 1.872870 73.67569 29.44707
ROE P_E_RATIO MTB MC ERP EPS DY DTE DPR
Mean 33.92024 11.41220 2.771220 2.63E+08 1.922195 19.86561 5.073415 6.143659 43.96805
Median 34.50000 10.10000 2.480000 1.45E+08 0.130000 17.09000 4.270000 0.160000 38.43000
Maximum 73.03000 50.30000 11.03000 1.12E+09 15.21000 49.38000 15.41000 94.37000 99.30000
The table 2a, 2b, 2c and 2d above show the descriptive statistics of the data series taken for
different sectors. After analysing 132 observations, the dependent variable (PE ratio) show an
average of 17.76 value of cement sector. Median is defining the middle value between the largest
and the smallest values. Here different variables derive different values of median which is
clearly defines in the above calculation. Maximum and the minimum in the descriptive statistics
show the maximum and minimum value of the particular data that is of 132 observations and if I
consider the dependent variable the maximum value of the price-earnings ratio is 250.0000 and a
minimum value of observation is 1.200000. Standard deviation measures the dispersion of data
that is it describes the unsystematic risk. Higher the standard deviation higher will be the
unsystematic risk. Here debt to equity ratio shows the higher unsystematic risk 92. 499. While
the other variables show lesser risk than debt to equity ratio.
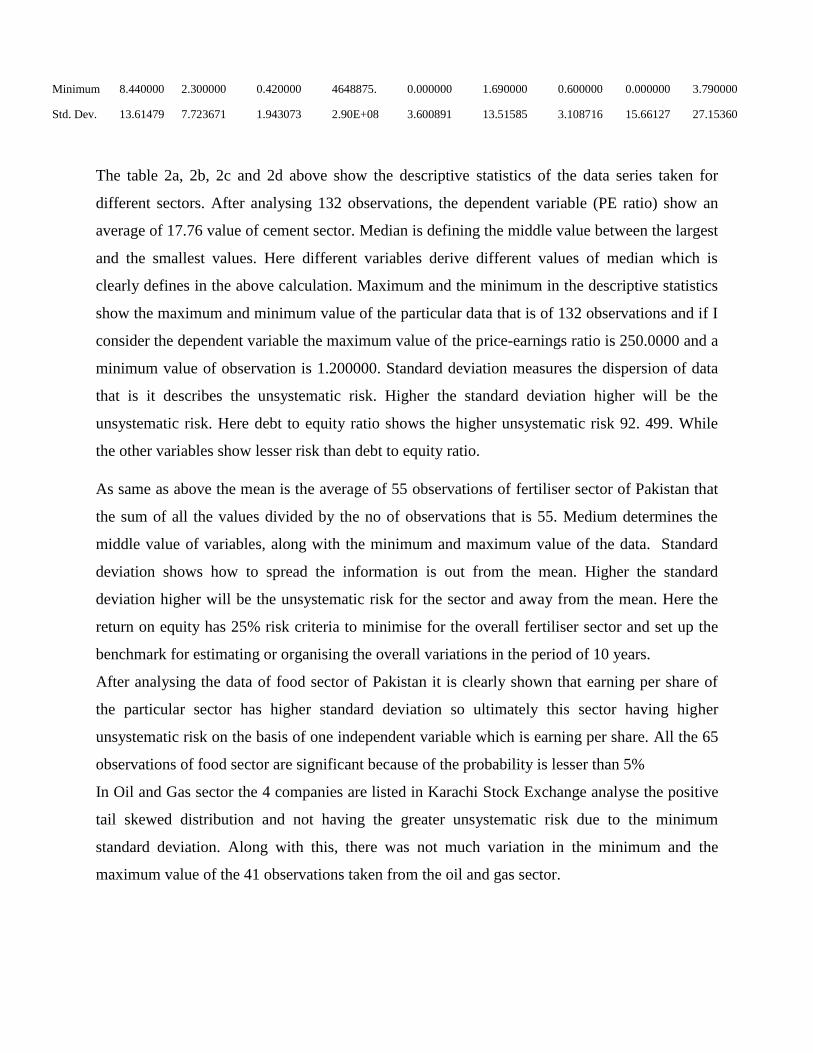
As same as above the mean is the average of 55 observations of fertiliser sector of Pakistan that
the sum of all the values divided by the no of observations that is 55. Medium determines the
middle value of variables, along with the minimum and maximum value of the data. Standard
deviation shows how to spread the information is out from the mean. Higher the standard
deviation higher will be the unsystematic risk for the sector and away from the mean. Here the
return on equity has 25% risk criteria to minimise for the overall fertiliser sector and set up the
benchmark for estimating or organising the overall variations in the period of 10 years.
After analysing the data of food sector of Pakistan it is clearly shown that earning per share of
the particular sector has higher standard deviation so ultimately this sector having higher
unsystematic risk on the basis of one independent variable which is earning per share. All the 65
observations of food sector are significant because of the probability is lesser than 5%
In Oil and Gas sector the 4 companies are listed in Karachi Stock Exchange analyse the positive
tail skewed distribution and not having the greater unsystematic risk due to the minimum
standard deviation. Along with this, there was not much variation in the minimum and the
maximum value of the 41 observations taken from the oil and gas sector.
Minimum 8.440000 2.300000 0.420000 4648875. 0.000000 1.690000 0.600000 0.000000 3.790000
Std. Dev. 13.61479 7.723671 1.943073 2.90E+08 3.600891 13.51585 3.108716 15.66127 27.15360
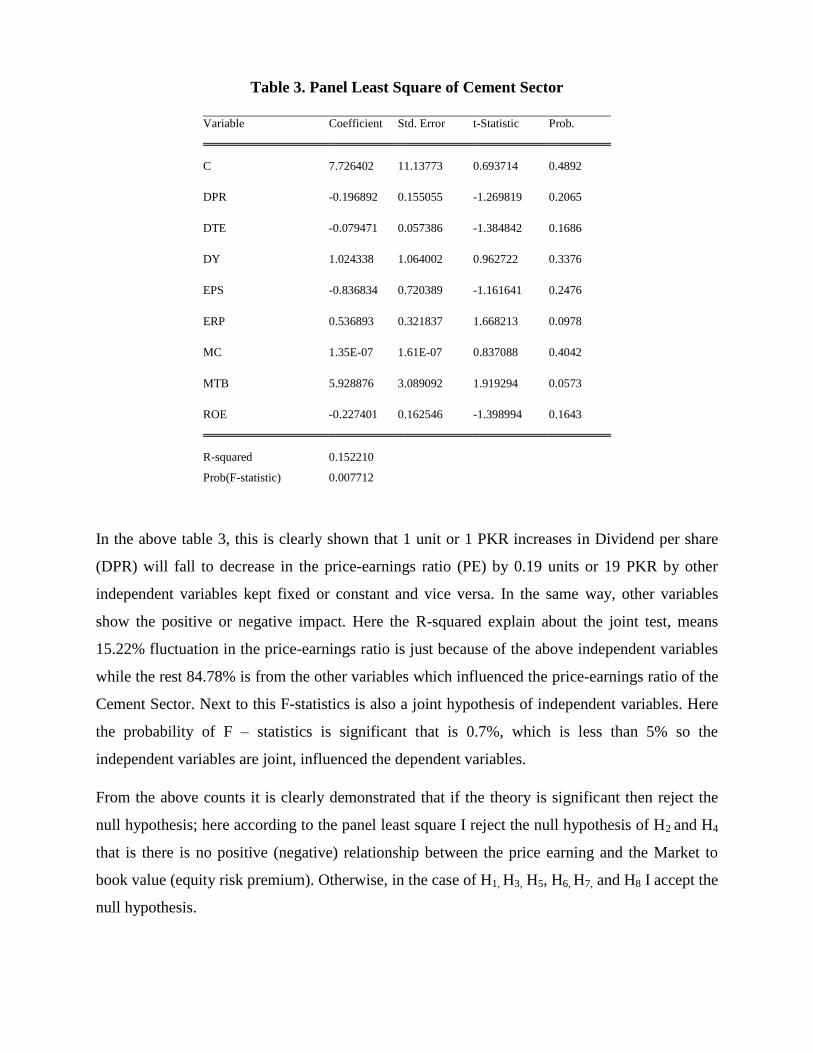
Table 3. Panel Least Square of Cement Sector
Variable Coefficient Std. Error t-Statistic Prob.
C 7.726402 11.13773 0.693714 0.4892
DPR -0.196892 0.155055 -1.269819 0.2065
DTE -0.079471 0.057386 -1.384842 0.1686
DY 1.024338 1.064002 0.962722 0.3376
EPS -0.836834 0.720389 -1.161641 0.2476
ERP 0.536893 0.321837 1.668213 0.0978
MC 1.35E-07 1.61E-07 0.837088 0.4042
MTB 5.928876 3.089092 1.919294 0.0573
ROE -0.227401 0.162546 -1.398994 0.1643
R-squared 0.152210
Prob(F-statistic) 0.007712
In the above table 3, this is clearly shown that 1 unit or 1 PKR increases in Dividend per share
(DPR) will fall to decrease in the price-earnings ratio (PE) by 0.19 units or 19 PKR by other
independent variables kept fixed or constant and vice versa. In the same way, other variables
show the positive or negative impact. Here the R-squared explain about the joint test, means
15.22% fluctuation in the price-earnings ratio is just because of the above independent variables
while the rest 84.78% is from the other variables which influenced the price-earnings ratio of the
Cement Sector. Next to this F-statistics is also a joint hypothesis of independent variables. Here
the probability of F – statistics is significant that is 0.7%, which is less than 5% so the
independent variables are joint, influenced the dependent variables.
From the above counts it is clearly demonstrated that if the theory is significant then reject the
null hypothesis; here according to the panel least square I reject the null hypothesis of H2 and H4
that is there is no positive (negative) relationship between the price earning and the Market to
book value (equity risk premium). Otherwise, in the case of H1, H3, H5, H6, H7, and H8 I accept the
null hypothesis.
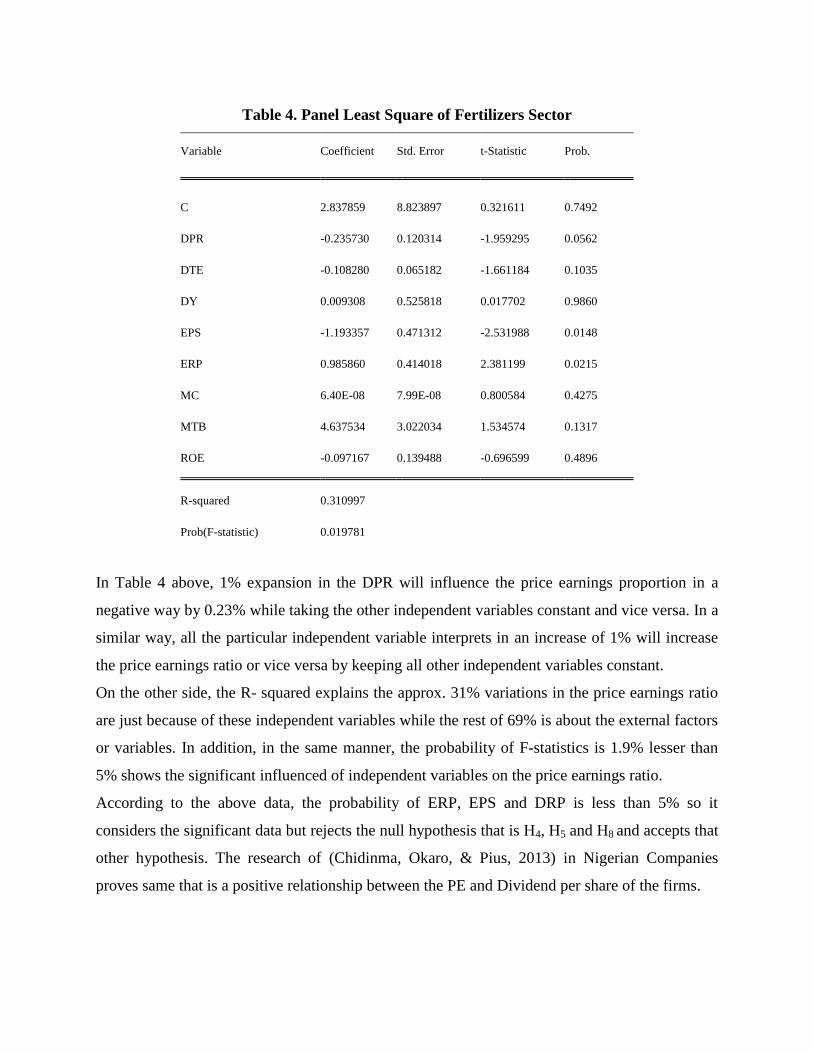
Table 4. Panel Least Square of Fertilizers Sector
Variable Coefficient Std. Error t-Statistic Prob.
C 2.837859 8.823897 0.321611 0.7492
DPR -0.235730 0.120314 -1.959295 0.0562
DTE -0.108280 0.065182 -1.661184 0.1035
DY 0.009308 0.525818 0.017702 0.9860
EPS -1.193357 0.471312 -2.531988 0.0148
ERP 0.985860 0.414018 2.381199 0.0215
MC 6.40E-08 7.99E-08 0.800584 0.4275
MTB 4.637534 3.022034 1.534574 0.1317
ROE -0.097167 0.139488 -0.696599 0.4896
R-squared 0.310997
Prob(F-statistic) 0.019781
In Table 4 above, 1% expansion in the DPR will influence the price earnings proportion in a
negative way by 0.23% while taking the other independent variables constant and vice versa. In a
similar way, all the particular independent variable interprets in an increase of 1% will increase
the price earnings ratio or vice versa by keeping all other independent variables constant.
On the other side, the R- squared explains the approx. 31% variations in the price earnings ratio
are just because of these independent variables while the rest of 69% is about the external factors
or variables. In addition, in the same manner, the probability of F-statistics is 1.9% lesser than
5% shows the significant influenced of independent variables on the price earnings ratio.
According to the above data, the probability of ERP, EPS and DRP is less than 5% so it
considers the significant data but rejects the null hypothesis that is H4, H5 and H8 and accepts that
other hypothesis. The research of (Chidinma, Okaro, & Pius, 2013) in Nigerian Companies
proves same that is a positive relationship between the PE and Dividend per share of the firms.
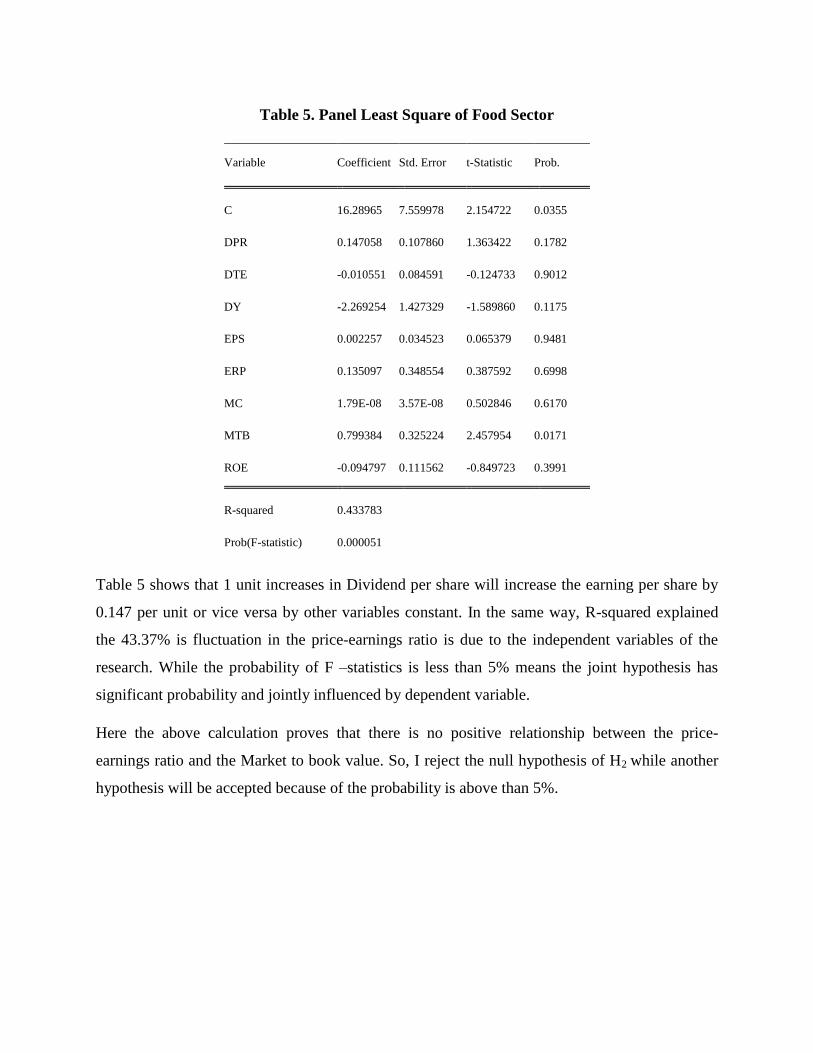
Table 5. Panel Least Square of Food Sector
Variable Coefficient Std. Error t-Statistic Prob.
C 16.28965 7.559978 2.154722 0.0355
DPR 0.147058 0.107860 1.363422 0.1782
DTE -0.010551 0.084591 -0.124733 0.9012
DY -2.269254 1.427329 -1.589860 0.1175
EPS 0.002257 0.034523 0.065379 0.9481
ERP 0.135097 0.348554 0.387592 0.6998
MC 1.79E-08 3.57E-08 0.502846 0.6170
MTB 0.799384 0.325224 2.457954 0.0171
ROE -0.094797 0.111562 -0.849723 0.3991
R-squared 0.433783
Prob(F-statistic) 0.000051
Table 5 shows that 1 unit increases in Dividend per share will increase the earning per share by
0.147 per unit or vice versa by other variables constant. In the same way, R-squared explained
the 43.37% is fluctuation in the price-earnings ratio is due to the independent variables of the
research. While the probability of F –statistics is less than 5% means the joint hypothesis has
significant probability and jointly influenced by dependent variable.
Here the above calculation proves that there is no positive relationship between the price-
earnings ratio and the Market to book value. So, I reject the null hypothesis of H2 while another
hypothesis will be accepted because of the probability is above than 5%.
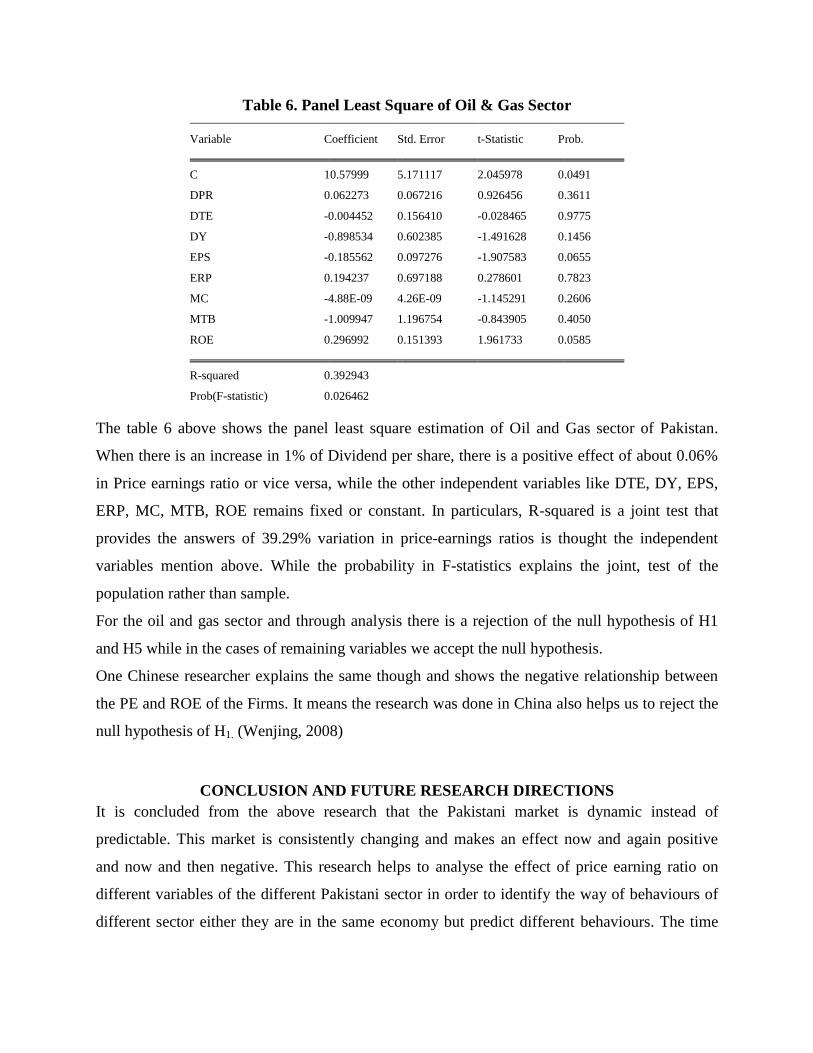
Table 6. Panel Least Square of Oil & Gas Sector
Variable Coefficient Std. Error t-Statistic Prob.
C 10.57999 5.171117 2.045978 0.0491
DPR 0.062273 0.067216 0.926456 0.3611
DTE -0.004452 0.156410 -0.028465 0.9775
DY -0.898534 0.602385 -1.491628 0.1456
EPS -0.185562 0.097276 -1.907583 0.0655
ERP 0.194237 0.697188 0.278601 0.7823
MC -4.88E-09 4.26E-09 -1.145291 0.2606
MTB -1.009947 1.196754 -0.843905 0.4050
ROE 0.296992 0.151393 1.961733 0.0585
R-squared 0.392943
Prob(F-statistic) 0.026462
The table 6 above shows the panel least square estimation of Oil and Gas sector of Pakistan.
When there is an increase in 1% of Dividend per share, there is a positive effect of about 0.06%
in Price earnings ratio or vice versa, while the other independent variables like DTE, DY, EPS,
ERP, MC, MTB, ROE remains fixed or constant. In particulars, R-squared is a joint test that
provides the answers of 39.29% variation in price-earnings ratios is thought the independent
variables mention above. While the probability in F-statistics explains the joint, test of the
population rather than sample.
For the oil and gas sector and through analysis there is a rejection of the null hypothesis of H1
and H5 while in the cases of remaining variables we accept the null hypothesis.
One Chinese researcher explains the same though and shows the negative relationship between
the PE and ROE of the Firms. It means the research was done in China also helps us to reject the
null hypothesis of H1. (Wenjing, 2008)
CONCLUSION AND FUTURE RESEARCH DIRECTIONS
It is concluded from the above research that the Pakistani market is dynamic instead of
predictable. This market is consistently changing and makes an effect now and again positive
and now and then negative. This research helps to analyse the effect of price earning ratio on
different variables of the different Pakistani sector in order to identify the way of behaviours of
different sector either they are in the same economy but predict different behaviours. The time
frame of 10 years will surely help the investors or the financial supporter to makes their decision
in short time frame rather receive the dividends or to reinvest for the in the particular stocks for
future benefits. That if one of the sectors doesn’t show this model best fitted then it should be
like that other sectors will also reject the panel least square model but it not like that because of
the dynamic structure of Pakistani Market. In the end, it is clearly shown that every sector has a
different mindset or we can say the different proportion to analyse or identify the price earning
on different independent variables.
Forthcoming or the expected researchers can scrutinise ranges such as in spite of taking 4 sectors
to analyse the earning management they easily work on the all the sectors sideways with their
companies listed in the Pakistan Stock Exchange. Along with this, this research could be for the
other countries as well whose has the same cultural activities as if the Pakistan has. This will
create the number of opportunities for the researchers that either the cultural values or mindsets
of the population effect the earning management in the organisations and for overall sectors.
REFERENCES A. M. (2007). Determinants of capital structure of banks in Ghana: An empirical approach. Baltic Journal
Of Management, 67-79.
Ahmed, H., & Javed, A. J. (2009). The Determinants of Dividend Policy in Pakistan. International
Research Journal of Finance & Economics, 29 110-125.
Azhagaiah, & Veeramuthu. (2010). Predictor variables on the dividend. predictor variables on the
dividend.
Baker, M., & Wurgler, J. (2004). A catering theory of dividends. The Journal of Finance, 59(3), 1125-
1165.
Basu, S. (1983). The relationship between earnings' yield, market value and return for NYSE common
stocks: Further evidence. Journal of financial economics, 12(1), 129-156.
Bawa, S. K., & Kaur, P. (2013). The impact of Dividend Policy on Shareholder's Wealth: An Empirical
Analysis of Indian Information Technology Sector. Asia-Pacific Finance and Accounting Review, 1(3),
17.
Beaver, W., & & Morse, D. (1978). What determines Price Earning Ratio. Financial Analyst Journal, 65-
76.
Bradley, M., Jarrell, G. A., & Kim, E. (1984). On the existence of an optimal capital structure: Theory
and evidence. The Journal of Finance, 39(3), 857-878.
Cen, L., Wei, J., & Zhang, J. (2006). Forecasted earnings per share and the cross-section of expected
stock returns. Working Paper, Hong Kong University of Science & Technology.
Chidinma, O., Okaro, S. C., & Pius, V. C. (2013). Shareholders value and firms dividend policy:
Evidence from public firms in Nigeria. Research Journal of Management Science, 2(12), 26-28.
Devaki, S., & Kamalaveni, D. (2012). Shareholding patterns and dividend payout: An empirical analysis
in Indian corporate hotels. International Journal of Multidisciplinary Research, 2(1), 49-63.
Fan-Fah, C., Mohd, S., & Nasir, A. (2008). Earnings announcements: The impact of firm size on share
prices. Journal of Money, Investment and Banking, 3, 36-46.
Juma'h, A. H., & Pacheco, C. J. O. (2008). The financial factors influencing cash dividend policy: A
sample of US manufacturing companies. Inter Metro Business Journal, 4(2), 23-43.
Khan, & I., M. (2009). Price Earnings Ratio and Market to Book Ratio. IUB Journal of Social Sciences
and Humanities, 7 (2)
Khan, W., Naz, A., Khan, M., Khan, Q. W., & Ahmad, S. (2013). The impact of capital structure and
financial performance on stock returns: a case of Pakistan textile industry. Middle-East Journal of
Scientific Research, 16(2), 289-295.
Kumaresan, S. (2014). Impact of Dividend Policy on Share Holders’ Wealth. International Journal of
Technological Exploration and Learning, 3(1), 349-352.
Ling, F. S., Abdull Mutalip, M. L., Shahrin, A. R., & Othman, M. S. (2007). Dividend policy: evidence
from public listed companies in Malaysia.
Liu, J., Nissim, D., & Thomas, J. (2007). Is cash flow king in valuations?. Financial Analysts Journal,
63(2), 56-68.
Mostafa, W. (2017). The impact of earnings management on the value relevance of earnings. Empirical
evidence from Egypt ", Managerial Auditing Journal, 32 (1) 50 - 74.
Myers, S. C. (1984). The capital structure puzzle. Journal of finance, 575-592.
Naceur, S. B., Goared, M., & Belanes, A. (2006). Determinants & Dynamics of Dividend Policy.
International Review of Finance , 6(2) 1-23.
Okpara, G., & Chigozie. (2010). A Diagnosis of the Determinants of Dividend Payout Policy in Nigeria.
A Factor Analytical Approach American journal of scientific research, 57-67.
Rahman, R. A. (2010). Institutional investors and earnings management: Malaysian evidence. Accounting
Research Institute and Faculty of Accountancy, Universiti Teknologi MARA, Shah Alam, Malaysia, 8,
110-127.
Saeed, M. M., Gull, A. A., & Rashed, M. Y. (February 2013). The Impact of Capital Structure on
Banking. INTERDISCIPLINARY JOURNAL OF CONTEMPORARY RESEARCH IN BUSINESS.
Salman, M. (2013). Effect of dividend policy on shareholders’ wealth: A study of the sugar industry in
Pakistan. Global Journal of Management and Business Research Finance, 13(7):47-54.
Schreiner, A., & & Spremann, K. (2007). Multiples and their valuation accuracy in European equity
markets. Retrieved from the University of St. Gallen. Retrieved:
http://papers.ssrn.com/sol3/papers.cfm?abstract_id=957352
Stacescu, B. (2006). Dividend Policy in Switzerland. Journal of Economic Literature, 1-44.
Tahir, A., & Raja, N. (2014). The impact of dividend policy on shareholders’ wealth. International
Journal of Business and Management, 16 (1): 24-33.
Thomas, J., & Zhang, H. (2006). Another look at E/P ratio. Yale school of Management.
Tse, C. B. (2005). Use dividends to signal or not: an examination of the UK dividend payout patterns.
Managerial Finance, 31(4), 12-33.
Uwuigbe, U., J, J., & A, A. (2012). Dividend policy and firm performance.A study of listed firms in
Nigeria. Accounting and Management Information System, 442-54.
Wenjing, H. (2008). PRICE-EARNINGS RATIO AND INFLUENCE FACTORS: EVIDENCE FROM
CHINA. Accounting and Finance.
Wu, W. (2013). The forward E/P ratio and earnings growth. Retrieved February 2017, from University
of Massachusetts Boston.: http://papers.ssrn.com/sol3/papers.cfm?abstract_id=1014177
Zarowin, P. (1990). What Determines Price Earning Ratio. Journal of Accounting, Auditing and Finance,
439-454.