earnings management and seasoned private equity …...japanese private placement issuers regarding...
TRANSCRIPT
UN!Vr::RSITY OF HAWAI'I LIBRARY
EARNINGS MANAGEMENT AND SEASONED PRIVATE EQUITY
PLACEMENTS: EVIDENCE FROM U.S. AND JAPANESE ISSUERS
cS\03
A DISSERTATION SUBMITTED TO THE GRADUATE DIVISION OF THE UNIVERSITY OF HAWAI'I IN PARTIAL FULFILLMENT OF THE
REQUIREMENTS FOR THE DEGREE OF
DOCTOR OF PHILOSOPHY
IN
INTERNATIONAL MANAGEMENT
AUGUST 2008
By Daoping He
Dissertation Committee:
David Yang, Chairperson Liming Guan Jenny Teruya Wei Huang
PingSun Leung

We certifY that we have read this dissertation and that, in our opinion, it is satisfactory in scope and quality as a dissertation for the degree of Doctor of Philosophy in International Management.
DlSSERTA nON COMMITTEE
ii

ACKNOWLEDGMENTS
I wish to thank all members of my dissertation committee including Dr. David
Yang, Dr. Liming Guan, Dr. PingSun Leung, Dr. Jenny Teruya, and Dr. Wei Huang for
their great help and support. I would like to add a special thanks to Dr. David Yang, my
committee chair, and Dr. Liming Guan for their guidance and patience through this
academic journey.
I wish to thank many faculty and staff members of Shidler College of Business
and my fellow Ph.D. students for their encouragement and support.
I wish to thank my parents for their love, support, and encouragement. I am
especially grateful to my wife and children. Without their love, sacrifices, and support, I
would never have had this achievement.
111
------
ABSTRACT
Seasoned private equity placement is an important vehicle by which public firms
obtain equity financing. This study seeks to accomplish three goals regarding the
issuance of private placements: (1) to investigate managers' earnings manipulation
behavior of U.S. issuers around the time of the issuance; (2) to examine whether such
earnings manipulation behavior helps explain the long-term post-issue stock
underperformance; and (3) to provide further evidence from Japanese private placement
issuers regarding the pattern of earnings management around the time of issuance and the
extent to which it can explain the post-issue stock underperformance. The results show
that managers of U.S. private placement issuers tend to engage in income-increasing
earnings management around the time of the issuance and the income-increasing
accounting accruals made at the time of private placements predict the post-issue stock
underperformance. The study also finds that, similar to their U.S. counterparts, Japanese
managers tend to report inflated earnings around the time of private placements issuance
and the earnings management by Japanese private placement issuers in the year of
issuance predicts the firm's post-issue stock underperformance.
IV

TABLE OF CONTENTS
Acknowledgments ............................................................................... iii
Abstract .......................................................................................... iv
List of Tables ....................................................................................... vii
List of Figures .................................................................................. viii
List of Abbreviations .......................................................................... ix
Chapter 1: Introduction....................................................................... 1
Chapter 2: Background and Literature Review........................................... 8
2.1 Public offerings and private placements............................................. 8
2.2 Issuing puzzle.. ............. ............... ..... ............. ........................... 9
2.3 Earnings management around seasoned public offerings ......................... II
2.4 Market reaction to private placement announcements ............................. 12
2.5 The monitoring role of institutional investors ...................................... 13
2.6 Recent findings on private placements .............................................. 14
2.7 International perspective .............................................................. 16
Chapter 3: Hypotheses Development ...................................................... 19
3.1 Earnings management around the issuance of private placements .............. 19
3.1.1 U.S. issuers ..................................................................... 19
3.1.2 Japanese issuers ............................................................... 21
3.2 Earnings management and post-issue stock underperformance .................. 23
Chapter 4: Sample and Methodology ...................................................... 25
4.1 Sample ................................................................................... 25
4.2 Methodology ............................................................................ 27
4.2.1 Timing of earnings management ............................................ 27
4.2.2 Proxy for earnings management. ............................................ 30
4.2.3 Measures of post-issue stock performance ................................. 34
4.2.4 Test of hypotheses ............................................................ 35
Chapter 5: Empirical Results ............................................................... 37
5.1 Earnings management around the issuance of private placements .............. 37
v
5.1.1 U.S. findings ................................................................... 37
5.1.2 Japanese findings .............................................................. 38
5.2 Earnings management and post-issue stock perfonnance ........................ 39
5.2.1 U.S. findings ................................................................... 39
5.2.2 Japanese findings .............................................................. 42
5.3 Comparison between U.S. and Japanese issuers ................................... 44
Chapter 6: Sensitivity Analysis ............................................................. 48
Chapter 7: Conclusion ........................................................................ 53
Appendix A: New U.S. Seasoned Security Issues of Corp. by Types of Offerings .. 56
Appendix B: Tables ........................................................................... 57
Appendix C: Fignres .......................................................................... 71
Endnotes ....................................................................................... 75
References ..................................................................................... 76
VI

LIST OF TABLES
I. Summary of U.S. private placements sample size and gross proceeds ......... 57
2. Summary of Japanese private placements sample size and gross proceeds ... 58
3. Discretionary accruals for U.s. issuing firms versus control firms ............. 60
4. Discretionary accruals for Japanese issuing firms versus control firms ........ 61
5. Post-issue stock returns for extreme discretionary accruals quartiles: U.S. issuers ............................................................................. 62
6. Regressions of post-issue stock performance on discretionary accruals in year -1 and control variables for U.s. issuers ................................... 63
7. Post-issue stock returns for extreme discretionary accruals quartiles: Japanese issuers ........................................................................ 64
8. Regressions of post-issue stock performance on discretionary accruals in year 0 and control variables for Japanese issuers ............................... 65
9. Logistic analysis of private placement decision ................................... 66
10. Discretionary accruals for U.S. private placement firms versus control firms - propensity score matching ......................................... 67
11. Regressions of post-issue stock performance on discretionary accruals in year -I and controls for U.S. issuers - propensity score matching ............. 68
12. Discretionary accruals for Japanese private placement firms versus control firms - propensity score matching ......................................... 69
13. Regressions of post-issue stock performance on discretionary accruals in year 0 and controls for Japanese issuers - propensity score matching ......... 70
Vll
LIST OF FIGURES
Figure Page
I. Discretionary accruals for U.S. issuing firms and control firms ................ 71
2. Discretionary accruals for Japanese issuing firms and control firms ........... 72
3. Abnormal returns classified by discretionary accruals around issue year quartiles for U.S. issuers .............................................................. 73
4. Abnormal returns classified by discretionary accruals around issue year quartiles for Japanese issuers ......................................................... 74
viii

AMEX
CEO
CRSP
DA
GAAP
IPO
NASDAQ
NDA
NYSE
PACAP
ROA
SEC
SEO
SIC
TA
LIST OF ABBREVIATIONS
American Stock Exchange
Chief Executive Officer
Center for Research in Security Prices
Discretionary Accruals
Generally Accepted Accounting Principles
Initial Public Offerings
National Association of Securities Dealers Automated Quotation
Nondiscretionary Accruals
New York Stock Exchange
Pacific-Basin Capital Markets Database
Return on Assets
Security and Exchange Commission
Seasoned Public Offerings
Standard Industrial Classification
Total Accruals
IX
CHAPTERl INTRODUCTION
This study seeks to accomplish three goals regarding the issuance of private
placements of common equity (hereafter, private placements): (1) to investigate
managers' earnings manipulation behavior of U.S. issuers around the time of the
issuance; (2) to examine whether such earnings manipulation behavior helps explain the
long-term post-issue stock underperformance; and (3) to provide further evidence from
Japanese private placement issuers regarding the pattern of earnings management around
the time of issuance and the extent to which it can explain the post-issue stock
underperformance.
Private placements, together with seasoned public offerings of common equity
(SEQ), are two important vehicles by which public firms obtain equity financing.
Contrary to seasoned public offerings of common equity, which issue new equity to the
general public, private placement issuers sell new equity to a restricted number of
investors. More than 30 percent of seasoned equity financing from external investors in
recent years has come from private placements (Federal Reserve Bulletin, see Appendix
A). While there is a sizeable body of literature on earnings management around the time
of seasoned public offerings and on the issuers' post-issue stock underperformance,
research on these issues related to private placements is scarce.
Studies on earnings management constitute an important research stream in the
literature about the quality of earnings. Typical research methodology on earnings
management first identifies a firm-specific event around which managers' incentives to
engage in opportunistic earnings manipulation appear to be strong, then employs various
1

accrual models to test the researchers' earnings management hypotheses (Healy and
Wahlen 1999). In response to the call of Dechow and Skinner (2000) for further research
on earnings management incentives around the time of securities issuance, this study
examines, among other things, earnings management around the time of private
placement, an important corporate event.
Earnings have been widely used by investors to assess firm value and security
offerings provide a direct incentive to manipUlate earnings (Dechow and Skinner 2000).
Managers of an issuing firm could use the accounting methods allowed under generally
accepted accounting principles (GAAP) to inflate reported earnings at the time of the
issuance in an attempt to portray a rosy picture of the firm's prospects. To the extent that
such income-increasing accounting choices are not detected by investors, managers may
obtain more favorable terms when selling new shares, thus gaining direct monetary
benefits for themselves and the firm. Existing literature provides an abundance of
evidence of earnings management around the time of various types of security issues,
particularly initial public offerings (Aharony et al. 1993; Friedlan 1994; Teoh et al.
1998a; DuCharme et al. 2001), seasoned public equity offerings (Teoh et al. 1998b;
Rangan 1998), convertible bond issues (Margetis 2004), and stock-for-stock mergers
(Erickson and Wang 1999). Since private placement is one of the most important sources
of corporate financing, this study predicts that managers of the issuing firms have strong
economic incentives to inflate reported earnings around the time securities are issued.
This study finds that managers of U.S. private placement issuers tend to engage in
income-increasing earnings management around the time of the issuance. The mean and
2
median of the discretionary accruals, the proxy for earnings management, of 348 sample
firms from 1989 to 2001 are 3.27 percent and 2.49 percent of total assets in the year prior
to the issue year. To eliminate the impact of other influencing factors, the study employs
a control sample consisting of firms matched on size and leverage in the same industry of
the issuing firms. In the year prior to the private placements, the discretionary accruals of
the issuing firms significantly exceed their non-issuing peers by 3.99 percent in mean and
1.98 percent in median.
Issuing private placements could be an endogenous choice. To mitigate this self
selection bias, the study also adopts the propensity score matching method to form the
control sample. Consistent with those of size and leverage matching, discretionary
accruals of issuing firms significantly exceed their non-issuing peers by 4.27 percent in
mean and 1.87 percent in median in the year prior to the issuance. This result suggests
that the findings on earnings management are not sensitive to alternative matching
methods in selecting the control sample.
Among various anomalies in the semi-strong form of the market efficiency
hypothesis, private placement has recently been found to be mispriced at the time of the
issuance. In particular, Hertzel et al. (2002) observe that firms conducting private
placements experience negative abnormal stock returns during the post-issue period.
They postulate that the reason for the post-issue stock underperformance is that, at the
time of the issuance, investors are over-optimistic about the issuing firms' future
performance. However, the source of the over-optimism is not identified clearly. Thus,
the second purpose of this study is to examine whether earnings management at the time
3

of private placements serves as a likely source of investor over-optimism. If investors
misinterpret the manipulated earnings around the time of private placements, the stock
price would be temporarily overvalued. However, when the inflated earnings do not
persist in the future and/or the income-increasing accruals made at the time of issuance
reverse in the subsequent periods, investors become disappointed and beat down the
stock price ofthe issuing firms. To test this projection, this study proposes that the
income-increasing accounting accruals made at the time of private placements predict the
post-issue stock underperformance.
To explore the relationship of discretionary accruals at the time of private
placement issuance with the post-issue stock performance, the sample is divided into four
groups according to the discretionary accruals made in the year prior to the issuing year.
The quartile group with the smallest discretionary accruals is called the conservative
group and the one with the largest discretionary accruals is called the aggressive group.
The study finds that the aggressive group has consistently poorer post-issue stock
performance than the conservative group. For example, the three-year post-issue market
excess return of the aggressive group lags that of the conservative group by 13 .29
percent, and the three-year post-issue abnormal return ofthe aggressive group lags that of
the conservative group by 35.23 percent. This result suggests that firms that inflate their
earnings more aggressively around the time of private placements experience poorer
stock performance subsequent to the issuance.
The study also runs regressions of the post-issue stock performance on
discretionary accruals at the time of private placements, along with control variables such
4

as size, book to market ratio, and industry dummies. Three-year market excess returns
and the abnormal returns of issuing firms are both significantly negatively correlated with
the discretionary accruals made in the year prior to the issuance. This evidence supports
the hypothesis that the discretionary accruals around the issuance of private placements
predict the post-issue stock underperformance. Thus, earnings manipulation around the
time of private placements could be a source that causes investors' over-optimism at the
time of the issuance.
The final purpose of this study is to investigate whether U.S. managers'
opportunistic behavior around private placements and their relationship with the post
issue stock underperformance also occurs in Japan. Fama and French (1998) suggest that
researchers should study issues of the same nature using data from countries other than
the U.S. to avoid data mining. With the second largest capital market in the world, the
Japanese market provides an important out-of-sample pool in which to examine how well
the findings in the U.S. market can be generalized.
The study finds that, similar to their U.S. counterparts, Japanese managers also
tend to report inflated earnings around the time of private placements issuance. The
mean and median ofthe discretionary accruals of the sample of 274 issuing firms from
1977 to 1999 are 5.82 percent and 3.43 percent of total assets in the year of issuance.
The discretionary accruals of issuing firms exceed their non-issuing peers by 6.51 percent
in mean and 3.87 percent in median. Using a different matching method, propensity
score matching, the discretionary accruals of issuing firms still exceed those of their non
issuing peers by 6.05 percent in mean and 3.78 percent in median.
5
One important difference observed in the pattern of earnings management
between U.S. issuers and Japanese issuers is the timing of earnings management. While
managers of U.S. issuers tend to inflate earnings in the year prior to private placements.
Japanese managers appear to report inflated earnings in the issuing year. A number of
reasons are offered to explain this difference.
For Japanese private placements issuers, the post-issue stock performance shows
a strong correlation with discretionary accruals made in the issuing year. Compared with
the conservative group in the three-year post-issue period, the buy-and-hold raw return
for the aggressive group is 13.09 percent lower, the buy-and-hold market excess return is
11.62 percent lower, and the buy-and-hold abnormal return is 8.21 percent lower. In the
five-year post-issue period, the raw return for the aggressive group is 18.96 percent
lower, the market excess return is 11.44 percent lower, and the abnormal return is 30.65
percent lower. The parameter of regressions of three-year and five-year post-issue stock
raw returns, market excess returns, and abnormal returns on discretionary accruals made
in the issue year are statistically significant, suggesting that the earnings management by
Japanese private plilCement issuers in the year of issuance predicts the firm's post-issue
stock underperformance.
This study makes a number of contributions to the literature. First, the study adds
evidence to the sizeable body of research on earnings management around the time of
security issuance by documenting income increasing earnings management around the
time of private placements. Therefore, it complements the findings of prior studies on
other types of security issuances. Second, the study sheds new light on the capital market
6
anomaly related to private placements. While existing literature attributes post-issue
stock underperformance to investor over-optimism at the time of the private placement,
the findings ofthis study suggest that a possible source of this over-optimism is earnings
management around the time the securities are issued. Finally, this study contributes to
the earnings management literature in an international context by identifying the pattern
of earnings management around the time of private placements and the extent to which it
can explain the post-issue stock underperformance in the world's two largest capital
markets, the U.S. and Japan.
The rest of the paper is organized as follows. Chapter 2 presents the background
literature on private placements and the hypotheses of the study are developed in Chapter
3. Chapter 4 describes the sample and methodology while Chapter 5 presents the primary
findings of the study. Sensitivity analyses are conducted in Chapter 6 and Chapter 7
concludes the study.
7

CHAPTER 2 BACKGROUND AND LITERATURE REVIEW
This chapter presents the background literature for this study. The background
literature of public offerings and private placements, the issuing puzzle, and earnings
management regarding the public offerings are presented first, followed by discussions of
related private placement literature and, finally, the relevant international literature.
2.1 Public Offerings and Private Placements
Public offerings and private placements, focusing on raising equity capital from external
investors, are two important ways for public companies to conduct seasoned equity
offerings. Both individuals and institutional investors can participate in public offerings,
which are usually conducted via a managing investment bank as the underwriter or
underwriting syndicate. U.S. companies must register the issue with the Security and
Exchange Commission (SEC) when they conduct public offerings.
Companies can avoid this costly process if they conduct equity offerings
privately. Private placements refer to the direct issuance of equity securities to a
restricted number of investors. Most private placement investors are large institutional
investors such as mutual funds and pension funds. The price of the issue is determined
by negotiation between the issuer and the investors (Ross et al. 2002; Keown et al. 2003;
Marciukaityte 200 I ).
There are several other advantages to private placements over public offerings.
First, the issuers are exempted from the registration and disclosure requirements of
various securities statutes. Second, investment dealers' fee for a private placement is
much less than that for a public offering. Third, private placements can also help firms
8

-- -----
raise capital quickly. Fourth, obtaining private placements significantly improves a
firm's ability to attract additional capital, research partners, and commercial partners
(Srivastava 1989; Folta and Janney 2004; Janney and Folta 2006).
2.2 Issuing Puzzle
Most studies on seasoned public offerings in the mid-1980s examine the stock
market reaction to the issue announcements. These studies generally document a
negative market reaction to the announcement of the issuance. On average, the two-day
abnormal stock returns on announcement of public offerings are -3.14 percent for
industrial companies and -0.75 percent for utility companies (Smith 1986), suggesting
that stock price is overvalued when firms conduct public offerings. A theory developed
by Myers and Majluf(l984) to explain this negative market reaction argues that
managers know a good deal about the company they manage, so when the company's
stock price is undervalued, managers will be less likely to issue equity to new investors
because it would let them take advantage of existing shareholders. It is more likely that
managers decide to issue new equity when the stock price is overvalued, so stock price
falls when firms announce the public offerings because it sends a signal to the market that
managers believe the company's stock is overvalued.
Loughran and Ritter (1995) conduct the first study to examine the long-run post
issue stock performance of firms that conduct public offerings. They find that after
public offerings, firms experience negative abnormal stock returns for up to five years
compared to similar size firms in the same industry which do not issue new equity.
Spiess and Affleck-Graves (1995) find similar results, so both studies conclude that
9
managers take advantage of a firm's specific information to issue equity when the firm's
stock is overvalued. This explanation was called the windows of opportunity hypothesis.
Considering the negative market reaction to the announcement of the new issues, the
underreaction hypothesis is developed to explain the poor post-issue stock performance.
The underreaction hypothesis maintains that the stock market reflects only part of the
information about the share price when new issues are announced. Daniel et al. (1998)
develop a model to explain the underreaction phenomenon from the behavioral theory
approach and conclude that investors tend to overestimate their ability to generate
information and tend to underestimate their forecast errors.
The phenomenon of poor post-issue stock performance of public offerings has its
dissenters. For example, Fama (1998) argues that the documented poor performance is
based on the assumption of efficacy of the benchmarks used. Thus, he questions the
accuracy of benchmarks and suggests that the phenomenon of poor post-issue stock
performance in public offerings is only a random variation of market efficiency. Brav et
al. (2000) and Mitchell and Stafford (2000) provide evidence to support Fama's
arguments and conclude that, once appropriate benchmarks are used to measure abnormal
retums, the magnitude of the anomalies in stock prices subsequent to public offerings
substantially decreased. On the other hand, Bayless and Jay (2003) expand the study of
Brav et al. (2000) but find that firms making public offerings consistently experience
superior performance except during the five years following the issue. Although
alternative explanations exist, the poor post-issue stock performance of public offerings is
IO

still widely believed to be an important challenge to the capital market efficiency (Hertzel
et al. 2002).
2.3 Earnings Management around Seasoned Public Offerings
Managers have incentives to manipulate earnings by choosing reporting methods
and estimates that may not accurately reflect their firms' underlying economics. They
may do this for their own benefit or for the existing shareholders' benefit. Earnings
management occurs when managers use judgment in fmancial reporting and in
structuring transactions to alter financial reports to either mislead some stakeholders
about the underlying economic performance of the company or to influence contractual
outcomes that depend on reported accounting numbers (Healy and Wahlen 1999).
Previous studies have identified a variety of earnings management incentives, including
capital market expectations and valuation, contracts written in terms of accounting
numbers, and government regulations, among others. Dechow and Skinner (2000)
propose that, since managers have become increasingly sensitive to their firms' stock
price levels and their relationship to earnings, researchers should focus more on capital
market incentives for earnings management and in particular, on the strong incentives to
beat benchmarks and boost stock prices before issuing equity.
Several studies provide consistent evidence of managers' opportunistic behavior
around the time of public offerings. Given the poor post-issue stock performance which
shows an average return of only 7 percent per year while returns for matched non-issuing
firms average 15 percent per year, it is doubtful why investors buy those issues
(Loughran and Ritter 1995). Teoh at al. (l998b) examine whether managers manipulate
11

-- -- ------- --------
reported earnings around the issuance of public offerings and whether earnings
management around the time of offerings can lead investors to be overly optimistic about
the issuer's prospects, which would explain, at least in part, the poor post issue stock
performance. They find that in the issuing year, issuers' asset scaled discretionary
current accruals exceed their performance matched industry peers by 2.9 percent. They
also find that the discretionary accruals predict the underperformance in the post-issue
stock returns. Using different samples, Rangan (1998) has similar results. Shivakumar
(2000) provides additional evidence on managers opportunistic behavior around SEOs;
however, he argues that earnings management may not be designed to mislead investors;
rather, it may reflect managers' rational response to an anticipated negative market
reaction to the offering announcement.
2.4 Market Reaction to Private Placement Announcements
Unlike firms making public offerings, firms conducting private placements
experience positive market reaction at the announcement of issuance. Wruck (1989)
documents a 4.5 percent average abnormal return during the announcement period and
Hertzel and Smith (1993) report a similar result. However, the two papers differ in their
explanations for this phenomenon. First, Wruck proposes an ownership structure
hypothesis to interpret her findings, explaining that the higher the level of ownership
concentration, the easier it is for a small group of shareholders to influence managers'
behavior to align managers' and shareholders' interests. To support this explanation,
Wruck finds that the total holdings of those investors reported in proxy statements
increase from an average of 31 percent to an average of 37 percent of the firm's voting
12

---------- ----- ---------
shares and the change in firm value at the announcement of a private placement is
strongly correlated with the resulting change in ownership concentration. Hertzel and
Smith, on the other hand, propose the information hypothesis to explain the positive
market reaction. Following Myers and Majluf's (1984) assumption, Herzel and Smith
conclude that undervalued firms will not likely issue equity publicly to avoid releasing
negative signals about the firms' value. In addition, they argue that the willingness of
private placement investors to commit funds to the issuers conveys a signal to the market
that the issuers are undervalued. To support this hypothesis, they find a correlation
between the positive abnormal returns at the announcement time and the potential
undervaluation.
2.5 The Monitoring Role of Institutional Investors
The findings of Wruck (1989) and Hertzel and Smith (1993) tend to support the
view that the involvement of large investors that purchase private placements increases
the issuer's value by providing either a monitoring role or a certification role. Many
studies document that institutional investors have an effective monitoring effect on
management behavior. Shleifer and Vishny (1986) develop a model to prove
theoretically that institutional investors can increase the monitoring role and mitigate the
free rider problem. McConnell and Servaes (1990) empirically document a significant
positive relationship between the value of the firms and the percentage share ownership
of institutional investors. Bushee (1998) finds that managers are less likely to myopically
cut R&D expenditure to reverse an earnings decline when institutional ownership is high,
implying that institutional investors, as sophisticated investors, serve a monitoring role in
13

curbing the myopic behavior. Chung et al. (2002) provide evidence that the presence of
large institutional investors prohibit managers from increasing or decreasing reported
profits in their own interest. Rajgopal et al. (2002) show that the absolute value of
discretionary accruals declines with institutional ownership, a result consistent with
managers' recognition that institutional investors are better informed than individual
investors, which reduces the perceived benefit of earnings management. In a review of
corporate governance studies, Shleifer and Vishny (1997) conclude that institutional
investors in the U.S. reduce agency cost in firms and pressure managers to improve their
true economic performance.
If the institutional investors that purchase private placements do enhance the
monitoring role and constrain managers' opportunistic behavior, different from the public
offerings, we may not find earnings management behavior around the time of private
placement issuance. However, recent findings on private placements have suggested that
most of those institutional investors involved in private placements are passive and that
they bring no more of a monitoring role than do investors in public offerings (Barclay et
al. 2005; Wu 2004). Therefore, it is still likely that managers engage in earnings
management to mislead investors at the time of private placements.
2.6 Recent Findings on Private Placements
Hertzel et al. (2002) find that, along with positive market reaction to the
announcements of issuance, public firms conducting private placements experience poor
post-issue stock performance, which is not consistent with the underreaction hypothesis
drawn from public offering studies. Under the underreaction hypothesis, the positive
14

--------------------
announcement effect should cause firms conducting private placements to experience
positive abnormal returns in the long run. Hertzel et al. conclude that investors are
overoptimistic about the prospects of firms that issue equity, publicly and privately. The
importance of this finding is that, contrary to the traditional belief, firms conducting
private placements are overvalued, possibly because investors are overoptimistic about
the monitoring role of new institutional investors.
Recent studies have challenged the anticipated monitoring effect by the
involvement of new institutional investors. Larcker et al. (2005) find that fourteen
corporate governance factors, including institutional ownership, explain only 0.6 percent
to 5.1 percent of the cross-sectional variation of a wide set of dependent variables,
including abnormal accruals. This finding suggests that institutional ownership has very
limited ability to explain managerial behavior and organizational performance. Barclay
et al. (2005) provide evidence that supports the entrenchment hypothesis, which proposes
that managers consider not only the interests of shareholders but their own interests as
well when they conduct private placements. The entrenchment hypothesis also maintains
that managers dislike being monitored (Brennan and Franks 1997; Field and Sheehan
2004), and are, therefore, likely to place the equity with passive institutional investors
who will not interfere with managerial decisions. Barclay et al. find that, after the
issuance, most private placement purchasers remain passive, that firm value declines, and
that there are few acquisitions. Wu (2004) examines the monitoring role of managers on
the choice between public offerings and private placements and finds that private
placement investors do not engage in more monitoring than public offering investors do.
15

In the absence of the monitoring roles brought by the new institutional investors,
managers may act opportunistically when they conduct private placements if there are
strong incentives for them to do so.
2.7 International Perspective
Some researchers have expanded the new issue studies to other countries. In
Japan, Kang and Stulz (\996) study the market reactions to announcement of various
equity issues and convertible debt issues. They find that, similar to the U.S. studies, the
abnormal return for the 3-day window surrounding the announcement of private
placements is 3.13 percent; however, contrary to the U.S. findings, the abnormal return
for public offerings is also positive but small at 0.45 percent. Based on this evidence,
Kang et al. (1999) examine the long-term post-issue performance of Japanese firms that
issued equity and convertible debt and find that both public offering and private
placement issuers underperform for at least five years. Their results contradict the
underreaction hypothesis derived from studies using the U.S. data. Cai and Loughran
(1998) also study Japanese firms conducting public offerings and also find
underperformance over the subsequent five-year period. Mathew (2002) reports similar
results for firms conducting public offerings in Japan and Hong Kong; however, firms in
Korea have experienced insignificant post-issue abnormal returns, suggesting that the
underperformance after public offerings does not always hold in other countries. Tan et
al. (2002) find a positive announcement effect for both right offerings and private
placements in Singapore, while Wu et al. (2005) provide evidence that tbe positive
announcement effect occurs not only with private placements but also with public
16

offerings in Hong Kong and suggest that the positive announcement effect may be
influenced by factors other than the monitoring effect, which is associated with the
changes in ownership concentration.
Several studies have also documented the issuing puzzle in European countries.
Levis (1995) finds long-run stock underperformance following public offerings for U.K.
firms; similar evidence is reported by Kabir and Poosenboom (2003) for firms in the
Netherlands and by Pastor-Llorca and Martin-Ugedo (2004) for Spanish firms. However,
Ho (2005) finds no evidence oflong-run post-issue underperformance of U.K. firms
following public offerings.
Several studies have also investigated managers' opportunistic behavior around
equity offerings in countries other than the U.S. Ching et al. (2002) investigate the right
offering firms in Hong Kong and find evidence of earnings management around the time
of the offering. They also find that right offering firms with larger boards have a higher
degree of earnings management. Yoon and Miller (2002) study 249 Korean public
offering firms and find that Korean issuers manage earnings, especially when their
operating performance has been poor. Reddy (2005) examines Indian firms conducting
seasoned public offerings and finds that the discretionary accruals are larger for issuing
firms than for non-issuing firms, although the difference is not statistically significant.
Beuselinck et al. (2005) study Belgian unlisted firms and find that they manage earnings
upward prior to receiving venture capital and that after the involvement of venture
capital, the level of earnings management declines; this suggests that the involvement of
venture capital induces higher earnings quality. Guan et al. (2005) examine Japanese
17

finns conducting seasoned public offerings and find that Japanese managers tend to
choose not to manage earnings prior to issuing but to defer managing earnings to the
post-issue period to hide post-issue poor operating perfonnance. While the empirical
results of these studies on earnings management around the time of public offerings are
generally consistent with those using the U.S. data, there is little evidence regarding
managers' opportunistic behavior around the issuance of private placements in an
international setting.
18

CHAPTER 3 HYPOTHESES DEVELOPMENT
This chapter develops the four hypotheses of the study. First, the earnings
management hypotheses for both U.S. and Japanese issues around the issuance of private
placements are developed, followed by the hypotheses on the association of earnings
management around the time ofthe issuance and the post-issue stock underperformance
for both the U.S. and Japanese issuers.
3.1 Earnings Management around the Issuance of Private Placements
3.1.1 U.S. Issuers
Earnings are among the most important measures investors use to assess a firm's
future performance (Healy and Wahlen 1999). Dechowand Skinner (2000) suggest that,
around the time of new securities issuance, managers have strong incentives to
manipulate earnings to portray a rosy picture of the firm's future performance and,
consequently, may sell the securities on more favorable terms and therefore reduce the
cost of financing. Empirical evidence on certain types of securities issue appears to
support this argument. For example, both the initial public offering issuers (Aharony et
al. 1993; Friedlan 1994; Teoh et al. 1998a; DuCharme et al. 2001) and seasoned public
equity issuers (Teoh et al. 1998b; Rangan 1998) tend to make income-increasing
accounting choices around the time of issuance in an attempt to increase the selling prices
of the new equity. In corporate stock for stock mergers, the acquiring firms manage
earnings upward in the periods prior to the merger agreement to increase their stock
prices in order to reduce the cost of buying the target firms (Erickson and Wang 1999).
Unlisted firms also tend to manipulate earnings upward prior to receiving venture capital
19

financing in order to show a better picture of their company's prospects, thereby
increasing the chances of being funded by venture capitalists (Beuselinck et al. 2005).
Similarly, firms conducting private placements may also have incentives to report
inflated earnings prior to the issuance in order to attract more investors since the
manipulated earnings may lead the investors to believe that the reported earnings could
continue into the future and therefore become overly optimistic about the issuers' future
performance. This would allow private placement issuers to boost their images and sell
their new equity on more favorable terms.
It would be pointless for managers to manipulate earnings if private placement
purchasers could see through it. However, Healy and Wahlen (1999) argue that investors
may not fully see through earnings management that is reflected in accruals; even for
underwriters, fully adjusting for accounting choices may be difficult and costly (Friedlan
1994). Since most private placement investors are institutional investors, managers'
opportunities to manage earnings around the issuance may be restrained because of the
active involvement of institutional investors (Chung et al. 2002). However, Barclay et al.
(2005) find that managers issuing private placements deliberately select passive
institutional investors, and Wu (2004) provides evidence showing that private placements
investors do not provide more monitoring roles than public investors l. Therefore, it is
likely that private placement issuers still have the opportunity to manipulate earnings
around the issuance and that such behavior may go undetected by investors.
Engaging in earnings management at the time of private placement is not without
downside risks. First, subsequent discovery of the earnings management around the time
20
of private placement may lead to lawsuits by investors if the earnings overstatement leads
to investor losses (DuCharme et al. 2004). Second, such a discovery will undoubtedly
reduce the credibility of the issuing firms' financial statements and impair their ability to
raise additional capital at favorable terms in the future. Finally, U.S. firms identified by
the Securities and Exchange Commission (SEC) as violators of GAAP will face an
increase in their future costs of capital.
Even so, because the economic benefits of reporting inflated earnings prior to
private placement are substantial, if managers do not think they are likely to be
discovered or if the costs of discovery are perceived less than the potential benefits, they
are likely to adopt the discretionary accounting choices that increase the reported
earnings around the time of private placement issuance. Therefore, the first hypothesis of
the study is:
HI: Managers of U.S. private placement issuing firms manipUlate reported earnings upward around the time of issuance.
3.1.2 Japanese Issuers
Literature documents that Japanese managers and U.S. managers have similar
objectives although the corporate governance systems are different. A seminal paper of
Kaplan (1994) studies top executive tumover and compensation, and their relation to firm
performance in the U.S. and Japanese companies. He finds that, similar to the U.S.,
Japanese management turnover and compensation are related to earnings and stock
returns and the compensation of Japanese managers are positively correlated with stock
performance and current cash flow. More importantly, the relations for the Japanese
21
- - -- -- -- -- _._-------
managers are generally economically and statistically similar to those for their U.s.
counterparts. Therefore, Japanese managers are similar to U.S. managers in their focus
on current earnings performance.
A number of studies have investigated Japanese managers' opportunistic behavior
and provided evidence that, similar to their U.S. cOlmterparts, Japanese managers also
engage in earnings management under various scenarios. Thomas et al. (2004) report
that, in addition to managing discretionary accruals, Japanese managers also manipulate
earnings using transactions with affiliated companies to avoid losses, earnings declines,
and negative forecast errors. Hermarm et aI. (2003) find that Japanese managers use
gains from the sale of fixed assets and marketable securities to manage earnings in order
to avoid reporting earnings below forecast and the previous year's earnings. Mande et al.
(2000) document that Japanese managers make myopic decisions by adjusting their
research and development allocations to smooth earnings, while Hermarm and Tatsuo
(I 996) document that Japanese managers use depreciation changes to manage earnings.
Agarwal et al. (2005) find that Japanese banks use security gains and loan loss provisions
to manage earnings, and Guan et al. (2005) provide evidence that Japanese managers
manipulate earnings around public equity offerings.
Other studies have suggested that the degree of earnings management in Japan
could be stronger than that in the U.S. Lang et al. (2004) compare the characteristics of
earnings for U.S. companies with reconciled earnings for non-U.S. companies cross
listed on the U.s. market and find that Japanese firms belong to higher level of earnings
management group than U.S. firms do. Leuz et aI. (2003) develop an aggregate measure
22

of earnings management across countries and show that the earnings management
problem is more prevalent in Japan than in the U.S., partly because of weaker investor
protection in Japan. The monitoring role of institutional investors, such as pension funds,
mutual funds, and insurance companies, has also been found to be weaker in Japan
(Gibson 1998).
Therefore, if the economic incentives to report inflated earnings are strong among
Japanese private placement issuers, it is likely that managers of the issuing firms will
engage in earnings manipulation at the time of issuance. Thus, the second hypothesis of
this study is:
H2: Managers of Japanese private placement issning firms manipulate reported earnings upward around the time of issuance.
3.2 Earnings Management and Post-Issue Stock Underperformance
Hertzel et al. (2002) recently pinpoint the long-term stock underperformance
subsequent to private placements. Relative to control firms matched by size and book to
market ratio, the mean three-year buy and hold abnormal return is -23.8 percent, which is
similar to that found for initial public offerings and seasoned public equity offerings.
Hertzel et al. argue that the post-issue stock underperfornlance is likely due to the
investors' over-optimism about the issuers' future performance around the time of private
placements, although they do not identify clearly the source of the over-optimism.
This study proposes that earnings management around the time of the issuance of
private placements is a likely source of investor over-optimism. If investors expect the
reported (but manipulated) earnings around the time of private placements to persist into
23

-------
the future, stock price will be temporarily overvalued. Then, when the income-increasing
accruals reverse in subsequent periods and the earnings trend does not persist, investors
may become disappointed and beat down the stock price. Thus, if earnings management
at the time of issuance is a source of investor over-optimism, the aggressive accounting
accruals at the time of the private placement issuance will cause post-issue stock
underperformance. Several studies examining seasoned public offerings have made a
similar prediction and found evidence supporting this prediction. For example, Teoh et
al. (1998b) and Rangan (1998) find that earnings management around the issuance of
seasoned public offerings explains a portion of the post-issue stock underperformance.
Specifically, the higher the discretionary accruals around the issuance of seasoned public
offerings, the lower the abnormal post-issue stock returns. Following this line of
reasoning, the third and fourth hypotheses are:
H3: Earnings management around the time of private placements conducted by U.S. issuers predicts post-issue stock underperformance.
H4: Earnings management around the time of private placements conducted by Japanese issuers predicts post-issue stock underperformance.
24

CHAPTER 4 SAMPLE AND METHODOLOGY
This chapter first discusses the sample selection for both U.S. and Japanese
private placement issuers, followed by descriptions of the methodology of the study. The
last part of this chapter addresses the methods used to test the hypotheses.
4.1 Sample
The initial U.S. sample of private placement issues is obtained from the New
Issues Database from Securities Data Corporation. The issuers' financial data are
obtained from Standard and Poor's Research Insight database, and stock returns from the
Center for Research in Security Prices (CRSP). The New Issues Database contains 831
private placement common stock issues from 1989 to 2001 in the New York Stock
Exchange (NYSE), the American Stock Exchange (AMEX), and the NASDAQ. To
qualify for the study sample, firms issuing private placements must have the necessary
financial data to allow a calculation of discretionary accruals in the year prior to the issue,
matching measurements, and stock returns for at least one month after the issue.
Financial and utility firms are eliminated from the sample because these firms are subject
to special regulations. In order to reduce the confounding effects on earnings
management from public equity offerings, firms conducting both public offerings and
private placements in the same year are also excluded from the sample. Iffirms issued
multiple private placements within three years, only the first issue is kept in the final
sample.
The final U.S. sample contains 348 observations. Table 1 presents the sample
size and gross proceeds by year and industry classification for the U.S. private
25

placements issues. Because the study adopts the cash flow approach to calculate
discretionary accruals for the U.S. firms, the sample starts from the year 1989? The study
also needs to test the stock performance five years after the issuance, so sample data ends
in the year 2001. Four years (1992,1993,2000, and 2001) are very active and contain
more than 25 issues each year. Chemical products, instruments and related products, and
service industries each carry more than 10 percent of the sample.
[Insert Table I about here 1
The initial sample of Japanese private placement issues is obtained from the
NEEDS Corporate Action Related Database, compiled by Nihon Keizai Shimbun Inc.
The issuer's financial and stock return data are obtained from the Pacific-Basin Capital
Markets (PACAP) database. The NEEDS database provides 542 private placement issues
from 1977 to 1999. Similar to the U.S. issues, to be included in the sample, firms issuing
private placements must have the necessary financial data to allow calculation of
discretionary accruals in the year prior to the issue, matching measurements, and at least
one month's stock returns after the issue; financial and utility firms are eliminated from
the sample, as are issuers that conduct private placements and public offerings at the
same time. If a firm conducts more than one private placement within a three-year
period, only the first issue will be included in the sample. The final Japan sample
consists of 274 issues. Table 2 reports the statistics of the sample. Two years (1977 and
1999) are very active, and each contains more than 10 percent of the sample. Machinery
and electric machinery industries each contain more than 13 percent of the sample.
[Insert Table 2 about here 1
26
4.2 Methodology
4.2.1 Timing of Earnings Management
Identifying of the timing of earnings management a priori is critical in any
earnings management study. In keeping with the earnings management research on IPOs
and SEOs, a company's annual financial statements are defined as being for the issuing
year (year 0) if the fiscal year-end of the financial statements is within 12 months after
the private placement date. Based on this definition, it is possible that the arrnual financial
statements of an issuing firm for year 0 will cover some months prior to the private
placement date because the fiscal year-end can be less than 12 months after the private
placement date. Once year 0 is defined, financial statements for other years surrounding
the private placement date (i.e., year -2, -1, + 1 and +2) can be defined accordingly.
Extant earnings management literature on IPOs and SEOs documents that
earnings management is most prominent in the year preceding the issuing year (year -I)
andlor the year of the issuing year (year 0). Several studies (Friedlan 1994; Aharony et
al. 1993; DuCharme et al. 2000) have examined earnings management prior to making
IPOs and find that IPO firms tend to inflate earnings in the year prior to the IPO (year -1).
Teoh et al. (1998a) define the issue year (year 0) as the fiscal year in which the IPO
occurs (which is the same definition this study uses) and includes both pre- and post-IPO
months, arguing that IPO firms have incentive to manipulate both pre- and immediate
post-IPO earnings. Teoh et al. (I 998b ) study earnings manipulation around the issue of
SEOs and find that discretionary current accruals for SEO firms are positive in year-l
and more prominent in year O.
27

----- --------------
While the same arguments about earnings management for IPOs and SEOs can be
made for private placements, the relative strength of these arguments and the effects of
some other factors also need to be considered in determining the timing of earnings
management by private placement issuers:
(1) Most IPO and SE~ studies maintain that earnings management made in year-l
helps to inflate stock prices and to increase the proceeds from the issuance.
(2) Since the reverse of accruals made in earlier years increases the litigation risk for
the issuers, managers have incentives to continue to manage earnings upward
after issuing securities.
(3) Prior to issuing securities, firms have strong incentive to release optimistic
earnings forecasts and to announce good news in order to boost the stock price or
investors' confidence. Ruland et al. (1990) find that firms issuing earnings
forecasts are more likely to finance externally in the subsequent three months than
are the control firms that did not issue earnings forecasts. Frankel et al. (1995)
also find that firms are more likely disclose earnings forecasts if they plan to raise
capital. When managers conduct voluntary disclosures, they tend to disclose
information favoring them or existing shareholders. For example, Aboody and
Kasznik (2000) find that CEOs opportunistically manage the timing of their
information disclosures to increase the value of their stock option awards by
delaying announcements of good news and rushing forward bad news before the
awards. Again, to reduce the risk of litigation or to increase the credibility of
managers' voluntary disclosures, the issuing firms have incentive to inflate
28

- - -- -- - -----------
earnings in the annual reports that cover the time period when the earnings
forecasts and good news are released.
(4) The ability of managers to boost earnings in consecutive years is limited by a
number of factors. First, the current accrual accounting system provides a limited
set of methods by which to manipulate earnings (Watts and Zimmerman 1986).
Second, since the balance sheet accumulates the effect of previous accounting
choices, managers' ability to manipulate earnings decreases with how much net
asset values have been already overstated on the balance sheet (Barton and Simko
2002).
(5) Since all accruals will reverse in the future, the external auditor bears a higher risk
oflitigation if income-increasing earnings management occurs in consecutive
years. Therefore, if earnings management occurs in one year, the external auditor
has incentive to curtail earnings management in the following year.
(6) The issuing firms may also face litigation and reputation damage if a large
amount of earnings management is detected by the investors, although the risk of
investor litigation is lower in Japan than in the U.S. (Leuz et al. 2003).
(7) Since private placement buyers are mostly institutional investors, the ability of
these investors, even though passive, to initiate lawsuits against the issuer, if
earnings management is detected, is likely to be greater than the ability of
investors in IPOs or SEOs to do so. This is because the free-rider problem is less
severe among the private placement buyers.
29

Thus, the timing and extent of earnings management around the time of private
placements are an empirical issue. It is possible that the issuers manage earnings upward
in both year -1 and year 0, while it is also possible that the issuers manage earnings
upward only in year -I and not in year 0, or vice versa, and that the timing of earnings
management may be different between U.S. issuers and Japanese issuers. Since this
study examines the discretionary accruals in each of the five years surrounding the
issuing year, the timing and extent of the earnings management made by U.S. issuing
firms and Japanese issuing firms will likely be captured by this time span.
4.2.2 Proxy for Earnings Management
If earnings management has occurred, it is likely that there is evidence in
measures that reflect accounting policy choices. It would be informative not only to find
evidence of earnings management, but also to identify the accounting choice or choices
that have been employed to achieve the desired earnings. However, since most
accounting choices are not observed by outsiders, researchers rely on various aggregate
measures of earnings management, assuming that methods used by managers to
manipulate earnings would be spread over a portfolio of accounting choices. Most recent
studies on earnings management have used estimations of discretionary accruals as a
measure of earnings management, so this study will adopt the same measurement as the
proxy for earnings management.
Dechow et al. (1995) assess the relative performance of five alternative
discretionary accrual models for detecting earnings management and conclude that a
modified version of the Jones (1991) model provides the most powerful tests of earnings
30

management. Further, Subramanyam (1996) finds that the cross-sectional variation of
modified Jones (1991) model provides better estimates ofthe normal accruals than the
times-series model does. Bartov et al. (2000) find that the cross-sectional modified Jones
model outperforms the time-series modified Jones model in identifYing firms with
qualified audit opinions. Therefore, this study will adopt the modified Jones (I991)
model and the cross-sectional estimation method to measure discretionary accruals.
Also, since firms' past performances could also affect the level of their accruals (Kathori
et a1. 2005), the lagged return on assets (ROA) is also included in the regressions to
estimate nondiscretionary accruals for each firm.
where:
TAt NIt
For U.S. firms, total accruals are measured using the cash flow approach:
T At = [NIt - CFOt] / At.! (1)
= total accruals = income before extraordinary items and discontinued operations (Research Insight data item #123) = cash flow from operations (Research Insight data item #308 minus data item #124)
For Japanese firms, because information about cash flow from operations is not
available3, the balance sheet approach is used to calculate total accruals. Total accruals
(TA) are measured as the change in non-cash working capital (excluding current
31

----------------------------
maturities oflong-term debt) less total depreciation expense for the current period in year
t, scaled by total assets at the end of year (-1; that is,
TA, = [ (t.CA, - t.CASH,) - (t.CLt - t.CMLTD,) - DEPt 1 / A t-l
where:
TA, t.CA, t.CASH, t.CL, I1CMLTD, DEP, A,_t
= total accruals in year t = change in current assets in year t = change in cash in year t = change in current liahilities in year t = change in current portion of long-term debt in year t = depreciation and amortization expense in year t = total assets at the end of year t- L
(2)
To calculate the discretionary accruals, the non-discretionary portion of total
accruals must be estimated_ For both countries, the expected nondiscretionary accruals
for firm i in year ( (NDAit) are measured as:
where:
I1REVil = change in revenue for firm i in year t I1RECiI = change in net receivables for firm i in year t PPEiI = gross property, plant, and equipment for firm i at the end of year t ROAt_1 = Return on average assets in year t-1 [30il, [3ht, [32i" [33i1= firm-specific parameters for firm i in year t_
In equation (3), the firm-specific parameters, /JOit, /J1it, /J2it and /J3it, are estimated
cross-sectionally using the two-digit SIC code for firmj's data 0'" i):4
Once the nondiscretionary accruals are estimated, the discretionary accruals for
firm i in year t (DAit) are calculated as the prediction error:
DAit = T Ait - NDAit (5)
32

Managers of issuing finns may have managed earnings for reasons other than
trying to induce investor optimism. Two prominent reasons relate to finns' desire to
reduce the political cost and the debt default cost (Watt and Zimmennan, 1986).
Empirically, a finn's political cost is usually proxied by finn size, and debt default cost is
proxied by the leverage of the finn. To mitigate the impact ofthese two factors on the
measurement of earnings management, this study employs a matched control sample of non-
issuers. If the discretionary accruals of the issuing finns are significantly different from
those of the non-issuing control finns in year t,5 then there is evidence of earnings
management among the issuing finns in year t and the results of earnings management of
the issuers are not likely due to incentives other than inducing investors to accept tenns
more favorable to the issuers.
For the matching procedure, one control finn is selected for each private placement
finn by matching the two-digit SIC code, total assets, and debt-to-asset ratio at the end of
year -1. The control finn should not have conducted private placements in the following
three years. Because there are two continuous variables in the matching, this study employs
the procedure proposed by Murray (1983). Thus, for each potential matched finn, the
Mahalanobis distance is calculated as:
where:
d = the distance measure of finn b from private placement finn c, Mb= a vector of matching variables for finn b, Mc= a vector of matching variables for private placement finn c, W = the covariance matrix of the cross-section of matching variables.
33
(6)

rJ is considered as a univariate measure of multidimensional differences and is
calculated for all non-issuing firms within the same two-digit SIC code as the issuing
firm. The control firm is the one that has the smallest D2. The Mahalanobis distance
approach provides a more precise matching measurement than the Euclidean distance
approach in that it considers the variance and covariance of each matching variable
(Murray 1983).
4.2.3 Measures of Post-Issue Stock Performance
Three measures of stock performance are used in this study: raw return, market
excess return, and abnormal return. All the measures are the buy-and-hold returns over a
three- or five-year period. The raw returns and market excess returns do not adjust for
firms' risk and, therefore, are biased estimates of stock performance. The purpose of
including these two measures is so they can serve as benchmarks for the abnormal
returns.
The method used to calculate the abnormal returns is similar to Hertzel et al.
(2002). Specifically, the abnormal return of an issuing firm is calculated as the difference
between the buy-and-hold raw return of the issuer and that of a matched non-issuer.
Finding the correct matching firm is critical in this process because measures oflong
term abnormal stock returns could be subject to greater measurement errors than
measures of short-term returns (Kothari and Warner 1997). Barber and Lyon (1997)
analyze the empirical power and specification of test statistics in event studies designed
to investigate long-run abnormal stock performance and conclude that the control firm
approach, in which sample firms are matched by similar size and book to market ratios of
34

industry peers, yields well specified test statistics. The matching procedure in this study
will employ the Mahalanobis distance approach using two continuous variables-firm
size and book to market ratio-for a firm within the same two-digit SIC code as the
issuer. The firm with smallest D2 in the same two-digit SIC code is the control firm for
the issuer.
4.2.4 Test of Hypotheses
With the issuing year defined as year 0, discretionary accruals of issuing firms in
years -2, -1, 0, + 1, +2 are calculated. The most important measures used to test
Hypotheses 1 and i are discretionary accruals in years -1 and 0, since discretionary
accruals for other years are not expected to be significantly different from zero. A
statistically significant positive measure of discretionary accruals in either year -lor year
o (or both) will lend support to Hypotheses 1 and 2.
Testing Hypotheses 3 and 4 involves two steps. In the first step, four portfolios of
issuers are formed based on the quartiles of discretionary accruals around the issue year;
the discretionary accruals for the year that are significantly positive are used to form the
portfolios, and the two extreme portfolios are called the aggressive (quartile 4) and the
conservative (quartile 1) private placement issuers. The abnormal returns for each
portfolio are calculated as the cumulative buy-and-hold return on sample firms less the
simple cumulative buy-and-hold return on control firms over the five-year post-issue
period. Hypotheses 3 and 4 predict that the most aggressive issuers will exhibit the most
negative post-issue abnormal returns and that the most conservative issuers will exhibit
the least negative (in terms of magnitude) post-issue abnormal returns. This first step
35
provides a view of the relationship between the earnings management around the time of
private placements and the post-issue stock performance.
Building on the results of the first step, the second step is a formal statistical test
of Hypotheses 3 and 4. Specifically, OLS regressions are run using individual issuer's
three- and five-year post-issue raw return, market access return, and abnormal return as
the dependent variable. The independent variable of primary interest to the study is the
abnormal accruals for year -lor year 0, whichever is significantly positive. The
regressions also include an industry dummy, firm size, and book to market variables as
control variables. The industry dummy accounts for post-issue stock performance across
industries and firm size and book to market variables control for firm characteristics. A
significantly negative estimate of the coefficient of the discretionary accruals variable
will lend support to Hypotheses 3 and 4. The two steps used to test the association
between discretionary accruals and post-issue stock performance are similar to those in
Teoh et al. (l998b).
The OLS regression model is specified as:
R, = /30 + /31 (DAJ + /32 (SizeJ + /33 (BtoMJ + E y (Industry _ dummiesJ + Ii, (7)
where:
R, = issuer's raw return, market excess return, or abnormal return DA, = issuer's discretionary accruals around issuance Size, = issuer's market value of equity BtoM, = book to market ratio Industry_dummies, = industry dummy variables
36

CHAPTERS EMPIRICAL RESULTS
This chapter first presents the results of the test on earnings managements around
the issuance of private placements, beginning with the findings on U.S. private
placements issues, followed by those on Japanese issues. Then the correlation between
earnings managements and post issue stock underperformance are addressed for both
U.S. and Japanese issuers. The final section compares and contrasts the results of U.S.
and Japanese issuers.
5.1 Earnings Management around the Issuance of Private Placements
This section presents the evidence of earnings management behavior around the
issuance of private. placements for both U.S. and Japanese issuers.
5.1.1 U.S. Findings
Table 3 reports five years of asset-scaled discretionary accruals around the issue
of private placements for the U.S. issuers and those for the control firms. Figure 1
depicts the mean of discretionary accruals for the U.S. issuers and the control firms over
the same period. The mean and median for year -2 are not significantly different from
zero; but for year -1, the year prior to the private placements, the discretionary accruals
of the issuing firms have a mean of 3.27 percent and a median of2.49 percent of total
assets, both of which are significantly positive. For years 0, + 1, and +2, the means and
medians are greater than zero; however, they are not statistically significant at the
37

conventional levels (except for the median for year + I, which is significant at ten percent
level).
[Insert Table 3]
[Insert Figure I]
Since managers' incentives to manage earnings could also be due to finn size and
leverage, the results from the modified Jones model should be compared with those of the
control group to draw an overall inference about earnings management around the time of
private placements. Table 3 also reports the mean and median for those control finns
over the same time period, none of which is significantly different from zero. The study
conducts pair-wise comparison tests on the differences in discretionary accruals between
private placement issuers and their control finns, and the result shows that in the year -I,
private placement issuers have significantly greater discretionary accruals in both mean
and median than their non-issue peers6, suggesting that the observed abnormally high
magnitude of earnings managements in year -I cannot be attributed to finn size, leverage
or the industry-specific categories of the sample. The comparison of the mean and
median of discretionary accruals between the issuing finns and the control finns does not
reveal any statistically significant difference in other years. Thus, the empirical results
support the first hypothesis that U.S. managers tend to manipulate earnings upward in the
year prior to the issue of private placements.
5.1.2 Japanese Findings
Table 4 reports the five-year discretionary accruals around private placement
issues for Japanese issuers and those for the control finns. For year -2, the mean and the
38

median of discretionary accruals are not significantly different from zero; however, for
the year -1, both the mean and the median of issuing firms' discretionary accruals are
significantly less than zero. Still, they are not significantly different from their control
firms, suggesting that the statistical significance from the discretionary accrual
measurement may be caused by factors other than incentives from private placement
issues. For year 0, the discretionary accruals for issuing firms have a mean of 5.82
percent and a median of 3.43 percent of total assets, and both are significantly positive.
Meanwhile, the mean and median are significantly higher than those for the control firms.
Thus, the earnings management for Japanese issuers appears to be concentrated in the
year of the issue. For the year + 1 and +2, the mean and median are not significantly
different from zero and not significantly different from those for the control firms. Thus,
the evidence shows that the level of earnings manipulation in the issue year is
significantly positive, which supports the second hypothesis.
[Insert Table 4 about here 1
[Insert Figure 2 about here 1
S.2 Earnings Management and Post-issue Stock Performance
This section discusses the relationship between earnings management around the
issue of private placements and the post-issue stock performance. The findings for U.S.
issuers are discussed first, followed by those for Japanese issuers.
S.2.1 U.S. Findings
Existing literature documents that after issuing private placements, firms
experience negative abnormal stock performance (Hertzei et aI., 2002). This study
39
examines the sample firms and finds results consistent with existing literature. The
average three-year buy-and-hold abnormal stock returns for the U.S. sample are -32.83
percent, while five-year abnormal returns are -35.09 percent. The existing literature has
postulated that the negative abnormal stock return is due to investors' over-optimism
about these issuing firms' future performance. This study argues that earnings
management around the private placement issue could be a factor in the investors' over
optimism, because the inflated earnings around the issuance could mislead investors
about the issuer's future performance. The reversal of accruals in the following years
results in a drop in the issuer's stock price. Thus, the more earnings management, the
poorer the post-issue stock performance.
To test this hypothesis, the study first classifies the U.S. issuing firms according
to the level of their discretionary accruals in year -1 to derive four portfolios. The
quartile group with the lowest discretionary accruals is called the conservative group, and
the group with the highest discretionary accruals is called the aggressive group. Buy
and-hold raw returns are developed for each portfolio, and the portfolio is rebalanced
every year. Market excess returns for each portfolio are also calculated. In addition, the
study adopts the Mahalanobis distance approach to develop a control firm for each
sample firm with a similar size and book to market ratio in the same industry. The buy
and-hold excess returns over their control firms for each portfolio are also developed as
abnormal returns.
Table 5 reports the raw returns, the market excess returns, and the abnormal
returns for the conservative and aggressive portfolio for each year over a five-year post-
40

issue period. Over the five-year period, the conservative portfolio generates 60.08
percent in raw returns while the aggressive portfolio generates 66.95 percent in raw
returns. The market excess returns for the conservative portfolio over the five-year
period are 3.81 percent and they are 5.08 percent for the aggressive portfolio. The
abnormal returns for the conservative portfolio over the period are -12.82 percent and
they are -40.82 percent for the aggressive portfolio. The three-year returns show a
similar pattern: the three-year raw return of the conservative group is 18.22 percent and
that of the aggressive group is 16.78 percent; the three-year market excess return of the
conservative group is 3.54 percent and that of the aggressive group is -9.75 percent; and
the three-year abnormal return of the conservative group is -15.98 percent and that of the
aggressive group is -51.21 percent. Figure 3 depicts the size and book-to-market value
adjusted abnormal returns for each quartile, showing that the aggressive quartile performs
more poorly than the conservative quartile and suggesting that the higher the level of
discretionary accruals prior to the private placement issuance, the poorer the post-issue
stock performance.
[Insert Table 5 about here 1
[Insert Figure 3 about here 1
The study runs OLS regressions of three-year and five-year post-issue stock raw
returns, market excess returns, and abnormal returns on discretionary accruals for year -1,
as well as on the control variables of market value, book-to-market, and industry
dummies. The regression is run at the firm level, and Table 6 reports the regression
results. The variable of most interest is the discretionary accruals in year -1. The
41
coefficient of the discretionary accruals in year -Ion the three-year market excess
returns is -0.3485 and significant at the 5% level (t = -1.96); the coefficient of
discretionary accruals in year -Ion the three-year abnormal returns is -0.4343 and also
significant at the 5% level (t = -1.83).
[Insert Table 6 about here 1
Tbus, the results in table 6 support the third hypothesis. For private placement
issuers in the U.S., the higher the discretionary accruals in year -1, the poorer the three
year post-issue market excess returns and abnormal returns. Therefore, the level of
earnings management is associated with the three-year post issue stock
underperformance, suggesting that earnings management could be a factor causing U.S.
investors' over optimism prior to the issue of private placements.
5.2.2 Japanese Findings
Consistent with existing literature, the Japanese issuers of private placements
experience poor post-issue stock performance. The average three-year abnormal return
for the whole sample is -24.60 percent and the five-year abnormal return is -29.18
percent. Similar to the analysis of the U.S. sample, the Japanese sample is also divided
into four groups based on the amount of discretionary accruals in year O. Table 7 reports
the results of the post-issue stock returns for the two extreme groups. The three-year
buy-and-hold returns of the conservative group are consistently greater than those of the
aggressive group; the three-year raw return of the conservative group is 20.38 percent and
that of the aggressive group is 7.29 percent; the three-year market excess return of the
conservative group is -7.66 percent and that of the aggressive group is -19.28 percent;
42

---- ----
and the three-year abnonnal retnrn of the conservative group is -20.33 percent and that of
the aggressive group is -28.54 percent. The five-year buy-and-hold returns show a
similar pattern: the five-year raw return of the conservative group is 51.39 percent and
that of the aggressive group is 32.43 percent; the five-year market excess return of the
conservative group is -13.14 percent and that of the aggressive group is -24.58 percent;
and the five-year abnonnal return of the conservative group is -17.12 percent and that of
the aggressive group is -47.77 percent. Figure 4 depicts sixty monthly buy-and-hold
abnonnal returns for the four portfolios after the issue of private placements and shows
that the aggressive group almost always experiences poorer abnormal post-issue stock
returns than the conservative group. The findings provide evidence that the poor post
issue stock perfonnance among the Japanese finns is associated with the level of earnings
management in the year of the private placement.
[Insert Table 7 about here]
[Insert Figure 4 about here 1
Table 8 reports the results of the regressions of post-issue stock returns on
discretionary accruals in the year private placement are issued. The results show that
three-year post-issue buy-and-hold returns are significantly associated with discretionary
accruals in year 0: the coefficient of discretionary accruals in year 0 on three-year raw
returns is -0.8679 with t = -2.16; the coefficient of discretionary accruals in year 0 on
three-year market excess returns is -0.4292 with t = -1.98; and the coefficient of
discretionary accruals in year 0 on three-year abnonnal returns is -0.4302 with t = -1.36.
[Insert Table 8 about here 1
43

The five-year post-issue buy-and-hold stock returns are also statistically
associated with discretionary accruals in year 0: the coefficient of discretionary accruals
in year 0 on five-year raw returns is -1.1033 with t = -1.89; the coefficient of
discretionary accruals in year 0 on five-year market excess returns is -0.3199 with t = -
1.30; and the coefficient of discretionary accruals in year 0 on five-year abnormal returns
is -0.6425 with t = "1.58.
The findings on Japanese private placement issuers, then, consistently support the
fourth hypothesis that earnings management around the private placements predicts post
issue stock underperformance. The higher discretionary accruals are in the issue year, the
poorer the post-issue stock performance.
5.3 Comparison between U.S. and Japanese Issuers
The analyses provide consistent evidence that, similar to firms issuing IPOs or
SEOs, both U.S. and Japanese issuers tend to inflate their earnings around the time of
private placements. The manipulated earnings could lead investors to believe that the
reported earnings may last into the future and, therefore, to become over optimistic about
the issuers' future performance. Such over confidence would allow the issuers to boost
their stock prices and sell the new equity under more favorable terms.
The study also provides evidence that the earnings manipulation around the
issuance of private placements predicts the post-issue stock underperformance for both
U.S. and Japanese issuers. Investors are temporarily fooled by the inflated earnings
around private placements and are subsequently disappointed by poor earnings
performance when manipulated accruals reverse. The higher the level of manipulated
44

earnings around the issue of private placements, the poorer the post-issue stock
performance.
There are some notable differences in the timing of earnings management
between U.S. and Japanese issuers. Managers of U.S. issuers tend to manipulate earnings
in the year prior to the issuance, while Japanese managers tend to manipulate earnings in
the year they issue the private placements. The discretionary accruals for U.S. issuers in
year -1 and 0 are, on average, positive, but the means and medians of discretionary
accruals are significantly different from zero only in year -1. Existing studies have
documented that U.S. equity issuers may become the target oflegal action when they
manipulate their earnings (DuCharme et al. 2004). Thus, managers issuing private
placements are likely to choose to manipulate earnings in the year prior to the issue,
rather than immediately before the issue in the issue year. This litigation avoidance
behavior is also found in Frankel et al. (1995) who find that forces such as legal liability
deter managers from more frequent forecasting around the time of an actual equity
offering, even though the tendency to issue management forecasts and to finance
externally are positively associated over a long period of time.
Japanese managers tend to manipulate their earnings in the issue year. Among the
five years around the issue of private placements, only in the issue year (year 0) are the
discretionary accruals significantly greater than zero. Contrary to their U.S. counterparts,
who have strong incentive to minimize the risk of litigation, Japanese firms seem to be
less hesitant to manipulate their earnings immediately around the issue of private
placements.
45
Existing literature points out that investor protection is weaker in Japan (see La
Porta et al. 2000 and Leuz et al. 2003), so managers could choose to manipulate their
earnings immediately before the issue of private placements without worrying about the
litigation risk. One way to manipulate investors' expectations about a firm's future
performance is to voluntarily disclose the (inflated) earnings forecast before the issue of
private placements.) Consequently, issuing firms are more likely to make income
increasing accounting decisions to meet these earnings predictions when they prepare
financial statements at the end of issue year (Kasznik 1999).8
Another way to mislead investors when private placements are issued is to
manipulate interim earnings if the issuer reports interim financial statements prior to the
issuance. Japanese publicly traded firms are required to report semiannual interim
financial statements and annual statements. Fearing loss of reputation, managers are less
likely to let these manipulated interim earnings reverse immediately after a semiannual
report, so the manipulated semiannual interim earnings are likely to be reflected on the
annual earnings in the issue year.
Another difference between U.S. and Japanese issuers is that earnings
management around the time of private placements for Japanese issuers predicts a longer
post-issue stock underperformance. Both three-year and five-year post-issue stock
returns are significantly negatively associated with discretionary accruals in year 0 for
Japanese issuers, whereas only three-year stock returns are significantly associated with
discretionary accruals in year -I and combined discretionary accruals for U.S. firms.
46

This phenomenon shows that the influence on U.S. finns' long-tenn stock perfonnance
might be more complicated.
47

CHAPTER 6 SENSITIVITY ANALYSIS
The selection of control firms is crucial in many empirical studies. To test the
first and second hypotheses, a control firm for each private placement-issuing firm is
chosen to mitigate the influence of factors such as industry, size, and leverage. The
discretionary accruals of private placement firms are significantly greater than those of
control firms, so the detected earnings management is not due to factors other than the
private placement. To test the third and forth hypotheses, control firms are also
developed for the calculation of the issuers' post-issue abnormal returns. Compared to
raw returns and market excess returns, abnormal returns are a more accurate measure of
stock performance in that they mitigate some systematic and firm specific factors that can
influence the stock returns.
Empirical studies have used a variety of matching methods to derive the control
firms. When two or more continuous variables are used in the matching, many studies
have adopted the Euclidean distance approach and have chosen the firm with the closest
Euclidean distance to the experimental firm as its control firm. Murray (1983) is the first
to apply the Mahalanobis distance approach to accounting and finance empirical research.
The Mahalanobis distance approach, as used in this study, improves the Euclidean
distance approach by considering the variance and covariance of these control variables
when calculating the distance and, thus, provides more accurate matching. However, the
application of the Mahalanobis distance approach is seldom used in accounting and
finance studies.
48
An alternative matching approach, the propensity score matching approach that
structures non-experimental data to look like experimental data, has gained popularity in
economics research in recent years. Rosenbaum and Rubin (1983) advocate the use of
propensity scores, which measure the probability that firms receive treatment, to reduce
the dimensionality of the matching. By matching on the scalar variable, sample firms
could be matched with the nearest non-treated firms having a similar treatment condition
on covariates. Since the propensity score matching method is a significant improvement
in matching techniques, it becomes a rapid growing method in accounting and corporate
finance as a sensitivity analysis to address self-selection issues (Li and Prabhala 2007).
The sensitivity analysis conducted in this study uses ofthe propensity score
matching method to select the control sample. A logistic regression is processed to
calculate propensity scores for the sample firms and the potential control firms.
Following existing literature, the independent variables include trading system, industry,
issue year, firm size, leverage, book to market ratio, sales, return on assets, and research
and development expenses (Spiess and Affleck-Graves 1995, Schultz 2003, Mclaughlin
et al. 1996, Loughran and Ritter 1997, and Jung et al. 1996). The propensity scores, the
probability that a firm may conduct private placements, are derived after the regression.
The logistic regression results are shown in Table 9. Due to lack of research and
development expense data for Japanese firms, Japanese model does not include this
variable.
[Insert Table 9 about here 1
49

Overall, the logistic model for U.S. firms reports a 70 percent accuracy for the
issuing firms and a 75 percent accuracy for non-issuing firms, while the logistic model
for Japanese firms reports a 76 percent accuracy for the issuing firms and a 77 percent
accuracy for non-issuing firms. To be qualified into the pool of non-issuing firms, a firm
must have necessary data to calculate discretionary accruals and stock returns. Once the
propensity score is calculated for each firm, the control sample can be derived. A non
issuing firm with the nearest neighbor of propensity score in the same industry is chosen
as the control firm for each issuing firm.
The annual discretionary accruals for the five-year period surrounding the issue
year are calculated for the control firm for each U.S. private placement issuer. Table 10
reports the five year discretionary accruals for the issuers and their control firms. Similar
to the results from using the Mahalanobis distance matching to select the control sample,
the mean and median of discretionary accruals in year -I of the sample firms are both
significantly greater than those oftheir control firms9. There is no significant difference
in discretionary accruals between the issuing firms and control firms for years -2, 0, and
+ 1. Although year +2's the mean of discretionary accruals for sample firms is
significantly and marginally greater than that for the control firms, the median is not
significantly different between the two groups. Thus, the results are consistent with the
Mahalanobis distance approach, suggesting that the empirical results in Chapter 5 in
support of the first hypothesis are not sensitive to alternative matching procedures in
selecting the control sample.
[Insert Table 10 about here]
50

-- ---------------
Raw returns are derived for the control firms and five years post-issue abnormal
returns are developed as buy-and-hold excess returns over these control firms. Table 11
reports the results of the regression of post-issue stock performance on discretionary
accruals for year _1. 10 The coefficient of discretionary accruals in year -Ion tbree-year
abnormal returns is -0.5082 and is significant at the 10 percent level. The results are
qualitatively the same as those from the Mahalanobis distance approach in selecting the
control sample, suggesting that the findings on the association between post-issue stock
performance and earnings management around the time of private placements are not
sensitive to alternative matching methods.
[Insert Table 11 about here]
The sensitivity analysis also provides results similar to the Mahalanobis distance
approach for Japanese firms. Table 12 reports the discretionary accruals for Japanese
issuing firms, their control firms, and the difference. The discretionary accruals in year 0
for the issuing firms are significantly greater than those for their control firms at the 1
percent level, providing consistent evidence that Japanese issuers manipulate their
earnings when they issue private placements. Interestingly, both the mean and median of
discretionary accruals in year-l for issuing firms are significantly (although marginally)
less than those for their control firms, suggesting that Japanese managers may reserve
some of the accruals before they conduct private placements in order to facilitate the
manipulation of their earnings in the issuing year. However, the Mahalanobis distance
approach does not provide similar results.
[Insert Table 12 about here]
51

------------------- --- -- - --
Table 13 reports the regression results of abnormal returns on discretionary
accruals and control variables for Japanese issuers. The coefficient of discretionary
accruals in year 0 on three-year abnormal returns is -0.3143, which is significant at the 10
percent level. The coefficient of discretionary accruals in year 0 on five-year abnormal
returns is -0.5794, which is also significant at the 10 percent level. This result is similar
to results from the Mahalanobis distance approach for selecting the control sample.
[Insert Table 13 about here]
Thus, the propensity score matching approach provides results consistent with the
Mahalanobis distance approach for both the U.S. and the Japanese studies. This implies
that the findings of the study are not sensitive to the matching method adopted for
selecting the control sample.
52

CHAPTER 7 CONCLUSION
Private placements provide direct incentive to managers to manipulate earnings.
In doing so, managers may portray a rosy picture of the firms' prospects to attract new
investors and obtain more favorable terms for selling new shares. This study investigates
whether U.S. private placement issuers manipulate their earnings around the time of
issue, and the results indicate that U.S. managers tend to income increasingly manage
their earnings around the private placement.
The study also examines the effect on stock performance of earnings management
around the issue of private placements. Investors could be misled by the manipulated
earnings and become over-optimistic about the issuers' future performances. When the
income-increasing accruals reverse in subsequent periods, investors become disappointed
and beat down the stock price to the firms' fundamental values. Thus, the study finds
that post-issue stock underperformance is associated with earnings management prior to
the private placement and that, the higher the level of earnings management before the
issue of private placements, the poorer the post-issue stock performance will be.
The study further analyzes whether earnings manipulation around the time of
private placements issuance and its impact on issuers' post-issue stock performance are
demonstrated similar patterns in Japan. The results indicate that, like their U.S.
counterparts, Japanese private placement issuers also manipulate their earnings around
the time of issue and that the manipulated earnings predict the issuers' post-issue stock
underperformance.
53

The study also investigates whether an alternative matching technique could have
influence on the findings. A popular matching method in economics, propensity score
matching, is used to replace the Mahalanobis distance approach and the results are
similar, suggesting that the findings are not sensitive to alternative matching methods.
Testing earnings management using accrual models is a simultaneous test of
earnings management and the validity of the accrual models (Kothari et aI., 2005), so this
study is limited by the accuracy of the accrual model that is adopted to capture the
existence and level of earnings management. Although the study adopts the best
performing accrual model, to the extent that the model could fail to correctly extract the
discretionary portion from the total accruals, the results should be interpreted with
caution.
This study is also limited by the effectiveness of the matching models in dealing
with self-selection bias since issuing private placements could be an endogenous choice.
To deal with the self-selection problem, this study conduct a sensitivity test using
propensity score matching method. Issuing firms are matched with control firms by the
similar probability to issue private placements. Although the consistent results using the
propensity score matching method with the dimension by dimension matching using
Mahalanobis distance are conforming, the robustness of this study is based on the
assumption that unobserved private information should not explain outcome differentials
between firms choosing to issue private placements and those choosing not to. A
structural self-selection model could be the possible extension of the methodology in the
future of this study.
54

The findings of this study document that on average firms issuing private
placements have tendency to manipulate their earnings around the issuance. However,
the magnitude of the manipulations is different across the issuing firms. It will be
interesting to investigate what factors affect the firms' decision to manage earnings or the
magnitude of the manipulations, whether these factors have similar impact on private
placement issuers with other equity issuers, such as initial public offerings, seasoned
public offerings, right offerings and convertible bond offerings, etc and whether these
factors have similar impact across countries. These will be the extension of this study in
the future.
55

APPENDIX A: NEW U.S. SEASONED SECURITY ISSUES OF CORPORATION BY TYPES OF OFFERINGS, 1996-2006
1996 1997 1998 1999 2000 2001 2002 2003 2004 2005
Public offerings" 114.6 110.9 121.3 125.0 134.9 120.9 110.4 123.3 147.6 115.3
Private placements" 43.2 61.9 84.7 112.7 177.0 100.0 60.5 58.8 n.a.** n.a.**
Total" 157.8 172.8 206.0 237.7 311.9 220.9 170.9 182.1 % of Private placements 27.40% 35.80% 41.10% 47.40% 56.70% 45.30% 35.40% 32.30%
Footnotes: a. Source: Board of Governors of the Federal Reserve System, Federal Reserve Bulletin. b. " Numbers are in billions of dollars. c. *" Not available. Federal Reserve Bulletin stops reporting private placement data after 2003.
56
2006
119.2
n.a.**

APPENDIX B: TABLES
Table 1: Summary of U.S. private placements sample size and gross proceeds
Panel A: Sample size and gross proceeds by calendar year Year Sample size Percentage Gross proceeds (million $) 1989 17 4.89% 1,214.65 1990 13 3.74% 688.74 1991 14 4.02% 213.50 1992 25 7.18% 275.50 1993 25 7.18% 324.25 1994 19 5.46% 272.27 1995 16 4.60% 474.40 1996 15 4.31% 199.65 1997 16 4.60% 464.96 1998 7 2.01% 169.33 1999 18 5.17% 872.46 2000 40 11.49% 1,710.40 2001 123 35.34% 2,675.25
Total 348 100.00% 9,556.08
Panel B: Sample size and gross proceeds by industry classification Industry classification Sample size Percentage Gross proceeds (million $)
Mining
Oil And Gas
Food Products
Chemical Products
Computer Equipment
Electronic Equipment
Transportation
Instruments And Related Product
Communications
Wholesale
Retail
Financia1 SelVices
Services
Others
Total
Footnote:
9 2.59% 221.76 6 1. 72% 438.42 6
94 16 25 18 38 12 6
21 12 67 18
348
1.72% 27.01% 4.60% 7.18% 5.17% 10.92% 3.45% 1.72% 6.03% 3.45% 19.25% 5.17%
100.00%
368.10 2,218.40 431.52 299.00 470.88 677.54 294.48 69.90 893.97 482.88
1,886.05 801.54
9,556.08
The SEC required U.S. public firms to provide a cash flow statement starting in 1987. Since the stndy needs to calculate discretionary accruals two years prior to the issuance of private placements, the sample ofissuers starts from 1989. Since the study also needs to calculate postissue stock performance up to five years, the sample ends in 2001.
57
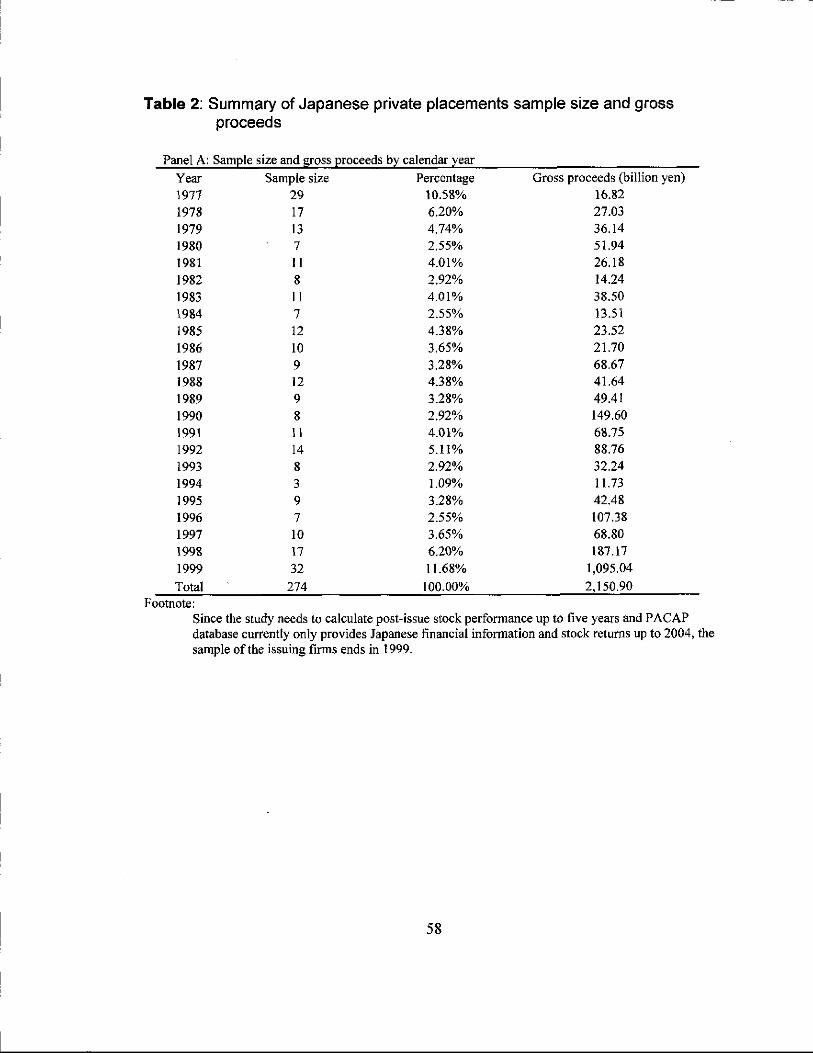
Table 2: Summary of Japanese private placements sample size and gross proceeds
Panel A: Sample size and grOSS proceeds by calendar year
Year Sample size Percentage Gross proceeds (billion yen)
1977 29 10.58% 16.82
1978 17 6.20% 27.03
1979 13 4.74% 36.14 1980 7 2.55% 51.94
1981 11 4.01% 26.18
1982 8 2.92% 14.24
1983 11 4.01% 38.50
1984 7 2.55% 13.51
1985 12 4.38% 23.52
1986 10 3.65% 21.70
1987 9 3.28% 68.67 1988 12 4.38% 41.64
1989 9 3.28% 49.41
1990 8 2.92% 149.60
1991 11 4.01% 68.75
1992 14 5.11% 88.76
1993 8 2.92% 32.24
1994 3 1.09% 11.73 1995 9 3.28% 42.48
1996 7 2.55% 107.38
1997 10 3.65% 68.80 1998 17 6.20% 187.17
1999 32 11.68% 1,095.04
Total 274 100.00% 2,150.90 Footnote:
Since the study needs to calculate post-issue stock performance up to five years and PACAP database currently only provides Japanese financial information and stock retums up to 2004, the sample ofthe issuing firms ends in 1999.
58
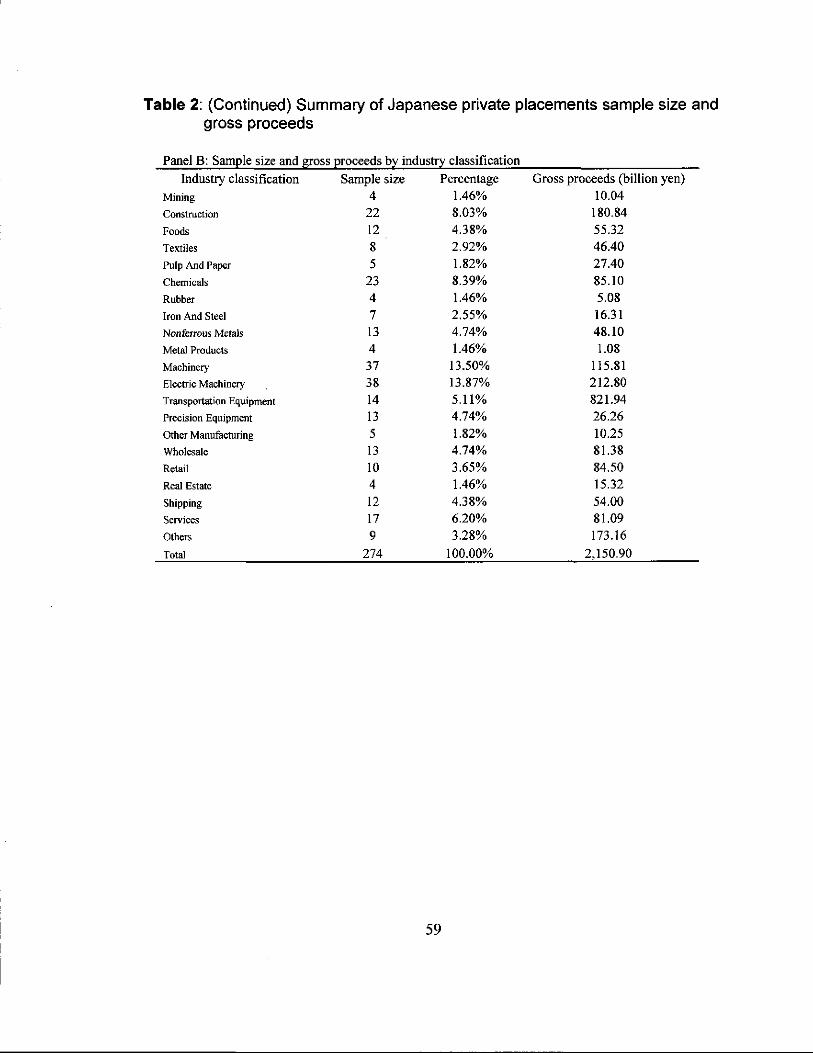
Table 2: (Continued) Summary of Japanese private placements sample size and gross proceeds
Panel B: Sample size and gross proceeds by industry classification
Industry classification Sample size Percentage Gross proceeds (billion yen)
Mining 4 1.46% 10.04 Construction 22 8.03% 180.84
Foods 12 4.38% 55.32
Textiles 8 2.92% 46.40 Pulp And Paper 5 1.82% 27.40 Chemicrus 23 8.39% 85.10 Rubber 4 1.46% 5.08 Iron And Steel 7 2.55% 16.31 Nonferrous Metals 13 4.74% 48.10 Metal Products 4 1.46% 1.08 Machinery 37 13.50% 115.81 Electric Machinery 38 13.87% 212.80 Transportation Equipment 14 5.11% 821.94 Precision Equipment 13 4.74% 26.26
Other Manufacttuing 5 1.82% 10.25 Wholesale 13 4.74% 81.38 Retail 10 3.65% 84.50 Real Estate 4 1.46% 15.32 Shipping 12 4.38% 54.00 Services 17 6.20% 81.09 Others 9 3.28% 173.16
Total 274 100.00% 2,150.90
59
Table 3: Discretionary accruals for U.S. issuing firms versus control firms
Std. Variable Mean Dev. Median Min Max
Year -2 (N=289) PP fInns -0.0021 0.3535 0.0104 -1.7926 1.2482
(t=-O.IO, pr=O.920) (pr=0.281) Control fInns 0.0044 0.2920 0.0045 -1.2817 1.6583
(t=0.24, pr=0.811) (pr=Oo444)
Test of difference (t=-0.23, p=0.815) (pr=0.672)
Year-1 (N=348) PP fInns 0.0327** 0.2816 0.0249*" -1.4318 1.5114
(t=2.15, pr=0.032) (pr=O.OOI) Control fInns -0.0072 0.2125 0.0051 -0.8906 0.8037
(t=-0.64, pr=0.521) (pr=0.782)
Test of difference (t=2.11, pr=O.035) (pr=0.059)
Year 0 (N=321) PP fInns 0.0054 0.2466 0.0128 -1.1477 1.5460
(t=0.39, pr=0.694) (pr=0.307)
Control fInns -0.0018 0.1991 0.0055 -1.4221 0.7863 (t=-0.16, pr=0.874) (pr=0.281)
Test of difference (t=Oo4O, p=0.687) (pr=0.865)
Year +1 (N=291) PP fInns 0.0127 0.1805 0.0143' -0.6056 0.8132
(t=1.20, pr=0.231) (pr=0.066) Control finns -0.0020 0.2189 -0.0080 -1.1885 1.5788
(t=-0.14, pr=0.886) (pr=0.627) Test of difference (t=0.83, p=0.405) (pr=0.157)
Year +2 (N=260) PP fInns 0.0193 0.1963 0.0068 -1.2727 1.1556
(t=1.58, pr=0.114) (pr=0.108)
ControlfInns -0.0130 0.1855 0.0023 -0.8277 0.8948 (t=-0.95, pr=O.343) (pr=0.553)
Test of difference (t=1.76, E=0.079) (Er=0.187) Footnotes:
a. Paired-sample t-test is used to evaluate difference in means, and Wilcoxon rank-sum test is used to evaluate the difference in medians.
b. "', ", ': Significant different from zero at 0.01,0.05, and 0.10, respectively, two-tailed test.
60

Table 4: Discretionary accruals for Japanese issuing firms versus control firms
Std. Variable Mean Dev. Median Min Max
Year -2 (N~264) PP firms -0.0062 0.0982 -0.0017 -0.4080 0.6855
(F-l.03, pJ=0.303) (pJ=0.330) Control firms -0.0097 0.0993 -0.0155'" -0.4071 0.7157
(t~-1.56, pJ=0.119) (pJ=O.OOI) Test of difference (F0.40, p~0.691) (pJ=O.IOI)
Year-l (N~274) PP firms -0.0217'" 0.1132 -0.0161'" -0.4431 0.4389
(t~-3.17, pJ=0.OO2) (pJ=O.OOO) Control firms -0.0119" 0.0823 -0.0113'" -0.4003 0.4813
(1~-2.39, pJ=O.o!8) (pJ=0.002) Test of difference (t~-1.I6, pJ=0.247) (pJ=0.432)
Year 0 (N~248) PP firms 0.0582'" 0.1544 0.0343'" -0.5112 0.5863
(F5.94, pJ=O.OOO) (pJ=O.OOO) Control firms -0.0059 0.1024 -0.0044 -0.4583 0.5016
(t~-0.91, pJ=0.366) (pJ=0.087) Test of difference (F5.45, p~O.OOO) (pJ=O.OOO)
Year +l (N~229) PP firms 0.0070 0.1169 0.0046 -0.3805 0.8264
(FO.90, pJ=0.367) (pJ=0.364) Control firms 0.0056 0.1136 -0.0036 -0.4408 0.5411
(t~0.08, pJ=O.937) (pJ=O.83\) Test of difference (F0.52, p~0.597) (pJ=O.397)
Year +2 (N~218) PP fIrms 0.0037 0.1214 0.0015 -0.5996 0.8516
(t~0.45, pJ=0.653) (pJ=0.341) Control firms -0.0092 0.0874 -0.0037 -0.4870 0.3497
(p- \.52, pJ=0.130) (pJ=0.231) Test of difference {pI.26, 12~0.208l (12J=0.122)
Footnotes: a. Paired-sample I-test is used to evaluate difference in means, and Wilcoxon rank-sum test is used to
evaluate the difference in medians. b. "', ", ': Significant different from zero at 0.01,0.05, and 0.10, respectively, two-tailed test.
61

Table 5: Post-issue stock returns for extreme discretionary accruals quartiles: U.S. issuers
Vears Rawretums ~arketexcessreturns Abnormal returns after
issuance Conservative Aggressive Conservative Aggressive Conservative Aggressive
1 -11.73 -6.72 -8.49 -3.78 -23.16 -27.67
2 19.25 -5.03 12.91 -13.08 -21.49 -41.66
3 18.22 16.78 3.54 -9.75 -15.98 -51.21
4 34.17 35.39 2.08 -9.25 -12.7\ -46.38
5 60.08 66.95 3.81 5.08 -12.82 -40.82 Footnote:
The total sample is classified into four groups by the issuer's discretionary accruals in the year preceding the issuing year. The conservative group is the quartile group with the smallest discretionary accruals and the aggressive group is the one with the largest discretionary accruals.
62
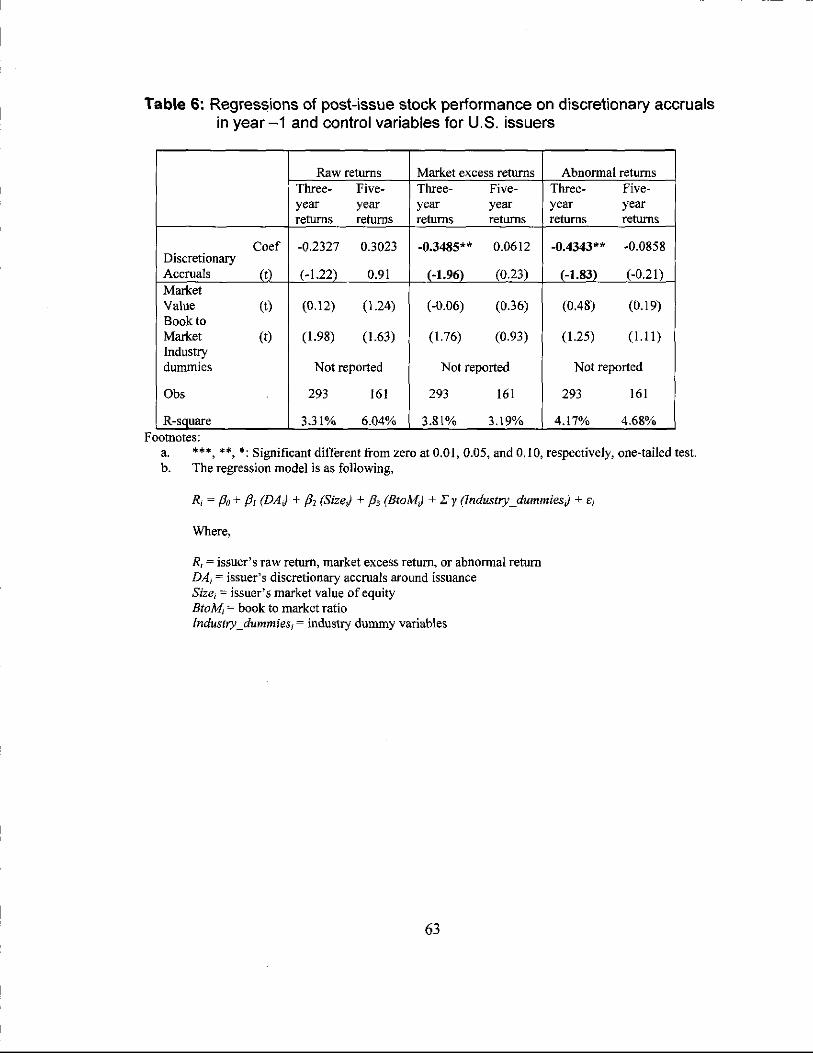
Table 6: Regressions of post-issue stock performance on discretionary accruals in year -1 and control variables for U.S. issuers
Raw returns Market excess returns Abnonnal returns Three- Five- Three- Five- Three- Five-year year year year year year rerums returns returns returns returns returns
Coef -0.2327 0.3023 -0.3485** 0.0612 -0.4343** -0.0858 Discretionary Accruals (t) (-1.22) 0.91 (-1.96) (0.23) (-1.83) (-0.21) Market Value (t) (0.12) (1.24) (-0.06) (0.36) (0.48) (0.19) Book to Market (t) (1.98) (1.63) (1.76) (0.93) (\.25) (1.11) Industry dummies Not reported Not reported Not reported
Obs 293 161 293 161 293 161
R-sQuare 3.31% 6.04% 3.81% 3.19% 4.17% 4.68% Footnotes:
a. • •• , •• , ': Significant different from zero at 0.01,0.05, and 0.10, respectively, one-tailed test. b. The regression model is as following,
R, ~ {30 + {31 (DAJ + {3,(SizeJ + (3, (8toM) + Ey (Industry_dummiesJ + E,
Where,
R/ = issuer's raw return, market excess return, or abnormal return DAi = issuer's discretionary accruals around issuance Sizei = issuer's market value of equity 8toM; ~ book to market ratio Industry_dummies, ~ industry dummy variables
63

-- --------------~
Table 7: Post-issue stock returns for extrerne discretionary accruals quartiles: Japanese issuers
Years Raw returns Market excess returns Abnormal returns after
issuance Conservative Aggressive Conservative Aggressive Conservative Aggressive
1 18.16 8.81 -0.64 -1.71 3.31 -8.57
2 26.86 10.15 -6.91 -13.57 -13.58 -22.07
3 20.38 7.29 -7.66 -19.28 -20.33 -28.54
4 34.91 23.12 -12.92 -22.32 -21.45 -40.99
5 51.39 32.43 -13.14 -24.58 -17.12 -47.77 Footnote:
The total sample is classified into four groups by the issuer's discretionary accruals in the issuing year. The conservative group is the quartile group with smaller discretionary accruals and the aggressive group is the one with larger discretionary accruals.
64

- - - -- ._-------
Table 8: Regressions of post-issue stock performance on discretionary accruals in year 0 and control variables for Japanese issuers
Raw returns Market excess returns Abnormal returns Three- Three- Three-year Five-year year Five-year year Five-year returns returns returns returns returns returns
Discre-tionary Coef -0.8679*' -1.1033** -0.4292*' -0.3199* -0.4302' -0.6425* Accruals (t) (-2.16) (-1.89) (-1.98) (-1.30) (-1.36) (-1.58) Market Value (t) (-5.15) (-3044) (-250) (-1.6&) (-0.60) (-0.81) Book to Market (t) (-0.55) (-0.95) (-0.68) (+0040) (-lAO) -0.26 Industry dummies Not reported Not reported Not reported Obs 219 202 219 202 219 202
R-square 19.01% 11.13% 8.00% 4.63% 7.08% 5.28%
Footnotes: a. "', ", *: Significant different from zero at 0.01, 0.05. and 0.10, respectively, one-tailed test. b. The regression model is as following,
R, ~ /30 + /31 (DAJ + /32 (Size) + /33 (BloM) + Iy (Induslry_dummies) + e,
'Where,
Rj = issuer's raw return, market excess return, or abnonnal return DAi = issuer's discretionary accruals around issuance Sizej = issuer's market value of equity 810M, ~ book to market ratio Industry_dummies, ~ industry dummy variables
65
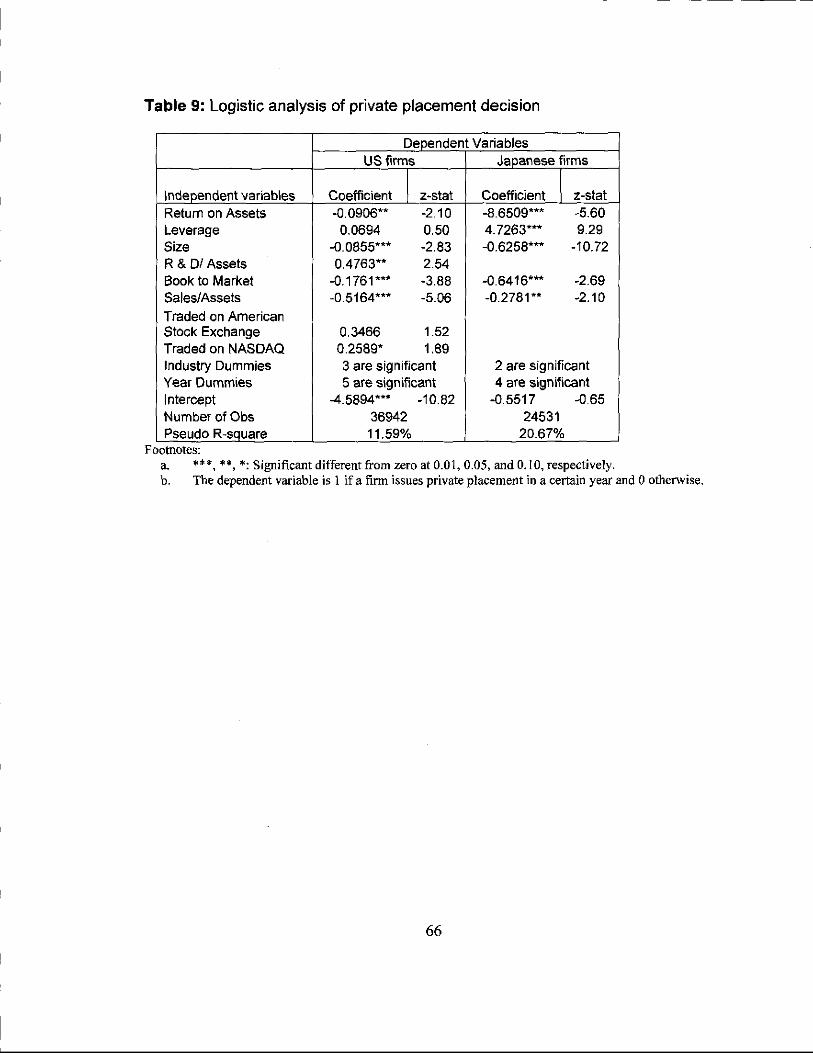
Table 9: Logistic analysis of private placement decision
Dependent Variables US firms JaQanese firms
Independent variables Coefficient 1 z-stat Coefficient .1 z-stat Return on Assets -0.0906" -2.10 -8.6509'" -5.60 Leverage 0.0694 0.50 4.7263'" 9.29 Size -0.0855'" -2.83 -0.6258'" -10.72 R & DI Assets 0.4763" 2.54 Book to Market -0.1761'" -3.88 -0.6416'" -2.69 SaleslAssets -0.5164'" -5.06 -0.2781" -2.10 Traded on American Stock Exchange 0.3466 1.52 Traded on NASDAQ 0.2589' 1.89 Industry Dummies 3 are significant 2 are significant Year Dummies 5 are significant 4 are significant Intercept -4.5894'" -10.82 -0.5517 -0.65 Number of Obs 36942 24531 Pseudo R-square 11.59% 20.67%
Footnotes: a. • •• , •• , *: Significant different from zero at 0.01, 0.05, and 0.10, respectively. b, The dependent variable is 1 if a firm issues private placement in a certain year and 0 othelWise,
66

- - -- ------~
Table 10: Discretionary accruals for U.S. private placement firms versus control firms - propensity score matching
SId. Variable Mean Dev. Median Min Max
Year -2 (N=289) PP finns -0.0021 0.3535 0.0104 -1.7926 1.2482
(1=-0.10, pFO.920) (pr=0.281) Control finns 0.0081 0.2920 0.0102' -1.7113 1.2321
(t91.52, pr=0.601) (pr=0.059) Test of difference (1~-0.39, p~0.694) (pr=0.869)
Year -1 (N=348) PPfinns 0.0327*' 0.2816 0.0249**' -1.4318 1.5114
(t~2.15, pr=0.032) (pr=O.OOI) Control finns -0.0100 0.2125 0.0062 -1.7070 1.5687
(t~-0.56, pr=O.577) (pr=0.957) Test of difference (t~1.82, pFO.069) (pFO.042)
Year 0 (N=321) PP finns 0.0054 0.2466 0.0128 -1.1477 1.5460
(F0.39, pr=0.694) (pFO.307) Control finns 0.0050 0.1991 0.0060 -1.4365 1.1002
(t~-0.39, pr=0.695) (pr=0.420) Test of difference (t~0.02, p~0.983) (pr=0.662)
Year +1 (N=291) PP finns 0.0127 0.1805 0.0143' -0.6056 0.8132
(t~1.20, pr=0.23I) (pr=O.066) Control finns -0.0102 0.2189 -0.0030 -0.9299 1.1316
(t~-0.78, pFO.435) (pr~O.996)
Test of difference (t~1.36, p~0.173) (pr=0.17l)
Year +2 (N=260) PP finns 0.0193 0.1963 0.0068 -1.2727 1.1556
(t=1.58, pFO.114) (pFO.108) Control finns -0.0072 0.1855 -0.0032 -0.6795 0.5421
(t~-0.78, pr=O.434) (pFO.970)
Test of difference (t=1.73, ~~0.083) (~r=O.526)
Footnotes: a. Paired-sample t-test is used to evaluate difference in means, and Wilcoxon rank-sum test is used to
evaluate the difference in medians. b. ***, **, *: Significant different from zero at 0.01,0.05, and 0.10, respectively, two-tailed test.
67

Table 11: Regressions of post-issue stock performance on discretionary accruals in year -1 and control variables for U.S. issuers - propensity score matching
Raw returns Market excess returns Abnormal returns Three- Five- Three- Five-year year Three-year Five-year year year returns returns returns returns returns returns
Coef -0.2327 0.3023 -0.3485** 0.0612 -0.5082· 0.0776 Discretionary Accruals (t) (-1.22) (0.91) (-1.96) (0.23) (-1.43) (0.23)
Market Value (t) (0.12) (1.24) (-0.06) (0.36) (-0.05) (0.41) Book to Market (t) (1.98) (1.63) (1.76) (0.93) (0.04) (0.80) Industry dummies Not reported Not reported Not reported
Obs 293 161 293 161 293 161
R-square 3.31% 6.04% 3.81% 3.19% 4.48% 6.31% Footuoles:
a. • ••• ". ': Significant different from zero at 0.0 I, 0.05, and 0.10, respectively, one-tailed test. b. The regression model is as following,
Ri ~ /30 + /3J (DAJ + /32 (Size) + /33 (B/oM) + L Y (Industry_dummies) + ei
Where,
Ri = issuer's raw return, market excess return, or abnonnal return DA/ = issuer's discretionary accruals around issuance Sizej = issuer's market value of equity BtoM, ~ hook to market ratio Industry_dummies, ~ industry dummy variables
68

,------ - ---- --- --- ---- --~-------~
Table 12: Discretionary accruals for Japanese private placement firms versus controifirms ~ propensity score matching
Std. Variable Mean Dev. Median Min Max
Year -2 (N~264) PP firms -0.0062 0.0982 -0.0017 -0.4080 0.6855
(t=-1.03, pr=O.303) (pFO.330) Control firms -0.0024 0.0993 0.0000 -0.3051 0.3200
(t=-0.51, pFO.608) (pr=O.605) Test of difference (t=051, p=0.610) (pr=O.262)
Year -1 (N=274) PP fIrms -0.0217'" 0.1132 -0.0161'" -0.4431 0.4389
(t=-3.17, pFO.002) (pFO.OOO) Control fIrms -0.0072' 0.0823 -0.0032 -0.3236 0.2113
(t=-1.70, pFO.090) (pFO.160) Test of difference (t=-1.80, pr=O.072) (pFO.061)
Year 0 (N=248) PP firms 0.0582'" 0.1544 0.0343'" -0.5112 0.5863
(t=5.94, pFO.OOO) (pFO.OOO) Control firms -0.0023 0.1024 -0.0035 -0.2863 0.2288
(t=-0.54, pFO.590) (pFO.677) Test of difference (t=5.65, p=O.OOO) (pFO.OOO)
Year +l (N=229) PP firms 0.0070 0.1169 0.0046 -0.3805 0.8264
(t=0.90, pFO.367) (pFO.364) Control firms 0.0078' 0.1136 0.0034 -0.2547 0.2324
(t=1.77, pFO.079) (pr=0.182) Test of difference (t=-0.09, p=0.93I) (pFO.866)
Year +2 (N=21S) . PP firms 0.0037 0.1214 0.0015 -0.5996 0.8516
(t=0.45, pFO.653) (pFO.341) Control firms 0.0064 0.0874 0.0040 -0.2444 0.3200
(t= 1.31, pFO.192) (pFO.375)
Test of difference (t=-0.29, E=0.775) (EFO.94Q Footnotes;
a. Paired-sample t-test is used to evaluate difference in means, and Wilcoxon rank-sum test is used to evaluate the difference in medians .
b. ••• , ", '; Significant different from zero at 0.01, 0.05, and 0.10, respectively, two-tailed test.
69

Table 13: The regressions of post-issue returns on discretionary accruals in year o and controls for Japanese issuers-propensity score matching
Raw returns Market excess returns Abnonnal returns
Tbree- Three- Three-year Five-year year Five-year year Five-year returns returns returns returns returns returns
Discre-tionary Coef -0.8679*' -1.1033" -0.4292** -0.3199' -0.3143* -0.5794* Accruals (D (-2-16) (-1.89) (-1.98L (-1.30) 1-1.34l _(-1.6~t Market Value (t) (-5.15) (-3.44) (-2.50) (-1.68) (-0.73) (-0.08) Book to Market (t) (-0.55) (-0.95) (-0.68) (+0.40) -0.01 (-0.44) Industry dummies Not reported Not reported Not reported Obs 219 202 219 202 219 202 R-square 19.01% 11.13% 8.00% 4.63% 7.54% 2.20%
Footnotes: a. • •• , ", ': Significant different from zero at 0.01, 0.05, and 0.10, respectively, one-tailed test. b. The regression model is as following,
R; = Po + PI (DAJ + fJ2 (Size) + fJdBtoM) + Ey (Industry_dummiesJ + c;
'Where,
R j = issuer's raw return, market excess return, or abnonnal return DA;::: issuer's· discretionary accruals around issuance Size; = issuer's market value of equity BtoM, = book to market ratio
Industry_dummies, = industry dummy variables
70

0.0400
.!! 0.0300 ca :::s ... u 0.0200 u ca >-... 0.0100 ca r::: 0 ;;
0.0000 CI) ... u .!!! c -0.0100
-0.0200
APPENDIX C: FIGURES
Event years
o Private placement firms
• Control firms
Figure 1: Discretionary accruals for U.S. issuing firms and control firms
71
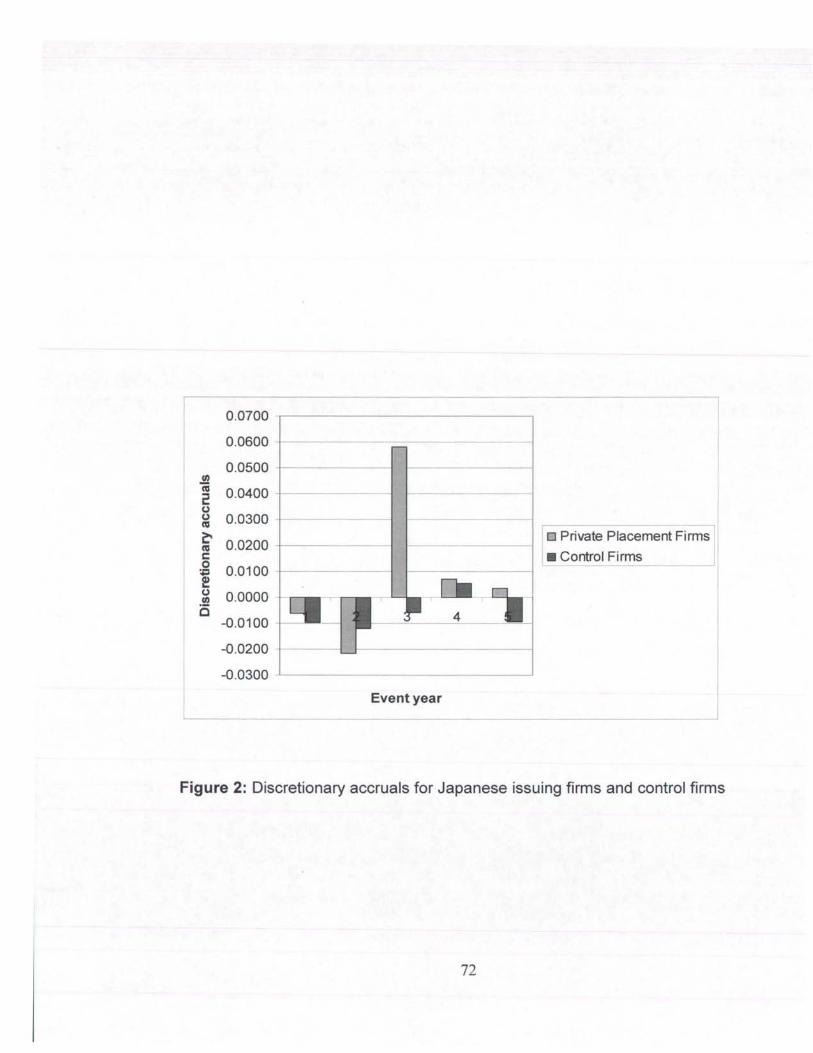
~0700 I 0.0600 -I----------------j
0.0500 -1-------
.!!J. 2 0.0400 +------1 C.)
~ 0.0300
~ 0.0200 +--------1 c o ., 0.0100 -1--------1
~ ~ 0.0000 is
-0.0100
-0.0200 -j---
-------1
-0.0300 -'---------------'
Event year
10 Private Placement Firms l • Control Firms
Figure 2: Discretionary accruals for Japanese issuing firms and control firms
72
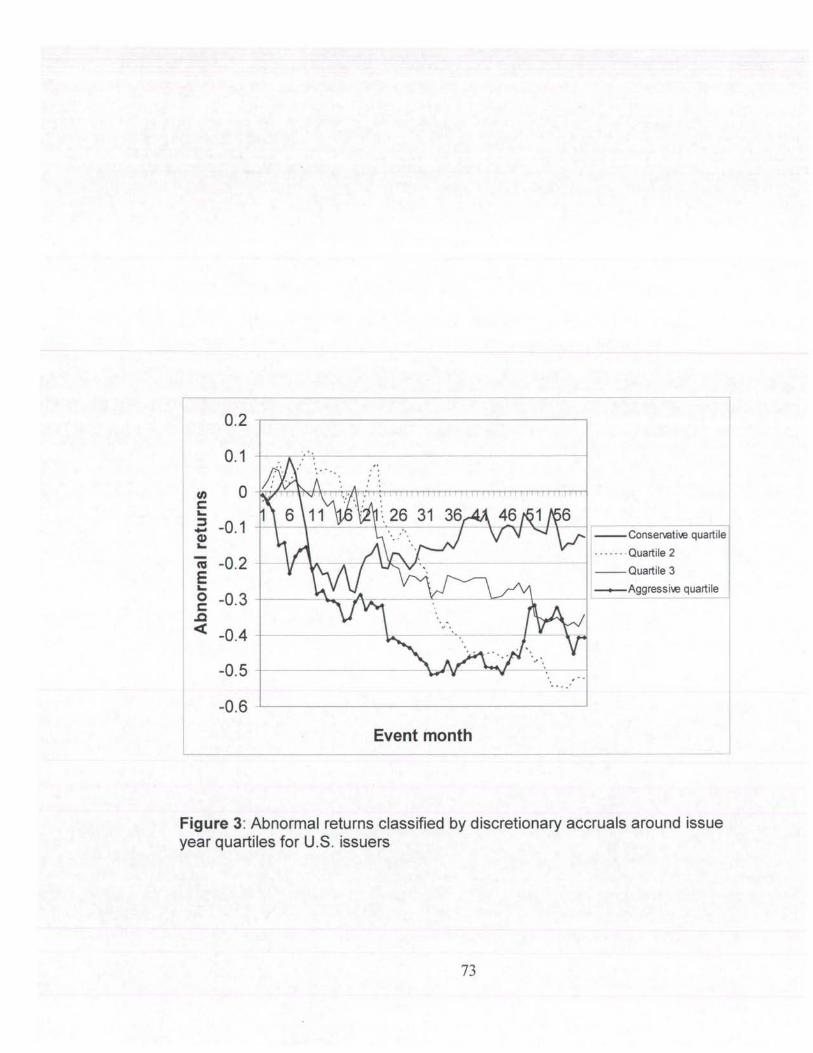
0.2
0.1
tn 0 s:::: L-::::J -0.1 -(1) L-
eu -0.2 E L-0 -0.3 s:::: .c <t -0.4
-0.5
-0.6
·~h-~~~\4~~~~~------------~
+-----~_-~~-----L----~~--II----~
Event month
--Conservatil.e quartile
. . . .. . . Quartile 2
--Quartile 3
_Aggressil.e quartile
Figure 3: Abnormal returns classified by discretionary accruals around issue year quartiles for U.S. issuers
73
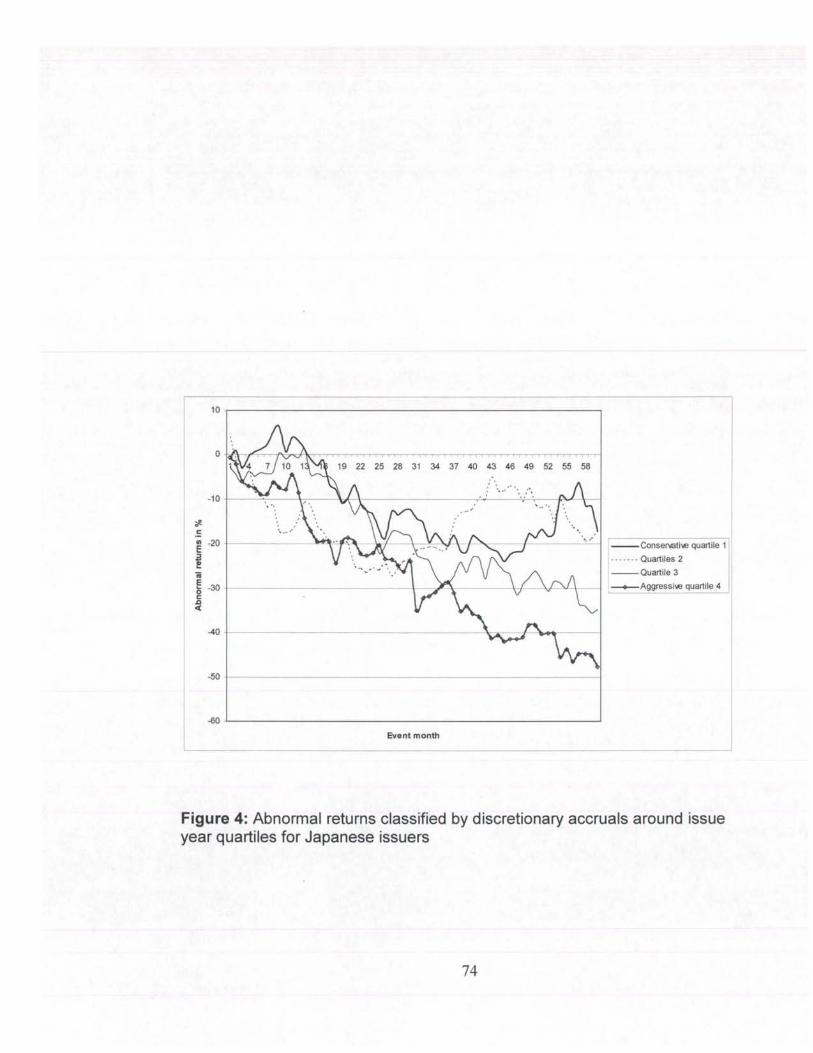
10
0
19 22 25 28 31 34 37 40 43 46 49 52 55 58
-1 0
;f!. <: .. .... 1/1 -20 E --Conservatil.€ quartile 1
! - - - - - - . Quartiles 2
ii --Quartile 3 E
-30 (; _Aggressil.€ quartile 4 <: .0 «
-40
-50
-60
Event month
Figure 4: Abnormal returns classified by discretionary accruals around issue year quartiles for Japanese issuers
74

ENDNOTES
1 It is arguable that discounts offered to the private placement investors may somewhat reflect the concern of private placement investors on reported earnings. However, offering discounts can help attract more institutional investors, increasing the pool from which managers can select based on their preference; offering discounts may also help issuing firms bring more capital quickly. In the meantime, there is a restricted time period for private placement investors to fe-sell their securities - discounts may be used to compensate for this liquidity problem. Given the variety of roles of discounts, it is difficult to distinguish the level of reflection on the concern of earnings quality.
2 The SEC required U.S. public firms to provide a cash flow statement starting in 1987. Since the study needs to calculate discretionary accruals two years prior to the issuance of private placements, the sample of issuers starts from 1989.
3 The Japanese accounting standard for cash flow statements was issued in 1998. Japanese listed companies start to submit their cash flow statements from the year 2000.
4 Firms issuing public offerings and private placements in year t are also excluded in the cross-sectional regression estimating the parameters of equation (3).
5 Paired-sample t-test is used to evaluate difference in means and Wilcoxon rank-sum test is used to evaluate the difference in medians.
6 Paired-sample t-test is used to evaluate difference in means and Wilcoxon rank-sum test is used to evaluate the difference in medians.
7 Frankel et al. (1995) find that US firms issuing more capital tend to issue more forecasting. Francis et aI. (2005) using a sample of 672 observations from 34 countries outside of the United State, also document that firms in industries with great external financing needs have higher levels of voluntary disclosure.
8 Gramlich and Sorensen (2004) examine a sample of 58 Danish firms that issue voluntary earnings forecasts in connection with IPOs and find that managers of Danish firms exercise discretionary accruals to mitigate earnings forecast errors.
9 Paired-sample t-test is used to evaluate difference in means and Wilcoxon rank-sum test is used to evaluate the difference in medians.
to The only difference between Table 11 and Table 6 is in the abnormal returns sections.
75
REFERENCE
Aboody, David and Ron Kasznik. 2000. CEO Stock Option Awards and the Timing of Corporate Voluntary Disclosures. Journal of Accounting and Economics 29: 73-100.
Agarwal, Sumit, Souphala Chomsisengphet, Chunlin Liu, and S. Ghon Rhee. 2005. Earnings Management Behaviors under Different Economic Environments: Evidence from Japanese Banks. Working paper.
Aharony, Joseph, Chan-Jane Lin, and Martin P. Loeb. 1993. Initial Public Offerings, Accounting Choices, and Earnings Management. Contemporary Accounting Research 10: 61-81.
Barber, Brad M. and John D. Lyon. 1997. Detecting Long-Run Abnormal Stock Returns: The Empirical Power and Specification of Test Statistics. Journal of Financial Economics 43: 341-372.
Barclay, Michael J., Clifford G. Holderness, and Dennis P. Sheehan. 2005. Private Placements and Managerial Entrenchment. Working paper, University of Rochester.
Barton, Jan and Paul J. Simko. 2002. The Balance Sheet as an Earnings Management Constraint. Accounting Review 77: 1-27.
Bartov, E., F. Gul, and J. Tsui. 2000. Discretionary-Accruals Models and Audit Qualifications. Journal of Accounting and Economics 30: 421-452.
Bayless, Mark and Nancy R. Jay. 2003. Is the Performance of Firms Following Seasoned Equity Issues Anomalous? Journal of Banking & Finance 27: 1273-1296.
Beuselinck, Christof, Marc Deloof, and Sophie Manigart. 2005. Private Equity and Earnings Quility. Working paper, Ghent University.
Brav, Alon, Christopher Geczy, and Paul A. Gompers. 2000. Is the Abnormal Return Flowing Equity Issuances Anomalous. Journal of Financial Economics 56: 209-249.
Brennan, M. J. and J. Franks. 1997. Underpricing, Ownership and Control in Initial Public Offerings of Equity Securities in the UK. Journal of Financial Economics, 45: 391-413.
Bushee, Brian J. 1998. The Influence of Institutional Investors on Myopic R&D Investment Behavior. Accounting Review 73 (3): 305-333.
Cai, Jun and Tim Loughran. 1998. The Performance of Japanese Seasoned Equity Offerings, 1971-1992. Pacific-Basin Finance Journal 6: 395-425.
76

Ching, Ken M.L., Michael Firth, and Oliver M. Rui. 2002. Earnings Management, Corporate Governance and the Market Performance of Seasoned Equity Offerings. Working paper, The Hong Kong Polytechnic University.
Chung, Richard, Michael Firth, and Jeong-Bon Kim. 2002. Institutional Monitoring and Opportunistic Earnings Management. Journal o/Corporate Finance 8: 29-48.
Daniel, Kent, David Hirshleifer, and Avanidhar Subrhmanyam. 1998. Investor Psychology and Security Market under- and Overreactions. Journal 0/ Finance 53 (6): 1839-1885.
Dechow, P., R. Sloan, and A. Sweeney. 1995. Detecting Earnings Management. Accounting Review 70: 193-225.
Dechow, Patricia and Douglas J. Skinner. 2000. Earnings Management: Reconciling the views of Accounting Academics, Practitioners, and Regulators. Accounting Horizons 14 (2): 235-250.
DuCharme, Larry L., Paul H. Malatesta, and Stephan E. Sefcik. 2001. Earnings Management: IPO Valuation and Subsequent Performance. Journal 0/ Accounting, Auditing & Finance 16: 369-396.
:-c":----:---:-:-' and . 2004. Earnings Management, Stock Issues, and Shareholder Lawsuits. Journal o/Financial Economics 71: 27-49.
Erickson, Merle and Shiing-wu Wang. 1999. Earnings Management by Acquiring Firms in Stock for Stock Mergers. Journal 0/ Accounting and Economics 27: 149-176.
Fama, Eugene F. 1998. Market Efficiency, Long-term Returns, and Behavioral Finance. Journal 0/ Financial Economics 49: 283-306.
Fama, Eugene F. and Kenneth R. French. 1998. Value versus Growth: The International Evidence. Journal o/Finance 53 (6): 1975-1999.
Field, Laura Casares and Dennis P. Sheehan. 2004. IPO Underpricing and Outside Blockholdings. Journal o/Corporate Finance 10 (2): 263-280.
Folta, Timothy B. and Jay J. Janney. 2004. Strategic Benefits to Firms Issuing Private Equity Placements. Strategic Management Journal 25: 223-242.
Francis, Jere R., Inder K. Khurana. 2005. Disclosure Incentives and Effects on Cost of Capital around the World. Accounting Review 80: 1125-1162.
77

Frankel, Richard, Maureen McNichols, and G. Peter Wilson. 1995. Discretionary Disclosure and External Financing. Accounting Review 70: 135-150.
Friedlan, John. 1994. Accounting Choices ofIssuers ofInitial Public Offerings. Contemporary Accounting Research 11 (1): 1-31.
Gibson, Michael. 1998. Big Bang deregulation and Japanese Corporate Governance: A Survey of the Issues. Board of Governors of the Federal Reserve System, International Finance Discussion Paper 624.
Gramlich, Jeffrey D. and Ole Sorensen. 2004. Voluntary Management Earnings Forecasts and Discretionary Accruals: Evidence from Danish IPOs. European Accounting Review 13: 235-259
Guan, Liming, Daoping He, and Ghon Rhee. 2005. Earnings Management and the Performance of Seasoned Equity Offerings: Evidence from Japanese Issuers. Working paper presented in AAA annual conference, University of Hawai'i.
Healy, Paul M. and James M. Wahlen. 1999. A Review of the Earnings Management Literature and Its Implications for Standard Setting. Accounting Horizons 13 (4): 365-383.
Hermann, Don, and Tatsuo Inoue. 1996. Income Smoothing and Incentives by Operating Condition: an Empirical Test Using Depreciation Changes in Japan. Journal of international Accounting, Auditing & Taxation 5 (2): 161-178.
Hermann, Don, Tatsuo Inoue, and Wayne B. Thomas. 2003. The Sale of Assets to Manage Earnings in Japan. Journal of Accounting Research 41 (1): 89-108.
Hertzel, Michael and Richard L. Smith. 1993. Market Discounts and Shareholder Gains for Placing Equity Privately. Journal of Finance 48 (2): 459-485.
Hertzel, Michael, Michael Lemmon, James S. Linck, and Lynn Rees. 2002. Long-Run Performance Following Private Placements of Equity. Journal of Finance 57 (6): 2595-2617.
Ho, Keng-Yu. 2005. Long Horizon Abnormal Performance Following Rights Issues and Placings: Additional Evidence from the U.K. Market. Review of Financial Economics 14: 25-45.
Janney, Jay J. and Timothy B. Folta. 2006. Moderating Effects ofInvestor Experience on the Signaling Value of Private Equity Placements. Journal of Business Venturing 21: 27-44.
78

-----------------------
Jones, J. 1991. Earnings Management during Import ReliefInvestigations. Journal of Accounting Research 29: 193-228.
Jung, Kooyul, Y oung-Cheol Kim, and Rene M. Stulz. 1996. Timing, Investment Opportunities, Managerial Discretion, and the Security Issue Decision. Journal of Financial Economics 42: 159-185.
Kabir, Rezaul and Peter Roosenboom. 2003. Can the Stock Market Anticipate Future Operating Performance? Evidence from Equity Rights Issues. Journal of Corporate Finance 9: 93-113.
Kang, Jun-Koo and Rene M. Stulz. 1996. How Different Is Japanese Corporate Finance? An Investigation of the Information Content of New Security Issues. Review of Financial Studies 9 (1): 109-139.
Kang, Jun-Koo, Yong-Cheol Kim, and Rene M. Stulz. 1999. The Underreaction Hypothesis and the New Issue Puzzle: Evidence from Japan. Review of Financial Studies 12 (3): 519-534.
Kaplan, Steven N. 1994. Top Executive Rewards and Firm Performance: A Comparison of Japan and the United States. The Journal of Political Economy 102 (3): 510-546.
Kasznik, Ron. 1999. On the Association between Voluntary Disclosure and Earnings Management. Journal of Accounting Research. 37: 57-81.
Keown, Arthur, David F. Scott, Jr., John D. Martin, and J. William Petty. 2003. Foundations of Finance. Prentice Hall.
Kothari, S.P., and J. Warner. 1997. Measuring Long-Horizon Security Price Performance. Journal of Financial Economics 49: 1541-1578.
Kothari, S.P., Leonge, Andrew J. and Wasley, Charles E. 2005. Performance Matched Discretionary Accrual Measures. Journal of Accounting and Economics 39: 163-197
La Porta, R., Lopez-de-Silanes, F., Shileifer, A., Vishny, R. 2000. Investor Protection and Corporate Governance. Journal of Financial Economics 58 : 3-27.
Lang, Mark, Jana Smith Raedy, and Wendy Wilson. 2004. Earnings Quality and Cross Listing: Are Reconciled Earnings Comparable to U.S. Earnings? Working paper, University of North Carolina.
Larcker, David F., Scott A. Richardson, and Irem Tuna. 2005. How Important is Corporate Governance? Working paper presented in 2005 AAA Annual Conference, University of Pennsylvania.
79

Leuz, Christian, Dhananjay Nanda, and Peter D. Wysocki. 2003. Earnings Management and Investor Protection: an International Comparison. Journal of Financial Economics 69: 505-527.
Levis, Mario. 1995. Seasoned Equity Offerings and the Short- and Long-Run Performance of Initial Public Offerings in the UK. European Financial Management 1 (2): 125-146.
Li, Kai and N.R. Prabhala. 2007. Self-Selection Models in Corporate Finance. Hand Book of Corporate Finance, chapter two.
Loughran, Tim and Jay R. Ritter. 1995. The New Issues Puzzle. Journal of Finance 50: 23-51.
Mande, Vivek, Richard G. File, and Wikil Kwak. 2000. Income Smoothing and Discretionary R&D Expenditures of Japanese Firms. Contemporary Accounting Research 17 (2): 263-302.
Marciukaityte, Dalia. 2001. Issues in Public and Private Equity Offerings. Dissertation, Drexel University.
Margetis, Speros L. 2004. Two Essay on Earnings Management: Earnings Management Surrounding Straight and Convertible Debt. And the Intra-Industry Contagion Effect of Earnings Restatements. Dissertation. University of South Florida.
Mathew, Prem G. 2002. Long-Horizon Seasoned Equity Offerings Performance in Pacific Rim Markets. Review of Financial Economics 11: 317-333.
McConnell, John 1. and Hemy Servaes. 1990. Additional Evidence on Equity Ownership and Corporate Value. Journal of Financial Economics 27: 595-612.
McLaughlin, Robyn, Assem Safieddine, and Gopala K. Vasudevan. 1996. The Operating Performance of Seasoned Equity Issuers: Free Cash Flow and Post-Issue Performance. Financial Management 25 (4): 41-53.
Mitchell, Mark L. and Erik Stafford. 2000. Managerial Decisions and Long-Term Stock Price Performance. Journal of Business 73 (3): 287-329.
Murray, D. 1983. The Effect of Certain Research Design Choices on the Assessment of the Market's Reaction to LIFO Changes: a Methodological Study. Journal of Accounting Research 21 (1): 128-140.
80

Myers, Stewart C. and Nocholas S. Majluf. 1984. Corporate Financing and Investment Decisions When Firms Have Information That Investors Do Not Have. Journal of Financial Economics 13: 187-221.
Pastor-Llorca, Maria Jesus and Juan Francisco Martin-Ugedo. 2004. Long-Run Performance of Spanish Seasoned Equity Issues with Rights. International Review of Financial Analysis 13: 191-215.
Rajgopal, Shivaram, Mohan Venkatachalam, and James Jiambalvo. 2002. Is Institutional Ownership Associated with Earnings Management and the Extent to which Stock Prices Reflect Future Earnings? Contemporary Accounting Research 19 (1): 117-136.
Rangan, Srinivasan. 1998. Earnings Management and the Performance of Seasoned Equity Offerings. Journal of Financial Economics 50: 101-122.
Reddy, Y. Subba. 2005. Seasoned Capital Offerings: Earnings Management and LongRun Operating Performance ofIndian Firms. Working paper, Monash University Malaysia.
Rosenbaum, Paul R. and Donald B. Rubin. 1983. The Central Role of the Propensity Score in Observational Studies for Causal Effects. Biometrika 70: 41-55.
Ross, Stephen A., Randolph W. Westerfield, and Jeffrey Jaffe. 2002. Corporate Finance. 5th edition, Irwin McGraw-Hill.
Ruland, William, Samuel Tung, and Nashwa E. George. 1990. Factors Associated with the Disclosure of Managers' Forecasts. Accounting Review 65: 710-721.
Schultz, Paul. 2003. Pseudo Market Timing and the Long-Run Underperformance of IPOs. Journal of Finance 58 (2): 483-518.
Shivakumar, Lakshmanan. 2000. Do Firms Mislead Investors by Overstating Earnings before Seasoned Equity Offerings? Journal of Accounting and Economics 29: 339-371.
Shleifer, Andrei and Robert W. Vishny. 1986. Large Shareholders and Corporate Control. Journal of Political Economy 94 (3): 461-488.
____ and .-=:-::-__ 1997. A survey of Corporate Governance. Journal of Finance 52 (2): 737-783.
Smith, Clifford W. Jr. 1986. Investment Banking and the Capital Acquisition Process. Journal of Financial Economics IS: 3-29.
81

Spiess, D. Katherine and John Affleck-Graves. 1995. Underperformance in long-run stock returns following seasoned equity offerings. Journal of Financial Economics 38: 243-267.
Srivastava, Ashwani Kumar. 1989. Private Equity Placements: An Investigation of Discounts, Price Effects, and Floatation Costs. Dissertation, University of Toronto.
Subramanyam, K. 1996. The Pricing of Discretionary Accruals. Journal of Accounting and Economics 22: 249-282.
Tan, Ruth S.K., P.L. Chng, and Y.H. Tong. 2002. Private Placements and Rights Issues in Singapore. Pacific-Basin Finance Journal 1 0: 29-54.
Teoh, Siew Hong, Ivo Welch, and T.J. Wong. 1998a. Earnings Management and the Long Term Market Performance of Initial Public Offerings, Journal of Finance 53: 1935-1974.
______ , and . 1998b. Earnings Management and the Underperformance of Seasoned Equity Offerings. Journal of Financial Economics 50: 63-99.
Thomas, Wayne B., Donald R. Herrmann, and Tatsuo Inoue. 2004. Earnings Management through Affiliated Transactions. Journal of International Accounting Research 3 (2): 1-25.
Watts, Ross L., and Jerold L. Zimmerman. 1986. Positive Accounting Theory. Prentice Hall.
Wruck, Karen Hopper. 1989. Equity Ownership Concentration and Firm Value-Evidence From Private Equity Financings. Journal of Financial Economics 23: 3-28.
Wu, Xueping, Zheng Wang, and Jun Yao. 2005. Understanding the Positive Announcement Effects of Private Equity Placements: New Insights from Hong Kong Data. Review of Finance 9: 385-414.
Wu, YiLin. 2004. The Choice of Equity Selling Mechanisms. Journal of Financial Economics 74: 93-119.
Yoon, Soon Suk and Gary Miller. 2002. Earnings Management of Seasoned Equity Offering Firms in Korea. International Journal of Accounting 37: 57-78.
82