earnings presentation first quarter 2012 -...
TRANSCRIPT
Earnings Presentation
First Quarter 2012
May 2012
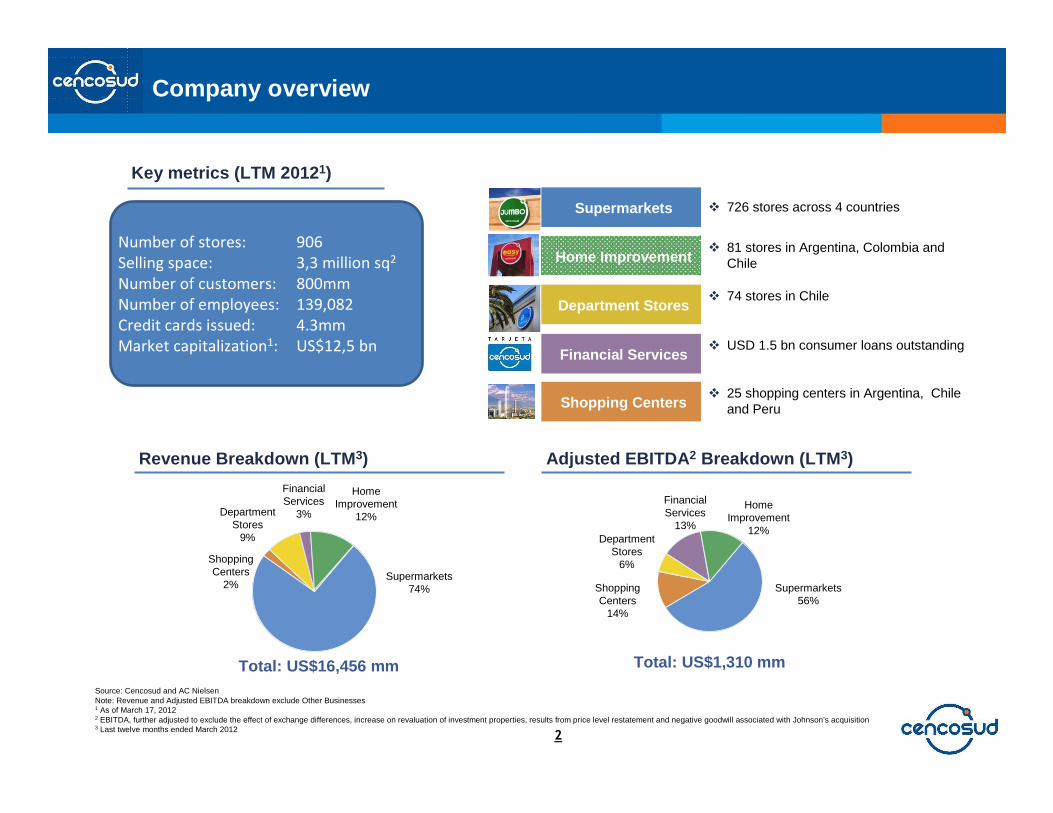
Source: Cencosud and AC NielsenNote: Revenue and Adjusted EBITDA breakdown exclude Other Businesses1 As of March 17, 20122 EBITDA, further adjusted to exclude the effect of exchange differences, increase on revaluation of investment properties, results from price level restatement and negative goodwill associated with Johnson’s acquisition3 Last twelve months ended March 2012
Company overview
Supermarkets
Home Improvement
Department Stores
Financial Services
Shopping Centers
� 726 stores across 4 countries
� 81 stores in Argentina, Colombia and Chile
� 74 stores in Chile
� 25 shopping centers in Argentina, Chile and Peru
� USD 1.5 bn consumer loans outstanding
2
Supermarkets74%
Home Improvement
12%
Shopping Centers
2%
Financial Services
3%Department Stores
9%
Revenue Breakdown (LTM 3) Adjusted EBITDA 2 Breakdown (LTM 3)
Total: US$16,456 mm
Department Stores
6%
Shopping Centers
14%
Financial Services
13%
Home Improvement
12%
Supermarkets56%
Total: US$1,310 mm
Number of stores: 906
Selling space: 3,3 million sq2
Number of customers: 800mm
Number of employees: 139,082
Credit cards issued: 4.3mm
Market capitalization1: US$12,5 bn
Key metrics (LTM 2012 1)
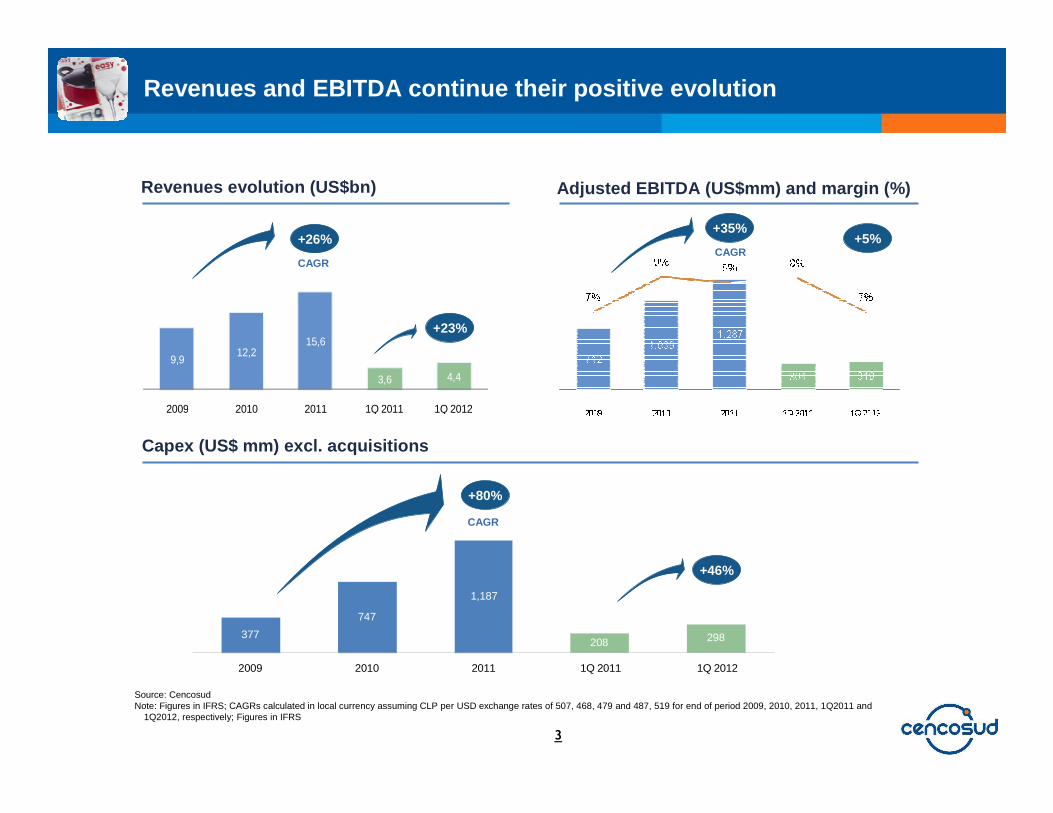
Revenues evolution (US$bn)
Revenues and EBITDA continue their positive evoluti on
Source: CencosudNote: Figures in IFRS; CAGRs calculated in local currency assuming CLP per USD exchange rates of 507, 468, 479 and 487, 519 for end of period 2009, 2010, 2011, 1Q2011 and
1Q2012, respectively; Figures in IFRS
3
9,912,2
15,6
3,6 4,4
2009 2010 2011 1Q 2011 1Q 2012
Adjusted EBITDA (US$mm) and margin (%)
377
747
1,187
208 298
2009 2010 2011 1Q 2011 1Q 2012
Capex (US$ mm) excl. acquisitions
+26%
CAGR
+80%
CAGR
+23%
+46%
+35%
CAGR+5%

…balance sheet flexibility and solid operational pe rformance haveallowed the company to maintain sustainable credit ratios
2,7 2,7 3,13,6
2009 2010 2011 1Q 2012
Net debt / Adjusted EBITDA
57% 53%72% 80%
2009 2010 2011 1Q 2012
3.6
7.7 7.0
4.5
2009 2010 2011 1Q 2012
Financial debt / EquityAdjusted EBITDA / Net interest expenses
4
Source: CencosudNote: Figures in IFRS; Ratios calculated in local currency assuming CLP per USD exchange rates of 507, 468, 519 and 487 for end of period 2009, 2010, 2011 and 1Q2012
Net debt evolution (US$bn)
2,03,1 3,7
4,7
2009 2010 2011 1Q 2012
� Duration of debt is 6 years at March 2012
� 28% of Cencosud’s debt is USD denominated, however, after cross currency swaps the exchange rate risk reduce to 9%
� The remaining is primarily UF and CLP denominated d ebt, matching the strong Chilean component in the E BITDA generation
Investment Highlights
Financial performance
First Quarter ResultsFirst Quarter Results
452606
777
193172
2009 2010 2011 1Q 2011 1Q 2012
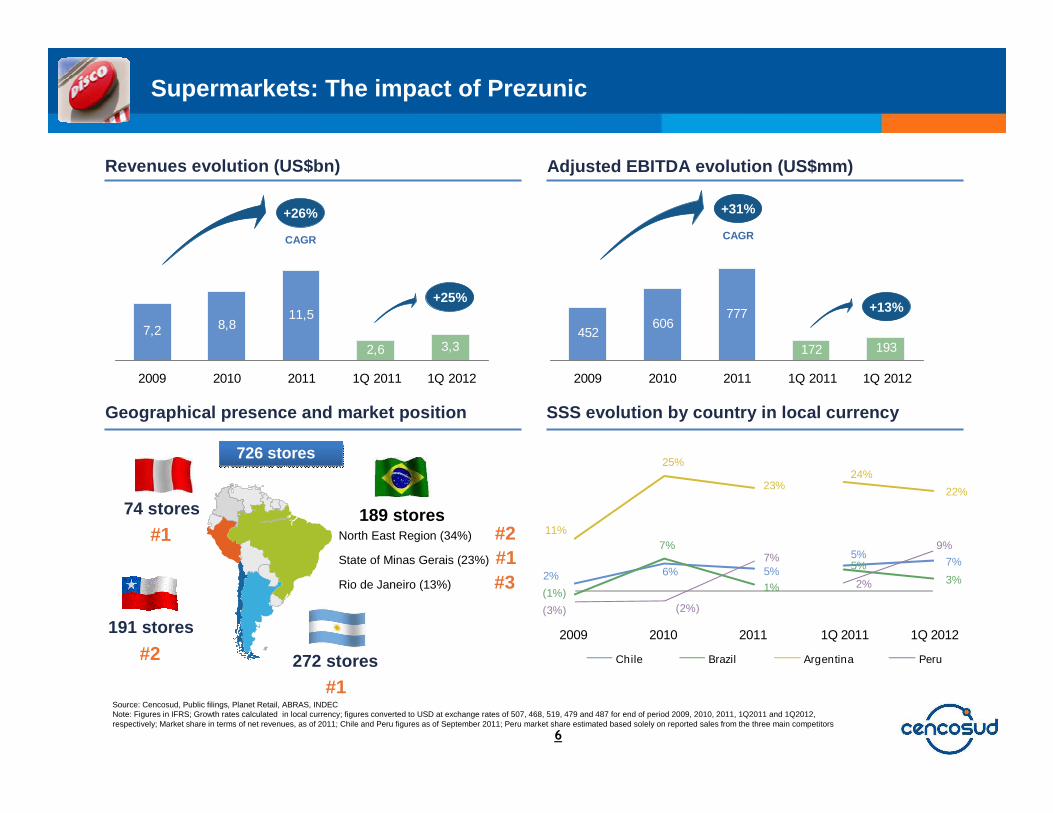
Geographical presence and market position
Revenues evolution (US$bn) Adjusted EBITDA evolution (US$mm)
Source: Cencosud, Public filings, Planet Retail, ABRAS, INDECNote: Figures in IFRS; Growth rates calculated in local currency; figures converted to USD at exchange rates of 507, 468, 519, 479 and 487 for end of period 2009, 2010, 2011, 1Q2011 and 1Q2012, respectively; Market share in terms of net revenues, as of 2011; Chile and Peru figures as of September 2011; Peru market share estimated based solely on reported sales from the three main competitors
SSS evolution by country in local currency
Supermarkets: The impact of Prezunic
6
3,32,6
11,58,87,2
2009 2010 2011 1Q 2011 1Q 2012
+26%
+13%
2% 6% 5%
5%7%
(1%)
7%
1%
5%3%
11%
25%
23%24%
22%
(3%) (2%)
7%
2%
9%
2009 2010 2011 1Q 2011 1Q 2012
Chile Brazil Argentina Peru
CAGR
272 stores
189 storesNorth East Region (34%) #2State of Minas Gerais (23%) #1Rio de Janeiro (13%) #3
726 stores726 stores
#1
191 stores
#2
74 stores
#1
+25%
+31%
CAGR

� US$497 million purchase price
� Increase exposure to Brazil
� Scale in Rio de Janeiro: 3rd largest supermarket chain
� Substantial growth opportunities: new formats, private labels, consumer finance
� Strong growth track record and brand recognition
� 72,108 m2 selling space and 31 stores incorporated
� Prezunic in 1Q12 accounted revenues of USD337 MM
17.9
14.4
11.1
2.7
1.2
1.2
1.0
0.9
0.9
CBD
Carrefour
Wal-Mart
Cencosud
Zaffari
Prezunic
DMA
Angeloni
COOP
Supermarkets: Prezunic Acquisition
Geographic presence
7
National ranking market share (%)
Source: Company filings, Planet Retail, ABRAS, IBGENote: Market share by % of industry’s gross revenues
GBarbosa Supermarkets (including EletroShow and pharmacies)Perini
Legend
Mercantil Rodrigues
Bretas Supermercados
Prezunic Supermercados
#1 Minas Gerais#2 Northeast region#3 Rio de Janeiro
17.9
14.4
11.1
3.9
1.2
1.0
0.9
0.9
CBD
Carrefour
Wal-Mart
Cencosud
Zaffari
DMA
Angeloni
COOP
Investment highlights
Present in 8 states accounting for approximately 33 % of national GDP with aggregate real GDP growth (2005-
2009) of 3.4% and 78.6mm inhabitants

1,258 1,356 1,460 1,552 1,476 1,338 1,361 1,412 1,469 1,496 1,431 1,547 1,797 1,942 2,127
83 116 124
333 458
2007 2008 2009 2010 2011 2007 2008 2009 2010 2011 2007 2008 2009 2010 2011 2007 2008 2009 2010 2011
9.1 12.3 13.0 16.5 17.3
7.7 9.8 10.4 13.3 15.4 7.7 9.2 9.8 12.6 14.4
0.2 1.1 1.1 1.7
4.2
2007 2008 2009 2010 2011 2007 2008 2009 2010 2011 2007 2008 2009 2010 2011 2007 2008 2009 2010 2011
Cencosud Brazil Carrefour Brazil CBD Food Walmart Brazil
CAGR 17%CAGR 19% CAGR 17%
Date Target Acquirer Amount (US$mm) EV/sales
Apr-07 Atacadao Carrefour 1,087 0.6x
Nov-07 Assaí CBD 197 0.4x
Nov-07 GBarbosa Cencosud 430 0.5x
Mar-10 Super Familia Cencosud 33 0.3x
Apr-10 28 -
Oct-10 Bretas Cencosud 705 0.5x
Jan-12 Prezunic Cencosud 497 0.4x
Median 0.5x
CAGR 118%
CAGR 4%CAGR 3% CAGR 10%
CAGR 53%
Net Revenues (US$bn)
Selling space (‘000s m 2)
Only active and successful consolidator in Brazil 1
Supermarkets: Competitive Landscape in Brazil
8
Source: Company filings, Planet Retail, equity researchNote: Carrefour Brazil figures based on gross revenues; Cencosud figures are pro-forma to Prezunic acquisition; Average FX rate during the respective period used for calculations1 Only considers transactions with deal size of US$25mm and greater

87137
171
46 51
2009 2010 2011 1Q 2011 1Q 2012
2%
24%
5%
11%
3%
(4%)
12%
7%
11%
2%
28%32%
28%30%
2009 2010 2011 1Q 2011 1Q 2012
Chile Colombia Argentina
Geographical presence and market position
Adjusted EBITDA evolution (US$mm)Revenues evolution (US$mm)
29 stores
#2
4 stores
48 stores
#1
81 stores81 stores
SSS evolution by country in local currency
Home Improvement: Remarkable Argentina performance
9
529472
1.9581.613
1.202
2009 2010 2011 1Q 2011 1Q 2012
Source: CencosudNote: Figures in IFRS; Growth rates calculated in local currency; figures converted to USD at exchange rates of 507, 468, 519, 479 and 487 for end of period 2009, 2010, 2011, 1Q2011 and 1Q2012, respectively;
Market position based on net revenues, as of 2011
+28%
CAGR
+40%
CAGR
+12% +11%

Shopping Centers: 2Q12 opening of Costanera
10
Adjusted EBITDA evolution (US$mm)Revenues evolution (US$mm)
140175 206
44 44
2009 2010 2011 1Q 2011 1Q 2012
6761
268230194
2009 2010 2011 1Q 2011 1Q 2012
Source: CencosudNote: Figures in IFRS; Growth rates calculated in local currency; figures converted to USD at exchange rates of 507, 468, 519, 479 and 487 for end of period 2009, 2010, 2011, 1Q2011 and 1Q2012, respectively;
Figures exclude intercompany operations; Market position based on gross leased area, as of 2011
+18%
CAGR
+21%
CAGR
Geographic presence and occupancy rates
#214 Shopping Centers
Gross Leased Area: 228,999 m2
99% occupancy rate
#29 Shopping Centers
Gross Leased Area: 282,693 m2
98% occupancy rate
2 Shopping CentersGross Leased Area: 54,750 m2
95% occupancy rate
25 Shopping Centers25 Shopping Centers
+9%+0,4%
Costanera Center
� Largest multi-purpose commercial complex in Chile
� 335 stores, including Jumbo, Easy and Paris
� Food court, 12 movie theaters, bowling court, medical centers and gym
� Shopping mall opened May 2012 with 150,000 sq GLA
� 2 premium Office Towers and 1 Hotel schedule to open end of 2013
� Costanera Center tower, designed by Cesar Pelli, is the highest building in South America, standing 300 meters tall
� Total capex of USD 1,098 MM
� Mitigation costs are USD 63 MM, of which USD 27 MM are already incurred
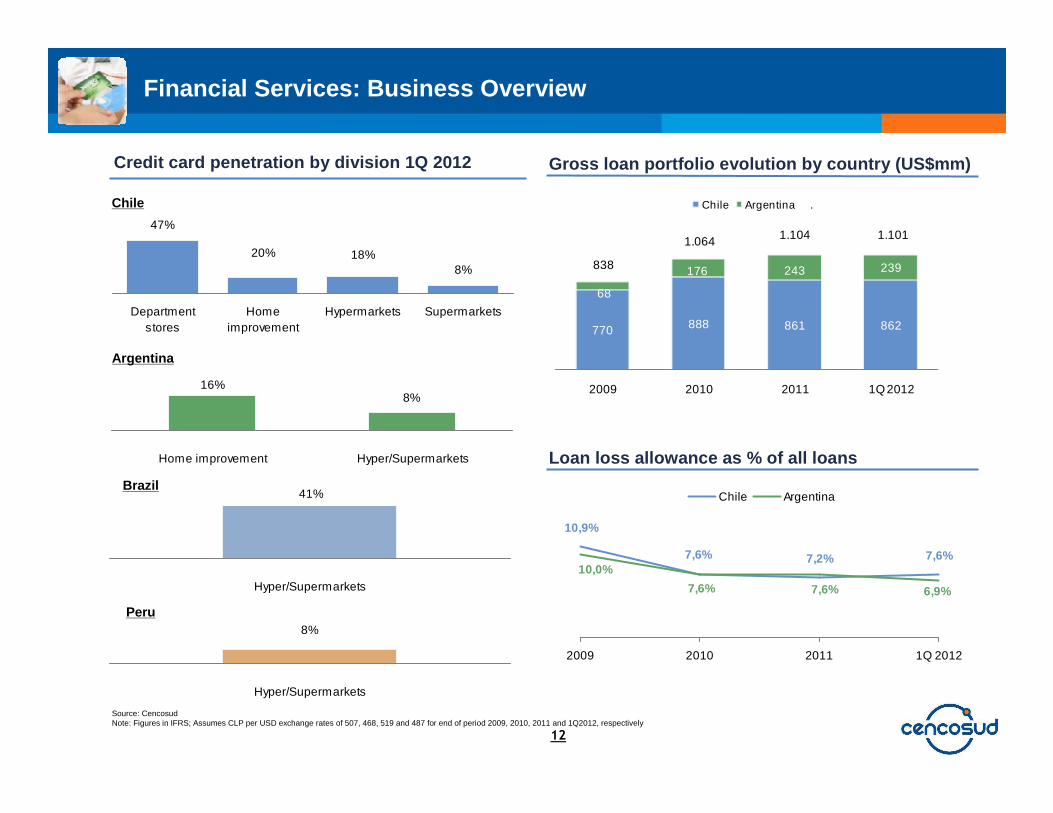
10,9%
7,2% 7,6%7,6%10,0%
6,9%7,6%7,6%
2009 2010 2011 1Q 2012
Chile Argentina
8%18%20%
47%
Departmentstores
Homeimprovement
Hypermarkets Supermarkets
8%16%
Home improvement Hyper/Supermarkets
Credit card penetration by division 1Q 2012
Source: CencosudNote: Figures in IFRS; Assumes CLP per USD exchange rates of 507, 468, 519 and 487 for end of period 2009, 2010, 2011 and 1Q2012, respectively
Financial Services: Business Overview
Loan loss allowance as % of all loans
Gross loan portfolio evolution by country (US$mm)
12
770 888 861 862
68
176 243 239838
1.064 1.104 1.101
2009 2010 2011 1Q 2012
Chile Argentina .Chile
Argentina
41%
Hyper/Supermarkets
Brazil
8%
Hyper/Supermarkets
Peru

Market opportunities and strategy
� Ninth largest consumer market in the world: Retail sales of
US$1.1 trillion during 20111
� Demographics capable of supporting Cencosud stores: 100
cities above 250 thousand in population
� Underpenetrated formal retail segment
� Best macroeconomic environment in the last 50 years
� Strong consumption, stable inflation rate and employment growth
� Underpenetrated formal retail market (30% of total spending)
� Growing purchasing power and household spending
� Developed credit markets with access to middle income
consumers
� Underpenetrated market with substantial growth opportunities
� Solid macroeconomic fundamentals
� Sustainable household consumption growth coupled with a
expansionary credit market environment
� Underpenetrated retail market with vast potential
1 Planet Retail13
Market opportunities Strategy
Enhance customer loyalty
Continue to develop and expand our multi-
format and multi-brand approach
Focus on operating margins and cash
flows
Organic expansion in selective markets
Continue to pursue opportunistic
acquisitions while maximizing synergies
Enhance customer loyalty
����
����
����
����
����
����
����
����
����
����
����
����
����
����
����
����
����
��������
����

-1,7%
19,7%
5,2%
17,9%
9,4%
2009 2010 2011 1Q 2011 1Q 2012
2009
Source: CencosudNote: Figures in IFRS; Growth rates calculated in local currency; figures converted to USD at exchange rates of 507, 468, 519, 479 and 487 for end of period 2009, 2010, 2011, 1Q2011, 1Q2012, respectively1 As of December 2011, including 39 Jonhson’s stores
SSS evolution in local currency
Department Stores: Impacted by Johnson’s
35 stores35 stores
Market Share by selling space – Chile 1
14
Adjusted EBITDA evolution (US$mm)Revenues evolution (US$mm)
20
8096
13 5
2009 2010 2011 1Q 2011 1Q 2012
9291.227 1.422
298 377
2009 2010 2011 1Q 2011 1Q 2012
+24% +117%
CAGR CAGR
39 stores39 stores
Cencosud36%
Falabella24%
Ripley24%
La Polar16%
+27%-62%

Department stores: acquisition of Johnson’s
Transaction summary
� In December 2011, we acquired an 85.58% interest
� 39 stores throughout Chile under the Johnson’s brand and 13 stores using the FES brand
� 120,000 m2 of selling space incorporated
Financial highlights
� Aggregate purchase price of Ch$32,606 million
� Of which, Ch$17,576 million to repay indebtedness at Johnson’s, while the rest to be used for working capital
� 2011 sales of Ch$118,447 million from its retail operations
Integration and objectives
� Replace all Johnson’s credit cards with Cencosud credit cards
� Improve our coverage of the low and middle income market segments in Chile
Key considerations Selling space expansion (‘000s m 2)
117
241236216
2009 2010 2011
Paris Johnson's359
359
241
243
236
161
Falabella
Ripley
La Polar
Largest department store presence in Chile (‘000s sq. meters)
+49%
Source: Company filingsNote: Figures as of 4Q11
+
15

Q&A