earnings presentation second quarter 2016 - …...earnings presentation second quarter 2016 28 july...
TRANSCRIPT

1
Earnings Presentation
Second Quarter 2016 28 July 2016
12:00 noon UK time
2
Forward-looking statements
Certain statements made in this announcement may include ‘forward-looking statements’. These statements may be identified by the use of words like ‘anticipate’, ‘believe’, ‘could’, ‘estimate’, ‘expect’, ‘forecast’, ‘intend’, ‘may’, ‘might’, ‘plan’, ‘predict’, ‘project’, ‘scheduled’, ‘seek’, ‘should’, ‘will’, and similar expressions. The forward-looking statements reflect our current views and are subject to risks, uncertainties and assumptions. The principal risks and uncertainties which could impact the Group and the factors which could affect the actual results are described but not limited to those in the ‘Risk Management’ section in the Group’s Annual Report and Consolidated Financial Statements for the year ended 31 December 2015. These factors, and others which are discussed in our public announcements, are among those that may cause actual and future results and trends to differ materially from our forward-looking statements: actions by regulatory authorities or other third parties; our ability to recover costs on significant projects; the general economic conditions and competition in the markets and businesses in which we operate; our relationship with significant clients; the outcome of legal and administrative proceedings or governmental enquiries; uncertainties inherent in operating internationally; the timely delivery of vessels on order; the impact of laws and regulations; and operating hazards, including spills and environmental damage. Many of these factors are beyond our ability to control or predict. Other unknown or unpredictable factors could also have material adverse effects on our future results. Given these factors, you should not place undue reliance on the forward-looking statements.

3
Jean Cahuzac CEO

4
Q2 2016 highlights
OPERATIONAL FINANCIAL ORDER INTAKE OUTLOOK
• Revenue $961m
• Adjusted EBITDA $280m
• Adjusted EBITDA margin 29.2%
• Diluted EPS of $0.40
• Net cash of $728m
• Strong overall project execution
• Further cost reduction and resizing measures announced
• Vessel utilisation Active: 82% Total: 67%
• Delivery of new-build vessels rescheduled
• Order backlog increased to $7.1 billion
• Order intake $1.6 billion
• Announced awards:
- Beatrice wind farm, BOWL
- Callater, Apache
• Market conditions remain challenging
• Timing of new awards to market remains uncertain
• Increasing early engagement opportunities
• Long-term outlook remains positive

5
Operational highlights
• Reliable and consistent project execution • Seasonal increase in North Sea activity • Significant progress on some of our major projects
Catcher (UK)
Aasta Hansteen (Norway)
TEN (Ghana)
WND Ph. 1 (Egypt)
END (Egypt)
Martin Linge (Norway)
Maria (Norway)

6
Our resizing and reorganising
• New organisation structure based on our core markets – Increased focus on our commercial and operational strength
– Leaner organisation structure reflects new ways of working
• Commercial focus: reduce capacity, retain capability – Additional resizing programme initiated in June 2016
• Adapt to expected lower levels of market activity • Increase efficiency and further enhance our competiveness
– Maintain leading market position • Maintain core expertise in engineering and project management • Maintain critical mass with Global Project Centres integration
SURF and Conventional i-Tech Services
(includes Life of Field and ROV services)
Corporate (includes Renewables
and Heavy-lift)

7
2016 $1.9bn (27%)
2017 $2.5bn (35%)
2018+ $2.7bn (38%)
Corporate(4)
$1.3bn (19%)
Backlog by segment
i-Tech Services
0.8bn (11%)
Backlog by Execution Date
Q2 Backlog and order intake
• Backlog of $7.1 billion(1), as at 30 June 2016 • $1.6 billion(2) order intake including announced awards:
– Beatrice wind farm, offshore UK;
– Callater, offshore UK
(1) Approximately $50 million adverse impact from foreign currency movements in the quarter (2) Included $47 million adverse impact from the early termination of PLSV Seven Mar contract in the quarter (3) Included $2.1 billion related to 9 long-term contracts for PLSVs in Brazil, approximately 70% of which
related to the four new-build PLSVs (Seven Waves, Seven Rio, Seven Sun and Seven Cruzeiro) (4) Corporate includes Renewables and Heavy-lift
Southern and Global Projects
SURF and Conventional(3)
$5.0bn (70%)

8
Business Unit outlook
Surf and Conventional • Low market activity and uncertain timing of new awards to market
• Remaining competitive while maintaining the right project risk profile
• Increasing number of early engagement opportunities
• Active SURF project tenders include:
• Fortuna (Equatorial Guinea) • Golfinho (Mozambique) • KG-DWN, block 98/2 (India)
• Mad Dog 2 (US GoM) • Platina (Angola) • Atoll (Egypt) • KG-D6, R-Cluster (India)
i-Tech Services • Focusing on expanding life of field activities worldwide
Renewables and Heavy-lift • Sustaining tender activity level

9
Ricardo Rosa CFO

10
Income statement – key highlights
Three months ended
In $ millions, unless otherwise indicated 30 June 16 Unaudited
30 June 15 Unaudited
Revenue 961 1,352
Net operating income (NOI) 177 169
Income before taxes 206 137
Taxation (69) (49)
Net income 136 88
Adjusted EBITDA(1) 280 275
Adjusted EBITDA margin 29% 20%
Diluted earnings per share 0.40 0.27
Weighted average number of shares (millions) 343 347
(1) Adjusted EBITDA defined in Appendix

11
Business Unit performance
Note: excludes contribution from Corporate segment Net Operating Loss for Corporate was $24 million in Q2 2016 and $16 million in H1 2016, which included a restructuring charge of $53 million recognised in Q2 2016 in relation to the 2016 resizing programme
Revenue NOI
$435m
$114m
Southern Hemisphere and Global Projects Q2 2016
Revenue NOI
$523m
Northern Hemisphere and Life of Field Q2 2016
$87m
Revenue NOI
$847m
$263m
Southern Hemisphere and Global Projects H1 2016
Revenue NOI
$124m
Northern Hemisphere and Life of Field H1 2016
$854m

12
• 2016: in progress – 5 active vessels to be
stacked or released
– Reduce the workforce to 8,000 people
– Complete by early 2017 – $350 million annual savings – Up to $100m restructuring
charge in 2016
• 2015: completed – First resizing programme – 13 vessels stacked or
released – Reduced the workforce by
3,600 people – $550 million annual savings – $136m restructuring charge
in 2015
39 30 27 29
5 7 5
5 4 4 4
Q2 '15 Q4 '15 Q1 '16 Q2 '16
Vessels
Active fleet Stacked Under construction
Delivering our resizing programme
44 39 38
14 13 10 9
Q4 '13 Q4 '14 Q4 '15 Q2 '16
Workforce (‘000s)
38

13
Summary of year to date 2016 cash flow
$ millions
Cash and cash equivalents at 31 Dec 2015 947
Net cash generated from operating activities 479 Decrease of $8 million in net operating liabilities
Net cash flow used in investing activities (173) Included capital expenditure of $205 million mainly on new-build vessel programme
Net cash flow used in financing activities (79) Included $72 million repurchase of convertible bonds
Other movements 6
Cash and cash equivalents at 30 Jun 2016 1,180
• In the second quarter $198 million net cash generated from operating activities and $123 million invested in capital expenditure
• Net cash of $728 million as at 30 June 2016 compared to $423 million at 31 December 2015

14
New-build vessels programme
Amounts include an estimate for interest to be capitalised during construction. E = estimated
557 544 499
162
108
55 Upto 31 Dec
20132014 2015 2016 E 2017 E
Capital expenditure ($ millions) Forecast
Actual spend to date
Seven Waves Seven Rio Seven Cruzeiro Seven Sun Seven Arctic
Delivered 2014
Delivered 2015
Due H2 2016
Due H1 2017
Due H1 2017
Due H1 2017
Seven Kestrel
Estimated total spend: $1.9bn

15
Financial guidance
2016 Guidance
Revenue Significantly lower than 2015
Adjusted EBITDA percentage margin Lower than 2015
Administrative expense $240 million - $250 million
Net finance charge Up to $5 million
Depreciation and Amortisation $380 million - $400 million
Full year effective tax rate 30% - 32%
Total capital expenditure $380 million - $410 million
- New build programme $270 million
- Sustaining capex $110 million - $140 million
Net working capital outflow $250 million - $350 million

16
Jean Cahuzac CEO

17
Our differentiators
Strong local businesses and embedded local capability
A diverse fleet of vessels and strategic global assets
Project delivery based on our expertise and know-how
Market-driven and cost-effective solutions
People Technology
Assets Local presence

18
Our People
• Our highly skilled and experienced workforce deliver projects safely and reliably
• Reduction in capacity in line with lower expected activity levels and new ways of working
• Focus on maintaining competitiveness and protecting our core offering through the cycle

19
Our Technology
• Developing and implementing market-leading technology to drive down cost
• Technology and innovation are central to the evolution of offshore developments
• Early engagement is key to unlocking cost savings
• Integrated solutions are gaining traction
Riser Systems
Flowline Systems
Bundles
Subsea Processing
LOF & remote intervention O
ur fiv
e st
rate
gic
tech
nolo
gy p
rogr
amm
es
20
5 Light
construction
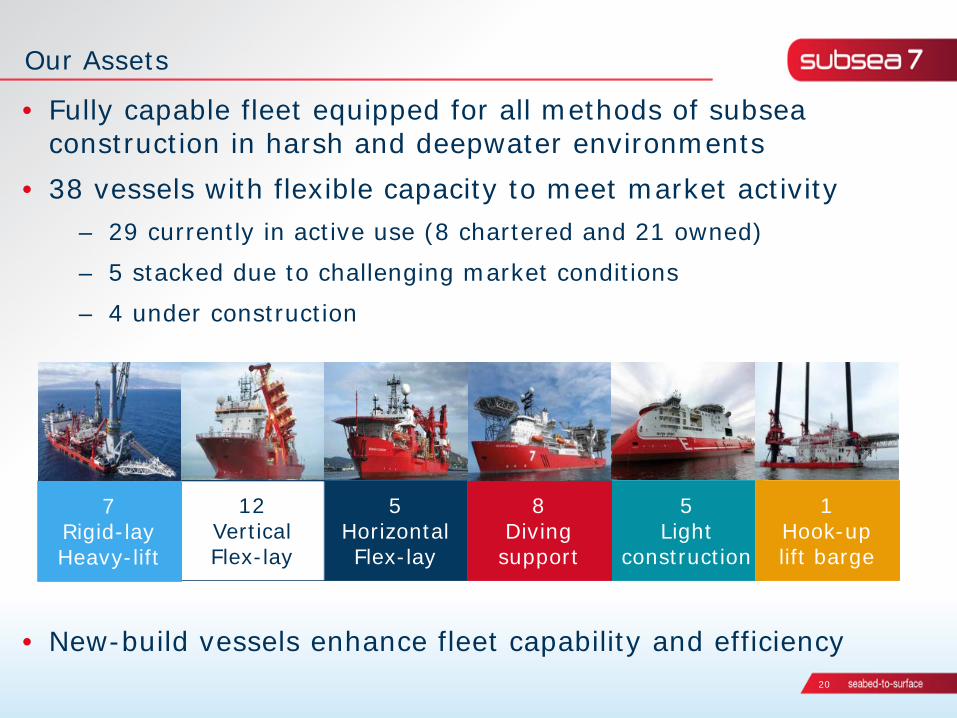
• Fully capable fleet equipped for all methods of subsea construction in harsh and deepwater environments
• 38 vessels with flexible capacity to meet market activity – 29 currently in active use (8 chartered and 21 owned)
– 5 stacked due to challenging market conditions
– 4 under construction
• New-build vessels enhance fleet capability and efficiency
Our Assets
5 Horizontal Flex-lay
8 Diving support
12 Vertical Flex-lay
7 Rigid-lay Heavy-lift
1 Hook-up lift barge

21
Subsea 7: a world-leading services contractor
• The foreseeable future remains challenging
• Once awarded, large projects can take 12 to 18 months of planning before offshore activity commences
• We are driving change within the Group and across the industry to adapt to the lower oil price environment
• Innovation is central to creating a sustainable low cost, high quality service for our clients
• We are positioned strongly to win and execute projects, but market activity remains low
• The long-term outlook for deepwater oil and gas production remains intact

22
Q&A

23 23
Appendix
• Our global presence • Major project progression • Adjusted EBITDA • Segmental analysis • Supplementary Income Statement • Balance Sheet summary • Our fleet

24
Our global presence
• Catcher, Premier • Culzean, Maersk • Callater, Apache • Western Isles, Dana • Montrose, Talisman • USC & Pipelay, Shell • SCIRM, BP • DSVi, Various
• Stampede, Hess • Coulomb Ph2, Shell • Holstein Deep, Freeport McMoran
• PLSVs, Petrobras
• T.E.N., Tullow (JV Partner) • West Nile Delta Phase 1, BP • West Nile Delta Phase 2, BP • West Nile Delta, Burullus • East Nile Delta, Pharonic • Lianzi, Chevron
• EPRS, INPEX/Chevron • Persephone, Woodside
• Martin Linge, Total • Aasta Hansteen, Statoil • Maria, Wintershall • Mariner, Statoil
• Beatrice wind farm, BOWL
25
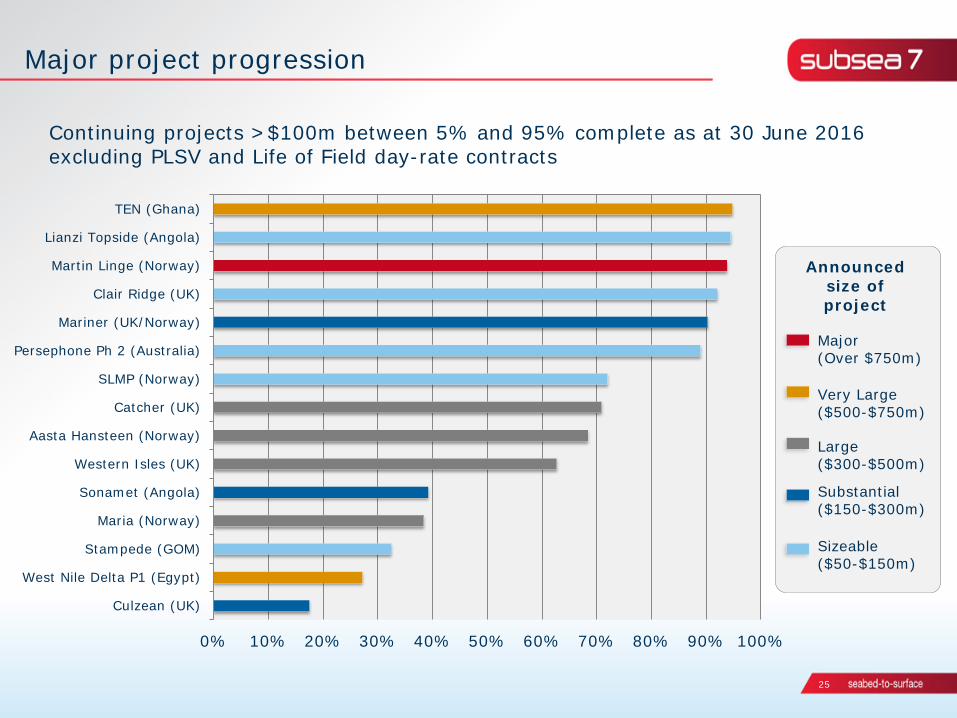
Major project progression
Continuing projects >$100m between 5% and 95% complete as at 30 June 2016 excluding PLSV and Life of Field day-rate contracts
0% 10% 20% 30% 40% 50% 60% 70% 80% 90% 100%
TEN (Ghana)
Lianzi Topside (Angola)
Martin Linge (Norway)
Clair Ridge (UK)
Mariner (UK/Norway)
Persephone Ph 2 (Australia)
SLMP (Norway)
Catcher (UK)
Aasta Hansteen (Norway)
Western Isles (UK)
Sonamet (Angola)
Maria (Norway)
Stampede (GOM)
West Nile Delta P1 (Egypt)
Culzean (UK)
Sizeable ($50-$150m)
Substantial ($150-$300m)
Large ($300-$500m)
Very Large ($500-$750m)
Major (Over $750m)
Announced size of project

26
Adjusted EBITDA • Adjusted earnings before interest, taxation, depreciation and amortisation (‘Adjusted EBITDA’) is a non-IFRS
measure that represents net income before additional specific items that are considered to impact the comparison of the Group’s performance either period-on-period or with other businesses. The Group defines Adjusted EBITDA as net income adjusted to exclude depreciation, amortisation and mobilisation costs, impairment charges or impairment reversals, finance income, other gains and losses (including gain on disposal of subsidiary and gain on distribution), finance costs and taxation. Adjusted EBITDA margin is defined as Adjusted EBITDA divided by revenue, expressed as a percentage.
• The items excluded from Adjusted EBITDA represent items which are individually or collectively material but which are not considered representative of the performance of the business during the periods presented. Other gains and losses principally relate to disposals of investments, property, plant and equipment and net foreign exchange gains or losses. Impairments of assets represent the excess of the assets’ carrying amount over the amount that is expected to be recovered from their use in the future or their sale.
• Adjusted EBITDA and Adjusted EBITDA margin have not been prepared in accordance with IFRS as adopted by the EU. These measures exclude items that can have a significant effect on the Group’s income or loss and therefore should not be considered as an alternative to, or more meaningful than, net income (as determined in accordance with IFRS) as a measure of the Group’s operating results or cash flows from operations (as determined in accordance with IFRS) as a measure of the Group’s liquidity.
• Management believes that Adjusted EBITDA and Adjusted EBITDA margin are important indicators of the operational strength and the performance of the business. These non-IFRS measures provide management with a meaningful comparative for its Business Units, as they eliminate the effects of financing, depreciation and taxation. Management believes that the presentation of Adjusted EBITDA is also useful as it is similar to measures used by companies within Subsea 7’s peer group and therefore believes it to be a helpful calculation for those evaluating companies within Subsea 7’s industry. Adjusted EBITDA margin may also be a useful ratio to compare performance to its competitors and is widely used by shareholders and analysts following the Group’s performance. Notwithstanding the foregoing, Adjusted EBITDA and Adjusted EBITDA margin as presented by the Group may not be comparable to similarly titled measures reported by other companies.

27
For the period (in $millions)
Three Months Ended 30 June 2016
Three Months Ended 30 June 2015
Net operating income 177 169
Depreciation, amortisation and mobilisation 93 106
Impairment of property, plant and equipment 10 –
Adjusted EBITDA 280 275
Revenue 961 1,352
Adjusted EBITDA % 29% 20%
Reconciliation of Adjusted EBITDA
Net operating income to Adjusted EBITDA
For the period (in $millions)
Three Months Ended 30 June 2016
Three Months Ended 30 June 2015
Net income 136 88
Depreciation, amortisation and mobilisation 93 106
Impairment of property, plant and equipment 10 –
Finance income (6) (5)
Other gains and losses (23) 36
Finance costs - 1
Taxation 69 49
Adjusted EBITDA 280 275
Revenue 961 1,352
Adjusted EBITDA % 29% 20%
Net income to Adjusted EBITDA

28
In $ millions (unaudited) Northern Hemisphere and Life of Field
Southern Hemisphere and Global Projects Corporate TOTAL
Revenue 642 707 4 1,352
Net operating income 105 131 (67) 169
Finance income 5
Other gains and losses (36)
Finance costs (1)
Income before taxes 137
In $ millions (unaudited) Northern Hemisphere and Life of Field
Southern Hemisphere and Global Projects Corporate TOTAL
Revenue 523 435 3 961
Net operating income 87 114 (24) 177
Finance income 6
Other gains and losses 23
Finance costs -
Income before taxes 206
Segmental analysis
For the three months ended 30 June 2016
For the three months ended 30 June 2015

29
Restated segments
• Six quarters of restated segmental results
In $ millions
Revenue 2015 2016
Q1 Q2 Q3 Q4 Full Year Q1 Q2 Half
Year
SURF & Conventional 1,063 1,229 1,068 923 4,283 640 865 1,505
i-Tech Services 116 120 111 99 446 103 93 196
Corporate 2 3 20 3 29 3 3 6
Total Revenue 1,181 1,352 1,200 1,025 4,758 746 961 1,707
In $ millions
Net Operating Income excluding goodwill impairment 2015 2016
Q1 Q2 Q3 Q4 Full Year Q1 Q2 Half
Year
SURF & Conventional 153 230 253 204 840 171 188 359
i-Tech Services 13 6 12 (9) 22 15 13 28
Corporate 10 (67) (51) (90) (198) 7 (24) (16)
Total Net Operating Income 176 169 214 106 665 194 177 371
• Revenue represents only external revenues for each segment. • Corporate includes Renewables and Heavy-lift. It also includes restructuring charges related to the Group’s
resizing and cost reduction measures and asset impairment charges.

30
Income statement – supplementary details
In $ millions Three months ended
30 June 16 Unaudited
30 June 15
Unaudited
Administrative expenses (68) (79)
Share of net income of associates and joint ventures 27 14
Depreciation and amortisation 93 106
Impairment of property, plant and equipment 10 –
Net operating income 177 169
Net finance income 6 5
Other gains and losses 23 (36)
Income before taxes 206 137
Taxation (69) (49)
Net income 136 88
Net income attributable to:
Shareholders of the parent company 137 94
Non-controlling interests (1) (5)

31
Summary balance sheet
In $ millions
30 Jun 2016
Unaudited
31 Dec 2015
Audited
Assets
Non-current assets
Goodwill 726 767
Property, plant and equipment 4,459 4,559
Other non-current assets 556 502
Total non-current assets 5,741 5,828
Current assets
Trade and other receivables 594 584
Construction contracts - assets 119 278
Other accrued income and prepaid expenses 157 152
Cash and cash equivalents 1,180 947
Other current assets 88 65
Total current assets 2,138 2,026
Total assets 7,879 7,854
In $ millions
30 Jun 2016
Unaudited
31 Dec 2015
Audited
Equity & Liabilities
Total equity 5,497 5,346
Non-current liabilities
Non-current portion of borrowings 451 524
Other non-current liabilities 182 210
Total non-current liabilities 633 734
Current liabilities
Trade and other liabilities 1,066 1,123
Construction contracts – liabilities 378 459
Deferred revenue 6 10
Other current liabilities 298 182
Total current liabilities 1,748 1,774
Total liabilities 2,382 2,508
Total equity & liabilities 7,879 7,854

32
Our fleet as at 30 June 2016
• 29 vessels in the active fleet 21 Owned: Seven Borealis Seven Oceans Seven Condor Seven Rio Seven Seas Sapura 3000 (1) Oleg Strashnov (1) Stanislav Yudin (1)
Rockwater 2 Seven Atlantic Seven Falcon Seven Osprey Seven Pelican Kommandor 3000 Seven Eagle Seven Mar Simar Esperança
8 Chartered: Skandi Acergy Normand Seven Grant Candies Normand Subsea Siem Stingray Subsea Viking Normand Oceanic (2) Seven Viking (2)
• 5 vessels stacked
• 4 under construction
Seven Navica Seven Discovery Rockwater 1 Seven Inagha Seven Petrel
Seven Sun Seven Arctic Seven Kestrel Seven Cruzeiro
- delivery due H2 2016 - delivery due H1 2017 - delivery due H1 2017 - delivery due H1 2017
• Up to 5 vessels will be removed from the active fleet by early 2017 (1) Owned and operated by a joint venture (2) Long-term charter from a vessel-owning joint venture
Seven Antares Seven Waves Seven Pacific Seven Phoenix

33 Page 28-Jul-16