earnings release - 1.31 - walmart.com · earnings release - 1.31.2017 created date: 20170220130
TRANSCRIPT
Walmart U.S. Q4 comps grew 1.8% and Walmart U.S. eCommerce GMV grew 36.1%,Company reports GAAP Q4 FY17 EPS of $1.22 and full-year GAAP EPS of $4.38,
Q4 adjusted EPS1 of $1.30 and full-year adjusted EPS1 of $4.32
Fourth-quarter highlights
Diluted EPS was $1.22, which includes the impact of the discrete items detailed in this press release. Excluding these items1, EPS was $1.30.
“We're moving with speed to become more of a digital enterprise and better serve customers. We had a very solid fourth quarter with U.S. comp sales growth of 1.8 percent and U.S. e-commerce GMV growth of 36 percent. Our international business is consistently delivering solid sales growth in constant currency, and Sam's Club posted its best comp sales growth of the year. I want to thank our talented associates for their work. We have more work to do, but I'm pleased with our progress.”
Doug McMillon, President and CEO, Wal-Mart Stores, Inc.
Total revenue was $130.9 billion, an increase of 1.0%. Excluding currency1, total revenue was $133.6 billion, an increase of 3.0%.
Walmart U.S. comp sales increased 1.8%, driven by a trafficincrease of 1.4%. Neighborhood Market comps increasedapproximately 5.3%.
E-commerce growth at Walmart U.S. was strong as sales andGMV increased 29.0% and 36.1%, respectively, includingJet.com and online grocery.
Net sales at Walmart International were $31.0 billion, a decrease of 5.1%. Excluding currency1, net sales were $33.7 billion, an increase of 3.0%.
The company generated $11.9 billion in operating cash flow and returned $3.6 billion to shareholders throughdividends and share repurchases.
Fiscal 2017 highlights
Diluted EPS from continuing operations was $4.38, which includes certain discrete items detailed in this press release. Excluding these items1, EPS was $4.32.
Total revenue was $485.9 billion, an increase of 0.8%. Excluding currency1, total revenue was $496.9 billion, an increase of 3.1%.
Operating income was $22.8 billion, a decrease of 5.6%. Excluding currency1, operating income was $23.4 billion, a decrease of 2.9%.
The company generated $31.5 billion in operating cash flow and returned $14.5 billion to shareholdersthrough dividends and share repurchases.
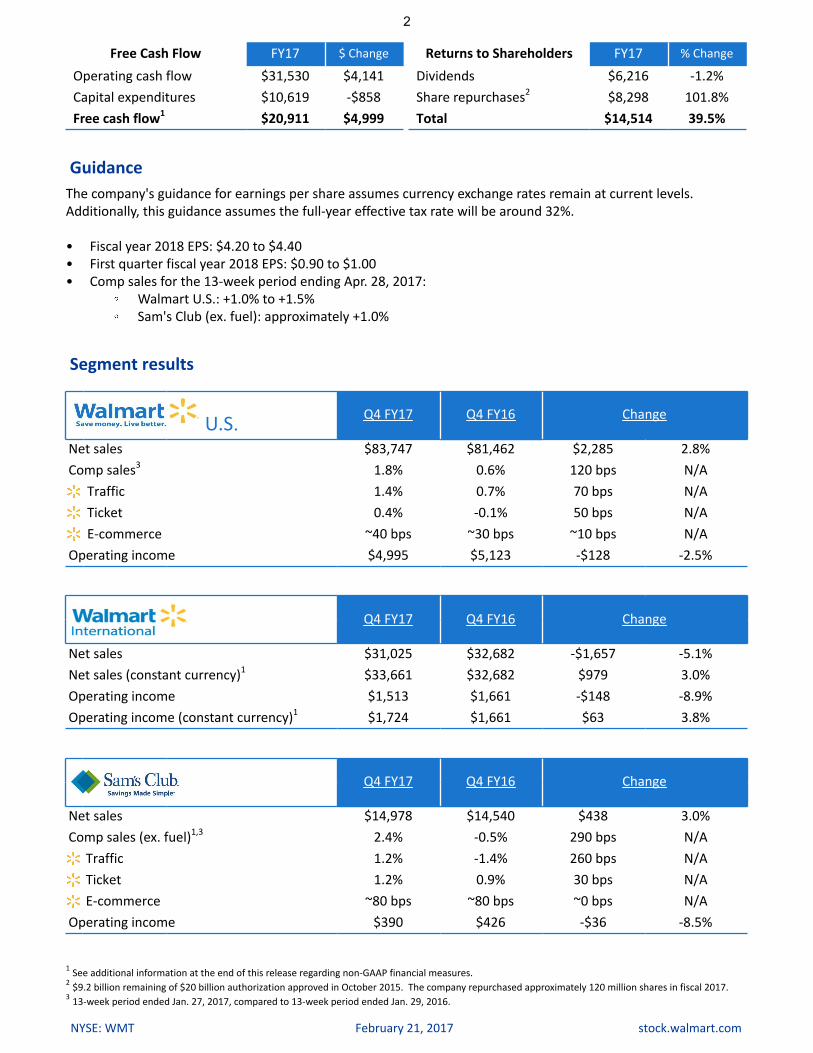
Key results(Amounts in millions, except as noted)
Q4 FY17 Q4 FY16 Change
Revenue $130,936 $129,667 $1,269 1.0%
Revenue (constant currency)1 $133,584 $129,667 $3,917 3.0%
Operating income $6,205 $6,642 -$437 -6.6%
Operating income (constant currency)1 $6,414 $6,642 -$228 -3.4%
1 See additional information at the end of this release regarding non-GAAP financial measures.
NYSE: WMT February 21, 2017 stock.walmart.com
2
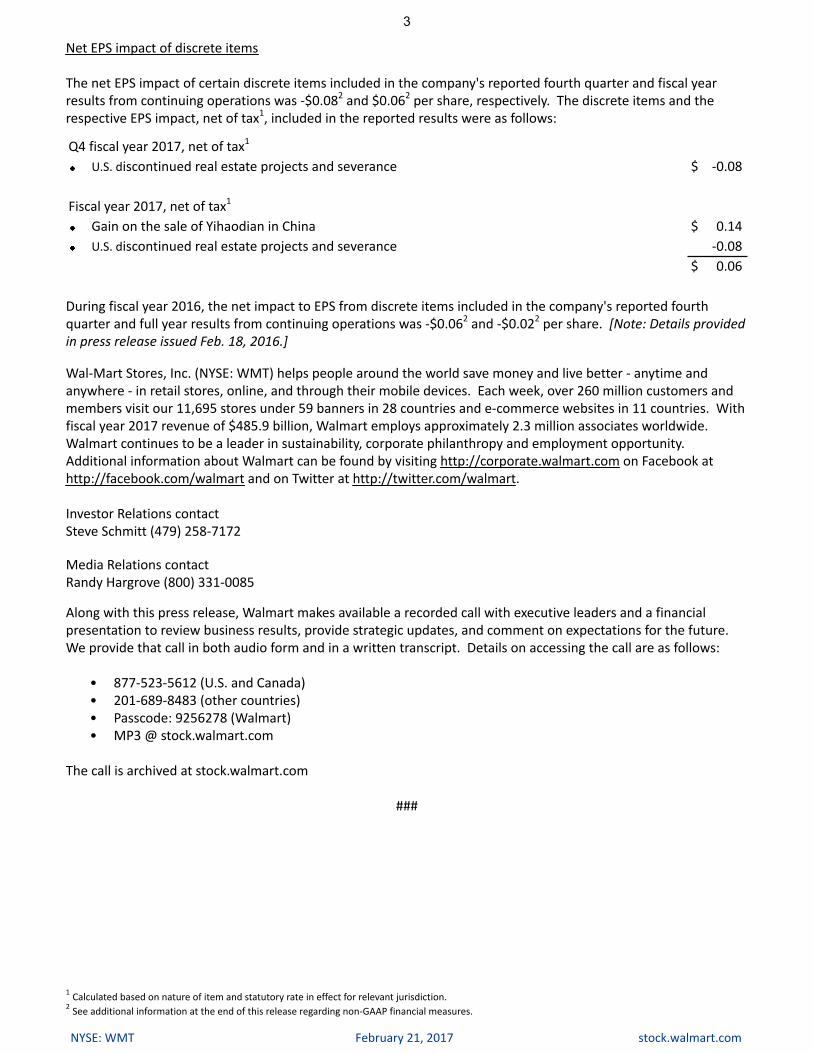
Free Cash Flow FY17 $ Change Returns to Shareholders FY17 % Change
Operating cash flow $31,530 $4,141 Dividends $6,216 -1.2%
Capital expenditures $10,619 -$858 Share repurchases2 $8,298 101.8%
Free cash flow1 $20,911 $4,999 Total $14,514 39.5%
Guidance
The company's guidance for earnings per share assumes currency exchange rates remain at current levels. Additionally, this guidance assumes the full-year effective tax rate will be around 32%.
• Fiscal year 2018 EPS: $4.20 to $4.40• First quarter fiscal year 2018 EPS: $0.90 to $1.00• Comp sales for the 13-week period ending Apr. 28, 2017:
Walmart U.S.: +1.0% to +1.5%Sam's Club (ex. fuel): approximately +1.0%
Segment results
U.S. Q4 FY17 Q4 FY16 Change
Net sales $83,747 $81,462 $2,285 2.8%
Comp sales3 1.8% 0.6% 120 bps N/A
Traffic 1.4% 0.7% 70 bps N/A
Ticket 0.4% -0.1% 50 bps N/A
E-commerce ~40 bps ~30 bps ~10 bps N/A
Operating income $4,995 $5,123 -$128 -2.5%
Q4 FY17 Q4 FY16 Change
Net sales $31,025 $32,682 -$1,657 -5.1%
Net sales (constant currency)1 $33,661 $32,682 $979 3.0%
Operating income $1,513 $1,661 -$148 -8.9%
Operating income (constant currency)1 $1,724 $1,661 $63 3.8%
Q4 FY17 Q4 FY16 Change
Net sales $14,978 $14,540 $438 3.0%
Comp sales (ex. fuel)1,3 2.4% -0.5% 290 bps N/A
Traffic 1.2% -1.4% 260 bps N/A
Ticket 1.2% 0.9% 30 bps N/A
E-commerce ~80 bps ~80 bps ~0 bps N/A
Operating income $390 $426 -$36 -8.5%
1 See additional information at the end of this release regarding non-GAAP financial measures.2 $9.2 billion remaining of $20 billion authorization approved in October 2015. The company repurchased approximately 120 million shares in fiscal 2017.3 13-week period ended Jan. 27, 2017, compared to 13-week period ended Jan. 29, 2016.
NYSE: WMT February 21, 2017 stock.walmart.com
3
Net EPS impact of discrete items
The net EPS impact of certain discrete items included in the company's reported fourth quarter and fiscal year results from continuing operations was -$0.082 and $0.062 per share, respectively. The discrete items and the respective EPS impact, net of tax1, included in the reported results were as follows:
Q4 fiscal year 2017, net of tax1
U.S. discontinued real estate projects and severance $ -0.08
Fiscal year 2017, net of tax1
Gain on the sale of Yihaodian in China $ 0.14
U.S. discontinued real estate projects and severance -0.08
$ 0.06
During fiscal year 2016, the net impact to EPS from discrete items included in the company's reported fourth quarter and full year results from continuing operations was -$0.062 and -$0.022 per share. [Note: Details provided in press release issued Feb. 18, 2016.]
Wal-Mart Stores, Inc. (NYSE: WMT) helps people around the world save money and live better - anytime and anywhere - in retail stores, online, and through their mobile devices. Each week, over 260 million customers and members visit our 11,695 stores under 59 banners in 28 countries and e-commerce websites in 11 countries. With fiscal year 2017 revenue of $485.9 billion, Walmart employs approximately 2.3 million associates worldwide. Walmart continues to be a leader in sustainability, corporate philanthropy and employment opportunity. Additional information about Walmart can be found by visiting http://corporate.walmart.com on Facebook at http://facebook.com/walmart and on Twitter at http://twitter.com/walmart.
Investor Relations contact Steve Schmitt (479) 258-7172
Media Relations contactRandy Hargrove (800) 331-0085
Along with this press release, Walmart makes available a recorded call with executive leaders and a financial presentation to review business results, provide strategic updates, and comment on expectations for the future. We provide that call in both audio form and in a written transcript. Details on accessing the call are as follows:
• 877-523-5612 (U.S. and Canada)• 201-689-8483 (other countries)• Passcode: 9256278 (Walmart)• MP3 @ stock.walmart.com
The call is archived at stock.walmart.com
###
1 Calculated based on nature of item and statutory rate in effect for relevant jurisdiction.2 See additional information at the end of this release regarding non-GAAP financial measures.
NYSE: WMT February 21, 2017 stock.walmart.com
4
Forward-Looking Statements
This release contains statements as to Walmart management's guidance regarding earnings per share for the three months ending April 30, 2017 and year ending January 31, 2018, and Walmart U.S.'s comparable store sales and Sam's Club's comparable club sales, excluding fuel, for the 13 weeks ending April 28, 2017. Walmart believes such statements are "forward-looking statements" as defined in, and are intended to enjoy the protection of the safe harbor for forward-looking statements provided by, the Private Securities Litigation Reform Act of 1995, as amended. Assumptions on which such forward-looking statements are based, including without limitation the assumption regarding Walmart’s effective tax rate for the year ending stated in this release, are also forward-looking statements. Walmart's actual results may differ materially from the guidance provided as a result of changes in circumstances, assumptions not being realized or other risks, uncertainties and factors including:
• economic, geo-political, capital markets and business conditions, trends and events around the world and in the markets in which Walmart operates;
• currency exchange rate fluctuations, changes in market interest rates and commodity prices;• unemployment levels;• competitive pressures;• inflation or deflation, generally and in particular product categories;• consumer confidence, disposable income, credit availability, spending levels, shopping patterns, debt
levels and demand for certain merchandise;• consumer enrollment in health and drug insurance programs and such programs' reimbursement rates;• the amount of Walmart's net sales denominated in the U.S. dollar and various foreign currencies;• the financial performance of Walmart and each of its segments;• Walmart's ability to successfully integrate acquired businesses, including Jet.com, Inc.;• Walmart's effective tax rate and the factors affecting Walmart's effective tax rate, including assessments of
certain tax contingencies, valuation allowances, changes in law, administrative audit outcomes, impact of discrete items and the mix of earnings between the U.S. and Walmart's international operations;
• customer traffic and average ticket in Walmart's stores and clubs and on its e-commerce websites;• the mix of merchandise Walmart sells, the cost of goods it sells and the shrinkage it experiences;• the amount of Walmart's total sales and operating expenses in the various markets in which it operates;• transportation, energy and utility costs and the selling prices of gasoline and diesel fuel;• supply chain disruptions and disruptions in seasonal buying patterns;• consumer acceptance of and response to Walmart's stores, clubs, e-commerce websites, mobile apps,
initiatives, programs and merchandise offerings;• cyber security events affecting Walmart and related costs;• developments in, outcomes of, and costs incurred in legal or regulatory proceedings to which Walmart is a
party;• casualty and accident-related costs and insurance costs;• the turnover in Walmart's workforce and labor costs, including healthcare and other benefit costs;• changes in accounting estimates or judgments;• changes in existing tax, labor and other laws and regulations and changes in tax rates, trade agreements,
trade restrictions and tariff rates;• the level of public assistance payments;• natural disasters, public health emergencies, civil disturbances, and terrorist attacks; and• Walmart's expenditures for FCPA and other compliance related costs.
Such risks, uncertainties and factors also include the risks relating to Walmart’s strategy, operations and performance and the financial, legal, tax, regulatory, compliance, reputational and other risks discussed in Walmart’s most recent annual report on Form 10-K filed with the SEC. You should consider the forward-looking statements in this call in conjunction with that annual report on Form 10-K and Walmart’s quarterly reports on Form 10-Q and current reports on Form 8-K filed with the SEC. Walmart urges you to consider all of the risks, uncertainties and factors identified above or discussed in such reports carefully in evaluating the forward-looking statements in this call. Walmart cannot assure you that the results reflected or implied by any forward-looking statement will be realized or, even if substantially realized, that those results will have the forecasted or expected consequences and effects for or on Walmart’s operations or financial performance. The forward-looking statements made in this call are as of the date of this call. Walmart undertakes no obligation to update these forward-looking statements to reflect subsequent events or circumstances.
5
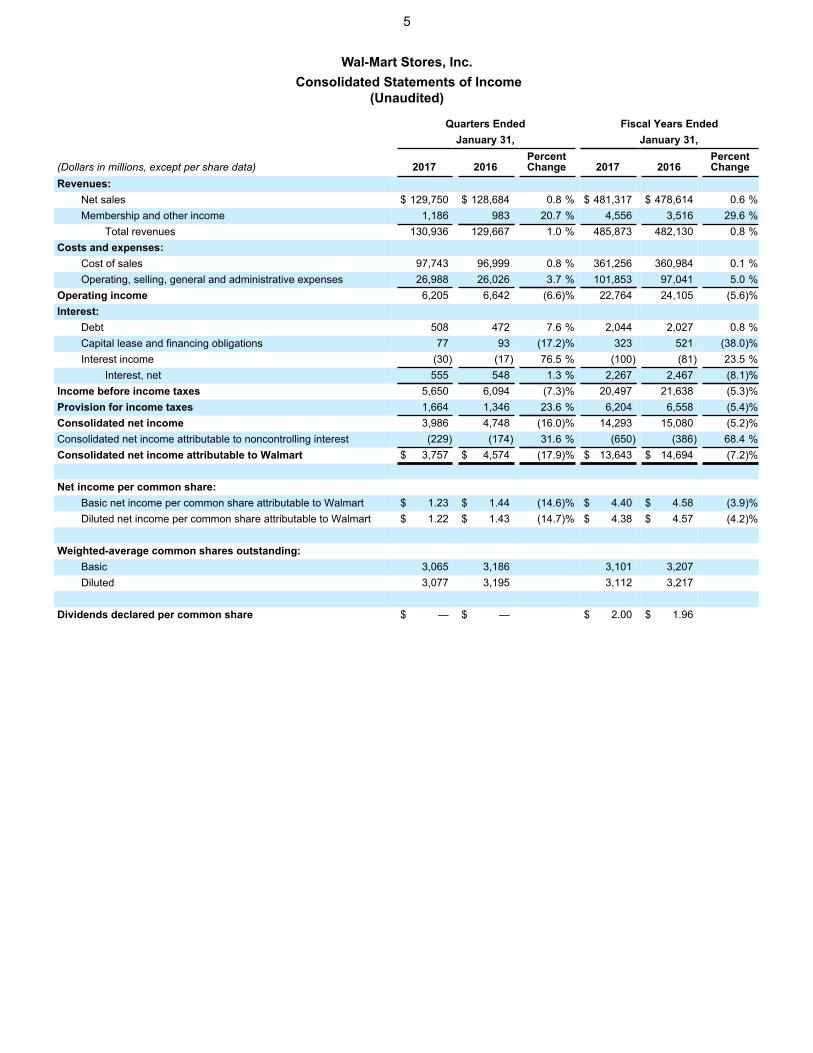
Wal-Mart Stores, Inc. Consolidated Statements of Income
(Unaudited)
Quarters Ended Fiscal Years EndedJanuary 31, January 31,
(Dollars in millions, except per share data) 2017 2016PercentChange 2017 2016
PercentChange
Revenues:Net sales $ 129,750 $ 128,684 0.8 % $ 481,317 $ 478,614 0.6 %Membership and other income 1,186 983 20.7 % 4,556 3,516 29.6 %
Total revenues 130,936 129,667 1.0 % 485,873 482,130 0.8 %Costs and expenses:
Cost of sales 97,743 96,999 0.8 % 361,256 360,984 0.1 %Operating, selling, general and administrative expenses 26,988 26,026 3.7 % 101,853 97,041 5.0 %
Operating income 6,205 6,642 (6.6)% 22,764 24,105 (5.6)%Interest:
Debt 508 472 7.6 % 2,044 2,027 0.8 %Capital lease and financing obligations 77 93 (17.2)% 323 521 (38.0)%Interest income (30) (17) 76.5 % (100) (81) 23.5 %
Interest, net 555 548 1.3 % 2,267 2,467 (8.1)%Income before income taxes 5,650 6,094 (7.3)% 20,497 21,638 (5.3)%Provision for income taxes 1,664 1,346 23.6 % 6,204 6,558 (5.4)%Consolidated net income 3,986 4,748 (16.0)% 14,293 15,080 (5.2)%Consolidated net income attributable to noncontrolling interest (229) (174) 31.6 % (650) (386) 68.4 %Consolidated net income attributable to Walmart $ 3,757 $ 4,574 (17.9)% $ 13,643 $ 14,694 (7.2)%
Net income per common share:Basic net income per common share attributable to Walmart $ 1.23 $ 1.44 (14.6)% $ 4.40 $ 4.58 (3.9)%Diluted net income per common share attributable to Walmart $ 1.22 $ 1.43 (14.7)% $ 4.38 $ 4.57 (4.2)%
Weighted-average common shares outstanding:Basic 3,065 3,186 3,101 3,207Diluted 3,077 3,195 3,112 3,217
Dividends declared per common share $ — $ — $ 2.00 $ 1.96
6
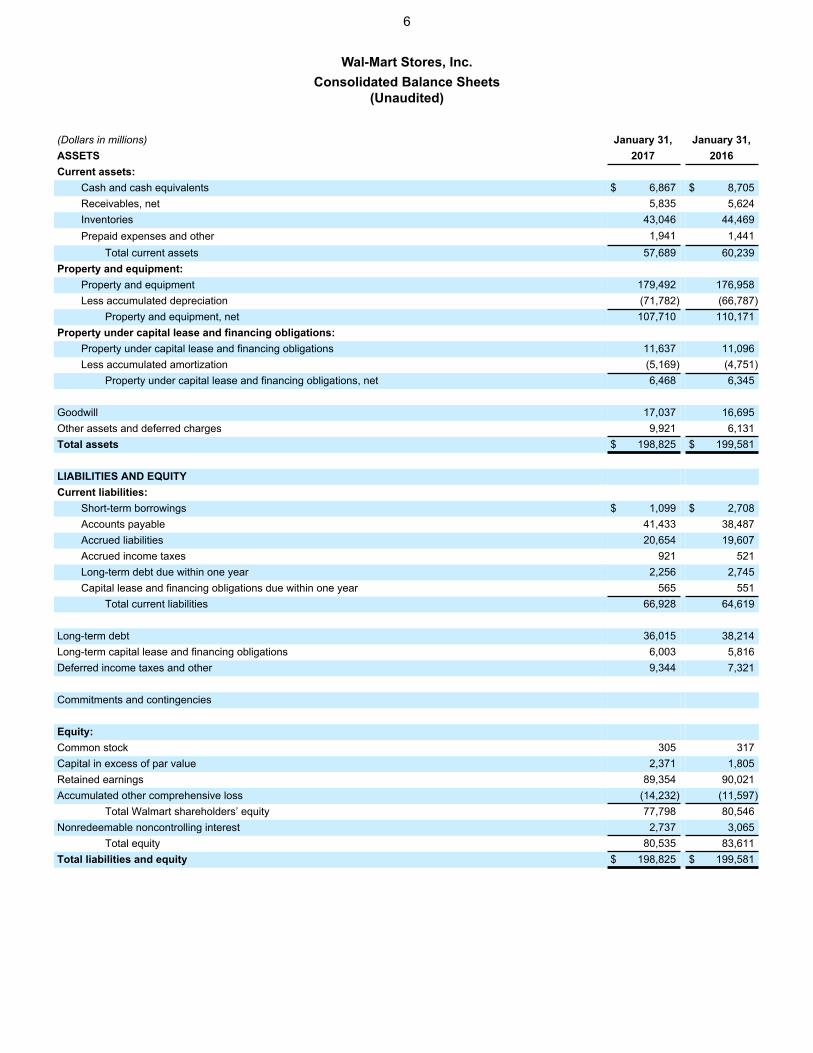
Wal-Mart Stores, Inc.Consolidated Balance Sheets
(Unaudited)
(Dollars in millions) January 31, January 31,ASSETS 2017 2016Current assets:
Cash and cash equivalents $ 6,867 $ 8,705Receivables, net 5,835 5,624Inventories 43,046 44,469Prepaid expenses and other 1,941 1,441
Total current assets 57,689 60,239Property and equipment:
Property and equipment 179,492 176,958Less accumulated depreciation (71,782) (66,787)
Property and equipment, net 107,710 110,171Property under capital lease and financing obligations:
Property under capital lease and financing obligations 11,637 11,096Less accumulated amortization (5,169) (4,751)
Property under capital lease and financing obligations, net 6,468 6,345
Goodwill 17,037 16,695Other assets and deferred charges 9,921 6,131Total assets $ 198,825 $ 199,581
LIABILITIES AND EQUITYCurrent liabilities:
Short-term borrowings $ 1,099 $ 2,708Accounts payable 41,433 38,487Accrued liabilities 20,654 19,607Accrued income taxes 921 521Long-term debt due within one year 2,256 2,745Capital lease and financing obligations due within one year 565 551
Total current liabilities 66,928 64,619
Long-term debt 36,015 38,214Long-term capital lease and financing obligations 6,003 5,816Deferred income taxes and other 9,344 7,321
Commitments and contingencies
Equity:Common stock 305 317Capital in excess of par value 2,371 1,805Retained earnings 89,354 90,021Accumulated other comprehensive loss (14,232) (11,597)
Total Walmart shareholders’ equity 77,798 80,546Nonredeemable noncontrolling interest 2,737 3,065
Total equity 80,535 83,611Total liabilities and equity $ 198,825 $ 199,581
7
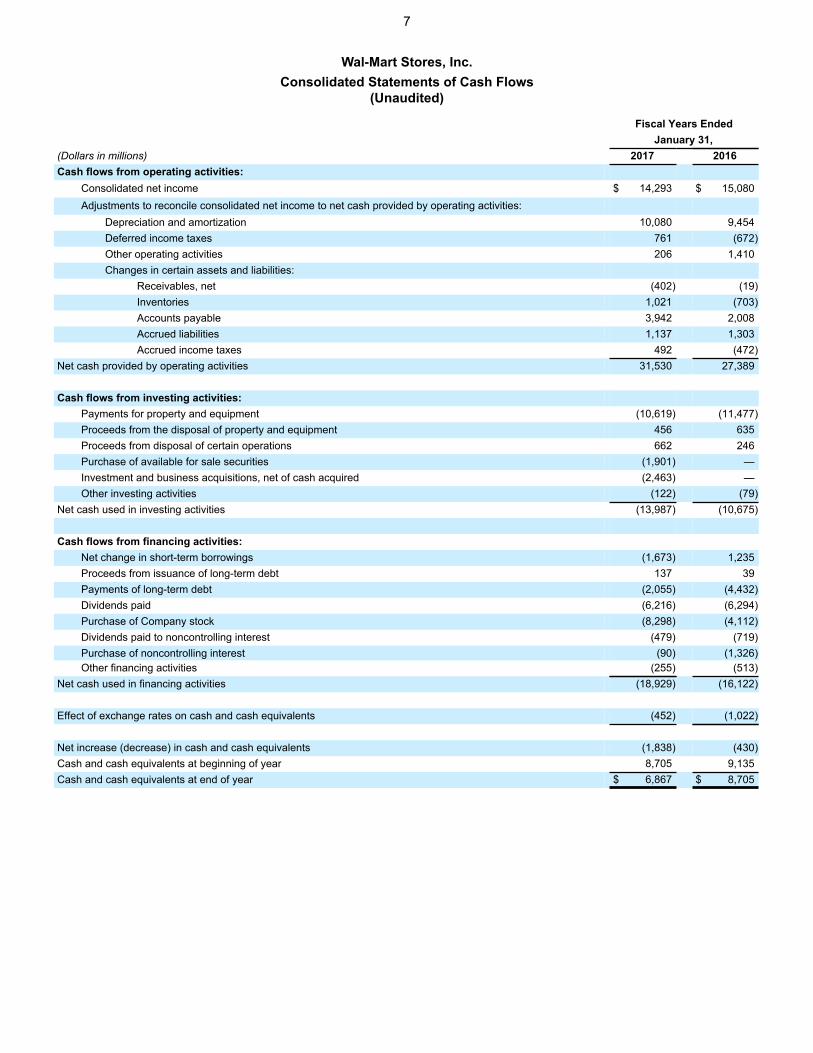
Wal-Mart Stores, Inc.Consolidated Statements of Cash Flows
(Unaudited)
Fiscal Years EndedJanuary 31,
(Dollars in millions) 2017 2016Cash flows from operating activities:
Consolidated net income $ 14,293 $ 15,080Adjustments to reconcile consolidated net income to net cash provided by operating activities:
Depreciation and amortization 10,080 9,454Deferred income taxes 761 (672)Other operating activities 206 1,410Changes in certain assets and liabilities:
Receivables, net (402) (19)Inventories 1,021 (703)Accounts payable 3,942 2,008Accrued liabilities 1,137 1,303Accrued income taxes 492 (472)
Net cash provided by operating activities 31,530 27,389
Cash flows from investing activities:Payments for property and equipment (10,619) (11,477)Proceeds from the disposal of property and equipment 456 635Proceeds from disposal of certain operations 662 246Purchase of available for sale securities (1,901) —Investment and business acquisitions, net of cash acquired (2,463) —Other investing activities (122) (79)
Net cash used in investing activities (13,987) (10,675)
Cash flows from financing activities:Net change in short-term borrowings (1,673) 1,235Proceeds from issuance of long-term debt 137 39Payments of long-term debt (2,055) (4,432)Dividends paid (6,216) (6,294)Purchase of Company stock (8,298) (4,112)Dividends paid to noncontrolling interest (479) (719)Purchase of noncontrolling interest (90) (1,326)Other financing activities (255) (513)
Net cash used in financing activities (18,929) (16,122)
Effect of exchange rates on cash and cash equivalents (452) (1,022)
Net increase (decrease) in cash and cash equivalents (1,838) (430)Cash and cash equivalents at beginning of year 8,705 9,135Cash and cash equivalents at end of year $ 6,867 $ 8,705
8
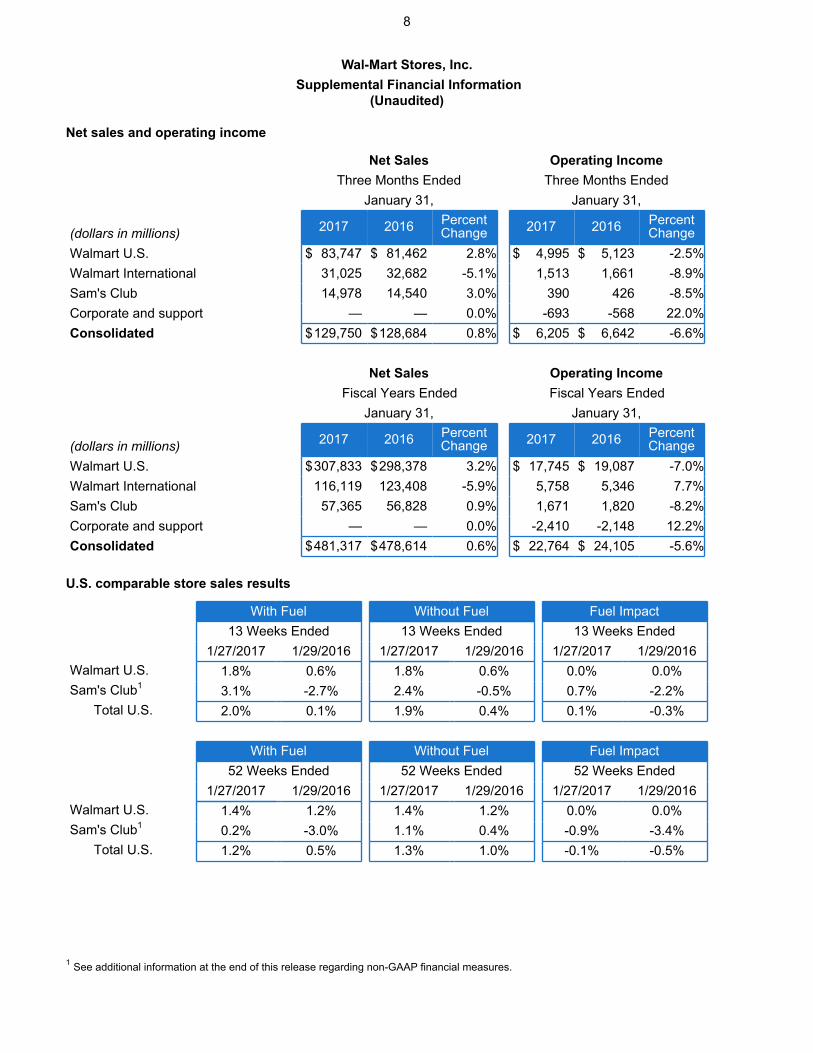
Wal-Mart Stores, Inc. Supplemental Financial Information
(Unaudited)
Net sales and operating income
Net Sales Operating IncomeThree Months Ended Three Months Ended
January 31, January 31,
(dollars in millions) 2017 2016 PercentChange 2017 2016 Percent
ChangeWalmart U.S. $ 83,747 $ 81,462 2.8% $ 4,995 $ 5,123 -2.5%Walmart International 31,025 32,682 -5.1% 1,513 1,661 -8.9%Sam's Club 14,978 14,540 3.0% 390 426 -8.5%Corporate and support — — 0.0% -693 -568 22.0%Consolidated $129,750 $128,684 0.8% $ 6,205 $ 6,642 -6.6%
Net Sales Operating IncomeFiscal Years Ended Fiscal Years Ended
January 31, January 31,
(dollars in millions) 2017 2016 PercentChange 2017 2016 Percent
ChangeWalmart U.S. $307,833 $298,378 3.2% $ 17,745 $ 19,087 -7.0%Walmart International 116,119 123,408 -5.9% 5,758 5,346 7.7%Sam's Club 57,365 56,828 0.9% 1,671 1,820 -8.2%Corporate and support — — 0.0% -2,410 -2,148 12.2%Consolidated $481,317 $478,614 0.6% $ 22,764 $ 24,105 -5.6%
U.S. comparable store sales results
With Fuel Without Fuel Fuel Impact 13 Weeks Ended 13 Weeks Ended 13 Weeks Ended
1/27/2017 1/29/2016 1/27/2017 1/29/2016 1/27/2017 1/29/2016Walmart U.S. 1.8% 0.6% 1.8% 0.6% 0.0% 0.0%Sam's Club1 3.1% -2.7% 2.4% -0.5% 0.7% -2.2%
Total U.S. 2.0% 0.1% 1.9% 0.4% 0.1% -0.3%
With Fuel Without Fuel Fuel Impact 52 Weeks Ended 52 Weeks Ended 52 Weeks Ended
1/27/2017 1/29/2016 1/27/2017 1/29/2016 1/27/2017 1/29/2016Walmart U.S. 1.4% 1.2% 1.4% 1.2% 0.0% 0.0%Sam's Club1 0.2% -3.0% 1.1% 0.4% -0.9% -3.4%
Total U.S. 1.2% 0.5% 1.3% 1.0% -0.1% -0.5%
1 See additional information at the end of this release regarding non-GAAP financial measures.
9
Wal-Mart Stores, Inc.Reconciliations of and Other Information Regarding Non-GAAP Financial Measures
(Unaudited)
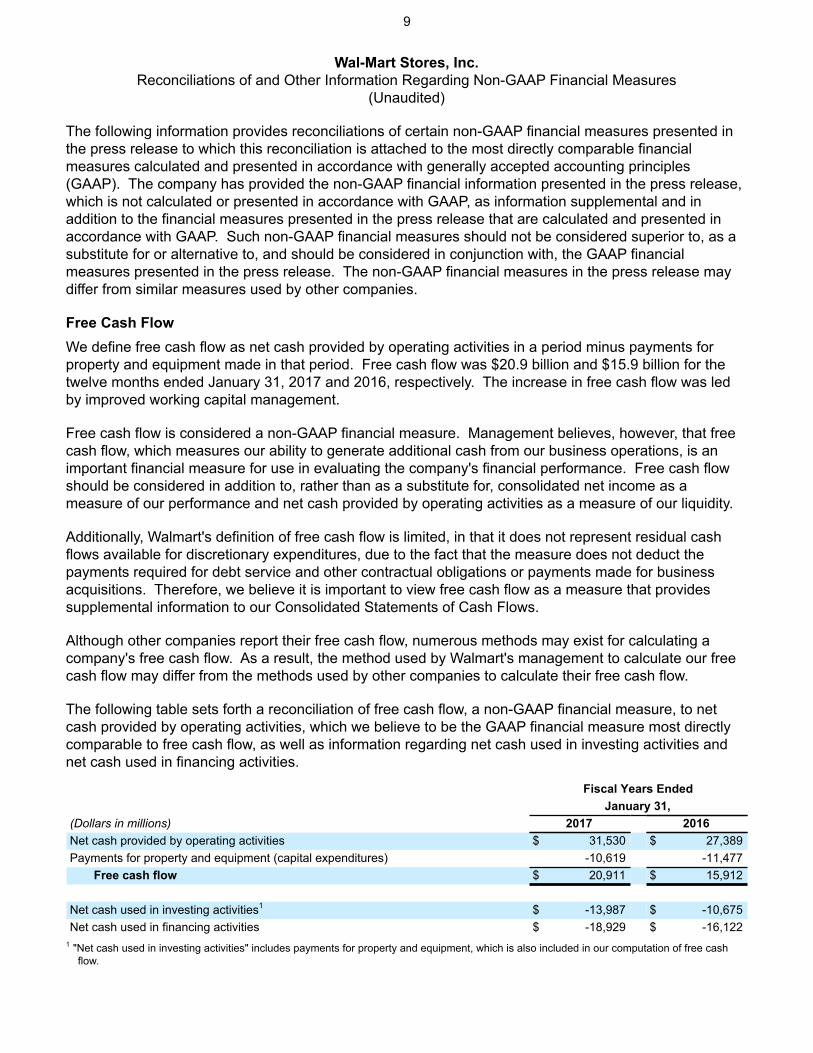
The following information provides reconciliations of certain non-GAAP financial measures presented in the press release to which this reconciliation is attached to the most directly comparable financial measures calculated and presented in accordance with generally accepted accounting principles (GAAP). The company has provided the non-GAAP financial information presented in the press release, which is not calculated or presented in accordance with GAAP, as information supplemental and in addition to the financial measures presented in the press release that are calculated and presented in accordance with GAAP. Such non-GAAP financial measures should not be considered superior to, as a substitute for or alternative to, and should be considered in conjunction with, the GAAP financial measures presented in the press release. The non-GAAP financial measures in the press release may differ from similar measures used by other companies.
Free Cash FlowWe define free cash flow as net cash provided by operating activities in a period minus payments for property and equipment made in that period. Free cash flow was $20.9 billion and $15.9 billion for the twelve months ended January 31, 2017 and 2016, respectively. The increase in free cash flow was led by improved working capital management.
Free cash flow is considered a non-GAAP financial measure. Management believes, however, that free cash flow, which measures our ability to generate additional cash from our business operations, is an important financial measure for use in evaluating the company's financial performance. Free cash flow should be considered in addition to, rather than as a substitute for, consolidated net income as a measure of our performance and net cash provided by operating activities as a measure of our liquidity.
Additionally, Walmart's definition of free cash flow is limited, in that it does not represent residual cash flows available for discretionary expenditures, due to the fact that the measure does not deduct the payments required for debt service and other contractual obligations or payments made for business acquisitions. Therefore, we believe it is important to view free cash flow as a measure that provides supplemental information to our Consolidated Statements of Cash Flows.
Although other companies report their free cash flow, numerous methods may exist for calculating a company's free cash flow. As a result, the method used by Walmart's management to calculate our free cash flow may differ from the methods used by other companies to calculate their free cash flow.
The following table sets forth a reconciliation of free cash flow, a non-GAAP financial measure, to net cash provided by operating activities, which we believe to be the GAAP financial measure most directly comparable to free cash flow, as well as information regarding net cash used in investing activities and net cash used in financing activities.
Fiscal Years Ended January 31,(Dollars in millions) 2017 2016Net cash provided by operating activities $ 31,530 $ 27,389Payments for property and equipment (capital expenditures) -10,619 -11,477
Free cash flow $ 20,911 $ 15,912
Net cash used in investing activities1 $ -13,987 $ -10,675Net cash used in financing activities $ -18,929 $ -16,122
1 "Net cash used in investing activities" includes payments for property and equipment, which is also included in our computation of free cash flow.
10
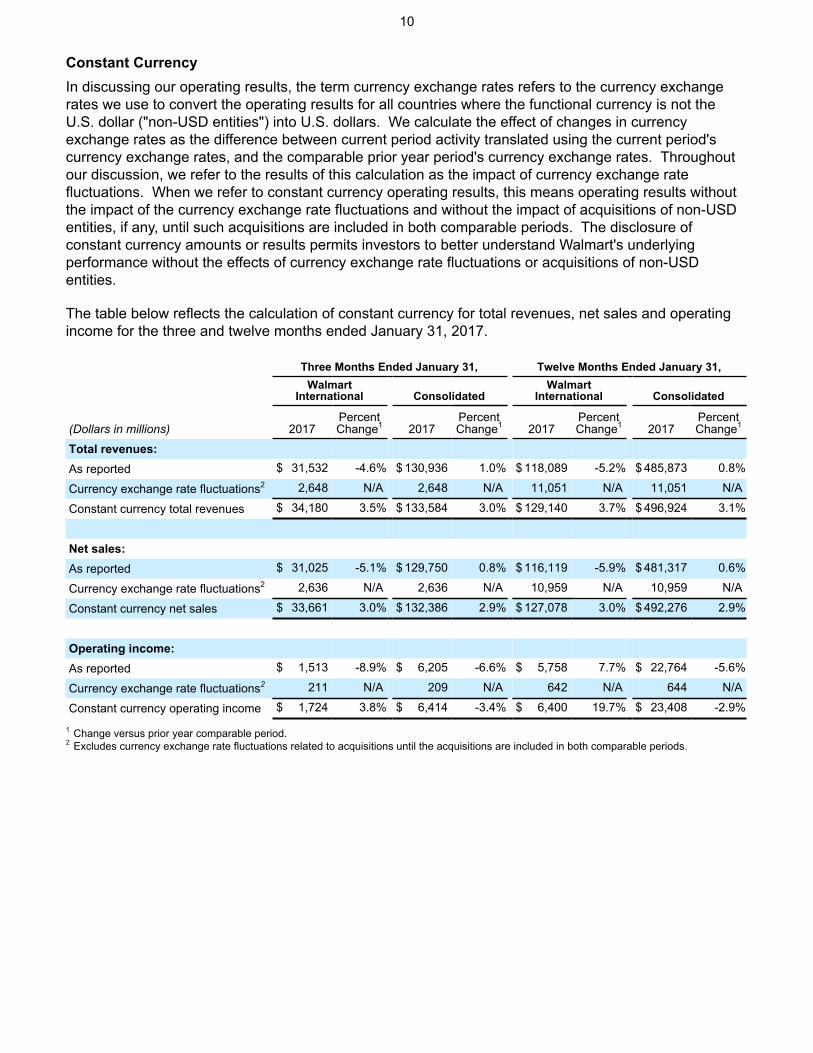
Constant Currency In discussing our operating results, the term currency exchange rates refers to the currency exchange rates we use to convert the operating results for all countries where the functional currency is not the U.S. dollar ("non-USD entities") into U.S. dollars. We calculate the effect of changes in currency exchange rates as the difference between current period activity translated using the current period's currency exchange rates, and the comparable prior year period's currency exchange rates. Throughout our discussion, we refer to the results of this calculation as the impact of currency exchange rate fluctuations. When we refer to constant currency operating results, this means operating results without the impact of the currency exchange rate fluctuations and without the impact of acquisitions of non-USD entities, if any, until such acquisitions are included in both comparable periods. The disclosure of constant currency amounts or results permits investors to better understand Walmart's underlying performance without the effects of currency exchange rate fluctuations or acquisitions of non-USD entities.
The table below reflects the calculation of constant currency for total revenues, net sales and operating income for the three and twelve months ended January 31, 2017.
Three Months Ended January 31, Twelve Months Ended January 31,Walmart
International ConsolidatedWalmart
International Consolidated
(Dollars in millions) 2017Percent Change1 2017
Percent Change1 2017
Percent Change1 2017
Percent Change1
Total revenues:As reported $ 31,532 -4.6% $ 130,936 1.0% $ 118,089 -5.2% $ 485,873 0.8%
Currency exchange rate fluctuations2 2,648 N/A 2,648 N/A 11,051 N/A 11,051 N/A
Constant currency total revenues $ 34,180 3.5% $ 133,584 3.0% $ 129,140 3.7% $ 496,924 3.1%
Net sales:As reported $ 31,025 -5.1% $ 129,750 0.8% $ 116,119 -5.9% $ 481,317 0.6%
Currency exchange rate fluctuations2 2,636 N/A 2,636 N/A 10,959 N/A 10,959 N/A
Constant currency net sales $ 33,661 3.0% $ 132,386 2.9% $ 127,078 3.0% $ 492,276 2.9%
Operating income:As reported $ 1,513 -8.9% $ 6,205 -6.6% $ 5,758 7.7% $ 22,764 -5.6%
Currency exchange rate fluctuations2 211 N/A 209 N/A 642 N/A 644 N/A
Constant currency operating income $ 1,724 3.8% $ 6,414 -3.4% $ 6,400 19.7% $ 23,408 -2.9%
1 Change versus prior year comparable period.2 Excludes currency exchange rate fluctuations related to acquisitions until the acquisitions are included in both comparable periods.
11
Comparable Sam's Club Sales MeasuresThe comparable club sales of the company's Sam's Club operating segment ("Sam's Club") for the 13-week and 52-week periods ended Jan. 27, 2017 and Jan. 29, 2016, and for the 13-week period ending Apr. 28, 2017, in each case calculated by excluding Sam's Club's fuel sales for such periods (the "Sam's Club Comparable Sales Measures"), are non-GAAP financial measures as defined by the SEC's rules. We believe the Sam's Club comparable club sales for the historical periods for which the corresponding Sam's Club Comparable Sales Measures are presented, calculated by including fuel sales, are the financial measures computed in accordance with GAAP most directly comparable to the respective Sam's Club Comparable Sales Measures.
We believe that the presentation of the Sam's Club Comparable Sales Measures provides useful information to investors regarding the company's financial condition and results of operations because that information permits investors to understand the effect of the fuel sales, which are affected by the volatility of fuel prices, on Sam's Club's comparable club sales for the periods presented.
Adjusted EPSThe adjusted diluted earnings per share from continuing operations attributable to Walmart (Adjusted EPS) for each of the three-month periods and fiscal years ended Jan. 31, 2017 and 2016 is considered a non-GAAP financial measure under the SEC's rules because the Adjusted EPS for each such period excludes certain amounts not excluded in the diluted earnings per share from continuing operations attributable to Walmart calculated in accordance with GAAP (EPS) for each of the three-month periods and fiscal years ended Jan. 31, 2017 and 2016. Management believes that the Adjusted EPS for each of the three-month periods and fiscal years ended Jan. 31, 2017 and 2016 is a meaningful measure to share with investors because that measure, which adjusts EPS for such period for certain items recorded in such period, is the measure that best allows comparison of the performance for the comparable period. In addition, the measure affords investors a view of what management considers Walmart's core earnings performance for each of the three-month periods and fiscal years ended Jan. 31, 2017 and 2016 and also affords investors the ability to make a more informed assessment of such core earnings performance for the comparable period.
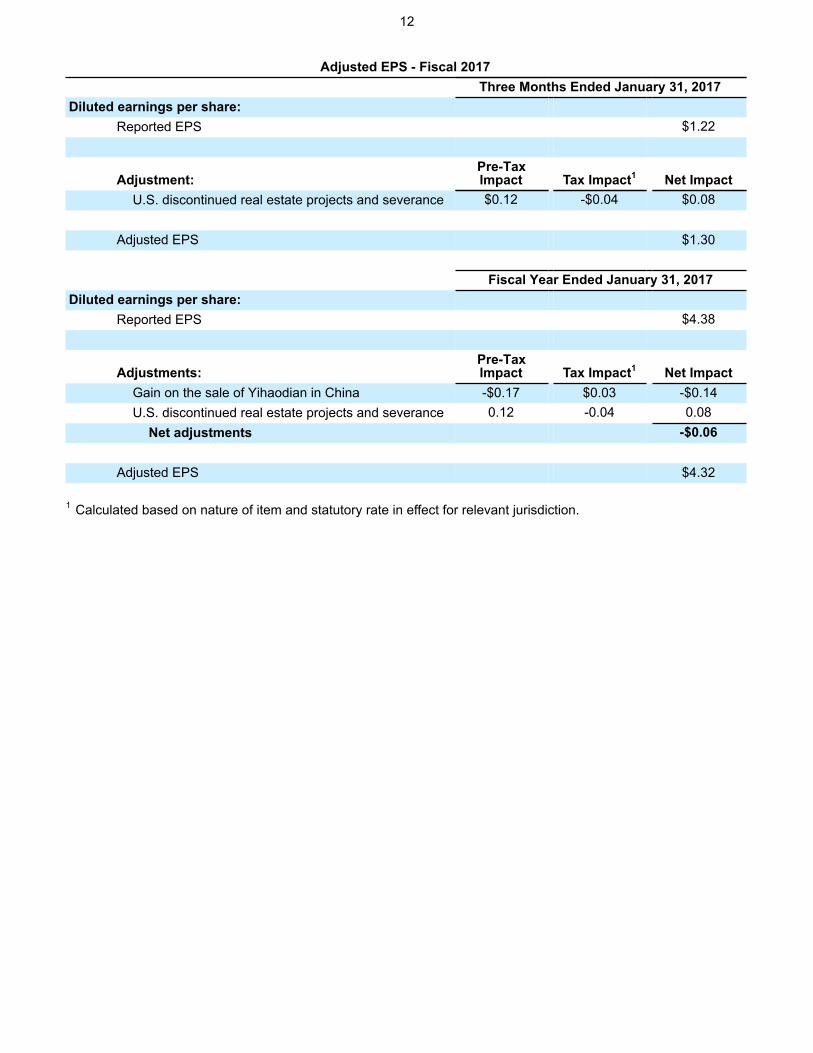
We have calculated the Adjusted EPS for the three months and the fiscal year ended Jan. 31, 2017 by adjusting the EPS for each period for the amount of the impact of: (1) U.S. discontinued real estate projects and severance and (2) the gain on the sale of Yihaodian in China as reported in Q2 FY17.
Adjusted EPS for each of the three months and the fiscal year ended Jan. 31, 2017 is a non-GAAP financial measure. The most directly comparable financial measure calculated in accordance with GAAP is EPS for the three months and the fiscal year ended Jan. 31, 2017.
12
Adjusted EPS - Fiscal 2017Three Months Ended January 31, 2017
Diluted earnings per share:Reported EPS $1.22
Adjustment:Pre-TaxImpact Tax Impact1 Net Impact
U.S. discontinued real estate projects and severance $0.12 -$0.04 $0.08
Adjusted EPS $1.30
Fiscal Year Ended January 31, 2017Diluted earnings per share:
Reported EPS $4.38
Adjustments:Pre-TaxImpact Tax Impact1 Net Impact
Gain on the sale of Yihaodian in China -$0.17 $0.03 -$0.14U.S. discontinued real estate projects and severance 0.12 -0.04 0.08
Net adjustments -$0.06
Adjusted EPS $4.32
1 Calculated based on nature of item and statutory rate in effect for relevant jurisdiction.
13
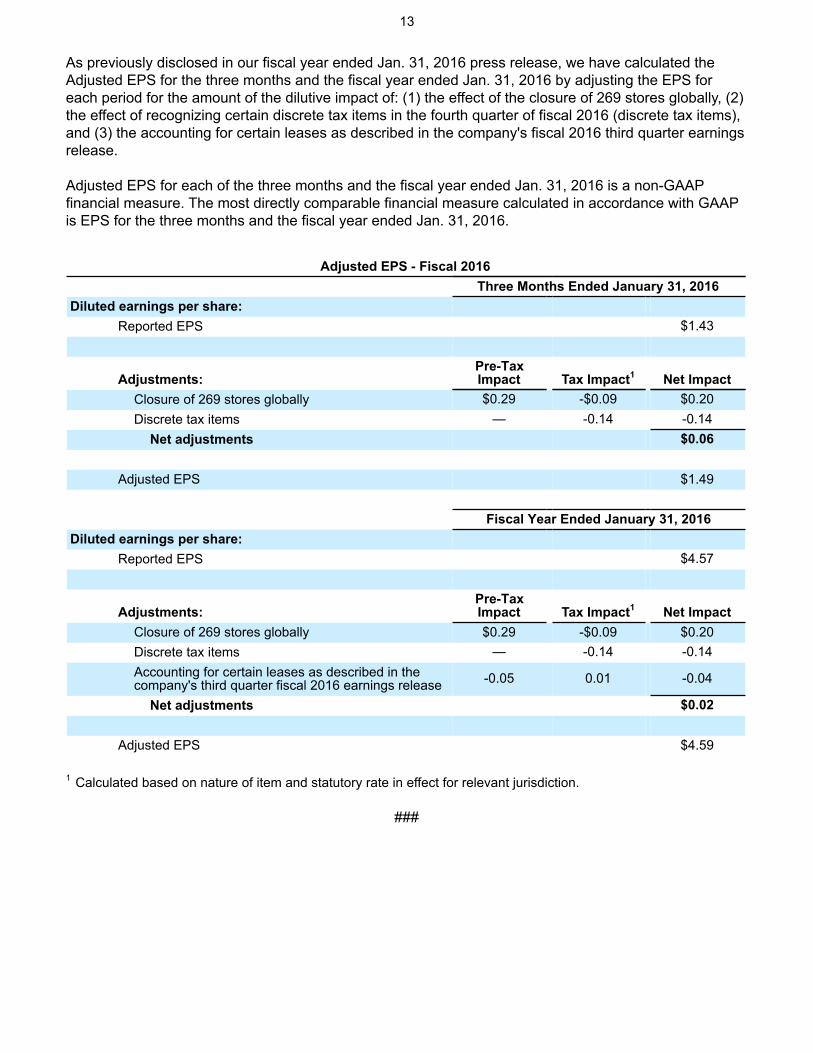
As previously disclosed in our fiscal year ended Jan. 31, 2016 press release, we have calculated the Adjusted EPS for the three months and the fiscal year ended Jan. 31, 2016 by adjusting the EPS for each period for the amount of the dilutive impact of: (1) the effect of the closure of 269 stores globally, (2) the effect of recognizing certain discrete tax items in the fourth quarter of fiscal 2016 (discrete tax items), and (3) the accounting for certain leases as described in the company's fiscal 2016 third quarter earnings release.
Adjusted EPS for each of the three months and the fiscal year ended Jan. 31, 2016 is a non-GAAP financial measure. The most directly comparable financial measure calculated in accordance with GAAP is EPS for the three months and the fiscal year ended Jan. 31, 2016.
Adjusted EPS - Fiscal 2016Three Months Ended January 31, 2016
Diluted earnings per share:Reported EPS $1.43
Adjustments:Pre-TaxImpact Tax Impact1 Net Impact
Closure of 269 stores globally $0.29 -$0.09 $0.20Discrete tax items — -0.14 -0.14
Net adjustments $0.06
Adjusted EPS $1.49
Fiscal Year Ended January 31, 2016Diluted earnings per share:
Reported EPS $4.57
Adjustments:Pre-TaxImpact Tax Impact1 Net Impact
Closure of 269 stores globally $0.29 -$0.09 $0.20Discrete tax items — -0.14 -0.14Accounting for certain leases as described in thecompany's third quarter fiscal 2016 earnings release -0.05 0.01 -0.04
Net adjustments $0.02
Adjusted EPS $4.59
1 Calculated based on nature of item and statutory rate in effect for relevant jurisdiction.
###