earnings release 4q17 - credit suisse · earnings release 4q17 2 ... and the national credit union...
TRANSCRIPT

Earnings Release
4Q17
2Earnings Release 4Q17
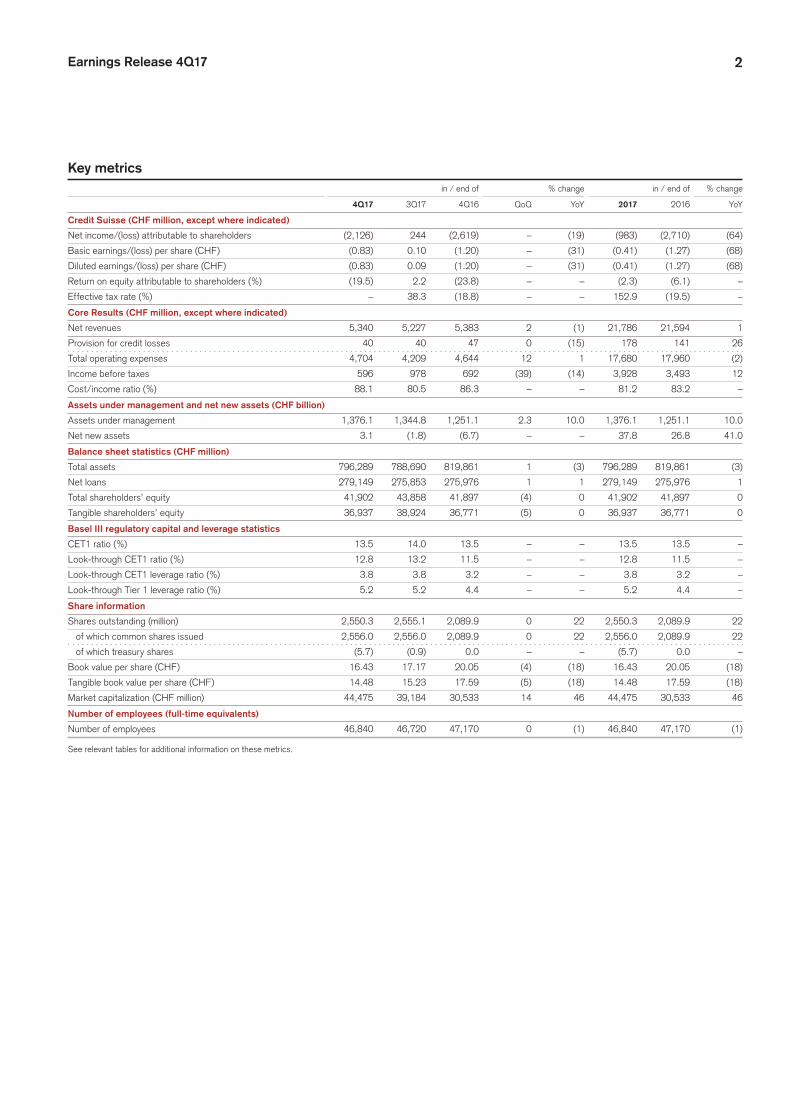
Key metrics in / end of % change in / end of % change
4Q17 3Q17 4Q16 QoQ YoY 2017 2016 YoY
Credit Suisse (CHF million, except where indicated)
Net income/(loss) attributable to shareholders (2,126) 244 (2,619) – (19) (983) (2,710) (64)
Basic earnings/(loss) per share (CHF) (0.83) 0.10 (1.20) – (31) (0.41) (1.27) (68)
Diluted earnings/(loss) per share (CHF) (0.83) 0.09 (1.20) – (31) (0.41) (1.27) (68)
Return on equity attributable to shareholders (%) (19.5) 2.2 (23.8) – – (2.3) (6.1) –
Effective tax rate (%) – 38.3 (18.8) – – 152.9 (19.5) –
Core Results (CHF million, except where indicated)
Net revenues 5,340 5,227 5,383 2 (1) 21,786 21,594 1
Provision for credit losses 40 40 47 0 (15) 178 141 26
Total operating expenses 4,704 4,209 4,644 12 1 17,680 17,960 (2)
Income before taxes 596 978 692 (39) (14) 3,928 3,493 12
Cost/income ratio (%) 88.1 80.5 86.3 – – 81.2 83.2 –
Assets under management and net new assets (CHF billion)
Assets under management 1,376.1 1,344.8 1,251.1 2.3 10.0 1,376.1 1,251.1 10.0
Net new assets 3.1 (1.8) (6.7) – – 37.8 26.8 41.0
Balance sheet statistics (CHF million)
Total assets 796,289 788,690 819,861 1 (3) 796,289 819,861 (3)
Net loans 279,149 275,853 275,976 1 1 279,149 275,976 1
Total shareholders’ equity 41,902 43,858 41,897 (4) 0 41,902 41,897 0
Tangible shareholders’ equity 36,937 38,924 36,771 (5) 0 36,937 36,771 0
Basel III regulatory capital and leverage statistics
CET1 ratio (%) 13.5 14.0 13.5 – – 13.5 13.5 –
Look-through CET1 ratio (%) 12.8 13.2 11.5 – – 12.8 11.5 –
Look-through CET1 leverage ratio (%) 3.8 3.8 3.2 – – 3.8 3.2 –
Look-through Tier 1 leverage ratio (%) 5.2 5.2 4.4 – – 5.2 4.4 –
Share information
Shares outstanding (million) 2,550.3 2,555.1 2,089.9 0 22 2,550.3 2,089.9 22
of which common shares issued 2,556.0 2,556.0 2,089.9 0 22 2,556.0 2,089.9 22
of which treasury shares (5.7) (0.9) 0.0 – – (5.7) 0.0 –
Book value per share (CHF) 16.43 17.17 20.05 (4) (18) 16.43 20.05 (18)
Tangible book value per share (CHF) 14.48 15.23 17.59 (5) (18) 14.48 17.59 (18)
Market capitalization (CHF million) 44,475 39,184 30,533 14 46 44,475 30,533 46
Number of employees (full-time equivalents)
Number of employees 46,840 46,720 47,170 0 (1) 46,840 47,170 (1)
See relevant tables for additional information on these metrics.

3Earnings Release 4Q17
Credit Suisse
Credit SuisseIn 4Q17, we recorded a net loss attributable to shareholders of CHF 2,126 million. Diluted loss per share was CHF 0.83 and return on equity attributable to shareholders was (19.5)%. As of the end of 4Q17, our BIS CET1 ratio was 12.8% on a look-through basis.
Results in / end of % change in / end of % change
4Q17 3Q17 4Q16 QoQ YoY 2017 2016 YoY
Statements of operations (CHF million)
Net interest income 1,565 1,622 1,622 (4) (4) 6,557 7,562 (13)
Commissions and fees 3,104 2,762 2,941 12 6 11,817 11,092 7
Trading revenues 186 320 258 (42) (28) 1,317 313 321
Other revenues 334 268 360 25 (7) 1,209 1,356 (11)
Net revenues 5,189 4,972 5,181 4 0 20,900 20,323 3
Provision for credit losses 43 32 75 34 (43) 210 252 (17)
Compensation and benefits 2,526 2,451 2,682 3 (6) 10,177 10,572 (4)
General and administrative expenses 1,977 1,630 4,184 21 (53) 6,835 9,770 (30)
Commission expenses 365 347 394 5 (7) 1,430 1,455 (2)
Restructuring expenses 137 112 49 22 180 455 540 (16)
Total other operating expenses 2,479 2,089 4,627 19 (46) 8,720 11,765 (26)
Total operating expenses 5,005 4,540 7,309 10 (32) 18,897 22,337 (15)
Income/(loss) before taxes 141 400 (2,203) (65) – 1,793 (2,266) –
Income tax expense 2,234 153 414 – 440 2,741 441 –
Net income/(loss) (2,093) 247 (2,617) – (20) (948) (2,707) (65)
Net income attributable to noncontrolling interests 33 3 2 – – 35 3 –
Net income/(loss) attributable to shareholders (2,126) 244 (2,619) – (19) (983) (2,710) (64)
Statement of operations metrics (%)
Return on regulatory capital 1.2 3.5 (18.6) – – 3.9 (4.7) –
Cost/income ratio 96.5 91.3 141.1 – – 90.4 109.9 –
Effective tax rate – 38.3 (18.8) – – 152.9 (19.5) –
Earnings per share (CHF)
Basic earnings/(loss) per share (0.83) 0.10 (1.20) – (31) (0.41) (1.27) (68)
Diluted earnings/(loss) per share (0.83) 0.09 (1.20) – (31) (0.41) (1.27) (68)
Return on equity (%, annualized)
Return on equity attributable to shareholders (19.5) 2.2 (23.8) – – (2.3) (6.1) –
Return on tangible equity attributable to shareholders 1 (22.0) 2.5 (26.9) – – (2.6) (6.9) –
Balance sheet statistics (CHF million)
Total assets 796,289 788,690 819,861 1 (3) 796,289 819,861 (3)
Risk-weighted assets 2 271,680 265,012 268,045 3 1 271,680 268,045 1
Leverage exposure 2 916,525 908,967 950,763 1 (4) 916,525 950,763 (4)
Number of employees (full-time equivalents)
Number of employees 46,840 46,720 47,170 0 (1) 46,840 47,170 (1)
1 Based on tangible shareholders’ equity attributable to shareholders, a non-GAAP financial measure, which is calculated by deducting goodwill and other intangible assets from total shareholders’ equity attributable to shareholders as presented in our balance sheet. Management believes that the return on tangible shareholders’ equity attributable to shareholders is meaningful as it allows consistent measurement of the performance of businesses without regard to whether the businesses were acquired.
2 Disclosed on a look-through basis.
4Earnings Release 4Q17
Credit Suisse
Credit Suisse
Core Results
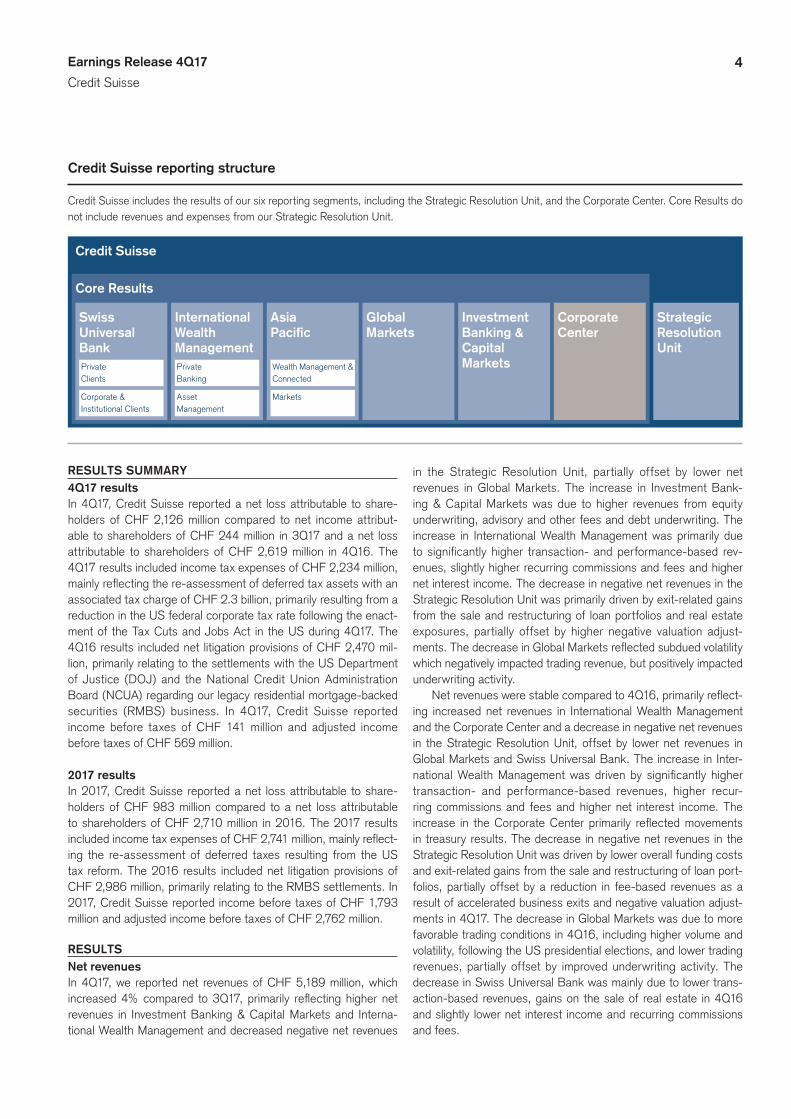
Credit Suisse reporting structure
Credit Suisse includes the results of our six reporting segments, including the Strategic Resolution Unit, and the Corporate Center. Core Results do not include revenues and expenses from our Strategic Resolution Unit.
Swiss Universal Bank
International Wealth Management
Asia Pacific
Global Markets
Investment Banking & Capital Markets
Corporate Center
Strategic Resolution Unit
Private Clients
Private Banking
Wealth Management & Connected
Corporate & Institutional Clients
Asset Management
Markets
RESULTS SUMMARY4Q17 resultsIn 4Q17, Credit Suisse reported a net loss attributable to share-holders of CHF 2,126 million compared to net income attribut-able to shareholders of CHF 244 million in 3Q17 and a net loss attributable to shareholders of CHF 2,619 million in 4Q16. The 4Q17 results included income tax expenses of CHF 2,234 million, mainly reflecting the re-assessment of deferred tax assets with an associated tax charge of CHF 2.3 billion, primarily resulting from a reduction in the US federal corporate tax rate following the enact-ment of the Tax Cuts and Jobs Act in the US during 4Q17. The 4Q16 results included net litigation provisions of CHF 2,470 mil-lion, primarily relating to the settlements with the US Department of Justice (DOJ) and the National Credit Union Administration Board (NCUA) regarding our legacy residential mortgage-backed securities (RMBS) business. In 4Q17, Credit Suisse reported income before taxes of CHF 141 million and adjusted income before taxes of CHF 569 million.
2017 resultsIn 2017, Credit Suisse reported a net loss attributable to share-holders of CHF 983 million compared to a net loss attributable to shareholders of CHF 2,710 million in 2016. The 2017 results included income tax expenses of CHF 2,741 million, mainly reflect-ing the re-assessment of deferred taxes resulting from the US tax reform. The 2016 results included net litigation provisions of CHF 2,986 million, primarily relating to the RMBS settlements. In 2017, Credit Suisse reported income before taxes of CHF 1,793 million and adjusted income before taxes of CHF 2,762 million.
RESULTSNet revenuesIn 4Q17, we reported net revenues of CHF 5,189 million, which increased 4% compared to 3Q17, primarily reflecting higher net revenues in Investment Banking & Capital Markets and Interna-tional Wealth Management and decreased negative net revenues
in the Strategic Resolution Unit, partially offset by lower net revenues in Global Markets. The increase in Investment Bank-ing & Capital Markets was due to higher revenues from equity underwriting, advisory and other fees and debt underwriting. The increase in International Wealth Management was primarily due to significantly higher transaction- and performance-based rev-enues, slightly higher recurring commissions and fees and higher net interest income. The decrease in negative net revenues in the Strategic Resolution Unit was primarily driven by exit-related gains from the sale and restructuring of loan portfolios and real estate exposures, partially offset by higher negative valuation adjust-ments. The decrease in Global Markets reflected subdued volatility which negatively impacted trading revenue, but positively impacted underwriting activity.
Net revenues were stable compared to 4Q16, primarily reflect-ing increased net revenues in International Wealth Management and the Corporate Center and a decrease in negative net revenues in the Strategic Resolution Unit, offset by lower net revenues in Global Markets and Swiss Universal Bank. The increase in Inter-national Wealth Management was driven by significantly higher transaction- and performance-based revenues, higher recur-ring commissions and fees and higher net interest income. The increase in the Corporate Center primarily reflected movements in treasury results. The decrease in negative net revenues in the Strategic Resolution Unit was driven by lower overall funding costs and exit-related gains from the sale and restructuring of loan port-folios, partially offset by a reduction in fee-based revenues as a result of accelerated business exits and negative valuation adjust-ments in 4Q17. The decrease in Global Markets was due to more favorable trading conditions in 4Q16, including higher volume and volatility, following the US presidential elections, and lower trading revenues, partially offset by improved underwriting activity. The decrease in Swiss Universal Bank was mainly due to lower trans-action-based revenues, gains on the sale of real estate in 4Q16 and slightly lower net interest income and recurring commissions and fees.
5Earnings Release 4Q17
Credit Suisse
Provision for credit lossesProvision for credit losses in 4Q17 was CHF 43 million, primar-ily related to net provisions of CHF 15 million in Swiss Universal Bank, CHF 14 million in International Wealth Management, CHF 8 million in Global Markets and CHF 7 million in Asia Pacific.
Litigation mattersIn November 2017, Credit Suisse reached a settlement with the New York State Department of Financial Services (DFS), result-ing in a pre-tax charge of USD 135 million. The agreement with the DFS settles claims relating to certain areas of Credit Suisse’s voice and electronic foreign exchange trading business between 2008 and 2015.
Credit Suisse has been responding to requests from certain governmental and regulatory authorities, including the DOJ and the US Securities and Exchange Commission (SEC), regarding Credit Suisse’s hiring practices in the Asia Pacific region and, in particular, whether Credit Suisse hired referrals from government agencies and other state-owned entities in exchange for invest-ment banking business and/or regulatory approvals, in potential violation of the US Foreign Corrupt Practices Act and related civil statutes. Credit Suisse is cooperating with the authorities on this matter.
Total operating expensesWe reported total operating expenses of CHF 5,005 million in 4Q17, an increase of 10% compared to 3Q17, reflecting a 21% increase in general and administrative expenses, mainly relating to higher professional services fees and litigation provisions, a 3% increase in compensation and benefits and a 22% increase in restructuring expenses. In 4Q17, we incurred CHF 137 million of restructuring expenses in connection with the implementation of our strategy, of which CHF 65 million were compensation and benefits-related expenses.
Total operating expenses decreased 32% compared to 4Q16, primarily reflecting a 53% decrease in general and administrative expenses, mainly relating to lower litigation provisions, and a 6% decrease in compensation and benefits, partially offset by a 180% increase in restructuring expenses.
Income tax expenseIncome tax expense of CHF 2,234 million in 4Q17 mainly reflected the re-assessment of deferred tax assets, with an associated tax charge of CHF 2.3 billion primarily resulting from the US tax reform, the non-deductible penalty relating to the settlement with the DFS regarding the foreign exchange business and the impact from rec-ognizing tax contingency accruals, partially offset by the impact of
the geographical mix of results. Overall, net deferred tax assets decreased CHF 2,104 million to CHF 5,128 million during 4Q17, mainly driven by the re-assessment of deferred taxes, partially off-set by earnings and a foreign exchange impact. Deferred tax assets on net operating losses decreased CHF 453 million to CHF 2,213 million during 4Q17.
US tax reform – Tax Cuts and Jobs ActThe US tax reform enacted on December 22, 2017 resulted in a reduction of the federal corporate income tax rate from 35% to 21%, effective as of January 1, 2018. The US tax reform required a re-assessment of our deferred tax assets, which resulted in a tax charge recorded in 4Q17, primarily related to our US deferred tax assets. The impact of the US tax reform on our look-through com-mon equity tier 1 (CET1) ratio in 4Q17 was minimal.
The reform also introduced the base erosion and anti-abuse tax (BEAT), effective as of January 1, 2018. It is broadly levied on tax deductions created by certain payments, e.g. for interest and services, to affiliated group companies outside the US, in the case where the calculated tax based on a modified taxable income exceeds the amount of ordinary federal corporate income taxes paid. The tax rates applicable for banks are 6% for 2018, 11% for 2019 until 2025 and 13.5% from 2026 onward. On the basis of the current analysis of the BEAT alternative tax regime, we regard it as more likely than not that the Group will not be subject to this regime in 2018. However, there are significant uncertainties in the application of BEAT and this interpretation will be subject to review once further guidance has been issued by the US Department of Treasury.
Capital distribution proposalOur Board of Directors will propose to the shareholders at the Annual General Meeting (AGM) on April 27, 2018 a distribution of CHF 0.25 per share out of capital contribution reserves for the financial year 2017. The distribution will be free of Swiss withhold-ing tax and will not be subject to income tax for Swiss resident individuals holding the shares as a private investment. The distribu-tion will be payable in cash.
Board of directorsThe Board of Directors of Credit Suisse Group AG is proposing Michael Klein and Ana Paula Pessoa for election as new non-executive members of the Board of Directors at the 2018 AGM. Richard E. Thornburgh, upon reaching the relevant tenure limit, will not stand for re-election. All other members of the Board of Directors will stand for re-election for a further term of office of one year.
6Earnings Release 4Q17
Credit Suisse
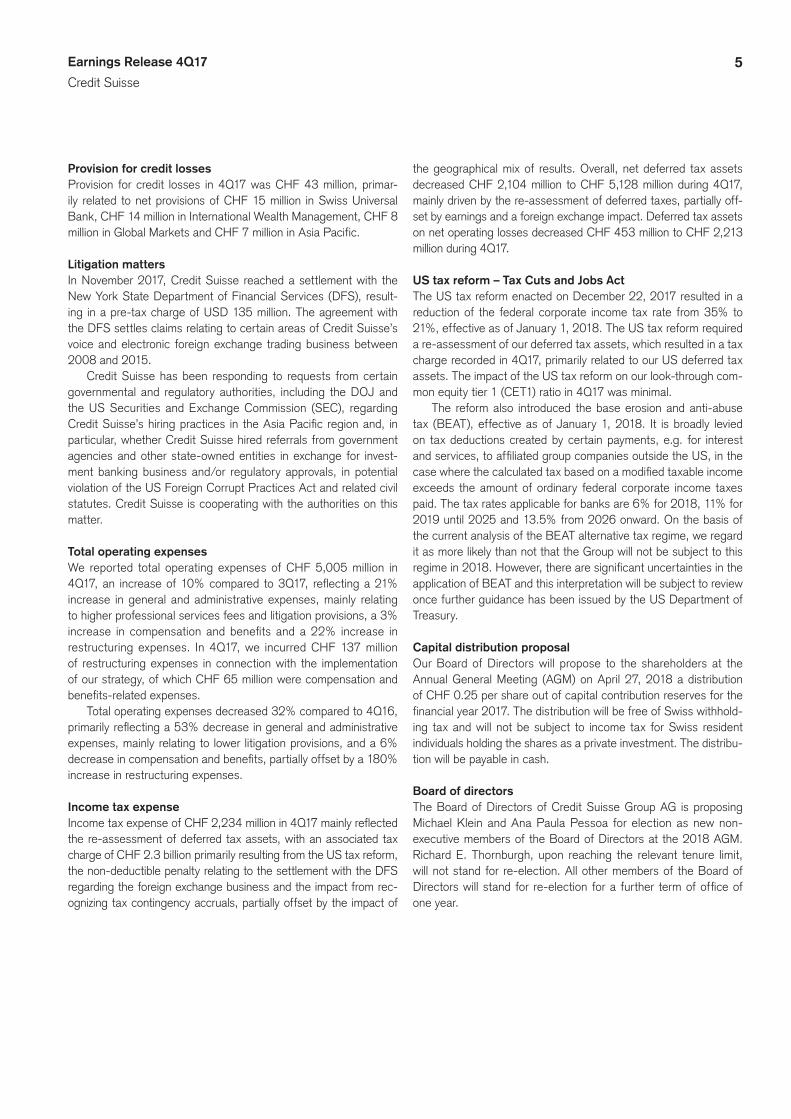
Overview of Results
Investment Swiss International Banking & Strategic Universal Wealth Global Capital Corporate Core Resolution Credit in / end of Bank Management Asia Pacific Markets Markets Center Results Unit Suisse
4Q17 (CHF million)
Net revenues 1,318 1,364 885 1,163 565 45 5,340 (151) 5,189
Provision for credit losses 15 14 7 8 (1) (3) 40 3 43
Compensation and benefits 453 561 394 645 324 84 2,461 65 2,526
Total other operating expenses 417 449 308 705 135 229 2,243 236 2,479
of which general and administrative expenses 352 371 217 490 119 219 1,768 209 1,977
of which restructuring expenses (2) 11 23 71 14 2 119 18 137
Total operating expenses 870 1,010 702 1,350 459 313 4,704 301 5,005
Income/(loss) before taxes 433 340 176 (195) 107 (265) 596 (455) 141
Return on regulatory capital (%) 13.5 25.2 13.3 (5.5) 15.0 – 5.6 – 1.2
Cost/income ratio (%) 66.0 74.0 79.3 116.1 81.2 – 88.1 – 96.5
Total assets 228,857 94,753 96,497 242,159 20,803 67,591 750,660 45,629 796,289
Goodwill 610 1,544 1,496 459 633 0 4,742 0 4,742
Risk-weighted assets 1 65,572 38,256 31,474 58,858 20,058 23,849 238,067 33,613 271,680
Leverage exposure 1 257,054 99,267 105,585 283,809 43,842 67,034 856,591 59,934 916,525
3Q17 (CHF million)
Net revenues 1,319 1,262 890 1,262 457 37 5,227 (255) 4,972
Provision for credit losses 14 3 5 6 12 0 40 (8) 32
Compensation and benefits 462 543 397 568 293 103 2,366 85 2,451
Total other operating expenses 417 361 270 617 117 61 1,843 246 2,089
of which general and administrative expenses 340 285 195 451 99 44 1,414 216 1,630
of which restructuring expenses 13 16 10 27 16 9 91 21 112
Total operating expenses 879 904 667 1,185 410 164 4,209 331 4,540
Income/(loss) before taxes 426 355 218 71 35 (127) 978 (578) 400
Return on regulatory capital (%) 13.2 26.9 16.8 2.0 5.2 – 9.3 – 3.5
Cost/income ratio (%) 66.6 71.6 74.9 93.9 89.7 – 80.5 – 91.3
Total assets 228,647 88,692 95,919 239,910 20,477 65,636 739,281 49,409 788,690
Goodwill 606 1,540 1,485 456 628 0 4,715 0 4,715
Risk-weighted assets 1 64,519 37,217 31,237 55,993 19,486 20,718 229,170 35,842 265,012
Leverage exposure 1 256,207 93,455 106,128 281,531 42,794 63,467 843,582 65,385 908,967
4Q16 (CHF million)
Net revenues 1,399 1,299 862 1,265 574 (16) 5,383 (202) 5,181
Provision for credit losses 34 6 11 (4) 0 0 47 28 75
Compensation and benefits 497 565 429 634 329 122 2,576 106 2,682
Total other operating expenses 486 397 319 630 96 140 2,068 2,559 4,627
of which general and administrative expenses 416 318 219 475 101 101 1,630 2,554 4,184
of which restructuring expenses (3) 16 19 15 (6) 7 48 1 49
Total operating expenses 983 962 748 1,264 425 262 4,644 2,665 7,309
Income/(loss) before taxes 382 331 103 5 149 (278) 692 (2,895) (2,203)
Return on regulatory capital (%) 12.2 27.0 7.6 0.3 22.9 – 6.6 – (18.6)
Cost/income ratio (%) 70.3 74.1 86.8 99.9 74.0 – 86.3 – 141.1
Total assets 228,363 91,083 97,221 239,700 20,784 62,413 739,564 80,297 819,861
Goodwill 623 1,612 1,546 476 656 0 4,913 0 4,913
Risk-weighted assets 1 65,669 35,252 34,605 51,713 18,027 17,338 222,604 45,441 268,045
Leverage exposure 1 252,889 94,092 108,926 284,143 45,571 59,374 844,995 105,768 950,763
1 Disclosed on a look-through basis.
7Earnings Release 4Q17
Credit Suisse
Overview of Results (continued)
Investment Swiss International Banking & Strategic Universal Wealth Global Capital Corporate Core Resolution Credit in / end of Bank Management Asia Pacific Markets Markets Center Results Unit Suisse
2017 (CHF million)
Net revenues 5,396 5,111 3,504 5,551 2,139 85 21,786 (886) 20,900
Provision for credit losses 75 27 15 31 30 0 178 32 210
Compensation and benefits 1,833 2,216 1,602 2,532 1,268 394 9,845 332 10,177
Total other operating expenses 1,723 1,517 1,158 2,538 472 427 7,835 885 8,720
of which general and administrative expenses 1,375 1,203 831 1,839 423 368 6,039 796 6,835
of which restructuring expenses 59 70 63 150 42 14 398 57 455
Total operating expenses 3,556 3,733 2,760 5,070 1,740 821 17,680 1,217 18,897
Income/(loss) before taxes 1,765 1,351 729 450 369 (736) 3,928 (2,135) 1,793
Return on regulatory capital (%) 13.7 25.8 13.8 3.2 13.7 – 9.3 – 3.9
Cost/income ratio (%) 65.9 73.0 78.8 91.3 81.3 – 81.2 – 90.4
2016 (CHF million)
Net revenues 5,759 4,698 3,597 5,497 1,972 71 21,594 (1,271) 20,323
Provision for credit losses 79 20 26 (3) 20 (1) 141 111 252
Compensation and benefits 1,937 2,119 1,665 2,725 1,237 277 9,960 612 10,572
Total other operating expenses 1,718 1,438 1,181 2,727 454 482 8,000 3,765 11,765
of which general and administrative expenses 1,375 1,145 836 2,001 424 399 6,180 3,590 9,770
of which restructuring expenses 60 54 53 217 28 7 419 121 540
Total operating expenses 3,655 3,557 2,846 5,452 1,691 759 17,960 4,377 22,337
Income/(loss) before taxes 2,025 1,121 725 48 261 (687) 3,493 (5,759) (2,266)
Return on regulatory capital (%) 16.5 23.3 13.7 0.4 10.7 – 8.5 – (4.7)
Cost/income ratio (%) 63.5 75.7 79.1 99.2 85.8 – 83.2 – 109.9
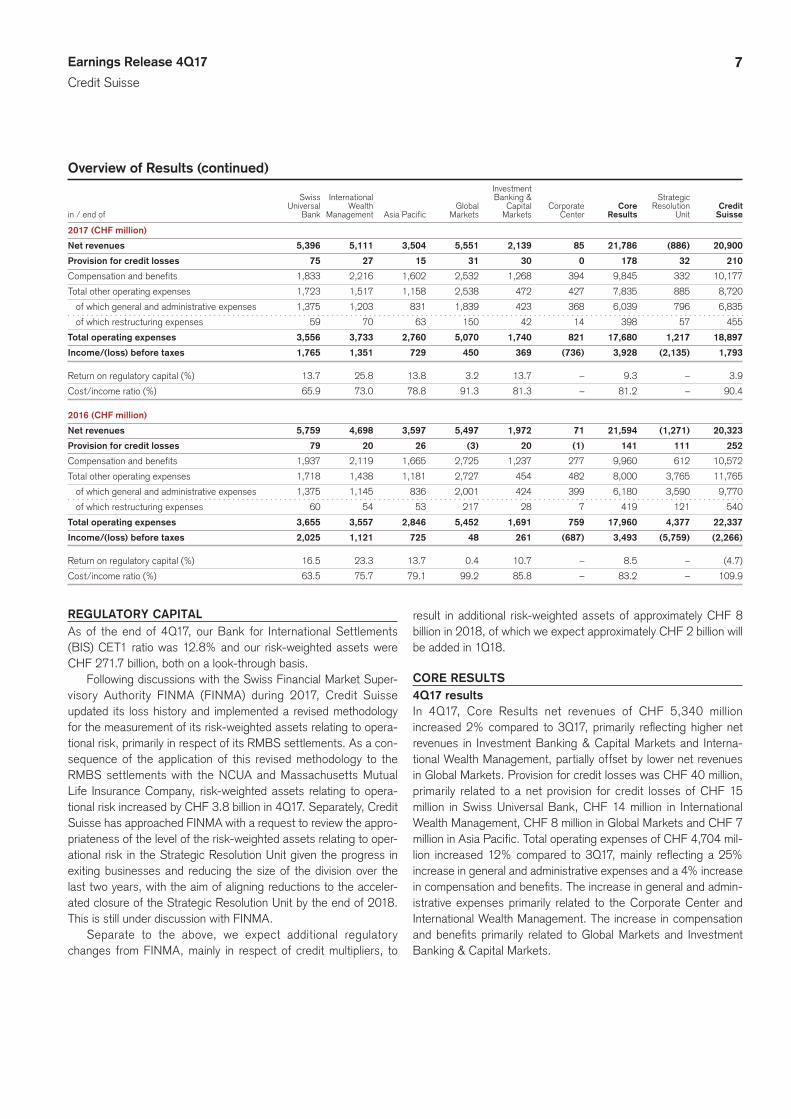
REGULATORY CAPITALAs of the end of 4Q17, our Bank for International Settlements (BIS) CET1 ratio was 12.8% and our risk-weighted assets were CHF 271.7 billion, both on a look-through basis.
Following discussions with the Swiss Financial Market Super-visory Authority FINMA (FINMA) during 2017, Credit Suisse updated its loss history and implemented a revised methodology for the measurement of its risk-weighted assets relating to opera-tional risk, primarily in respect of its RMBS settlements. As a con-sequence of the application of this revised methodology to the RMBS settlements with the NCUA and Massachusetts Mutual Life Insurance Company, risk-weighted assets relating to opera-tional risk increased by CHF 3.8 billion in 4Q17. Separately, Credit Suisse has approached FINMA with a request to review the appro-priateness of the level of the risk-weighted assets relating to oper-ational risk in the Strategic Resolution Unit given the progress in exiting businesses and reducing the size of the division over the last two years, with the aim of aligning reductions to the acceler-ated closure of the Strategic Resolution Unit by the end of 2018. This is still under discussion with FINMA.
Separate to the above, we expect additional regulatory changes from FINMA, mainly in respect of credit multipliers, to
result in additional risk-weighted assets of approximately CHF 8 billion in 2018, of which we expect approximately CHF 2 billion will be added in 1Q18.
CORE RESULTS4Q17 resultsIn 4Q17, Core Results net revenues of CHF 5,340 million increased 2% compared to 3Q17, primarily reflecting higher net revenues in Investment Banking & Capital Markets and Interna-tional Wealth Management, partially offset by lower net revenues in Global Markets. Provision for credit losses was CHF 40 million, primarily related to a net provision for credit losses of CHF 15 million in Swiss Universal Bank, CHF 14 million in International Wealth Management, CHF 8 million in Global Markets and CHF 7 million in Asia Pacific. Total operating expenses of CHF 4,704 mil-lion increased 12% compared to 3Q17, mainly reflecting a 25% increase in general and administrative expenses and a 4% increase in compensation and benefits. The increase in general and admin-istrative expenses primarily related to the Corporate Center and International Wealth Management. The increase in compensation and benefits primarily related to Global Markets and Investment Banking & Capital Markets.
8Earnings Release 4Q17
Credit Suisse
Core Results net revenues were stable compared to 4Q16, pri-marily reflecting lower net revenues in Global Markets and Swiss Universal Bank, offset by an increase in net revenues in Interna-tional Wealth Management and the Corporate Center. Total oper-ating expenses were stable compared to 4Q16, primarily reflect-ing an 8% increase in general and administrative expenses and a 148% increase in restructuring expenses, partially offset by a 4% decrease in compensation and benefits. The increase in gen-eral and administrative expenses primarily related to the Corporate Center and International Wealth Management, partially offset by a decrease in Swiss Universal Bank. Compared to 4Q16, restructur-ing expenses of CHF 119 million increased significantly, primarily in Global Markets and Investment Banking & Capital Markets. The decrease in compensation and benefits primarily related to Swiss Universal Bank and Asia Pacific.
2017 resultsIn 2017, Core Results reported income before taxes of CHF 3,928 million, an increase of 12% compared to 2016, primarily due to stable net revenues, lower general and administrative expenses and lower compensation and benefits, offset by a higher provision for credit losses. The stable net revenues in 2017 were mainly related to higher net revenues in International Wealth Management and Investment Banking & Capital Markets, offset by lower net revenues in Swiss Universal Bank and Asia Pacific. The lower gen-eral and administrative expenses were primarily related to Global Markets. The lower compensation and benefits were mainly due to decreases in compensation and benefits in Global Markets, Swiss Universal Bank and Asia Pacific, partially offset by higher com-pensation and benefits in the Corporate Center and International Wealth Management. The higher provision for credit losses was mainly related to Global Markets.
FINANCIAL TARGETS AND OBJECTIVESAt the Investor Day on November 30, 2017, we confirmed or updated our financial targets for the Group and the divisions. We also communicated new financial objectives for the Group for 2019 and 2020.
As indicated, many of our references to ambitions, objec-tives and targets for revenues, operating expenses, income/(loss) before taxes and return on regulatory capital are on an adjusted basis. These adjusted numbers and return on tangible equity attributable to shareholders are non-GAAP financial measures. Adjusted results exclude goodwill impairment, major litigation charges, restructuring expenses and gains, losses and expenses from business or real estate sales. The operating cost base on an adjusted basis and our cost savings program are measured using adjusted total operating expenses at constant foreign exchange rates since 2015 and also include adjustments for certain account-ing changes (which had not been in place at the launch of the cost savings program), debit valuation adjustments related volatility and for foreign exchange. Return on tangible equity attributable to shareholders is based on tangible shareholders’ equity attributable to shareholders, which is calculated by deducting goodwill and
other intangible assets from total shareholders’ equity attributable to shareholders as presented in our balance sheet. Management believes that the return on tangible shareholders’ equity attribut-able to shareholders is meaningful as it allows consistent measure-ment of the performance of businesses without regard to whether the businesses were acquired. A reconciliation of these ambitions, objectives and targets to the nearest GAAP measures is unavail-able without unreasonable efforts, as the items of exclusion are unavailable on a prospective basis.
Financial targets:p reduce our operating cost base on an adjusted basis to below
CHF 17.0 billion by year-end 2018;p increase our cumulative net cost savings on an adjusted basis
to more than CHF 4.2 billion by year-end 2018;p maintain a look-through CET1 ratio of greater than 12.5% in
2018;p achieve a look-through CET1 leverage ratio of greater than
3.5% and a look-through tier 1 leverage ratio of greater than 5.0% in 2018;
p achieve adjusted income before taxes for Swiss Universal Bank of CHF 2.3 billion in 2018;
p achieve adjusted income before taxes for International Wealth Management of CHF 1.8 billion in 2018;
p achieve adjusted income before taxes for Asia Pacific Wealth Management & Connected of CHF 0.85 billion in 2018 and an adjusted return on regulatory capital for Asia Pacific Markets of 10-15% for full-year 2019;
p achieve adjusted return on regulatory capital for Investment Banking & Capital Markets of 15-20% for full-year 2018;
p achieve adjusted return on regulatory capital for Global Mar-kets of 10-15% for full-year 2018 while operating within a risk-weighted assets threshold of USD 60 billion and a leverage exposure threshold of USD 290 billion; and
p reduce adjusted loss before taxes for the Strategic Resolution Unit to approximately USD 1.4 billion in 2018, reduce risk-weighted assets (excluding operational risk) to USD 11 bil-lion and reduce leverage exposure to USD 40 billion by year-end 2018; reduce adjusted loss before taxes to approximately USD 0.5 billion in 2019.
Financial objectives for 2019 and 2020:p intend to increase our return on tangible equity attributable to
shareholders to 10-11% by 2019 and 11-12% by 2020;p intend to operate at an annual cost base on an adjusted basis
of CHF 16.5–17.0 billion in 2019 and 2020, subject to market conditions and investment opportunities within this range;
p intend to operate at a look-through CET1 ratio of greater than 12.5% for 2019 and 2020, before the implementation of the Basel III reforms beginning in 2020; and
p plan to distribute 50% of net income earned cumulatively in 2019 and 2020 to shareholders primarily through share buy-backs or special dividends.
9Earnings Release 4Q17
Credit Suisse
Reconciliation of adjusted results
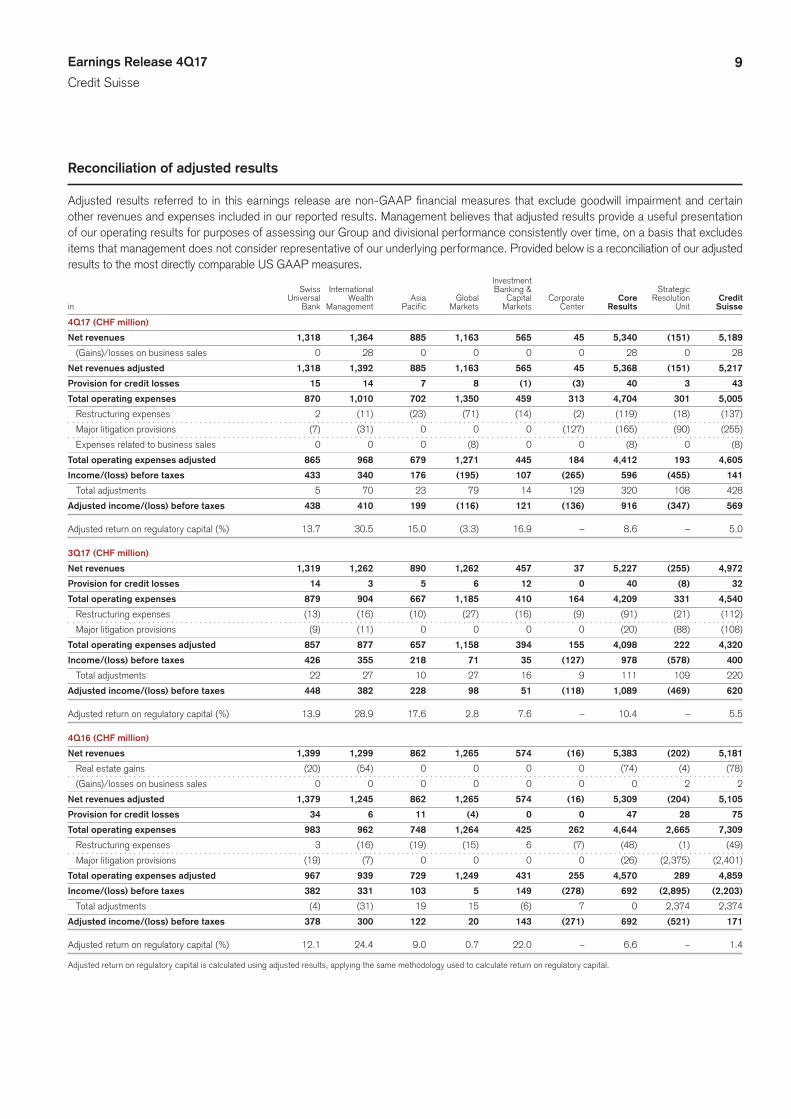
Adjusted results referred to in this earnings release are non-GAAP financial measures that exclude goodwill impairment and certain other revenues and expenses included in our reported results. Management believes that adjusted results provide a useful presentation of our operating results for purposes of assessing our Group and divisional performance consistently over time, on a basis that excludes items that management does not consider representative of our underlying performance. Provided below is a reconciliation of our adjusted results to the most directly comparable US GAAP measures. Investment Swiss International Banking & Strategic Universal Wealth Asia Global Capital Corporate Core Resolution Credit in Bank Management Pacific Markets Markets Center Results Unit Suisse
4Q17 (CHF million)
Net revenues 1,318 1,364 885 1,163 565 45 5,340 (151) 5,189
(Gains)/losses on business sales 0 28 0 0 0 0 28 0 28
Net revenues adjusted 1,318 1,392 885 1,163 565 45 5,368 (151) 5,217
Provision for credit losses 15 14 7 8 (1) (3) 40 3 43
Total operating expenses 870 1,010 702 1,350 459 313 4,704 301 5,005
Restructuring expenses 2 (11) (23) (71) (14) (2) (119) (18) (137)
Major litigation provisions (7) (31) 0 0 0 (127) (165) (90) (255)
Expenses related to business sales 0 0 0 (8) 0 0 (8) 0 (8)
Total operating expenses adjusted 865 968 679 1,271 445 184 4,412 193 4,605
Income/(loss) before taxes 433 340 176 (195) 107 (265) 596 (455) 141
Total adjustments 5 70 23 79 14 129 320 108 428
Adjusted income/(loss) before taxes 438 410 199 (116) 121 (136) 916 (347) 569
Adjusted return on regulatory capital (%) 13.7 30.5 15.0 (3.3) 16.9 – 8.6 – 5.0
3Q17 (CHF million)
Net revenues 1,319 1,262 890 1,262 457 37 5,227 (255) 4,972
Provision for credit losses 14 3 5 6 12 0 40 (8) 32
Total operating expenses 879 904 667 1,185 410 164 4,209 331 4,540
Restructuring expenses (13) (16) (10) (27) (16) (9) (91) (21) (112)
Major litigation provisions (9) (11) 0 0 0 0 (20) (88) (108)
Total operating expenses adjusted 857 877 657 1,158 394 155 4,098 222 4,320
Income/(loss) before taxes 426 355 218 71 35 (127) 978 (578) 400
Total adjustments 22 27 10 27 16 9 111 109 220
Adjusted income/(loss) before taxes 448 382 228 98 51 (118) 1,089 (469) 620
Adjusted return on regulatory capital (%) 13.9 28.9 17.6 2.8 7.6 – 10.4 – 5.5
4Q16 (CHF million)
Net revenues 1,399 1,299 862 1,265 574 (16) 5,383 (202) 5,181
Real estate gains (20) (54) 0 0 0 0 (74) (4) (78)
(Gains)/losses on business sales 0 0 0 0 0 0 0 2 2
Net revenues adjusted 1,379 1,245 862 1,265 574 (16) 5,309 (204) 5,105
Provision for credit losses 34 6 11 (4) 0 0 47 28 75
Total operating expenses 983 962 748 1,264 425 262 4,644 2,665 7,309
Restructuring expenses 3 (16) (19) (15) 6 (7) (48) (1) (49)
Major litigation provisions (19) (7) 0 0 0 0 (26) (2,375) (2,401)
Total operating expenses adjusted 967 939 729 1,249 431 255 4,570 289 4,859
Income/(loss) before taxes 382 331 103 5 149 (278) 692 (2,895) (2,203)
Total adjustments (4) (31) 19 15 (6) 7 0 2,374 2,374
Adjusted income/(loss) before taxes 378 300 122 20 143 (271) 692 (521) 171
Adjusted return on regulatory capital (%) 12.1 24.4 9.0 0.7 22.0 – 6.6 – 1.4
Adjusted return on regulatory capital is calculated using adjusted results, applying the same methodology used to calculate return on regulatory capital.
10Earnings Release 4Q17
Credit Suisse
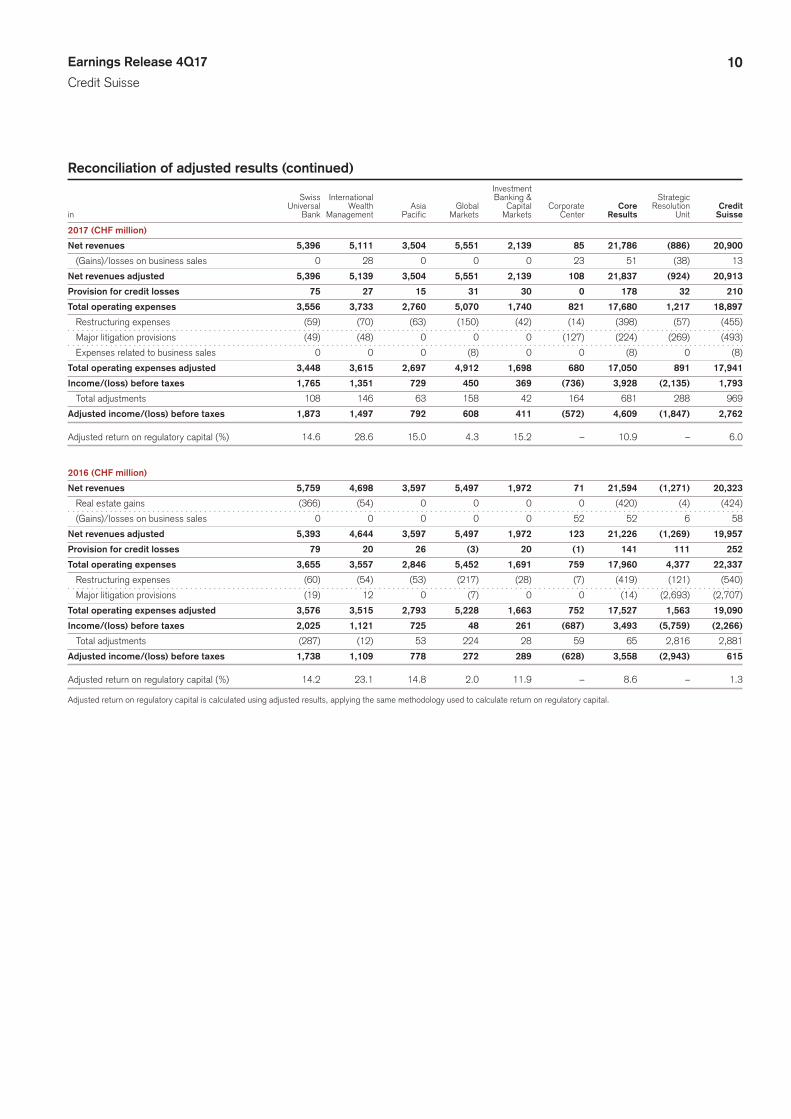
Reconciliation of adjusted results (continued) Investment Swiss International Banking & Strategic Universal Wealth Asia Global Capital Corporate Core Resolution Credit in Bank Management Pacific Markets Markets Center Results Unit Suisse
2017 (CHF million)
Net revenues 5,396 5,111 3,504 5,551 2,139 85 21,786 (886) 20,900
(Gains)/losses on business sales 0 28 0 0 0 23 51 (38) 13
Net revenues adjusted 5,396 5,139 3,504 5,551 2,139 108 21,837 (924) 20,913
Provision for credit losses 75 27 15 31 30 0 178 32 210
Total operating expenses 3,556 3,733 2,760 5,070 1,740 821 17,680 1,217 18,897
Restructuring expenses (59) (70) (63) (150) (42) (14) (398) (57) (455)
Major litigation provisions (49) (48) 0 0 0 (127) (224) (269) (493)
Expenses related to business sales 0 0 0 (8) 0 0 (8) 0 (8)
Total operating expenses adjusted 3,448 3,615 2,697 4,912 1,698 680 17,050 891 17,941
Income/(loss) before taxes 1,765 1,351 729 450 369 (736) 3,928 (2,135) 1,793
Total adjustments 108 146 63 158 42 164 681 288 969
Adjusted income/(loss) before taxes 1,873 1,497 792 608 411 (572) 4,609 (1,847) 2,762
Adjusted return on regulatory capital (%) 14.6 28.6 15.0 4.3 15.2 – 10.9 – 6.0
2016 (CHF million)
Net revenues 5,759 4,698 3,597 5,497 1,972 71 21,594 (1,271) 20,323
Real estate gains (366) (54) 0 0 0 0 (420) (4) (424)
(Gains)/losses on business sales 0 0 0 0 0 52 52 6 58
Net revenues adjusted 5,393 4,644 3,597 5,497 1,972 123 21,226 (1,269) 19,957
Provision for credit losses 79 20 26 (3) 20 (1) 141 111 252
Total operating expenses 3,655 3,557 2,846 5,452 1,691 759 17,960 4,377 22,337
Restructuring expenses (60) (54) (53) (217) (28) (7) (419) (121) (540)
Major litigation provisions (19) 12 0 (7) 0 0 (14) (2,693) (2,707)
Total operating expenses adjusted 3,576 3,515 2,793 5,228 1,663 752 17,527 1,563 19,090
Income/(loss) before taxes 2,025 1,121 725 48 261 (687) 3,493 (5,759) (2,266)
Total adjustments (287) (12) 53 224 28 59 65 2,816 2,881
Adjusted income/(loss) before taxes 1,738 1,109 778 272 289 (628) 3,558 (2,943) 615
Adjusted return on regulatory capital (%) 14.2 23.1 14.8 2.0 11.9 – 8.6 – 1.3
Adjusted return on regulatory capital is calculated using adjusted results, applying the same methodology used to calculate return on regulatory capital.
11Earnings Release 4Q17
Swiss Universal Bank
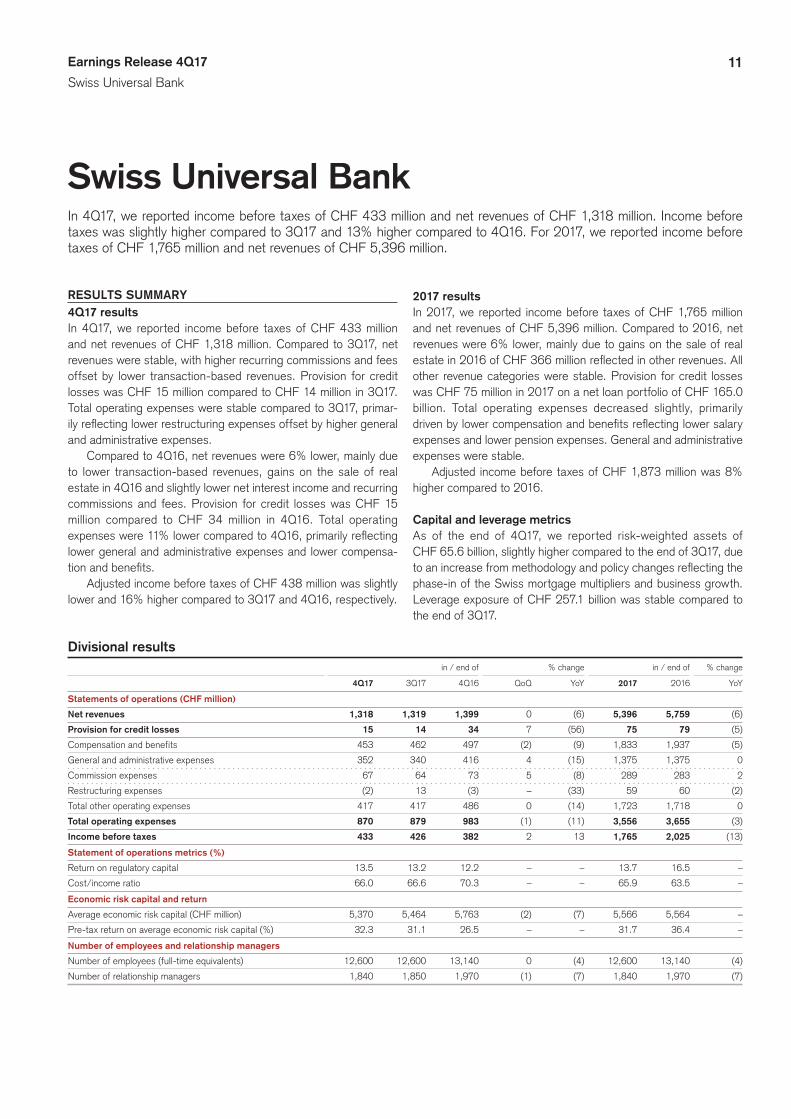
Swiss Universal BankIn 4Q17, we reported income before taxes of CHF 433 million and net revenues of CHF 1,318 million. Income before taxes was slightly higher compared to 3Q17 and 13% higher compared to 4Q16. For 2017, we reported income before taxes of CHF 1,765 million and net revenues of CHF 5,396 million.
RESULTS SUMMARY4Q17 resultsIn 4Q17, we reported income before taxes of CHF 433 million and net revenues of CHF 1,318 million. Compared to 3Q17, net revenues were stable, with higher recurring commissions and fees offset by lower transaction-based revenues. Provision for credit losses was CHF 15 million compared to CHF 14 million in 3Q17. Total operating expenses were stable compared to 3Q17, primar-ily reflecting lower restructuring expenses offset by higher general and administrative expenses.
Compared to 4Q16, net revenues were 6% lower, mainly due to lower transaction-based revenues, gains on the sale of real estate in 4Q16 and slightly lower net interest income and recurring commissions and fees. Provision for credit losses was CHF 15 million compared to CHF 34 million in 4Q16. Total operating expenses were 11% lower compared to 4Q16, primarily reflecting lower general and administrative expenses and lower compensa-tion and benefits.
Adjusted income before taxes of CHF 438 million was slightly lower and 16% higher compared to 3Q17 and 4Q16, respectively.
2017 resultsIn 2017, we reported income before taxes of CHF 1,765 million and net revenues of CHF 5,396 million. Compared to 2016, net revenues were 6% lower, mainly due to gains on the sale of real estate in 2016 of CHF 366 million reflected in other revenues. All other revenue categories were stable. Provision for credit losses was CHF 75 million in 2017 on a net loan portfolio of CHF 165.0 billion. Total operating expenses decreased slightly, primarily driven by lower compensation and benefits reflecting lower salary expenses and lower pension expenses. General and administrative expenses were stable.
Adjusted income before taxes of CHF 1,873 million was 8% higher compared to 2016.
Capital and leverage metricsAs of the end of 4Q17, we reported risk-weighted assets of CHF 65.6 billion, slightly higher compared to the end of 3Q17, due to an increase from methodology and policy changes reflecting the phase-in of the Swiss mortgage multipliers and business growth. Leverage exposure of CHF 257.1 billion was stable compared to the end of 3Q17.
Divisional results in / end of % change in / end of % change
4Q17 3Q17 4Q16 QoQ YoY 2017 2016 YoY
Statements of operations (CHF million)
Net revenues 1,318 1,319 1,399 0 (6) 5,396 5,759 (6)
Provision for credit losses 15 14 34 7 (56) 75 79 (5)
Compensation and benefits 453 462 497 (2) (9) 1,833 1,937 (5)
General and administrative expenses 352 340 416 4 (15) 1,375 1,375 0
Commission expenses 67 64 73 5 (8) 289 283 2
Restructuring expenses (2) 13 (3) – (33) 59 60 (2)
Total other operating expenses 417 417 486 0 (14) 1,723 1,718 0
Total operating expenses 870 879 983 (1) (11) 3,556 3,655 (3)
Income before taxes 433 426 382 2 13 1,765 2,025 (13)
Statement of operations metrics (%)
Return on regulatory capital 13.5 13.2 12.2 – – 13.7 16.5 –
Cost/income ratio 66.0 66.6 70.3 – – 65.9 63.5 –
Economic risk capital and return
Average economic risk capital (CHF million) 5,370 5,464 5,763 (2) (7) 5,566 5,564 –
Pre-tax return on average economic risk capital (%) 32.3 31.1 26.5 – – 31.7 36.4 –
Number of employees and relationship managers
Number of employees (full-time equivalents) 12,600 12,600 13,140 0 (4) 12,600 13,140 (4)
Number of relationship managers 1,840 1,850 1,970 (1) (7) 1,840 1,970 (7)
12Earnings Release 4Q17
Swiss Universal Bank
Divisional results (continued) in / end of % change in / end of % change
4Q17 3Q17 4Q16 QoQ YoY 2017 2016 YoY
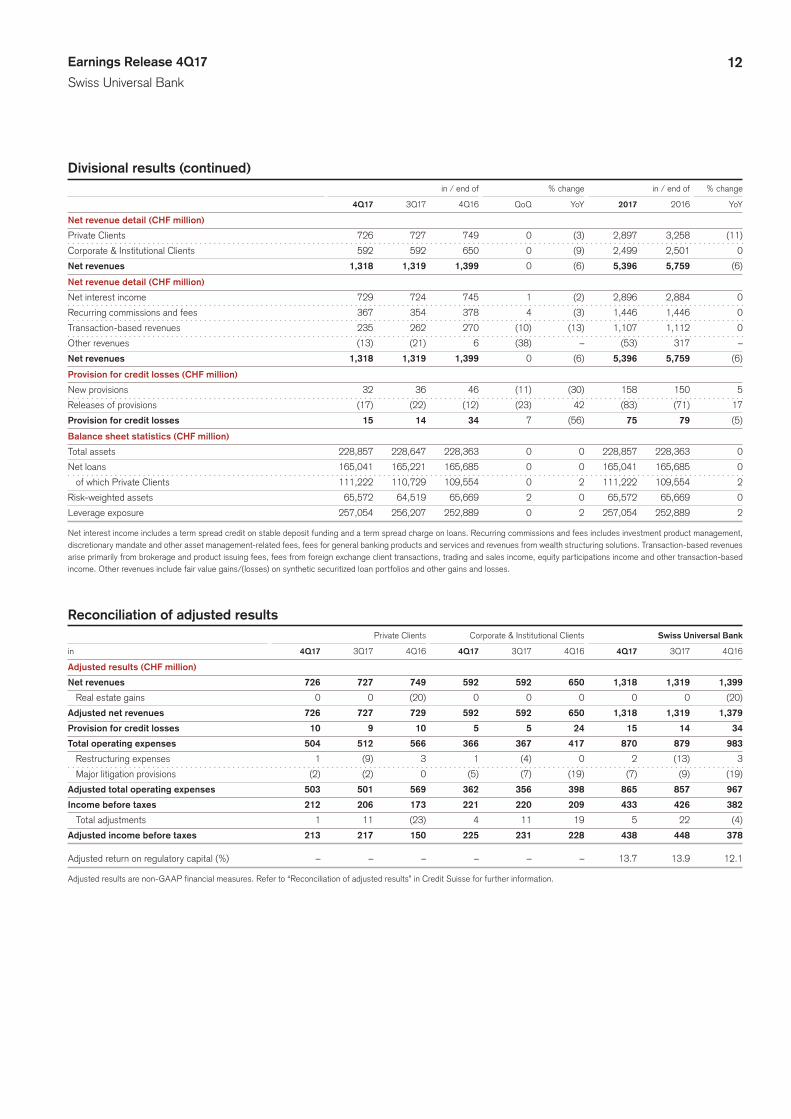
Net revenue detail (CHF million)
Private Clients 726 727 749 0 (3) 2,897 3,258 (11)
Corporate & Institutional Clients 592 592 650 0 (9) 2,499 2,501 0
Net revenues 1,318 1,319 1,399 0 (6) 5,396 5,759 (6)
Net revenue detail (CHF million)
Net interest income 729 724 745 1 (2) 2,896 2,884 0
Recurring commissions and fees 367 354 378 4 (3) 1,446 1,446 0
Transaction-based revenues 235 262 270 (10) (13) 1,107 1,112 0
Other revenues (13) (21) 6 (38) – (53) 317 –
Net revenues 1,318 1,319 1,399 0 (6) 5,396 5,759 (6)
Provision for credit losses (CHF million)
New provisions 32 36 46 (11) (30) 158 150 5
Releases of provisions (17) (22) (12) (23) 42 (83) (71) 17
Provision for credit losses 15 14 34 7 (56) 75 79 (5)
Balance sheet statistics (CHF million)
Total assets 228,857 228,647 228,363 0 0 228,857 228,363 0
Net loans 165,041 165,221 165,685 0 0 165,041 165,685 0
of which Private Clients 111,222 110,729 109,554 0 2 111,222 109,554 2
Risk-weighted assets 65,572 64,519 65,669 2 0 65,572 65,669 0
Leverage exposure 257,054 256,207 252,889 0 2 257,054 252,889 2
Net interest income includes a term spread credit on stable deposit funding and a term spread charge on loans. Recurring commissions and fees includes investment product management, discretionary mandate and other asset management-related fees, fees for general banking products and services and revenues from wealth structuring solutions. Transaction-based revenues arise primarily from brokerage and product issuing fees, fees from foreign exchange client transactions, trading and sales income, equity participations income and other transaction-based income. Other revenues include fair value gains/(losses) on synthetic securitized loan portfolios and other gains and losses.
Reconciliation of adjusted results Private Clients Corporate & Institutional Clients Swiss Universal Bank
in 4Q17 3Q17 4Q16 4Q17 3Q17 4Q16 4Q17 3Q17 4Q16
Adjusted results (CHF million)
Net revenues 726 727 749 592 592 650 1,318 1,319 1,399
Real estate gains 0 0 (20) 0 0 0 0 0 (20)
Adjusted net revenues 726 727 729 592 592 650 1,318 1,319 1,379
Provision for credit losses 10 9 10 5 5 24 15 14 34
Total operating expenses 504 512 566 366 367 417 870 879 983
Restructuring expenses 1 (9) 3 1 (4) 0 2 (13) 3
Major litigation provisions (2) (2) 0 (5) (7) (19) (7) (9) (19)
Adjusted total operating expenses 503 501 569 362 356 398 865 857 967
Income before taxes 212 206 173 221 220 209 433 426 382
Total adjustments 1 11 (23) 4 11 19 5 22 (4)
Adjusted income before taxes 213 217 150 225 231 228 438 448 378
Adjusted return on regulatory capital (%) – – – – – – 13.7 13.9 12.1
Adjusted results are non-GAAP financial measures. Refer to “Reconciliation of adjusted results” in Credit Suisse for further information.
13Earnings Release 4Q17
Swiss Universal Bank
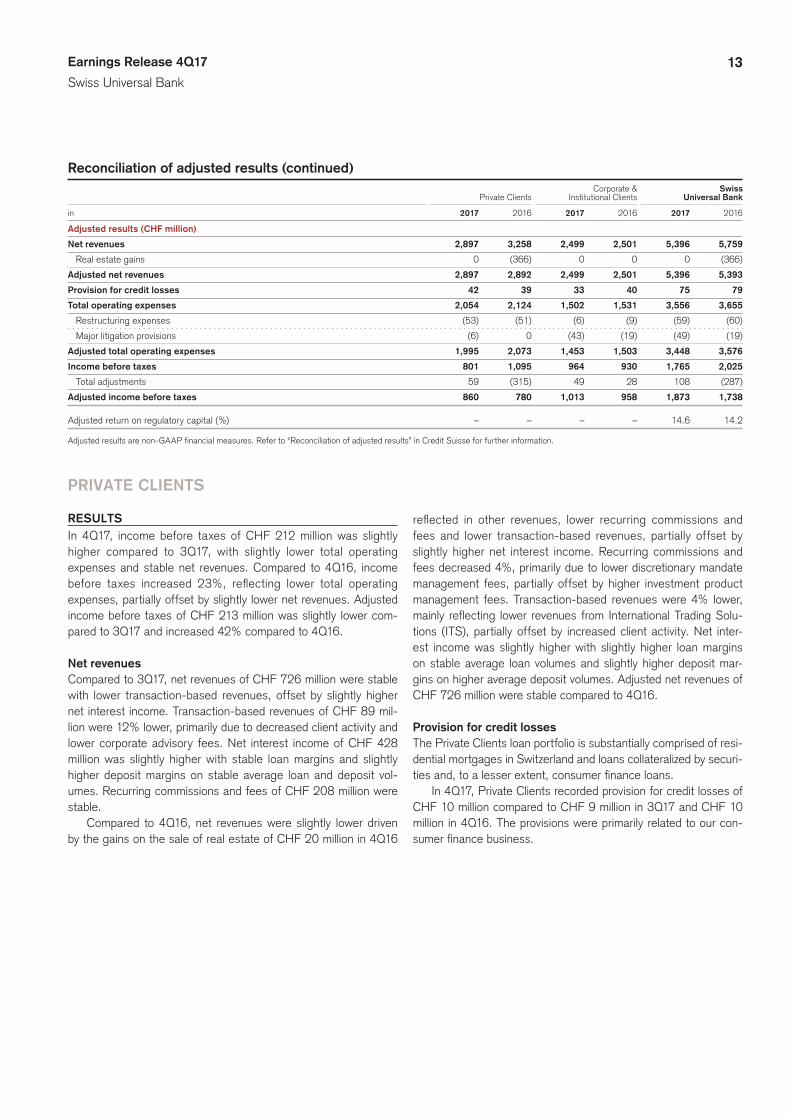
Reconciliation of adjusted results (continued) Corporate & Swiss Private Clients Institutional Clients Universal Bank
in 2017 2016 2017 2016 2017 2016
Adjusted results (CHF million)
Net revenues 2,897 3,258 2,499 2,501 5,396 5,759
Real estate gains 0 (366) 0 0 0 (366)
Adjusted net revenues 2,897 2,892 2,499 2,501 5,396 5,393
Provision for credit losses 42 39 33 40 75 79
Total operating expenses 2,054 2,124 1,502 1,531 3,556 3,655
Restructuring expenses (53) (51) (6) (9) (59) (60)
Major litigation provisions (6) 0 (43) (19) (49) (19)
Adjusted total operating expenses 1,995 2,073 1,453 1,503 3,448 3,576
Income before taxes 801 1,095 964 930 1,765 2,025
Total adjustments 59 (315) 49 28 108 (287)
Adjusted income before taxes 860 780 1,013 958 1,873 1,738
Adjusted return on regulatory capital (%) – – – – 14.6 14.2
Adjusted results are non-GAAP financial measures. Refer to “Reconciliation of adjusted results” in Credit Suisse for further information.
PRIVATE CLIENTS
RESULTSIn 4Q17, income before taxes of CHF 212 million was slightly higher compared to 3Q17, with slightly lower total operating expenses and stable net revenues. Compared to 4Q16, income before taxes increased 23%, reflecting lower total operating expenses, partially offset by slightly lower net revenues. Adjusted income before taxes of CHF 213 million was slightly lower com-pared to 3Q17 and increased 42% compared to 4Q16.
Net revenuesCompared to 3Q17, net revenues of CHF 726 million were stable with lower transaction-based revenues, offset by slightly higher net interest income. Transaction-based revenues of CHF 89 mil-lion were 12% lower, primarily due to decreased client activity and lower corporate advisory fees. Net interest income of CHF 428 million was slightly higher with stable loan margins and slightly higher deposit margins on stable average loan and deposit vol-umes. Recurring commissions and fees of CHF 208 million were stable.
Compared to 4Q16, net revenues were slightly lower driven by the gains on the sale of real estate of CHF 20 million in 4Q16
reflected in other revenues, lower recurring commissions and fees and lower transaction-based revenues, partially offset by slightly higher net interest income. Recurring commissions and fees decreased 4%, primarily due to lower discretionary mandate management fees, partially offset by higher investment product management fees. Transaction-based revenues were 4% lower, mainly reflecting lower revenues from International Trading Solu-tions (ITS), partially offset by increased client activity. Net inter-est income was slightly higher with slightly higher loan margins on stable average loan volumes and slightly higher deposit mar-gins on higher average deposit volumes. Adjusted net revenues of CHF 726 million were stable compared to 4Q16.
Provision for credit lossesThe Private Clients loan portfolio is substantially comprised of resi-dential mortgages in Switzerland and loans collateralized by securi-ties and, to a lesser extent, consumer finance loans.
In 4Q17, Private Clients recorded provision for credit losses of CHF 10 million compared to CHF 9 million in 3Q17 and CHF 10 million in 4Q16. The provisions were primarily related to our con-sumer finance business.
14Earnings Release 4Q17
Swiss Universal Bank
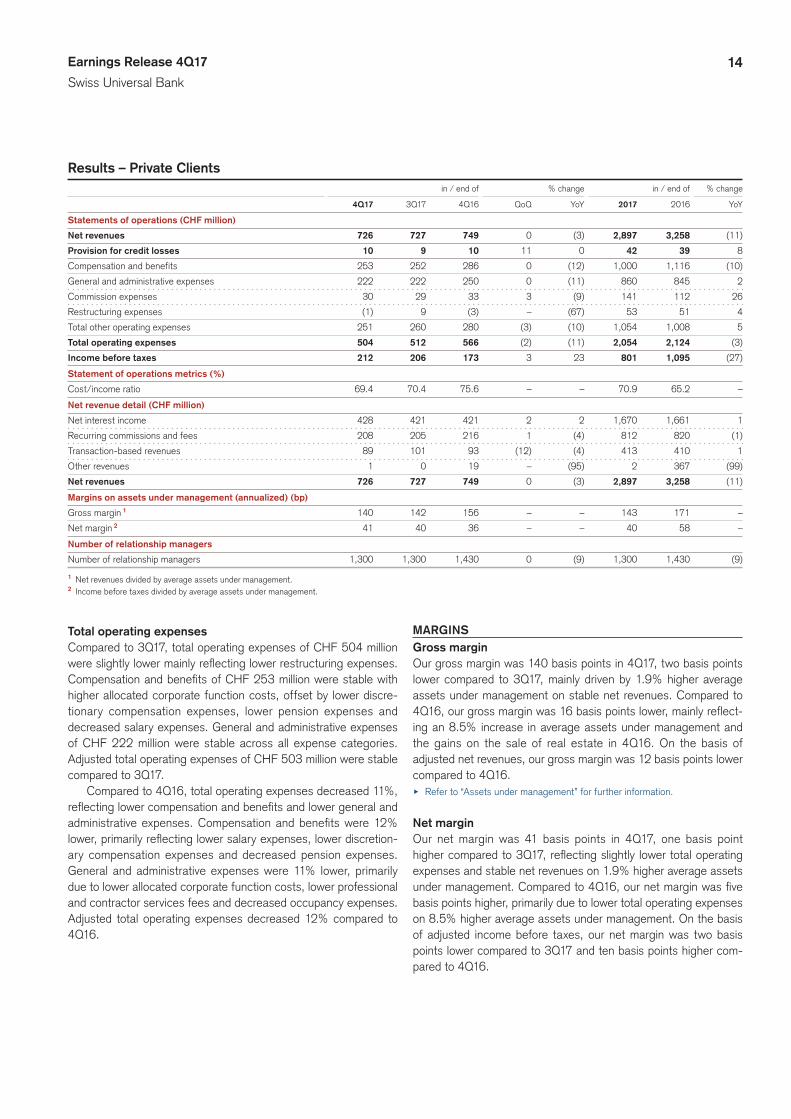
Results – Private Clients in / end of % change in / end of % change
4Q17 3Q17 4Q16 QoQ YoY 2017 2016 YoY
Statements of operations (CHF million)
Net revenues 726 727 749 0 (3) 2,897 3,258 (11)
Provision for credit losses 10 9 10 11 0 42 39 8
Compensation and benefits 253 252 286 0 (12) 1,000 1,116 (10)
General and administrative expenses 222 222 250 0 (11) 860 845 2
Commission expenses 30 29 33 3 (9) 141 112 26
Restructuring expenses (1) 9 (3) – (67) 53 51 4
Total other operating expenses 251 260 280 (3) (10) 1,054 1,008 5
Total operating expenses 504 512 566 (2) (11) 2,054 2,124 (3)
Income before taxes 212 206 173 3 23 801 1,095 (27)
Statement of operations metrics (%)
Cost/income ratio 69.4 70.4 75.6 – – 70.9 65.2 –
Net revenue detail (CHF million)
Net interest income 428 421 421 2 2 1,670 1,661 1
Recurring commissions and fees 208 205 216 1 (4) 812 820 (1)
Transaction-based revenues 89 101 93 (12) (4) 413 410 1
Other revenues 1 0 19 – (95) 2 367 (99)
Net revenues 726 727 749 0 (3) 2,897 3,258 (11)
Margins on assets under management (annualized) (bp)
Gross margin 1 140 142 156 – – 143 171 –
Net margin 2 41 40 36 – – 40 58 –
Number of relationship managers
Number of relationship managers 1,300 1,300 1,430 0 (9) 1,300 1,430 (9)
1 Net revenues divided by average assets under management.2 Income before taxes divided by average assets under management.
Total operating expensesCompared to 3Q17, total operating expenses of CHF 504 million were slightly lower mainly reflecting lower restructuring expenses. Compensation and benefits of CHF 253 million were stable with higher allocated corporate function costs, offset by lower discre-tionary compensation expenses, lower pension expenses and decreased salary expenses. General and administrative expenses of CHF 222 million were stable across all expense categories. Adjusted total operating expenses of CHF 503 million were stable compared to 3Q17.
Compared to 4Q16, total operating expenses decreased 11%, reflecting lower compensation and benefits and lower general and administrative expenses. Compensation and benefits were 12% lower, primarily reflecting lower salary expenses, lower discretion-ary compensation expenses and decreased pension expenses. General and administrative expenses were 11% lower, primarily due to lower allocated corporate function costs, lower professional and contractor services fees and decreased occupancy expenses. Adjusted total operating expenses decreased 12% compared to 4Q16.
MARGINSGross marginOur gross margin was 140 basis points in 4Q17, two basis points lower compared to 3Q17, mainly driven by 1.9% higher average assets under management on stable net revenues. Compared to 4Q16, our gross margin was 16 basis points lower, mainly reflect-ing an 8.5% increase in average assets under management and the gains on the sale of real estate in 4Q16. On the basis of adjusted net revenues, our gross margin was 12 basis points lower compared to 4Q16.u Refer to “Assets under management” for further information.
Net marginOur net margin was 41 basis points in 4Q17, one basis point higher compared to 3Q17, reflecting slightly lower total operating expenses and stable net revenues on 1.9% higher average assets under management. Compared to 4Q16, our net margin was five basis points higher, primarily due to lower total operating expenses on 8.5% higher average assets under management. On the basis of adjusted income before taxes, our net margin was two basis points lower compared to 3Q17 and ten basis points higher com-pared to 4Q16.
15Earnings Release 4Q17
Swiss Universal Bank
Assets under management – Private Clients in / end of % change in / end of % change
4Q17 3Q17 4Q16 QoQ YoY 2017 2016 YoY
Assets under management (CHF billion)
Assets under management 208.3 206.1 192.2 1.1 8.4 208.3 192.2 8.4
Average assets under management 208.0 204.2 191.7 1.9 8.5 202.2 190.0 6.4
Assets under management by currency (CHF billion)
USD 30.5 30.1 28.7 1.3 6.3 30.5 28.7 6.3
EUR 22.9 21.9 19.0 4.6 20.5 22.9 19.0 20.5
CHF 145.0 144.2 136.7 0.6 6.1 145.0 136.7 6.1
Other 9.9 9.9 7.8 0.0 26.9 9.9 7.8 26.9
Assets under management 208.3 206.1 192.2 1.1 8.4 208.3 192.2 8.4
Growth in assets under management (CHF billion)
Net new assets 0.0 1.0 (1.8) – – 4.7 0.1 –
Other effects 2.2 3.6 1.4 – – 11.4 2.3 –
of which market movements 2.5 2.2 0.4 – – 12.4 2.1 –
of which foreign exchange 0.8 1.7 1.2 – – 0.8 0.3 –
of which other (1.1) (0.3) (0.2) – – (1.8) (0.1) –
Growth in assets under management 2.2 4.6 (0.4) – – 16.1 2.4 –
Growth in assets under management (annualized) (%)
Net new assets 0.0 2.0 (3.7) – – 2.4 0.1 –
Other effects 4.3 7.1 2.9 – – 6.0 1.2 –
Growth in assets under management (annualized) 4.3 9.1 (0.8) – – 8.4 1.3 –
Growth in assets under management (rolling four-quarter average) (%)
Net new assets 2.4 1.5 0.1 – – – – –
Other effects 6.0 5.5 1.2 – – – – –
Growth in assets under management (rolling
four-quarter average) 8.4 7.0 1.3 – – – – –
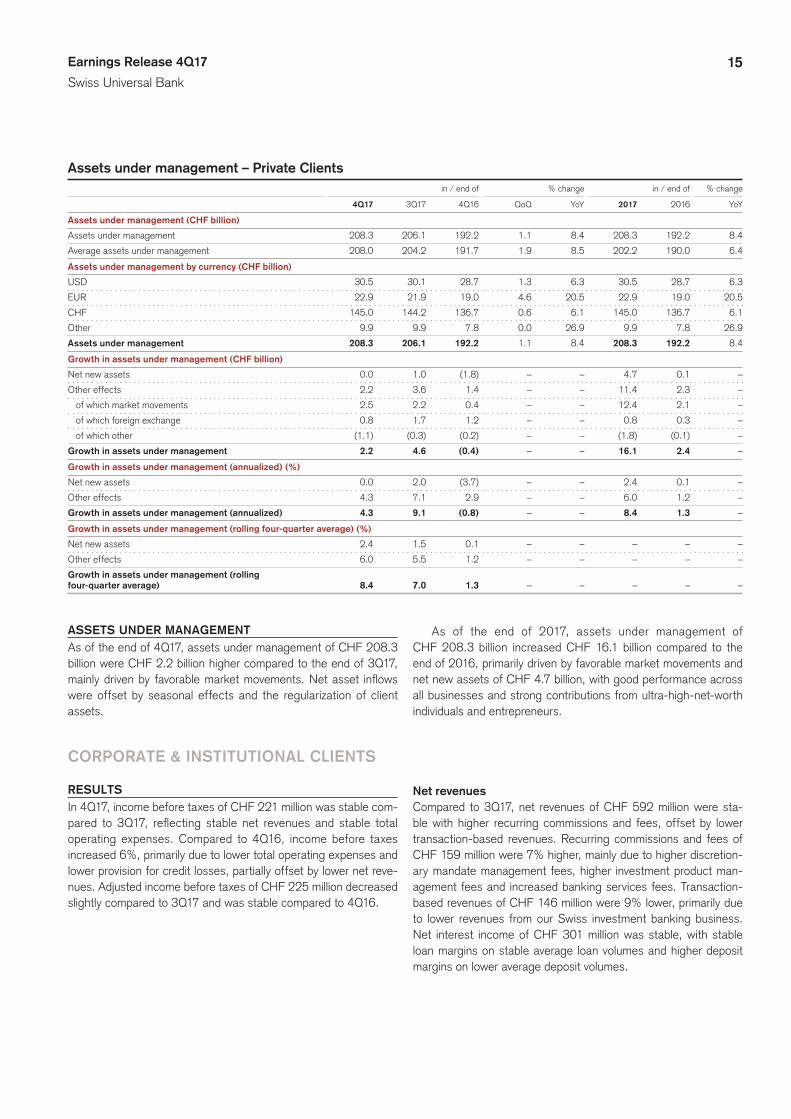
ASSETS UNDER MANAGEMENT As of the end of 4Q17, assets under management of CHF 208.3 billion were CHF 2.2 billion higher compared to the end of 3Q17, mainly driven by favorable market movements. Net asset inflows were offset by seasonal effects and the regularization of client assets.
As of the end of 2017, assets under management of CHF 208.3 billion increased CHF 16.1 billion compared to the end of 2016, primarily driven by favorable market movements and net new assets of CHF 4.7 billion, with good performance across all businesses and strong contributions from ultra-high-net-worth individuals and entrepreneurs.
CORPORATE & INSTITUTIONAL CLIENTS
RESULTSIn 4Q17, income before taxes of CHF 221 million was stable com-pared to 3Q17, reflecting stable net revenues and stable total operating expenses. Compared to 4Q16, income before taxes increased 6%, primarily due to lower total operating expenses and lower provision for credit losses, partially offset by lower net reve-nues. Adjusted income before taxes of CHF 225 million decreased slightly compared to 3Q17 and was stable compared to 4Q16.
Net revenuesCompared to 3Q17, net revenues of CHF 592 million were sta-ble with higher recurring commissions and fees, offset by lower transaction-based revenues. Recurring commissions and fees of CHF 159 million were 7% higher, mainly due to higher discretion-ary mandate management fees, higher investment product man-agement fees and increased banking services fees. Transaction-based revenues of CHF 146 million were 9% lower, primarily due to lower revenues from our Swiss investment banking business. Net interest income of CHF 301 million was stable, with stable loan margins on stable average loan volumes and higher deposit margins on lower average deposit volumes.
16Earnings Release 4Q17
Swiss Universal Bank
Results – Corporate & Institutional Clients in / end of % change in / end of % change
4Q17 3Q17 4Q16 QoQ YoY 2017 2016 YoY
Statements of operations (CHF million)
Net revenues 592 592 650 0 (9) 2,499 2,501 0
Provision for credit losses 5 5 24 0 (79) 33 40 (18)
Compensation and benefits 200 210 211 (5) (5) 833 821 1
General and administrative expenses 130 118 166 10 (22) 515 530 (3)
Commission expenses 37 35 40 6 (8) 148 171 (13)
Restructuring expenses (1) 4 0 – – 6 9 (33)
Total other operating expenses 166 157 206 6 (19) 669 710 (6)
Total operating expenses 366 367 417 0 (12) 1,502 1,531 (2)
Income before taxes 221 220 209 0 6 964 930 4
Statement of operations metrics (%)
Cost/income ratio 61.8 62.0 64.2 – – 60.1 61.2 –
Net revenue detail (CHF million)
Net interest income 301 303 324 (1) (7) 1,226 1,223 0
Recurring commissions and fees 159 149 162 7 (2) 634 626 1
Transaction-based revenues 146 161 177 (9) (18) 694 702 (1)
Other revenues (14) (21) (13) (33) 8 (55) (50) 10
Net revenues 592 592 650 0 (9) 2,499 2,501 0
Number of relationship managers
Number of relationship managers 540 550 540 (2) 0 540 540 0
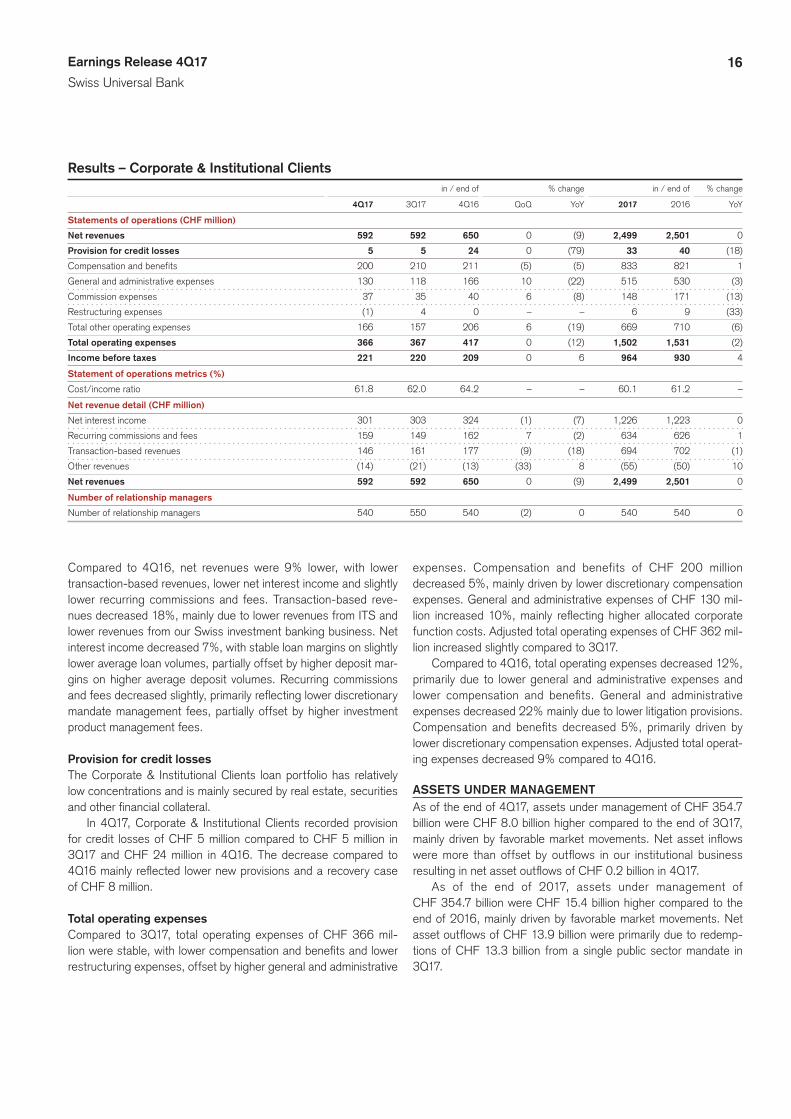
Compared to 4Q16, net revenues were 9% lower, with lower transaction-based revenues, lower net interest income and slightly lower recurring commissions and fees. Transaction-based reve-nues decreased 18%, mainly due to lower revenues from ITS and lower revenues from our Swiss investment banking business. Net interest income decreased 7%, with stable loan margins on slightly lower average loan volumes, partially offset by higher deposit mar-gins on higher average deposit volumes. Recurring commissions and fees decreased slightly, primarily reflecting lower discretionary mandate management fees, partially offset by higher investment product management fees.
Provision for credit lossesThe Corporate & Institutional Clients loan portfolio has relatively low concentrations and is mainly secured by real estate, securities and other financial collateral.
In 4Q17, Corporate & Institutional Clients recorded provision for credit losses of CHF 5 million compared to CHF 5 million in 3Q17 and CHF 24 million in 4Q16. The decrease compared to 4Q16 mainly reflected lower new provisions and a recovery case of CHF 8 million.
Total operating expensesCompared to 3Q17, total operating expenses of CHF 366 mil-lion were stable, with lower compensation and benefits and lower restructuring expenses, offset by higher general and administrative
expenses. Compensation and benefits of CHF 200 million decreased 5%, mainly driven by lower discretionary compensation expenses. General and administrative expenses of CHF 130 mil-lion increased 10%, mainly reflecting higher allocated corporate function costs. Adjusted total operating expenses of CHF 362 mil-lion increased slightly compared to 3Q17.
Compared to 4Q16, total operating expenses decreased 12%, primarily due to lower general and administrative expenses and lower compensation and benefits. General and administrative expenses decreased 22% mainly due to lower litigation provisions. Compensation and benefits decreased 5%, primarily driven by lower discretionary compensation expenses. Adjusted total operat-ing expenses decreased 9% compared to 4Q16.
ASSETS UNDER MANAGEMENTAs of the end of 4Q17, assets under management of CHF 354.7 billion were CHF 8.0 billion higher compared to the end of 3Q17, mainly driven by favorable market movements. Net asset inflows were more than offset by outflows in our institutional business resulting in net asset outflows of CHF 0.2 billion in 4Q17.
As of the end of 2017, assets under management of CHF 354.7 billion were CHF 15.4 billion higher compared to the end of 2016, mainly driven by favorable market movements. Net asset outflows of CHF 13.9 billion were primarily due to redemp-tions of CHF 13.3 billion from a single public sector mandate in 3Q17.
17Earnings Release 4Q17
International Wealth Management
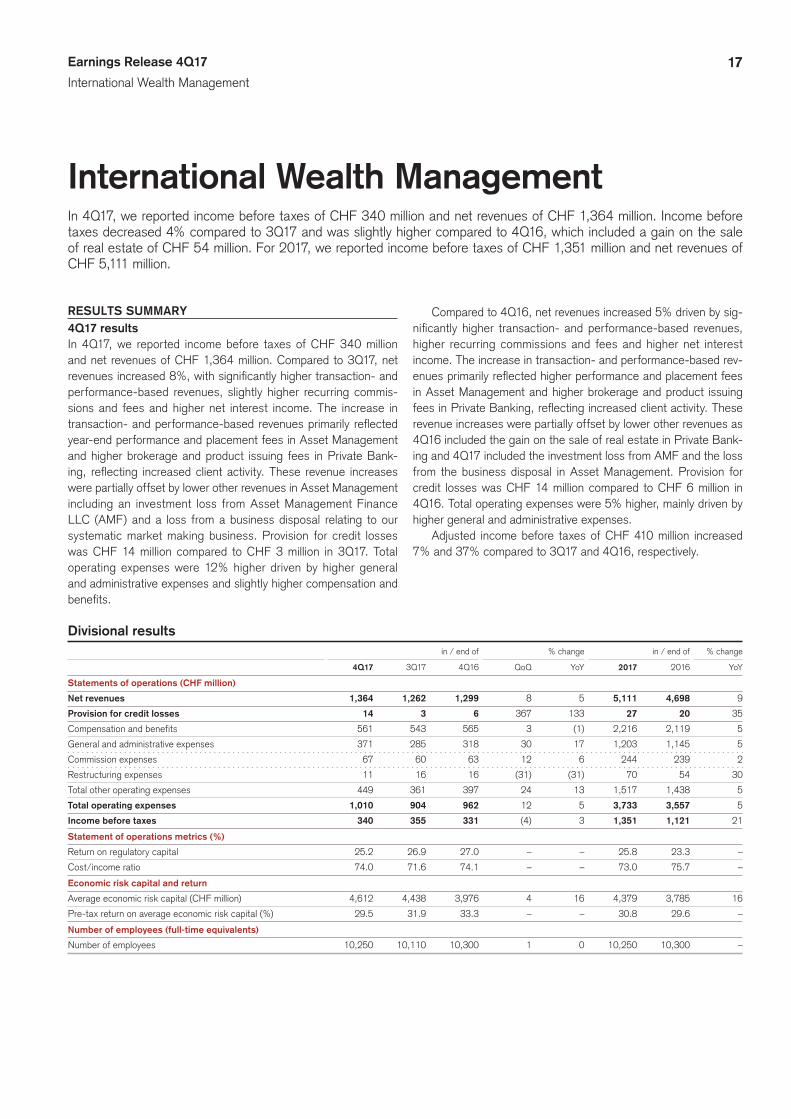
International Wealth ManagementIn 4Q17, we reported income before taxes of CHF 340 million and net revenues of CHF 1,364 million. Income before taxes decreased 4% compared to 3Q17 and was slightly higher compared to 4Q16, which included a gain on the sale of real estate of CHF 54 million. For 2017, we reported income before taxes of CHF 1,351 million and net revenues of CHF 5,111 million.
RESULTS SUMMARY4Q17 resultsIn 4Q17, we reported income before taxes of CHF 340 million and net revenues of CHF 1,364 million. Compared to 3Q17, net revenues increased 8%, with significantly higher transaction- and performance-based revenues, slightly higher recurring commis-sions and fees and higher net interest income. The increase in transaction- and performance-based revenues primarily reflected year-end performance and placement fees in Asset Management and higher brokerage and product issuing fees in Private Bank-ing, reflecting increased client activity. These revenue increases were partially offset by lower other revenues in Asset Management including an investment loss from Asset Management Finance LLC (AMF) and a loss from a business disposal relating to our systematic market making business. Provision for credit losses was CHF 14 million compared to CHF 3 million in 3Q17. Total operating expenses were 12% higher driven by higher general and administrative expenses and slightly higher compensation and benefits.
Compared to 4Q16, net revenues increased 5% driven by sig-nificantly higher transaction- and performance-based revenues, higher recurring commissions and fees and higher net interest income. The increase in transaction- and performance-based rev-enues primarily reflected higher performance and placement fees in Asset Management and higher brokerage and product issuing fees in Private Banking, reflecting increased client activity. These revenue increases were partially offset by lower other revenues as 4Q16 included the gain on the sale of real estate in Private Bank-ing and 4Q17 included the investment loss from AMF and the loss from the business disposal in Asset Management. Provision for credit losses was CHF 14 million compared to CHF 6 million in 4Q16. Total operating expenses were 5% higher, mainly driven by higher general and administrative expenses.
Adjusted income before taxes of CHF 410 million increased 7% and 37% compared to 3Q17 and 4Q16, respectively.
Divisional results in / end of % change in / end of % change
4Q17 3Q17 4Q16 QoQ YoY 2017 2016 YoY
Statements of operations (CHF million)
Net revenues 1,364 1,262 1,299 8 5 5,111 4,698 9
Provision for credit losses 14 3 6 367 133 27 20 35
Compensation and benefits 561 543 565 3 (1) 2,216 2,119 5
General and administrative expenses 371 285 318 30 17 1,203 1,145 5
Commission expenses 67 60 63 12 6 244 239 2
Restructuring expenses 11 16 16 (31) (31) 70 54 30
Total other operating expenses 449 361 397 24 13 1,517 1,438 5
Total operating expenses 1,010 904 962 12 5 3,733 3,557 5
Income before taxes 340 355 331 (4) 3 1,351 1,121 21
Statement of operations metrics (%)
Return on regulatory capital 25.2 26.9 27.0 – – 25.8 23.3 –
Cost/income ratio 74.0 71.6 74.1 – – 73.0 75.7 –
Economic risk capital and return
Average economic risk capital (CHF million) 4,612 4,438 3,976 4 16 4,379 3,785 16
Pre-tax return on average economic risk capital (%) 29.5 31.9 33.3 – – 30.8 29.6 –
Number of employees (full-time equivalents)
Number of employees 10,250 10,110 10,300 1 0 10,250 10,300 –
18Earnings Release 4Q17
International Wealth Management
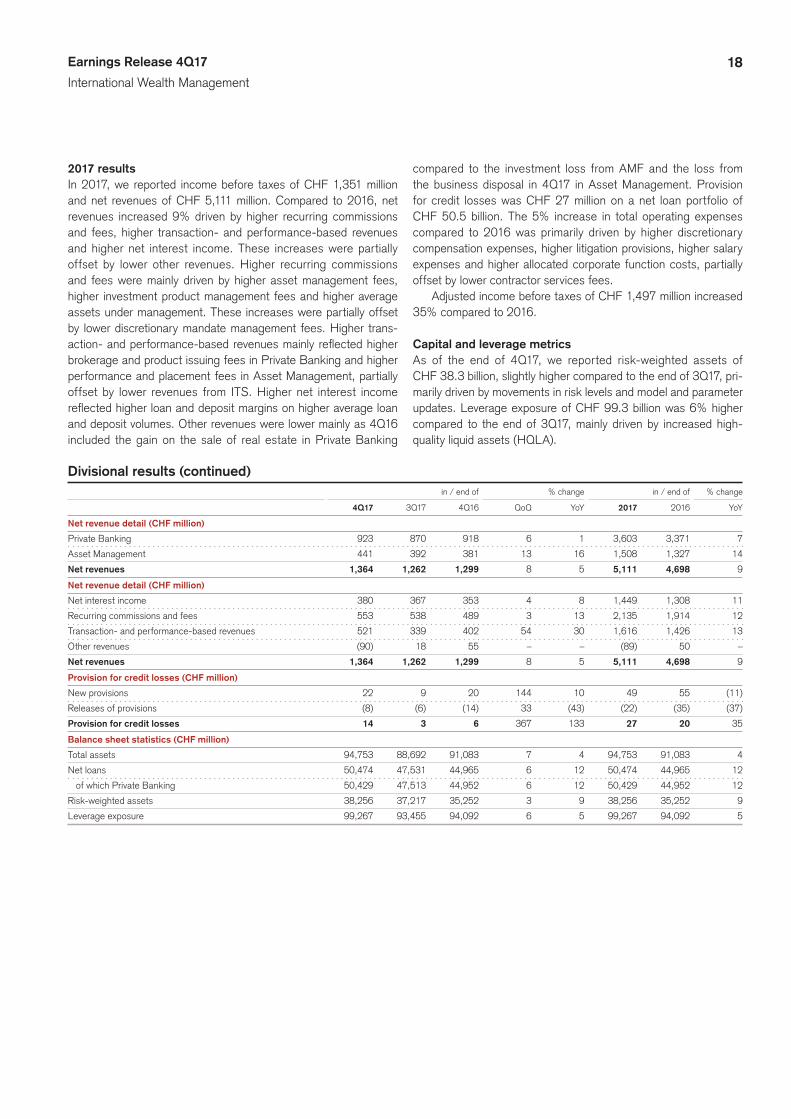
2017 resultsIn 2017, we reported income before taxes of CHF 1,351 million and net revenues of CHF 5,111 million. Compared to 2016, net revenues increased 9% driven by higher recurring commissions and fees, higher transaction- and performance-based revenues and higher net interest income. These increases were partially offset by lower other revenues. Higher recurring commissions and fees were mainly driven by higher asset management fees, higher investment product management fees and higher average assets under management. These increases were partially offset by lower discretionary mandate management fees. Higher trans-action- and performance-based revenues mainly reflected higher brokerage and product issuing fees in Private Banking and higher performance and placement fees in Asset Management, partially offset by lower revenues from ITS. Higher net interest income reflected higher loan and deposit margins on higher average loan and deposit volumes. Other revenues were lower mainly as 4Q16 included the gain on the sale of real estate in Private Banking
compared to the investment loss from AMF and the loss from the business disposal in 4Q17 in Asset Management. Provision for credit losses was CHF 27 million on a net loan portfolio of CHF 50.5 billion. The 5% increase in total operating expenses compared to 2016 was primarily driven by higher discretionary compensation expenses, higher litigation provisions, higher salary expenses and higher allocated corporate function costs, partially offset by lower contractor services fees.
Adjusted income before taxes of CHF 1,497 million increased 35% compared to 2016.
Capital and leverage metricsAs of the end of 4Q17, we reported risk-weighted assets of CHF 38.3 billion, slightly higher compared to the end of 3Q17, pri-marily driven by movements in risk levels and model and parameter updates. Leverage exposure of CHF 99.3 billion was 6% higher compared to the end of 3Q17, mainly driven by increased high-quality liquid assets (HQLA).
Divisional results (continued) in / end of % change in / end of % change
4Q17 3Q17 4Q16 QoQ YoY 2017 2016 YoY
Net revenue detail (CHF million)
Private Banking 923 870 918 6 1 3,603 3,371 7
Asset Management 441 392 381 13 16 1,508 1,327 14
Net revenues 1,364 1,262 1,299 8 5 5,111 4,698 9
Net revenue detail (CHF million)
Net interest income 380 367 353 4 8 1,449 1,308 11
Recurring commissions and fees 553 538 489 3 13 2,135 1,914 12
Transaction- and performance-based revenues 521 339 402 54 30 1,616 1,426 13
Other revenues (90) 18 55 – – (89) 50 –
Net revenues 1,364 1,262 1,299 8 5 5,111 4,698 9
Provision for credit losses (CHF million)
New provisions 22 9 20 144 10 49 55 (11)
Releases of provisions (8) (6) (14) 33 (43) (22) (35) (37)
Provision for credit losses 14 3 6 367 133 27 20 35
Balance sheet statistics (CHF million)
Total assets 94,753 88,692 91,083 7 4 94,753 91,083 4
Net loans 50,474 47,531 44,965 6 12 50,474 44,965 12
of which Private Banking 50,429 47,513 44,952 6 12 50,429 44,952 12
Risk-weighted assets 38,256 37,217 35,252 3 9 38,256 35,252 9
Leverage exposure 99,267 93,455 94,092 6 5 99,267 94,092 5
19Earnings Release 4Q17
International Wealth Management
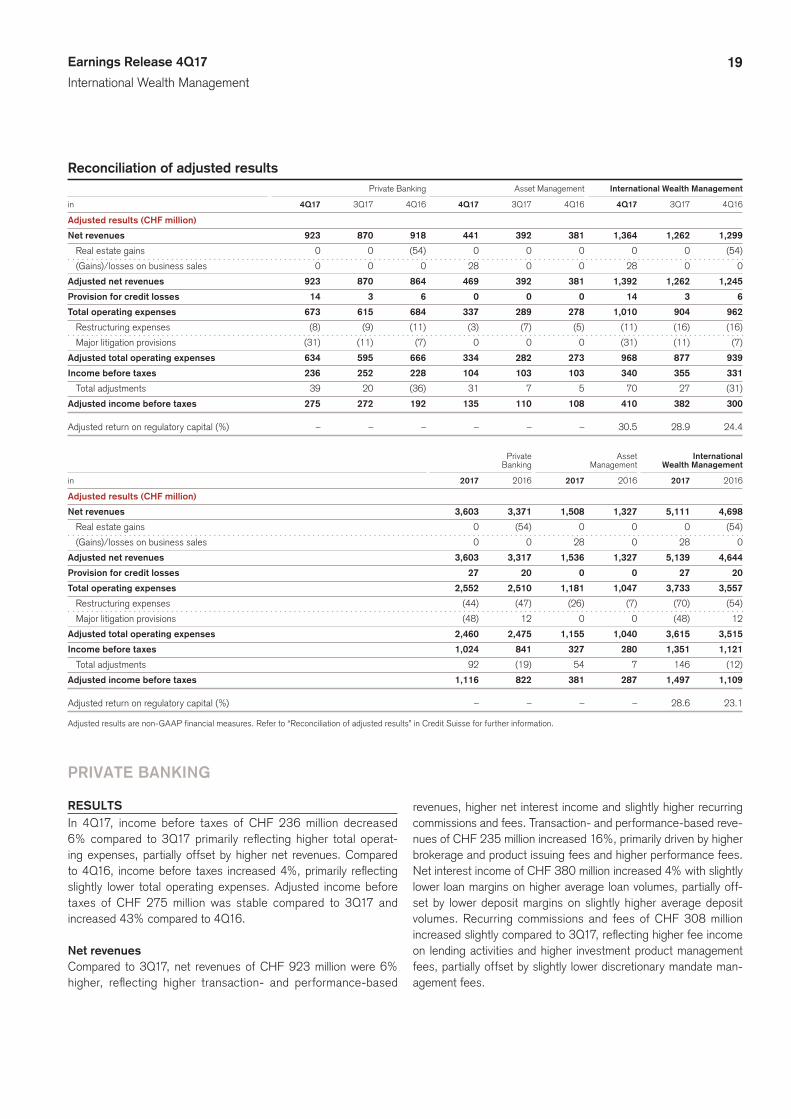
Reconciliation of adjusted results Private Banking Asset Management International Wealth Management
in 4Q17 3Q17 4Q16 4Q17 3Q17 4Q16 4Q17 3Q17 4Q16
Adjusted results (CHF million)
Net revenues 923 870 918 441 392 381 1,364 1,262 1,299
Real estate gains 0 0 (54) 0 0 0 0 0 (54)
(Gains)/losses on business sales 0 0 0 28 0 0 28 0 0
Adjusted net revenues 923 870 864 469 392 381 1,392 1,262 1,245
Provision for credit losses 14 3 6 0 0 0 14 3 6
Total operating expenses 673 615 684 337 289 278 1,010 904 962
Restructuring expenses (8) (9) (11) (3) (7) (5) (11) (16) (16)
Major litigation provisions (31) (11) (7) 0 0 0 (31) (11) (7)
Adjusted total operating expenses 634 595 666 334 282 273 968 877 939
Income before taxes 236 252 228 104 103 103 340 355 331
Total adjustments 39 20 (36) 31 7 5 70 27 (31)
Adjusted income before taxes 275 272 192 135 110 108 410 382 300
Adjusted return on regulatory capital (%) – – – – – – 30.5 28.9 24.4
Private Asset International Banking Management Wealth Management
in 2017 2016 2017 2016 2017 2016
Adjusted results (CHF million)
Net revenues 3,603 3,371 1,508 1,327 5,111 4,698
Real estate gains 0 (54) 0 0 0 (54)
(Gains)/losses on business sales 0 0 28 0 28 0
Adjusted net revenues 3,603 3,317 1,536 1,327 5,139 4,644
Provision for credit losses 27 20 0 0 27 20
Total operating expenses 2,552 2,510 1,181 1,047 3,733 3,557
Restructuring expenses (44) (47) (26) (7) (70) (54)
Major litigation provisions (48) 12 0 0 (48) 12
Adjusted total operating expenses 2,460 2,475 1,155 1,040 3,615 3,515
Income before taxes 1,024 841 327 280 1,351 1,121
Total adjustments 92 (19) 54 7 146 (12)
Adjusted income before taxes 1,116 822 381 287 1,497 1,109
Adjusted return on regulatory capital (%) – – – – 28.6 23.1
Adjusted results are non-GAAP financial measures. Refer to “Reconciliation of adjusted results” in Credit Suisse for further information.
PRIVATE BANKING
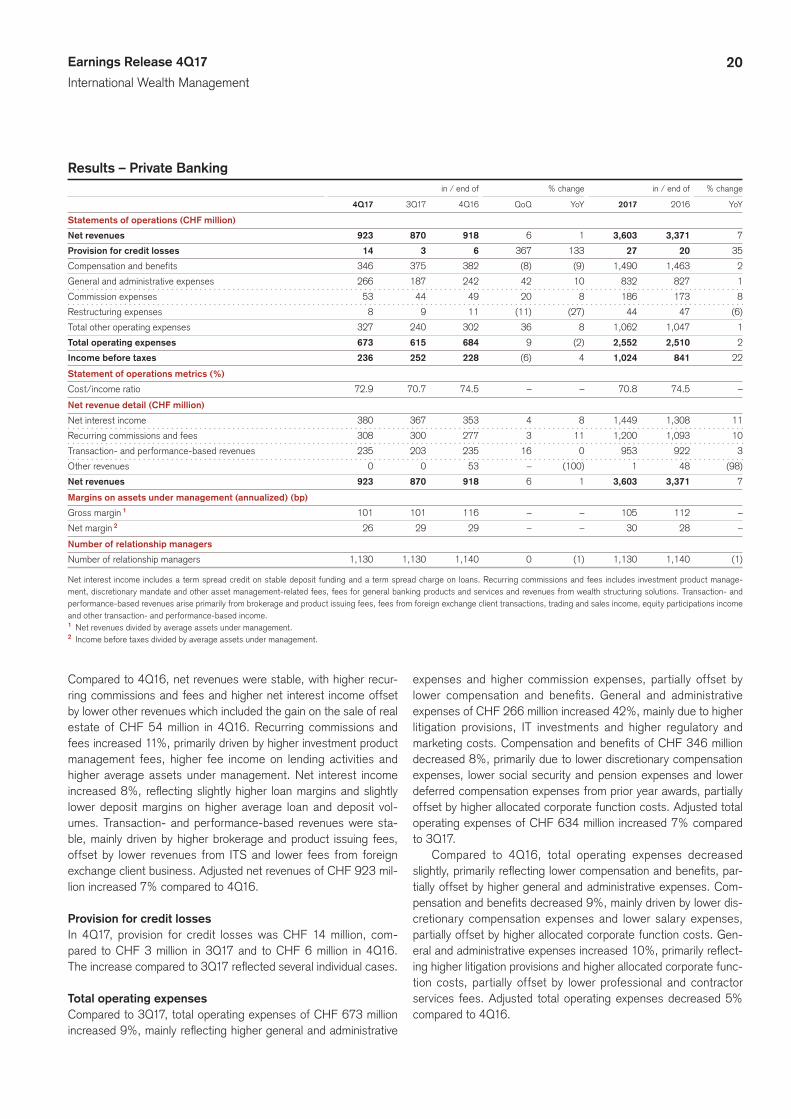
RESULTSIn 4Q17, income before taxes of CHF 236 million decreased 6% compared to 3Q17 primarily reflecting higher total operat-ing expenses, partially offset by higher net revenues. Compared to 4Q16, income before taxes increased 4%, primarily reflecting slightly lower total operating expenses. Adjusted income before taxes of CHF 275 million was stable compared to 3Q17 and increased 43% compared to 4Q16.
Net revenuesCompared to 3Q17, net revenues of CHF 923 million were 6% higher, reflecting higher transaction- and performance-based
revenues, higher net interest income and slightly higher recurring commissions and fees. Transaction- and performance-based reve-nues of CHF 235 million increased 16%, primarily driven by higher brokerage and product issuing fees and higher performance fees. Net interest income of CHF 380 million increased 4% with slightly lower loan margins on higher average loan volumes, partially off-set by lower deposit margins on slightly higher average deposit volumes. Recurring commissions and fees of CHF 308 million increased slightly compared to 3Q17, reflecting higher fee income on lending activities and higher investment product management fees, partially offset by slightly lower discretionary mandate man-agement fees.
20Earnings Release 4Q17
International Wealth Management
Results – Private Banking in / end of % change in / end of % change
4Q17 3Q17 4Q16 QoQ YoY 2017 2016 YoY
Statements of operations (CHF million)
Net revenues 923 870 918 6 1 3,603 3,371 7
Provision for credit losses 14 3 6 367 133 27 20 35
Compensation and benefits 346 375 382 (8) (9) 1,490 1,463 2
General and administrative expenses 266 187 242 42 10 832 827 1
Commission expenses 53 44 49 20 8 186 173 8
Restructuring expenses 8 9 11 (11) (27) 44 47 (6)
Total other operating expenses 327 240 302 36 8 1,062 1,047 1
Total operating expenses 673 615 684 9 (2) 2,552 2,510 2
Income before taxes 236 252 228 (6) 4 1,024 841 22
Statement of operations metrics (%)
Cost/income ratio 72.9 70.7 74.5 – – 70.8 74.5 –
Net revenue detail (CHF million)
Net interest income 380 367 353 4 8 1,449 1,308 11
Recurring commissions and fees 308 300 277 3 11 1,200 1,093 10
Transaction- and performance-based revenues 235 203 235 16 0 953 922 3
Other revenues 0 0 53 – (100) 1 48 (98)
Net revenues 923 870 918 6 1 3,603 3,371 7
Margins on assets under management (annualized) (bp)
Gross margin 1 101 101 116 – – 105 112 –
Net margin 2 26 29 29 – – 30 28 –
Number of relationship managers
Number of relationship managers 1,130 1,130 1,140 0 (1) 1,130 1,140 (1)
Net interest income includes a term spread credit on stable deposit funding and a term spread charge on loans. Recurring commissions and fees includes investment product manage-ment, discretionary mandate and other asset management-related fees, fees for general banking products and services and revenues from wealth structuring solutions. Transaction- and performance-based revenues arise primarily from brokerage and product issuing fees, fees from foreign exchange client transactions, trading and sales income, equity participations income and other transaction- and performance-based income.1 Net revenues divided by average assets under management.2 Income before taxes divided by average assets under management.
Compared to 4Q16, net revenues were stable, with higher recur-ring commissions and fees and higher net interest income offset by lower other revenues which included the gain on the sale of real estate of CHF 54 million in 4Q16. Recurring commissions and fees increased 11%, primarily driven by higher investment product management fees, higher fee income on lending activities and higher average assets under management. Net interest income increased 8%, reflecting slightly higher loan margins and slightly lower deposit margins on higher average loan and deposit vol-umes. Transaction- and performance-based revenues were sta-ble, mainly driven by higher brokerage and product issuing fees, offset by lower revenues from ITS and lower fees from foreign exchange client business. Adjusted net revenues of CHF 923 mil-lion increased 7% compared to 4Q16.
Provision for credit lossesIn 4Q17, provision for credit losses was CHF 14 million, com-pared to CHF 3 million in 3Q17 and to CHF 6 million in 4Q16. The increase compared to 3Q17 reflected several individual cases.
Total operating expensesCompared to 3Q17, total operating expenses of CHF 673 million increased 9%, mainly reflecting higher general and administrative
expenses and higher commission expenses, partially offset by lower compensation and benefits. General and administrative expenses of CHF 266 million increased 42%, mainly due to higher litigation provisions, IT investments and higher regulatory and marketing costs. Compensation and benefits of CHF 346 million decreased 8%, primarily due to lower discretionary compensation expenses, lower social security and pension expenses and lower deferred compensation expenses from prior year awards, partially offset by higher allocated corporate function costs. Adjusted total operating expenses of CHF 634 million increased 7% compared to 3Q17.
Compared to 4Q16, total operating expenses decreased slightly, primarily reflecting lower compensation and benefits, par-tially offset by higher general and administrative expenses. Com-pensation and benefits decreased 9%, mainly driven by lower dis-cretionary compensation expenses and lower salary expenses, partially offset by higher allocated corporate function costs. Gen-eral and administrative expenses increased 10%, primarily reflect-ing higher litigation provisions and higher allocated corporate func-tion costs, partially offset by lower professional and contractor services fees. Adjusted total operating expenses decreased 5% compared to 4Q16.
21Earnings Release 4Q17
International Wealth Management
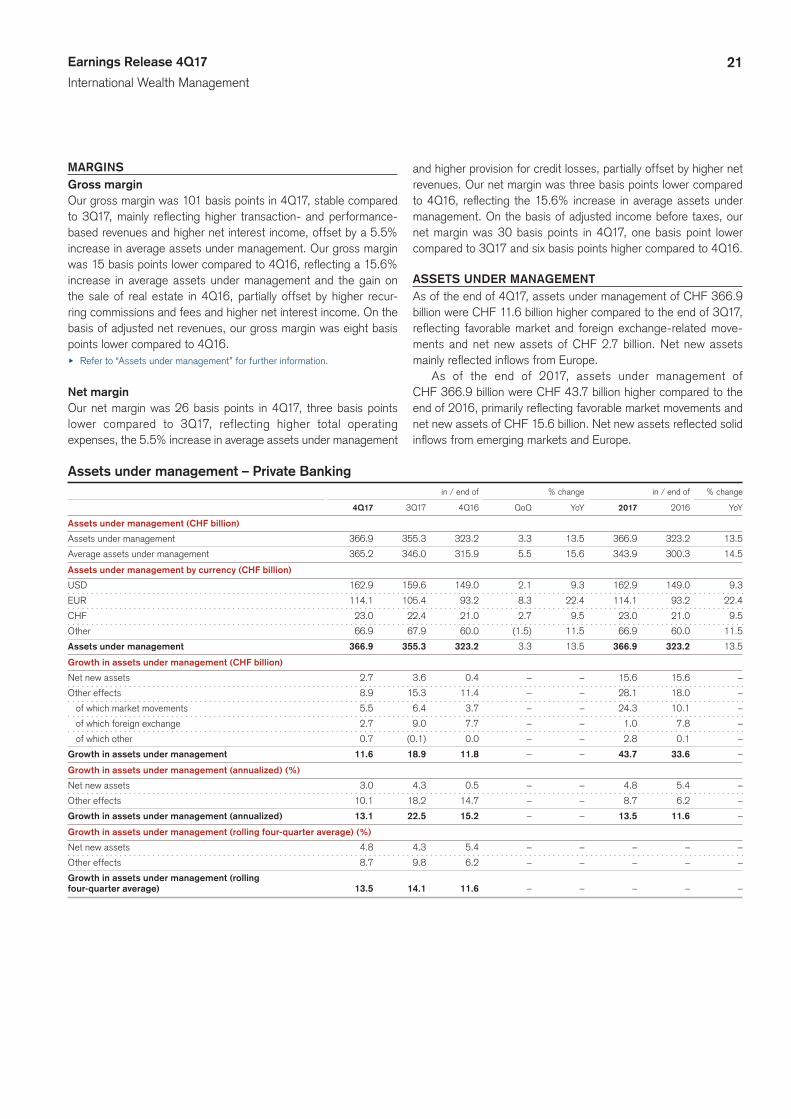
MARGINSGross marginOur gross margin was 101 basis points in 4Q17, stable compared to 3Q17, mainly reflecting higher transaction- and performance-based revenues and higher net interest income, offset by a 5.5% increase in average assets under management. Our gross margin was 15 basis points lower compared to 4Q16, reflecting a 15.6% increase in average assets under management and the gain on the sale of real estate in 4Q16, partially offset by higher recur-ring commissions and fees and higher net interest income. On the basis of adjusted net revenues, our gross margin was eight basis points lower compared to 4Q16.u Refer to “Assets under management” for further information.
Net marginOur net margin was 26 basis points in 4Q17, three basis points lower compared to 3Q17, reflecting higher total operating expenses, the 5.5% increase in average assets under management
and higher provision for credit losses, partially offset by higher net revenues. Our net margin was three basis points lower compared to 4Q16, reflecting the 15.6% increase in average assets under management. On the basis of adjusted income before taxes, our net margin was 30 basis points in 4Q17, one basis point lower compared to 3Q17 and six basis points higher compared to 4Q16.
ASSETS UNDER MANAGEMENTAs of the end of 4Q17, assets under management of CHF 366.9 billion were CHF 11.6 billion higher compared to the end of 3Q17, reflecting favorable market and foreign exchange-related move-ments and net new assets of CHF 2.7 billion. Net new assets mainly reflected inflows from Europe.
As of the end of 2017, assets under management of CHF 366.9 billion were CHF 43.7 billion higher compared to the end of 2016, primarily reflecting favorable market movements and net new assets of CHF 15.6 billion. Net new assets reflected solid inflows from emerging markets and Europe.
Assets under management – Private Banking in / end of % change in / end of % change
4Q17 3Q17 4Q16 QoQ YoY 2017 2016 YoY
Assets under management (CHF billion)
Assets under management 366.9 355.3 323.2 3.3 13.5 366.9 323.2 13.5
Average assets under management 365.2 346.0 315.9 5.5 15.6 343.9 300.3 14.5
Assets under management by currency (CHF billion)
USD 162.9 159.6 149.0 2.1 9.3 162.9 149.0 9.3
EUR 114.1 105.4 93.2 8.3 22.4 114.1 93.2 22.4
CHF 23.0 22.4 21.0 2.7 9.5 23.0 21.0 9.5
Other 66.9 67.9 60.0 (1.5) 11.5 66.9 60.0 11.5
Assets under management 366.9 355.3 323.2 3.3 13.5 366.9 323.2 13.5
Growth in assets under management (CHF billion)
Net new assets 2.7 3.6 0.4 – – 15.6 15.6 –
Other effects 8.9 15.3 11.4 – – 28.1 18.0 –
of which market movements 5.5 6.4 3.7 – – 24.3 10.1 –
of which foreign exchange 2.7 9.0 7.7 – – 1.0 7.8 –
of which other 0.7 (0.1) 0.0 – – 2.8 0.1 –
Growth in assets under management 11.6 18.9 11.8 – – 43.7 33.6 –
Growth in assets under management (annualized) (%)
Net new assets 3.0 4.3 0.5 – – 4.8 5.4 –
Other effects 10.1 18.2 14.7 – – 8.7 6.2 –
Growth in assets under management (annualized) 13.1 22.5 15.2 – – 13.5 11.6 –
Growth in assets under management (rolling four-quarter average) (%)
Net new assets 4.8 4.3 5.4 – – – – –
Other effects 8.7 9.8 6.2 – – – – –
Growth in assets under management (rolling
four-quarter average) 13.5 14.1 11.6 – – – – –
22Earnings Release 4Q17
International Wealth Management
ASSET MANAGEMENT
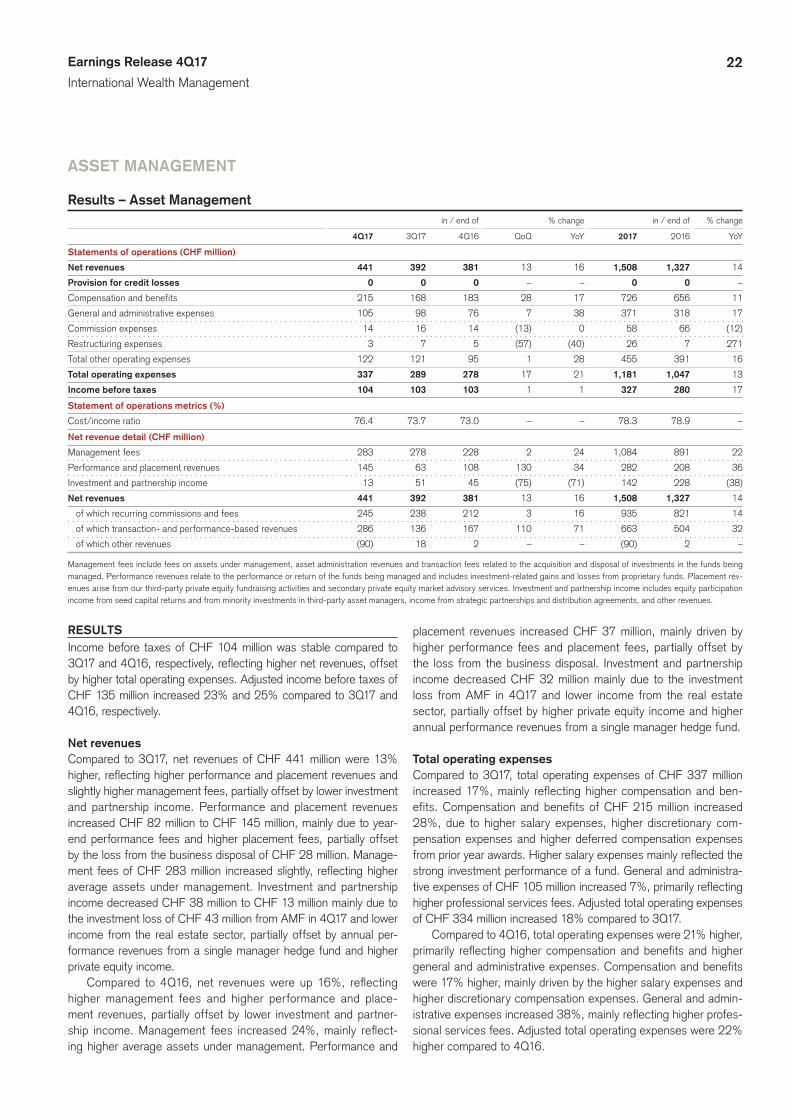
Results – Asset Management in / end of % change in / end of % change
4Q17 3Q17 4Q16 QoQ YoY 2017 2016 YoY
Statements of operations (CHF million)
Net revenues 441 392 381 13 16 1,508 1,327 14
Provision for credit losses 0 0 0 – – 0 0 –
Compensation and benefits 215 168 183 28 17 726 656 11
General and administrative expenses 105 98 76 7 38 371 318 17
Commission expenses 14 16 14 (13) 0 58 66 (12)
Restructuring expenses 3 7 5 (57) (40) 26 7 271
Total other operating expenses 122 121 95 1 28 455 391 16
Total operating expenses 337 289 278 17 21 1,181 1,047 13
Income before taxes 104 103 103 1 1 327 280 17
Statement of operations metrics (%)
Cost/income ratio 76.4 73.7 73.0 – – 78.3 78.9 –
Net revenue detail (CHF million)
Management fees 283 278 228 2 24 1,084 891 22
Performance and placement revenues 145 63 108 130 34 282 208 36
Investment and partnership income 13 51 45 (75) (71) 142 228 (38)
Net revenues 441 392 381 13 16 1,508 1,327 14
of which recurring commissions and fees 245 238 212 3 16 935 821 14
of which transaction- and performance-based revenues 286 136 167 110 71 663 504 32
of which other revenues (90) 18 2 – – (90) 2 –
Management fees include fees on assets under management, asset administration revenues and transaction fees related to the acquisition and disposal of investments in the funds being managed. Performance revenues relate to the performance or return of the funds being managed and includes investment-related gains and losses from proprietary funds. Placement rev-enues arise from our third-party private equity fundraising activities and secondary private equity market advisory services. Investment and partnership income includes equity participation income from seed capital returns and from minority investments in third-party asset managers, income from strategic partnerships and distribution agreements, and other revenues.
RESULTSIncome before taxes of CHF 104 million was stable compared to 3Q17 and 4Q16, respectively, reflecting higher net revenues, offset by higher total operating expenses. Adjusted income before taxes of CHF 135 million increased 23% and 25% compared to 3Q17 and 4Q16, respectively.
Net revenuesCompared to 3Q17, net revenues of CHF 441 million were 13% higher, reflecting higher performance and placement revenues and slightly higher management fees, partially offset by lower investment and partnership income. Performance and placement revenues increased CHF 82 million to CHF 145 million, mainly due to year-end performance fees and higher placement fees, partially offset by the loss from the business disposal of CHF 28 million. Manage-ment fees of CHF 283 million increased slightly, reflecting higher average assets under management. Investment and partnership income decreased CHF 38 million to CHF 13 million mainly due to the investment loss of CHF 43 million from AMF in 4Q17 and lower income from the real estate sector, partially offset by annual per-formance revenues from a single manager hedge fund and higher private equity income.
Compared to 4Q16, net revenues were up 16%, reflecting higher management fees and higher performance and place-ment revenues, partially offset by lower investment and partner-ship income. Management fees increased 24%, mainly reflect-ing higher average assets under management. Performance and
placement revenues increased CHF 37 million, mainly driven by higher performance fees and placement fees, partially offset by the loss from the business disposal. Investment and partnership income decreased CHF 32 million mainly due to the investment loss from AMF in 4Q17 and lower income from the real estate sector, partially offset by higher private equity income and higher annual performance revenues from a single manager hedge fund.
Total operating expensesCompared to 3Q17, total operating expenses of CHF 337 million increased 17%, mainly reflecting higher compensation and ben-efits. Compensation and benefits of CHF 215 million increased 28%, due to higher salary expenses, higher discretionary com-pensation expenses and higher deferred compensation expenses from prior year awards. Higher salary expenses mainly reflected the strong investment performance of a fund. General and administra-tive expenses of CHF 105 million increased 7%, primarily reflecting higher professional services fees. Adjusted total operating expenses of CHF 334 million increased 18% compared to 3Q17.
Compared to 4Q16, total operating expenses were 21% higher, primarily reflecting higher compensation and benefits and higher general and administrative expenses. Compensation and benefits were 17% higher, mainly driven by the higher salary expenses and higher discretionary compensation expenses. General and admin-istrative expenses increased 38%, mainly reflecting higher profes-sional services fees. Adjusted total operating expenses were 22% higher compared to 4Q16.
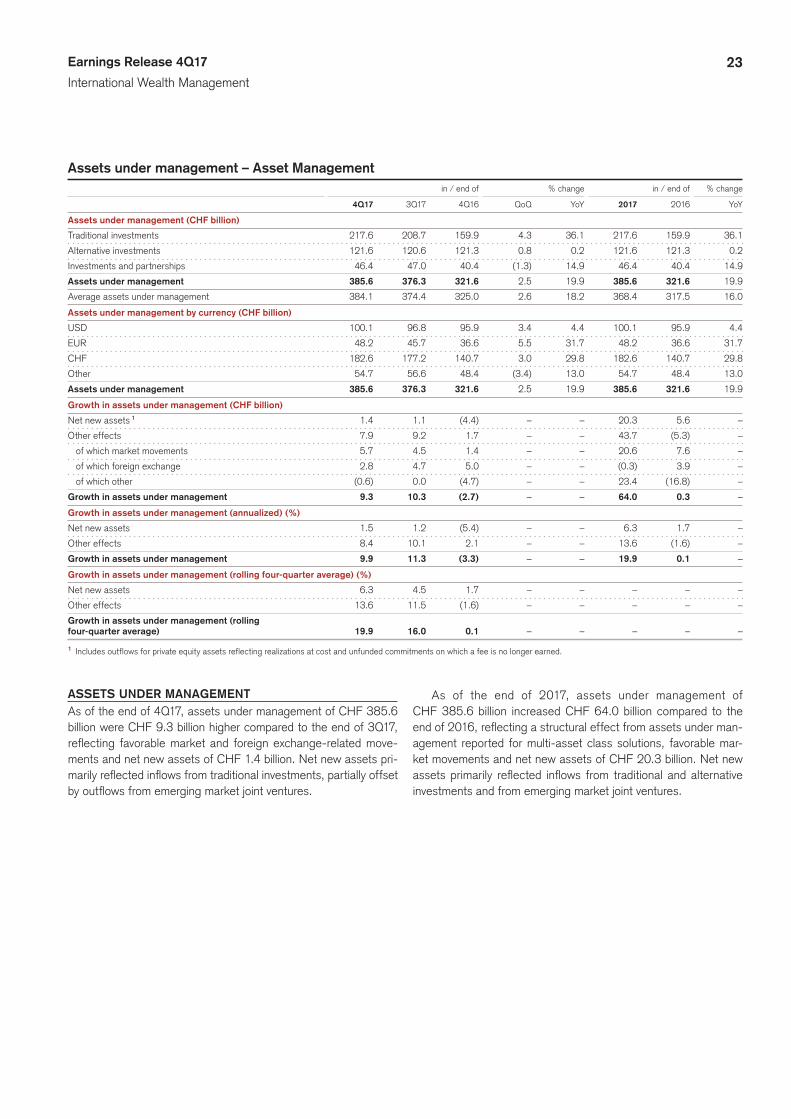
23Earnings Release 4Q17
International Wealth Management
Assets under management – Asset Management in / end of % change in / end of % change
4Q17 3Q17 4Q16 QoQ YoY 2017 2016 YoY
Assets under management (CHF billion)
Traditional investments 217.6 208.7 159.9 4.3 36.1 217.6 159.9 36.1
Alternative investments 121.6 120.6 121.3 0.8 0.2 121.6 121.3 0.2
Investments and partnerships 46.4 47.0 40.4 (1.3) 14.9 46.4 40.4 14.9
Assets under management 385.6 376.3 321.6 2.5 19.9 385.6 321.6 19.9
Average assets under management 384.1 374.4 325.0 2.6 18.2 368.4 317.5 16.0
Assets under management by currency (CHF billion)
USD 100.1 96.8 95.9 3.4 4.4 100.1 95.9 4.4
EUR 48.2 45.7 36.6 5.5 31.7 48.2 36.6 31.7
CHF 182.6 177.2 140.7 3.0 29.8 182.6 140.7 29.8
Other 54.7 56.6 48.4 (3.4) 13.0 54.7 48.4 13.0
Assets under management 385.6 376.3 321.6 2.5 19.9 385.6 321.6 19.9
Growth in assets under management (CHF billion)
Net new assets 1 1.4 1.1 (4.4) – – 20.3 5.6 –
Other effects 7.9 9.2 1.7 – – 43.7 (5.3) –
of which market movements 5.7 4.5 1.4 – – 20.6 7.6 –
of which foreign exchange 2.8 4.7 5.0 – – (0.3) 3.9 –
of which other (0.6) 0.0 (4.7) – – 23.4 (16.8) –
Growth in assets under management 9.3 10.3 (2.7) – – 64.0 0.3 –
Growth in assets under management (annualized) (%)
Net new assets 1.5 1.2 (5.4) – – 6.3 1.7 –
Other effects 8.4 10.1 2.1 – – 13.6 (1.6) –
Growth in assets under management 9.9 11.3 (3.3) – – 19.9 0.1 –
Growth in assets under management (rolling four-quarter average) (%)
Net new assets 6.3 4.5 1.7 – – – – –
Other effects 13.6 11.5 (1.6) – – – – –
Growth in assets under management (rolling
four-quarter average) 19.9 16.0 0.1 – – – – –
1 Includes outflows for private equity assets reflecting realizations at cost and unfunded commitments on which a fee is no longer earned.
ASSETS UNDER MANAGEMENTAs of the end of 4Q17, assets under management of CHF 385.6 billion were CHF 9.3 billion higher compared to the end of 3Q17, reflecting favorable market and foreign exchange-related move-ments and net new assets of CHF 1.4 billion. Net new assets pri-marily reflected inflows from traditional investments, partially offset by outflows from emerging market joint ventures.
As of the end of 2017, assets under management of CHF 385.6 billion increased CHF 64.0 billion compared to the end of 2016, reflecting a structural effect from assets under man-agement reported for multi-asset class solutions, favorable mar-ket movements and net new assets of CHF 20.3 billion. Net new assets primarily reflected inflows from traditional and alternative investments and from emerging market joint ventures.
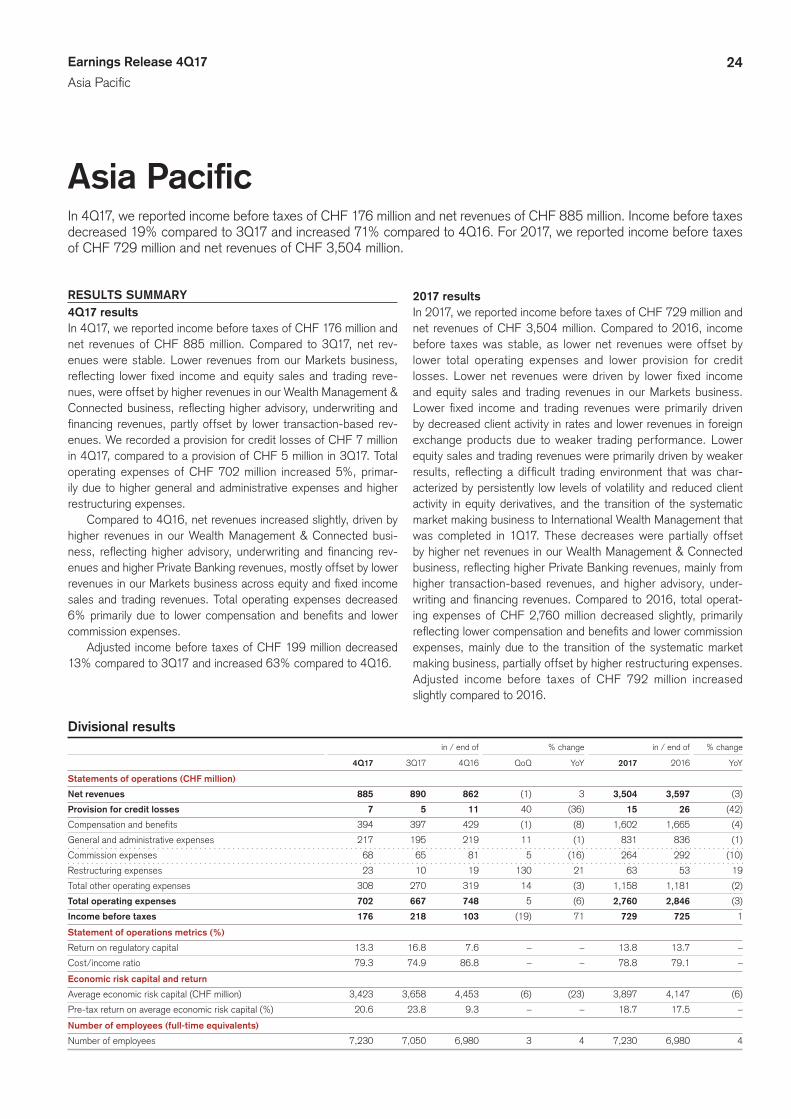
24Earnings Release 4Q17
Asia Pacific
AsiaPacificIn 4Q17, we reported income before taxes of CHF 176 million and net revenues of CHF 885 million. Income before taxes decreased 19% compared to 3Q17 and increased 71% compared to 4Q16. For 2017, we reported income before taxes of CHF 729 million and net revenues of CHF 3,504 million.
RESULTS SUMMARY4Q17 resultsIn 4Q17, we reported income before taxes of CHF 176 million and net revenues of CHF 885 million. Compared to 3Q17, net rev-enues were stable. Lower revenues from our Markets business, reflecting lower fixed income and equity sales and trading reve-nues, were offset by higher revenues in our Wealth Management & Connected business, reflecting higher advisory, underwriting and financing revenues, partly offset by lower transaction-based rev-enues. We recorded a provision for credit losses of CHF 7 million in 4Q17, compared to a provision of CHF 5 million in 3Q17. Total operating expenses of CHF 702 million increased 5%, primar-ily due to higher general and administrative expenses and higher restructuring expenses.
Compared to 4Q16, net revenues increased slightly, driven by higher revenues in our Wealth Management & Connected busi-ness, reflecting higher advisory, underwriting and financing rev-enues and higher Private Banking revenues, mostly offset by lower revenues in our Markets business across equity and fixed income sales and trading revenues. Total operating expenses decreased 6% primarily due to lower compensation and benefits and lower commission expenses.
Adjusted income before taxes of CHF 199 million decreased 13% compared to 3Q17 and increased 63% compared to 4Q16.
2017 resultsIn 2017, we reported income before taxes of CHF 729 million and net revenues of CHF 3,504 million. Compared to 2016, income before taxes was stable, as lower net revenues were offset by lower total operating expenses and lower provision for credit losses. Lower net revenues were driven by lower fixed income and equity sales and trading revenues in our Markets business. Lower fixed income and trading revenues were primarily driven by decreased client activity in rates and lower revenues in foreign exchange products due to weaker trading performance. Lower equity sales and trading revenues were primarily driven by weaker results, reflecting a difficult trading environment that was char-acterized by persistently low levels of volatility and reduced client activity in equity derivatives, and the transition of the systematic market making business to International Wealth Management that was completed in 1Q17. These decreases were partially offset by higher net revenues in our Wealth Management & Connected business, reflecting higher Private Banking revenues, mainly from higher transaction-based revenues, and higher advisory, under-writing and financing revenues. Compared to 2016, total operat-ing expenses of CHF 2,760 million decreased slightly, primarily reflecting lower compensation and benefits and lower commission expenses, mainly due to the transition of the systematic market making business, partially offset by higher restructuring expenses. Adjusted income before taxes of CHF 792 million increased slightly compared to 2016.
Divisional results in / end of % change in / end of % change
4Q17 3Q17 4Q16 QoQ YoY 2017 2016 YoY
Statements of operations (CHF million)
Net revenues 885 890 862 (1) 3 3,504 3,597 (3)
Provision for credit losses 7 5 11 40 (36) 15 26 (42)
Compensation and benefits 394 397 429 (1) (8) 1,602 1,665 (4)
General and administrative expenses 217 195 219 11 (1) 831 836 (1)
Commission expenses 68 65 81 5 (16) 264 292 (10)
Restructuring expenses 23 10 19 130 21 63 53 19
Total other operating expenses 308 270 319 14 (3) 1,158 1,181 (2)
Total operating expenses 702 667 748 5 (6) 2,760 2,846 (3)
Income before taxes 176 218 103 (19) 71 729 725 1
Statement of operations metrics (%)
Return on regulatory capital 13.3 16.8 7.6 – – 13.8 13.7 –
Cost/income ratio 79.3 74.9 86.8 – – 78.8 79.1 –
Economic risk capital and return
Average economic risk capital (CHF million) 3,423 3,658 4,453 (6) (23) 3,897 4,147 (6)
Pre-tax return on average economic risk capital (%) 20.6 23.8 9.3 – – 18.7 17.5 –
Number of employees (full-time equivalents)
Number of employees 7,230 7,050 6,980 3 4 7,230 6,980 4
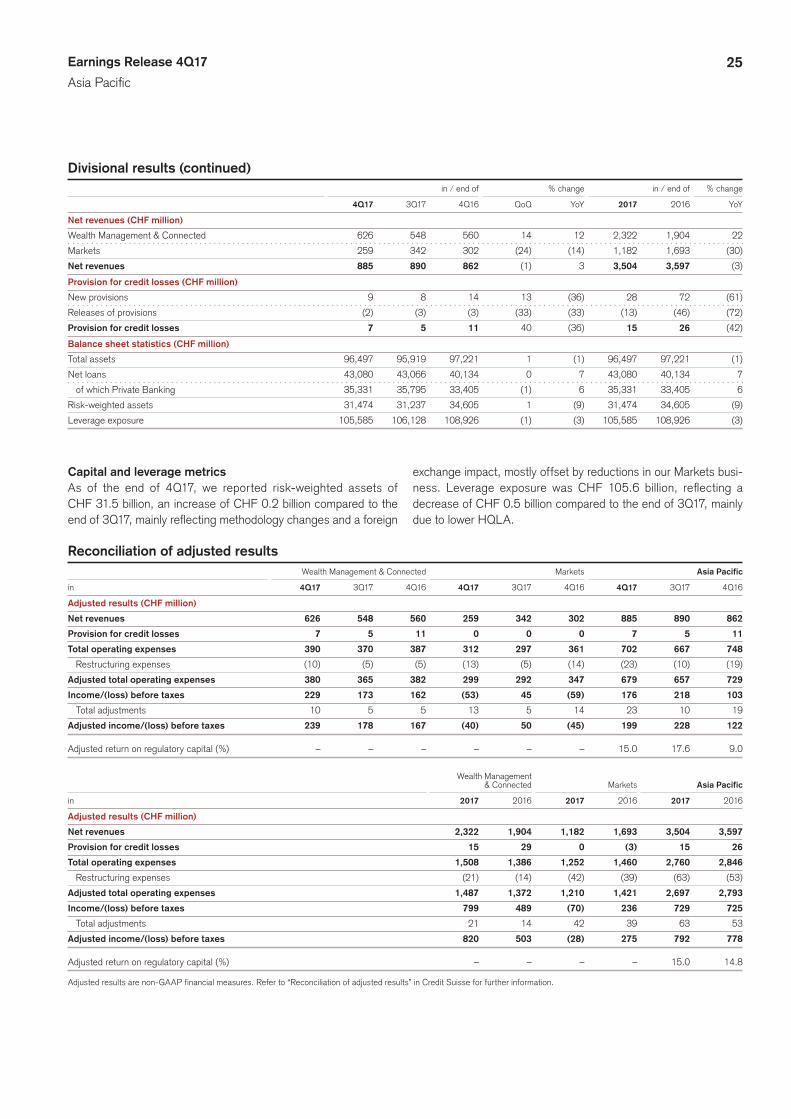
25Earnings Release 4Q17
Asia Pacific
Divisional results (continued) in / end of % change in / end of % change
4Q17 3Q17 4Q16 QoQ YoY 2017 2016 YoY
Net revenues (CHF million)
Wealth Management & Connected 626 548 560 14 12 2,322 1,904 22
Markets 259 342 302 (24) (14) 1,182 1,693 (30)
Net revenues 885 890 862 (1) 3 3,504 3,597 (3)
Provision for credit losses (CHF million)
New provisions 9 8 14 13 (36) 28 72 (61)
Releases of provisions (2) (3) (3) (33) (33) (13) (46) (72)
Provision for credit losses 7 5 11 40 (36) 15 26 (42)
Balance sheet statistics (CHF million)
Total assets 96,497 95,919 97,221 1 (1) 96,497 97,221 (1)
Net loans 43,080 43,066 40,134 0 7 43,080 40,134 7
of which Private Banking 35,331 35,795 33,405 (1) 6 35,331 33,405 6
Risk-weighted assets 31,474 31,237 34,605 1 (9) 31,474 34,605 (9)
Leverage exposure 105,585 106,128 108,926 (1) (3) 105,585 108,926 (3)
Capital and leverage metrics As of the end of 4Q17, we reported risk-weighted assets of CHF 31.5 billion, an increase of CHF 0.2 billion compared to the end of 3Q17, mainly reflecting methodology changes and a foreign
exchange impact, mostly offset by reductions in our Markets busi-ness. Leverage exposure was CHF 105.6 billion, reflecting a decrease of CHF 0.5 billion compared to the end of 3Q17, mainly due to lower HQLA.
Reconciliation of adjusted results Wealth Management & Connected Markets Asia Pacific
in 4Q17 3Q17 4Q16 4Q17 3Q17 4Q16 4Q17 3Q17 4Q16
Adjusted results (CHF million)
Net revenues 626 548 560 259 342 302 885 890 862
Provision for credit losses 7 5 11 0 0 0 7 5 11
Total operating expenses 390 370 387 312 297 361 702 667 748
Restructuring expenses (10) (5) (5) (13) (5) (14) (23) (10) (19)
Adjusted total operating expenses 380 365 382 299 292 347 679 657 729
Income/(loss) before taxes 229 173 162 (53) 45 (59) 176 218 103
Total adjustments 10 5 5 13 5 14 23 10 19
Adjusted income/(loss) before taxes 239 178 167 (40) 50 (45) 199 228 122
Adjusted return on regulatory capital (%) – – – – – – 15.0 17.6 9.0
Wealth Management & Connected Markets Asia Pacific
in 2017 2016 2017 2016 2017 2016
Adjusted results (CHF million)
Net revenues 2,322 1,904 1,182 1,693 3,504 3,597
Provision for credit losses 15 29 0 (3) 15 26
Total operating expenses 1,508 1,386 1,252 1,460 2,760 2,846
Restructuring expenses (21) (14) (42) (39) (63) (53)
Adjusted total operating expenses 1,487 1,372 1,210 1,421 2,697 2,793
Income/(loss) before taxes 799 489 (70) 236 729 725
Total adjustments 21 14 42 39 63 53
Adjusted income/(loss) before taxes 820 503 (28) 275 792 778
Adjusted return on regulatory capital (%) – – – – 15.0 14.8
Adjusted results are non-GAAP financial measures. Refer to “Reconciliation of adjusted results” in Credit Suisse for further information.
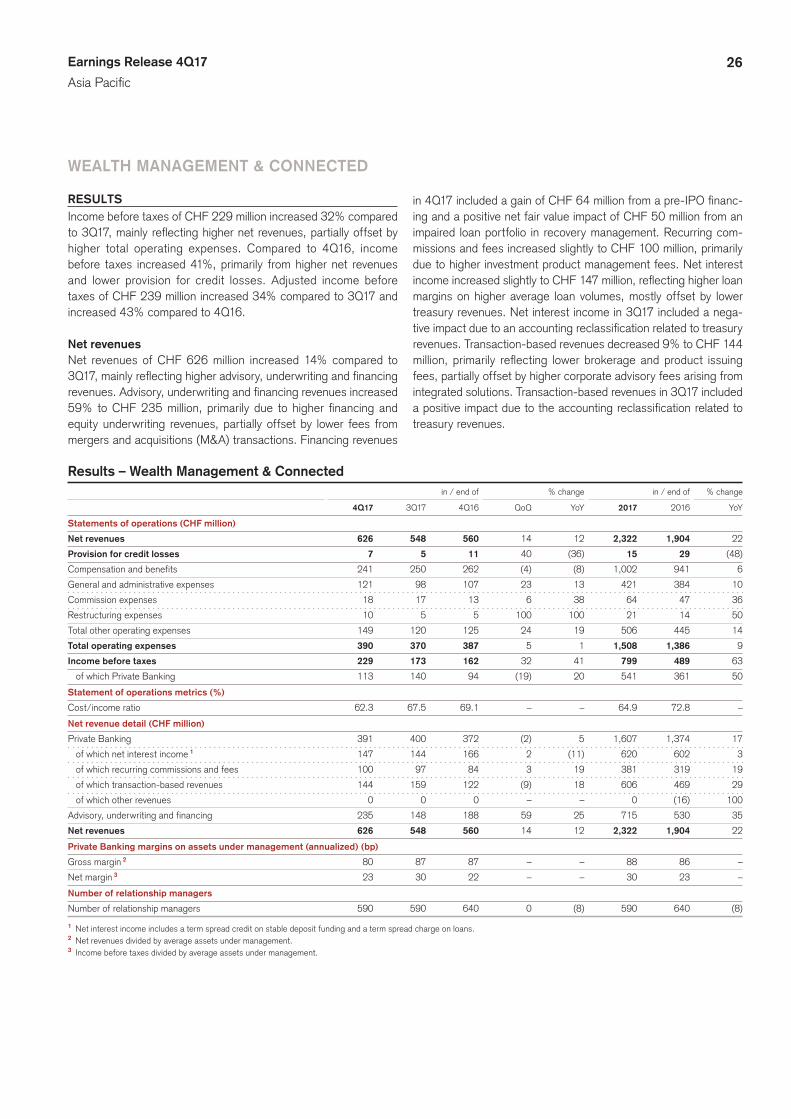
26Earnings Release 4Q17
Asia Pacific
WEALTH MANAGEMENT & CONNECTED
RESULTSIncome before taxes of CHF 229 million increased 32% compared to 3Q17, mainly reflecting higher net revenues, partially offset by higher total operating expenses. Compared to 4Q16, income before taxes increased 41%, primarily from higher net revenues and lower provision for credit losses. Adjusted income before taxes of CHF 239 million increased 34% compared to 3Q17 and increased 43% compared to 4Q16.
Net revenuesNet revenues of CHF 626 million increased 14% compared to 3Q17, mainly reflecting higher advisory, underwriting and financing revenues. Advisory, underwriting and financing revenues increased 59% to CHF 235 million, primarily due to higher financing and equity underwriting revenues, partially offset by lower fees from mergers and acquisitions (M&A) transactions. Financing revenues
in 4Q17 included a gain of CHF 64 million from a pre-IPO financ-ing and a positive net fair value impact of CHF 50 million from an impaired loan portfolio in recovery management. Recurring com-missions and fees increased slightly to CHF 100 million, primarily due to higher investment product management fees. Net interest income increased slightly to CHF 147 million, reflecting higher loan margins on higher average loan volumes, mostly offset by lower treasury revenues. Net interest income in 3Q17 included a nega-tive impact due to an accounting reclassification related to treasury revenues. Transaction-based revenues decreased 9% to CHF 144 million, primarily reflecting lower brokerage and product issuing fees, partially offset by higher corporate advisory fees arising from integrated solutions. Transaction-based revenues in 3Q17 included a positive impact due to the accounting reclassification related to treasury revenues.
Results – Wealth Management & Connected in / end of % change in / end of % change
4Q17 3Q17 4Q16 QoQ YoY 2017 2016 YoY
Statements of operations (CHF million)
Net revenues 626 548 560 14 12 2,322 1,904 22
Provision for credit losses 7 5 11 40 (36) 15 29 (48)
Compensation and benefits 241 250 262 (4) (8) 1,002 941 6
General and administrative expenses 121 98 107 23 13 421 384 10
Commission expenses 18 17 13 6 38 64 47 36
Restructuring expenses 10 5 5 100 100 21 14 50
Total other operating expenses 149 120 125 24 19 506 445 14
Total operating expenses 390 370 387 5 1 1,508 1,386 9
Income before taxes 229 173 162 32 41 799 489 63
of which Private Banking 113 140 94 (19) 20 541 361 50
Statement of operations metrics (%)
Cost/income ratio 62.3 67.5 69.1 – – 64.9 72.8 –
Net revenue detail (CHF million)
Private Banking 391 400 372 (2) 5 1,607 1,374 17
of which net interest income 1 147 144 166 2 (11) 620 602 3
of which recurring commissions and fees 100 97 84 3 19 381 319 19
of which transaction-based revenues 144 159 122 (9) 18 606 469 29
of which other revenues 0 0 0 – – 0 (16) 100
Advisory, underwriting and financing 235 148 188 59 25 715 530 35
Net revenues 626 548 560 14 12 2,322 1,904 22
Private Banking margins on assets under management (annualized) (bp)
Gross margin 2 80 87 87 – – 88 86 –
Net margin 3 23 30 22 – – 30 23 –
Number of relationship managers
Number of relationship managers 590 590 640 0 (8) 590 640 (8)
1 Net interest income includes a term spread credit on stable deposit funding and a term spread charge on loans.2 Net revenues divided by average assets under management.3 Income before taxes divided by average assets under management.
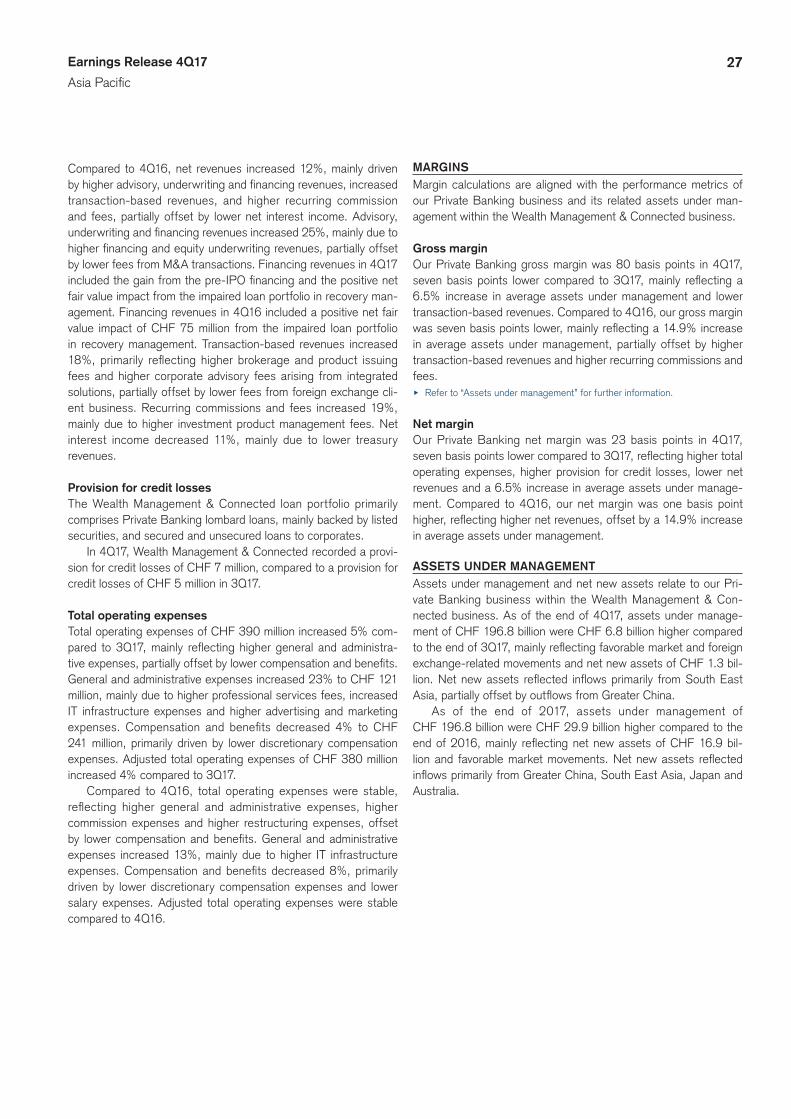
27Earnings Release 4Q17
Asia Pacific
Compared to 4Q16, net revenues increased 12%, mainly driven by higher advisory, underwriting and financing revenues, increased transaction-based revenues, and higher recurring commission and fees, partially offset by lower net interest income. Advisory, underwriting and financing revenues increased 25%, mainly due to higher financing and equity underwriting revenues, partially offset by lower fees from M&A transactions. Financing revenues in 4Q17 included the gain from the pre-IPO financing and the positive net fair value impact from the impaired loan portfolio in recovery man-agement. Financing revenues in 4Q16 included a positive net fair value impact of CHF 75 million from the impaired loan portfolio in recovery management. Transaction-based revenues increased 18%, primarily reflecting higher brokerage and product issuing fees and higher corporate advisory fees arising from integrated solutions, partially offset by lower fees from foreign exchange cli-ent business. Recurring commissions and fees increased 19%, mainly due to higher investment product management fees. Net interest income decreased 11%, mainly due to lower treasury revenues.
Provision for credit lossesThe Wealth Management & Connected loan portfolio primarily comprises Private Banking lombard loans, mainly backed by listed securities, and secured and unsecured loans to corporates.
In 4Q17, Wealth Management & Connected recorded a provi-sion for credit losses of CHF 7 million, compared to a provision for credit losses of CHF 5 million in 3Q17.
Total operating expensesTotal operating expenses of CHF 390 million increased 5% com-pared to 3Q17, mainly reflecting higher general and administra-tive expenses, partially offset by lower compensation and benefits. General and administrative expenses increased 23% to CHF 121 million, mainly due to higher professional services fees, increased IT infrastructure expenses and higher advertising and marketing expenses. Compensation and benefits decreased 4% to CHF 241 million, primarily driven by lower discretionary compensation expenses. Adjusted total operating expenses of CHF 380 million increased 4% compared to 3Q17.
Compared to 4Q16, total operating expenses were stable, reflecting higher general and administrative expenses, higher commission expenses and higher restructuring expenses, offset by lower compensation and benefits. General and administrative expenses increased 13%, mainly due to higher IT infrastructure expenses. Compensation and benefits decreased 8%, primarily driven by lower discretionary compensation expenses and lower salary expenses. Adjusted total operating expenses were stable compared to 4Q16.
MARGINSMargin calculations are aligned with the performance metrics of our Private Banking business and its related assets under man-agement within the Wealth Management & Connected business.
Gross marginOur Private Banking gross margin was 80 basis points in 4Q17, seven basis points lower compared to 3Q17, mainly reflecting a 6.5% increase in average assets under management and lower transaction-based revenues. Compared to 4Q16, our gross margin was seven basis points lower, mainly reflecting a 14.9% increase in average assets under management, partially offset by higher transaction-based revenues and higher recurring commissions and fees.u Refer to “Assets under management” for further information.
Net marginOur Private Banking net margin was 23 basis points in 4Q17, seven basis points lower compared to 3Q17, reflecting higher total operating expenses, higher provision for credit losses, lower net revenues and a 6.5% increase in average assets under manage-ment. Compared to 4Q16, our net margin was one basis point higher, reflecting higher net revenues, offset by a 14.9% increase in average assets under management.
ASSETS UNDER MANAGEMENTAssets under management and net new assets relate to our Pri-vate Banking business within the Wealth Management & Con-nected business. As of the end of 4Q17, assets under manage-ment of CHF 196.8 billion were CHF 6.8 billion higher compared to the end of 3Q17, mainly reflecting favorable market and foreign exchange-related movements and net new assets of CHF 1.3 bil-lion. Net new assets reflected inflows primarily from South East Asia, partially offset by outflows from Greater China.
As of the end of 2017, assets under management of CHF 196.8 billion were CHF 29.9 billion higher compared to the end of 2016, mainly reflecting net new assets of CHF 16.9 bil-lion and favorable market movements. Net new assets reflected inflows primarily from Greater China, South East Asia, Japan and Australia.
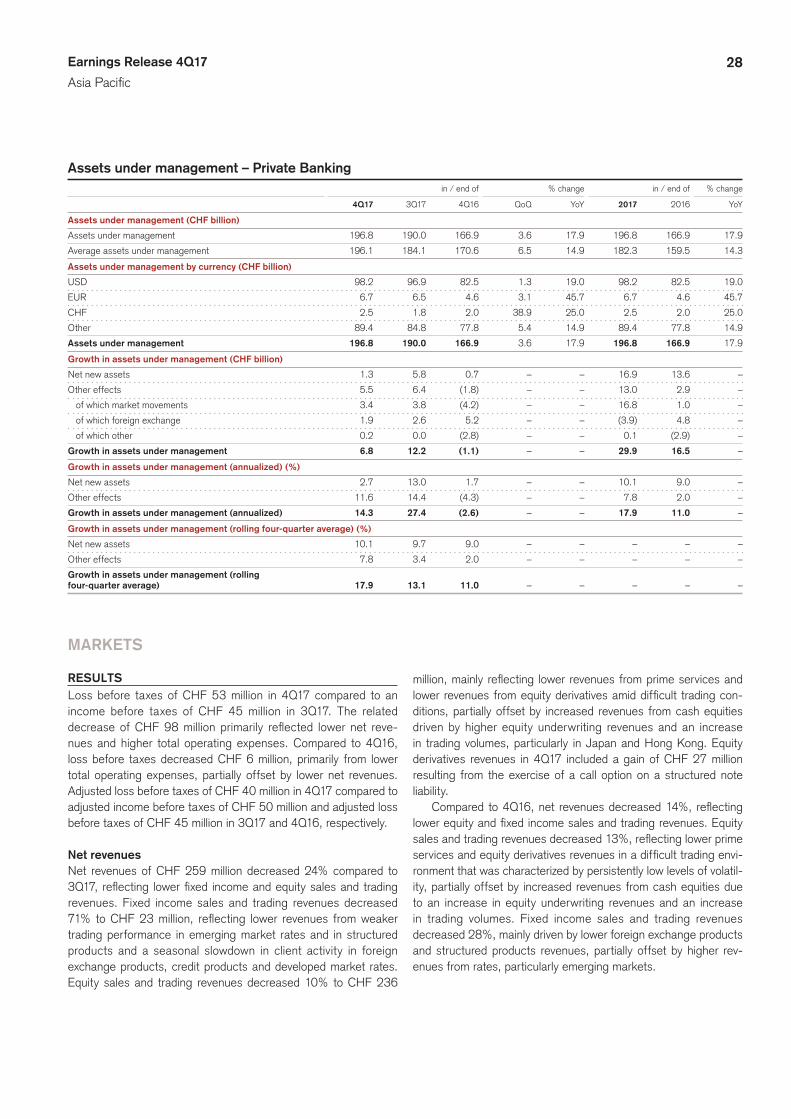
28Earnings Release 4Q17
Asia Pacific
Assets under management – Private Banking in / end of % change in / end of % change
4Q17 3Q17 4Q16 QoQ YoY 2017 2016 YoY
Assets under management (CHF billion)
Assets under management 196.8 190.0 166.9 3.6 17.9 196.8 166.9 17.9
Average assets under management 196.1 184.1 170.6 6.5 14.9 182.3 159.5 14.3
Assets under management by currency (CHF billion)
USD 98.2 96.9 82.5 1.3 19.0 98.2 82.5 19.0
EUR 6.7 6.5 4.6 3.1 45.7 6.7 4.6 45.7
CHF 2.5 1.8 2.0 38.9 25.0 2.5 2.0 25.0
Other 89.4 84.8 77.8 5.4 14.9 89.4 77.8 14.9
Assets under management 196.8 190.0 166.9 3.6 17.9 196.8 166.9 17.9
Growth in assets under management (CHF billion)
Net new assets 1.3 5.8 0.7 – – 16.9 13.6 –
Other effects 5.5 6.4 (1.8) – – 13.0 2.9 –
of which market movements 3.4 3.8 (4.2) – – 16.8 1.0 –
of which foreign exchange 1.9 2.6 5.2 – – (3.9) 4.8 –
of which other 0.2 0.0 (2.8) – – 0.1 (2.9) –
Growth in assets under management 6.8 12.2 (1.1) – – 29.9 16.5 –
Growth in assets under management (annualized) (%)
Net new assets 2.7 13.0 1.7 – – 10.1 9.0 –
Other effects 11.6 14.4 (4.3) – – 7.8 2.0 –
Growth in assets under management (annualized) 14.3 27.4 (2.6) – – 17.9 11.0 –
Growth in assets under management (rolling four-quarter average) (%)
Net new assets 10.1 9.7 9.0 – – – – –
Other effects 7.8 3.4 2.0 – – – – –
Growth in assets under management (rolling
four-quarter average) 17.9 13.1 11.0 – – – – –
MARKETS
RESULTSLoss before taxes of CHF 53 million in 4Q17 compared to an income before taxes of CHF 45 million in 3Q17. The related decrease of CHF 98 million primarily reflected lower net reve-nues and higher total operating expenses. Compared to 4Q16, loss before taxes decreased CHF 6 million, primarily from lower total operating expenses, partially offset by lower net revenues. Adjusted loss before taxes of CHF 40 million in 4Q17 compared to adjusted income before taxes of CHF 50 million and adjusted loss before taxes of CHF 45 million in 3Q17 and 4Q16, respectively.
Net revenuesNet revenues of CHF 259 million decreased 24% compared to 3Q17, reflecting lower fixed income and equity sales and trading revenues. Fixed income sales and trading revenues decreased 71% to CHF 23 million, reflecting lower revenues from weaker trading performance in emerging market rates and in structured products and a seasonal slowdown in client activity in foreign exchange products, credit products and developed market rates. Equity sales and trading revenues decreased 10% to CHF 236
million, mainly reflecting lower revenues from prime services and lower revenues from equity derivatives amid difficult trading con-ditions, partially offset by increased revenues from cash equities driven by higher equity underwriting revenues and an increase in trading volumes, particularly in Japan and Hong Kong. Equity derivatives revenues in 4Q17 included a gain of CHF 27 million resulting from the exercise of a call option on a structured note liability.
Compared to 4Q16, net revenues decreased 14%, reflecting lower equity and fixed income sales and trading revenues. Equity sales and trading revenues decreased 13%, reflecting lower prime services and equity derivatives revenues in a difficult trading envi-ronment that was characterized by persistently low levels of volatil-ity, partially offset by increased revenues from cash equities due to an increase in equity underwriting revenues and an increase in trading volumes. Fixed income sales and trading revenues decreased 28%, mainly driven by lower foreign exchange products and structured products revenues, partially offset by higher rev-enues from rates, particularly emerging markets.
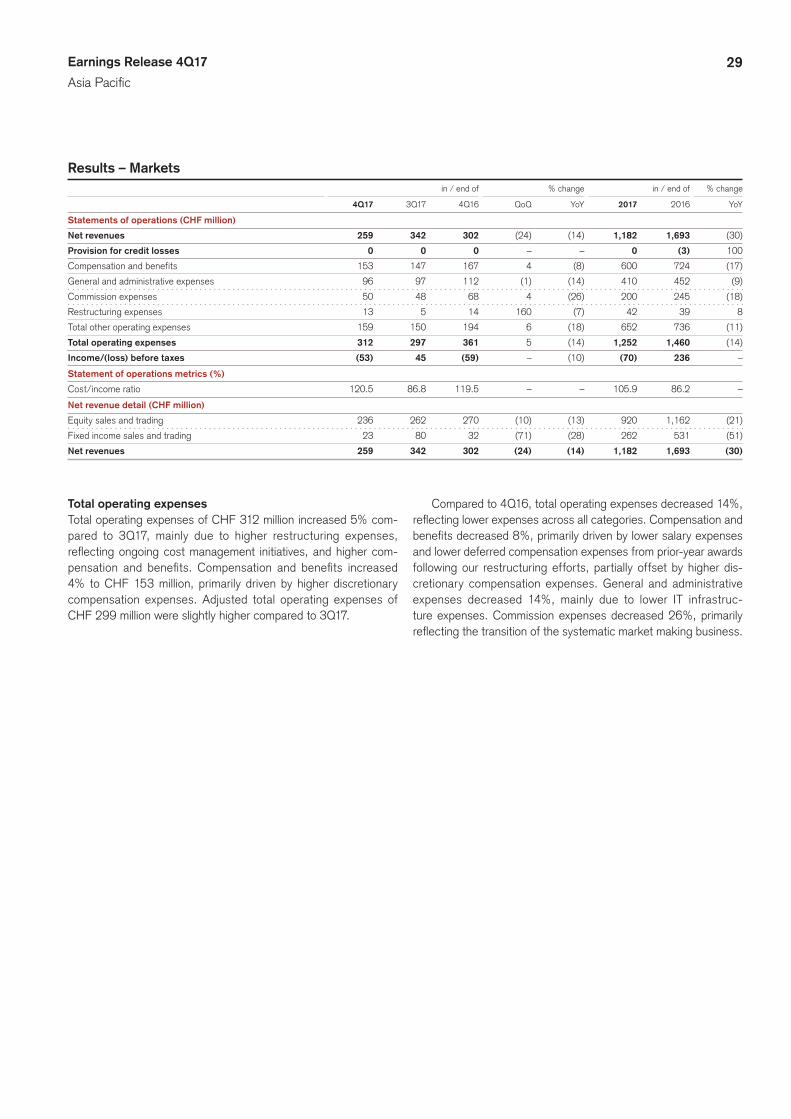
29Earnings Release 4Q17
Asia Pacific
Results – Markets in / end of % change in / end of % change
4Q17 3Q17 4Q16 QoQ YoY 2017 2016 YoY
Statements of operations (CHF million)
Net revenues 259 342 302 (24) (14) 1,182 1,693 (30)
Provision for credit losses 0 0 0 – – 0 (3) 100
Compensation and benefits 153 147 167 4 (8) 600 724 (17)
General and administrative expenses 96 97 112 (1) (14) 410 452 (9)
Commission expenses 50 48 68 4 (26) 200 245 (18)
Restructuring expenses 13 5 14 160 (7) 42 39 8
Total other operating expenses 159 150 194 6 (18) 652 736 (11)
Total operating expenses 312 297 361 5 (14) 1,252 1,460 (14)
Income/(loss) before taxes (53) 45 (59) – (10) (70) 236 –
Statement of operations metrics (%)
Cost/income ratio 120.5 86.8 119.5 – – 105.9 86.2 –
Net revenue detail (CHF million)
Equity sales and trading 236 262 270 (10) (13) 920 1,162 (21)
Fixed income sales and trading 23 80 32 (71) (28) 262 531 (51)
Net revenues 259 342 302 (24) (14) 1,182 1,693 (30)
Total operating expensesTotal operating expenses of CHF 312 million increased 5% com-pared to 3Q17, mainly due to higher restructuring expenses, reflecting ongoing cost management initiatives, and higher com-pensation and benefits. Compensation and benefits increased 4% to CHF 153 million, primarily driven by higher discretionary compensation expenses. Adjusted total operating expenses of CHF 299 million were slightly higher compared to 3Q17.
Compared to 4Q16, total operating expenses decreased 14%, reflecting lower expenses across all categories. Compensation and benefits decreased 8%, primarily driven by lower salary expenses and lower deferred compensation expenses from prior-year awards following our restructuring efforts, partially offset by higher dis-cretionary compensation expenses. General and administrative expenses decreased 14%, mainly due to lower IT infrastruc-ture expenses. Commission expenses decreased 26%, primarily reflecting the transition of the systematic market making business.
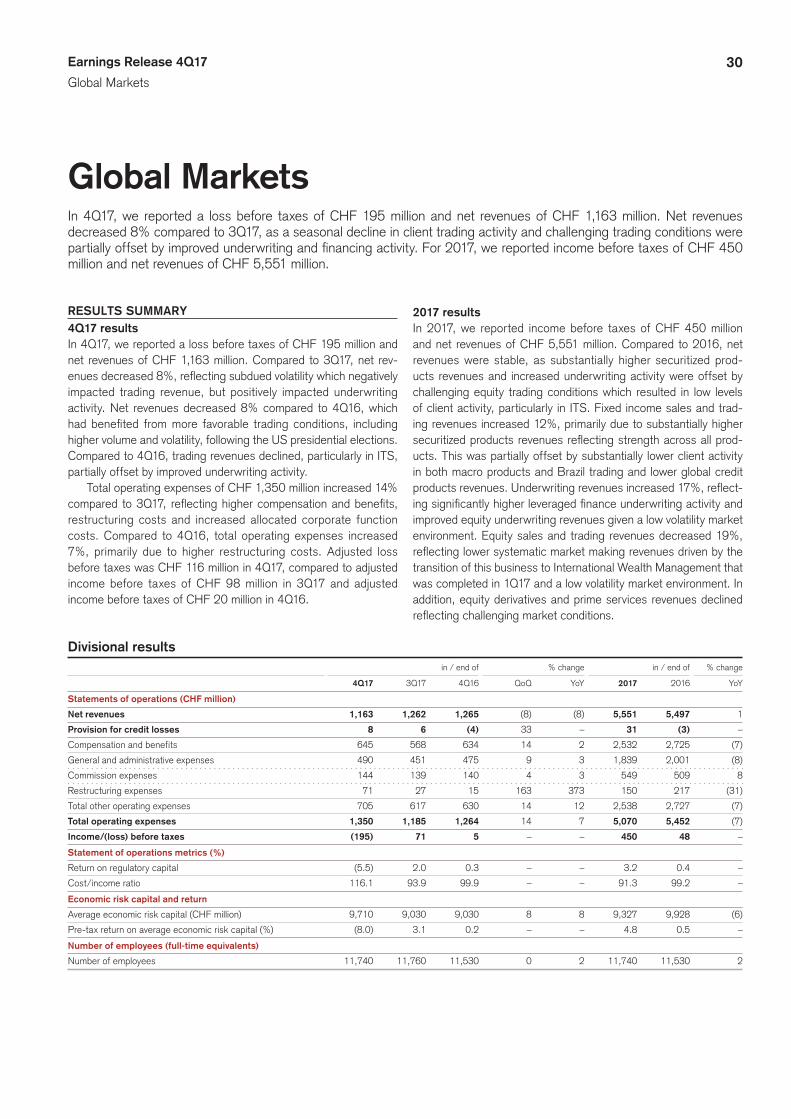
30Earnings Release 4Q17
Global Markets
Global MarketsIn 4Q17, we reported a loss before taxes of CHF 195 million and net revenues of CHF 1,163 million. Net revenues decreased 8% compared to 3Q17, as a seasonal decline in client trading activity and challenging trading conditions were partially offset by improved underwriting and financing activity. For 2017, we reported income before taxes of CHF 450 million and net revenues of CHF 5,551 million.
RESULTS SUMMARY4Q17 resultsIn 4Q17, we reported a loss before taxes of CHF 195 million and net revenues of CHF 1,163 million. Compared to 3Q17, net rev-enues decreased 8%, reflecting subdued volatility which negatively impacted trading revenue, but positively impacted underwriting activity. Net revenues decreased 8% compared to 4Q16, which had benefited from more favorable trading conditions, including higher volume and volatility, following the US presidential elections. Compared to 4Q16, trading revenues declined, particularly in ITS, partially offset by improved underwriting activity.
Total operating expenses of CHF 1,350 million increased 14% compared to 3Q17, reflecting higher compensation and benefits, restructuring costs and increased allocated corporate function costs. Compared to 4Q16, total operating expenses increased 7%, primarily due to higher restructuring costs. Adjusted loss before taxes was CHF 116 million in 4Q17, compared to adjusted income before taxes of CHF 98 million in 3Q17 and adjusted income before taxes of CHF 20 million in 4Q16.
2017 resultsIn 2017, we reported income before taxes of CHF 450 million and net revenues of CHF 5,551 million. Compared to 2016, net revenues were stable, as substantially higher securitized prod-ucts revenues and increased underwriting activity were offset by challenging equity trading conditions which resulted in low levels of client activity, particularly in ITS. Fixed income sales and trad-ing revenues increased 12%, primarily due to substantially higher securitized products revenues reflecting strength across all prod-ucts. This was partially offset by substantially lower client activity in both macro products and Brazil trading and lower global credit products revenues. Underwriting revenues increased 17%, reflect-ing significantly higher leveraged finance underwriting activity and improved equity underwriting revenues given a low volatility market environment. Equity sales and trading revenues decreased 19%, reflecting lower systematic market making revenues driven by the transition of this business to International Wealth Management that was completed in 1Q17 and a low volatility market environment. In addition, equity derivatives and prime services revenues declined reflecting challenging market conditions.
Divisional results in / end of % change in / end of % change
4Q17 3Q17 4Q16 QoQ YoY 2017 2016 YoY
Statements of operations (CHF million)
Net revenues 1,163 1,262 1,265 (8) (8) 5,551 5,497 1
Provision for credit losses 8 6 (4) 33 – 31 (3) –
Compensation and benefits 645 568 634 14 2 2,532 2,725 (7)
General and administrative expenses 490 451 475 9 3 1,839 2,001 (8)
Commission expenses 144 139 140 4 3 549 509 8
Restructuring expenses 71 27 15 163 373 150 217 (31)
Total other operating expenses 705 617 630 14 12 2,538 2,727 (7)
Total operating expenses 1,350 1,185 1,264 14 7 5,070 5,452 (7)
Income/(loss) before taxes (195) 71 5 – – 450 48 –
Statement of operations metrics (%)
Return on regulatory capital (5.5) 2.0 0.3 – – 3.2 0.4 –
Cost/income ratio 116.1 93.9 99.9 – – 91.3 99.2 –
Economic risk capital and return
Average economic risk capital (CHF million) 9,710 9,030 9,030 8 8 9,327 9,928 (6)
Pre-tax return on average economic risk capital (%) (8.0) 3.1 0.2 – – 4.8 0.5 –
Number of employees (full-time equivalents)
Number of employees 11,740 11,760 11,530 0 2 11,740 11,530 2
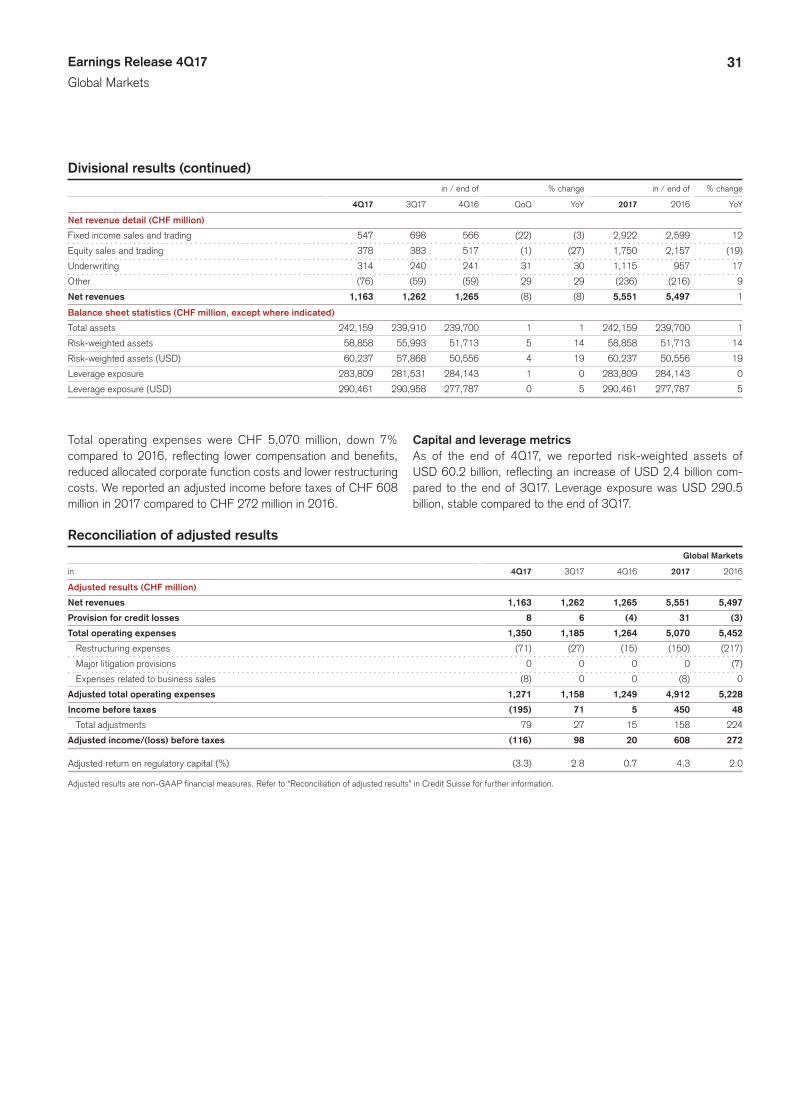
31Earnings Release 4Q17
Global Markets
Divisional results (continued) in / end of % change in / end of % change
4Q17 3Q17 4Q16 QoQ YoY 2017 2016 YoY
Net revenue detail (CHF million)
Fixed income sales and trading 547 698 566 (22) (3) 2,922 2,599 12
Equity sales and trading 378 383 517 (1) (27) 1,750 2,157 (19)
Underwriting 314 240 241 31 30 1,115 957 17
Other (76) (59) (59) 29 29 (236) (216) 9
Net revenues 1,163 1,262 1,265 (8) (8) 5,551 5,497 1
Balance sheet statistics (CHF million, except where indicated)
Total assets 242,159 239,910 239,700 1 1 242,159 239,700 1
Risk-weighted assets 58,858 55,993 51,713 5 14 58,858 51,713 14
Risk-weighted assets (USD) 60,237 57,868 50,556 4 19 60,237 50,556 19
Leverage exposure 283,809 281,531 284,143 1 0 283,809 284,143 0
Leverage exposure (USD) 290,461 290,958 277,787 0 5 290,461 277,787 5
Total operating expenses were CHF 5,070 million, down 7% compared to 2016, reflecting lower compensation and benefits, reduced allocated corporate function costs and lower restructuring costs. We reported an adjusted income before taxes of CHF 608 million in 2017 compared to CHF 272 million in 2016.
Capital and leverage metrics As of the end of 4Q17, we reported risk-weighted assets of USD 60.2 billion, reflecting an increase of USD 2.4 billion com-pared to the end of 3Q17. Leverage exposure was USD 290.5 billion, stable compared to the end of 3Q17.
Reconciliation of adjusted results Global Markets
in 4Q17 3Q17 4Q16 2017 2016
Adjusted results (CHF million)
Net revenues 1,163 1,262 1,265 5,551 5,497
Provision for credit losses 8 6 (4) 31 (3)
Total operating expenses 1,350 1,185 1,264 5,070 5,452
Restructuring expenses (71) (27) (15) (150) (217)
Major litigation provisions 0 0 0 0 (7)
Expenses related to business sales (8) 0 0 (8) 0
Adjusted total operating expenses 1,271 1,158 1,249 4,912 5,228
Income before taxes (195) 71 5 450 48
Total adjustments 79 27 15 158 224
Adjusted income/(loss) before taxes (116) 98 20 608 272
Adjusted return on regulatory capital (%) (3.3) 2.8 0.7 4.3 2.0
Adjusted results are non-GAAP financial measures. Refer to “Reconciliation of adjusted results” in Credit Suisse for further information.
32Earnings Release 4Q17
Global Markets
RESULTSRevenues in 4Q17 reflected a change in the intra-divisional fund-ing cost allocation methodology between fixed income sales and trading and equity sales and trading due to ongoing work on the implementation of the net stable funding ratio framework.
Fixed income sales and tradingIn 4Q17, fixed income sales and trading revenues of CHF 547 million decreased 22% compared to 3Q17, driven by lower secu-ritized products and global credit products revenues, reflecting a seasonal slowdown in client activity. Securitized products reve-nues decreased driven by lower agency and non-agency trading revenues partially offset by strong asset finance activity. Global credit products revenues decreased significantly, primarily driven by lower leveraged finance trading revenues. This was partially offset by increased macro products revenues reflecting higher cli-ent activity in European rates. In addition, emerging markets rev-enues increased primarily reflecting higher Europe, Middle East and Africa (EMEA) structured credit and Latin American financing activity.
Fixed income sales and trading revenues decreased 3% com-pared to a strong 4Q16. Global credit products revenues declined significantly due to lower investment grade trading activity and leveraged finance given persistently low levels of volatility which led to reduced client activity. Macro products revenues declined, reflecting weakness in US rates partially offset by higher short term interest rate trading activity. In addition, emerging markets revenues declined significantly, driven by lower Brazil trading and financing activity reflecting challenging macroeconomic conditions. This was partially offset by continued strength in securitized prod-ucts revenues driven by significantly higher asset finance results.
Equity sales and tradingIn 4Q17, equity sales and trading revenues of CHF 378 million were stable compared to 3Q17, despite a seasonal slowdown in client activity coupled with a difficult trading environment charac-terized by persistently low levels of volatility and volumes. Prime services revenues increased reflecting higher commissions in listed derivatives. This was offset by lower revenues in cash equi-ties. In addition, equity derivatives revenues declined significantly primarily due to lower client activity in structured equity derivatives.
Equity sales and trading revenues decreased 27% compared to a strong 4Q16 and amid difficult trading market conditions. Equity derivatives revenues decreased significantly reflecting lower structured and flow derivatives revenues, particularly in EMEA. Cash equities revenues decreased substantially, reflecting lower
secondary revenues in the US consistent with reduced US trading volumes and compared to increased client activity in 4Q16 follow-ing the US presidential elections. In addition, prime services reve-nues decreased, reflecting lower client financing revenues partially offset by higher commissions in listed derivatives.
UnderwritingIn 4Q17, underwriting revenues of CHF 314 million increased 31% compared to 3Q17, reflecting improved market conditions and lower levels of volatility which benefited primary issuance activity. Debt underwriting revenues increased significantly, primarily due to higher leveraged finance revenues. In addition, equity underwrit-ing revenues increased significantly, consistent with an increase in primary issuance volumes.
Underwriting revenues increased 30% compared to 4Q16, reflecting an increase in debt and equity issuance activity. Debt underwriting revenues increased significantly, due to higher lever-aged finance revenues and investment grade revenues. In addition, we also had higher equity underwriting revenues consistent with increased primary issuance activity.
Provision for credit lossesGlobal markets recorded a provision for credit losses of CHF 8 million. This compares to a provision for credit losses of CHF 6 mil-lion in 3Q17 and a release of provision for credit losses of CHF 4 million in 4Q16.
Total operating expenses In 4Q17, total operating expenses of CHF 1,350 million increased 14% compared to 3Q17, reflecting higher compensation and ben-efits, increased restructuring costs and higher allocated corpo-rate function costs. Compensation and benefits increased reflect-ing higher discretionary compensation expenses and increased deferred compensation expenses from prior-year awards. During 4Q17, we incurred restructuring costs of CHF 71 million. General and administrative expenses increased, primarily due to higher allo-cated corporate function costs. Adjusted total operating expenses increased 10%.
Compared to 4Q16, total operating expenses increased 7% primarily due to higher restructuring costs. Compensation and benefits expenses increased slightly as lower allocated corporate function costs were offset by higher discretionary compensation expenses. General and administrative expenses increased slightly as lower allocated corporate function costs were offset by higher professional services fees. Adjusted total operating expenses increased slightly.
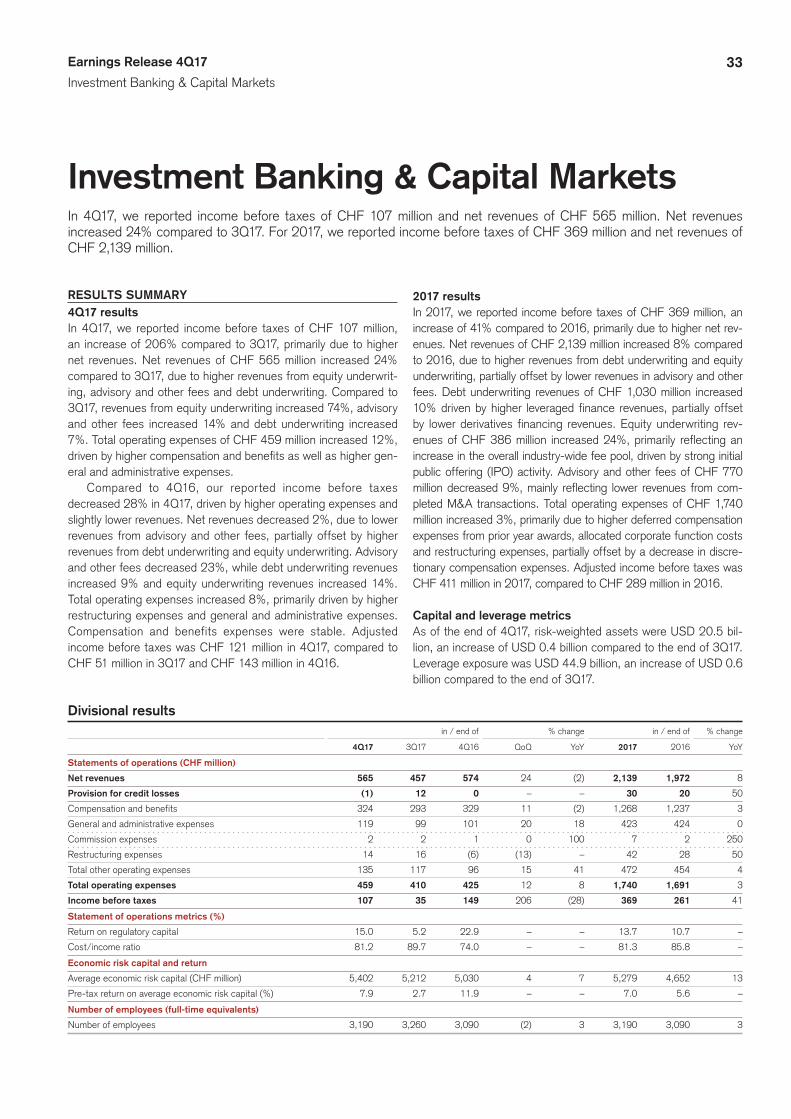
33Earnings Release 4Q17
Investment Banking & Capital Markets
Investment Banking & Capital MarketsIn 4Q17, we reported income before taxes of CHF 107 million and net revenues of CHF 565 million. Net revenues increased 24% compared to 3Q17. For 2017, we reported income before taxes of CHF 369 million and net revenues of CHF 2,139 million.
RESULTS SUMMARY4Q17 results In 4Q17, we reported income before taxes of CHF 107 million, an increase of 206% compared to 3Q17, primarily due to higher net revenues. Net revenues of CHF 565 million increased 24% compared to 3Q17, due to higher revenues from equity underwrit-ing, advisory and other fees and debt underwriting. Compared to 3Q17, revenues from equity underwriting increased 74%, advisory and other fees increased 14% and debt underwriting increased 7%. Total operating expenses of CHF 459 million increased 12%, driven by higher compensation and benefits as well as higher gen-eral and administrative expenses.
Compared to 4Q16, our reported income before taxes decreased 28% in 4Q17, driven by higher operating expenses and slightly lower revenues. Net revenues decreased 2%, due to lower revenues from advisory and other fees, partially offset by higher revenues from debt underwriting and equity underwriting. Advisory and other fees decreased 23%, while debt underwriting revenues increased 9% and equity underwriting revenues increased 14%. Total operating expenses increased 8%, primarily driven by higher restructuring expenses and general and administrative expenses. Compensation and benefits expenses were stable. Adjusted income before taxes was CHF 121 million in 4Q17, compared to CHF 51 million in 3Q17 and CHF 143 million in 4Q16.
2017 resultsIn 2017, we reported income before taxes of CHF 369 million, an increase of 41% compared to 2016, primarily due to higher net rev-enues. Net revenues of CHF 2,139 million increased 8% compared to 2016, due to higher revenues from debt underwriting and equity underwriting, partially offset by lower revenues in advisory and other fees. Debt underwriting revenues of CHF 1,030 million increased 10% driven by higher leveraged finance revenues, partially offset by lower derivatives financing revenues. Equity underwriting rev-enues of CHF 386 million increased 24%, primarily reflecting an increase in the overall industry-wide fee pool, driven by strong initial public offering (IPO) activity. Advisory and other fees of CHF 770 million decreased 9%, mainly reflecting lower revenues from com-pleted M&A transactions. Total operating expenses of CHF 1,740 million increased 3%, primarily due to higher deferred compensation expenses from prior year awards, allocated corporate function costs and restructuring expenses, partially offset by a decrease in discre-tionary compensation expenses. Adjusted income before taxes was CHF 411 million in 2017, compared to CHF 289 million in 2016.
Capital and leverage metricsAs of the end of 4Q17, risk-weighted assets were USD 20.5 bil-lion, an increase of USD 0.4 billion compared to the end of 3Q17. Leverage exposure was USD 44.9 billion, an increase of USD 0.6 billion compared to the end of 3Q17.
Divisional results in / end of % change in / end of % change
4Q17 3Q17 4Q16 QoQ YoY 2017 2016 YoY
Statements of operations (CHF million)
Net revenues 565 457 574 24 (2) 2,139 1,972 8
Provision for credit losses (1) 12 0 – – 30 20 50
Compensation and benefits 324 293 329 11 (2) 1,268 1,237 3
General and administrative expenses 119 99 101 20 18 423 424 0
Commission expenses 2 2 1 0 100 7 2 250
Restructuring expenses 14 16 (6) (13) – 42 28 50
Total other operating expenses 135 117 96 15 41 472 454 4
Total operating expenses 459 410 425 12 8 1,740 1,691 3
Income before taxes 107 35 149 206 (28) 369 261 41
Statement of operations metrics (%)
Return on regulatory capital 15.0 5.2 22.9 – – 13.7 10.7 –
Cost/income ratio 81.2 89.7 74.0 – – 81.3 85.8 –
Economic risk capital and return
Average economic risk capital (CHF million) 5,402 5,212 5,030 4 7 5,279 4,652 13
Pre-tax return on average economic risk capital (%) 7.9 2.7 11.9 – – 7.0 5.6 –
Number of employees (full-time equivalents)
Number of employees 3,190 3,260 3,090 (2) 3 3,190 3,090 3
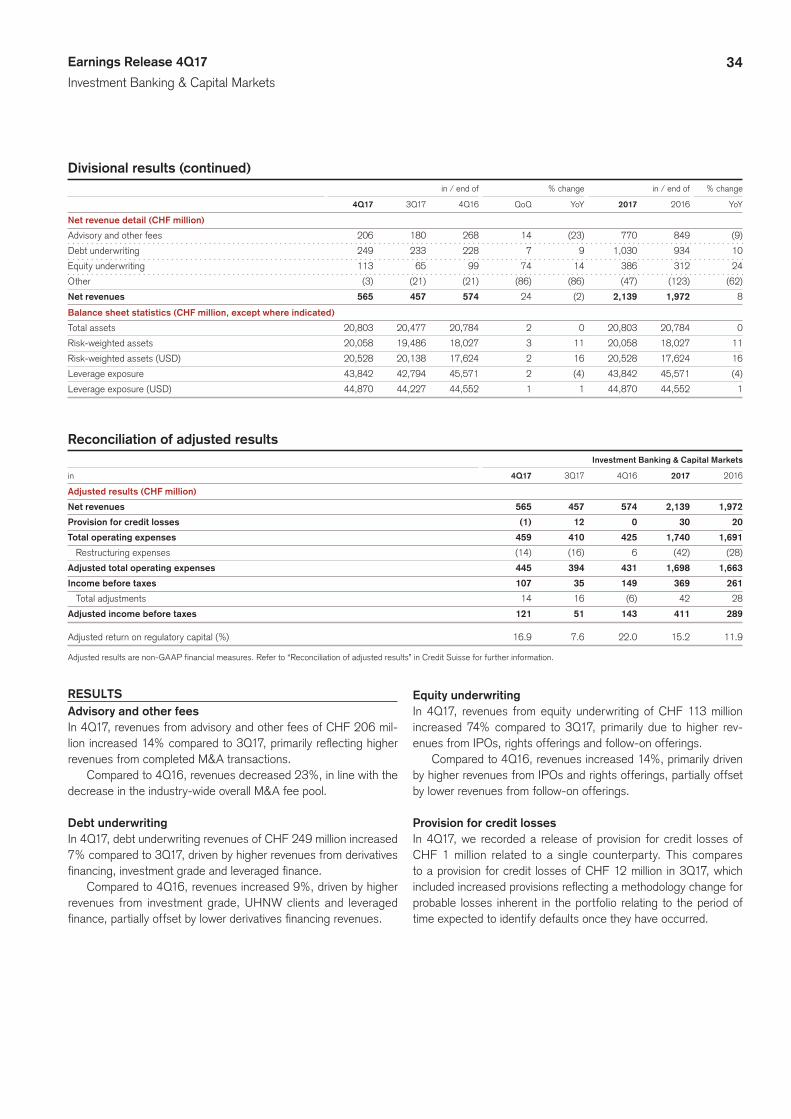
34Earnings Release 4Q17
Investment Banking & Capital Markets
Divisional results (continued) in / end of % change in / end of % change
4Q17 3Q17 4Q16 QoQ YoY 2017 2016 YoY
Net revenue detail (CHF million)
Advisory and other fees 206 180 268 14 (23) 770 849 (9)
Debt underwriting 249 233 228 7 9 1,030 934 10
Equity underwriting 113 65 99 74 14 386 312 24
Other (3) (21) (21) (86) (86) (47) (123) (62)
Net revenues 565 457 574 24 (2) 2,139 1,972 8
Balance sheet statistics (CHF million, except where indicated)
Total assets 20,803 20,477 20,784 2 0 20,803 20,784 0
Risk-weighted assets 20,058 19,486 18,027 3 11 20,058 18,027 11
Risk-weighted assets (USD) 20,528 20,138 17,624 2 16 20,528 17,624 16
Leverage exposure 43,842 42,794 45,571 2 (4) 43,842 45,571 (4)
Leverage exposure (USD) 44,870 44,227 44,552 1 1 44,870 44,552 1
Reconciliation of adjusted results Investment Banking & Capital Markets
in 4Q17 3Q17 4Q16 2017 2016
Adjusted results (CHF million)
Net revenues 565 457 574 2,139 1,972
Provision for credit losses (1) 12 0 30 20
Total operating expenses 459 410 425 1,740 1,691
Restructuring expenses (14) (16) 6 (42) (28)
Adjusted total operating expenses 445 394 431 1,698 1,663
Income before taxes 107 35 149 369 261
Total adjustments 14 16 (6) 42 28
Adjusted income before taxes 121 51 143 411 289
Adjusted return on regulatory capital (%) 16.9 7.6 22.0 15.2 11.9
Adjusted results are non-GAAP financial measures. Refer to “Reconciliation of adjusted results” in Credit Suisse for further information.
RESULTSAdvisory and other feesIn 4Q17, revenues from advisory and other fees of CHF 206 mil-lion increased 14% compared to 3Q17, primarily reflecting higher revenues from completed M&A transactions.
Compared to 4Q16, revenues decreased 23%, in line with the decrease in the industry-wide overall M&A fee pool.
Debt underwritingIn 4Q17, debt underwriting revenues of CHF 249 million increased 7% compared to 3Q17, driven by higher revenues from derivatives financing, investment grade and leveraged finance.
Compared to 4Q16, revenues increased 9%, driven by higher revenues from investment grade, UHNW clients and leveraged finance, partially offset by lower derivatives financing revenues.
Equity underwritingIn 4Q17, revenues from equity underwriting of CHF 113 million increased 74% compared to 3Q17, primarily due to higher rev-enues from IPOs, rights offerings and follow-on offerings.
Compared to 4Q16, revenues increased 14%, primarily driven by higher revenues from IPOs and rights offerings, partially offset by lower revenues from follow-on offerings.
Provision for credit lossesIn 4Q17, we recorded a release of provision for credit losses of CHF 1 million related to a single counterparty. This compares to a provision for credit losses of CHF 12 million in 3Q17, which included increased provisions reflecting a methodology change for probable losses inherent in the portfolio relating to the period of time expected to identify defaults once they have occurred.
35Earnings Release 4Q17
Investment Banking & Capital Markets
Total operating expenses Total operating expenses of CHF 459 million increased 12% com-pared to 3Q17, driven by higher compensation and benefits and general and administrative expenses. Compensation and benefits of CHF 324 million increased 11%, mainly reflecting a higher dis-cretionary compensation accrual, in line with improved business performance. General and administrative expenses of CHF 119 million increased 20% compared to 3Q17, mainly reflecting higher allocated corporate function costs, including IT.
Compared to 4Q16, total operating expenses increased 8%, driven by higher restructuring expenses and general and
administrative expenses. During 4Q17, we incurred restructuring costs of CHF 14 million compared to a credit in 4Q16. General and administrative expenses increased 18%, mainly reflecting tar-geted investments in business growth and in our compliance and IT functions. Compensation and benefits were stable, as higher deferred compensation expenses from prior year awards were off-set by lower discretionary compensation accrual. Adjusted total operating expenses increased 3% compared to 4Q16.
Global advisory and underwriting revenues
The Group’s global advisory and underwriting business operates across multiple business divisions that work in close collaboration with each other to generate these revenues. In order to reflect the global performance and capabilities of this business and for enhanced comparability versus its peers, the following table aggregates total advisory and underwriting revenues for the Group into a single metric in US dollar terms before cross-divisional revenue sharing agreements.
in % change in % change
4Q17 3Q17 4Q16 QoQ YoY 2017 2016 YoY
Global advisory and underwriting revenues (USD million)
Global advisory and underwriting revenues 1,034 950 1,042 9 (1) 4,133 3,771 10
of which advisory and other fees 228 237 310 (4) (26) 935 1,046 (11)
of which debt underwriting 519 544 498 (5) 4 2,292 1,967 17
of which equity underwriting 287 169 234 70 23 906 758 20
36Earnings Release 4Q17
Strategic Resolution Unit
Strategic Resolution UnitIn 4Q17, we reported a loss before taxes of CHF 455 million and decreased its risk-weighted assets by USD 2.6 billion and its leverage exposure by USD 6.2 billion compared to 3Q17. For 2017, we reported a loss before taxes of CHF 2,135 million.
RESULTS SUMMARY4Q17 resultsIn 4Q17, we reported a loss before taxes of CHF 455 million com-pared to losses of CHF 578 million in 3Q17 and CHF 2,895 mil-lion in 4Q16. In 4Q17, we reported an adjusted loss before taxes of CHF 347 million, compared to adjusted losses of CHF 469 mil-lion in 3Q17 and CHF 521 million in 4Q16.
We reported negative net revenues of CHF 151 million in 4Q17, driven by overall funding costs and valuation adjustments, partially offset by exit-related gains from the sale and restructuring of loan portfolios and real estate exposures and revenues from our legacy cross-border and small markets businesses. Valuation adjustments in 4Q17 primarily reflected mark-to-market losses on our legacy investment banking portfolio. Total operating expenses in 4Q17 were CHF 301 million, including CHF 209 million of general and administrative expenses, of which CHF 91 million were litigation provisions, and CHF 65 million of compensation and benefits.
2017 resultsIn 2017, we reported a loss before taxes of CHF 2,135 million, compared to a loss before taxes of CHF 5,759 million in 2016
that included significant litigation provisions of CHF 2,792 million, primarily related to the settlements with the DOJ and the NCUA regarding our legacy RMBS business. In 2017, we reported an adjusted loss before taxes of CHF 1,847 million, compared to CHF 2,943 million in 2016.
Negative net revenues of CHF 886 million in 2017 were driven by overall funding costs, valuation adjustments and exit costs, par-tially offset by revenues from our legacy cross-border and small markets businesses. Valuation adjustments in 2017 primarily reflected mark-to-market losses on our legacy investment banking portfolio. Provision for credit losses was CHF 32 million in 2017 compared to CHF 111 million in 2016. Total operating expenses were CHF 1,217 million in 2017, including CHF 796 million of general and administrative expenses, of which CHF 300 million were litigation provisions, and CHF 332 million of compensation and benefits.
In 2017, we reported adjusted total operating expenses of CHF 891 million, compared to CHF 1,563 million in 2016.
Divisional results in / end of % change in / end of % change
4Q17 3Q17 4Q16 QoQ YoY 2017 2016 YoY
Statements of operations (CHF million)
Net revenues (151) (255) (202) (41) (25) (886) (1,271) (30)
of which from noncontrolling interests
without significant economic interest 29 9 0 222 – 45 27 67
Provision for credit losses 3 (8) 28 – (89) 32 111 (71)
Compensation and benefits 65 85 106 (24) (39) 332 612 (46)
General and administrative expenses 209 216 2,554 (3) (92) 796 3,590 (78)
of which litigation provisions 91 100 2,388 (9) (96) 300 2,792 (89)
Commission expenses 9 9 4 0 125 32 54 (41)
Restructuring expenses 18 21 1 (14) – 57 121 (53)
Total other operating expenses 236 246 2,559 (4) (91) 885 3,765 (76)
Total operating expenses 301 331 2,665 (9) (89) 1,217 4,377 (72)
of which from noncontrolling interests
without significant economic interest 2 2 2 0 0 10 23 (57)
Loss before taxes (455) (578) (2,895) (21) (84) (2,135) (5,759) (63)
of which from noncontrolling interests
without significant economic interest 27 7 (2) 286 – 35 4 –
Number of employees (full-time equivalents)
Number of employees 1,530 1,640 1,830 (7) (16) 1,530 1,830 (16)
37Earnings Release 4Q17
Strategic Resolution Unit
Capital and leverage metricsAs of the end of 4Q17, we reported risk-weighted assets of USD 34.4 billion, a decrease of USD 2.6 billion and USD 10.0 bil-lion compared to the end of 3Q17 and 4Q16, respectively. Lever-age exposure was USD 61.3 billion as of the end of 4Q17, reflect-ing a decrease of USD 6.2 billion and USD 42.1 billion compared
to the end of 3Q17 and 4Q16, respectively. These reductions reflected a broad range of transactions executed in 4Q17, includ-ing the restructuring of life finance and emerging market expo-sures, real estate exits, and full exit of legacy leverage finance capital markets portfolio.
Divisional results (continued) in / end of % change in / end of % change
4Q17 3Q17 4Q16 QoQ YoY 2017 2016 YoY
Net revenue detail (CHF million)
Restructuring of select onshore businesses 0 (1) 9 100 (100) 31 154 (80)
Legacy cross-border and small markets businesses 24 26 41 (8) (41) 121 194 (38)
Legacy asset management positions (12) (85) (34) (86) (65) (79) (90) (12)
Legacy investment banking portfolio (121) (115) (154) 5 (21) (697) (1,253) (44)
Legacy funding costs (90) (90) (69) 0 30 (337) (315) 7
Other 19 1 5 – 280 30 12 150
Noncontrolling interests without significant economic interest 29 9 0 222 – 45 27 67
Net revenues (151) (255) (202) (41) (25) (886) (1,271) (30)
Balance sheet statistics (CHF million)
Total assets 45,629 49,409 80,297 (8) (43) 45,629 80,297 (43)
Risk-weighted assets 33,613 35,842 45,441 (6) (26) 33,613 45,441 (26)
Risk-weighted assets (USD) 34,401 37,042 44,425 (7) (23) 34,401 44,425 (23)
Leverage exposure 59,934 65,385 105,768 (8) (43) 59,934 105,768 (43)
Leverage exposure (USD) 61,339 67,574 103,402 (9) (41) 61,339 103,402 (41)
Reconciliation of adjusted results Strategic Resolution Unit
in 4Q17 3Q17 4Q16 2017 2016
Adjusted results (CHF million)
Net revenues (151) (255) (202) (886) (1,271)
Real estate gains 0 0 (4) 0 (4)
(Gains)/losses on business sales 0 0 2 (38) 6
Adjusted net revenues (151) (255) (204) (924) (1,269)
Provision for credit losses 3 (8) 28 32 111
Total operating expenses 301 331 2,665 1,217 4,377
Restructuring expenses (18) (21) (1) (57) (121)
Major litigation provisions (90) (88) (2,375) (269) (2,693)
Adjusted total operating expenses 193 222 289 891 1,563
Loss before taxes (455) (578) (2,895) (2,135) (5,759)
Total adjustments 108 109 2,374 288 2,816
Adjusted loss before taxes (347) (469) (521) (1,847) (2,943)
Adjusted results are non-GAAP financial measures. Refer to “Reconciliation of adjusted results” in Credit Suisse for further information.
38Earnings Release 4Q17
Strategic Resolution Unit
RESULTSNet revenuesWe reported negative net revenues of CHF 151 million in 4Q17 compared to negative net revenues of CHF 255 million in 3Q17 and CHF 202 million in 4Q16. Compared to 3Q17, the improve-ment was primarily driven by exit-related gains of CHF 51 million from the sale and restructuring of loan portfolios and real estate exposures, partially offset by higher negative valuation adjust-ments. In 4Q17 net revenues included CHF 29 million attributable to noncontrolling interests without significant economic interest arising from the consolidation of certain private equity funds.
Compared to 4Q16, the improvement was driven by lower overall funding costs and exit-related gains from the sale and restructuring of loan portfolios, partially offset by a reduction in fee-based revenues as a result of accelerated business exits and negative valuation adjustments in 4Q17.
Provision for credit lossesIn 4Q17, we recorded a provision for credit losses of CHF 3 million compared to a release of provision for credit losses of CHF 8 mil-lion in 3Q17 and a provision for credit losses of CHF 28 million in 4Q16. The provision for credit losses in 4Q16 was primarily related to ship finance transactions.
Total operating expensesTotal operating expenses of CHF 301 million decreased CHF 30 million compared to 3Q17, primarily reflecting lower compensa-tion and benefits and lower general and administrative expenses. Compensation and benefits of CHF 65 million decreased 24% pri-marily as a result of various cost reduction initiatives, including the impact of the transfer of our US private banking business. General and administrative expenses of CHF 209 million decreased 3%, including lower litigation provisions mainly in connection with mort-gage-related matters. Total operating expenses in 4Q17 included costs of CHF 38 million to meet requirements related to the set-tlements with US authorities regarding US cross-border matters, some of which relates to the work performed by the DFS monitor. Adjusted total operating expenses of CHF 193 million decreased 13% compared to 3Q17.
Compared to 4Q16, total operating expenses decreased CHF 2,364 million, due to lower general and administrative expenses and lower compensation and benefits. General and administrative expenses decreased 92%, including significantly lower litigation provisions, a decrease of CHF 2,297 million as 4Q16 included significant litigation provisions of CHF 2,388 mil-lion, primarily related to the RMBS settlements. Compensation and benefits decreased 39%, primarily as a result of various cost reduction initiatives, including the impact of the transfer of our US private banking business. Adjusted total operating expenses decreased 33% compared to 4Q16.
39Earnings Release 4Q17
Corporate Center
Corporate CenterIn 4Q17, we recorded a loss before taxes of CHF 265 million compared to a loss of CHF 127 million in 3Q17 and a loss of CHF 278 million in 4Q16. In 2017, we recorded a loss before taxes of CHF 736 million compared to a loss of CHF 687 million in 2016.
Corporate Center includes parent company operations such as Group financing, expenses for projects sponsored by the Group, including costs associated with the evolution of our legal entity structure to meet developing and future regulatory requirements, and certain other expenses and revenues that have not been allo-cated to the segments. Corporate Center also includes consolida-tion and elimination adjustments required to eliminate intercom-pany revenues and expenses.
Treasury results include the impact of volatility in the valuations of certain central funding transactions such as structured notes issuances and swap transactions. Since 2Q17, treasury results also include additional interest charges from transfer pricing to align funding costs to assets held in the Corporate Center.
Other revenues include required elimination adjustments asso-ciated with trading in own shares and, beginning in 3Q17, include the cost of certain hedging transactions executed in connection with the Group’s risk-weighted assets.
Compensation and benefits mainly reflect fair value adjust-ments on certain deferred compensation plans not allocated to the segments and certain deferred compensation retention awards intended to support the restructuring of the Group relating to Global Markets and Investment Banking & Capital Markets, pre-dominantly through the end of 2017, and to Asia Pacific predomi-nantly through the end of 2018.
4Q17 resultsIn 4Q17, we recorded a loss before taxes of CHF 265 million com-pared to CHF 127 million in 3Q17. The increased loss before taxes in 4Q17 was primarily driven by higher general and administrative expenses, partially offset by movements in treasury results.
In 4Q17, general and administrative expenses increased 398% compared to 3Q17, primarily reflecting a CHF 127 million impact from the settlement with the DFS relating to certain areas of our foreign exchange trading business and the impact from a provision for indirect taxes.
In 4Q17, treasury results of CHF 72 million reflected revenues with respect to structured notes volatility of CHF 237 million, com-pared to CHF 150 million in 3Q17, partially offset by negative rev-enues of CHF 104 million relating to hedging volatility and CHF 51 million relating to funding activities. The 4Q17 and 3Q17 struc-tured notes volatility was substantially comprised of the positive impact of an enhancement to the valuation methodology relating to the instrument-specific credit risk on fair value option elected structured notes that were previously recorded in accumulated other comprehensive income and were transferred to net income. We are in the process of migrating our structured notes portfolio to a new target operating model that allows for a more granular and precise valuation of the individual notes. This migration became sufficiently advanced during 4Q17 and 3Q17 with respect to the rates sub-portfolio to allow for this change in estimate.
Corporate Center results in % change in % change
4Q17 3Q17 4Q16 QoQ YoY 2017 2016 YoY
Statements of operations (CHF million)
Treasury results 72 45 (75) 60 – 56 (160) –
Other (27) (8) 59 238 – 29 231 (87)
Net revenues 45 37 (16) 22 – 85 71 20
Provision for credit losses (3) 0 0 – – 0 (1) 100
Compensation and benefits 84 103 122 (18) (31) 394 277 42
General and administrative expenses 219 44 101 398 117 368 399 (8)
Commission expenses 8 8 32 0 (75) 45 76 (41)
Restructuring expenses 2 9 7 (78) (71) 14 7 100
Total other operating expenses 229 61 140 275 64 427 482 (11)
Total operating expenses 313 164 262 91 19 821 759 8
Loss before taxes (265) (127) (278) 109 (5) (736) (687) 7
Balance sheet statistics (CHF million)
Total assets 67,591 65,636 62,413 3 8 67,591 62,413 8
Risk-weighted assets 1 23,849 20,718 17,338 15 38 23,849 17,338 38
Leverage exposure 1 67,034 63,467 59,374 6 13 67,034 59,374 13
1 Disclosed on a look-through basis.
40Earnings Release 4Q17
Corporate Center
2017 resultsIn 2017, we recorded a loss before taxes of CHF 736 million com-pared to a loss of CHF 687 million in 2016, primarily driven by higher total operating expenses, partially offset by an increase in net revenues, primarily related to treasury results.
Total operating expenses increased 8% primarily reflecting a 42% increase in compensation and benefits, partially offset by an 8% decrease in general and administrative expenses. The increase in compensation and benefits mainly reflected higher deferred compensation expenses from prior year awards. The decrease in general and administrative expenses was mainly due to lower expenses related to the evolution of the legal entity struc-ture, partially offset by the settlement with the DFS relating to cer-tain areas of our foreign exchange trading business and the impact from a provision for indirect taxes.
Treasury results of CHF 56 million in 2017 reflected revenues with respect to structured notes volatility of CHF 503 million,
compared to losses of CHF 175 million in 2016, partially offset by negative revenues of CHF 257 million relating to funding activities, CHF 118 million relating to hedging volatility and CHF 74 million relating to fair-valued money market instruments. The 2017 struc-tured notes volatility was predominately comprised of the positive impact of the enhancements in 3Q17 and 4Q17 to the valuation methodology relating to the instrument-specific credit risk on fair value option elected structured notes.
Capital metricsAs previously announced, following discussions with FINMA dur-ing 2017, we updated our loss history and implemented a revised methodology for the measurement of our risk-weighted assets relating to operational risk, primarily in respect of our RMBS set-tlements, which resulted in an increase of CHF 3.8 billion. This increase was partially offset by CHF 1.3 billion of movements in risk levels, primarily in credit risk.
Expense allocation to divisions in / end of % change in / end of % change
4Q17 3Q17 4Q16 QoQ YoY 2017 2016 YoY
Expense allocation to divisions (CHF million)
Compensation and benefits 660 671 719 (2) (8) 2,683 2,571 4
General and administrative expenses 851 603 771 41 10 2,642 2,978 (11)
Commission expenses 8 8 32 0 (75) 45 76 (41)
Restructuring expenses 73 26 24 181 204 158 166 (5)
Total other operating expenses 932 637 827 46 13 2,845 3,220 (12)
Total operating expenses before allocation to divisions 1,592 1,308 1,546 22 3 5,528 5,791 (5)
Net allocation to divisions 1,279 1,144 1,284 12 0 4,707 5,032 (6)
of which Swiss Universal Bank 261 254 279 3 (6) 1,010 1,021 (1)
of which International Wealth Management 243 192 210 27 16 816 789 3
of which Asia Pacific 185 183 161 1 15 738 669 10
of which Global Markets 418 374 444 12 (6) 1,524 1,732 (12)
of which Investment Banking & Capital Markets 93 71 72 31 29 320 279 15
of which Strategic Resolution Unit 79 70 118 13 (33) 299 542 (45)
Total operating expenses 313 164 262 91 19 821 759 8
Corporate services and business support, including in finance, operations, human resources, legal, compliance, risk management and IT, are provided by corporate functions, and the related costs are allocated to the segments and the Corporate Center based on their requirements and other relevant measures.
41Earnings Release 4Q17
Assets under management
Assets under managementAs of the end of 4Q17, assets under management were CHF 1,376.1 billion, 2.3% higher compared to the end of 3Q17 and 10.0% higher compared to the end of 4Q16. Net new assets were CHF 3.1 billion in 4Q17 and CHF 37.8 billion in 2017.
Assets under management end of % change
4Q17 3Q17 4Q16 QoQ YoY
Assets under management (CHF billion)
Swiss Universal Bank – Private Clients 208.3 206.1 192.2 1.1 8.4
Swiss Universal Bank – Corporate & Institutional Clients 354.7 346.7 339.3 2.3 4.5
International Wealth Management – Private Banking 366.9 355.3 323.2 3.3 13.5
International Wealth Management – Asset Management 385.6 376.3 321.6 2.5 19.9
Asia Pacific – Private Banking 196.8 190.0 166.9 3.6 17.9
Strategic Resolution Unit 5.0 5.9 13.7 (15.3) (63.5)
Assets managed across businesses 1 (141.2) (135.5) (105.8) 4.2 33.5
Assets under management 1,376.1 1,344.8 1,251.1 2.3 10.0
of which discretionary assets 452.5 446.0 404.3 1.5 11.9
of which advisory assets 923.6 898.8 846.8 2.8 9.1
1 Represents assets managed by Asset Management within International Wealth Management for the other businesses.
Net new assetsin 4Q17 3Q17 4Q16 2017 2016
Net new assets (CHF billion)
Swiss Universal Bank – Private Clients 0.0 1.0 (1.8) 4.7 0.1
Swiss Universal Bank – Corporate & Institutional Clients (0.2) (13.7) 0.8 (13.9) 2.5
International Wealth Managment – Private Banking 2.7 3.6 0.4 15.6 15.6
International Wealth Managment – Asset Management 1 1.4 1.1 (4.4) 20.3 5.6
Asia Pacific – Private Banking 1.3 5.8 0.7 16.9 13.6
Strategic Resolution Unit (0.5) (0.5) (2.9) (2.5) (8.5)
Assets managed across businesses 2 (1.6) 0.9 0.5 (3.3) (2.1)
Net new assets 3.1 (1.8) (6.7) 37.8 26.8
1 Includes outflows for private equity assets reflecting realizations at cost and unfunded commitments on which a fee is no longer earned.2 Represents assets managed by Asset Management within International Wealth Management for the other businesses.
4Q17 resultsAs of the end of 4Q17, assets under management of CHF 1,376.1 billion increased CHF 31.3 billion compared to the end of 3Q17. The increase was mainly driven by favorable market and foreign exchange-related movements and net new assets of CHF 3.1 billion.
Net new assets of CHF 3.1 billion in 4Q17 primarily reflected net new assets in the Private Banking business of International Wealth Management, mainly reflecting inflows from Europe, net new assets in the Asset Management business of International Wealth Management, primarily reflecting inflows from traditional investments and net new assets in the Private Banking business of Asia Pacific, primarily reflecting inflows from South East Asia.
2017 resultsAs of the end of 2017, assets under management were CHF 1,376.1 billion, an increase of CHF 125.0 billion compared to
the end of 2016. The increase was mainly driven by favorable mar-ket movements and net new assets of CHF 37.8 billion.
Net new assets of CHF 37.8 billion mainly reflected net new assets in the Asset Management business of International Wealth Management, primarily reflecting inflows from traditional and alter-native investments and from emerging market joint ventures, net new assets in the Private Banking business of Asia Pacific, reflect-ing inflows primarily from Greater China, South East Asia, Japan and Australia and net new assets in the Private Banking business of International Wealth Management, reflecting solid inflows from emerging markets and Europe. These inflows were partially off-set by net asset outflows in the Corporate & Institutional Clients business of Swiss Universal Bank primarily due to redemptions of CHF 13.3 billion from a single public sector mandate in 3Q17.u Refer to “Swiss Universal Bank”, “International Wealth Management” and “Asia Pacific” for further information.
42Earnings Release 4Q17
Additional financial metrics
AdditionalfinancialmetricsBalance sheetAs of the end of 4Q17, total assets of CHF 796.3 billion increased 1% compared to 3Q17, reflecting the foreign exchange translation impact and an increase in operating activities. Excluding the for-eign exchange translation impact, total assets increased CHF 2.7 billion.
Range of reasonably possible losses related to certain legal proceedings The Group’s estimate of the aggregate range of reasonably pos-sible losses that are not covered by existing provisions for certain proceedings for which the Group believes an estimate is possible was zero to CHF 1.3 billion as of the end of 4Q17.
Total shareholders’ equityCredit Suisse’s total shareholders’ equity decreased from CHF 43.9 billion as of the end of 3Q17 to CHF 41.9 billion as of the end of 4Q17. Total shareholders’ equity was negatively impacted by a net loss attributable to shareholders and by losses on fair value elected liabilities relating to credit risk, partially offset by an actuarial gain from the annual re-assessment of the Group’s defined benefit pension plan assets and liabilities, an increase in the share-based compensation obligation and foreign exchange-related movements on cumulative translation adjustments.
Liquidity coverage ratioOur average liquidity coverage ratio was 185% for 4Q17. The ratio reflects a conservative liquidity position, including ensuring that the Group’s branches and subsidiaries meet applicable local liquidity requirements.
Capital metricsThe CET1 ratio was 13.5% as of the end of 4Q17 compared to 14.0% as of the end of 3Q17, reflecting lower CET1 capital and higher risk-weighted assets. Credit Suisse’s tier 1 ratio was 18.9%
as of the end of 4Q17 compared to 19.4% as of the end of 3Q17. The total capital ratio was 20.8% as of the end of 4Q17 compared to 21.5% as of the end of 3Q17.
CET1 capital was CHF 36.7 billion as of the end of 4Q17 com-pared to CHF 37.3 billion as of the end of 3Q17, mainly reflecting a net loss attributable to shareholders, driven by the re-assessment impact on deferred tax assets resulting from the US tax reform. The decrease was partially offset by the regulatory adjustment of deferred tax assets, primarily resulting from the US tax reform.
Total eligible capital was CHF 56.7 billion as of the end of 4Q17 compared to CHF 57.2 billion as of the end of 3Q17, primar-ily reflecting decreases in CET1 capital and tier 2 capital.
Risk-weighted assets increased 2% to CHF 272.8 billion as of the end of 4Q17 compared to CHF 266.6 billion as of the end of 3Q17, mainly driven by methodology and policy changes, reflect-ing the updated loss history and the revised methodology for the measurement of our risk-weighted assets relating to operational risk, primarily in respect of our RMBS settlements, which resulted in an increase of CHF 3.8 billion in 4Q17, and a positive foreign exchange impact. These movements were partially offset by decreases in risk levels and model and parameter updates.
As of the end of 4Q17, the look-through CET1 ratio was 12.8% compared to 13.2% as of the end of 3Q17, reflecting higher risk-weighted assets, mainly resulting from the updated loss history and the revised methodology relating to operational risk.
Leverage metricsThe BIS tier 1 leverage ratio was 5.6% as of the end of 4Q17, with a BIS CET1 component of 4.0%. On a look-through basis, the BIS tier 1 leverage ratio was 5.2% as of the end of 4Q17, with a BIS CET1 component of 3.8%.
The look-through leverage exposure was CHF 916.5 billion as of the end of 4Q17 compared to CHF 909.0 billion as of the end of 3Q17.
BIS capital and leverage metrics Phase-in Look-through
end of 4Q17 3Q17 4Q16 4Q17 3Q17 4Q16
Capital metrics (%, except where indicated)
Risk-weighted assets (CHF billion) 272.8 266.6 271.4 271.7 265.0 268.0
CET1 ratio 13.5 14.0 13.5 12.8 13.2 11.5
Tier 1 ratio 18.9 19.4 18.0 17.4 17.8 15.6
Total capital ratio 20.8 21.5 20.5 18.9 19.4 17.4
Leverage metrics (%, except where indicated)
Leverage exposure (CHF billion) 919.1 912.0 957.1 916.5 909.0 950.8
CET1 leverage ratio 4.0 4.1 3.8 3.8 3.8 3.2
Tier 1 leverage ratio 5.6 5.7 5.1 5.2 5.2 4.4
Refer to the Appendix for additional information on BIS and Swiss capital and leverage metrics.
43Earnings Release 4Q17
Important information
Important informationThe Group has not finalized its 2017 Annual Report and the Group’s inde-pendent registered public accounting firm has not completed its audit of the consolidated financial statements for the period. Accordingly, the financial information contained in this Earnings Release is subject to completion of year-end procedures, which may result in changes to that information. Certain reclassifications have been made to prior periods to conform to the current presentation.
For purposes of this Earnings Release, unless the context otherwise requires, the terms “Credit Suisse”, “the Group”, “we”, “us” and “our” mean Credit Suisse Group AG and its consolidated subsidiaries. The business of Credit Suisse AG, the direct bank subsidiary of the Group, is substantially similar to the Group, and these terms are used to refer to both when the subject is the same or substantially similar. The term “the Bank” is used when referring to Credit Suisse AG and its consolidated subsidiaries.
Information referenced in this Earnings Release, whether via website links or otherwise, is not incorporated into this Earnings Release.
As of January 1, 2013, Basel III was implemented in Switzerland along with the Swiss “Too Big to Fail” legislation and regulations thereunder (Swiss Requirements) (in each case, subject to certain phase-in peri-ods). As of January 1, 2015, the BIS leverage ratio framework, as issued by BCBS, was implemented in Switzerland by FINMA. Our related dis-closures are in accordance with Credit Suisse’s interpretation of such requirements, including relevant assumptions. Changes in the interpre-tation of these requirements in Switzerland or in any of Credit Suisse’s assumptions or estimates could result in different numbers from those shown herein.
References to phase-in and look-through included herein refer to Basel III requirements and Swiss Requirements. Phase-in reflects that for the years 2014 – 2018, there will be a five-year (20% per annum) phase in of goodwill, other intangible assets and other capital deductions (e.g., certain deferred tax assets) and the phase-out of an adjustment for the account-ing treatment of pension plans and, for the years 2013 – 2022, there will be a phase out of certain capital instruments. Look-through assumes the full phase-in of goodwill and other intangible assets and other regulatory adjustments and the phase out of certain capital instruments.
Unless otherwise noted, leverage exposure is based on the BIS leverage ratio framework and consists of period-end balance sheet assets and prescribed regulatory adjustments. The look-through tier 1 leverage ratio and CET1 leverage ratio are calculated as look-through BIS tier 1 capital and CET1 capital, respectively, divided by period-end leverage exposure. Swiss leverage ratios are measured on the same period-end basis as the leverage exposure for the BIS leverage ratio.
Return on regulatory capital is calculated using income/(loss) after tax and assumes a tax rate of 30% and capital allocated based on the worst of 10% of average risk-weighted assets and 3.5% of average leverage exposure. For Global Markets and Investment Banking & Capital Markets, return on regulatory capital is based on US dollar denominated numbers. Adjusted return on regulatory capital is calculated using adjusted results, applying the same methodology to calculate return on regulatory capital.
We may not achieve all of the expected benefits of our strategic initia-tives. Factors beyond our control, including but not limited to the market and economic conditions, changes in laws, rules or regulations and other challenges discussed in our public filings, could limit our ability to achieve some or all of the expected benefits of these initiatives.
The Group’s estimate of the aggregate range of reasonably possible losses that are not covered by existing provisions which is discussed above relates only to those proceedings for which the Group believes an estimate is possible and which are discussed in the litigation note to the Consolidated Financial Statements in the Group’s Annual Report on Form 20-F and updated in its quarterly reports and to be updated in the Group’s Annual Report on Form 20-F that is scheduled to be released on March 23, 2018. It is inherently difficult to determine whether a loss is probable or even reasonably possible or to estimate the amount of any loss or loss range for many of the Group’s legal proceedings. The Group’s aggregate litigation provisions include estimates of losses, addi-tional losses or ranges of loss for proceedings for which such losses are probable and can be reasonably estimated. The Group does not believe that it can estimate an aggregate range of reasonably possible losses for certain of its proceedings because of their complexity, the novelty of some of the claims, the early stage of the proceedings, the limited amount of discovery that has occurred and/or other factors. For additional details, see the litigation note to the Consolidated Financial Statements in the Group’s Annual Report on Form 20-F and in each of its quarterly Financial Reports.
Investors and others should note that we announce material information (including quarterly earnings releases and financial reports) to the investing public using press releases, SEC and Swiss ad hoc filings, our website and public conference calls and webcasts. We intend to also use our Twitter account @creditsuisse (https://twitter.com/creditsuisse) to excerpt key messages from our public disclosures, including earnings releases. We may retweet such messages through certain of our regional Twitter accounts, including @csschweiz (https://twitter.com/csschweiz) and @csapac (https://twitter.com/csapac). Investors and others should take care to consider such abbreviated messages in the context of the disclosures from which they are excerpted. The information we post on these Twitter accounts is not a part of this Earnings Release.
In various tables, use of “–” indicates not meaningful or not applicable.
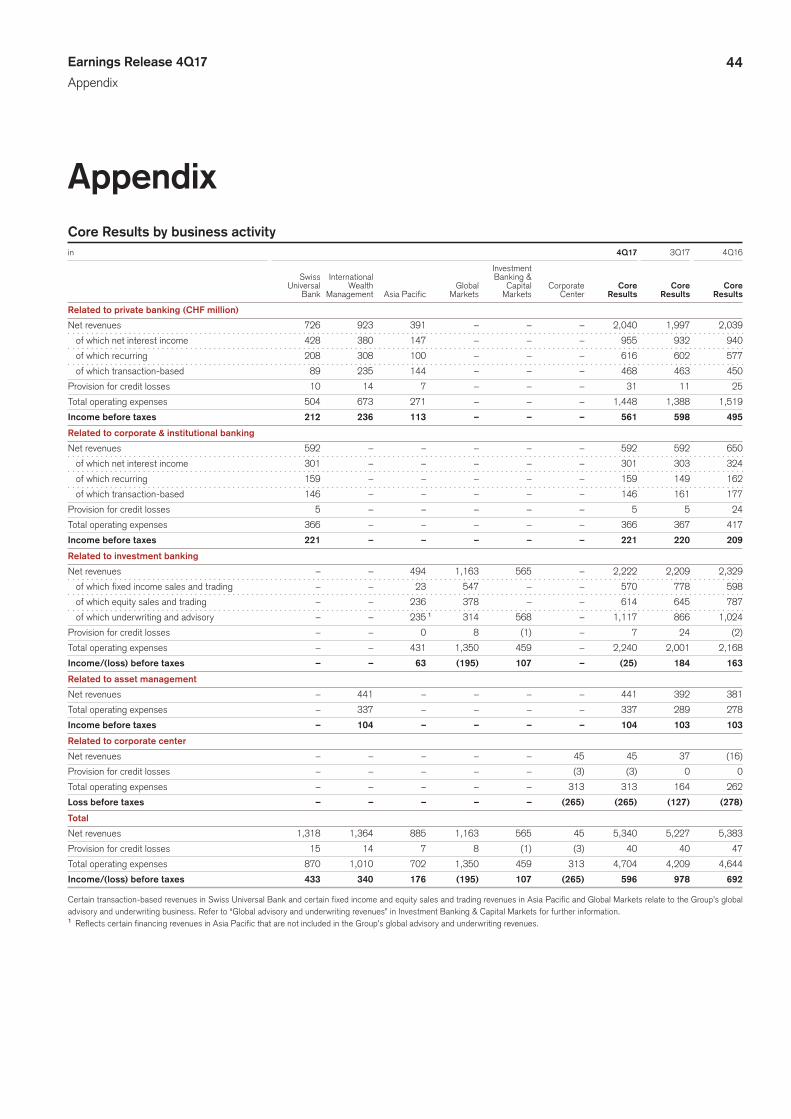
44Earnings Release 4Q17
Appendix
AppendixCore Results by business activity
in 4Q17 3Q17 4Q16
Investment Swiss International Banking & Universal Wealth Global Capital Corporate Core Core Core Bank Management Asia Pacific Markets Markets Center Results Results Results
Related to private banking (CHF million)
Net revenues 726 923 391 – – – 2,040 1,997 2,039
of which net interest income 428 380 147 – – – 955 932 940
of which recurring 208 308 100 – – – 616 602 577
of which transaction-based 89 235 144 – – – 468 463 450
Provision for credit losses 10 14 7 – – – 31 11 25
Total operating expenses 504 673 271 – – – 1,448 1,388 1,519
Income before taxes 212 236 113 – – – 561 598 495
Related to corporate & institutional banking
Net revenues 592 – – – – – 592 592 650
of which net interest income 301 – – – – – 301 303 324
of which recurring 159 – – – – – 159 149 162
of which transaction-based 146 – – – – – 146 161 177
Provision for credit losses 5 – – – – – 5 5 24
Total operating expenses 366 – – – – – 366 367 417
Income before taxes 221 – – – – – 221 220 209
Related to investment banking
Net revenues – – 494 1,163 565 – 2,222 2,209 2,329
of which fixed income sales and trading – – 23 547 – – 570 778 598
of which equity sales and trading – – 236 378 – – 614 645 787
of which underwriting and advisory – – 235 1 314 568 – 1,117 866 1,024
Provision for credit losses – – 0 8 (1) – 7 24 (2)
Total operating expenses – – 431 1,350 459 – 2,240 2,001 2,168
Income/(loss) before taxes – – 63 (195) 107 – (25) 184 163
Related to asset management
Net revenues – 441 – – – – 441 392 381
Total operating expenses – 337 – – – – 337 289 278
Income before taxes – 104 – – – – 104 103 103
Related to corporate center
Net revenues – – – – – 45 45 37 (16)
Provision for credit losses – – – – – (3) (3) 0 0
Total operating expenses – – – – – 313 313 164 262
Loss before taxes – – – – – (265) (265) (127) (278)
Total
Net revenues 1,318 1,364 885 1,163 565 45 5,340 5,227 5,383
Provision for credit losses 15 14 7 8 (1) (3) 40 40 47
Total operating expenses 870 1,010 702 1,350 459 313 4,704 4,209 4,644
Income/(loss) before taxes 433 340 176 (195) 107 (265) 596 978 692
Certain transaction-based revenues in Swiss Universal Bank and certain fixed income and equity sales and trading revenues in Asia Pacific and Global Markets relate to the Group’s global advisory and underwriting business. Refer to “Global advisory and underwriting revenues” in Investment Banking & Capital Markets for further information.1 Reflects certain financing revenues in Asia Pacific that are not included in the Group’s global advisory and underwriting revenues.
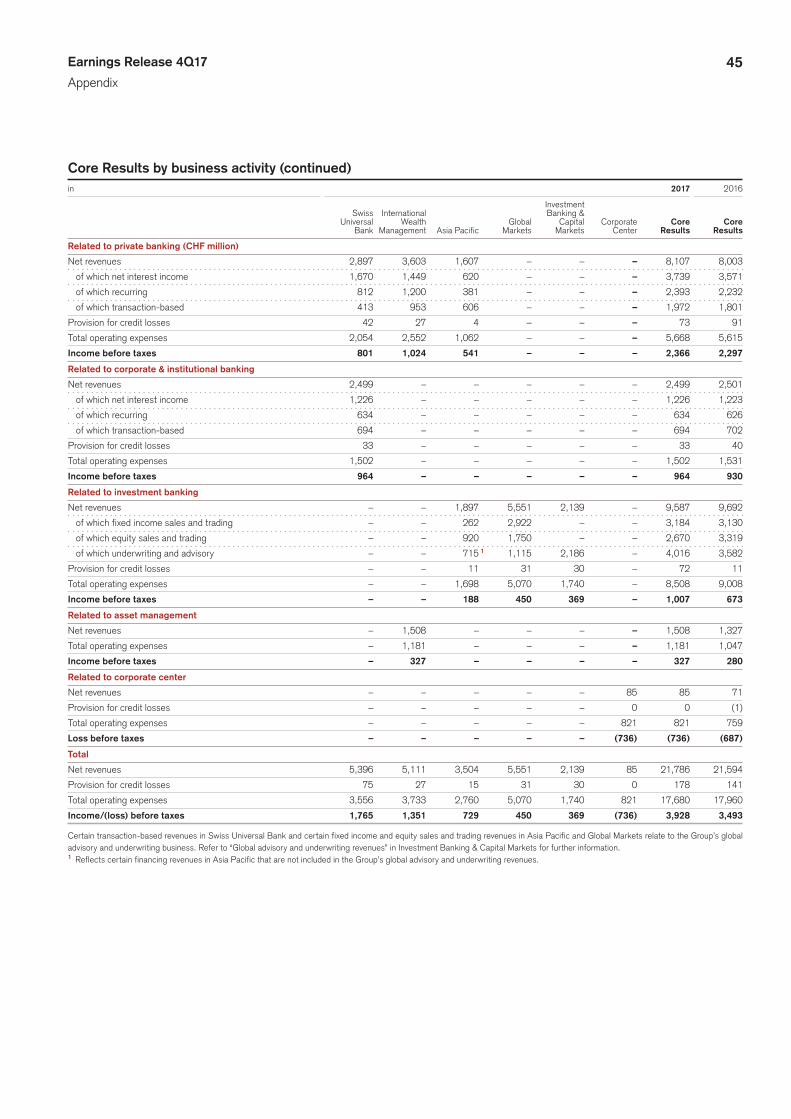
45Earnings Release 4Q17
Appendix
Core Results by business activity (continued)
in 2017 2016
Investment Swiss International Banking & Universal Wealth Global Capital Corporate Core Core Bank Management Asia Pacific Markets Markets Center Results Results
Related to private banking (CHF million)
Net revenues 2,897 3,603 1,607 – – – 8,107 8,003
of which net interest income 1,670 1,449 620 – – – 3,739 3,571
of which recurring 812 1,200 381 – – – 2,393 2,232
of which transaction-based 413 953 606 – – – 1,972 1,801
Provision for credit losses 42 27 4 – – – 73 91
Total operating expenses 2,054 2,552 1,062 – – – 5,668 5,615
Income before taxes 801 1,024 541 – – – 2,366 2,297
Related to corporate & institutional banking
Net revenues 2,499 – – – – – 2,499 2,501
of which net interest income 1,226 – – – – – 1,226 1,223
of which recurring 634 – – – – – 634 626
of which transaction-based 694 – – – – – 694 702
Provision for credit losses 33 – – – – – 33 40
Total operating expenses 1,502 – – – – – 1,502 1,531
Income before taxes 964 – – – – – 964 930
Related to investment banking
Net revenues – – 1,897 5,551 2,139 – 9,587 9,692
of which fixed income sales and trading – – 262 2,922 – – 3,184 3,130
of which equity sales and trading – – 920 1,750 – – 2,670 3,319
of which underwriting and advisory – – 715 1 1,115 2,186 – 4,016 3,582
Provision for credit losses – – 11 31 30 – 72 11
Total operating expenses – – 1,698 5,070 1,740 – 8,508 9,008
Income before taxes – – 188 450 369 – 1,007 673
Related to asset management
Net revenues – 1,508 – – – – 1,508 1,327
Total operating expenses – 1,181 – – – – 1,181 1,047
Income before taxes – 327 – – – – 327 280
Related to corporate center
Net revenues – – – – – 85 85 71
Provision for credit losses – – – – – 0 0 (1)
Total operating expenses – – – – – 821 821 759
Loss before taxes – – – – – (736) (736) (687)
Total
Net revenues 5,396 5,111 3,504 5,551 2,139 85 21,786 21,594
Provision for credit losses 75 27 15 31 30 0 178 141
Total operating expenses 3,556 3,733 2,760 5,070 1,740 821 17,680 17,960
Income/(loss) before taxes 1,765 1,351 729 450 369 (736) 3,928 3,493
Certain transaction-based revenues in Swiss Universal Bank and certain fixed income and equity sales and trading revenues in Asia Pacific and Global Markets relate to the Group’s global advisory and underwriting business. Refer to “Global advisory and underwriting revenues” in Investment Banking & Capital Markets for further information.1 Reflects certain financing revenues in Asia Pacific that are not included in the Group’s global advisory and underwriting revenues.
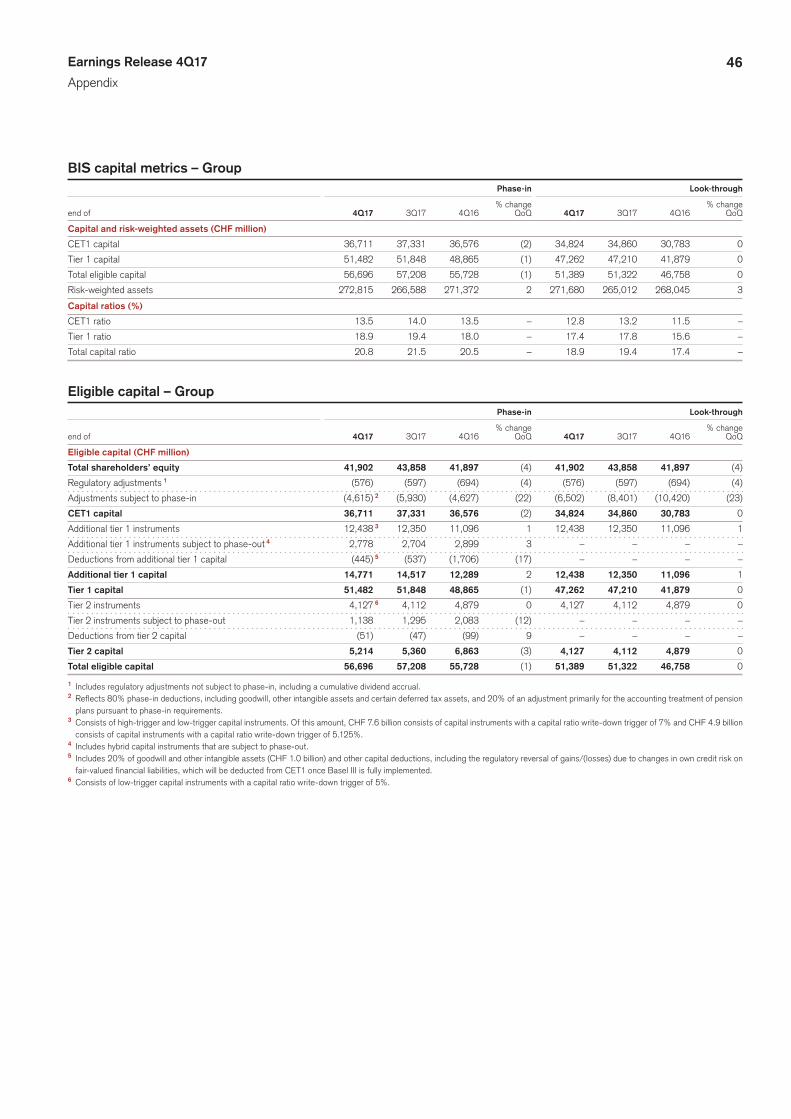
46Earnings Release 4Q17
Appendix
BIS capital metrics – Group Phase-in Look-through
% change % change
end of 4Q17 3Q17 4Q16 QoQ 4Q17 3Q17 4Q16 QoQ
Capital and risk-weighted assets (CHF million)
CET1 capital 36,711 37,331 36,576 (2) 34,824 34,860 30,783 0
Tier 1 capital 51,482 51,848 48,865 (1) 47,262 47,210 41,879 0
Total eligible capital 56,696 57,208 55,728 (1) 51,389 51,322 46,758 0
Risk-weighted assets 272,815 266,588 271,372 2 271,680 265,012 268,045 3
Capital ratios (%)
CET1 ratio 13.5 14.0 13.5 – 12.8 13.2 11.5 –
Tier 1 ratio 18.9 19.4 18.0 – 17.4 17.8 15.6 –
Total capital ratio 20.8 21.5 20.5 – 18.9 19.4 17.4 –
Eligible capital – Group Phase-in Look-through
% change % change
end of 4Q17 3Q17 4Q16 QoQ 4Q17 3Q17 4Q16 QoQ
Eligible capital (CHF million)
Total shareholders’ equity 41,902 43,858 41,897 (4) 41,902 43,858 41,897 (4)
Regulatory adjustments 1 (576) (597) (694) (4) (576) (597) (694) (4)
Adjustments subject to phase-in (4,615) 2 (5,930) (4,627) (22) (6,502) (8,401) (10,420) (23)
CET1 capital 36,711 37,331 36,576 (2) 34,824 34,860 30,783 0
Additional tier 1 instruments 12,438 3 12,350 11,096 1 12,438 12,350 11,096 1
Additional tier 1 instruments subject to phase-out 4 2,778 2,704 2,899 3 – – – –
Deductions from additional tier 1 capital (445) 5 (537) (1,706) (17) – – – –
Additional tier 1 capital 14,771 14,517 12,289 2 12,438 12,350 11,096 1
Tier 1 capital 51,482 51,848 48,865 (1) 47,262 47,210 41,879 0
Tier 2 instruments 4,127 6 4,112 4,879 0 4,127 4,112 4,879 0
Tier 2 instruments subject to phase-out 1,138 1,295 2,083 (12) – – – –
Deductions from tier 2 capital (51) (47) (99) 9 – – – –
Tier 2 capital 5,214 5,360 6,863 (3) 4,127 4,112 4,879 0
Total eligible capital 56,696 57,208 55,728 (1) 51,389 51,322 46,758 0
1 Includes regulatory adjustments not subject to phase-in, including a cumulative dividend accrual.2 Reflects 80% phase-in deductions, including goodwill, other intangible assets and certain deferred tax assets, and 20% of an adjustment primarily for the accounting treatment of pension
plans pursuant to phase-in requirements.3 Consists of high-trigger and low-trigger capital instruments. Of this amount, CHF 7.6 billion consists of capital instruments with a capital ratio write-down trigger of 7% and CHF 4.9 billion
consists of capital instruments with a capital ratio write-down trigger of 5.125%.4 Includes hybrid capital instruments that are subject to phase-out.5 Includes 20% of goodwill and other intangible assets (CHF 1.0 billion) and other capital deductions, including the regulatory reversal of gains/(losses) due to changes in own credit risk on
fair-valued financial liabilities, which will be deducted from CET1 once Basel III is fully implemented.6 Consists of low-trigger capital instruments with a capital ratio write-down trigger of 5%.
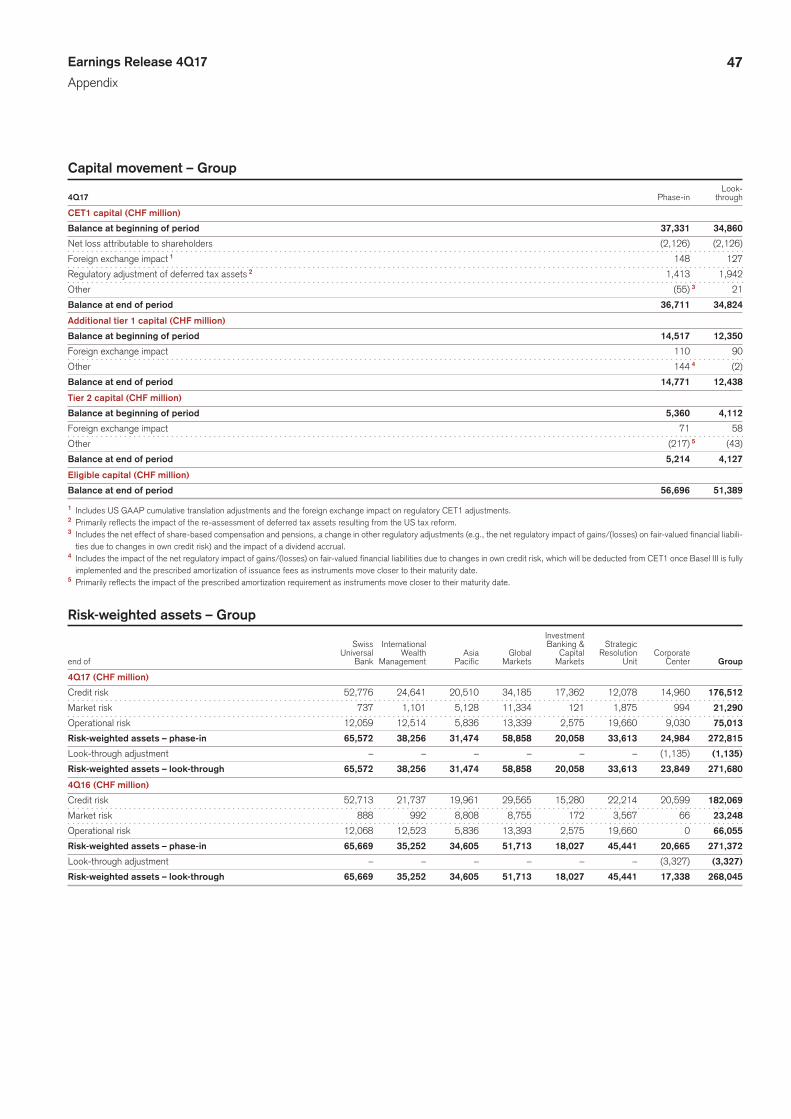
47Earnings Release 4Q17
Appendix
Capital movement – Group Look-
4Q17 Phase-in through
CET1 capital (CHF million)
Balance at beginning of period 37,331 34,860
Net loss attributable to shareholders (2,126) (2,126)
Foreign exchange impact 1 148 127
Regulatory adjustment of deferred tax assets 2 1,413 1,942
Other (55) 3 21
Balance at end of period 36,711 34,824
Additional tier 1 capital (CHF million)
Balance at beginning of period 14,517 12,350
Foreign exchange impact 110 90
Other 144 4 (2)
Balance at end of period 14,771 12,438
Tier 2 capital (CHF million)
Balance at beginning of period 5,360 4,112
Foreign exchange impact 71 58
Other (217) 5 (43)
Balance at end of period 5,214 4,127
Eligible capital (CHF million)
Balance at end of period 56,696 51,389
1 Includes US GAAP cumulative translation adjustments and the foreign exchange impact on regulatory CET1 adjustments.2 Primarily reflects the impact of the re-assessment of deferred tax assets resulting from the US tax reform.3 Includes the net effect of share-based compensation and pensions, a change in other regulatory adjustments (e.g., the net regulatory impact of gains/(losses) on fair-valued financial liabili-
ties due to changes in own credit risk) and the impact of a dividend accrual.4 Includes the impact of the net regulatory impact of gains/(losses) on fair-valued financial liabilities due to changes in own credit risk, which will be deducted from CET1 once Basel III is fully
implemented and the prescribed amortization of issuance fees as instruments move closer to their maturity date.5 Primarily reflects the impact of the prescribed amortization requirement as instruments move closer to their maturity date.
Risk-weighted assets – Group Investment Swiss International Banking & Strategic Universal Wealth Asia Global Capital Resolution Corporate
end of Bank Management Pacific Markets Markets Unit Center Group
4Q17 (CHF million)
Credit risk 52,776 24,641 20,510 34,185 17,362 12,078 14,960 176,512
Market risk 737 1,101 5,128 11,334 121 1,875 994 21,290
Operational risk 12,059 12,514 5,836 13,339 2,575 19,660 9,030 75,013
Risk-weighted assets – phase-in 65,572 38,256 31,474 58,858 20,058 33,613 24,984 272,815
Look-through adjustment – – – – – – (1,135) (1,135)
Risk-weighted assets – look-through 65,572 38,256 31,474 58,858 20,058 33,613 23,849 271,680
4Q16 (CHF million)
Credit risk 52,713 21,737 19,961 29,565 15,280 22,214 20,599 182,069
Market risk 888 992 8,808 8,755 172 3,567 66 23,248
Operational risk 12,068 12,523 5,836 13,393 2,575 19,660 0 66,055
Risk-weighted assets – phase-in 65,669 35,252 34,605 51,713 18,027 45,441 20,665 271,372
Look-through adjustment – – – – – – (3,327) (3,327)
Risk-weighted assets – look-through 65,669 35,252 34,605 51,713 18,027 45,441 17,338 268,045
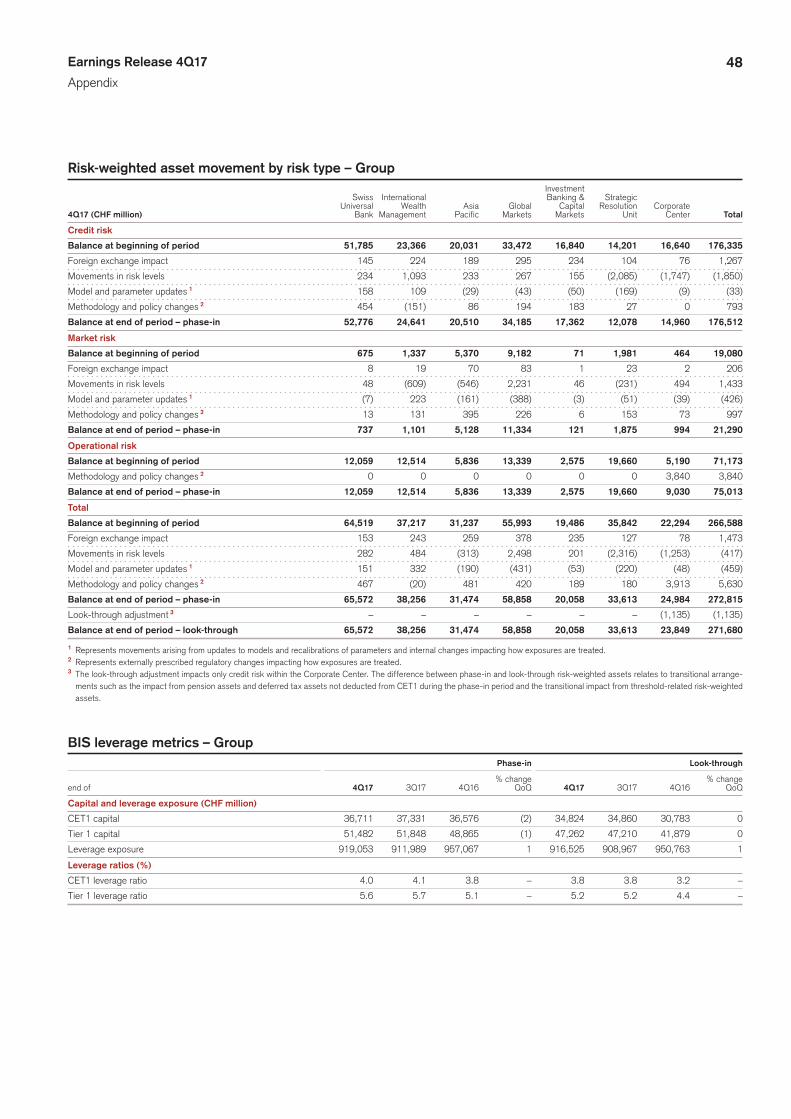
48Earnings Release 4Q17
Appendix
Risk-weighted asset movement by risk type – Group Investment Swiss International Banking & Strategic Universal Wealth Asia Global Capital Resolution Corporate
4Q17 (CHF million) Bank Management Pacific Markets Markets Unit Center Total
Credit risk
Balance at beginning of period 51,785 23,366 20,031 33,472 16,840 14,201 16,640 176,335
Foreign exchange impact 145 224 189 295 234 104 76 1,267
Movements in risk levels 234 1,093 233 267 155 (2,085) (1,747) (1,850)
Model and parameter updates 1 158 109 (29) (43) (50) (169) (9) (33)
Methodology and policy changes 2 454 (151) 86 194 183 27 0 793
Balance at end of period – phase-in 52,776 24,641 20,510 34,185 17,362 12,078 14,960 176,512
Market risk
Balance at beginning of period 675 1,337 5,370 9,182 71 1,981 464 19,080
Foreign exchange impact 8 19 70 83 1 23 2 206
Movements in risk levels 48 (609) (546) 2,231 46 (231) 494 1,433
Model and parameter updates 1 (7) 223 (161) (388) (3) (51) (39) (426)
Methodology and policy changes 2 13 131 395 226 6 153 73 997
Balance at end of period – phase-in 737 1,101 5,128 11,334 121 1,875 994 21,290
Operational risk
Balance at beginning of period 12,059 12,514 5,836 13,339 2,575 19,660 5,190 71,173
Methodology and policy changes 2 0 0 0 0 0 0 3,840 3,840
Balance at end of period – phase-in 12,059 12,514 5,836 13,339 2,575 19,660 9,030 75,013
Total
Balance at beginning of period 64,519 37,217 31,237 55,993 19,486 35,842 22,294 266,588
Foreign exchange impact 153 243 259 378 235 127 78 1,473
Movements in risk levels 282 484 (313) 2,498 201 (2,316) (1,253) (417)
Model and parameter updates 1 151 332 (190) (431) (53) (220) (48) (459)
Methodology and policy changes 2 467 (20) 481 420 189 180 3,913 5,630
Balance at end of period – phase-in 65,572 38,256 31,474 58,858 20,058 33,613 24,984 272,815
Look-through adjustment 3 – – – – – – (1,135) (1,135)
Balance at end of period – look-through 65,572 38,256 31,474 58,858 20,058 33,613 23,849 271,680
1 Represents movements arising from updates to models and recalibrations of parameters and internal changes impacting how exposures are treated.2 Represents externally prescribed regulatory changes impacting how exposures are treated.3 The look-through adjustment impacts only credit risk within the Corporate Center. The difference between phase-in and look-through risk-weighted assets relates to transitional arrange-
ments such as the impact from pension assets and deferred tax assets not deducted from CET1 during the phase-in period and the transitional impact from threshold-related risk-weighted assets.
BIS leverage metrics – Group Phase-in Look-through
% change % change
end of 4Q17 3Q17 4Q16 QoQ 4Q17 3Q17 4Q16 QoQ
Capital and leverage exposure (CHF million)
CET1 capital 36,711 37,331 36,576 (2) 34,824 34,860 30,783 0
Tier 1 capital 51,482 51,848 48,865 (1) 47,262 47,210 41,879 0
Leverage exposure 919,053 911,989 957,067 1 916,525 908,967 950,763 1
Leverage ratios (%)
CET1 leverage ratio 4.0 4.1 3.8 – 3.8 3.8 3.2 –
Tier 1 leverage ratio 5.6 5.7 5.1 – 5.2 5.2 4.4 –
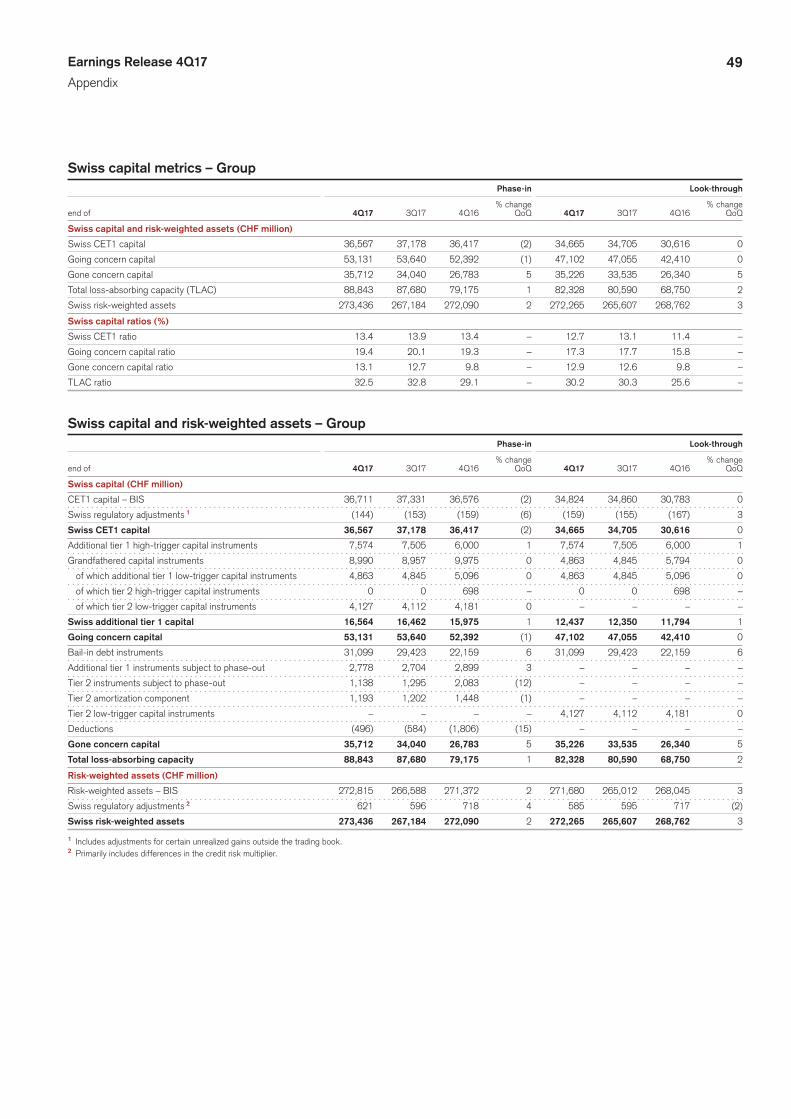
49Earnings Release 4Q17
Appendix
Swiss capital metrics – Group Phase-in Look-through
% change % change
end of 4Q17 3Q17 4Q16 QoQ 4Q17 3Q17 4Q16 QoQ
Swiss capital and risk-weighted assets (CHF million)
Swiss CET1 capital 36,567 37,178 36,417 (2) 34,665 34,705 30,616 0
Going concern capital 53,131 53,640 52,392 (1) 47,102 47,055 42,410 0
Gone concern capital 35,712 34,040 26,783 5 35,226 33,535 26,340 5
Total loss-absorbing capacity (TLAC) 88,843 87,680 79,175 1 82,328 80,590 68,750 2
Swiss risk-weighted assets 273,436 267,184 272,090 2 272,265 265,607 268,762 3
Swiss capital ratios (%)
Swiss CET1 ratio 13.4 13.9 13.4 – 12.7 13.1 11.4 –
Going concern capital ratio 19.4 20.1 19.3 – 17.3 17.7 15.8 –
Gone concern capital ratio 13.1 12.7 9.8 – 12.9 12.6 9.8 –
TLAC ratio 32.5 32.8 29.1 – 30.2 30.3 25.6 –
Swiss capital and risk-weighted assets – Group Phase-in Look-through
% change % change
end of 4Q17 3Q17 4Q16 QoQ 4Q17 3Q17 4Q16 QoQ
Swiss capital (CHF million)
CET1 capital – BIS 36,711 37,331 36,576 (2) 34,824 34,860 30,783 0
Swiss regulatory adjustments 1 (144) (153) (159) (6) (159) (155) (167) 3
Swiss CET1 capital 36,567 37,178 36,417 (2) 34,665 34,705 30,616 0
Additional tier 1 high-trigger capital instruments 7,574 7,505 6,000 1 7,574 7,505 6,000 1
Grandfathered capital instruments 8,990 8,957 9,975 0 4,863 4,845 5,794 0
of which additional tier 1 low-trigger capital instruments 4,863 4,845 5,096 0 4,863 4,845 5,096 0
of which tier 2 high-trigger capital instruments 0 0 698 – 0 0 698 –
of which tier 2 low-trigger capital instruments 4,127 4,112 4,181 0 – – – –
Swiss additional tier 1 capital 16,564 16,462 15,975 1 12,437 12,350 11,794 1
Going concern capital 53,131 53,640 52,392 (1) 47,102 47,055 42,410 0
Bail-in debt instruments 31,099 29,423 22,159 6 31,099 29,423 22,159 6
Additional tier 1 instruments subject to phase-out 2,778 2,704 2,899 3 – – – –
Tier 2 instruments subject to phase-out 1,138 1,295 2,083 (12) – – – –
Tier 2 amortization component 1,193 1,202 1,448 (1) – – – –
Tier 2 low-trigger capital instruments – – – – 4,127 4,112 4,181 0
Deductions (496) (584) (1,806) (15) – – – –
Gone concern capital 35,712 34,040 26,783 5 35,226 33,535 26,340 5
Total loss-absorbing capacity 88,843 87,680 79,175 1 82,328 80,590 68,750 2
Risk-weighted assets (CHF million)
Risk-weighted assets – BIS 272,815 266,588 271,372 2 271,680 265,012 268,045 3
Swiss regulatory adjustments 2 621 596 718 4 585 595 717 (2)
Swiss risk-weighted assets 273,436 267,184 272,090 2 272,265 265,607 268,762 3
1 Includes adjustments for certain unrealized gains outside the trading book.2 Primarily includes differences in the credit risk multiplier.
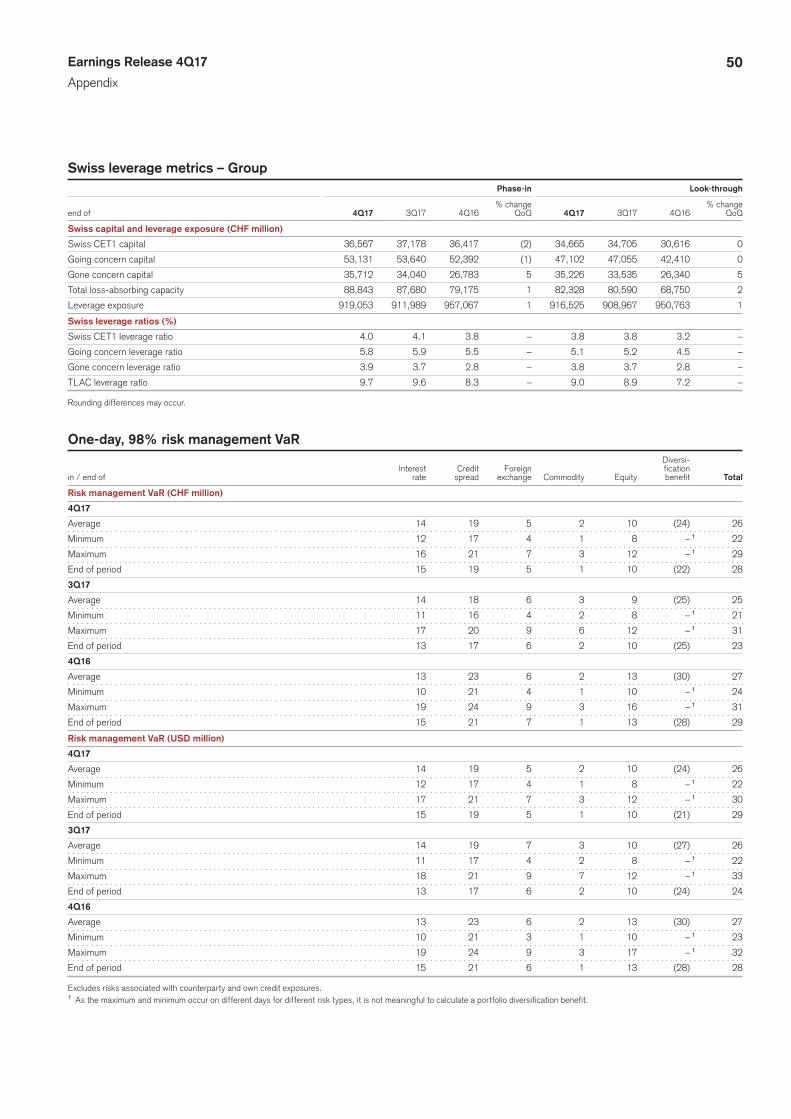
50Earnings Release 4Q17
Appendix
Swiss leverage metrics – Group Phase-in Look-through
% change % change
end of 4Q17 3Q17 4Q16 QoQ 4Q17 3Q17 4Q16 QoQ
Swiss capital and leverage exposure (CHF million)
Swiss CET1 capital 36,567 37,178 36,417 (2) 34,665 34,705 30,616 0
Going concern capital 53,131 53,640 52,392 (1) 47,102 47,055 42,410 0
Gone concern capital 35,712 34,040 26,783 5 35,226 33,535 26,340 5
Total loss-absorbing capacity 88,843 87,680 79,175 1 82,328 80,590 68,750 2
Leverage exposure 919,053 911,989 957,067 1 916,525 908,967 950,763 1
Swiss leverage ratios (%)
Swiss CET1 leverage ratio 4.0 4.1 3.8 – 3.8 3.8 3.2 –
Going concern leverage ratio 5.8 5.9 5.5 – 5.1 5.2 4.5 –
Gone concern leverage ratio 3.9 3.7 2.8 – 3.8 3.7 2.8 –
TLAC leverage ratio 9.7 9.6 8.3 – 9.0 8.9 7.2 –
Rounding differences may occur.
One-day, 98% risk management VaR Diversi- Interest Credit Foreign fication
in / end of rate spread exchange Commodity Equity benefit Total
Risk management VaR (CHF million)
4Q17
Average 14 19 5 2 10 (24) 26
Minimum 12 17 4 1 8 – 1 22
Maximum 16 21 7 3 12 – 1 29
End of period 15 19 5 1 10 (22) 28
3Q17
Average 14 18 6 3 9 (25) 25
Minimum 11 16 4 2 8 – 1 21
Maximum 17 20 9 6 12 – 1 31
End of period 13 17 6 2 10 (25) 23
4Q16
Average 13 23 6 2 13 (30) 27
Minimum 10 21 4 1 10 – 1 24
Maximum 19 24 9 3 16 – 1 31
End of period 15 21 7 1 13 (28) 29
Risk management VaR (USD million)
4Q17
Average 14 19 5 2 10 (24) 26
Minimum 12 17 4 1 8 – 1 22
Maximum 17 21 7 3 12 – 1 30
End of period 15 19 5 1 10 (21) 29
3Q17
Average 14 19 7 3 10 (27) 26
Minimum 11 17 4 2 8 – 1 22
Maximum 18 21 9 7 12 – 1 33
End of period 13 17 6 2 10 (24) 24
4Q16
Average 13 23 6 2 13 (30) 27
Minimum 10 21 3 1 10 – 1 23
Maximum 19 24 9 3 17 – 1 32
End of period 15 21 6 1 13 (28) 28
Excludes risks associated with counterparty and own credit exposures.1 As the maximum and minimum occur on different days for different risk types, it is not meaningful to calculate a portfolio diversification benefit.
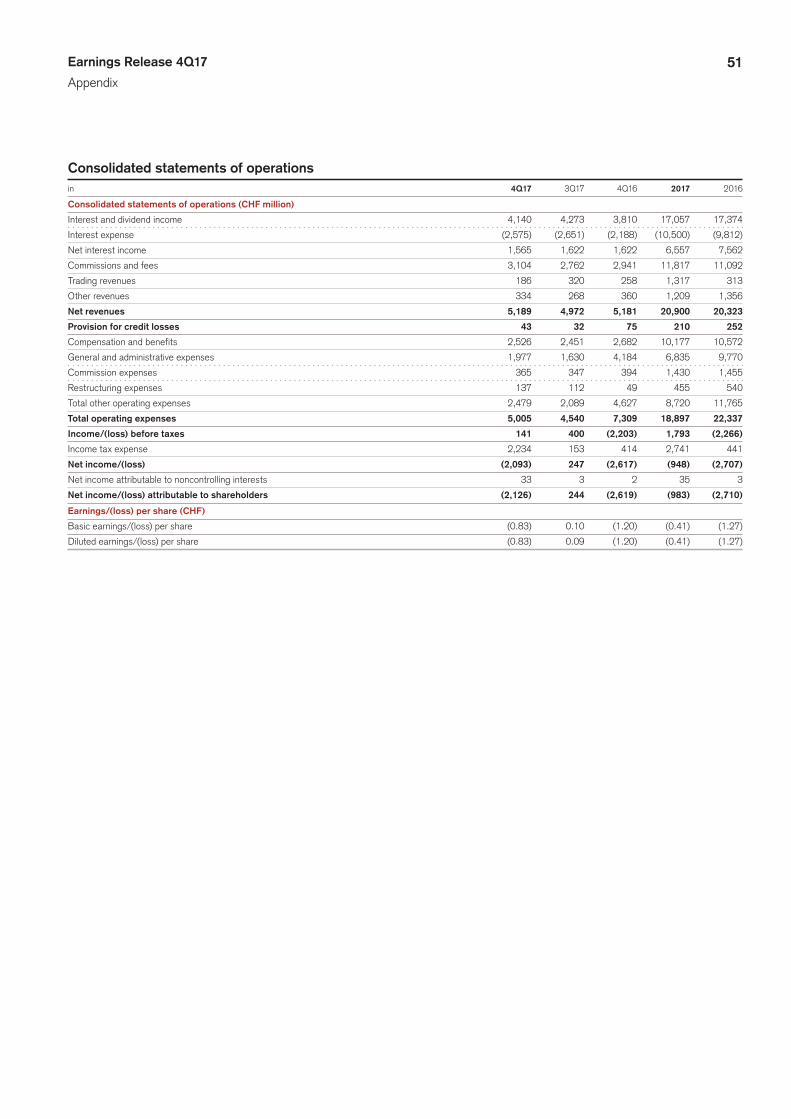
51Earnings Release 4Q17
Appendix
Consolidated statements of operations in 4Q17 3Q17 4Q16 2017 2016
Consolidated statements of operations (CHF million)
Interest and dividend income 4,140 4,273 3,810 17,057 17,374
Interest expense (2,575) (2,651) (2,188) (10,500) (9,812)
Net interest income 1,565 1,622 1,622 6,557 7,562
Commissions and fees 3,104 2,762 2,941 11,817 11,092
Trading revenues 186 320 258 1,317 313
Other revenues 334 268 360 1,209 1,356
Net revenues 5,189 4,972 5,181 20,900 20,323
Provision for credit losses 43 32 75 210 252
Compensation and benefits 2,526 2,451 2,682 10,177 10,572
General and administrative expenses 1,977 1,630 4,184 6,835 9,770
Commission expenses 365 347 394 1,430 1,455
Restructuring expenses 137 112 49 455 540
Total other operating expenses 2,479 2,089 4,627 8,720 11,765
Total operating expenses 5,005 4,540 7,309 18,897 22,337
Income/(loss) before taxes 141 400 (2,203) 1,793 (2,266)
Income tax expense 2,234 153 414 2,741 441
Net income/(loss) (2,093) 247 (2,617) (948) (2,707)
Net income attributable to noncontrolling interests 33 3 2 35 3
Net income/(loss) attributable to shareholders (2,126) 244 (2,619) (983) (2,710)
Earnings/(loss) per share (CHF)
Basic earnings/(loss) per share (0.83) 0.10 (1.20) (0.41) (1.27)
Diluted earnings/(loss) per share (0.83) 0.09 (1.20) (0.41) (1.27)
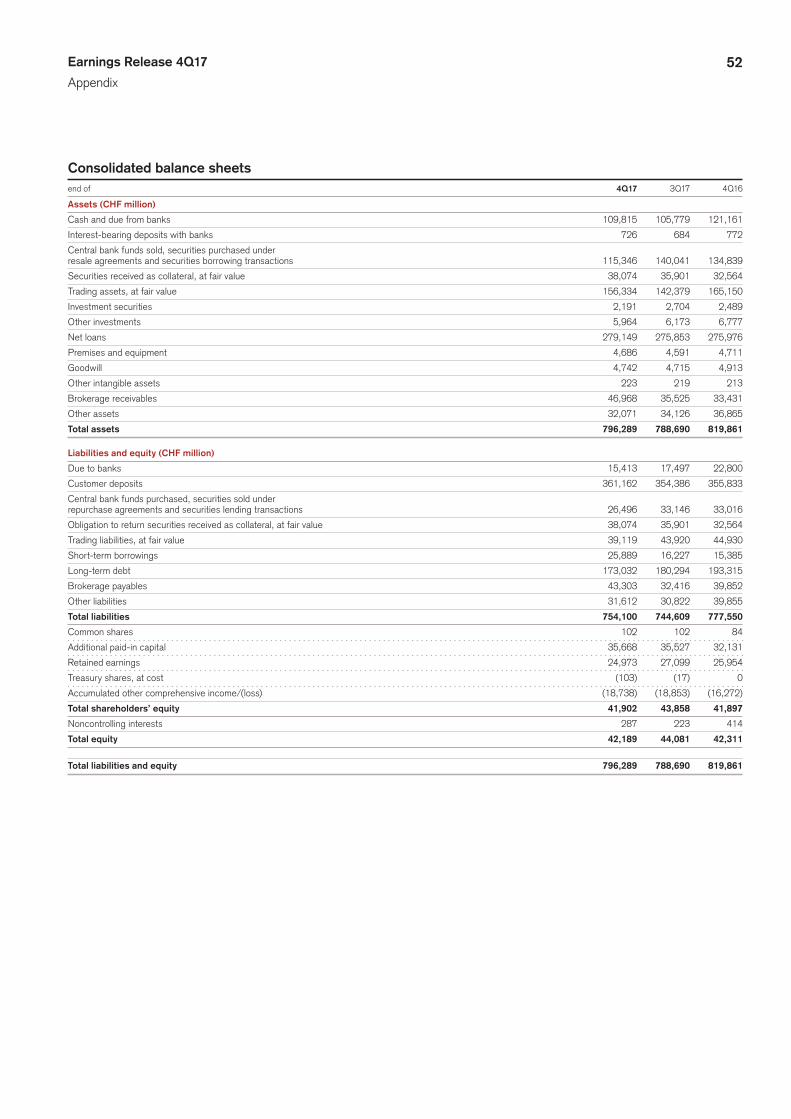
52Earnings Release 4Q17
Appendix
Consolidated balance sheetsend of 4Q17 3Q17 4Q16
Assets (CHF million)
Cash and due from banks 109,815 105,779 121,161
Interest-bearing deposits with banks 726 684 772
Central bank funds sold, securities purchased under
resale agreements and securities borrowing transactions 115,346 140,041 134,839
Securities received as collateral, at fair value 38,074 35,901 32,564
Trading assets, at fair value 156,334 142,379 165,150
Investment securities 2,191 2,704 2,489
Other investments 5,964 6,173 6,777
Net loans 279,149 275,853 275,976
Premises and equipment 4,686 4,591 4,711
Goodwill 4,742 4,715 4,913
Other intangible assets 223 219 213
Brokerage receivables 46,968 35,525 33,431
Other assets 32,071 34,126 36,865
Total assets 796,289 788,690 819,861
Liabilities and equity (CHF million)
Due to banks 15,413 17,497 22,800
Customer deposits 361,162 354,386 355,833
Central bank funds purchased, securities sold under
repurchase agreements and securities lending transactions 26,496 33,146 33,016
Obligation to return securities received as collateral, at fair value 38,074 35,901 32,564
Trading liabilities, at fair value 39,119 43,920 44,930
Short-term borrowings 25,889 16,227 15,385
Long-term debt 173,032 180,294 193,315
Brokerage payables 43,303 32,416 39,852
Other liabilities 31,612 30,822 39,855
Total liabilities 754,100 744,609 777,550
Common shares 102 102 84
Additional paid-in capital 35,668 35,527 32,131
Retained earnings 24,973 27,099 25,954
Treasury shares, at cost (103) (17) 0
Accumulated other comprehensive income/(loss) (18,738) (18,853) (16,272)
Total shareholders’ equity 41,902 43,858 41,897
Noncontrolling interests 287 223 414
Total equity 42,189 44,081 42,311
Total liabilities and equity 796,289 788,690 819,861
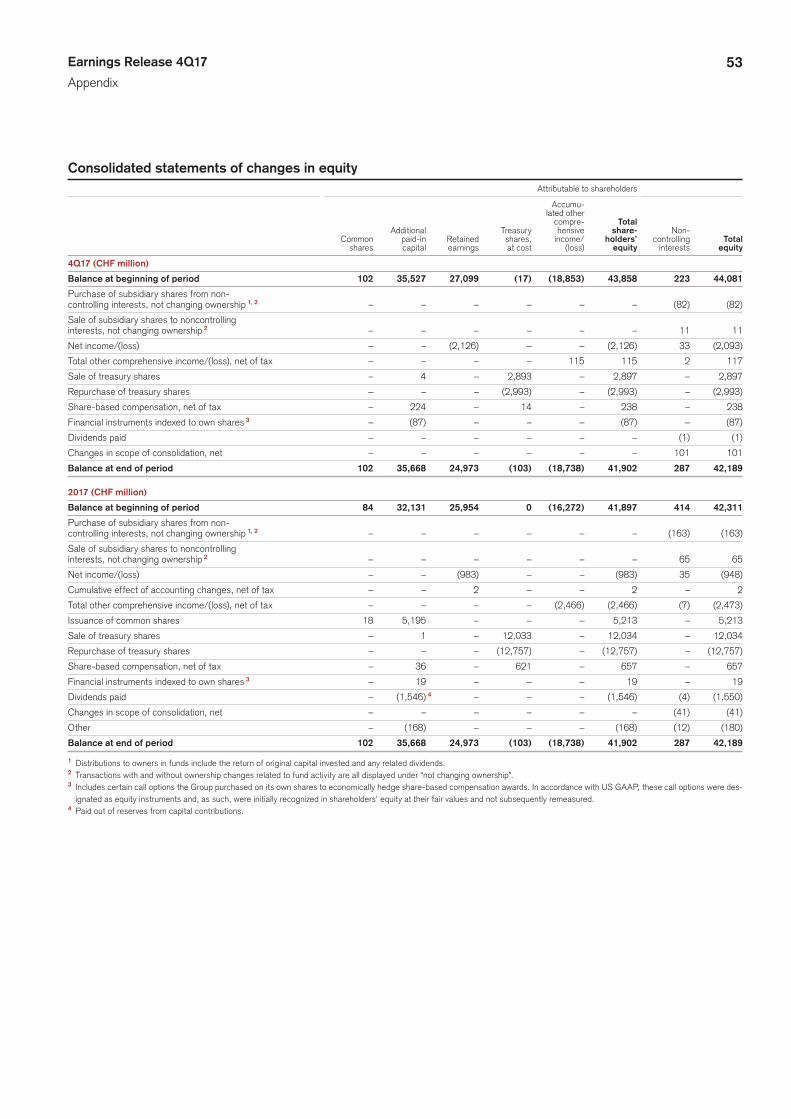
53Earnings Release 4Q17
Appendix
Consolidated statements of changes in equity Attributable to shareholders
Accumu- lated other compre- Total Additional Treasury hensive share- Non- Common paid-in Retained shares, income/ holders’ controlling Total shares capital earnings at cost (loss) equity interests equity
4Q17 (CHF million)
Balance at beginning of period 102 35,527 27,099 (17) (18,853) 43,858 223 44,081
Purchase of subsidiary shares from non-
controlling interests, not changing ownership 1,2 – – – – – – (82) (82)
Sale of subsidiary shares to noncontrolling
interests, not changing ownership 2 – – – – – – 11 11
Net income/(loss) – – (2,126) – – (2,126) 33 (2,093)
Total other comprehensive income/(loss), net of tax – – – – 115 115 2 117
Sale of treasury shares – 4 – 2,893 – 2,897 – 2,897
Repurchase of treasury shares – – – (2,993) – (2,993) – (2,993)
Share-based compensation, net of tax – 224 – 14 – 238 – 238
Financial instruments indexed to own shares 3 – (87) – – – (87) – (87)
Dividends paid – – – – – – (1) (1)
Changes in scope of consolidation, net – – – – – – 101 101
Balance at end of period 102 35,668 24,973 (103) (18,738) 41,902 287 42,189
2017 (CHF million)
Balance at beginning of period 84 32,131 25,954 0 (16,272) 41,897 414 42,311
Purchase of subsidiary shares from non-
controlling interests, not changing ownership 1,2 – – – – – – (163) (163)
Sale of subsidiary shares to noncontrolling
interests, not changing ownership 2 – – – – – – 65 65
Net income/(loss) – – (983) – – (983) 35 (948)
Cumulative effect of accounting changes, net of tax – – 2 – – 2 – 2
Total other comprehensive income/(loss), net of tax – – – – (2,466) (2,466) (7) (2,473)
Issuance of common shares 18 5,195 – – – 5,213 – 5,213
Sale of treasury shares – 1 – 12,033 – 12,034 – 12,034
Repurchase of treasury shares – – – (12,757) – (12,757) – (12,757)
Share-based compensation, net of tax – 36 – 621 – 657 – 657
Financial instruments indexed to own shares 3 – 19 – – – 19 – 19
Dividends paid – (1,546) 4 – – – (1,546) (4) (1,550)
Changes in scope of consolidation, net – – – – – – (41) (41)
Other – (168) – – – (168) (12) (180)
Balance at end of period 102 35,668 24,973 (103) (18,738) 41,902 287 42,189
1 Distributions to owners in funds include the return of original capital invested and any related dividends.2 Transactions with and without ownership changes related to fund activity are all displayed under “not changing ownership”.3 Includes certain call options the Group purchased on its own shares to economically hedge share-based compensation awards. In accordance with US GAAP, these call options were des-
ignated as equity instruments and, as such, were initially recognized in shareholders’ equity at their fair values and not subsequently remeasured.4 Paid out of reserves from capital contributions.
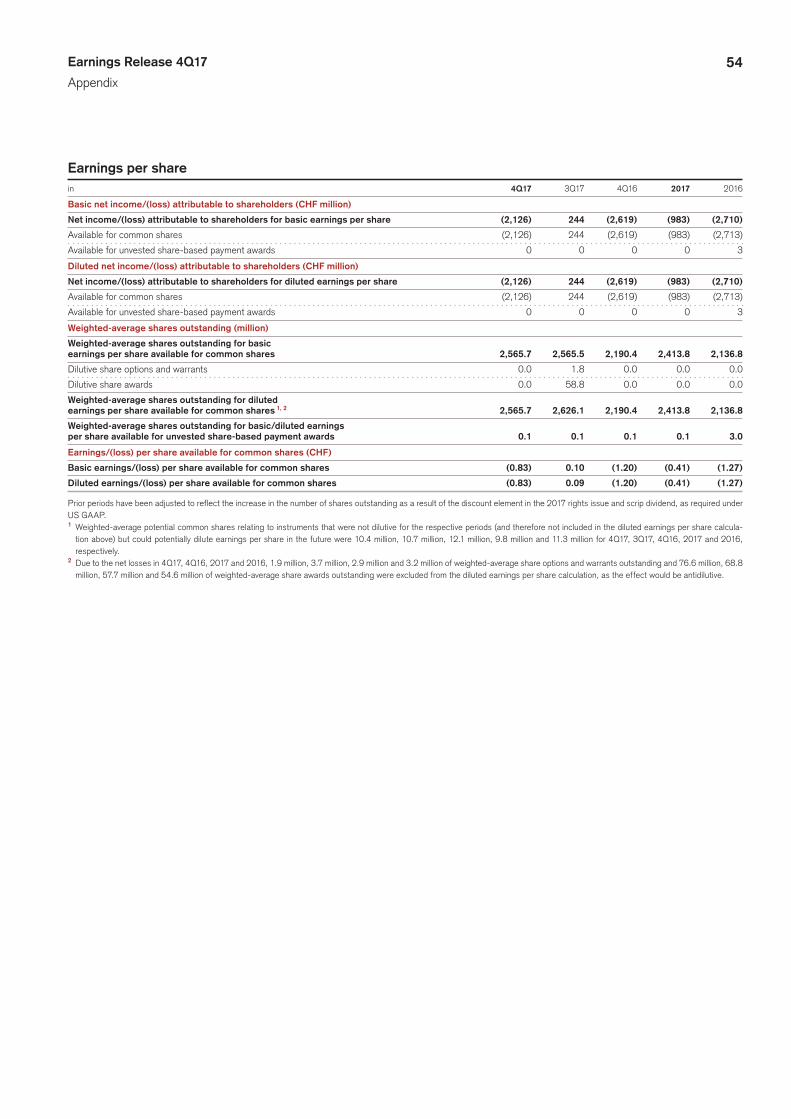
54Earnings Release 4Q17
Appendix
Earnings per share in 4Q17 3Q17 4Q16 2017 2016
Basic net income/(loss) attributable to shareholders (CHF million)
Net income/(loss) attributable to shareholders for basic earnings per share (2,126) 244 (2,619) (983) (2,710)
Available for common shares (2,126) 244 (2,619) (983) (2,713)
Available for unvested share-based payment awards 0 0 0 0 3
Diluted net income/(loss) attributable to shareholders (CHF million)
Net income/(loss) attributable to shareholders for diluted earnings per share (2,126) 244 (2,619) (983) (2,710)
Available for common shares (2,126) 244 (2,619) (983) (2,713)
Available for unvested share-based payment awards 0 0 0 0 3
Weighted-average shares outstanding (million)
Weighted-average shares outstanding for basic
earnings per share available for common shares 2,565.7 2,565.5 2,190.4 2,413.8 2,136.8
Dilutive share options and warrants 0.0 1.8 0.0 0.0 0.0
Dilutive share awards 0.0 58.8 0.0 0.0 0.0
Weighted-average shares outstanding for diluted
earnings per share available for common shares 1,2 2,565.7 2,626.1 2,190.4 2,413.8 2,136.8
Weighted-average shares outstanding for basic/diluted earnings
per share available for unvested share-based payment awards 0.1 0.1 0.1 0.1 3.0
Earnings/(loss) per share available for common shares (CHF)
Basic earnings/(loss) per share available for common shares (0.83) 0.10 (1.20) (0.41) (1.27)
Diluted earnings/(loss) per share available for common shares (0.83) 0.09 (1.20) (0.41) (1.27)
Prior periods have been adjusted to reflect the increase in the number of shares outstanding as a result of the discount element in the 2017 rights issue and scrip dividend, as required under US GAAP.1 Weighted-average potential common shares relating to instruments that were not dilutive for the respective periods (and therefore not included in the diluted earnings per share calcula-
tion above) but could potentially dilute earnings per share in the future were 10.4 million, 10.7 million, 12.1 million, 9.8 million and 11.3 million for 4Q17, 3Q17, 4Q16, 2017 and 2016, respectively.
2 Due to the net losses in 4Q17, 4Q16, 2017 and 2016, 1.9 million, 3.7 million, 2.9 million and 3.2 million of weighted-average share options and warrants outstanding and 76.6 million, 68.8 million, 57.7 million and 54.6 million of weighted-average share awards outstanding were excluded from the diluted earnings per share calculation, as the effect would be antidilutive.
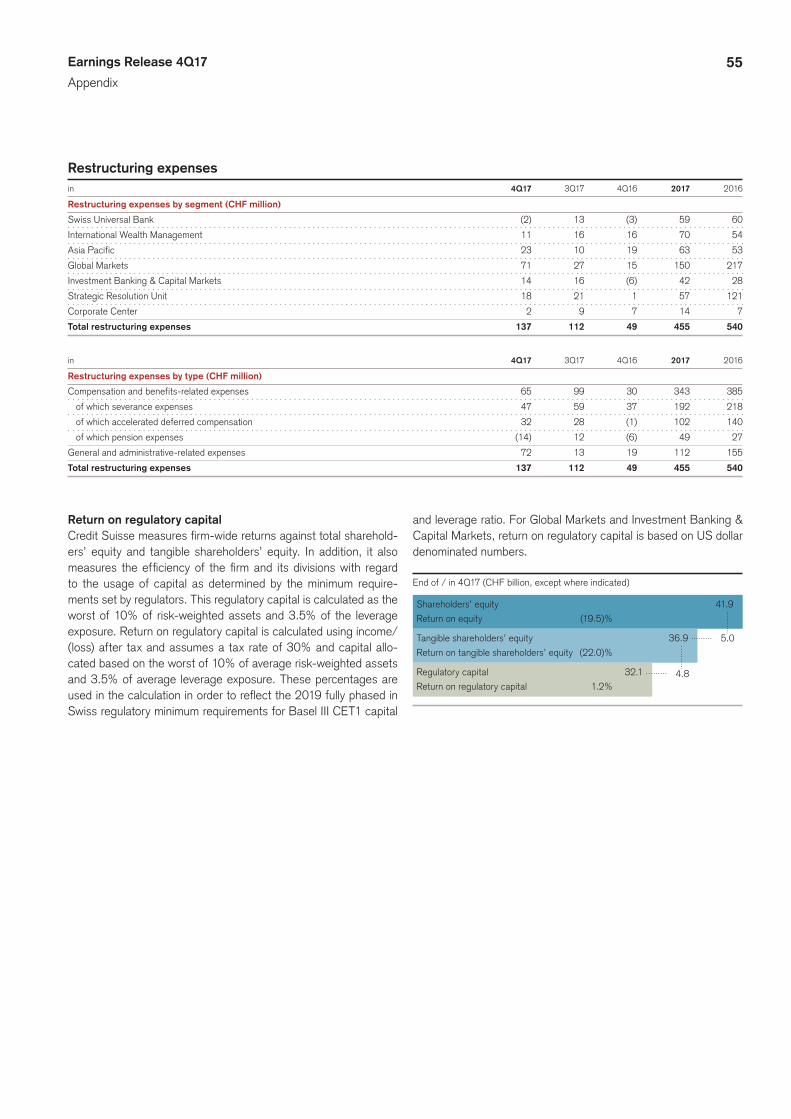
55Earnings Release 4Q17
Appendix
End of / in 4Q17 (CHF billion, except where indicated)
Shareholders’ equity 41.9
Return on equity (19.5)%
Tangible shareholders’ equity 36.9
Return on tangible shareholders’ equity (22.0)%
Regulatory capital 32.1
Return on regulatory capital 1.2%4.8
5.0
Restructuring expenses in 4Q17 3Q17 4Q16 2017 2016
Restructuring expenses by segment (CHF million)
Swiss Universal Bank (2) 13 (3) 59 60
International Wealth Management 11 16 16 70 54
Asia Pacific 23 10 19 63 53
Global Markets 71 27 15 150 217
Investment Banking & Capital Markets 14 16 (6) 42 28
Strategic Resolution Unit 18 21 1 57 121
Corporate Center 2 9 7 14 7
Total restructuring expenses 137 112 49 455 540
in 4Q17 3Q17 4Q16 2017 2016
Restructuring expenses by type (CHF million)
Compensation and benefits-related expenses 65 99 30 343 385
of which severance expenses 47 59 37 192 218
of which accelerated deferred compensation 32 28 (1) 102 140
of which pension expenses (14) 12 (6) 49 27
General and administrative-related expenses 72 13 19 112 155
Total restructuring expenses 137 112 49 455 540
Return on regulatory capitalCredit Suisse measures firm-wide returns against total sharehold-ers’ equity and tangible shareholders’ equity. In addition, it also measures the efficiency of the firm and its divisions with regard to the usage of capital as determined by the minimum require-ments set by regulators. This regulatory capital is calculated as the worst of 10% of risk-weighted assets and 3.5% of the leverage exposure. Return on regulatory capital is calculated using income/(loss) after tax and assumes a tax rate of 30% and capital allo-cated based on the worst of 10% of average risk-weighted assets and 3.5% of average leverage exposure. These percentages are used in the calculation in order to reflect the 2019 fully phased in Swiss regulatory minimum requirements for Basel III CET1 capital
and leverage ratio. For Global Markets and Investment Banking & Capital Markets, return on regulatory capital is based on US dollar denominated numbers.
56Earnings Release 4Q17
Appendix
Cautionary statement regarding forward-looking information This document contains statements that constitute forward-looking state-ments. In addition, in the future we, and others on our behalf, may make statements that constitute forward-looking statements. Such forward-looking statements may include, without limitation, statements relating to the following:p our plans, objectives, ambitions, targets or goals; p our future economic performance or prospects; p the potential effect on our future performance of certain contingencies; and p assumptions underlying any such statements.
Words such as “believes,” “anticipates,” “expects,” “intends” and “plans” and similar expressions are intended to identify forward-looking state-ments but are not the exclusive means of identifying such statements. We do not intend to update these forward-looking statements.
By their very nature, forward-looking statements involve inherent risks and uncertainties, both general and specific, and risks exist that predic-tions, forecasts, projections and other outcomes described or implied in forward-looking statements will not be achieved. We caution you that a number of important factors could cause results to differ materially from the plans, objectives, ambitions, targets, expectations, estimates and intentions expressed in such forward-looking statements. These factors include: p the ability to maintain sufficient liquidity and access capital markets; p market volatility and interest rate fluctuations and developments affect-
ing interest rate levels; p the strength of the global economy in general and the strength of the
economies of the countries in which we conduct our operations, in par-ticular the risk of continued slow economic recovery or downturn in the US or other developed countries or in emerging markets in 2018 and beyond;
p the direct and indirect impacts of deterioration or slow recovery in resi-dential and commercial real estate markets;
p adverse rating actions by credit rating agencies in respect of us, sov-ereign issuers, structured credit products or other credit-related expo-sures;
p the ability to achieve our strategic goals, including those related to cost efficiency, income/(loss) before taxes, capital ratios and return on regulatory capital, leverage exposure threshold, risk-weighted assets threshold, return on tangible equity, and other targets, objectives and ambitions;
p the ability of counterparties to meet their obligations to us; p the effects of, and changes in, fiscal, monetary, exchange rate, trade
and tax policies, as well as currency fluctuations; p political and social developments, including war, civil unrest or terrorist
activity; p the possibility of foreign exchange controls, expropriation, national-
ization or confiscation of assets in countries in which we conduct our operations;
p operational factors such as systems failure, human error, or the failure to implement procedures properly;
p the risk of cyberattacks on our business or operations; p actions taken by regulators with respect to our business and practices
and possible resulting changes to our business organization, practices and policies in countries in which we conduct our operations;
p the effects of changes in laws, regulations or accounting or tax stan-dards, policies or practices in countries in which we conduct our opera-tions;
p the potential effects of proposed changes in our legal entity structure; p competition or changes in our competitive position in geographic and
business areas in which we conduct our operations; p the ability to retain and recruit qualified personnel; p the ability to maintain our reputation and promote our brand; p the ability to increase market share and control expenses; p technological changes; p the timely development and acceptance of our new products and ser-
vices and the perceived overall value of these products and services by users;
p acquisitions, including the ability to integrate acquired businesses suc-cessfully, and divestitures, including the ability to sell non-core assets;
p the adverse resolution of litigation, regulatory proceedings and other contingencies; and
p other unforeseen or unexpected events and our success at managing these and the risks involved in the foregoing.
We caution you that the foregoing list of important factors is not exclusive. When evaluating forward-looking statements, you should carefully con-sider the foregoing factors and other uncertainties and events, including the information set forth in “Risk factors” in I – Information on the com-pany in our Annual Report 2016.