earnings release presentation - aep.com · earnings release presentation january 25, 2018 ... ercot...
TRANSCRIPT

1
4th Quarter 2017
Earnings Release Presentation
January 25, 2018

“Safe Harbor” Statement under the Private Securities Litigation Reform Act of 1995
Investor
Relations
Contacts
Bette Jo Rozsa Managing Director Investor Relations
614-716-2840 [email protected]
2
This presentation contains forward-looking statements within the meaning of Section 21E of the Securities Exchange Act of 1934. Although AEP and each of its
Registrant Subsidiaries believe that their expectations are based on reasonable assumptions, any such statements may be influenced by factors that could cause actual
outcomes and results to be materially different from those projected. Among the factors that could cause actual results to differ materially from those in the forward-
looking statements are: economic growth or contraction within and changes in market demand and demographic patterns in AEP service territories, inflationary or
deflationary interest rate trends, volatility in the financial markets, particularly developments affecting the availability or cost of capital to finance new capital projects and
refinance existing debt, the availability and cost of funds to finance working capital and capital needs, particularly during periods when the time lag between incurring
costs and recovery is long and the costs are material, electric load and customer growth, weather conditions, including storms and drought conditions, and the ability to
recover significant storm restoration costs, the cost of fuel and its transportation, the creditworthiness and performance of fuel suppliers and transporters and the cost of
storing and disposing of used fuel, including coal ash and spent nuclear fuel, availability of necessary generation capacity, the performance of generation plants and the
availability of fuel, including processed nuclear fuel, parts and service from reliable vendors, the ability to recover fuel and other energy costs through regulated or
competitive electric rates, the ability to build transmission lines and facilities (including the ability to obtain any necessary regulatory approvals and permits) when
needed at acceptable prices and terms and to recover those costs, new legislation, litigation and government regulation, including oversight of nuclear generation,
energy commodity trading and new or heightened requirements for reduced emissions of sulfur, nitrogen, mercury, carbon, soot or particulate matter and other
substances that could impact the continued operation, cost recovery and/or profitability of generation plants and related assets, evolving public perception of the risks
associated with fuels used before, during and after the generation of electricity, including nuclear fuel, timing and resolution of pending and future rate cases,
negotiations and other regulatory decisions, including rate or other recovery of new investments in generation, distribution and transmission service, environmental
compliance and excess accumulated deferred income taxes, resolution of litigation, the ability to constrain operation and maintenance costs, prices and demand for
power generated and sold at wholesale, changes in technology, particularly with respect to energy storage and new, developing, alternative or distributed sources of
generation, the ability to recover through rates any remaining unrecovered investment in generation units that may be retired before the end of their previously projected
useful lives, volatility and changes in markets for capacity and electricity, coal and other energy-related commodities, particularly changes in the price of natural gas,
changes in utility regulation and the allocation of costs within regional transmission organizations, including ERCOT, PJM and SPP, changes in the creditworthiness of
the counterparties with contractual arrangements, including participants in the energy trading market, actions of rating agencies, including changes in the ratings of debt,
the impact of volatility in the capital markets on the value of the investments held by the pension, other postretirement benefit plans, captive insurance entity and nuclear
decommissioning trust and the impact of such volatility on future funding requirements, accounting pronouncements periodically issued by accounting standard-setting
bodies and other risks and unforeseen events, including wars, the effects of terrorism (including increased security costs), embargoes, cyber security threats and other
catastrophic events.
Bette Jo Rozsa Managing Director Investor Relations
614-716-2840 [email protected]
Darcy Reese Director
Investor Relations 614-716-2614
Non-GAAP Financial Measures
Investor
Relations
Contacts
Bette Jo Rozsa Managing Director Investor Relations
614-716-2840 [email protected]
Brad Funk Director
Investor Relations 614-716-3162
AEP reports its financial results in accordance with accounting principles generally accepted in the United States (GAAP). AEP supplements the reporting of financial
information determined in accordance with GAAP with certain non-GAAP financial measures, including operating earnings (non-GAAP) and FFO to Total Debt.
Operating earnings (non-GAAP) excludes certain gains and losses and other specified items, including mark-to-market adjustments from commodity hedging activities
and other items as set forth in the reconciliation in the Appendix. FFO to Total Debt is adjusted for the effects of securitization, spent nuclear fuel trust, capital and
operating leases, pension, capitalized interest and changes in working capital. Operating earnings could differ from GAAP earnings for matters such as impairments,
divestitures, or changes in accounting principles. AEP management is not able to forecast if any of these items will occur or any amounts that may be reported for
future periods. Therefore, AEP is not able to provide a corresponding GAAP equivalent for earnings guidance.
This information is intended to enhance an investor’s overall understanding of period over period financial results and provide an indication of AEP’s baseline operating
performance by excluding items that are considered by management to be not directly related to the ongoing operations of the business. In addition, this information is
among the primary indicators management uses as a basis for evaluating performance, allocating resources, setting incentive compensation targets and planning and
forecasting of future periods.
These non-GAAP financial measures are not a presentation defined under GAAP and may not be comparable to other companies’ presentations. AEP has provided
these non-GAAP financial measures as supplemental information and in addition to the financial measures that are calculated and presented in accordance with GAAP.
These non-GAAP measures should not be deemed more useful than, a substitute for, or an alternative to the most comparable GAAP measures provided in the
materials presented. Reconciliations of these non-GAAP measures to the most comparable GAAP measures are provided in the appendices and supplemental
schedules to this presentation.

4
4th Quarter 2017 Highlights
4th Quarter 2017 Total Shareholder Return
Refer to appendix for reconciliation between GAAP and Operating EPS
YTD 2017
One Year Three Year Five Year

5
2017 Highlights & 2018 Focus
2017 Highlights
Financial Performance Deliver operating earnings within the guidance range of
$3.75 to $3.95 per share
Continue to focus on disciplined capital allocation, investing $6 billion in cap-ex, substantially in regulated entities with particular emphasis on wires
Deliver 5%-7% operating earnings growth rate
Regulatory and Strategic Initiatives Obtain necessary state regulatory approvals and move
forward with Wind Catcher Energy Connection project
Finalize base rate cases in Indiana, Michigan, Kentucky, Oklahoma and Texas with positive results
Evaluate impact of tax reform related to the right mix of cap-ex and rate base growth, ensure appropriate credit metrics, and work with state regulatory commissions to address the appropriate mechanism to provide the benefits of tax reform to customers
2018 Focus
Financial Performance Delivered GAAP earnings of $0.81 per share for Q4 2017
and $3.89 per share for 2017
Delivered operating earnings of $0.85 per share for Q4 2017 and $3.68 per share for 2017
Achieved regulated operating ROE of 9.5% for the year
Increased quarterly dividend by 5.1%
Regulatory and Strategic Initiatives Filed for state regulatory approvals of the Wind Catcher
Energy Connection project in Oklahoma, Texas, Louisiana and Arkansas
Base rate case filings made in Indiana, Michigan, Kentucky, Oklahoma and Texas
Competitive generation resolutions Closed on sale of certain competitive generation
assets totaling 5,329 MWs Rationalized ownership structure of Zimmer and
Conesville plants, Stuart plant retiring in June 2018 Filed amended Cardinal operating agreement with
FERC, awaiting approval
6
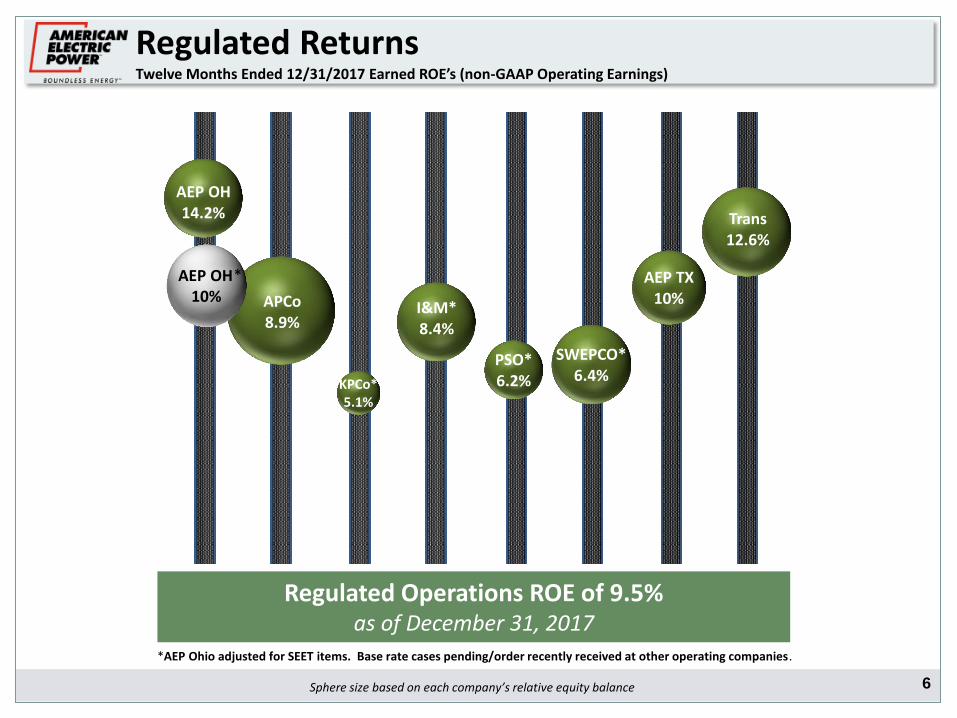
AEP OH 14.2%
APCo 8.9%
KPCo* 5.1%
I&M* 8.4%
PSO* 6.2%
SWEPCO* 6.4%
AEP TX 10%
Trans 12.6%
AEP OH 10%
Regulated Returns Twelve Months Ended 12/31/2017 Earned ROE’s (non-GAAP Operating Earnings)
Sphere size based on each company’s relative equity balance
Regulated Operations ROE of 9.5% as of December 31, 2017
*AEP Ohio adjusted for SEET items. Base rate cases pending/order recently received at other operating companies.
*

7
4th Quarter Operating Earnings Segment Detail
Refer to appendix for additional explanation of variances by segment
$0.03
2017 Actual EPS $0.36 $0.25 $0.16 $0.05 $0.03 $0.85
2016 Vertically Integrated Transmission & AEP Transmission Generation and Corporate and 2017
Actual Utilities Distribution Utilities Holdco Marketing Other Actual
Rate Changes $ 0.01
OH Settlement $ 0.04
Normal Load $ 0.02
O&M $ 0.07
Depreciation $ (0.01)
Eff Income Tax $ (0.01)
Other Taxes $ (0.01)
Other $ (0.02)
FERC 205 $ 0.01
Investments $ 0.03
Sold Assets $ (0.08)
Held Assets $ 0.01
Trading & Mkt $ 0.01
Other $ 0.01
O&M $ 0.04
Eff Income Tax $ 0.01
Rate Changes $ 0.06
Weather $ 0.04
O&M $ 0.11
Depreciation $ (0.03)
Eff Income Tax $ (0.12)
Other Taxes $ (0.01)
8
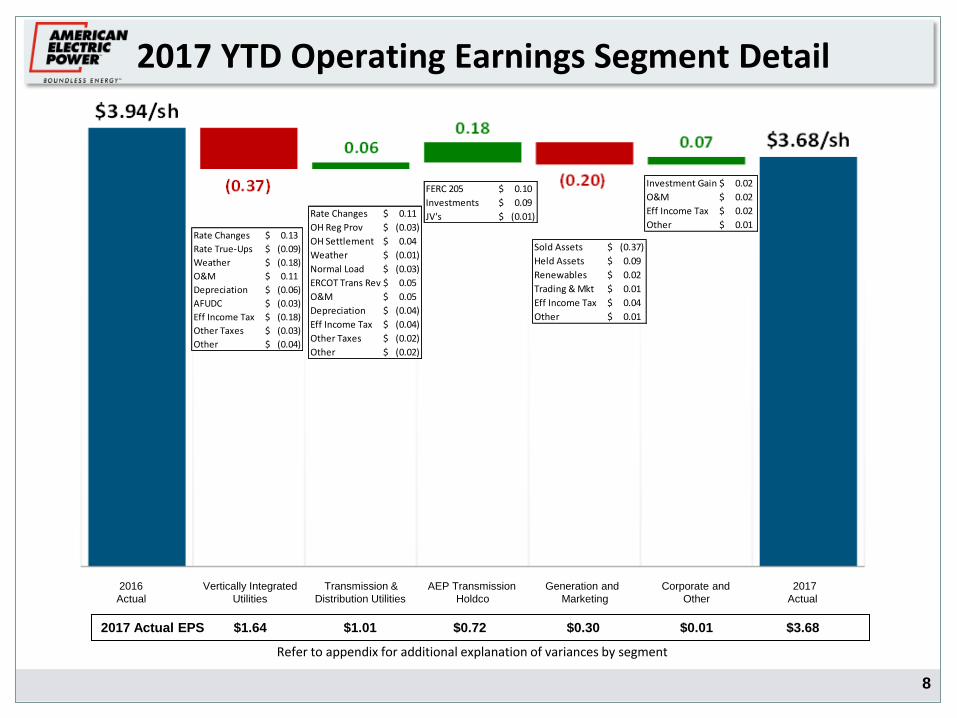
2017 YTD Operating Earnings Segment Detail
Refer to appendix for additional explanation of variances by segment
($0.07) $0.03
$0.03
2017 Actual EPS $1.64 $1.01 $0.72 $0.30 $0.01 $3.68
2016 Vertically Integrated Transmission & AEP Transmission Generation and Corporate and 2017
Actual Utilities Distribution Utilities Holdco Marketing Other Actual
FERC 205 $ 0.10
Investments $ 0.09
JV's $ (0.01)
Sold Assets $ (0.37)
Held Assets $ 0.09
Renewables $ 0.02
Trading & Mkt $ 0.01
Eff Income Tax $ 0.04
Other $ 0.01
Investment Gain $ 0.02
O&M $ 0.02
Eff Income Tax $ 0.02
Other $ 0.01 Rate Changes $ 0.13
Rate True-Ups $ (0.09)
Weather $ (0.18)
O&M $ 0.11
Depreciation $ (0.06)
AFUDC $ (0.03)
Eff Income Tax $ (0.18)
Other Taxes $ (0.03)
Other $ (0.04)
Rate Changes $ 0.11
OH Reg Prov $ (0.03)
OH Settlement $ 0.04
Weather $ (0.01)
Normal Load $ (0.03)
ERCOT Trans Rev $ 0.05
O&M $ 0.05
Depreciation $ (0.04)
Eff Income Tax $ (0.04)
Other Taxes $ (0.02)
Other $ (0.02)
9
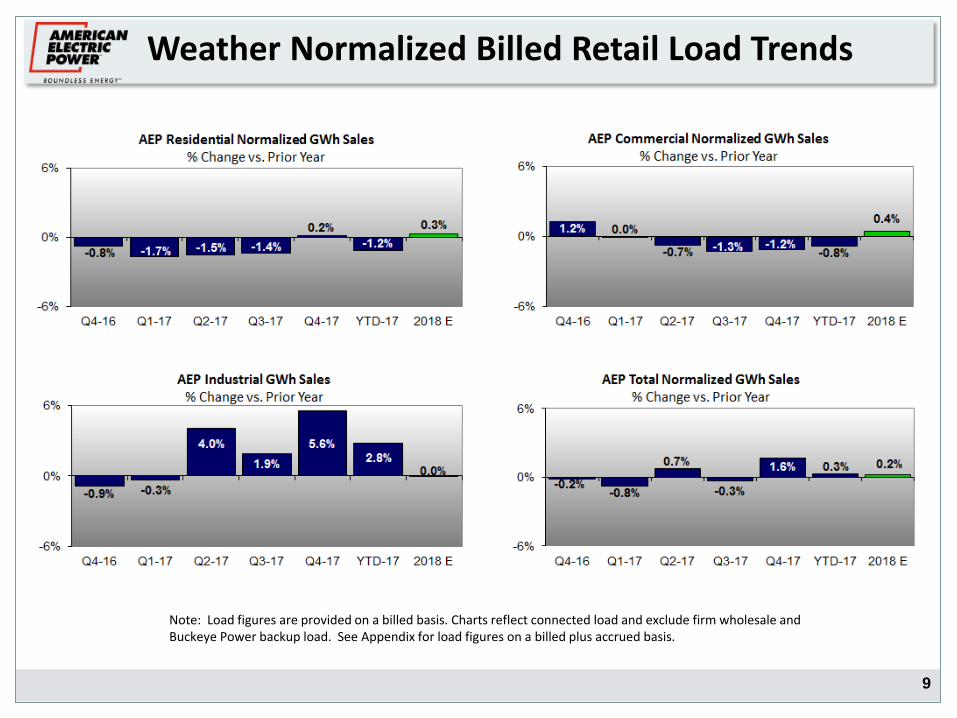
Weather Normalized Billed Retail Load Trends
Note: Load figures are provided on a billed basis. Charts reflect connected load and exclude firm wholesale and Buckeye Power backup load. See Appendix for load figures on a billed plus accrued basis.
10
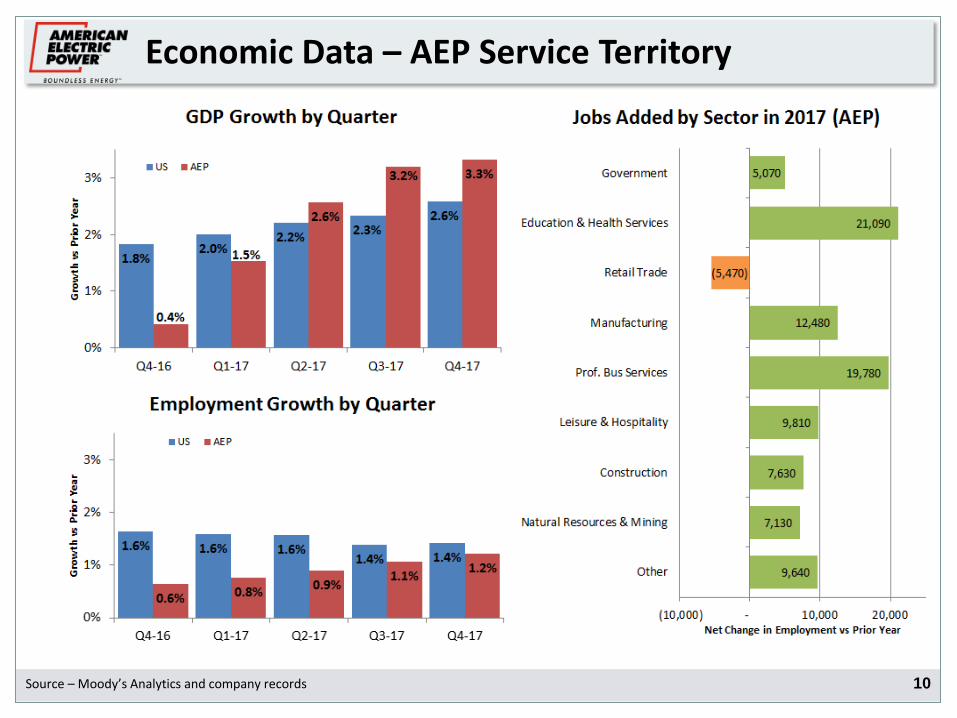
Economic Data – AEP Service Territory
Source – Moody’s Analytics and company records
11
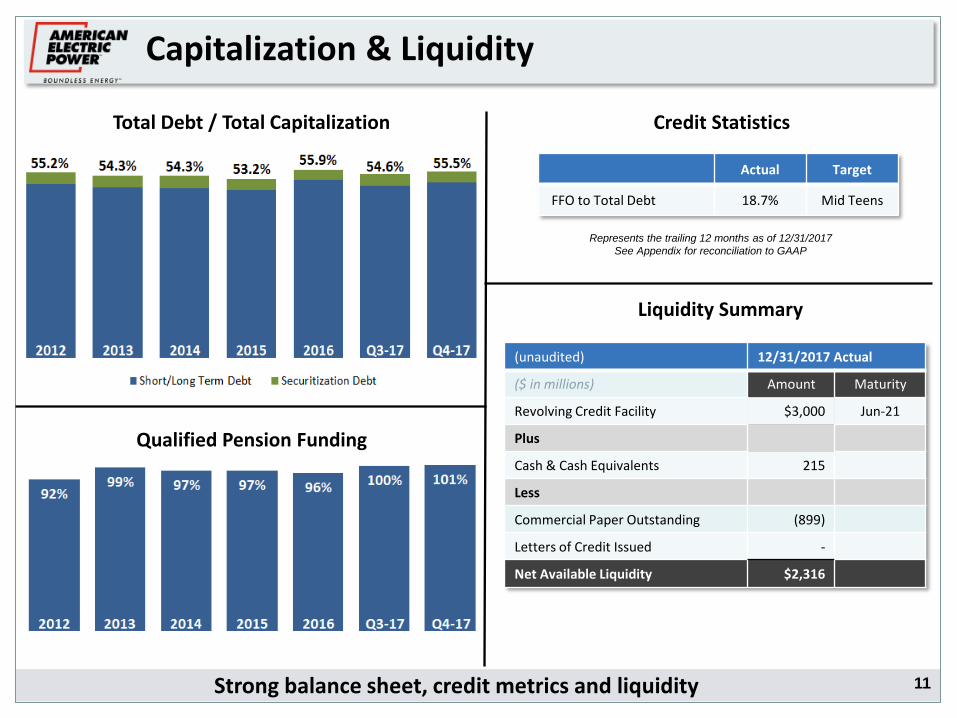
(unaudited) 12/31/2017 Actual
($ in millions) Amount Maturity
Revolving Credit Facility $3,000 Jun-21
Plus
Cash & Cash Equivalents 215
Less
Commercial Paper Outstanding (899)
Letters of Credit Issued -
Net Available Liquidity $2,316
Capitalization & Liquidity
Liquidity Summary
Credit Statistics Total Debt / Total Capitalization
Strong balance sheet, credit metrics and liquidity
Qualified Pension Funding
Actual Target
FFO to Total Debt 18.7% Mid Teens
Represents the trailing 12 months as of 12/31/2017
See Appendix for reconciliation to GAAP
12
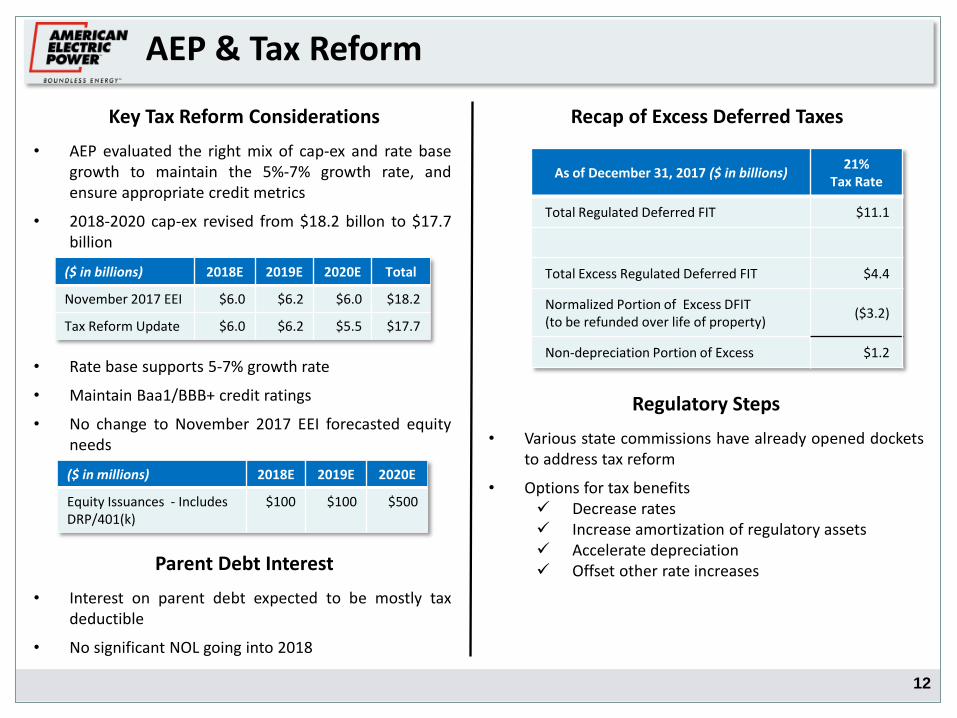
As of December 31, 2017 ($ in billions) 21%
Tax Rate
Total Regulated Deferred FIT $11.1
Total Excess Regulated Deferred FIT $4.4
Normalized Portion of Excess DFIT (to be refunded over life of property)
($3.2)
Non-depreciation Portion of Excess $1.2
Recap of Excess Deferred Taxes Key Tax Reform Considerations
• AEP evaluated the right mix of cap-ex and rate base growth to maintain the 5%-7% growth rate, and ensure appropriate credit metrics
• 2018-2020 cap-ex revised from $18.2 billon to $17.7 billion
AEP & Tax Reform
Parent Debt Interest
• Interest on parent debt expected to be mostly tax deductible
• No significant NOL going into 2018
• Various state commissions have already opened dockets to address tax reform
• Options for tax benefits Decrease rates Increase amortization of regulatory assets Accelerate depreciation Offset other rate increases
Regulatory Steps
($ in millions) 2018E 2019E 2020E
Equity Issuances - Includes DRP/401(k)
$100 $100 $500
• Rate base supports 5-7% growth rate
• Maintain Baa1/BBB+ credit ratings
• No change to November 2017 EEI forecasted equity needs
($ in billions) 2018E 2019E 2020E Total
November 2017 EEI $6.0 $6.2 $6.0 $18.2
Tax Reform Update $6.0 $6.2 $5.5 $17.7

13
Proven Track Record & 2018 Outlook
2018 Outlook Proven Track Record
Reaffirm 2018 operating earnings guidance of $3.75 - $3.95
Solid 2017 operating earnings
Strategic capital deployment
Demonstrated O&M discipline and track record of ability to offset inflationary increases
Dividend growth in line with earnings
5-7% growth rate with 2018 operating earnings guidance range of $3.75 - $3.95
Finalize pending base rate cases and move forward with Wind Catcher
Evaluate impact of tax reform and work with state regulatory commissions to address the appropriate mechanism to provide the benefits of tax reform to customers

14
Appendix

15
4th Quarter Reconciliation of GAAP to Operating Earnings
(a) Items recorded in Generation & Marketing segment (b) Items recorded in Corporate and Other segment (c) Items recorded in Transmission and Distribution Utilities segment (d) Items recorded in Vertically Integrated Utilities segment
Weighted average no. of shares outstanding: 492M Q4-16 and 492M Q4-17
$ millions Earnings Per Share
Q4-16 Q4-17 Change Q4-16 Q4-17 Change
Reported GAAP Earnings $373 $401 $28 $0.76 $0.81 $0.05
Non Operating Items:
Mark-to-Market Impact of Commodity Hedging Activities (a)
(4) - 4 (0.01) - 0.01
Disposition of Commercial Barging Operations (b) (6) - 6 (0.01) - 0.01
Federal Tax Audit Settlement (b) (22) - 22 (0.04) - 0.04
Effects of Tax Reform – All Segments - (27) (27) - (0.05) (0.05)
UK Windfall Tax (c) (13) - 13 (0.03) - 0.03
Impairment of Certain Merchant Generation Assets (a)
2 28 26 - 0.05 0.05
Impairment of Turk Plant (d) - 14 14 - 0.03 0.03
Welsh Unit 2 Disallowance (d) - 4 4 - 0.01 0.01
AEP Operating Earnings $330 $420 $90 $0.67 $0.85 $0.18

16
YTD December Reconciliation of GAAP to Operating Earnings
Weighted average no. of shares outstanding: 491M YTD-16 and 492M YTD-17
$ millions Earnings Per Share
YTD-16 YTD-17 Change YTD-16 YTD-17 Change
Reported GAAP Earnings $611 $1,913 $1,302 $1.24 $3.89 $2.65
Non Operating Items:
Mark-to-Market Impact of Commodity Hedging Activities (a)
(6) 3 9 (0.01) 0.01 0.02
Gain from Competitive Generation Asset Sale (a) - (129) (129) - (0.26) (0.26)
Capital Loss Valuation Allowance (a) (10) - 10 (0.02) - 0.02
Capital Loss Valuation Allowance (b) (34) - 34 (0.07) - 0.07
Disposition of Commercial Barging Operations (b) (1) - 1 - - -
Federal Tax Audit Settlement (b) (77) - 77 (0.15) - 0.15
Effects of Tax Reform – All Segments - (27) (27) - (0.05) (0.05)
UK Windfall Tax (c) (13) - 13 (0.03) - 0.03
Impairment of Certain Merchant Generation Assets (a)
1,460 30 (1,430) 2.97 0.05 (2.92)
Impairment of Certain Merchant Generation Assets (d)
7 - (7) 0.01 - (0.01)
Impairment of Turk Plant (d) - 14 14 - 0.03 0.03
Welsh Unit 2 Disallowance (d) - 4 4 - 0.01 0.01
AEP Operating Earnings $1,937 $1,808 ($129) $3.94 $3.68 ($0.26)
(a) Items recorded in Generation & Marketing segment (b) Items recorded in Corporate and Other segment (c) Items recorded in Transmission and Distribution Utilities segment (d) Items recorded in Vertically Integrated Utilities segment
17
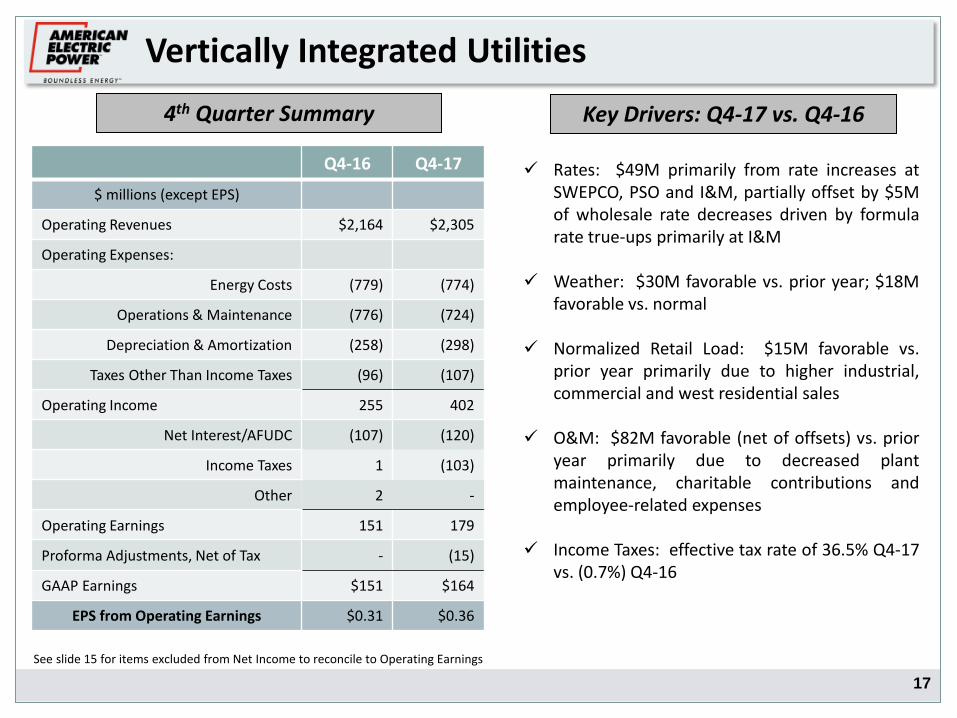
Vertically Integrated Utilities
Q4-16 Q4-17
$ millions (except EPS)
Operating Revenues $2,164 $2,305
Operating Expenses:
Energy Costs (779) (774)
Operations & Maintenance (776) (724)
Depreciation & Amortization (258) (298)
Taxes Other Than Income Taxes (96) (107)
Operating Income 255 402
Net Interest/AFUDC (107) (120)
Income Taxes 1 (103)
Other 2 -
Operating Earnings 151 179
Proforma Adjustments, Net of Tax - (15)
GAAP Earnings $151 $164
EPS from Operating Earnings $0.31 $0.36
4th Quarter Summary Key Drivers: Q4-17 vs. Q4-16
Rates: $49M primarily from rate increases at SWEPCO, PSO and I&M, partially offset by $5M of wholesale rate decreases driven by formula rate true-ups primarily at I&M
Weather: $30M favorable vs. prior year; $18M favorable vs. normal
Normalized Retail Load: $15M favorable vs. prior year primarily due to higher industrial, commercial and west residential sales
O&M: $82M favorable (net of offsets) vs. prior
year primarily due to decreased plant maintenance, charitable contributions and employee-related expenses
Income Taxes: effective tax rate of 36.5% Q4-17 vs. (0.7%) Q4-16
See slide 15 for items excluded from Net Income to reconcile to Operating Earnings
18
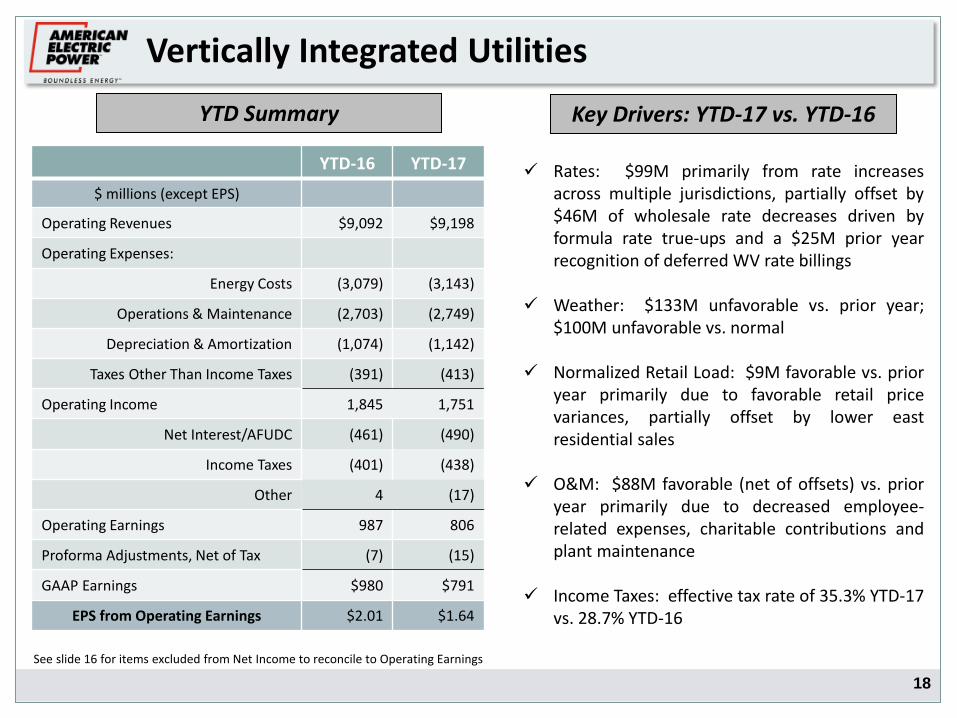
Vertically Integrated Utilities
YTD-16 YTD-17
$ millions (except EPS)
Operating Revenues $9,092 $9,198
Operating Expenses:
Energy Costs (3,079) (3,143)
Operations & Maintenance (2,703) (2,749)
Depreciation & Amortization (1,074) (1,142)
Taxes Other Than Income Taxes (391) (413)
Operating Income 1,845 1,751
Net Interest/AFUDC (461) (490)
Income Taxes (401) (438)
Other 4 (17)
Operating Earnings 987 806
Proforma Adjustments, Net of Tax (7) (15)
GAAP Earnings $980 $791
EPS from Operating Earnings $2.01 $1.64
YTD Summary Key Drivers: YTD-17 vs. YTD-16
Rates: $99M primarily from rate increases across multiple jurisdictions, partially offset by $46M of wholesale rate decreases driven by formula rate true-ups and a $25M prior year recognition of deferred WV rate billings
Weather: $133M unfavorable vs. prior year; $100M unfavorable vs. normal
Normalized Retail Load: $9M favorable vs. prior year primarily due to favorable retail price variances, partially offset by lower east residential sales
O&M: $88M favorable (net of offsets) vs. prior year primarily due to decreased employee-related expenses, charitable contributions and plant maintenance
Income Taxes: effective tax rate of 35.3% YTD-17
vs. 28.7% YTD-16
See slide 16 for items excluded from Net Income to reconcile to Operating Earnings
19
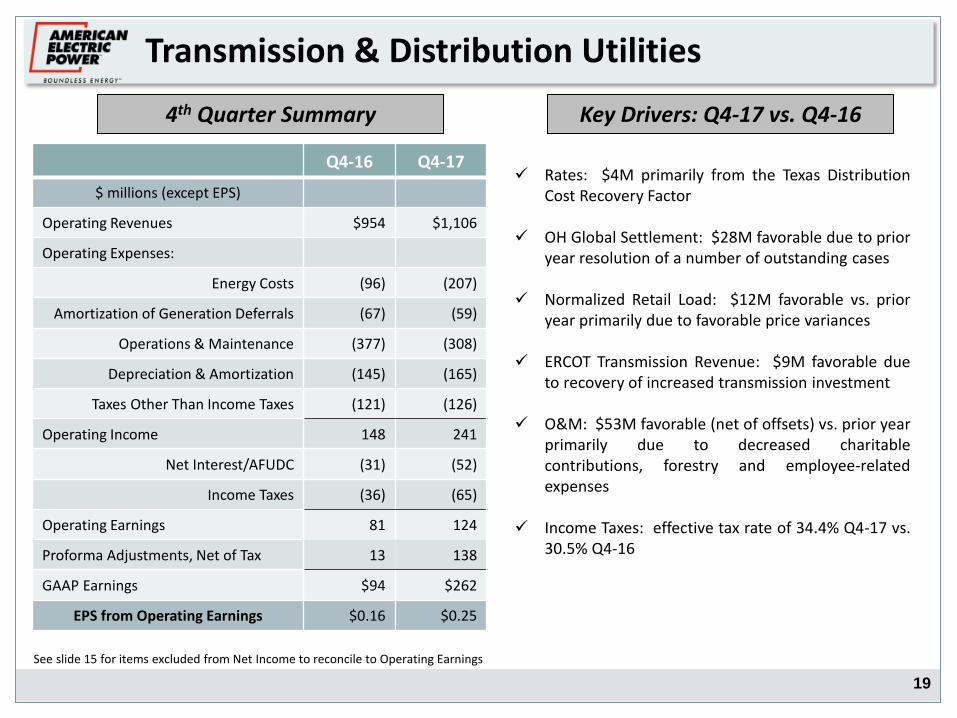
Transmission & Distribution Utilities
Q4-16 Q4-17
$ millions (except EPS)
Operating Revenues $954 $1,106
Operating Expenses:
Energy Costs (96) (207)
Amortization of Generation Deferrals (67) (59)
Operations & Maintenance (377) (308)
Depreciation & Amortization (145) (165)
Taxes Other Than Income Taxes (121) (126)
Operating Income 148 241
Net Interest/AFUDC (31) (52)
Income Taxes (36) (65)
Operating Earnings 81 124
Proforma Adjustments, Net of Tax 13 138
GAAP Earnings $94 $262
EPS from Operating Earnings $0.16 $0.25
4th Quarter Summary Key Drivers: Q4-17 vs. Q4-16
Rates: $4M primarily from the Texas Distribution Cost Recovery Factor
OH Global Settlement: $28M favorable due to prior year resolution of a number of outstanding cases
Normalized Retail Load: $12M favorable vs. prior year primarily due to favorable price variances
ERCOT Transmission Revenue: $9M favorable due to recovery of increased transmission investment
O&M: $53M favorable (net of offsets) vs. prior year primarily due to decreased charitable contributions, forestry and employee-related expenses
Income Taxes: effective tax rate of 34.4% Q4-17 vs. 30.5% Q4-16
See slide 15 for items excluded from Net Income to reconcile to Operating Earnings
20
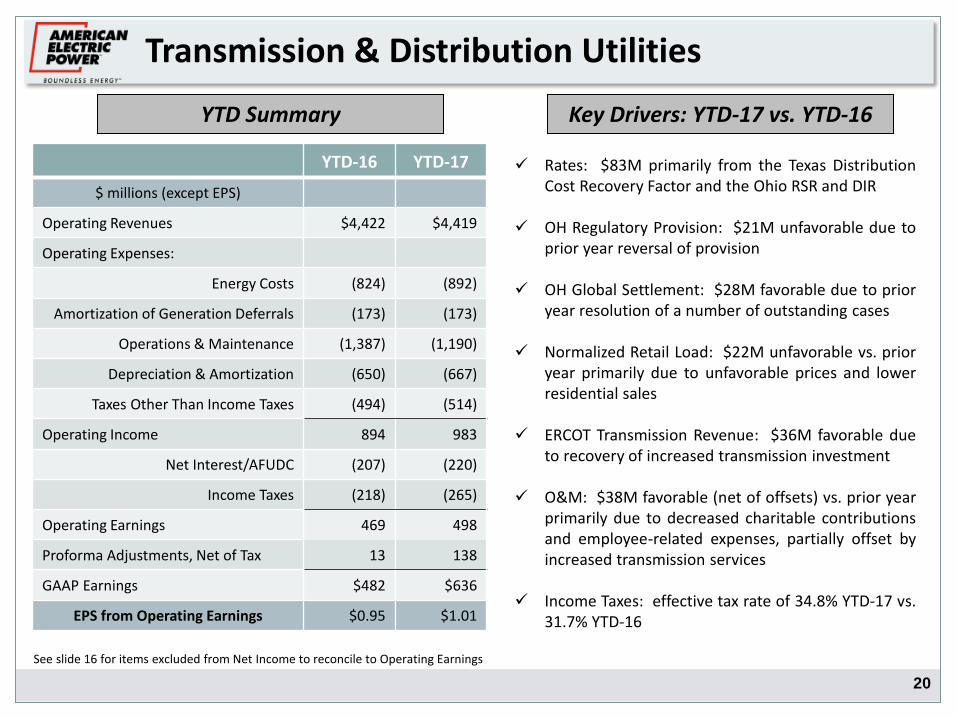
Transmission & Distribution Utilities
YTD-16 YTD-17
$ millions (except EPS)
Operating Revenues $4,422 $4,419
Operating Expenses:
Energy Costs (824) (892)
Amortization of Generation Deferrals (173) (173)
Operations & Maintenance (1,387) (1,190)
Depreciation & Amortization (650) (667)
Taxes Other Than Income Taxes (494) (514)
Operating Income 894 983
Net Interest/AFUDC (207) (220)
Income Taxes (218) (265)
Operating Earnings 469 498
Proforma Adjustments, Net of Tax 13 138
GAAP Earnings $482 $636
EPS from Operating Earnings $0.95 $1.01
YTD Summary Key Drivers: YTD-17 vs. YTD-16
Rates: $83M primarily from the Texas Distribution Cost Recovery Factor and the Ohio RSR and DIR
OH Regulatory Provision: $21M unfavorable due to
prior year reversal of provision
OH Global Settlement: $28M favorable due to prior year resolution of a number of outstanding cases
Normalized Retail Load: $22M unfavorable vs. prior year primarily due to unfavorable prices and lower residential sales
ERCOT Transmission Revenue: $36M favorable due to recovery of increased transmission investment
O&M: $38M favorable (net of offsets) vs. prior year primarily due to decreased charitable contributions and employee-related expenses, partially offset by increased transmission services
Income Taxes: effective tax rate of 34.8% YTD-17 vs. 31.7% YTD-16
See slide 16 for items excluded from Net Income to reconcile to Operating Earnings
21
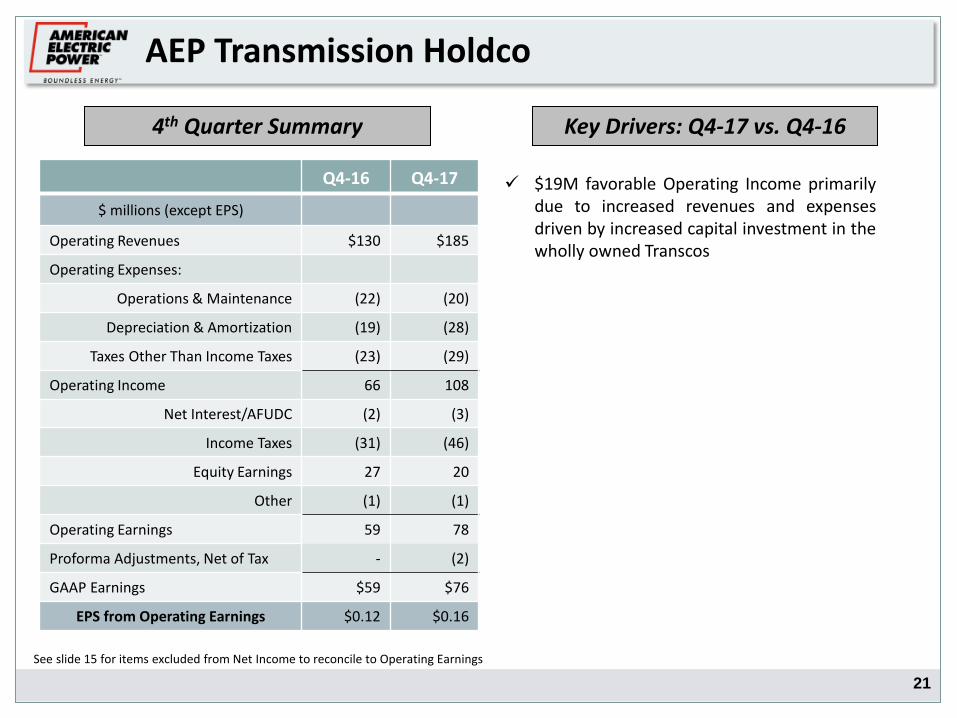
AEP Transmission Holdco
Q4-16 Q4-17
$ millions (except EPS)
Operating Revenues $130 $185
Operating Expenses:
Operations & Maintenance (22) (20)
Depreciation & Amortization (19) (28)
Taxes Other Than Income Taxes (23) (29)
Operating Income 66 108
Net Interest/AFUDC (2) (3)
Income Taxes (31) (46)
Equity Earnings 27 20
Other (1) (1)
Operating Earnings 59 78
Proforma Adjustments, Net of Tax - (2)
GAAP Earnings $59 $76
EPS from Operating Earnings $0.12 $0.16
4th Quarter Summary Key Drivers: Q4-17 vs. Q4-16
$19M favorable Operating Income primarily due to increased revenues and expenses driven by increased capital investment in the wholly owned Transcos
See slide 15 for items excluded from Net Income to reconcile to Operating Earnings
22
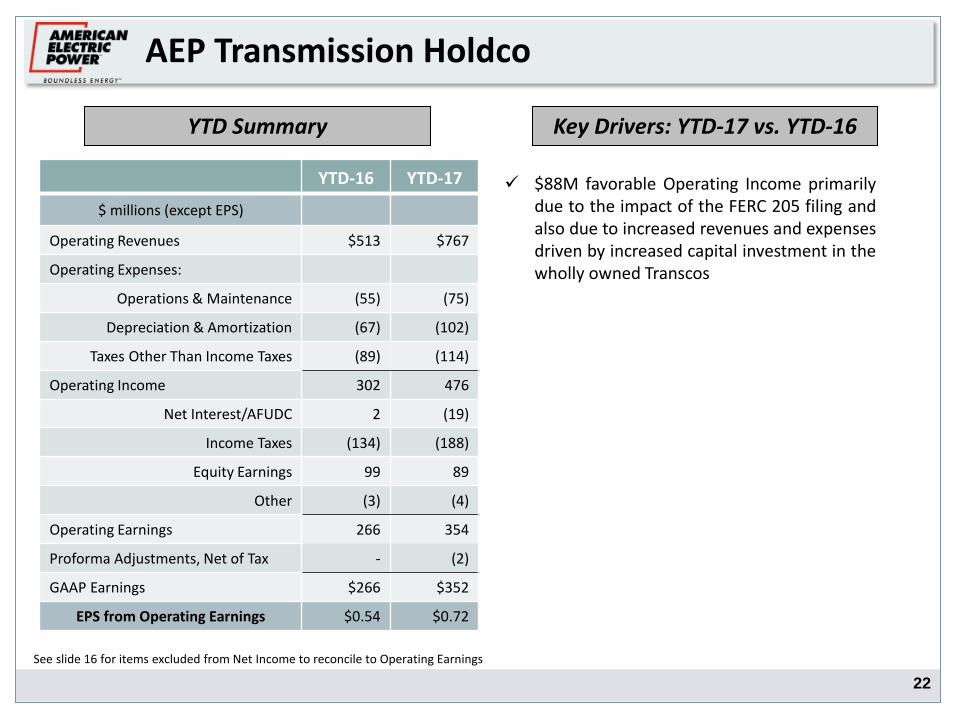
AEP Transmission Holdco
YTD-16 YTD-17
$ millions (except EPS)
Operating Revenues $513 $767
Operating Expenses:
Operations & Maintenance (55) (75)
Depreciation & Amortization (67) (102)
Taxes Other Than Income Taxes (89) (114)
Operating Income 302 476
Net Interest/AFUDC 2 (19)
Income Taxes (134) (188)
Equity Earnings 99 89
Other (3) (4)
Operating Earnings 266 354
Proforma Adjustments, Net of Tax - (2)
GAAP Earnings $266 $352
EPS from Operating Earnings $0.54 $0.72
YTD Summary Key Drivers: YTD-17 vs. YTD-16
$88M favorable Operating Income primarily due to the impact of the FERC 205 filing and also due to increased revenues and expenses driven by increased capital investment in the wholly owned Transcos
See slide 16 for items excluded from Net Income to reconcile to Operating Earnings
23
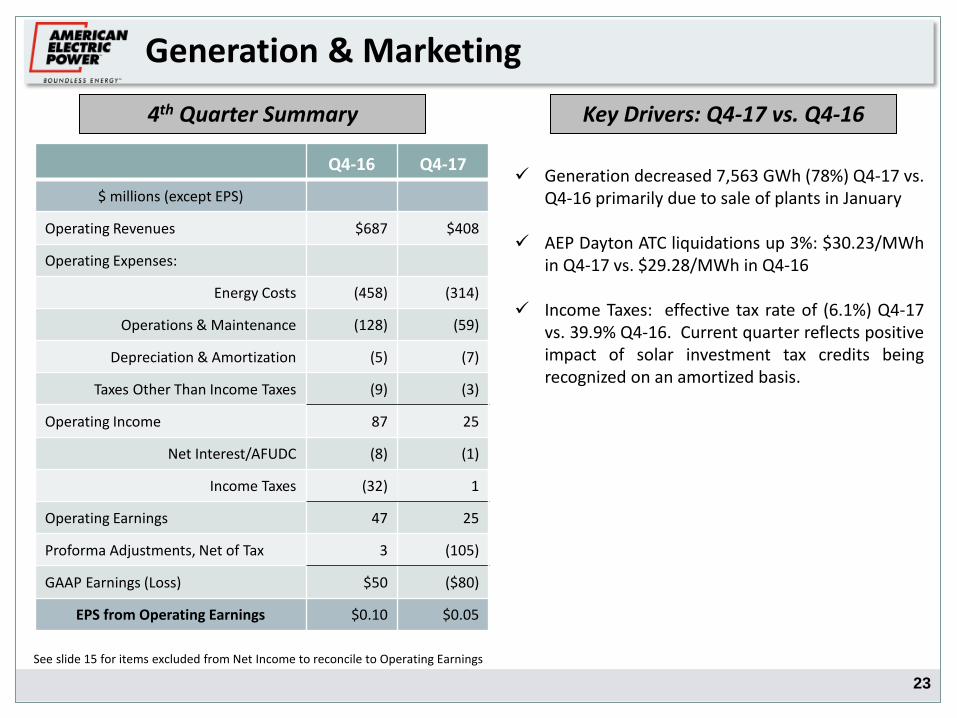
Generation & Marketing
Q4-16 Q4-17
$ millions (except EPS)
Operating Revenues $687 $408
Operating Expenses:
Energy Costs (458) (314)
Operations & Maintenance (128) (59)
Depreciation & Amortization (5) (7)
Taxes Other Than Income Taxes (9) (3)
Operating Income 87 25
Net Interest/AFUDC (8) (1)
Income Taxes (32) 1
Operating Earnings 47 25
Proforma Adjustments, Net of Tax 3 (105)
GAAP Earnings (Loss) $50 ($80)
EPS from Operating Earnings $0.10 $0.05
4th Quarter Summary
See slide 15 for items excluded from Net Income to reconcile to Operating Earnings
Key Drivers: Q4-17 vs. Q4-16
Generation decreased 7,563 GWh (78%) Q4-17 vs. Q4-16 primarily due to sale of plants in January
AEP Dayton ATC liquidations up 3%: $30.23/MWh
in Q4-17 vs. $29.28/MWh in Q4-16
Income Taxes: effective tax rate of (6.1%) Q4-17 vs. 39.9% Q4-16. Current quarter reflects positive impact of solar investment tax credits being recognized on an amortized basis.
24
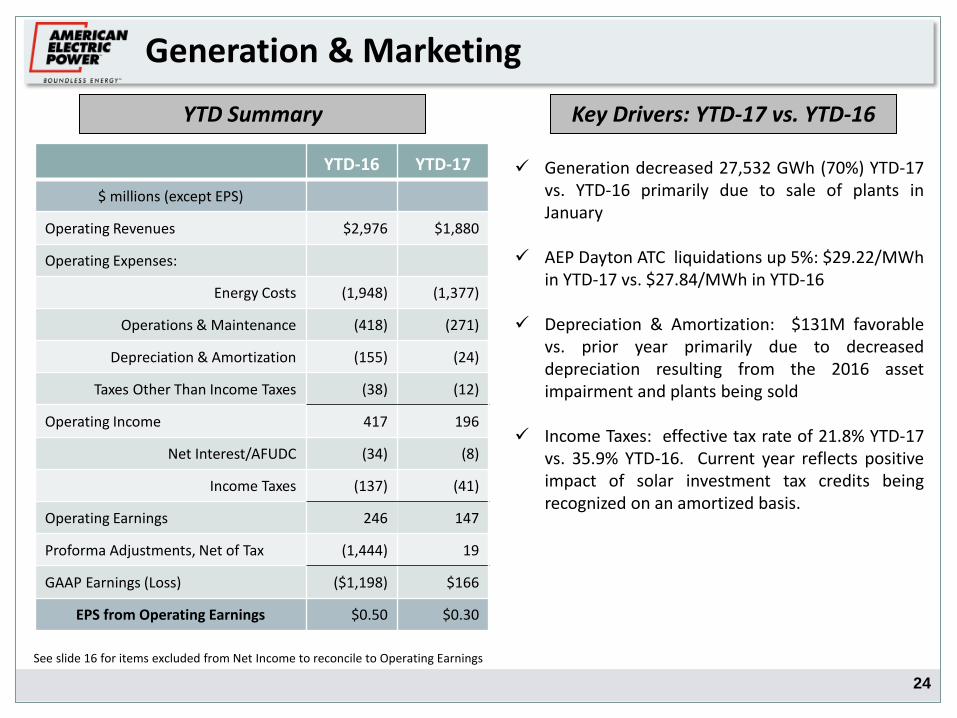
Generation & Marketing
YTD-16 YTD-17
$ millions (except EPS)
Operating Revenues $2,976 $1,880
Operating Expenses:
Energy Costs (1,948) (1,377)
Operations & Maintenance (418) (271)
Depreciation & Amortization (155) (24)
Taxes Other Than Income Taxes (38) (12)
Operating Income 417 196
Net Interest/AFUDC (34) (8)
Income Taxes (137) (41)
Operating Earnings 246 147
Proforma Adjustments, Net of Tax (1,444) 19
GAAP Earnings (Loss) ($1,198) $166
EPS from Operating Earnings $0.50 $0.30
YTD Summary
See slide 16 for items excluded from Net Income to reconcile to Operating Earnings
Key Drivers: YTD-17 vs. YTD-16
Generation decreased 27,532 GWh (70%) YTD-17 vs. YTD-16 primarily due to sale of plants in January
AEP Dayton ATC liquidations up 5%: $29.22/MWh
in YTD-17 vs. $27.84/MWh in YTD-16
Depreciation & Amortization: $131M favorable vs. prior year primarily due to decreased depreciation resulting from the 2016 asset impairment and plants being sold
Income Taxes: effective tax rate of 21.8% YTD-17 vs. 35.9% YTD-16. Current year reflects positive impact of solar investment tax credits being recognized on an amortized basis.

25
Rate Changes*, net of offsets (in millions)
Q4-17 vs. Q4-16
APCo/WPCo -
I&M ($1)
KPCo -
PSO $12
SWEPCO $33
Kingsport -
TOTAL $44
Impact on EPS
4th Quarter Retail Rate Performance
Rate Changes, net of offsets (in millions)
Q4-17 vs. Q4-16
AEP Ohio -
AEP Texas $4
TOTAL $4
Impact on EPS $0.01
Transmission & Distribution Utilities Vertically Integrated Utilities
* Includes rate true-ups.
$0.06
26
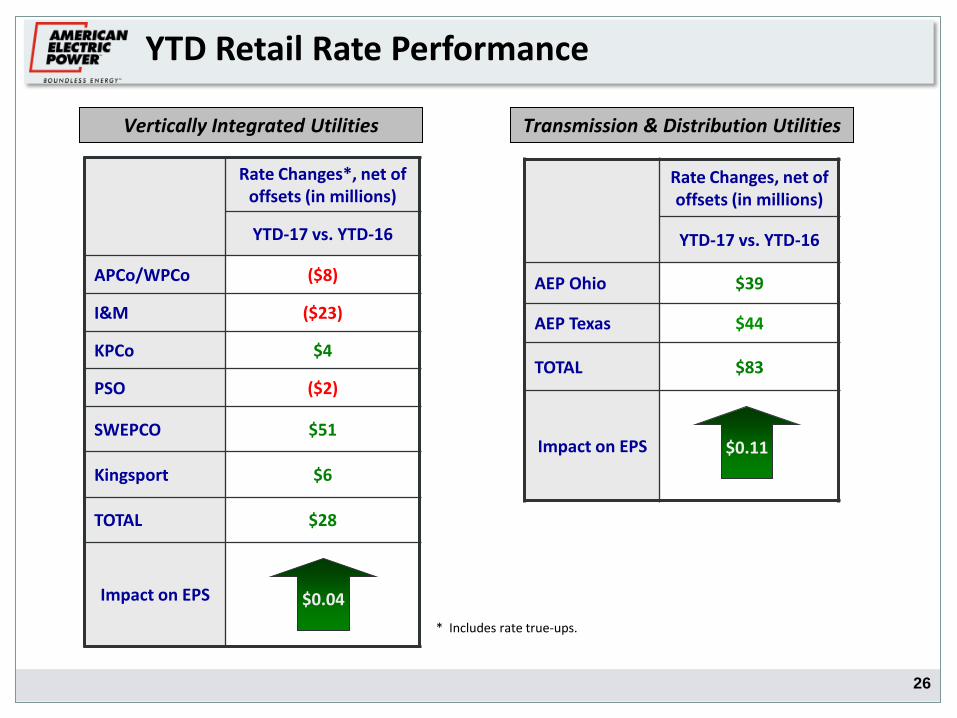
Rate Changes*, net of offsets (in millions)
YTD-17 vs. YTD-16
APCo/WPCo ($8)
I&M ($23)
KPCo $4
PSO ($2)
SWEPCO $51
Kingsport $6
TOTAL $28
Impact on EPS
YTD Retail Rate Performance
Rate Changes, net of offsets (in millions)
YTD-17 vs. YTD-16
AEP Ohio $39
AEP Texas $44
TOTAL $83
Impact on EPS $0.11
Transmission & Distribution Utilities Vertically Integrated Utilities
* Includes rate true-ups.
$0.04
27
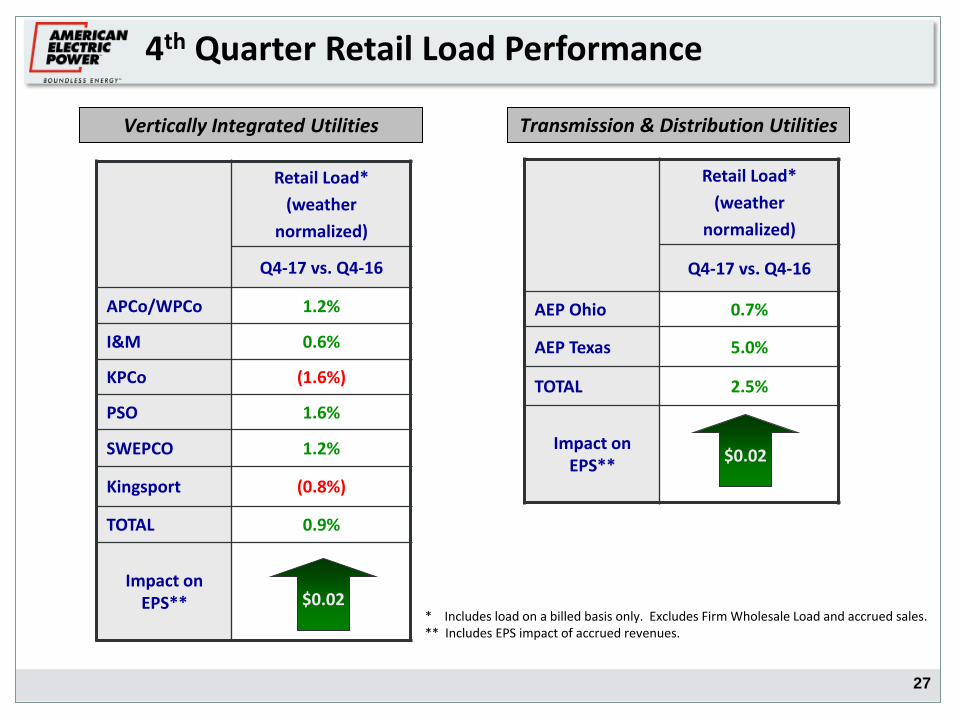
Retail Load*
(weather
normalized)
Q4-17 vs. Q4-16
AEP Ohio 0.7%
AEP Texas 5.0%
TOTAL 2.5%
Impact on EPS**
Retail Load*
(weather
normalized)
Q4-17 vs. Q4-16
APCo/WPCo 1.2%
I&M 0.6%
KPCo (1.6%)
PSO 1.6%
SWEPCO 1.2%
Kingsport (0.8%)
TOTAL 0.9%
Impact on EPS**
4th Quarter Retail Load Performance
Transmission & Distribution Utilities Vertically Integrated Utilities
* Includes load on a billed basis only. Excludes Firm Wholesale Load and accrued sales. ** Includes EPS impact of accrued revenues.
$0.02
$0.02
28
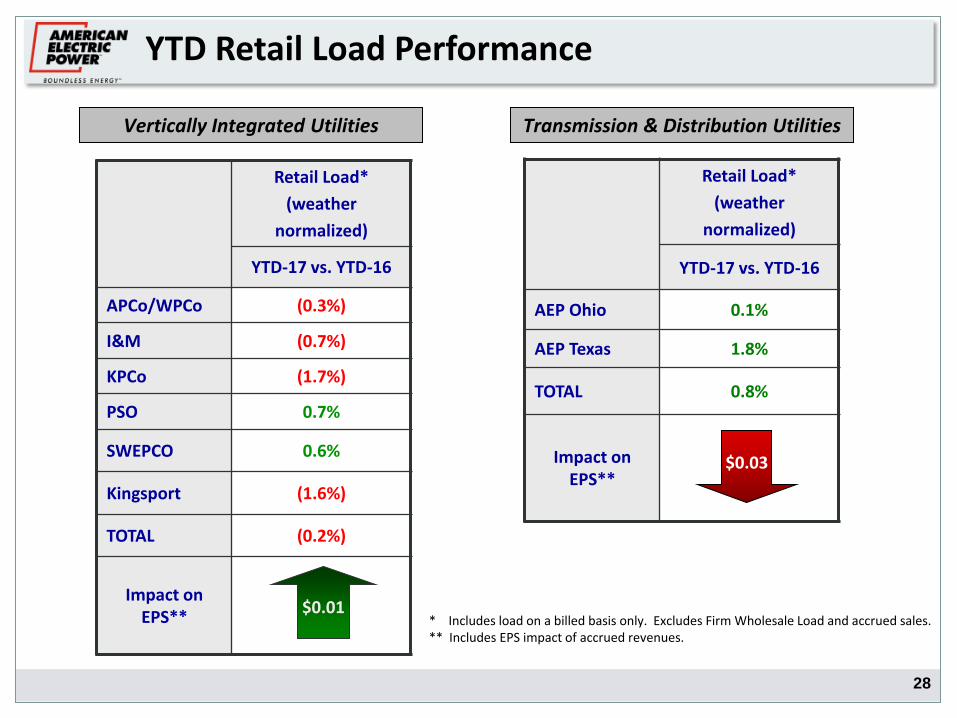
Retail Load*
(weather
normalized)
YTD-17 vs. YTD-16
AEP Ohio 0.1%
AEP Texas 1.8%
TOTAL 0.8%
Impact on EPS**
Retail Load*
(weather
normalized)
YTD-17 vs. YTD-16
APCo/WPCo (0.3%)
I&M (0.7%)
KPCo (1.7%)
PSO 0.7%
SWEPCO 0.6%
Kingsport (1.6%)
TOTAL (0.2%)
Impact on EPS**
YTD Retail Load Performance
Transmission & Distribution Utilities Vertically Integrated Utilities
* Includes load on a billed basis only. Excludes Firm Wholesale Load and accrued sales. ** Includes EPS impact of accrued revenues.
$0.01
$0.03

29
Normalized Retail Load Trends (Billed & Accrued)
Note: Load figures are provided on a billed and accrued basis. Charts reflect connected load and exclude firm wholesale and Buckeye Power backup load.
30
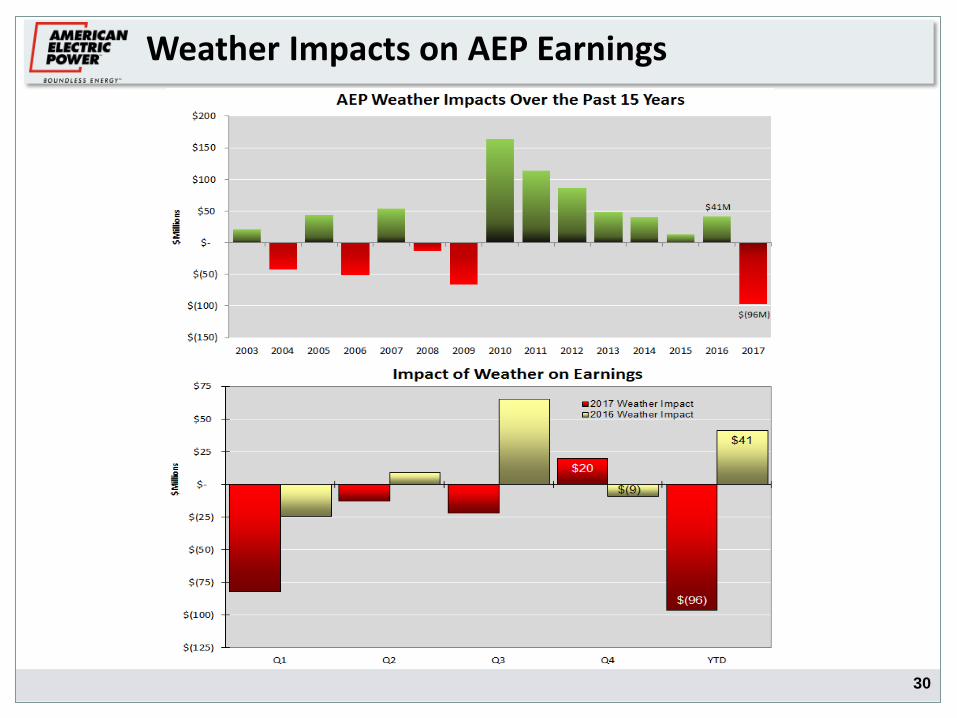
Weather Impacts on AEP Earnings
31
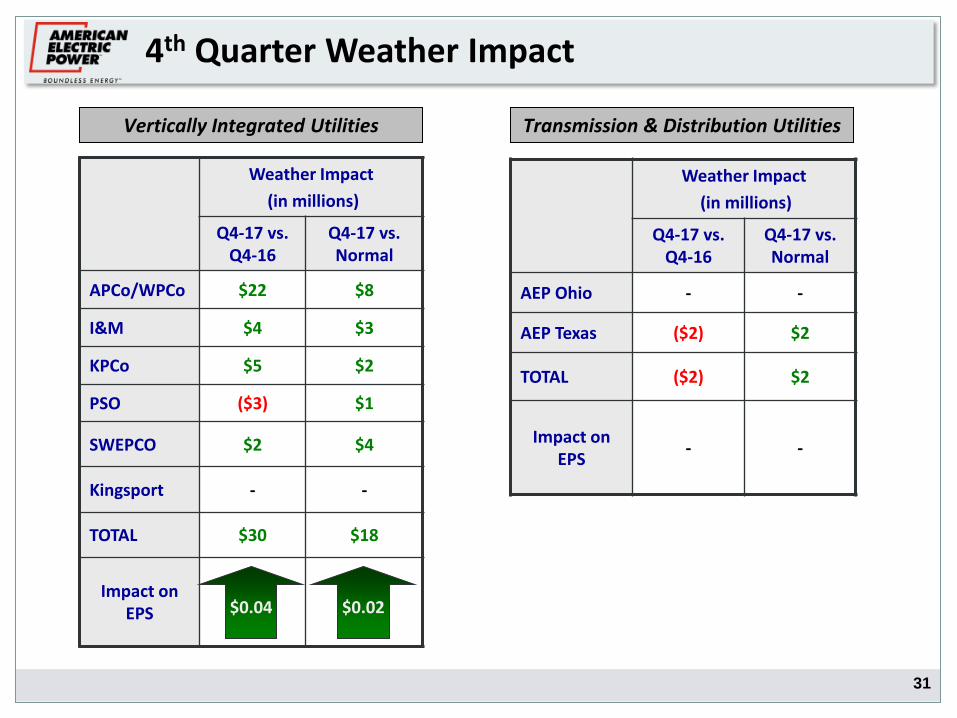
Weather Impact
(in millions)
Q4-17 vs. Q4-16
Q4-17 vs. Normal
APCo/WPCo $22 $8
I&M $4 $3
KPCo $5 $2
PSO ($3) $1
SWEPCO $2 $4
Kingsport - -
TOTAL $30 $18
Impact on EPS
Weather Impact
(in millions)
Q4-17 vs. Q4-16
Q4-17 vs. Normal
AEP Ohio - -
AEP Texas ($2) $2
TOTAL ($2) $2
Impact on EPS
-
-
Transmission & Distribution Utilities Vertically Integrated Utilities
4th Quarter Weather Impact
$0.04 $0.02

32
Weather Impact
(in millions)
YTD-17 vs. YTD-16
YTD-17 vs. Normal
APCo/WPCo ($49) ($36)
I&M ($25) ($19)
KPCo ($12) ($10)
PSO ($18) ($9)
SWEPCO ($27) ($26)
Kingsport ($2) -
TOTAL ($133) ($100)
Impact on EPS
Weather Impact
(in millions)
YTD-17 vs. YTD-16
YTD-17 vs. Normal
AEP Ohio - -
AEP Texas ($4) $4
TOTAL ($4) $4
Impact on EPS
Transmission & Distribution Utilities Vertically Integrated Utilities
YTD Weather Impact
$0.13
$0.01
$0.18
$0.01
33
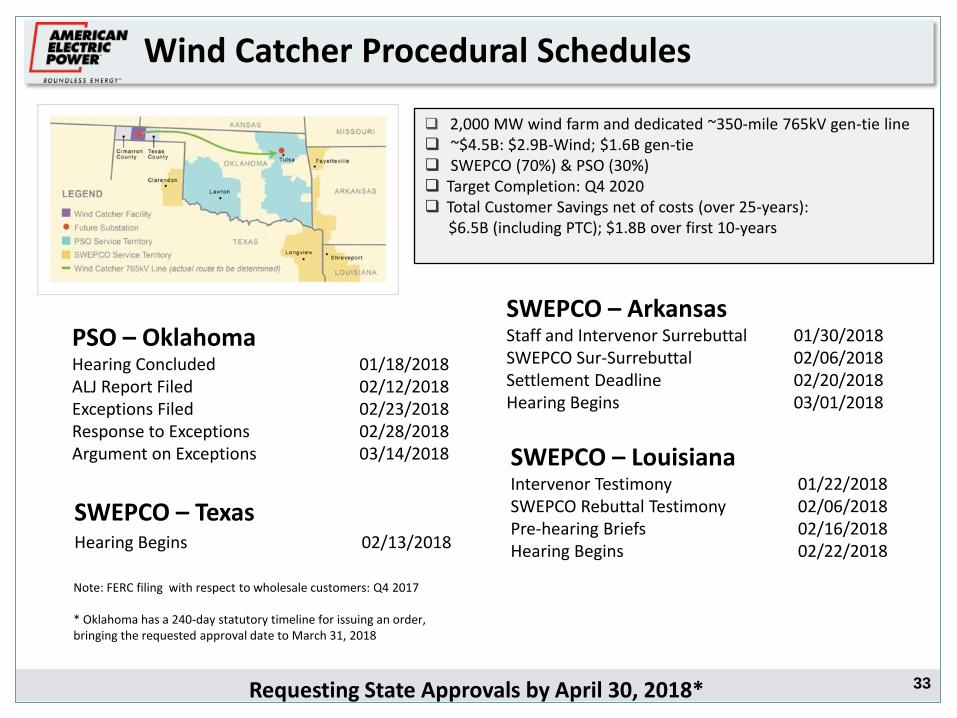
Wind Catcher Procedural Schedules
2,000 MW wind farm and dedicated ~350-mile 765kV gen-tie line ~$4.5B: $2.9B-Wind; $1.6B gen-tie SWEPCO (70%) & PSO (30%) Target Completion: Q4 2020 Total Customer Savings net of costs (over 25-years): $6.5B (including PTC); $1.8B over first 10-years
SWEPCO – Texas Hearing Begins 02/13/2018
PSO – Oklahoma Hearing Concluded 01/18/2018 ALJ Report Filed 02/12/2018 Exceptions Filed 02/23/2018 Response to Exceptions 02/28/2018 Argument on Exceptions 03/14/2018
SWEPCO – Arkansas Staff and Intervenor Surrebuttal 01/30/2018 SWEPCO Sur-Surrebuttal 02/06/2018 Settlement Deadline 02/20/2018 Hearing Begins 03/01/2018
SWEPCO – Louisiana Intervenor Testimony 01/22/2018 SWEPCO Rebuttal Testimony 02/06/2018 Pre-hearing Briefs 02/16/2018 Hearing Begins 02/22/2018
Note: FERC filing with respect to wholesale customers: Q4 2017 * Oklahoma has a 240-day statutory timeline for issuing an order, bringing the requested approval date to March 31, 2018
Requesting State Approvals by April 30, 2018*
34
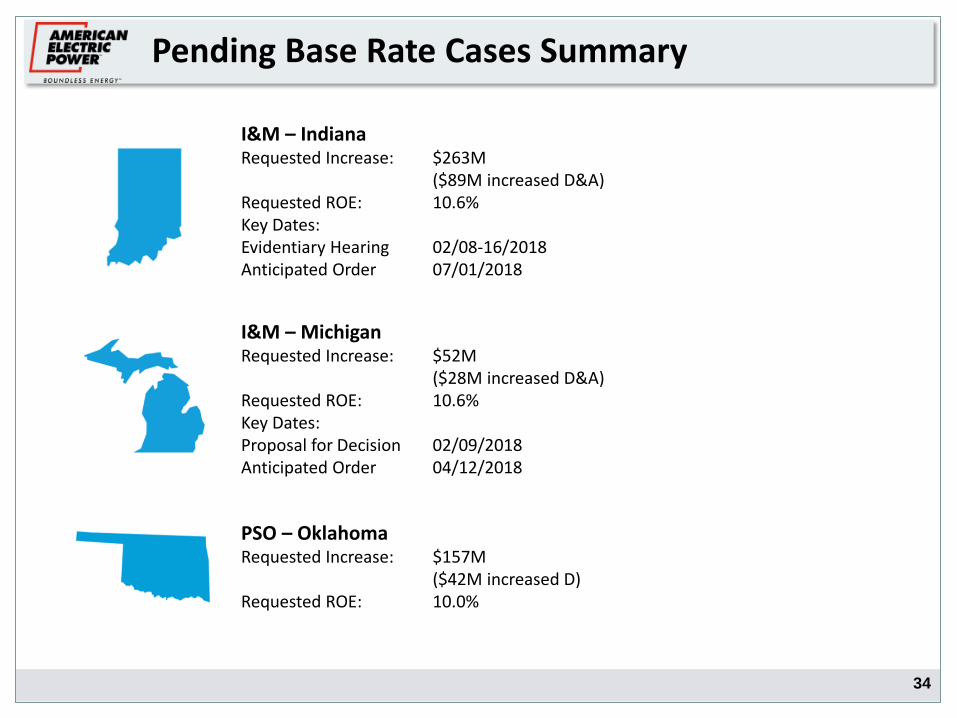
Pending Base Rate Cases Summary
I&M – Indiana Requested Increase: $263M ($89M increased D&A) Requested ROE: 10.6% Key Dates: Evidentiary Hearing 02/08-16/2018 Anticipated Order 07/01/2018
I&M – Michigan Requested Increase: $52M ($28M increased D&A) Requested ROE: 10.6% Key Dates: Proposal for Decision 02/09/2018 Anticipated Order 04/12/2018
PSO – Oklahoma Requested Increase: $157M ($42M increased D) Requested ROE: 10.0%
35
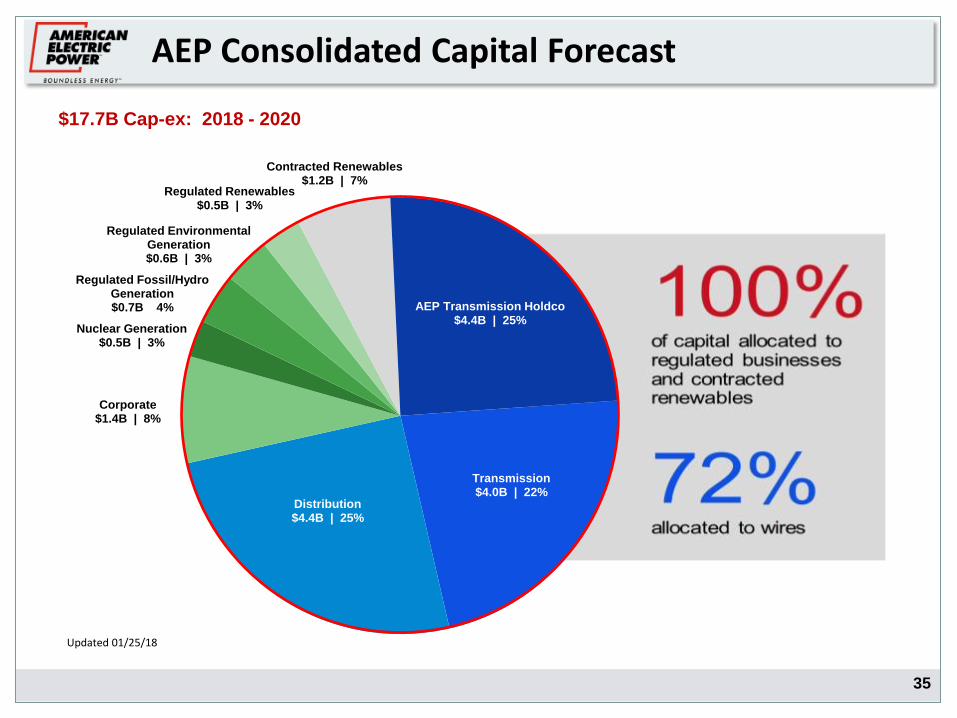
AEP Consolidated Capital Forecast
Transmission $4.0B | 22%
Distribution $4.4B | 25%
Corporate $1.4B | 8%
Nuclear Generation $0.5B | 3%
Regulated Fossil/Hydro Generation $0.7B 4%
Regulated Environmental Generation $0.6B | 3%
Regulated Renewables $0.5B | 3%
Contracted Renewables $1.2B | 7%
AEP Transmission Holdco $4.4B | 25%
$17.7B Cap-ex: 2018 - 2020
Updated 01/25/18
36
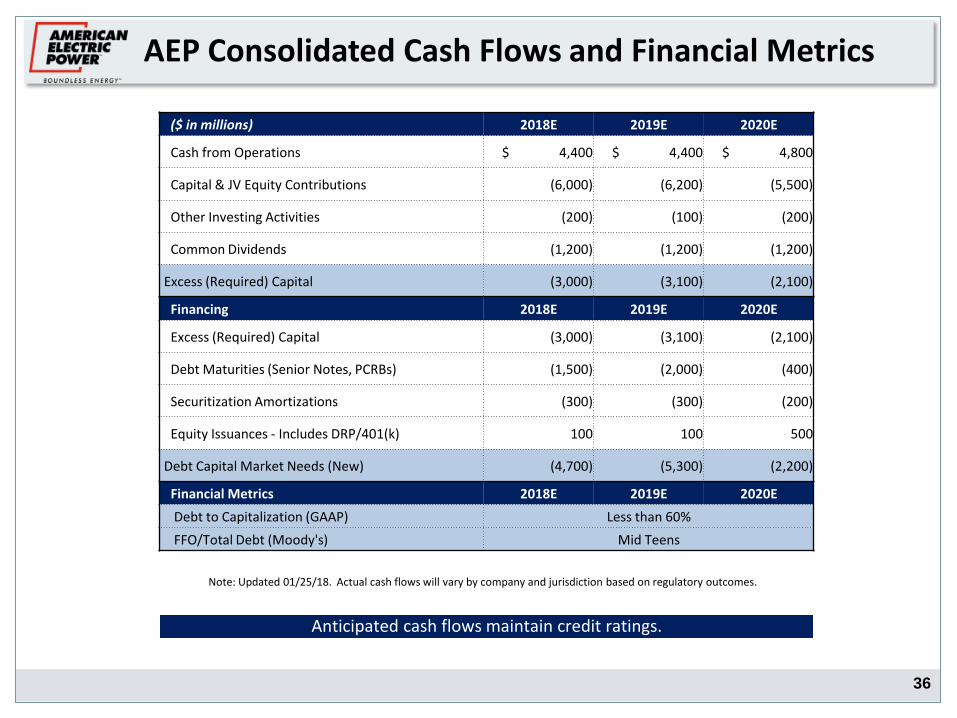
AEP Consolidated Cash Flows and Financial Metrics
($ in millions) 2018E 2019E 2020E
Cash from Operations $ 4,400 $ 4,400 $ 4,800
Capital & JV Equity Contributions (6,000) (6,200) (5,500)
Other Investing Activities (200) (100) (200)
Common Dividends (1,200) (1,200) (1,200)
Excess (Required) Capital (3,000) (3,100) (2,100)
Financing 2018E 2019E 2020E
Excess (Required) Capital (3,000) (3,100) (2,100)
Debt Maturities (Senior Notes, PCRBs) (1,500) (2,000) (400)
Securitization Amortizations (300) (300) (200)
Equity Issuances - Includes DRP/401(k) 100 100 500
Debt Capital Market Needs (New) (4,700) (5,300) (2,200)
Financial Metrics 2018E 2019E 2020E
Debt to Capitalization (GAAP) Less than 60%
FFO/Total Debt (Moody's) Mid Teens
Note: Updated 01/25/18. Actual cash flows will vary by company and jurisdiction based on regulatory outcomes.
Anticipated cash flows maintain credit ratings.

37
GAAP to Non-GAAP Reconciliations & Ratios
Adjusted Total Debt Calculation Adjusted FFO Calculation
As of 12/31/17
$ millions
GAAP Total Debt (incl. current maturities) $22,812
Less:
Securitization Bonds (1,424)
Spent Nuclear Fuel Trust (269)
Add: Capital Lease Obligations 298
Pension 259
Off-balance Sheet Leases 1,038
Adjusted Total Debt (Non-GAAP) $22,714
Adjusted Funds from Operations (FFO)
Adjusted Total Debt (Non-GAAP)
$4,257
$22,714 = = 18.7% FFO to Total Debt Ratio
12 Months Ended
12/31/17
$ millions
Cash Flow From Operations $4,282
Adjustments:
Changes in Working Capital 162
Capitalized Interest (49)
Securitization Amortization (299)
Lease Payments 161
Adjusted Funds from Operations (FFO) $4,257