earnings release q4 2011 - images.samsung.com · disclaimer the financial information in this...
TRANSCRIPT

Earnings Release Q4 2011
S El t iSamsung Electronics
January 2012

DisclaimerDisclaimer
The financial information in this document are consolidated earnings results based on K-IFRS.
This document is provided for the convenience of investors only, before our external audit on Q4 2011 financial
results of our headquarters is completed. The audit outcomes may cause some parts of this document to change.
This document contains "forward-looking statements" - that is, statements related to future, not past, events.
In this context, "forward-looking statements" often address our expected future business and financial performance,
and often contain words such as "expects”, "anticipates”, "intends”, "plans”, "believes”, "seeks” or "will ". p , p , , p , ,
“Forward-looking statements" by their nature address matters that are, to different degrees, uncertain.
For us, particular uncertainties which could adversely or positively affect our future results include:
· The behavior of financial markets including fluctuations in exchange rates interest rates and commodity prices The behavior of financial markets including fluctuations in exchange rates, interest rates and commodity prices
· Strategic actions including dispositions and acquisitions
· Unanticipated dramatic developments in our major businesses including Semiconductor, DP (Display Panel),
Telecommunication, DM & A (Digital Media & Appliances)
Numerous other matters at the national and international levels which could affect our future results· Numerous other matters at the national and international levels which could affect our future results
These uncertainties may cause our actual results to be materially different from those expressed in this document.

Income Statement Income Statement
(Unit: Trillion Won) 4Q ’11 % of sales 4Q ’10 % of sales 3Q ’11 FY ’11 % of sales FY ’10 % of sales( ) 4Q 11 4Q 10 3Q 11 FY 11 FY 10
Sales 47.30 100.0% 41.87 100.0% 41.27 165.00 100.0% 154.63 100.0%
Cost of Sales 31.51 66.6% 29.12 69.5% 27.75 112.15 68.0% 102.67 66.4%
Gross Profit 15.79 33.4% 12.76 30.5% 13.52 52.86 32.0% 51.96 33.6%
R&D expenses 2.74 5.8% 2.43 5.8% 2.43 9.98 6.0% 9.10 5.9%
SG&A expenses 8.46 17.9% 7.20 17.2% 6.80 27.42 16.6% 26.24 17.0%
Other operating profits/losses 0.70 1.5% △0.12 △0.3% △0.04 0.79 0.5% 0.68 0.4%
Operating Profit 5.30 11.2% 3.01 7.2% 4.25 16.25 9.8% 17.30 11.2%. 5Equity method gains/losses 0.32 0.7% 0.69 1.7% 0.29 1.40 0.8% 2.27 1.5%
Finance incomes/expenses △0.14 △0.3% △0.09 △0.2% △ 0.41 △0.49 △0.3% △0.24 △0.2%
Profit Before Income Tax 5.47 11.6% 3.62 8.6% 4.13 17.16 10.4% 19.33 12.5%
Income ta 1 47 3 1% 0 20 0 % 0 69 3 42 2 1% 3 18 2 1%
Key Profitability Indicators
Income tax 1.47 3.1% 0.20 0.5% 0.69 3.42 2.1% 3.18 2.1%
Net profit 4.00 8.5% 3.42 8.2% 3.44 13.73 8.3% 16.15 10.4%
4Q ’11 4Q ’10 3Q ’11 FY ’11 FY ’10
ROE 17% 17% 15% 14% 20%Profitability (Net income/Sales) 0.08 0.08 0.08 0.08 0.10
Asset turnover (Sales/Asset) 1 31 1 36 1 17 1 14 1 25
17%
15%17%
14%
18%19%
Asset turnover (Sales/Asset) 1.31 1.36 1.17 1.14 1.25
Leverage (Asset/Equity) 1.52 1.52 1.50 1.52 1.52
EBITDA Margin 19% 14% 18% 18% 18%
1
4Q ’10 3Q ’11 4Q ’11
ROE EBITDA Margin
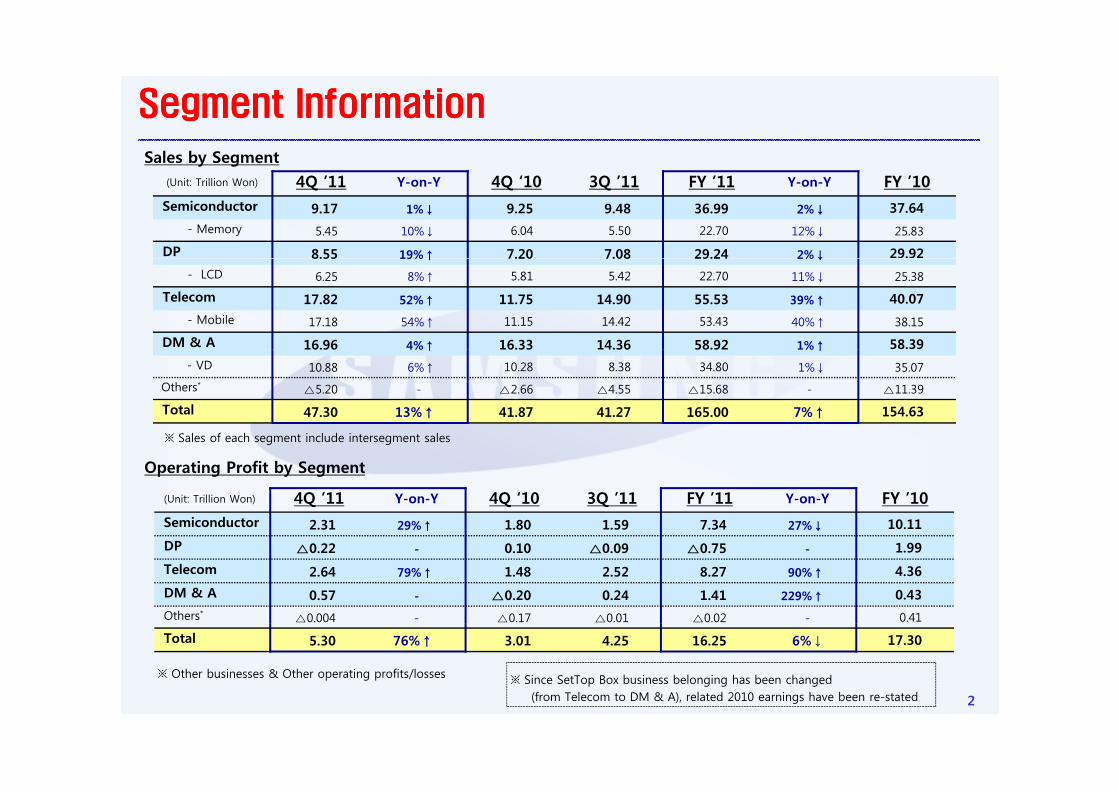
Sales by Segment
Segment InformationSegment Information
(Unit: Trillion Won) 4Q ’11 Y-on-Y 4Q ‘10 3Q ’11 FY ’11 Y-on-Y FY ’10Semiconductor 9.17 1%↓ 9.25 9.48 36.99 2%↓ 37.64
- Memory 5.45 10%↓ 6.04 5.50 22.70 12%↓ 25.83
DP 8.55 19%↑ 7.20 7.08 29.24 2%↓ 29.928.55 19%↑ 7.20 7.08 29.24 2%↓
- LCD 6.25 8%↑ 5.81 5.42 22.70 11%↓ 25.38
Telecom 17.82 52%↑ 11.75 14.90 55.53 39%↑ 40.07
- Mobile 17.18 54%↑ 11.15 14.42 53.43 40%↑ 38.15
DM & A 16.96 4%↑ 16.33 14.36 58.92 1%↑ 58.39↑ ↑
- VD 10.88 6%↑ 10.28 8.38 34.80 1%↓ 35.07
Others* △5.20 - △2.66 △4.55 △15.68 - △11.39
Total 47.30 13%↑ 41.87 41.27 165.00 7%↑ 154.63
※ Sales of each segment include intersegment sales
(Unit: Trillion Won) 4Q ’11 Y-on-Y 4Q ‘10 3Q ’11 FY ’11 Y-on-Y FY ’10Semiconductor 2.31 29%↑ 1.80 1.59 7.34 27%↓ 10.11
Operating Profit by Segment
※ Sales of each segment include intersegment sales
DP △0.22 - 0.10 △0.09 △0.75 - 1.99
Telecom 2.64 79%↑ 1.48 2.52 8.27 90%↑ 4.36
DM & A 0.57 - △0.20 0.24 1.41 229%↑ 0.43
Others* △0.004 - △0.17 △0.01 △0.02 - 0.41
Total 5.30 76%↑ 3.01 4.25 16.25 6%↓ 17.30
2
※ Other businesses & Other operating profits/losses ※ Since SetTop Box business belonging has been changed (from Telecom to DM & A), related 2010 earnings have been re-stated

Cash Flow StatementCash Flow Statement
(Unit: Trillion Won) 4Q ’11 FY ’11 FY ’10Q
Cash (Beginning of period)* 21.75 22.48 20.88
Cash flow from Operation 7.32 22.92 23.83
Net profit 4.00 13.73 16.15
Depreciation 3.49 12.93 10.85
Others △0.17 △3.74 △3.17
Cash flow from Investment △4.74 △21.62 △22.03
Increase in tangible assets △5.93 △21.97 △21.62
Cash flow from Finance 2.85 3.11 △0.15
Increase in Debts 2.81 3.76 1.70
Net increase in cash 5.13 4.40 1.60
C h (E d f i d)* 26 88 26 88 22 48
Cash Balance
* Cash = Cash + Cash equivalents + Short-term financial instruments + Short-term available-for-sale securities
Cash (End of period)* 26.88 26.88 22.48
Cash Net Cash
22.48 22.34 19.07
11 70 10.79 9 6012.23
21.75
26.88 Capex- 2011 : 23 trillion won (executed)
ㆍ Semiconductor 13.0 trillion won, DP 6.4 trillion won, etc.- 2012 : 25 trillion won (planned)
‘10 4Q ’11 1Q ’11 2Q ’11 3Q
11.70 10.798.10
’11 4Q
9.60 2012 : 25 trillion won (planned)ㆍ Semiconductor 15.0 trillion won, DP 6.6 trillion won, etc.
※ Subject to change based on market conditions
3
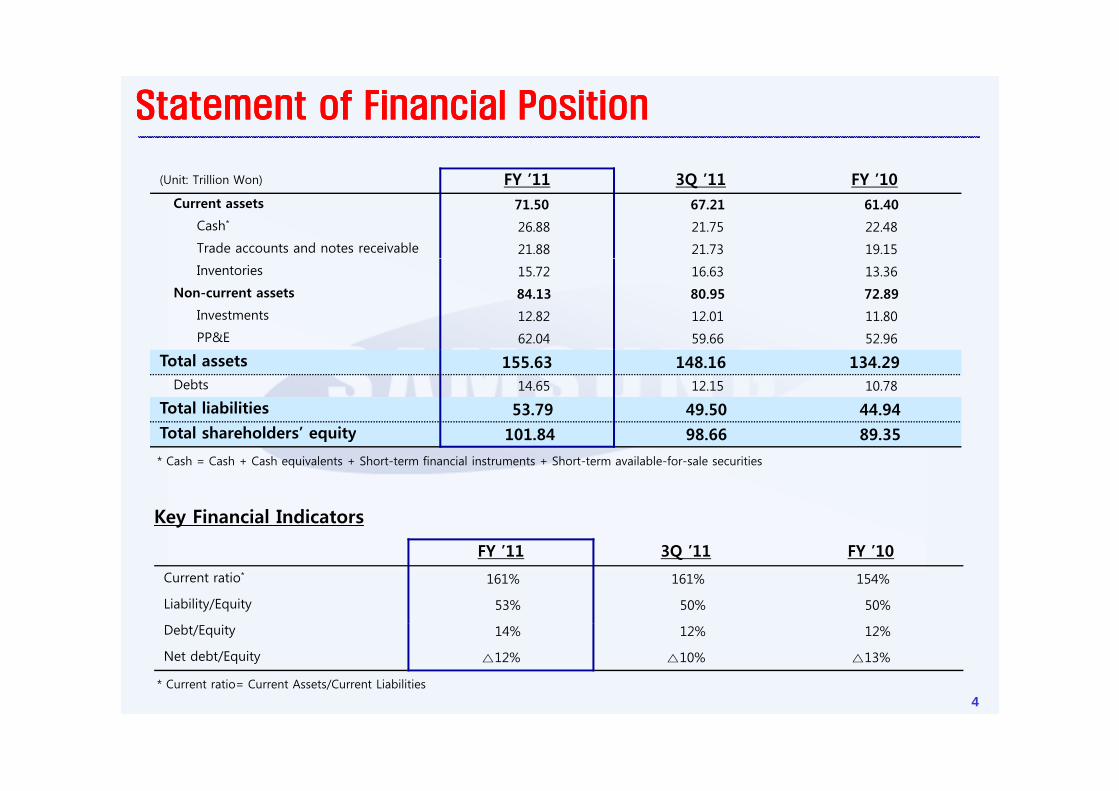
Statement of Financial Position Statement of Financial Position
(Unit: Trillion Won) FY ’11 3Q ’11 FY ’10Current assets 71.50 67.21 61.40
Cash* 26.88 21.75 22.48
Trade accounts and notes receivable 21.88 21.73 19.15
Inventories 15.72 16.63 13.36
Non-current assets 84.13 80.95 72.89
Investments 12.82 12.01 11.80
PP&E 62.04 59.66 52.96
Total assets 155.63 148.16 134.29Debts 14.65 12.15 10.78
Total liabilities 53.79 49.50 44.94 Total shareholders’ equity 101.84 98.66 89.35
Key Financial Indicators
* Cash = Cash + Cash equivalents + Short-term financial instruments + Short-term available-for-sale securities
q y
FY ’11 3Q ’11 FY ’10
Current ratio* 161% 161% 154%
Liability/Equity 53% 50% 50%
* Current ratio= Current Assets/Current Liabilities
Debt/Equity 14% 12% 12%
Net debt/Equity △12% △10% △13%
4

4Q results
Semiconductor Display Panel
[Memory] [LCD]
□ Market : PC demand remained weak amid lower-than-average seasonality, while mobile/server-related demand remained solid
- DRAM : Oversupply conditions persisted despite industry-wided ti tb k
□ Market : Panel demand was steady and price remained stable amid strong TV sales in developed markets during year-end peak season despite concerns for demand slow-down
- TV panel : Demand was strong during peak seasonproduction cutback - NAND : Channel demand (memory card, etc.) turned weak,
while embedded product demand remained strong
□ Samsung : Reinforced cost competitiveness via geometry i ti d d fit bilit b di
TV panel : Demand was strong during peak season(Black Friday’ in the US, etc.) in North America,while demand slowdown continued in EU due to economic downturn(5%↑QoQ)
IT panel : Demand declined due to flood in Thailandmigration and secured profitability by expanding differentiated solution products
- DRAM : Expanded 3xnm and below node production andincreased mobile/server-related product sales
- NAND : Expanded 2xnm products and increased solution
- IT panel : Demand declined due to flood in Thailandand weak demand for monitors
□ Samsung : Focused on expanding sales of LED panelsthrough value-added/differentiated product line-up
NAND : Expanded 2xnm products and increased solutionproducts (eMMC, SSD, etc.)
[System LSI]
□ Sales declined slightly QoQ due to low seasonality, major
- TV panel shipment : mid-20%↑ QoQ, around 20%↑ YoY
• Shipment of value-added panels increased (LED, 3D TV, etc.)
※ SMD : Shipment and sales growth continued, led byset makers’ year-end inventory adjustment, etc.
- Demand for major products (mobile AP, CIS, etc.) remained solid (High growth continued on a YoY basis)
※ SMD : Shipment and sales growth continued, led by demand increase from smartphones
5

4Q results
Telecommunication DM&A
[Handset]
□ M k t D d i d b id 10% Q Q d t
[ T V ]
□ M k t A id t lit d d i d□ Market : Demand increased by mid-10% QoQ due to strong seasonality
- Smartphones led market growth via launches of new mass market models, etc.
- Developed markets, esp. EU, showed strong demand growth
□ Market : Amid strong seasonality, demand increasedsignificantly in developed markets and solid demandgrowth continued in emerging markets
- Demand increased high-20% QoQ (low-single-digit %↑ YoY)
- LED TV demand increase led overall market growth p , p , g g
□ Samsung : Recorded strong earnings by enhancing high-end & mass market smartphone full line-ups
- Smartphone : Global shipments increased (apprx. 30%↑ QoQ),especially in developed markets
(apprx. 40%↑ QoQ)
□ Samsung : Outperformed the market and improvedprofitability by expanding sales of differentiated LED TVs
- LED TV sales increased by focusing on sales of premium models such as D7/8000 models in developed markets and reinforcing· Amid strong sales of Galaxy S II, shipments grew in all
segments with expansion of high-end (Galaxy Note/Nexus, etc.)and mass-market (Galaxy Ace/Y, etc.) model line-ups
- ASP Increased QoQ due to product mix improvement
such as D7/8000 models in developed markets and reinforcingregion-specific models in emerging markets
- LED TV shipments increased high-50% QoQ;LED TV portion reached around 60% in 4Q※ 2011 : Despite demand slowdown, outperformed the market
and profitability enhanced significantly led by improved※ 2011 : Revenue and shipment grew substantially led by
enhanced market leadership in high-end smartphones .Profitability also improved significantly.
[Network]
and profitability enhanced significantly led by improved product mixes both in developed/emerging markets
[ Digital appliances ]
□ Market : Demand declined QoQ due to global
□ Sales growth continued with expansion of LTEbusiness in domestic market and North America
economic slowdown□ Samsung : Revenue increased QoQ due to
sales growth in developed markets (US, Europe, etc.)
6

Market outlook
T l i tiS i d Telecommunication
□ 2012 outlook- Handset : Demand to increase by high single-digit% YoY· Smartphone growth to continue (over 30%↑YoY) vs.
□ 2012 outlook- DRAM : Competition to intensify in 1H amid weak PC demand ; Specialty DRAM demand to be solid amid concerns over
Semiconductor
feature phone growth to slow down
※ Emerging market and mass-market smartphone demand to increase; price competition to intensify
· LTE to expand in developed markets (US, Korea, Japan, etc.)
- Tablet : Demand to increase significantly YoY
supply increase
- NAND : Embedded product demand from smartphone, tablet,
PC, etc to remain strong
- S.LSI : Continuous growth of smart mobile devices to leaddemand for major products such mobile AP & CIS etc Tablet : Demand to increase significantly YoY
· Competition to intensify due to increase in new mass-marketmodels, etc.
□ 1Q : Global demand to decrease QoQ due to weak seasonality
- Market competition to continue due to new smartphone launches
demand for major products such mobile AP & CIS, etc
□ 1Q : IT demand to be affected by low seasonality ;DRAM oversupply to continue with HDD supply issue leading to PC demand decline, whereas mobile-related NAND/S.LSI demand to remain relatively solid
DM&A
□ 2012 outlook
- TV : Overall market growth to be driven by demand increase
Display Panel
□ 2012 outlook- Despite demand recovery led by emerging markets, concerns g y
in emerging markets and from LED TVs· Continuous rise in LED portion : ’11 mid-40% → ’12 high-60%
- Digital Appliances : Low growth expected in developed markets;Emerging markets demand increase to somewhat slowdown
□ 1Q : TV/digital appliances demand to decrease QoQ
for oversupply situation persist with production increase in China
- Supply-demand balance may improve amid industry-wide capexcutback and panel makers’ conservative control over utilization
□ 1Q : TV panel demand to decrease due to weak seasonality □ 1Q : TV/digital appliances demand to decrease QoQdue to weak seasonality, but increase slightly YoY.
□ 1Q : TV panel demand to decrease due to weak seasonality while IT panel demand to increase amid set maker’s new product launches
7

[Appendix 1] Statement of Financial Position (K-IFRS)(Unit : KRW 100 Million)
FY '11(A)
3Q '11(B)
FY '10(C)
Q-on-Q (A - B)
Y-on-Y (A - C)
Current Assets 715,020 672,143 614,026 42,877 100,994
- Cash ※ 268,776 217,509 224,800 51,267 43,976
- A/R 218,821 217,323 191,531 1,498 27,290
- Inventories 157,167 166,296 133,645 -9,129 23,522
- Other Current Assets 70,256 71,015 64,050 -759 6,206
Non Current Assets 841,292 809,516 728,861 31,776 112,431
- Investment 128,184 120,073 118,007 8,111 10,177
- PP&E 620,440 596,598 529,646 23,842 90,794
- Intangible Assets 33,552 34,082 27,794 -530 5,758
- Other Non Current Assets 59,116 58,763 53,414 353 5,702
1,556,312 1,481,659 1,342,887 74,653 213,425
Liabilities 537,859 495,016 449,397 42,843 88,462
- Debts 146,466 121,522 107,754 24,944 38,712
- Trade Accounts and N/P 102,767 112,756 91,487 -9,989 11,280
- Other Accounts and N/P & Accrued Expenses 160,620 130,063 140,036 30,557 20,584
- Income Tax Payable 12,628 11,502 20,515 1,126 -7,887
- Unearned Revenue & Other Advances 31,658 21,162 19,361 10,496 12,297
- Other Liabilities 83,720 98,011 70,244 -14,291 13,476
Shareholders' Equity 1,018,453 986,643 893,490 31,810 124,963
- Capital Stock 8,975 8,975 8,975 0 0
1,556,312 1,481,659 1,342,887 74,653 213,425
※ Cash = Cash + Cash equivalent + Short-term financial instruments + Marketable securities
Total Liabilities &Shareholder's Equity
Total Assets

[Appendix 2] Income Statement (K-IFRS)(Unit : KRW 100 Million)
FY '11Y-on-Y
4Q '11Q-on-Q
(A) % (B) % (C) % (D) % (A - D) (B - C)
1,650,018 100% 473,040 100% 412,739 100% 1,546,303 100% 103,715 60,301
1,121,451 68.0% 315,093 66.6% 277,542 67.2% 1,026,668 66.4% 94,783 37,551
528,567 32.0% 157,946 33.4% 135,197 32.8% 519,635 33.6% 8,932 22,749
99,798 6.0% 27,425 5.8% 24,292 5.9% 90,994 5.9% 8,804 3,133
274,219 16.6% 84,577 17.9% 67,992 16.5% 262,431 17.0% 11,788 16,585
- Wages & Fee 66,228 4.0% 18,304 3.9% 16,489 4.0% 62,124 4.0% 4,104 1,815
- Marketing Expenses 94,095 5.7% 31,700 6.7% 23,321 5.7% 90,592 5.9% 3,503 8,379
FY '10
SG&A
Gross Profit
Sales
Cost of Sales
R&D
4Q '11 3Q '11FY '11
7,947 0.5% 7,020 1.5% -384 -0.1% 6,756 0.4% 1,191 7,404
162,497 9.8% 52,964 11.2% 42,529 10.3% 172,966 11.2% -10,469 10,435
13,992 0.8% 3,209 0.7% 2,921 0.7% 22,671 1.5% -8,679 288
-4,899 -0.3% -1,428 -0.3% -4,127 -1.0% -2,350 -0.2% -2,549 2,699
- Interest Gain (or Loss) 616 0.0% 232 0.0% 96 0.0% -230 0.0% 846 136
- F/X Related Gain (or Loss) -6,648 -0.4% -2,022 -0.4% -5,565 -1.3% -1,797 -0.1% -4,851 3,543
171,590 10.4% 54,744 11.6% 41,323 10.0% 193,287 12.5% -21,697 13,421
- Income Taxes 34,249 2.1% 14,731 3.1% 6,906 1.7% 31,822 2.1% 2,427 7,825
137,341 8.3% 40,013 8.5% 34,417 8.3% 161,465 10.4% -24,124 5,596
Operating Profits
Other Operating Profits
Finance Incomes / Expenses
Gain(or Loss) on Equity Method Investment
Net Income
Income Before Income Taxes