earnings results briefing for the first quarter of the
TRANSCRIPT
Earnings Results Briefing for the First Quarter of the Fiscal Year Ending March 31, 2022
August 13, 2021Komehyo Holdings Co., Ltd.Securities code: 2780(Second Section, Tokyo and Nagoya Stock Exchanges)
IR・PR DepartmentTEL +81-52-249-5366Email [email protected]
2
1.Overview of Financial Results for the First Quarterof the Fiscal Year Ending March 31, 2022
2.Initiatives for the First Quarter of the Fiscal YearEnding March 31, 2022
3.Reference Information (Company Profile, etc.)
Contents
3
1.Overview of Financial Results for the First Quarterof the Fiscal Year Ending March 31, 2022
2.Initiatives for the First Quarter of the Fiscal YearEnding March 31, 2022
3.Reference Information (Company Profile, etc.)
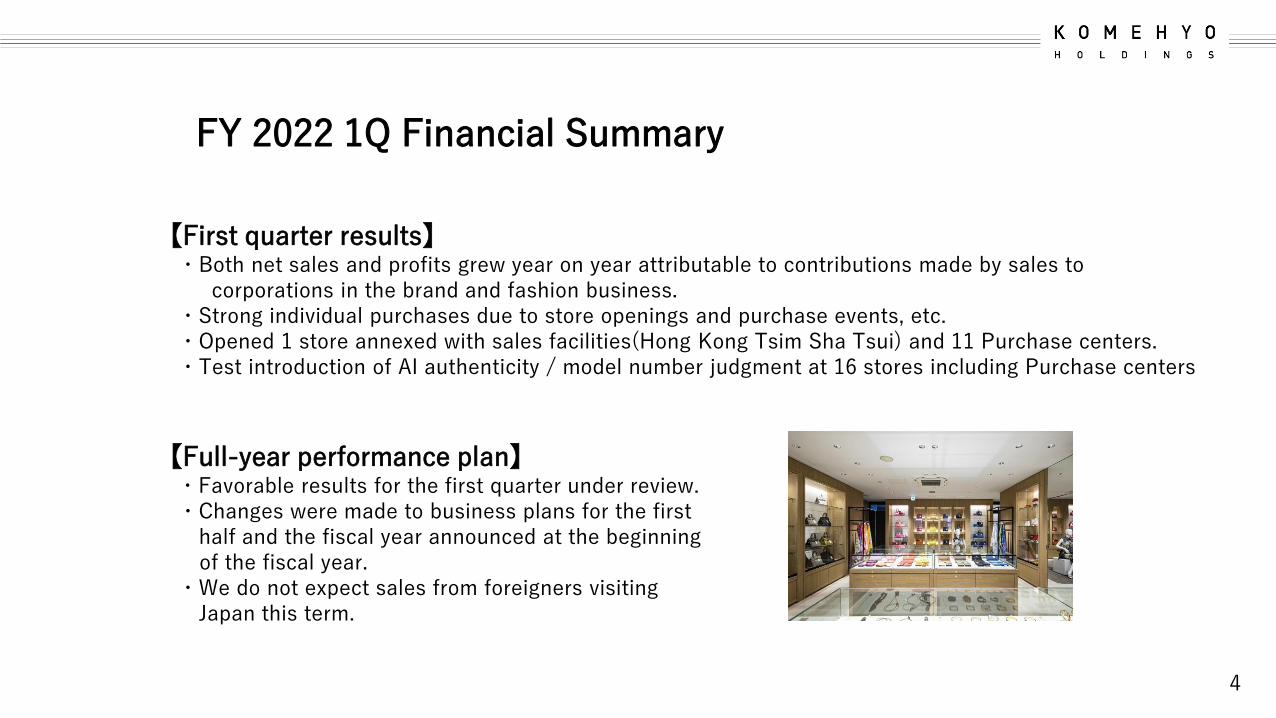
【First quarter results】・Both net sales and profits grew year on year attributable to contributions made by sales to
corporations in the brand and fashion business.・Strong individual purchases due to store openings and purchase events, etc.・Opened 1 store annexed with sales facilities(Hong Kong Tsim Sha Tsui) and 11 Purchase centers.・Test introduction of AI authenticity / model number judgment at 16 stores including Purchase centers
【Full-year performance plan】・Favorable results for the first quarter under review.・Changes were made to business plans for the first
half and the fiscal year announced at the beginningof the fiscal year.
・We do not expect sales from foreigners visiting Japan this term.
4
FY 2022 1Q Financial Summary

(Millions of yen) Net salesOperating income
Ordinary income
Net income
attributable
to owners of
parent
Basic earnings per
share
1HFY2022
Forecasts released
previously26,800 380 340 210 19.17
Revised forecasts
announced on this
occasion30,000 1,020 1,000 680 62.06
Change 3,200 640 660 470 -
Rate of change 11.9% 168.4% 194.1% 223.8% -
FY2022
Forecasts released
previously60,000 1,550 1,450 1,000 91.27
Revised forecasts
announced on this
occasion63,200 2,190 2,110 1,470 134.17
Change 3,200 640 660 470 -
Rate of change 5.3% 41.3% 45.5% 47.0% -5
Strong individual purchases、E-commerce hubs such as OMOs, contact centers, and corporate auctions have been successful under COVID-19
Revision of results forecasts for the first half and the fiscal year ending March 31, 2022
14,000
16,000
18,000
20,000
22,000
24,000
26,000
28,000
30,000
0
50
100
150
200
250
300
350
400
450
500
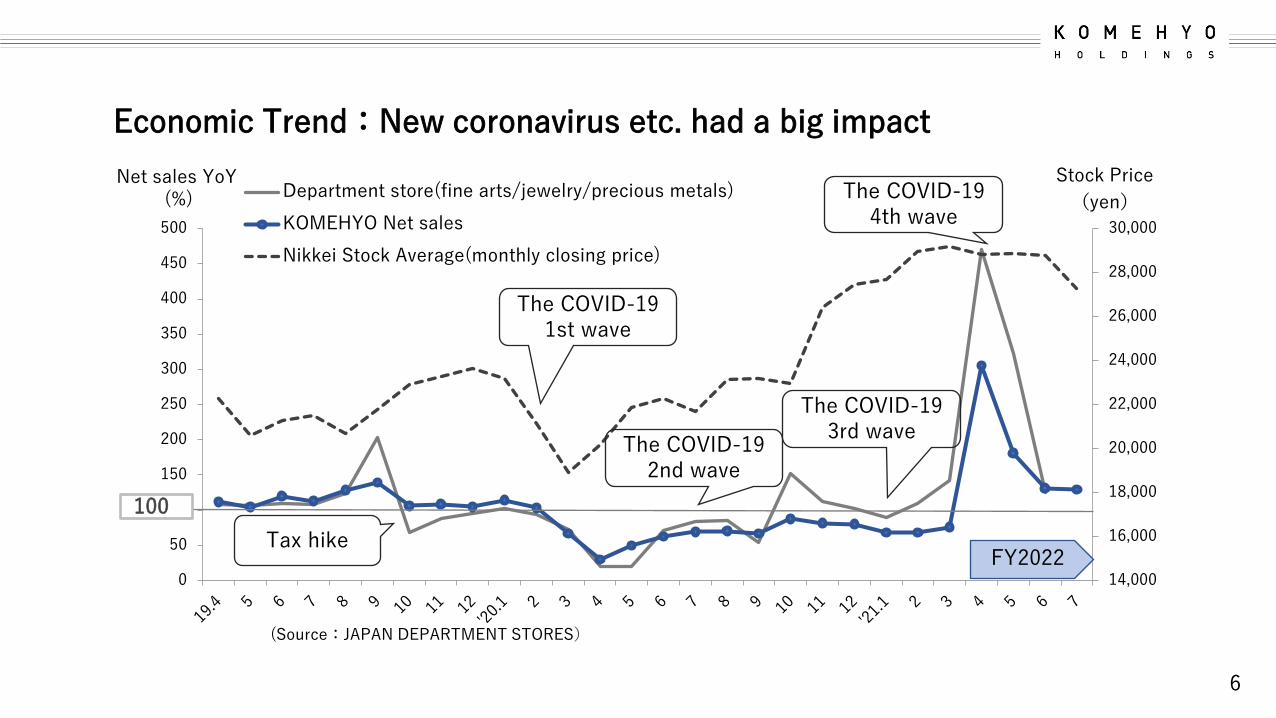
Department store(fine arts/jewelry/precious metals)
KOMEHYO Net sales
Nikkei Stock Average(monthly closing price)
Tax hike
100
The COVID-19 1st wave
Economic Trend:New coronavirus etc. had a big impact
6
Net sales YoY (%)
Stock Price
(yen)
The COVID-19 2nd wave
The COVID-19 3rd wave
(Source:JAPAN DEPARTMENT STORES)
FY2022
The COVID-19 4th wave
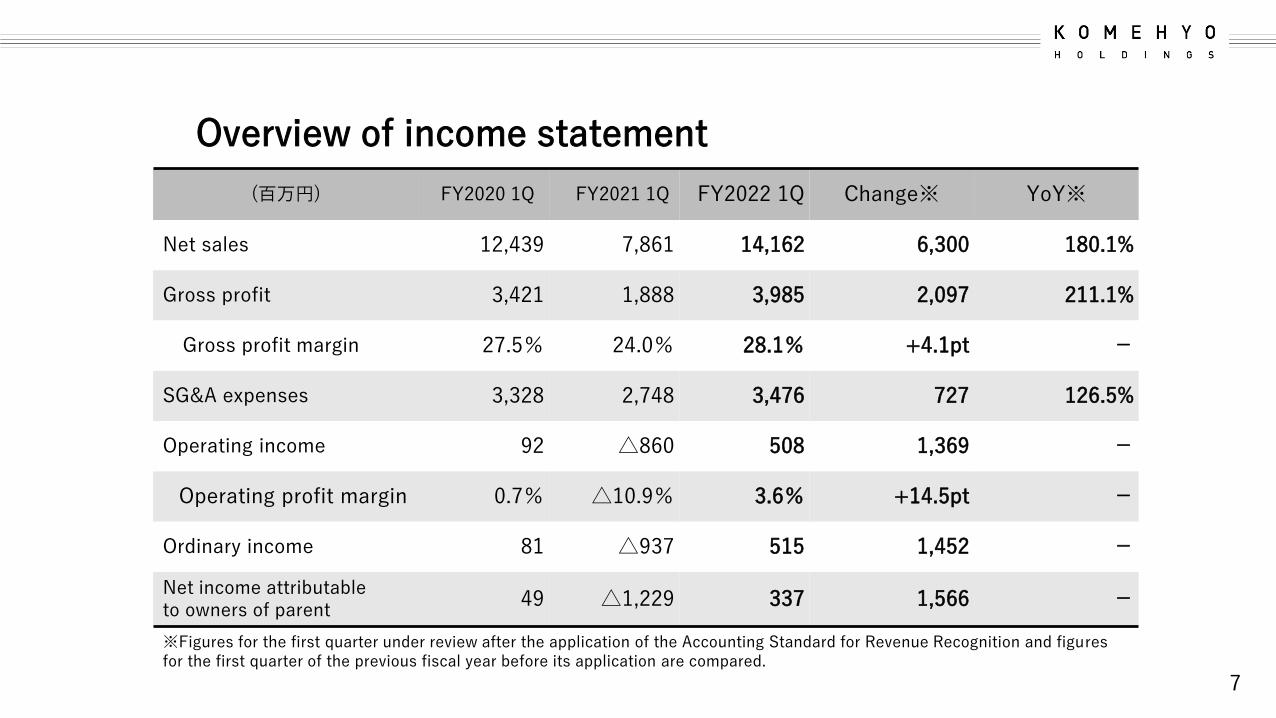
(百万円) FY2020 1Q FY2021 1Q FY2022 1Q Change※ YoY※
Net sales 12,439 7,861 14,162 6,300 180.1%
Gross profit 3,421 1,888 3,985 2,097 211.1%
Gross profit margin 27.5% 24.0% 28.1% +4.1pt -
SG&A expenses 3,328 2,748 3,476 727 126.5%
Operating income 92 △860 508 1,369 -
Operating profit margin 0.7% △10.9% 3.6% +14.5pt -
Ordinary income 81 △937 515 1,452 -
Net income attributableto owners of parent
49 △1,229 337 1,566 -
7
※Figures for the first quarter under review after the application of the Accounting Standard for Revenue Recognition and figuresfor the first quarter of the previous fiscal year before its application are compared.
Overview of income statement
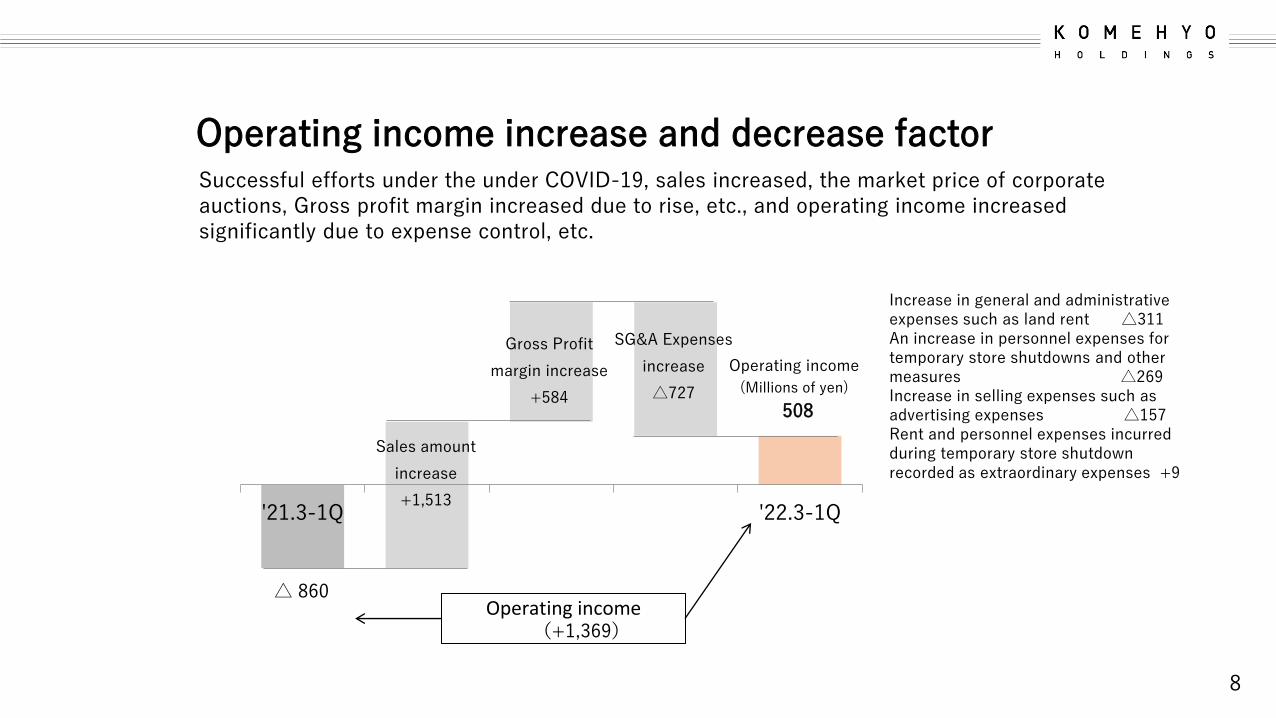
△ 860
508
Sales amount
increase
+1,513
Gross Profit
margin increase
+584
SG&A Expenses
increase
△727
'21.3-1Q '22.3-1Q
Operating income (+1,369)
8
Operating income increase and decrease factor
Increase in general and administrative expenses such as land rent △311An increase in personnel expenses for temporary store shutdowns and other measures △269Increase in selling expenses such as advertising expenses △157Rent and personnel expenses incurred during temporary store shutdownrecorded as extraordinary expenses +9
Successful efforts under the under COVID-19, sales increased, the market price of corporate auctions, Gross profit margin increased due to rise, etc., and operating income increased significantly due to expense control, etc.
Operating income
(Millions of yen)

624 388 545
1,393
1,282 1,542
1,310
1,077
1,388
FY2020-1Q FY2021-1Q FY2022-1Q
9
Changes in selling, general and administrative expenses
(Millions of yen)
SG&A ratios declined due to efficiency-oriented advertisements.
26.8 35.0 24.5
SG&A expenses to sales ratio(%)
General and administrative expenses +310・Increased land rent due to reduced
temporary store shutdown
Personnel expenses +259・Increased Personnel expenses due to reduced
temporary store shutdown
Selling expenses +157・Increase in advertising expenses, etc.
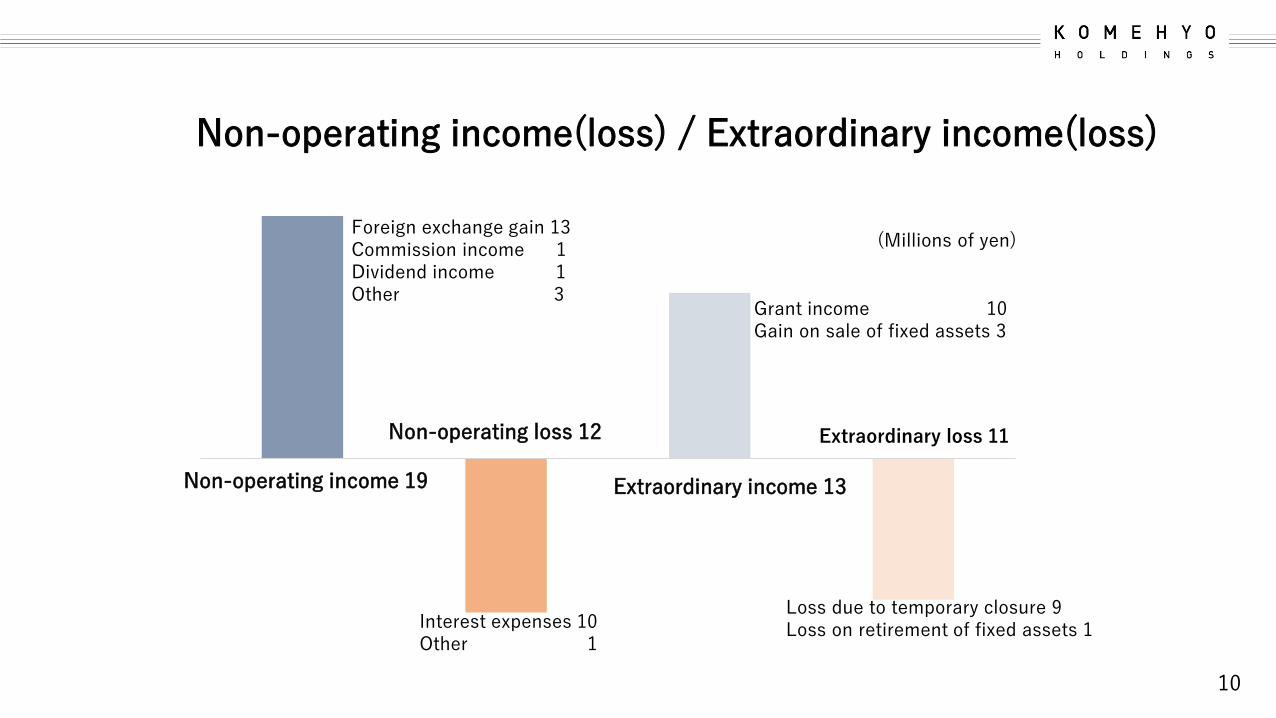
Interest expenses 10Other 1
Non-operating income(loss) / Extraordinary income(loss)
Foreign exchange gain 13Commission income 1Dividend income 1Other 3
Grant income 10Gain on sale of fixed assets 3
Loss due to temporary closure 9Loss on retirement of fixed assets 1
10
(Millions of yen)
Non-operating income 19
Non-operating loss 12
Extraordinary income 13
Extraordinary loss 11

(Millions of yen) FY2021 FY2022 1Q Change
Current assets 27,286 26,328 △957
Cash and deposits 10,538 7,084 △3,454
Products 12,649 15,085 +2,435
Other current assets 4,097 4,158 +61
Non-current assets 10,116 10,143 +27
Total assets 37,402 36,471 △930
Liabilities 18,955 17,644 △1,311
Interest-bearing liabilities 14,746 13,956 △789
Other liabilities 4,209 3,687 △521
Net assets 18,446 18,827 +380
Liabilities and Net Assets
37,402 36,471 △930
11
→Normalization of cash on hand as a precaution against COVID-19
→Merchandise increased with improved purchases from individuals.
→Borrowings decreased with the normalization of cash on hand.
→Attributable to an increase in retained earnings and other factors
Balance sheet overview

(Millions of yen) FY2020 1Q FY2021 1Q FY2022 1Q Change YoY
Bra
nd
Fash
ion
Net sales 11,701 7,137 13,277 6,140 186.0%
Operating income 184 △823 472 1,295 -
Operating margin 1.6% - 3.6% - -
Tire
an
d
Wh
eel
Net sales 716 711 864 153 121.5%
Operating income △95 △33 △20 13 -
Operating margin - - - - -
Real e
sta
te
leasin
g
Net sales 24 16 84 67 513.1%
Operating income 3 △3 25 28 -
Operating margin 15.5% - 29.8% - -
12
Overview by segmentIn the brand / fashion business, individual purchases are strong and the market price of corporate auctions is rising, and in the tire / wheel business, custom products are strong.
※Figures for the first quarter under review after the application of the Accounting Standard for Revenue Recognition and figuresfor the first quarter of the previous fiscal year before its application are compared.
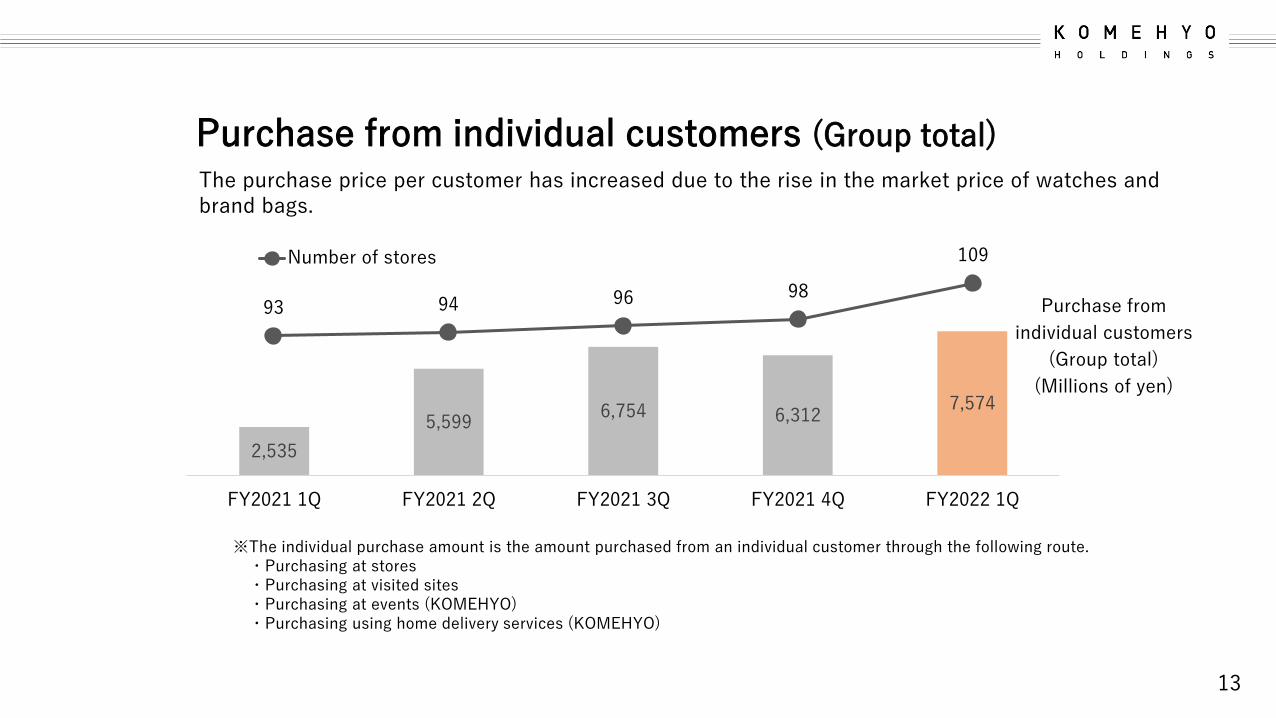
2,535
5,599 6,754 6,312
7,574
FY2021 1Q FY2021 2Q FY2021 3Q FY2021 4Q FY2022 1Q
93 94 96 98
109Number of stores
13
Purchase from individual customers (Group total)
Purchase from
individual customers
(Group total)
(Millions of yen)
※The individual purchase amount is the amount purchased from an individual customer through the following route.・Purchasing at stores・Purchasing at visited sites・Purchasing at events (KOMEHYO)・Purchasing using home delivery services (KOMEHYO)
The purchase price per customer has increased due to the rise in the market price of watches and brand bags.

3,518
6,786 7,421 7,151
7,947
FY2021 1Q FY2021 2Q FY2021 3Q FY2021 4Q FY2022 1Q
2,743 2,591 2,755 2,972 Number of registered
members
14
Changes in corporate auction trade volume
Trade volume
(Millions of yen)
※KOMEHYO auction:The online bidding method※K-BRAND OFF:Japan Brand Auction(JBA)TOKYO-the real bidding method
Japan Brand Auction(JBA)KANAZAWA-the live auction methodJBA Live Net Auction-The online bidding method
Hold the online bidding and the live auction method,trade volume increased due to rising prices of watches and brand bags
JBA
KOMEHYOauction

1,253
2,0062,211 2,176
2,021
FY2021 1Q FY2021 2Q FY2021 3Q FY2021 4Q FY2022 1Q
48.241.0 39.4 41.6 43.7
E-commerce-induced sales rate:EC Sales as a Percentage of Retail Sales
15
EC(KOMEHYO)
E-commerce
induced sales
(Millions of yen)
※KOMEHYO’s online store: Make a purchase by directly clicking the KOMEHYO online store or by making a phone callto a contact center and receiving a customer service.Purchasing from a catalog: Make a purchase after choosing a product from a catalog at the KOMEHYO online store, having the product delivered to a nearby KOMEHYO store and making sure of the product in person.Other companies’ websites: Make a purchase at a store KOMEHYO set up at an Internet sales site operated byanother company.
KOMEHYO website
Back orders
Others
With proposals for 1on1 customer service, EC replacement, and contact center operationThe composition ratio of orders increased compared to the same period of the previous year

16
1.Overview of Financial Results for the First Quarterof the Fiscal Year Ending March 31, 2022
2.Initiatives for the First Quarter of the Fiscal YearEnding March 31, 2022
3.Reference Information (Company Profile, etc.)
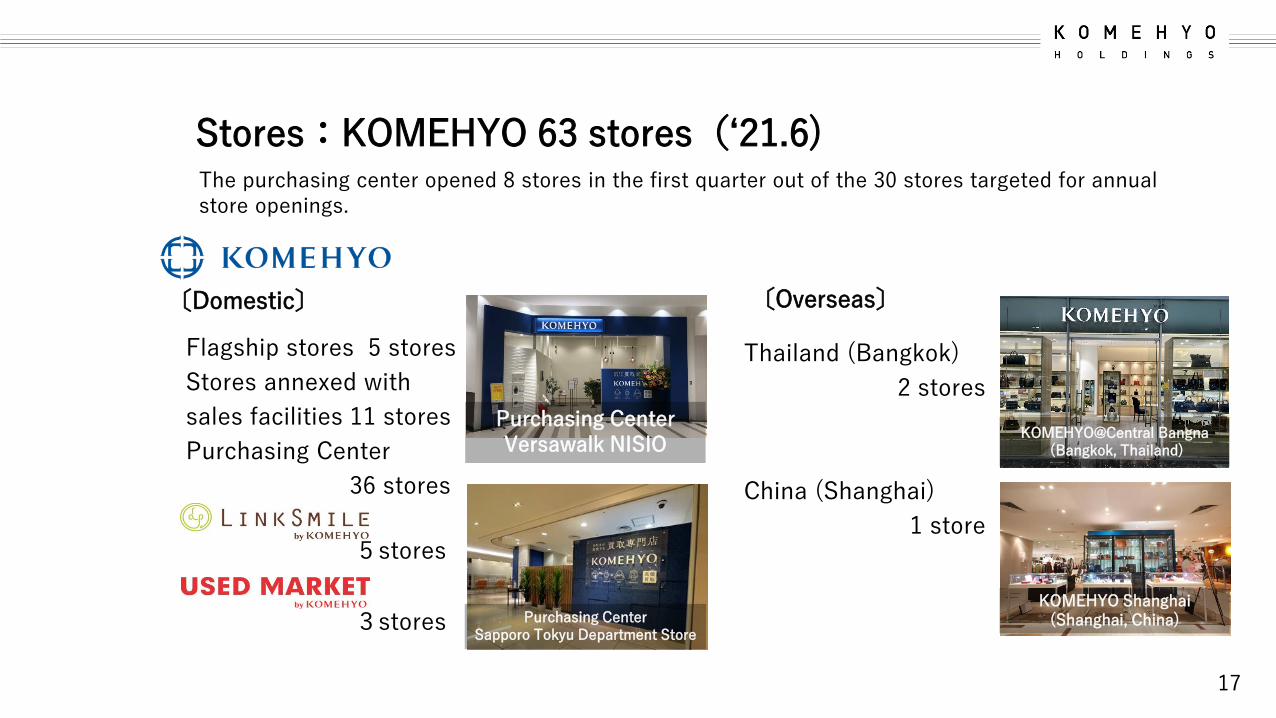
Flagship stores 5 stores
Stores annexed with
sales facilities 11 stores
Purchasing Center
36 stores
5stores
3stores
17
Stores:KOMEHYO 63 stores(‘21.6)
Purchasing CenterVersawalk NISIO
Purchasing CenterSapporo Tokyu Department Store
The purchasing center opened 8 stores in the first quarter out of the 30 stores targeted for annual store openings.
〔Domestic〕 〔Overseas〕
Thailand (Bangkok)
2 stores
China (Shanghai)
1 store
KOMEHYO@Central Bangna (Bangkok, Thailand)
KOMEHYO Shanghai(Shanghai, China)

Flagship stores 2 stores
Stores annexed with
sales facilities 2 stores
Purchasing Center
9 stores
18
Stores:BRAND OFF 25 stores(‘21.6)
Opened 3 purchasing centers in the first quarter and the Tsim Sha Tsui store in Hong Kong
purchasing center KANAZAWA NISI store
HONG KONG 8 stores
TAIWAN 3 stores
Thailand 1 stores
(Including FC 1 store)
Tsim Sha Tsui store (HK)
Tuen Mun V City store(HK)
〔Domestic〕 〔Overseas〕
Kanazawa Main Store

Cross-border EC
19
金沢本店
T-mall Live
Focusing on cross-border e-commerce for customers in China under COVID-19
Opened "BRAND OFF Overseas Flagship Store" at T-mall Global in June

20
WORM TOKYO
銀座本店WORM OSAKA ‘21.7 Opened
WORM(sneakers)・Shellman(Antique clock, etc.)Stores
Domestic 1 store Domestic 7 stores
Ginza main store
Ginza main store
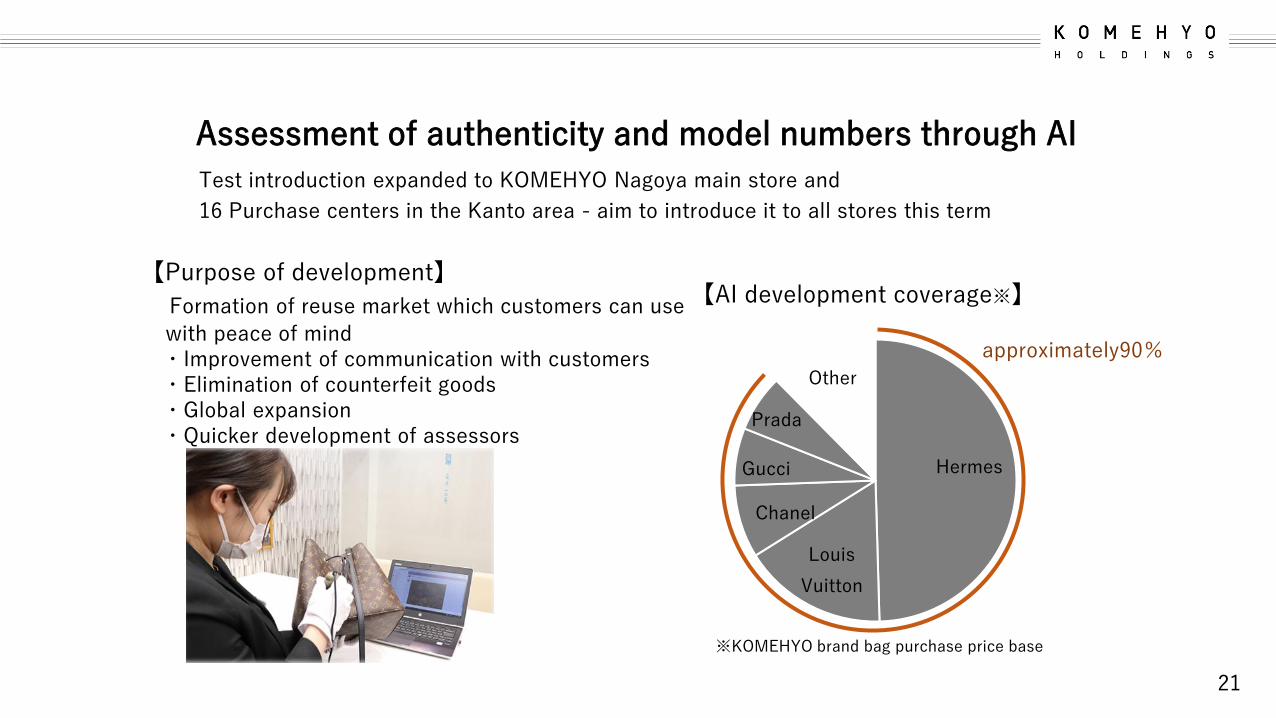
Hermes
Louis
Vuitton
Chanel
Gucci
Prada
Other
21
Assessment of authenticity and model numbers through AI
Test introduction expanded to KOMEHYO Nagoya main store and
16 Purchase centers in the Kanto area - aim to introduce it to all stores this term
【AI development coverage※】
approximately90%
※KOMEHYO brand bag purchase price base
【Purpose of development】
Formation of reuse market which customers can use
with peace of mind・Improvement of communication with customers・Elimination of counterfeit goods・Global expansion・Quicker development of assessors
22
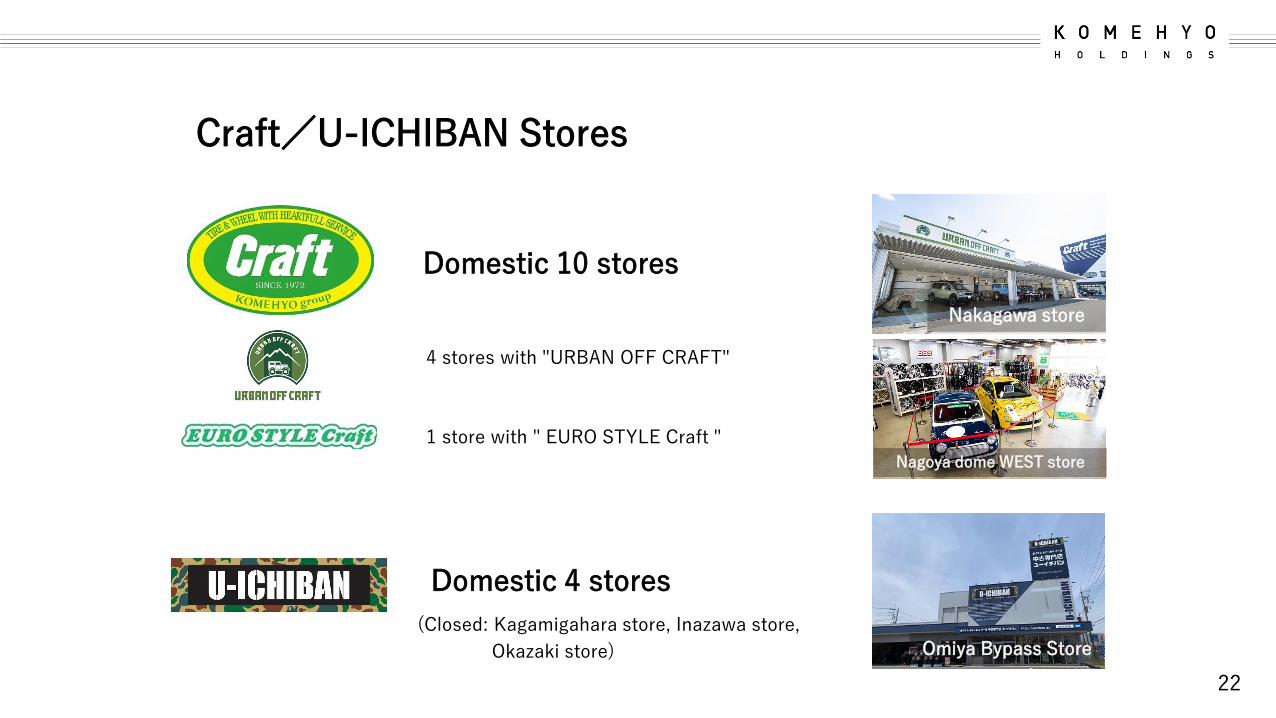
Craft/U-ICHIBAN Stores
Domestic 10 stores
Omiya Bypass Store
Nakagawa store
Nagoya dome WEST store
1 store with " EURO STYLE Craft "
4 stores with "URBAN OFF CRAFT"
(Closed: Kagamigahara store, Inazawa store,
Okazaki store)
Domestic 4 stores
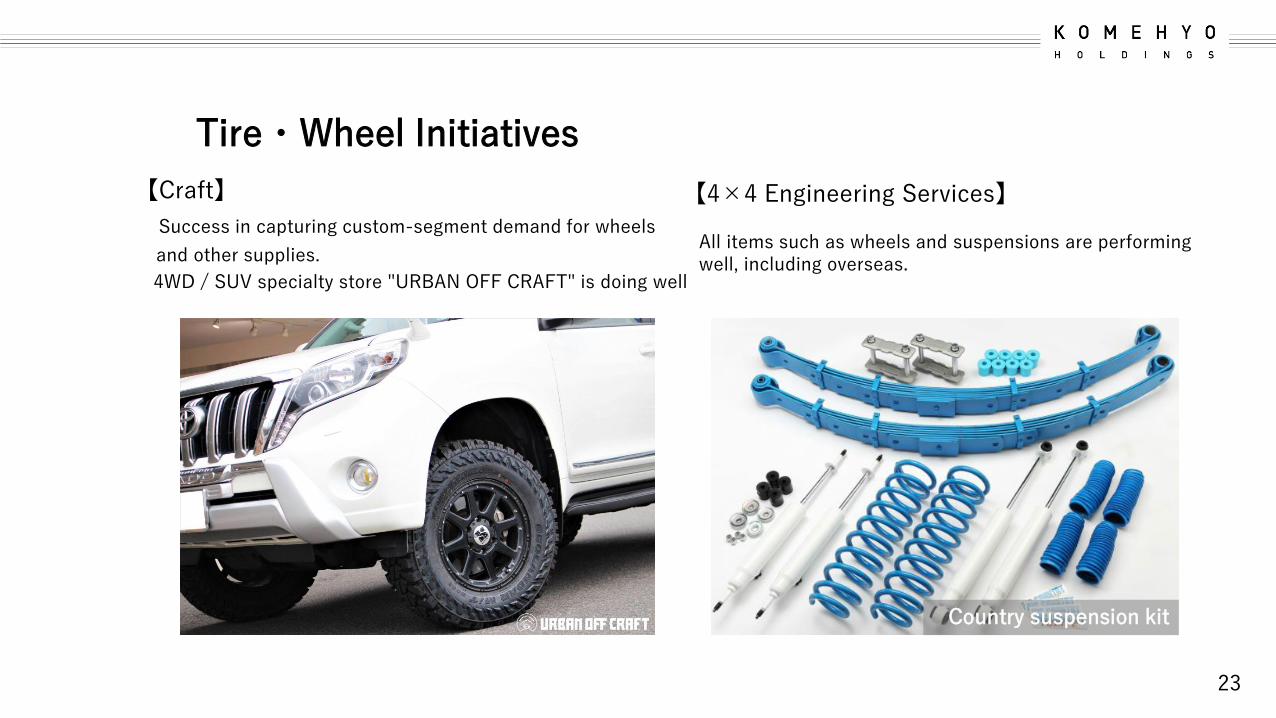
【Craft】
Success in capturing custom-segment demand for wheels
and other supplies.
4WD / SUV specialty store "URBAN OFF CRAFT" is doing well
23
Tire・Wheel Initiatives
Country suspension kit
【4×4 Engineering Services】
All items such as wheels and suspensions are performingwell, including overseas.
24
1.Overview of Financial Results for the First Quarterof the Fiscal Year Ending March 31, 2022
2.Initiatives for the First Quarter of the Fiscal YearEnding March 31, 2022
3.Reference Information (Company Profile, etc.)
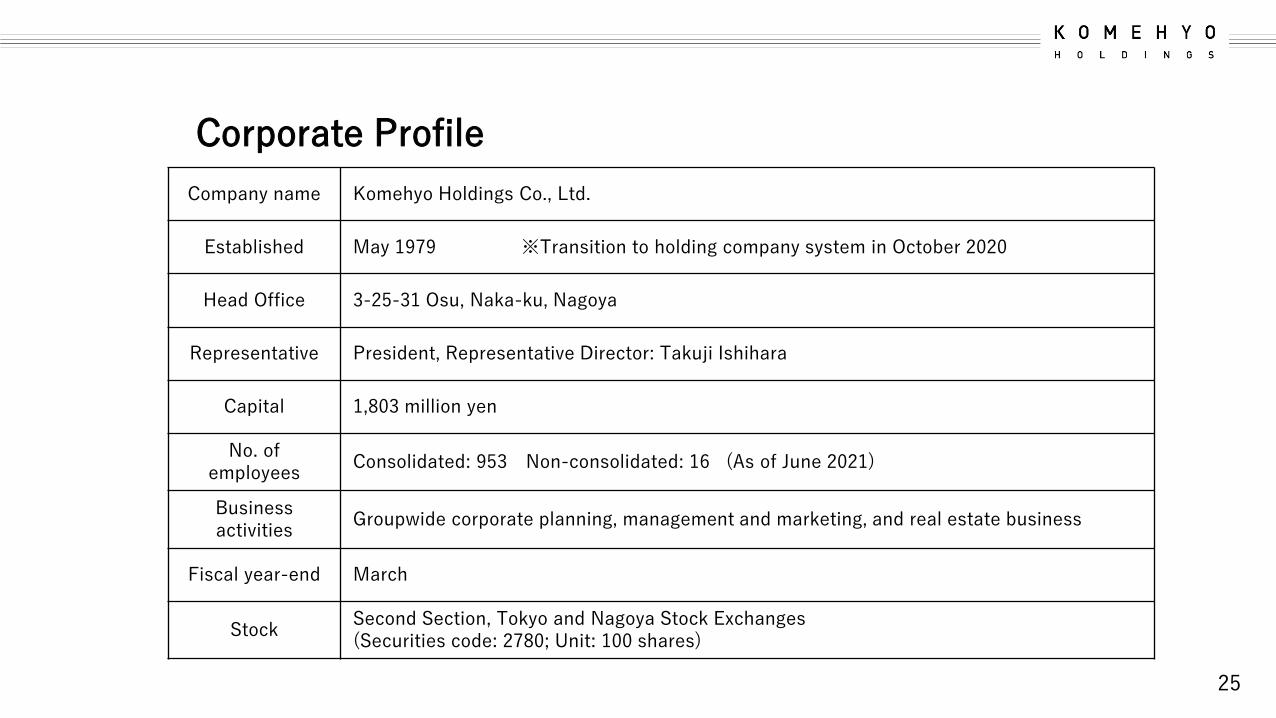
Company name Komehyo Holdings Co., Ltd.
Established May 1979 ※Transition to holding company system in October 2020
Head Office 3-25-31 Osu, Naka-ku, Nagoya
Representative President, Representative Director: Takuji Ishihara
Capital 1,803 million yen
No. of employees
Consolidated: 953 Non-consolidated: 16 (As of June 2021)
Business activities
Groupwide corporate planning, management and marketing, and real estate business
Fiscal year-end March
StockSecond Section, Tokyo and Nagoya Stock Exchanges(Securities code: 2780; Unit: 100 shares)
Corporate Profile
25
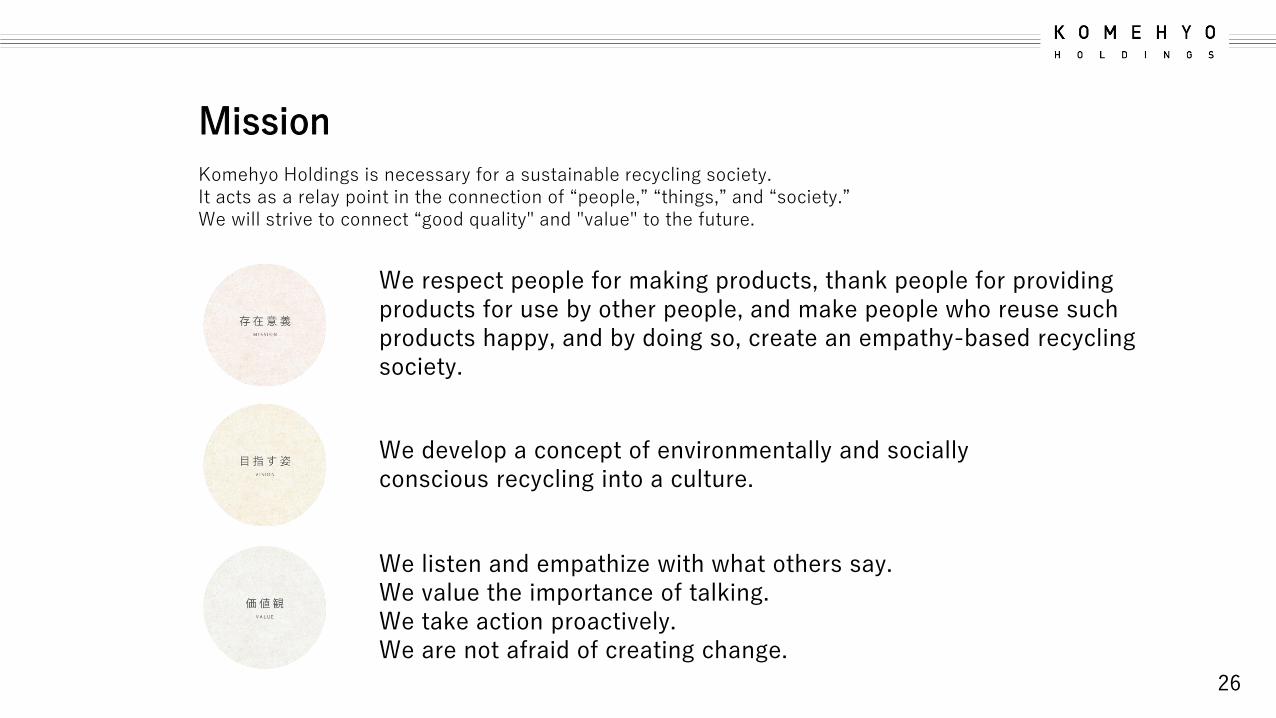
We respect people for making products, thank people for providing products for use by other people, and make people who reuse such products happy, and by doing so, create an empathy-based recycling society.
We develop a concept of environmentally and socially conscious recycling into a culture.
Komehyo Holdings is necessary for a sustainable recycling society.It acts as a relay point in the connection of “people,” “things,” and “society.”We will strive to connect “good quality" and "value" to the future.
Mission
We listen and empathize with what others say.We value the importance of talking.We take action proactively.We are not afraid of creating change.
26
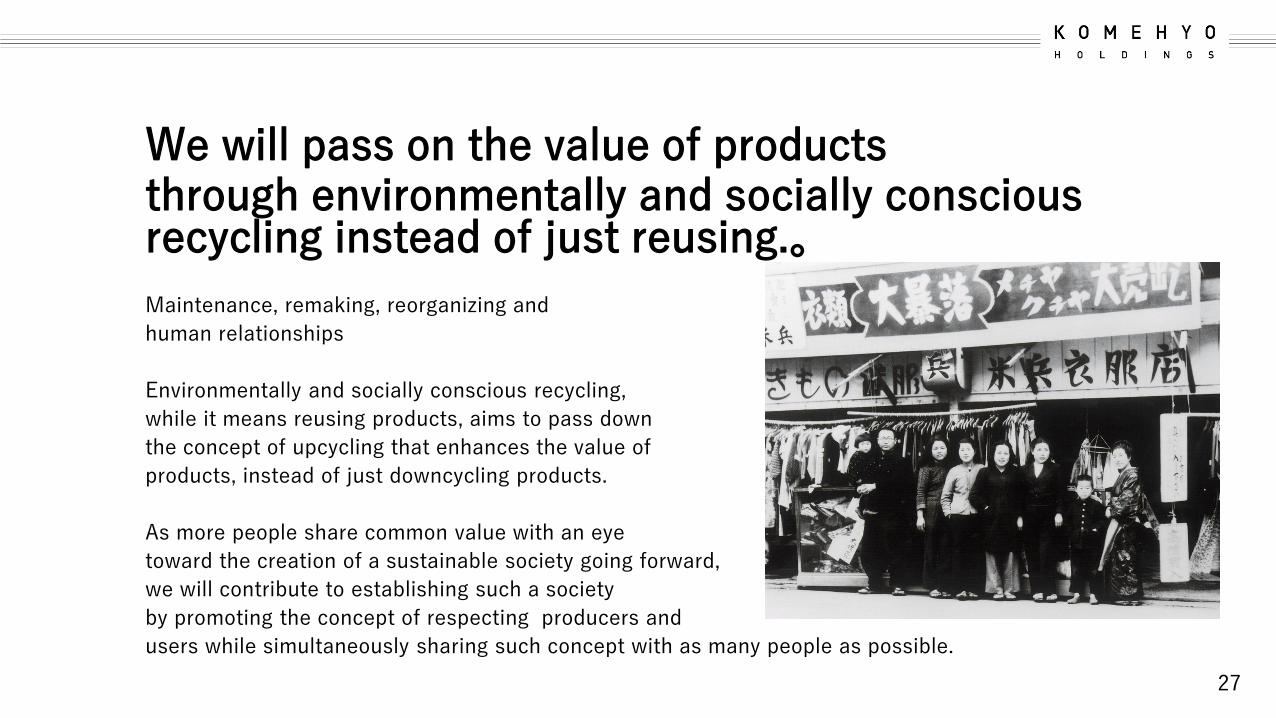
We will pass on the value of productsthrough environmentally and socially conscious recycling instead of just reusing.。
Maintenance, remaking, reorganizing and
human relationships
Environmentally and socially conscious recycling,
while it means reusing products, aims to pass down
the concept of upcycling that enhances the value of
products, instead of just downcycling products.
As more people share common value with an eye
toward the creation of a sustainable society going forward,
we will contribute to establishing such a society
by promoting the concept of respecting producers and
users while simultaneously sharing such concept with as many people as possible.
27

Corporate History
●Acquired Shellman Co.,Ltd.●Established SAHA
KOMEHYO COMPANYLIMITED
●Established Auto Parts KOMEHYO (currently AUTO PARTS JAPAN)
●Established KOMEHYO HONG KONG LIMITED
●Opened KOMEHYO Ginza Store
● Acquired CRAFT Co., Ltd.●Established KOMEHYO Auction
2003 2004 2011 2012 20131979 1987 1996 2000
● Established KOMEHYO Co., Ltd.
●Expanded into Tokyo(KOMEHYO Purchasing Center Dogenzaka)
●Expanded into Kansai
(KOMEHYO Shinsaibashi Store)
●Started online sales
● Listed on JASDAQ
●Listed on the second section of the Tokyo and Nagoya stock exchanges
● Changed the Japanese spelling of its name from 米兵 to コメ兵
●Opened KOMEHYO Shoten,a 5-tsubo used clothing store, in Osu, Nagoya
2018 2019
●Acquired Eve Corporation Co.,Ltd.
2017
●Acquired Four by four engineering service Co.,Ltd●Retail store KOMEHYO opened in Bangkok, Thailand●Acquired K-BRAND OFF Co.,Ltd and two overseas subsidiaries
2020
●Transition to a holdingcompany structure
●Opened the secondstore in Bangkok,Thailand
28

Business system diagram
Used goods business
Stores Gen
era
l cu
sto
mers
, etc
.
New and used goods business
purchase Sales
Gen
era
l cu
sto
mers
, etc
.
29
Home delivery Purchasing
Purchasing at events
Stores
WEB
Purchasing at visited sites

(Millions of yen)FY2022(Revised) FY2023 FY2024
1H Full year Full year Full year
Net sales 3 0 , 0 0 0 6 3 , 2 0 0 6 5 , 0 0 0 7 0 , 0 0 0
Operating income
1 , 0 2 0 2 , 1 9 0 2 , 1 0 0 2 , 8 0 0
Operating profit margin
3 . 4 % 3 . 5 % 3 . 2 % 4 . 0 %
Ordinary income 1 , 0 0 0 2 , 1 1 0 2 , 0 0 0 2 , 7 0 0
Net income attributableto owners of
parent
6 8 0 1 , 4 7 0 1 , 3 0 0 1 , 8 0 0
Medium-term management target (until FY2024)
30
※ Changes were made to business plans for the first half and the fiscal year announced at the beginning of the fiscal year.No change in medium-term plan.
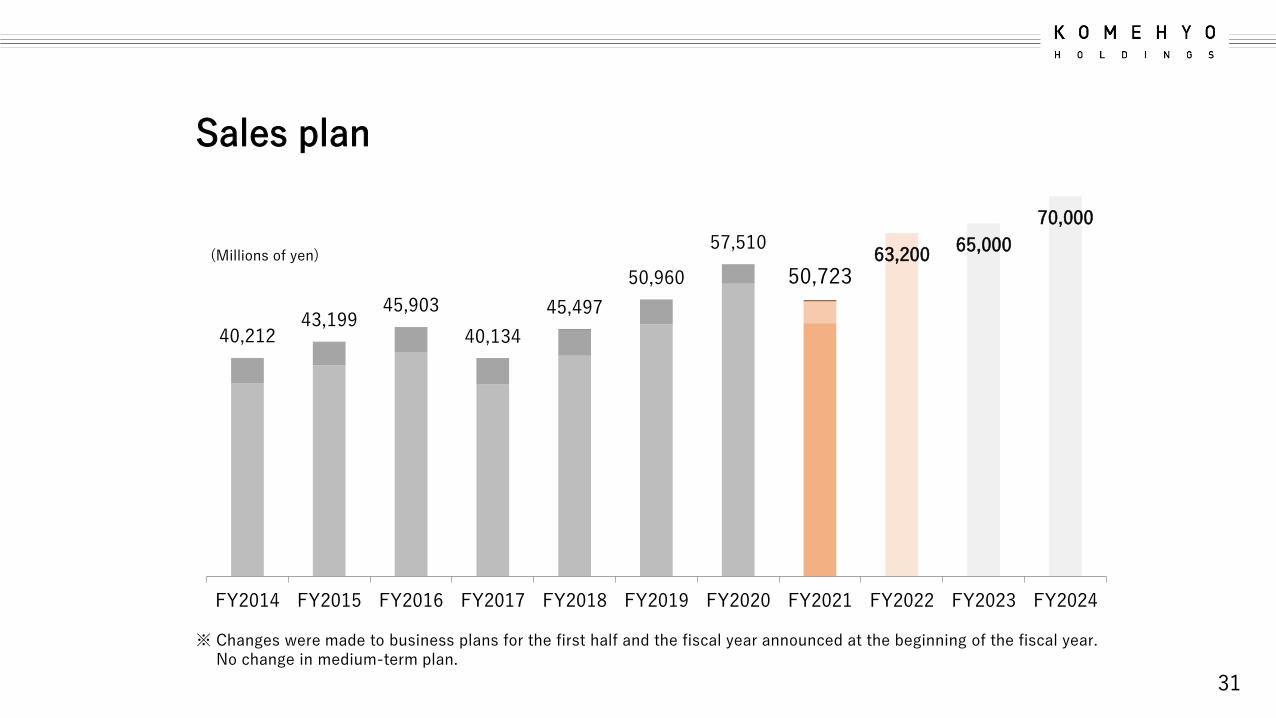
40,212 43,199
45,903
40,134
45,497
50,960
57,510
50,723 63,200
65,000
70,000
FY2014 FY2015 FY2016 FY2017 FY2018 FY2019 FY2020 FY2021 FY2022 FY2023 FY2024
31
Sales plan
(Millions of yen)
※ Changes were made to business plans for the first half and the fiscal year announced at the beginning of the fiscal year.No change in medium-term plan.

7.5 7.26.1
2.1
3.6 3.7
0.51.2
3.5 3.24.0
2,999 3,129 2,789
832
1,625 1,860
297 590
2,190 2,100
2,800
FY2014 FY2015 FY2016 FY2017 FY2018 FY2019 FY2020 FY2021 FY2022 FY2023 FY2024
32
Operating Profit Plan
Operating Income
(Millions of yen)
Operating Income
Margin (%)
※ Changes were made to business plans for the first half and the fiscal year announced at the beginning of the fiscal year.No change in medium-term plan.
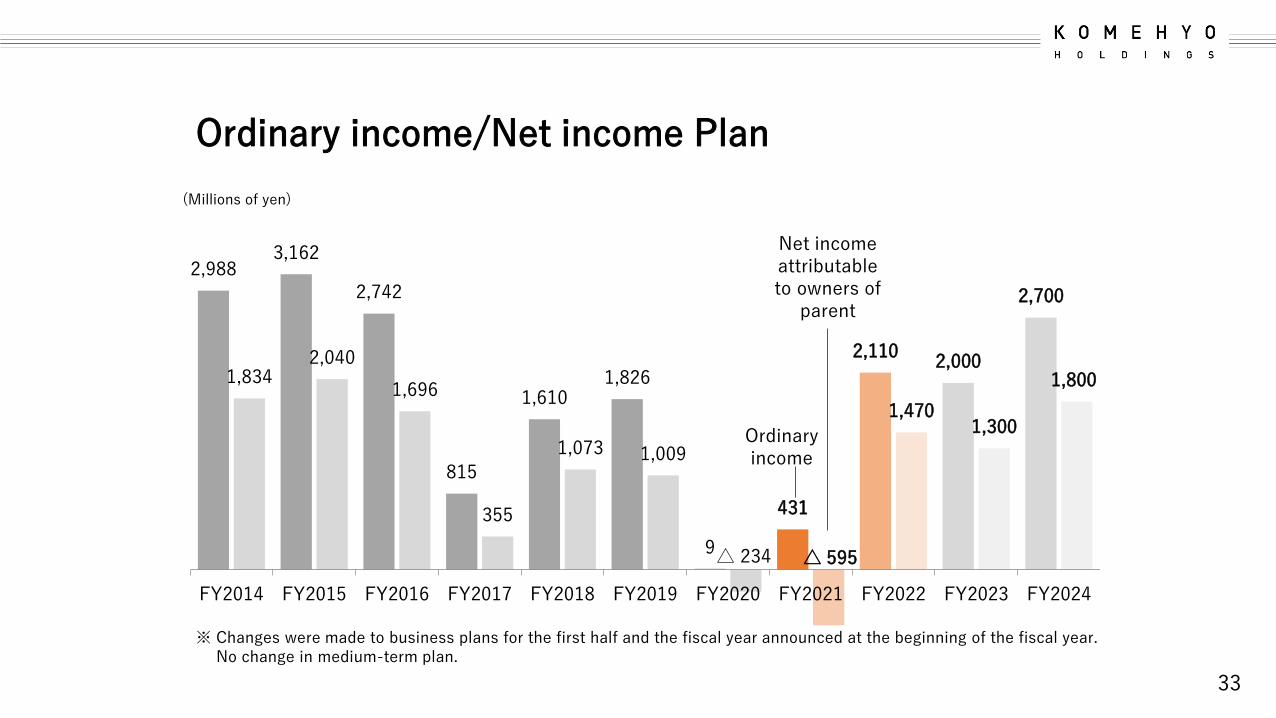
2,988 3,162
2,742
815
1,610 1,826
9
431
2,110 2,000
2,700
1,8342,040
1,696
355
1,073 1,009
△ 234 △ 595
1,4701,300
1,800
FY2014 FY2015 FY2016 FY2017 FY2018 FY2019 FY2020 FY2021 FY2022 FY2023 FY2024
33
Ordinary income/Net income Plan
Net income attributableto owners of
parent
Ordinary income
(Millions of yen)
※ Changes were made to business plans for the first half and the fiscal year announced at the beginning of the fiscal year.No change in medium-term plan.
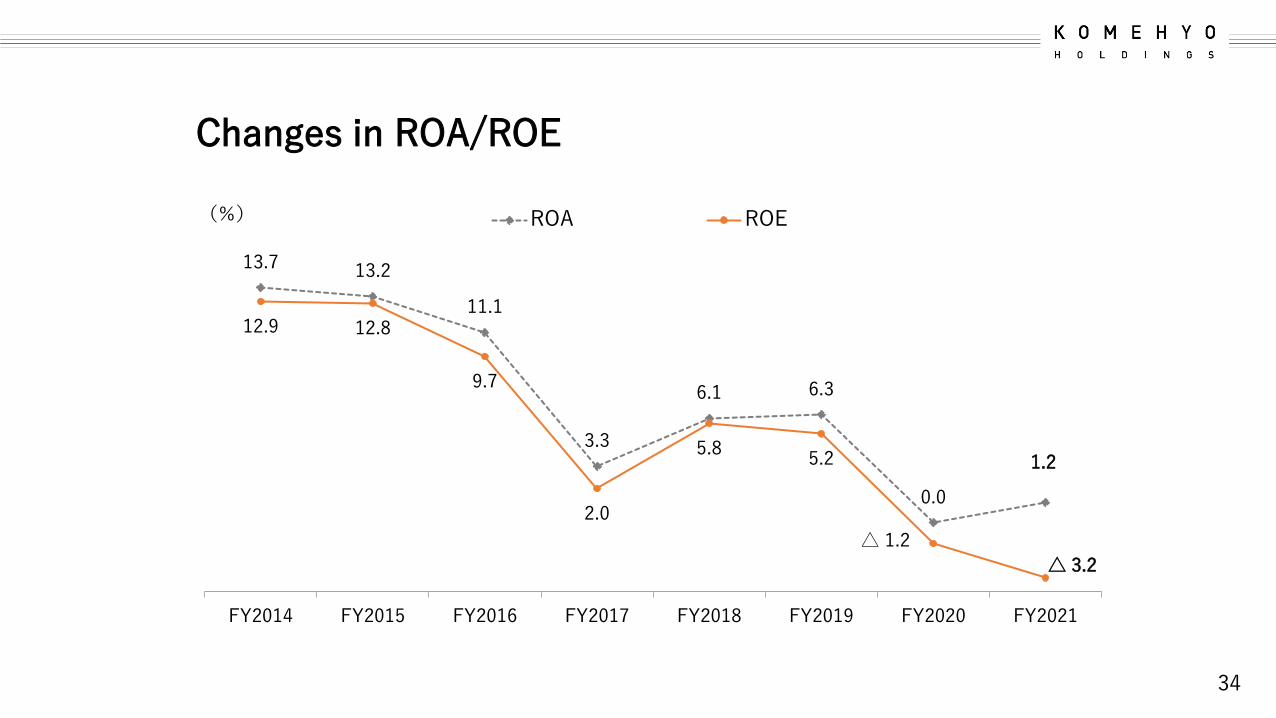
13.7 13.2
11.1
3.3
6.1 6.3
0.0
1.2
12.9 12.8
9.7
2.0
5.85.2
△ 1.2
△ 3.2
FY2014 FY2015 FY2016 FY2017 FY2018 FY2019 FY2020 FY2021
ROA ROE(%)
34
Changes in ROA/ROE

510592 648
748666
192
FY2017 FY2018 FY2019 FY2020 FY2021 FY2022-1Q
35
Changes in gross merchandise value
(100 millions of yen)KOMEHYO auction sales are mainly membership fees, and volume is not included in sales.
Total distribution volume (GMV) is a number that takes into account the volume of the auction and measures its influence in the reuse market.We think it is one of the indicators.
GMV is calculated simply by adding and subtracting sales and volume information at the KOMEHYO auction based on consolidated sales.
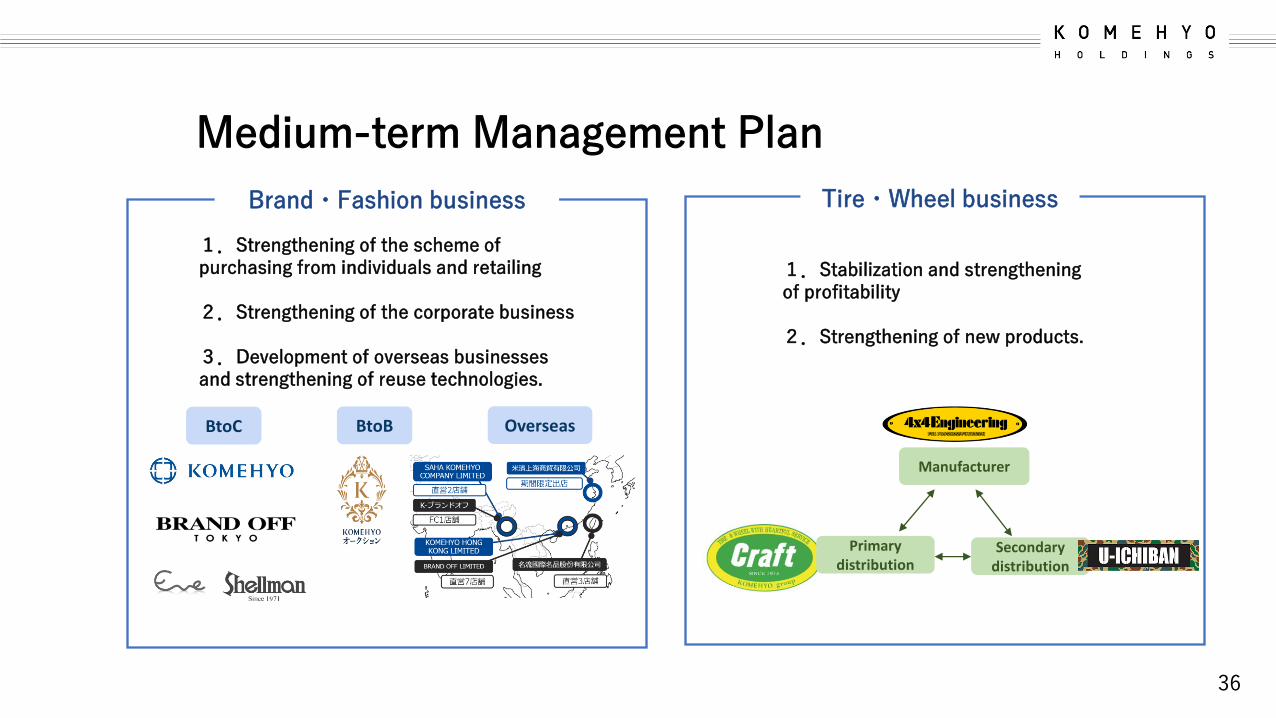
Medium-term Management Plan
1.Strengthening of the scheme of purchasing from individuals and retailing
2.Strengthening of the corporate business
3.Development of overseas businesses and strengthening of reuse technologies.
Brand・Fashion business
Overseas
Tire・Wheel business
BtoB
Manufacturer
Secondary distribution
Primary distribution
1.Stabilization and strengthening of profitability
2.Strengthening of new products.
BtoC
36

Medium-term Management Plan : Brand・Fashion
1.toC - Strengthening of the scheme of purchasingfrom individuals and retailing
・Increase the number of purchasing channels (acceleration ofnew store openings and facilitation of FC and alliances).
・Raise the capability of existing stores and improving CRMthrough OMO with a focus on LTV.
・Facilitate the upcycling of purchased products.
2.toB - Strengthening of the corporate business
・Strengthen and streamline the auction business.・Accelerate collaboration-based businesses.・Acquire new business partner companies.
3.Growth drivers - Development of overseasbusinesses and strengthening of reuse technologies.
・Drive growth in overseas channels (enhance profit levels).・Utilize data on products and customers among the group
companies.・Enhance purchasing channels through the utilization of AI.
37
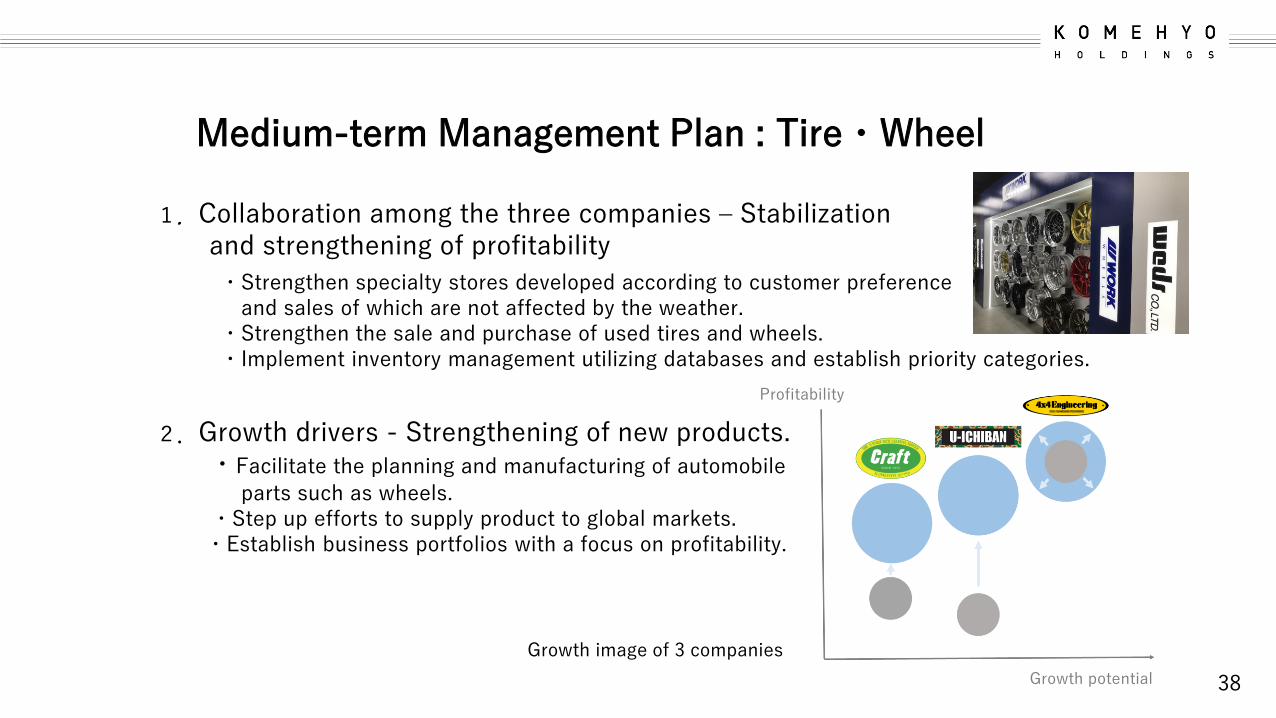
Medium-term Management Plan : Tire・Wheel
1.Collaboration among the three companies – Stabilizationand strengthening of profitability
・Strengthen specialty stores developed according to customer preferenceand sales of which are not affected by the weather.
・Strengthen the sale and purchase of used tires and wheels.・Implement inventory management utilizing databases and establish priority categories.
2.Growth drivers - Strengthening of new products.・Facilitate the planning and manufacturing of automobile
parts such as wheels.・Step up efforts to supply product to global markets.・Establish business portfolios with a focus on profitability.
Growth image of 3 companies
38
Profitability
Growth potential
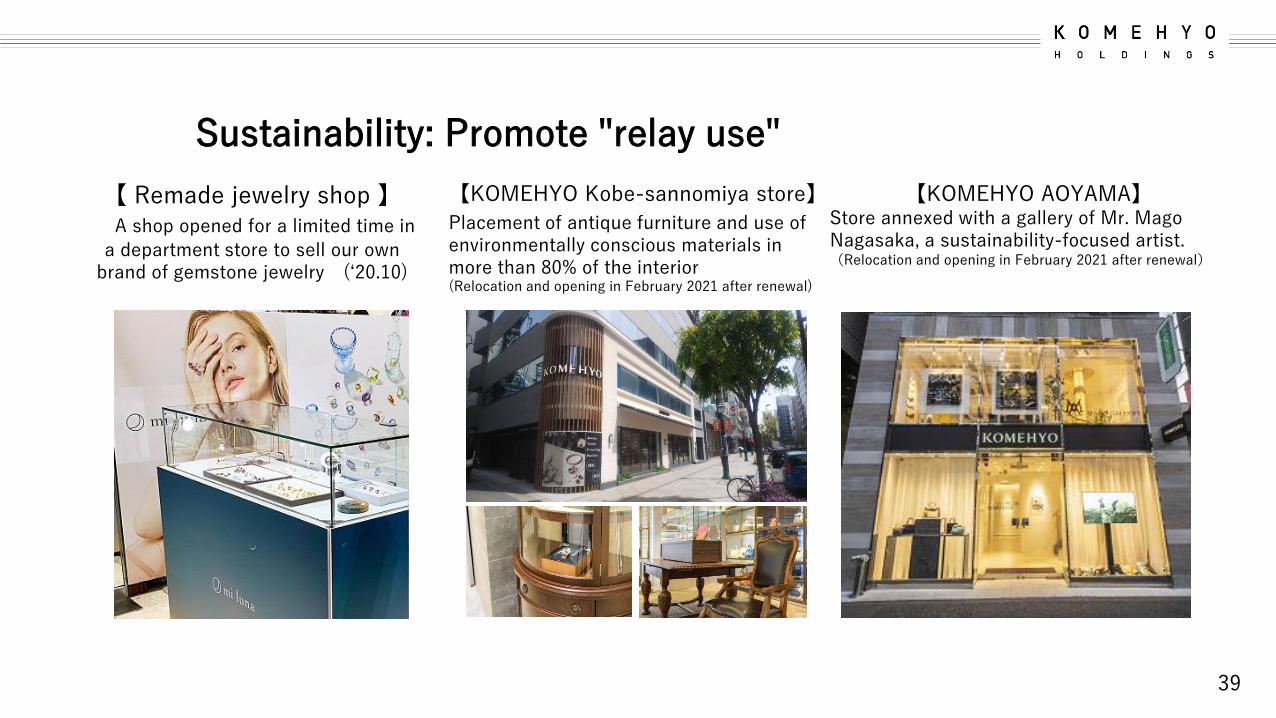
【 Remade jewelry shop 】A shop opened for a limited time in
a department store to sell our own brand of gemstone jewelry (‘20.10)
【KOMEHYO Kobe-sannomiya store】
Placement of antique furniture and use of environmentally conscious materials in more than 80% of the interior(Relocation and opening in February 2021 after renewal)
【KOMEHYO AOYAMA】Store annexed with a gallery of Mr. Mago Nagasaka, a sustainability-focused artist.(Relocation and opening in February 2021 after renewal)
Sustainability: Promote "relay use"
39

7 5 7 8 9 11 14 15 15 15 16 168
125 7
7 810
1514 15 15 15 16
8
8
12
FY2009FY2010FY2011FY2012FY2013FY2014FY2015FY2016FY2017FY2018FY2019FY2020FY2021FY2022
Fiscal year-end dividend Interim dividend
36.224.8 29.3
23.016.6 15.5 15.0
19.4
92.4
30.6 34.7
17.9
Payout ratio(%)
Shareholder return:Annual dividend for this term is 24 yen (planned)
40
Dividends (Yen)
(planned)
IR・PR Department
Phone:+81-52-249-5366E-mail:[email protected]
41
IR contact
Note:This document is an English translation of a document prepared in Japanese.Statements in this document that are not historical facts; statements concerning current plans, forecasts, strategies, and
opinions of KOMEHYO Co., Ltd. are forward-looking statements subject to various risks and uncertainties.These statements are prepared based on assumptions of the management of Komehyo Holdings Co.,Ltd. using currently
available information.Actual results may differ significantly from forecasts due to a variety of factors; therefore, investors should not place
undue reliance upon them.In addition, this document is not intended to solicit investments. Investors should make investment decisions at their
own discretion.