earnings results -...
TRANSCRIPT

Earnings ResultsSecond Quarter 2015

Forward Looking Statements
This presentation contains, or may be deemed to contain, forward-looking
statements. By their nature, forward-looking statements involve risks and
uncertainties because they relate to events and depend on circumstances that may or
may not occur in the future. The future results of Grupo Famsa, S.A.B. de C.V. and its
subsidiaries may differ from the results expressed in, or implied by, the forward-
looking statements set out herein, possibly to a material degree.
2

3
Operating and Financial Results 2Q15
Executive Summary
Famsa Mexico
Banco Famsa
Famsa USA
Consolidated Financial Results 2Q15
Agenda

Operating and Financial Results –
Second Quarter 2015

5
Executive Summary – Second Quarter 2015
Remarkable growth in Consolidated Net Sales of 12.2% and consolidated
EBITDA of 24.3% in 2Q15 compared to 2Q14
Grupo Famsa ratifies consolidated EBITDA will be in line with the high end of
the 2015 Guidance: Ps$1,800 million
Surpassing 2015 Guidance of +4.0%, Famsa Mexico’s SSS rose an outstanding
10.0% in 2Q15
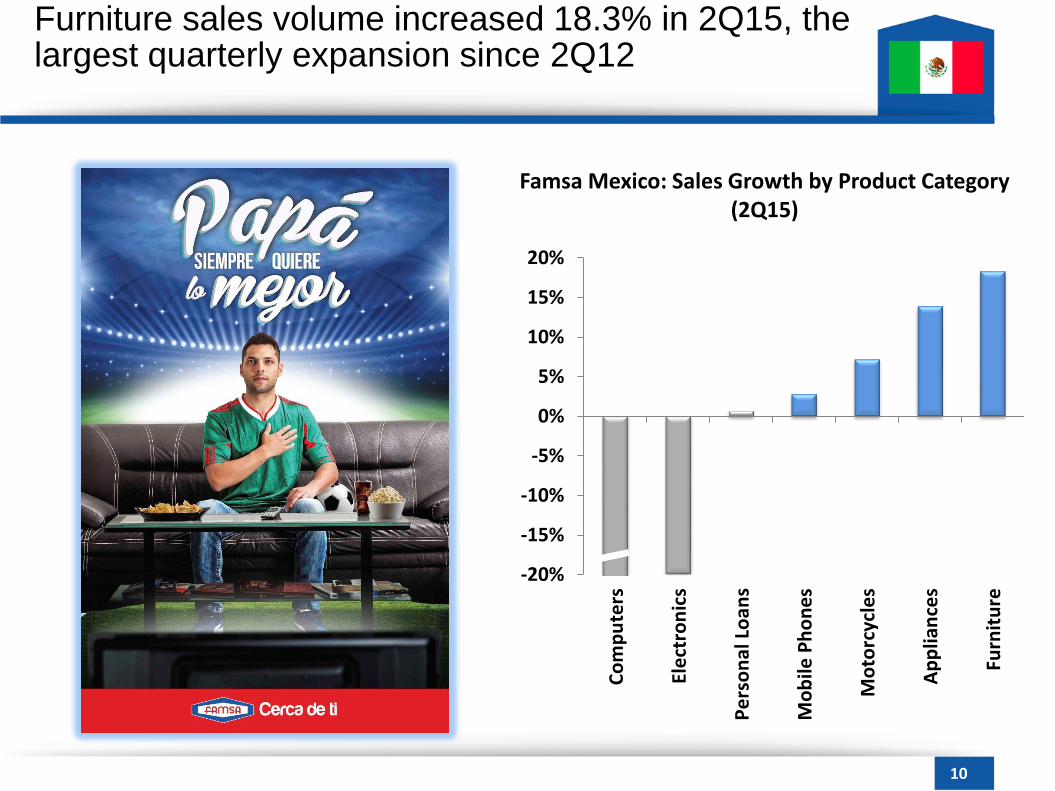
Furniture sales volume increased 18.3% in 2Q15, the largest quarterly
expansion since second quarter 2012
The Non-performing Loans Ratio (NPL) of Banco Famsa´s portfolio was 11.9%
as of June 30, 2015, the lowest level over the past three years
The balance of Commercial Loans Portfolio grew at an annual rate of 41.3%,
to Ps$3,509 million as of the end of June, 2015
Famsa USA’s dollar-denominated SSS increased 2 .7% year-over-year in 2Q15
Peso-denominated Net Sales grew 20.7% during 2Q15 due to the variation in
parity of the Mexican Peso vis-à-vis the America dollarUSA
MX

Famsa Mexico

7
ANTAD - Nominal Sales Growth2(General grouping, SSS)
1 Consumer Confidence Index published by INEGI (2003 base 100)2 Nominal sales growth published by ANTAD (General grouping , Same Store Sales)
Ind
ex
Consumer Confidence Index1(Seasonally adjusted series)
Gro
wth
(%)
The improvement in consumer spending in Mexico wasreflected in diverse financial indicators
88
89
90
91
92
93
94
95
Jun
´13
Sep
´13
De
c'1
3
Mar
´14
Jun
´14
Sep
´14
De
c'1
4
Mar
'15
Jun
'15
-4%
-3%
-2%
-1%
0%
1%
2%
3%
4%
5%
6%
Jun
´13
Sep
´13
De
c'1
3
Mar
'14
Jun
´14
Sep
´14
De
c'1
4
Mar
´15
Jun
'15

-9%
-6%
-3%
0%
3%
6%
9%
12%
2Q
13
3Q
13
4Q
13
1Q
14
2Q
14
3Q
14
4Q
14
1Q
15
2Q
15
8
Famsa Mexico: Net Sales
Pe
sos
(Mill
ion
s)
Gro
wth
(%)
Famsa Mexico: Quarterly SSS
Famsa Mexico continued its positive trend with a 10.9% increase in Net Sales in the second quarter of 2015
$3,207$3,557
$5,980
$6,590
2Q14 2Q15 J-J 14 J-J 15
Total: +10.9%SSS: +10.0%
Total: +10.2%SSS: +9.0%
Guídance: 4%

9
Famsa Mexico: % of Sales by Product Category
100%100%
% o
f Sa
les
Others
Motorcycles
Mobile Phones
Personal Loans
Electronics
Appliances
Computers
Furniture
Furniture increased its participation in the sales product mix during the first half of 2015
23.5% 21.9%
12.9% 13.4%
11.7% 11.5%
10.1% 11.0%
12.5% 10.0%
6.8%6.3%
4.9%3.8%
3.1%2.7%
12.2% 17.1%
J-J 14 J-J 15
SeasonallyClothing
2.3%2.3%
10
-20%
-15%
-10%
-5%
0%
5%
10%
15%
20%
Co
mp
ute
rs
Ele
ctro
nic
s
Pe
rso
nal
Lo
ans
Mo
bile
Ph
on
es
Mo
torc
ycle
s
Ap
plia
nce
s
Furn
itu
re
Famsa Mexico: Sales Growth by Product Category (2Q15)
Furniture sales volume increased 18.3% in 2Q15, the largest quarterly expansion since 2Q12
Banco Famsa

1,624 1,524 1,582 1,592 1,622
1,849 2,082 2,475 2,998 3,298
11,017 11,115 10,69510,901 10,787
2Q14 3Q14 4Q14 1Q15 2Q15
4.8% 4.8%
4.7%
4.4% 4.4%
0%
2%
4%
6%
8%
10%
12%
14%
1Q
14
2Q
14
3Q
14
4Q
14
1Q
15
2Q
15
12
Banco Famsa: Capitalization Index(ICAP)
Source: CNBV, Banco Famsa1 Preliminary figure
12.3%
Banco Famsa: Bank Deposits
+8.4%
Demand Deposits Time Deposits with optional avaliability
Time Deposits Average Cost of Funding
Demand deposits have posted an increase of 6.4% forthe last three quarters
$ 15,707$ 14,491
1
13
16.5% 16.6% 16.1%14.8%
17.1%15.6% 15.1% 14.8% 14.7%
15.7%17.5% 17.4% 17.6% 17.5% 16.9% 16.2% 15.6% 14.8%14.2% 14.5% 14.9%
13.3%12.6% 12.6% 11.9%
Jun
´13
Jul´
13
Au
g´1
3
Sep
´13
Oct
´13
No
v´1
3
De
c´1
3
Jan
´14
Feb
´14
Mar
´14
Ap
r´1
4
May
´14
Jun
´14
Jul´
14
Au
g´1
4
Sep
´14
Oct
'14
No
v'1
4
De
c'1
4
Jan
'15
Feb
'15
Mar
'15
Ap
r'1
5
May
'15
Jun
'15
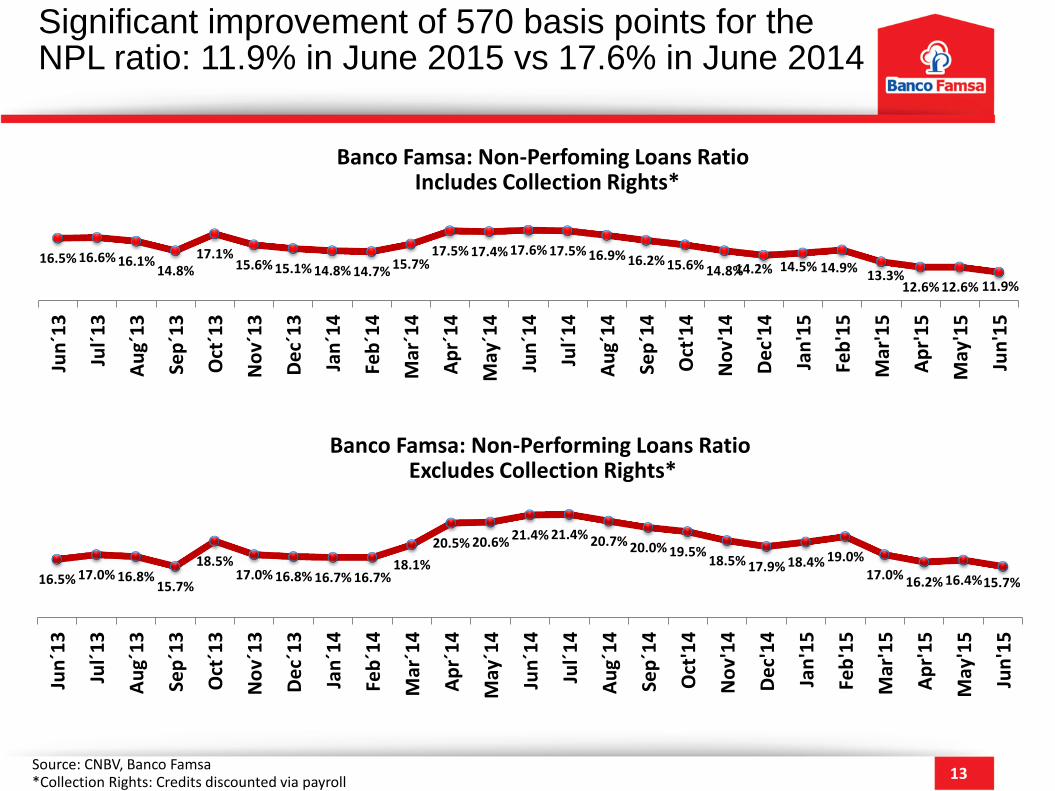
Banco Famsa: Non-Perfoming Loans RatioIncludes Collection Rights*
Banco Famsa: Non-Performing Loans Ratio Excludes Collection Rights*
16.5% 17.0% 16.8%15.7%
18.5%17.0% 16.8% 16.7% 16.7%
18.1%
20.5% 20.6% 21.4% 21.4% 20.7% 20.0% 19.5%18.5% 17.9% 18.4% 19.0%
17.0% 16.2% 16.4%15.7%
Jun
´13
Jul´
13
Au
g´1
3
Sep
´13
Oct
´13
No
v´1
3
De
c´1
3
Jan
´14
Feb
´14
Mar
´14
Ap
r´1
4
May
´14
Jun
´14
Jul´
14
Au
g´1
4
Sep
´14
Oct
'14
No
v'1
4
De
c'1
4
Jan
'15
Feb
'15
Mar
'15
Ap
r'1
5
May
'15
Jun
'15
Source: CNBV, Banco Famsa*Collection Rights: Credits discounted via payroll
Significant improvement of 570 basis points for theNPL ratio: 11.9% in June 2015 vs 17.6% in June 2014

14
Banco Famsa: Commercial Loans Banco Famsa: Commercial Loans Mix
+41.3%
$2,484 $2,691
$2,912
$3,492 $3,509
2Q14 3Q14 4Q14 1Q15 2Q15
Enterprises84%
SMEs13%
2Q15 Microcredits3%
Source: Grupo Famsa, Banco Famsa
*Pesos
Pe
sos
(Mill
ion
s)Commercial Loans Portfolio grew 41.3% year-over-
year as of 2Q15 achieving an NPL ratio of 2.3%
4.7%5.1%
3.7%
3.1%
2.3%
Microcredit SMEs Enterprises
No of Loans 4,195 231 95
AverageAmount
$26,000 $1.2 millions $11.5 millions
AverageDuration
23 months 36 months 36 months
Average Rate 64.0% 10.1% 7.0%
Guarantee NO Endorsement/ AffiliatedDebtor / NAFIN
Endorsement / AffiliatedDebtor /
Mortgage
*
NPL

Famsa USA

16
Pe
sos
(Mill
ion
s)
Famsa USA: Net Sales Famsa USA: Quarterly SSS
Gro
wth
(%)
-8%
-3%
2%
7%
2Q
13
3Q
13
4Q
13
1Q
14
2Q
14
3Q
14
4Q
14
1Q
15
2Q
15
Famsa USA´s peso-denominated Net Sales increased 20.7% during the second quarter of 2015
$428
$517
$847
$990
2Q14 2Q15 J-J 14 J-J 15
Total: +20.7% (MXN)Total: +2.8% (USD)SSS: +2.7% (USD)
Total: +16.9% (MXN)Total: +1.6% (USD)SSS: +1.6% (USD)
17
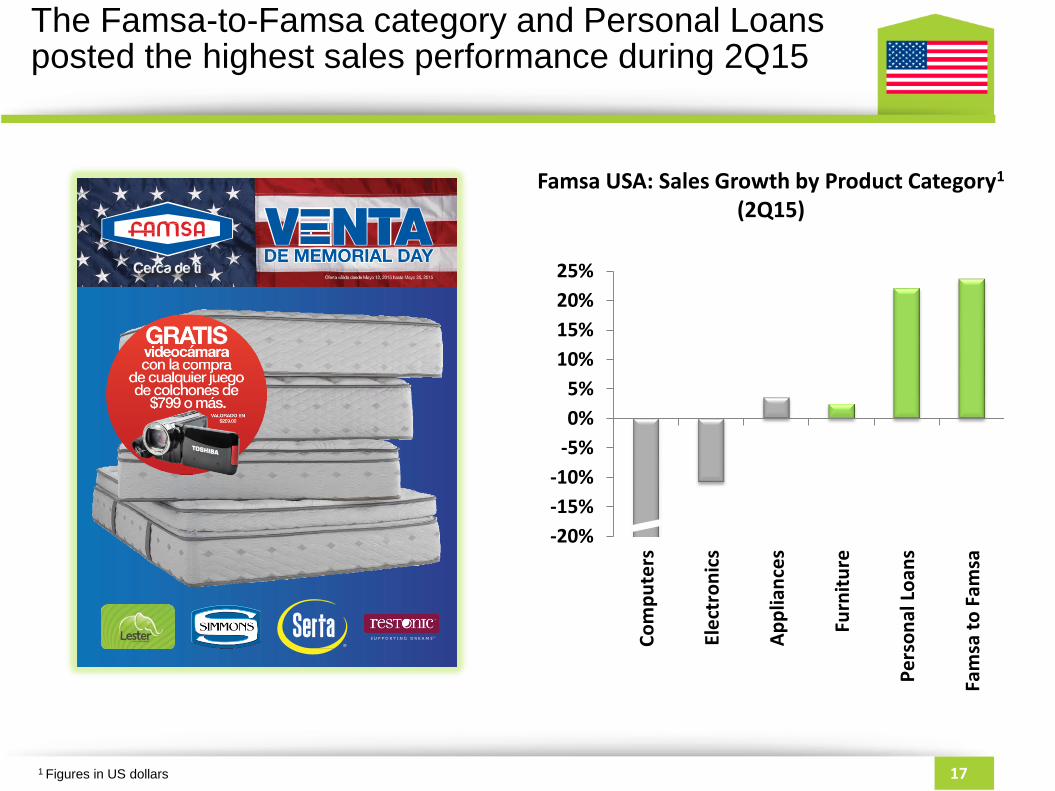
Famsa USA: Sales Growth by Product Category1
(2Q15)
-20%
-15%
-10%
-5%
0%
5%
10%
15%
20%
25%
Co
mp
ute
rs
Ele
ctro
nic
s
Ap
plia
nce
s
Furn
itu
re
Pe
rso
nal
Lo
ans
Fam
sa t
o F
amsa
The Famsa-to-Famsa category and Personal Loans posted the highest sales performance during 2Q15
1 Figures in US dollars
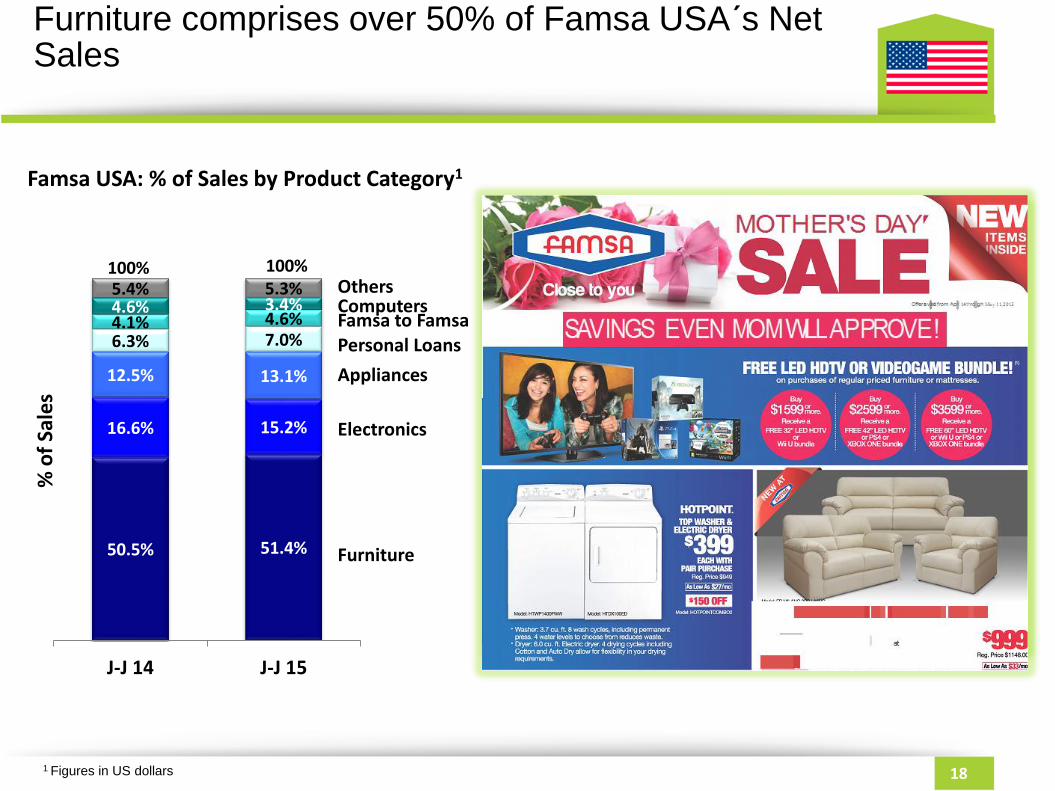
50.5% 51.4%
16.6% 15.2%
12.5% 13.1%
6.3% 7.0%4.1% 4.6%4.6% 3.4%5.4% 5.3%
J-J 14 J-J 15
18
Famsa USA: % of Sales by Product Category1
100%100%
% o
f Sa
les
Electronics
Appliances
Furniture
Personal Loans
OthersComputersFamsa to Famsa
Furniture comprises over 50% of Famsa USA´s Net Sales
1 Figures in US dollars

432 444
64 66
36417
2Q14 2Q15
363 374
25 26
342406
101
2Q14 2Q15
1Q15 Openings Closures 2Q15
Business Units 901 7 1 907
Stores 397 3 0 400
Famsa Mexico 371 3 0 374
Famsa USA 26 0 0 26
Banking branches 402 4 0 406
To be converted branches 102 0 1 101
19
Grupo Famsa: Business Units Grupo Famsa: Retail Area
M2
(Th
ou
san
ds)
Openings and Closures (2Q15)
Nu
mb
er o
f b
usi
nes
s u
nit
s
Bankingbranches
Stores Mx
Stores USA
Banking branches
Stores Mx
Stores USA
To be convertedbranches
To be converted branches558+3.0%+3.2%
149
907 54287910
During 2H15, Grupo Famsa expects to increase its presence in Mexico with the opening of 10 stores

ConsolidatedFinancial Results –
Second Quarter2015

2Q14 2Q15 J-J 14 J-J 15
Computers
Consolidated Net Sales
21
$6,866
+12.2%
Same Store Sales (%)
Consolidated Product Mix
Share of Consolidated Net Sales by Country
% o
f Sa
les
Pes
os
(Mill
ion
s)
MX
USA$3,657
88% 87%
12% 13%
2Q14 2Q15
% o
f Sa
les
Famsa USA
Famsa Mexico
Others
MotorcyclesMobile PhonesElectronics
Appliances
Personal Loans
Furniture
1 Excluding foreign exchange effects
Net Sales
2Q15 J-J 2015
Total +8.8% +8.0%
Famsa Mexico +10.0% +9.0%
Famsa USA1 +2.7% +1.6%
$4,104
$7,634+11.2%
21% 20%
15% 17%
13% 13%
13% 10%
10% 10%6% 5%5% 4%
17% 21%
Jan-Jun 14 Jan-Jun 15

2Q14 2Q15 J-J 14 J-J15
$370$461
+24.3%
$172
$249
$354
2Q14 2Q15 J-J 14 J-J 15
2Q14 2Q15 J-J 14 J-J 15
$3,632
22
Gross Profit EBITDA
Net Income
Pes
os
(Mill
ion
s)
48.6%
-4.7%
Financial Expenses, net
5.7%
MX
USA
MX
USA
5.7%
Profitability
$1,694$1,918
$3,254+13.2%
+11.6%
$716
$882
+44.6%
$521+47.1%
$42
$119
$227 $212
2Q14 2Q15 J-J 14 J-J 15
+181.2%
-6.5%
1 1
+23.3%
1 Foreign Exchange Gain in 2Q14 of $14 / Foreign Exchange Loss in 2Q15 of $771 Foreign Exchange Gain in 1H14 of $19 / Foreign Exchange Loss in 1H15 of $181
10.1% 10.4%47.4%46.3% 46.7% 47.6% 11.2% 11.6%
4.7% 6.1% 5.2% 6.8% 2.9% 3.3%1.2% 2.8%

23
$10,280 $10,568
4Q14 2Q15
4Q14 2Q15
$2,121
Trade Receivables Inventories
Net Debt and Bank Deposits Stockholders’ Equity
+8.2%
+2.8%
Bank Deposits
Net Debt
$14,752 $15,707
$5,938$6,829
4Q14 2Q15
+8.9%$20,690 $22,536
Commercial MxConsumer USA
Consumer Mx
Main Balance Sheet AccountsP
eso
s (M
illio
ns)
$2,295
$18,386 $18,981
$2,912 $3,509$2,105 $2,370
4Q14 2Q15
$23,402 $24,860+6.2%