earnings, revenues, & valuation: s&p 500/400/600
TRANSCRIPT
Earnings, Revenues, &Valuation:
S&P 500/400/600Yardeni Research, Inc.
November 14, 2014
Dr. Edward Yardeni516-972-7683
Joe Abbott732-497-5306
Please visit our sites atwww.yardeni.comblog.yardeni.com
thinking outside the box
Table Of Contents Table Of ContentsTable Of Contents
November 14, 2014 / Earnings, Revenues, & Valuation: S&P 500/400/600 www.yardeni.com
Yardeni Research, Inc.
S&P Earnings 3S&P 500 Earnings 4S&P 400 Earnings 5S&P 600 Earnings 6S&P 500/400/600 2014 Quarterly Earnings 7S&P 500/400/600 2014 Quarterly Y/Y Earnings Growth 8S&P 500/400/600 2015 Quarterly Earnings 9S&P 500/400/600 2015 Quarterly Y/Y Earnings Growth 10S&P 500/400/600 Indexes & Earnings 11S&P 500/400/600 P/Es 12S&P 500 Revenues & Profit Margin 13S&P 500 Revenues, Earnings, & Margins 14S&P Blue Angels 15-16S&P 500 Sectors Forward Earnings 17S&P 500 Sectors Forward Revenues 18S&P 500 Sectors Forward Profit Margin 19S&P 500 Sectors Forward P/Es 20

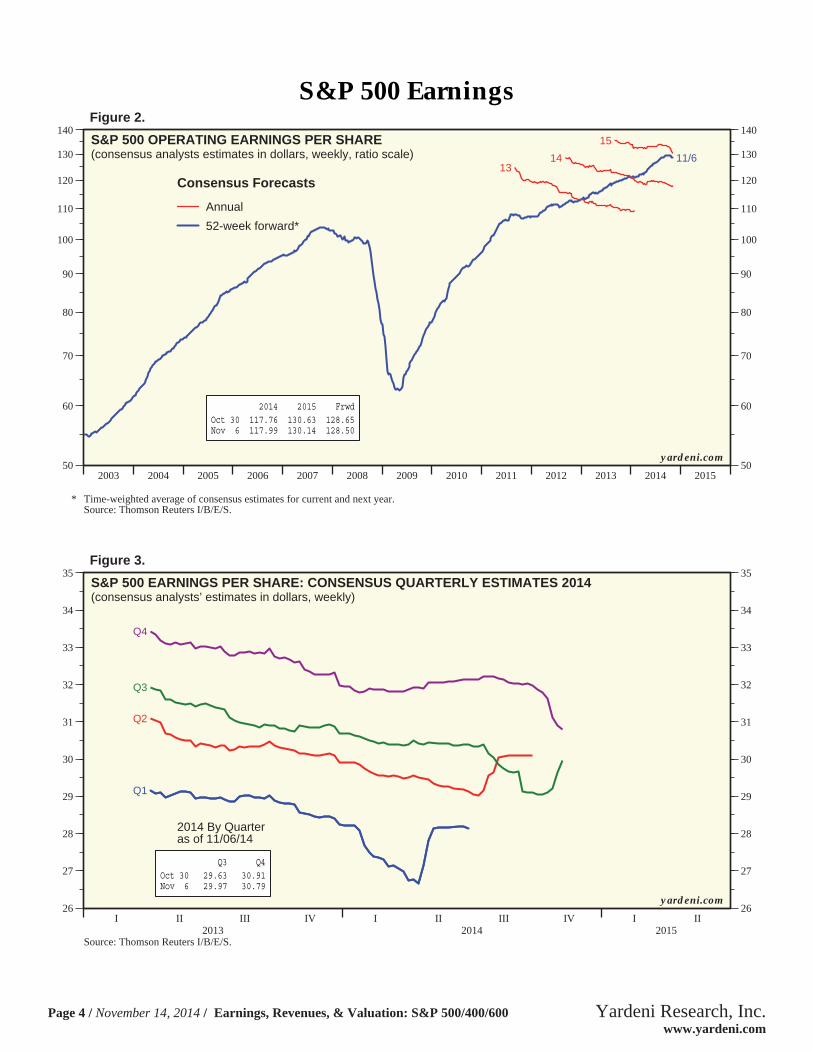
Figure 1.
2003 2004 2005 2006 2007 2008 2009 2010 2011 2012 2013 2014 201550
60
70
80
90
100
110
120
130
140
50
60
70
80
90
100
110
120
130
140
2014 2015 Frwd Oct 30 117.76 130.63 128.65 Nov 6 117.99 130.14 128.50
1314
1511/6
S&P 500 OPERATING EARNINGS PER SHARE(consensus analysts’ estimates in dollars, weekly, ratio scale)
Consensus Forecasts
Annual
52-week forward*
2003 2004 2005 2006 2007 2008 2009 2010 2011 2012 2013 2014 201525
35
45
55
65
75
85
95
25
35
45
55
65
75
85
95
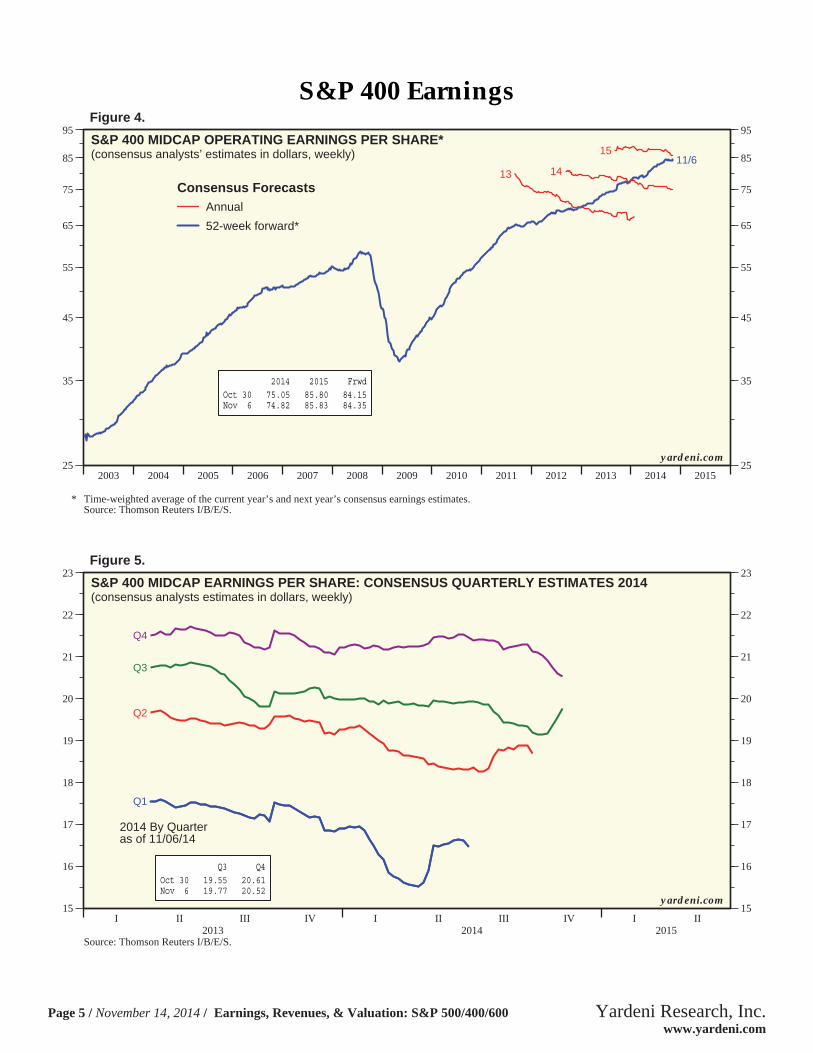
2014 2015 Frwd Oct 30 75.05 85.80 84.15 Nov 6 74.82 85.83 84.35
13 1415
11/6S&P 400
Consensus Forecasts
Annual
52-week forward*
2003 2004 2005 2006 2007 2008 2009 2010 2011 2012 2013 2014 201510
15
20
25
30
35
40
45
10
15
20
25
30
35
40
45
2014 2015 Frwd Oct 30 32.34 39.64 38.52 Nov 6 32.40 39.51 38.55
1314
1511/6
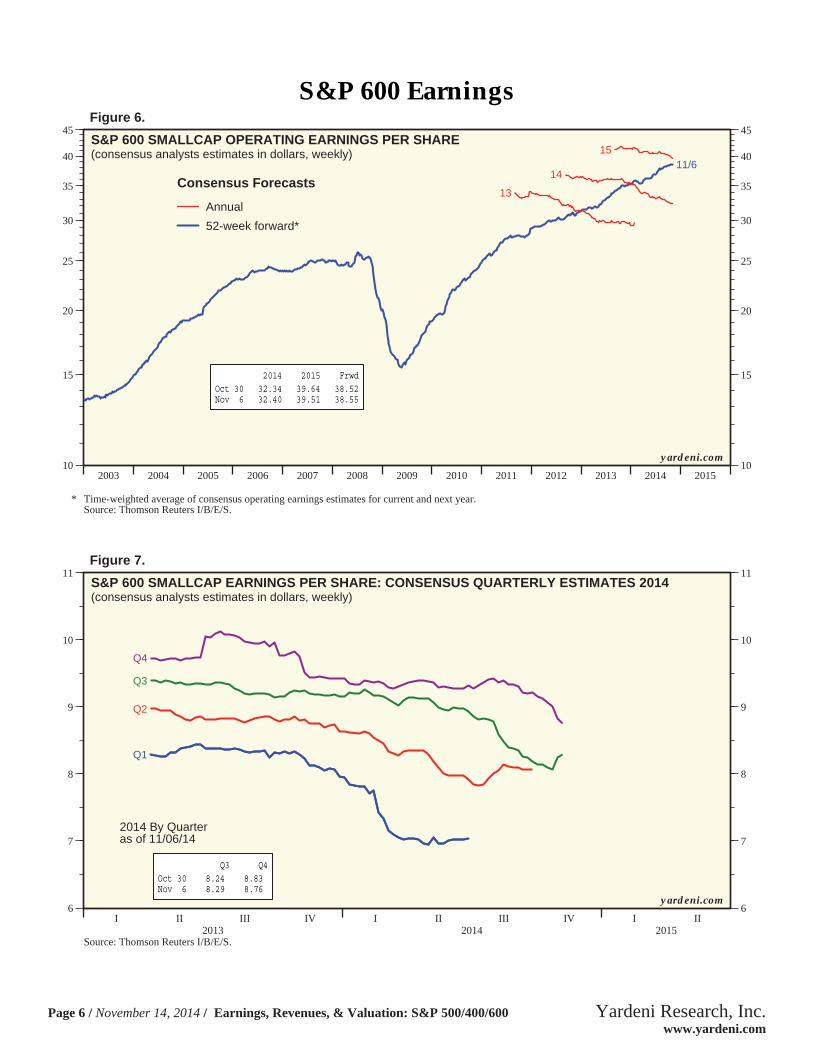
S&P 600
Consensus Forecasts
Annual
52-week forward*
* Time-weighted average of consensus operating earnings estimates for current and next year.Source: Thomson Reuters I/B/E/S.
yardeni.com
S&P Earnings
Page 3 / November 14, 2014 / Earnings, Revenues, & Valuation: S&P 500/400/600 www.yardeni.com
Yardeni Research, Inc.
2003 2004 2005 2006 2007 2008 2009 2010 2011 2012 2013 2014 201550
60
70
80
90
100
110
120
130
140
50
60
70
80
90
100
110
120
130
140
2014 2015 Frwd Oct 30 117.76 130.63 128.65 Nov 6 117.99 130.14 128.50
1314
15
11/6
S&P 500 OPERATING EARNINGS PER SHARE(consensus analysts estimates in dollars, weekly, ratio scale)
Consensus Forecasts
Annual
52-week forward*
* Time-weighted average of consensus estimates for current and next year.Source: Thomson Reuters I/B/E/S.
yardeni.com
Figure 2.
I II III IV I II III IV I II2013 2014 2015
26
27
28
29
30
31
32
33
34
35
26
27
28
29
30
31
32
33
34
35
Q3 Q4 Oct 30 29.63 30.91 Nov 6 29.97 30.79
Q1
Q2
Q3
Q4
2014 By Quarteras of 11/06/14
Source: Thomson Reuters I/B/E/S.
yardeni.com
S&P 500 EARNINGS PER SHARE: CONSENSUS QUARTERLY ESTIMATES 2014(consensus analysts’ estimates in dollars, weekly)
Figure 3.
S&P 500 Earnings
Page 4 / November 14, 2014 / Earnings, Revenues, & Valuation: S&P 500/400/600 www.yardeni.com
Yardeni Research, Inc.
2003 2004 2005 2006 2007 2008 2009 2010 2011 2012 2013 2014 201525
35
45
55
65
75
85
95
25
35
45
55
65
75
85
95
2014 2015 Frwd Oct 30 75.05 85.80 84.15 Nov 6 74.82 85.83 84.35
13 14
1511/6
S&P 400 MIDCAP OPERATING EARNINGS PER SHARE*(consensus analysts’ estimates in dollars, weekly)
Consensus ForecastsAnnual
52-week forward*
* Time-weighted average of the current year’s and next year’s consensus earnings estimates.Source: Thomson Reuters I/B/E/S.
yardeni.com
Figure 4.
I II III IV I II III IV I II2013 2014 2015
15
16
17
18
19
20
21
22
23
15
16
17
18
19
20
21
22
23
Q3 Q4 Oct 30 19.55 20.61 Nov 6 19.77 20.52
Q1
Q2
Q3
Q4
S&P 400 MIDCAP EARNINGS PER SHARE: CONSENSUS QUARTERLY ESTIMATES 2014(consensus analysts estimates in dollars, weekly)
2014 By Quarteras of 11/06/14
Source: Thomson Reuters I/B/E/S.
yardeni.com
Figure 5.
S&P 400 Earnings
Page 5 / November 14, 2014 / Earnings, Revenues, & Valuation: S&P 500/400/600 www.yardeni.com
Yardeni Research, Inc.
2003 2004 2005 2006 2007 2008 2009 2010 2011 2012 2013 2014 201510
15
20
25
30
35
40
45
10
15
20
25
30
35
40
45
2014 2015 Frwd Oct 30 32.34 39.64 38.52 Nov 6 32.40 39.51 38.55
13
14
1511/6
S&P 600 SMALLCAP OPERATING EARNINGS PER SHARE(consensus analysts estimates in dollars, weekly)
Consensus Forecasts
Annual
52-week forward*
* Time-weighted average of consensus operating earnings estimates for current and next year.Source: Thomson Reuters I/B/E/S.
yardeni.com
Figure 6.
I II III IV I II III IV I II2013 2014 2015
6
7
8
9
10
11
6
7
8
9
10
11
Q3 Q4 Oct 30 8.24 8.83 Nov 6 8.29 8.76
Q1
Q2
Q3
Q4
S&P 600 SMALLCAP EARNINGS PER SHARE: CONSENSUS QUARTERLY ESTIMATES 2014(consensus analysts estimates in dollars, weekly)
2014 By Quarteras of 11/06/14
Source: Thomson Reuters I/B/E/S.
yardeni.com
Figure 7.
S&P 600 Earnings
Page 6 / November 14, 2014 / Earnings, Revenues, & Valuation: S&P 500/400/600 www.yardeni.com
Yardeni Research, Inc.
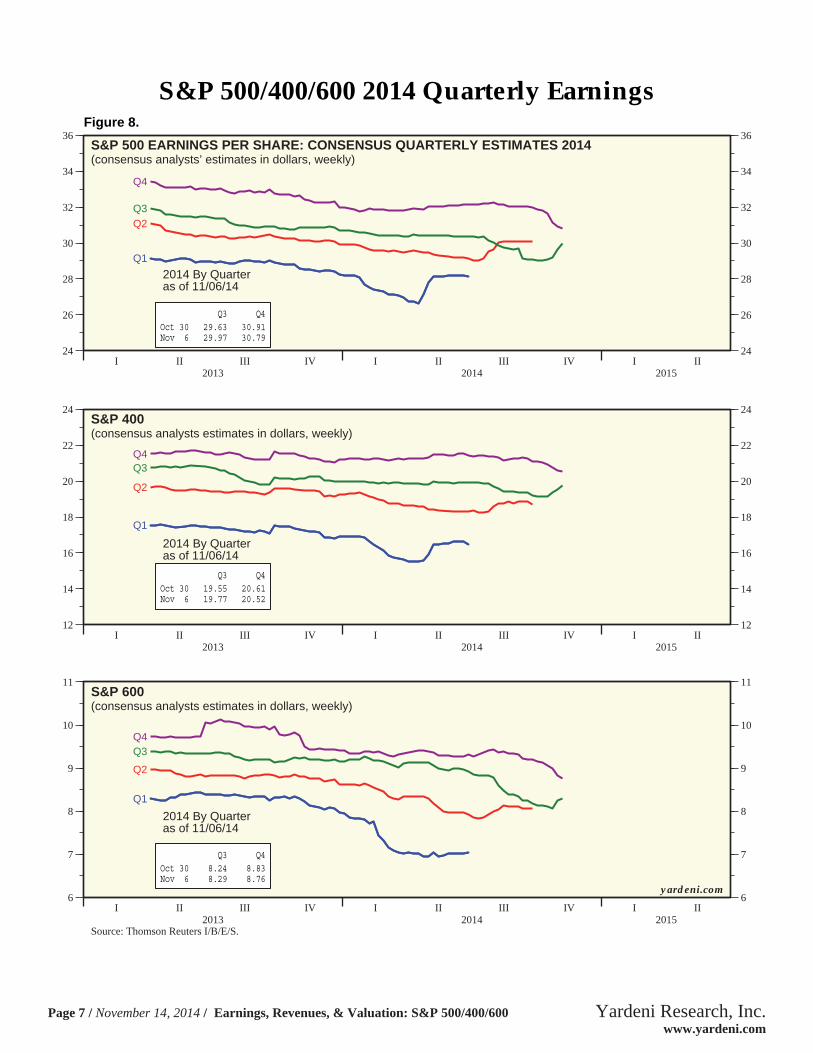
Figure 8.
I II III IV I II III IV I II2013 2014 2015
24
26
28
30
32
34
36
24
26
28
30
32
34
36
Q3 Q4 Oct 30 29.63 30.91 Nov 6 29.97 30.79
Q1
Q2Q3
Q4
2014 By Quarteras of 11/06/14
S&P 500 EARNINGS PER SHARE: CONSENSUS QUARTERLY ESTIMATES 2014(consensus analysts’ estimates in dollars, weekly)
I II III IV I II III IV I II2013 2014 2015
12
14
16
18
20
22
24
12
14
16
18
20
22
24
Q3 Q4 Oct 30 19.55 20.61 Nov 6 19.77 20.52
Q1
Q2
Q3Q4
S&P 400(consensus analysts estimates in dollars, weekly)
2014 By Quarteras of 11/06/14
I II III IV I II III IV I II2013 2014 2015
6
7
8
9
10
11
6
7
8
9
10
11
Q3 Q4 Oct 30 8.24 8.83 Nov 6 8.29 8.76
Q1
Q2
Q3Q4
S&P 600(consensus analysts estimates in dollars, weekly)
2014 By Quarteras of 11/06/14
Source: Thomson Reuters I/B/E/S.
yardeni.com
S&P 500/400/600 2014 Quarterly Earnings
Page 7 / November 14, 2014 / Earnings, Revenues, & Valuation: S&P 500/400/600 www.yardeni.com
Yardeni Research, Inc.
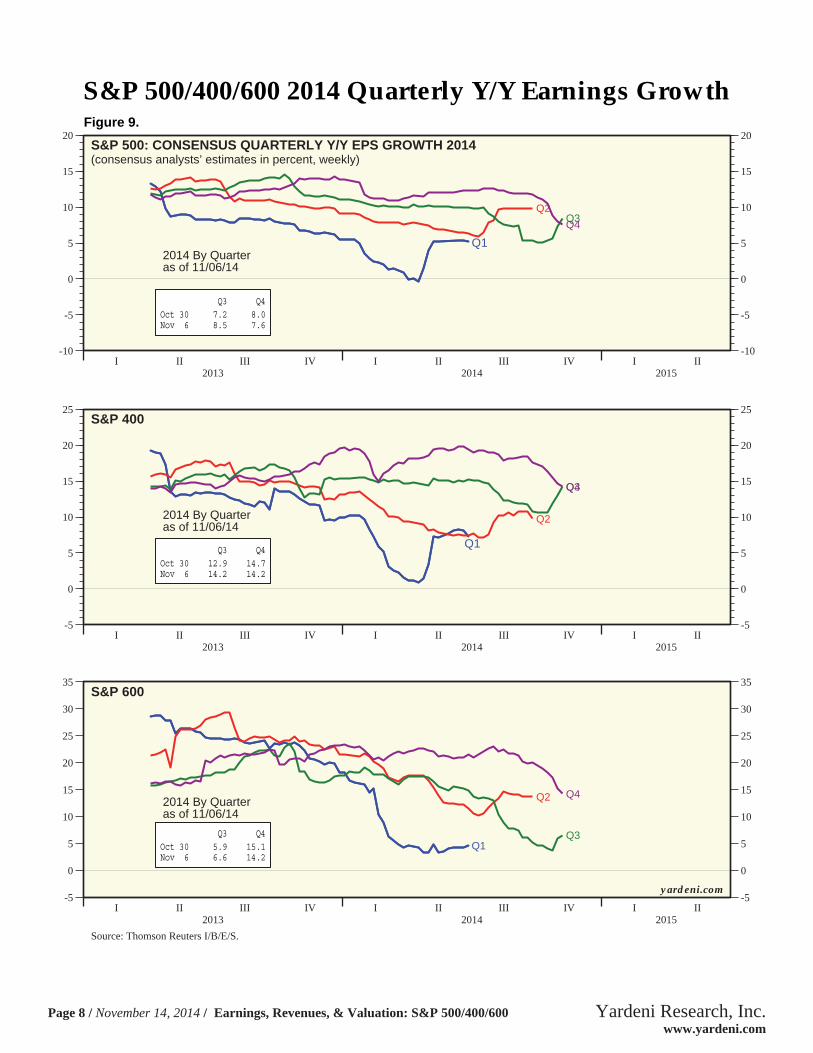
Figure 9.
I II III IV I II III IV I II2013 2014 2015
-10
-5
0
5
10
15
20
-10
-5
0
5
10
15
20
Q3 Q4 Oct 30 7.2 8.0 Nov 6 8.5 7.6
Q2Q3Q4
2014 By Quarteras of 11/06/14
Q1
S&P 500: CONSENSUS QUARTERLY Y/Y EPS GROWTH 2014(consensus analysts’ estimates in percent, weekly)
I II III IV I II III IV I II2013 2014 2015
-5
0
5
10
15
20
25
-5
0
5
10
15
20
25
Q3 Q4 Oct 30 12.9 14.7 Nov 6 14.2 14.2
Q2
Q3Q4
2014 By Quarteras of 11/06/14
Q1
S&P 400
I II III IV I II III IV I II2013 2014 2015
-5
0
5
10
15
20
25
30
35
-5
0
5
10
15
20
25
30
35
Q3 Q4 Oct 30 5.9 15.1 Nov 6 6.6 14.2
Q1
Q2
Q3
Q42014 By Quarteras of 11/06/14
Source: Thomson Reuters I/B/E/S.
yardeni.com
S&P 600
S&P 500/400/600 2014 Quarterly Y/Y Earnings Growth
Page 8 / November 14, 2014 / Earnings, Revenues, & Valuation: S&P 500/400/600 www.yardeni.com
Yardeni Research, Inc.
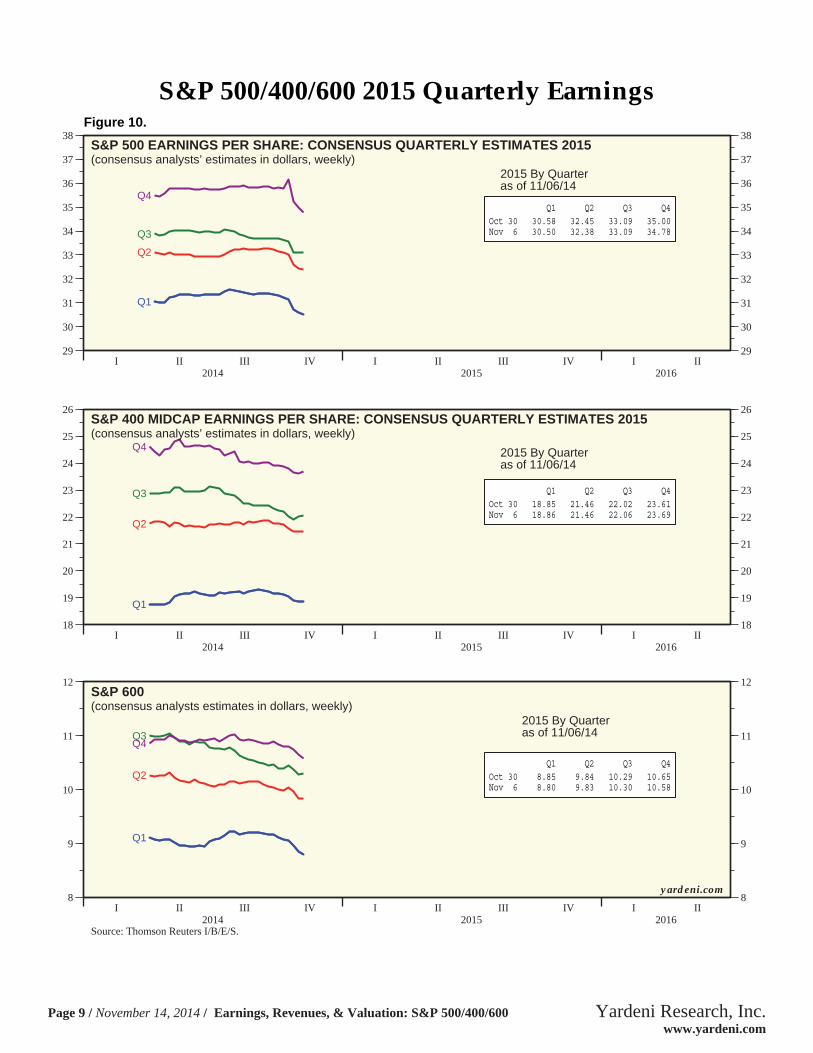
Figure 10.
I II III IV I II III IV I II2014 2015 2016
29
30
31
32
33
34
35
36
37
38
29
30
31
32
33
34
35
36
37
38
Q1 Q2 Q3 Q4 Oct 30 30.58 32.45 33.09 35.00 Nov 6 30.50 32.38 33.09 34.78
Q1
Q2
Q3
Q4
2015 By Quarteras of 11/06/14
S&P 500 EARNINGS PER SHARE: CONSENSUS QUARTERLY ESTIMATES 2015(consensus analysts’ estimates in dollars, weekly)
I II III IV I II III IV I II2014 2015 2016
18
19
20
21
22
23
24
25
26
18
19
20
21
22
23
24
25
26
Q1 Q2 Q3 Q4 Oct 30 18.85 21.46 22.02 23.61 Nov 6 18.86 21.46 22.06 23.69
Q1
Q2
Q3
Q4 2015 By Quarteras of 11/06/14
S&P 400 MIDCAP EARNINGS PER SHARE: CONSENSUS QUARTERLY ESTIMATES 2015(consensus analysts’ estimates in dollars, weekly)
I II III IV I II III IV I II2014 2015 2016
8
9
10
11
12
8
9
10
11
12
Q1 Q2 Q3 Q4 Oct 30 8.85 9.84 10.29 10.65 Nov 6 8.80 9.83 10.30 10.58
Q1
Q2
Q3Q4
S&P 600(consensus analysts estimates in dollars, weekly)
2015 By Quarteras of 11/06/14
Source: Thomson Reuters I/B/E/S.
yardeni.com
S&P 500/400/600 2015 Quarterly Earnings
Page 9 / November 14, 2014 / Earnings, Revenues, & Valuation: S&P 500/400/600 www.yardeni.com
Yardeni Research, Inc.
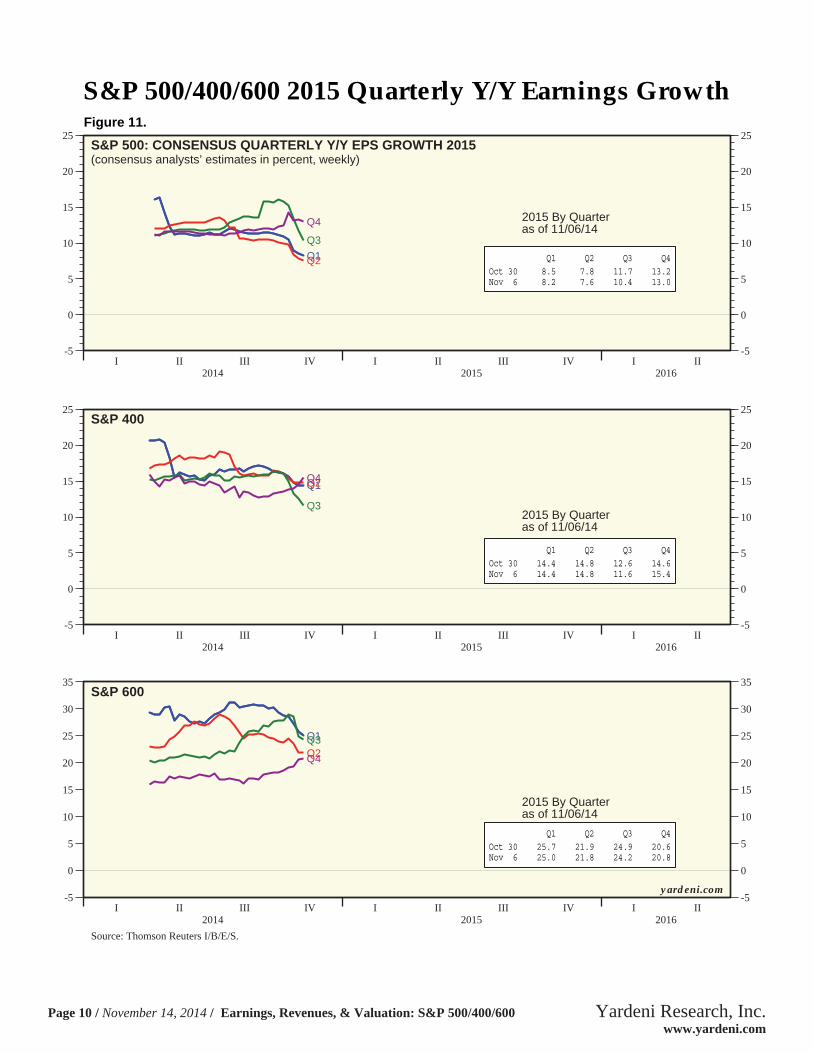
Figure 11.
I II III IV I II III IV I II2014 2015 2016
-5
0
5
10
15
20
25
-5
0
5
10
15
20
25
Q1 Q2 Q3 Q4 Oct 30 8.5 7.8 11.7 13.2 Nov 6 8.2 7.6 10.4 13.0
Q1Q2
Q3
Q4 2015 By Quarteras of 11/06/14
S&P 500: CONSENSUS QUARTERLY Y/Y EPS GROWTH 2015(consensus analysts’ estimates in percent, weekly)
I II III IV I II III IV I II2014 2015 2016
-5
0
5
10
15
20
25
-5
0
5
10
15
20
25
Q1 Q2 Q3 Q4 Oct 30 14.4 14.8 12.6 14.6 Nov 6 14.4 14.8 11.6 15.4
Q1Q2
Q3
Q4
2015 By Quarteras of 11/06/14
S&P 400
I II III IV I II III IV I II2014 2015 2016
-5
0
5
10
15
20
25
30
35
-5
0
5
10
15
20
25
30
35
Q1 Q2 Q3 Q4 Oct 30 25.7 21.9 24.9 20.6 Nov 6 25.0 21.8 24.2 20.8
Q1
Q2Q3
Q4
2015 By Quarteras of 11/06/14
Source: Thomson Reuters I/B/E/S.
yardeni.com
S&P 600
S&P 500/400/600 2015 Quarterly Y/Y Earnings Growth
Page 10 / November 14, 2014 / Earnings, Revenues, & Valuation: S&P 500/400/600 www.yardeni.com
Yardeni Research, Inc.
1999 2000 2001 2002 2003 2004 2005 2006 2007 2008 2009 2010 2011 2012 2013 2014 2015140
340
540
740
940
1140
1340
15401740194021402340
140
340
540
740
940
1140
1340
15401740194021402340
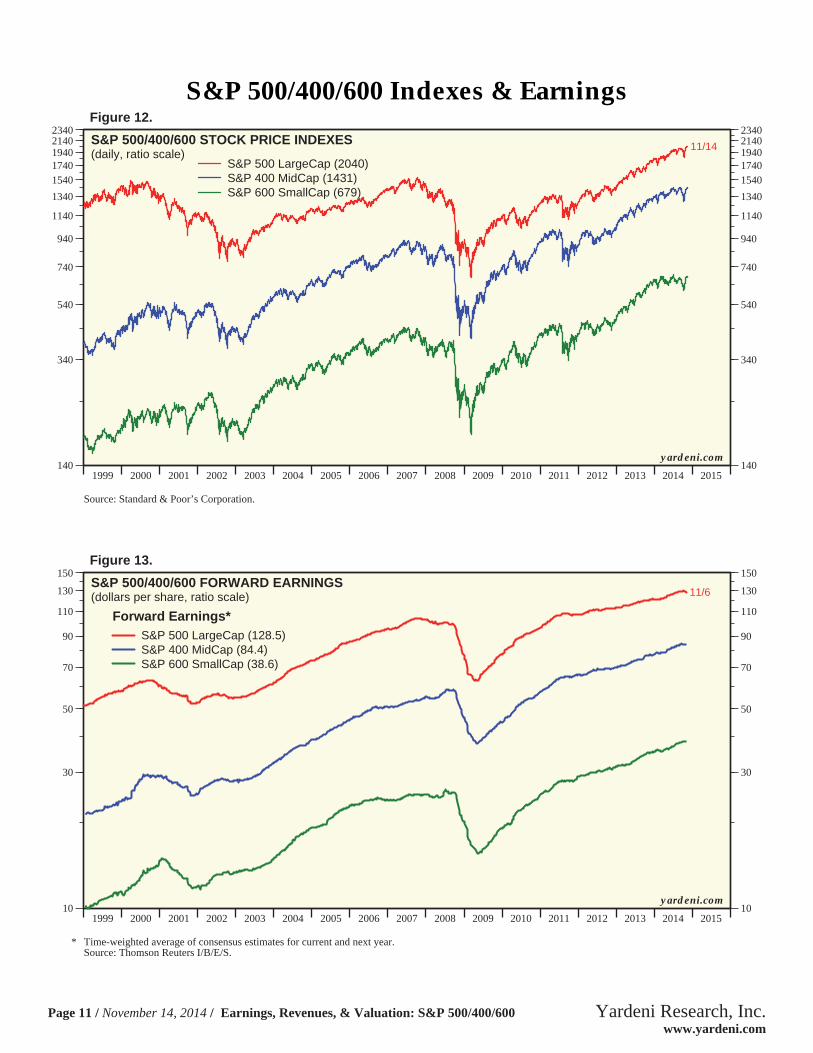
11/14S&P 500/400/600 STOCK PRICE INDEXES(daily, ratio scale)
S&P 500 LargeCap (2040)S&P 400 MidCap (1431)S&P 600 SmallCap (679)
Source: Standard & Poor’s Corporation.
yardeni.com
Figure 12.
1999 2000 2001 2002 2003 2004 2005 2006 2007 2008 2009 2010 2011 2012 2013 2014 201510
30
50
70
90
110
130
150
10
30
50
70
90
110
130
150
11/6S&P 500/400/600 FORWARD EARNINGS(dollars per share, ratio scale)
Forward Earnings*S&P 500 LargeCap (128.5)
S&P 600 SmallCap (38.6)S&P 400 MidCap (84.4)
* Time-weighted average of consensus estimates for current and next year.Source: Thomson Reuters I/B/E/S.
yardeni.com
Figure 13.
S&P 500/400/600 Indexes & Earnings
Page 11 / November 14, 2014 / Earnings, Revenues, & Valuation: S&P 500/400/600 www.yardeni.com
Yardeni Research, Inc.
1999 2000 2001 2002 2003 2004 2005 2006 2007 2008 2009 2010 2011 2012 2013 2014 2015 20168
10
12
14
16
18
20
22
24
26
28
8
10
12
14
16
18
20
22
24
26
28
11/7
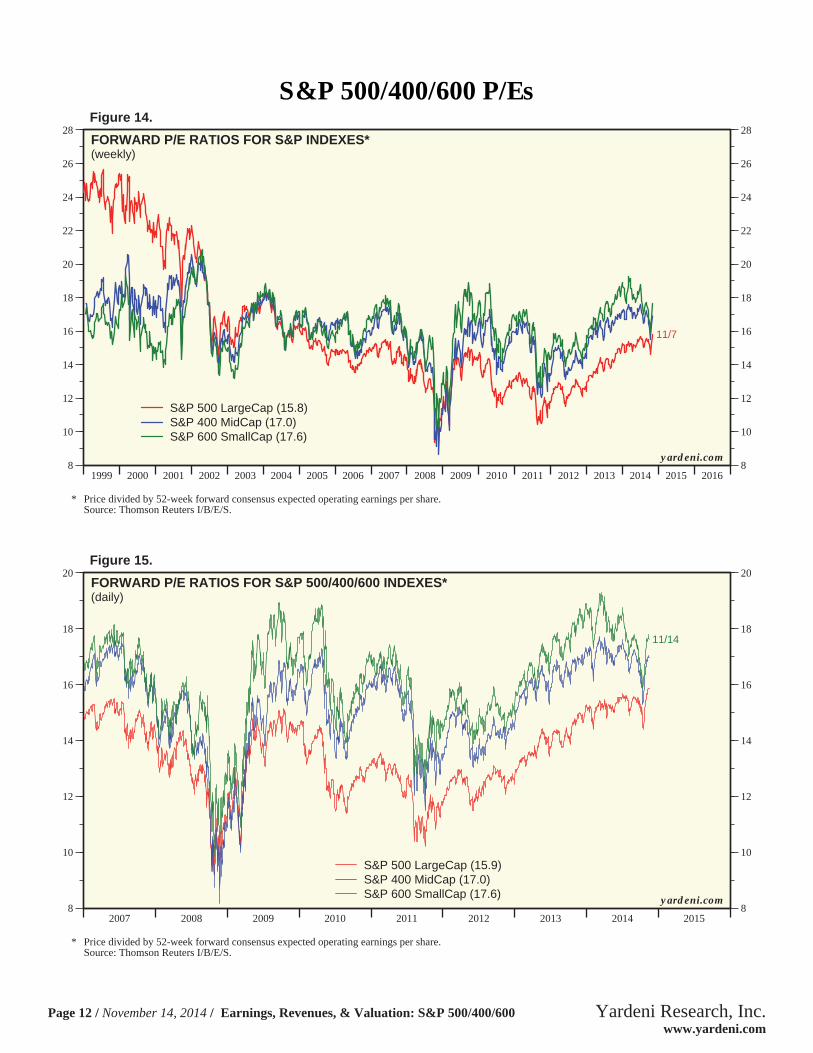
FORWARD P/E RATIOS FOR S&P INDEXES*(weekly)
S&P 500 LargeCap (15.8)S&P 400 MidCap (17.0)S&P 600 SmallCap (17.6)
* Price divided by 52-week forward consensus expected operating earnings per share.Source: Thomson Reuters I/B/E/S.
yardeni.com
Figure 14.
2007 2008 2009 2010 2011 2012 2013 2014 20158
10
12
14
16
18
20
8
10
12
14
16
18
20
11/14
FORWARD P/E RATIOS FOR S&P 500/400/600 INDEXES*(daily)
S&P 500 LargeCap (15.9)S&P 400 MidCap (17.0)S&P 600 SmallCap (17.6)
* Price divided by 52-week forward consensus expected operating earnings per share.Source: Thomson Reuters I/B/E/S.
yardeni.com
Figure 15.
S&P 500/400/600 P/Es
Page 12 / November 14, 2014 / Earnings, Revenues, & Valuation: S&P 500/400/600 www.yardeni.com
Yardeni Research, Inc.
2004 2005 2006 2007 2008 2009 2010 2011 2012 2013 2014 2015700
750
800
850
900
950
1000
1050
1100
1150
1200
1250
700
750
800
850
900
950
1000
1050
1100
1150
1200
1250
11/6
13
14
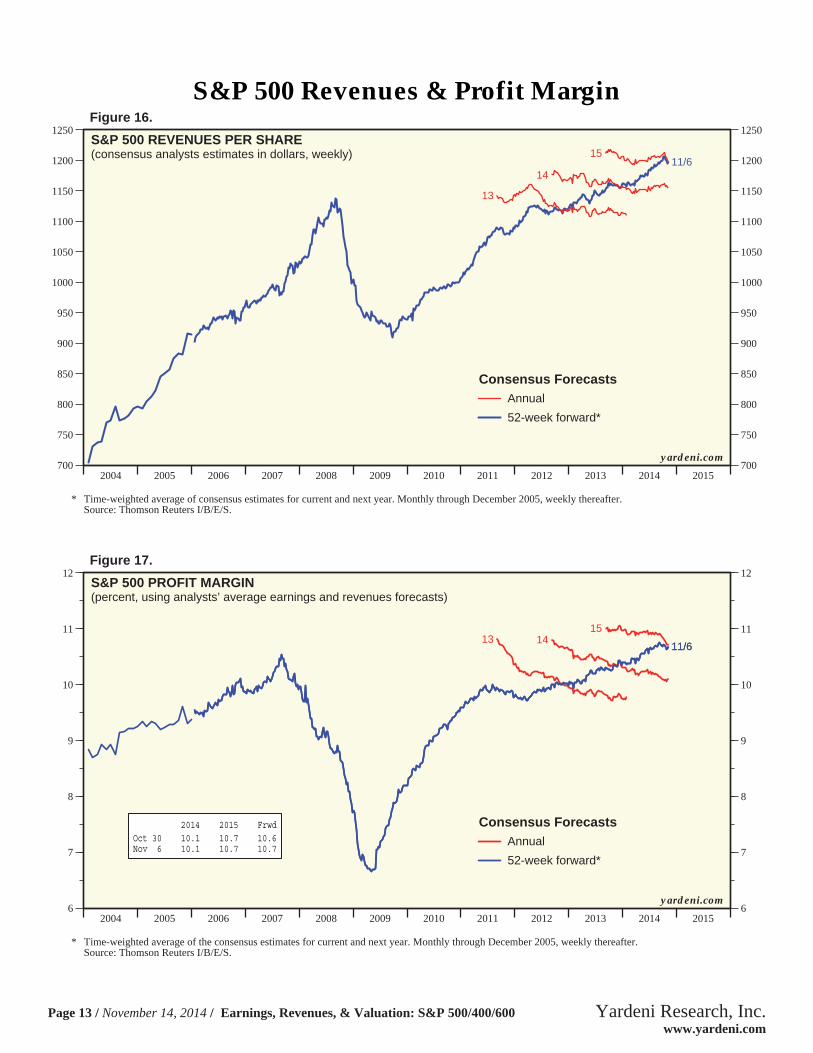
15S&P 500 REVENUES PER SHARE(consensus analysts estimates in dollars, weekly)
Consensus ForecastsAnnual
52-week forward*
* Time-weighted average of consensus estimates for current and next year. Monthly through December 2005, weekly thereafter.Source: Thomson Reuters I/B/E/S.
yardeni.com
Figure 16.
2004 2005 2006 2007 2008 2009 2010 2011 2012 2013 2014 20156
7
8
9
10
11
12
6
7
8
9
10
11
12
2014 2015 Frwd Oct 30 10.1 10.7 10.6 Nov 6 10.1 10.7 10.7
11/613 14
15
11/6
yardeni.com
(percent, using analysts’ average earnings and revenues forecasts)
* Time-weighted average of the consensus estimates for current and next year. Monthly through December 2005, weekly thereafter.Source: Thomson Reuters I/B/E/S.
S&P 500 PROFIT MARGIN
Consensus Forecasts
52-week forward*
Annual
Figure 17.
S&P 500 Revenues & Profit Margin
Page 13 / November 14, 2014 / Earnings, Revenues, & Valuation: S&P 500/400/600 www.yardeni.com
Yardeni Research, Inc.
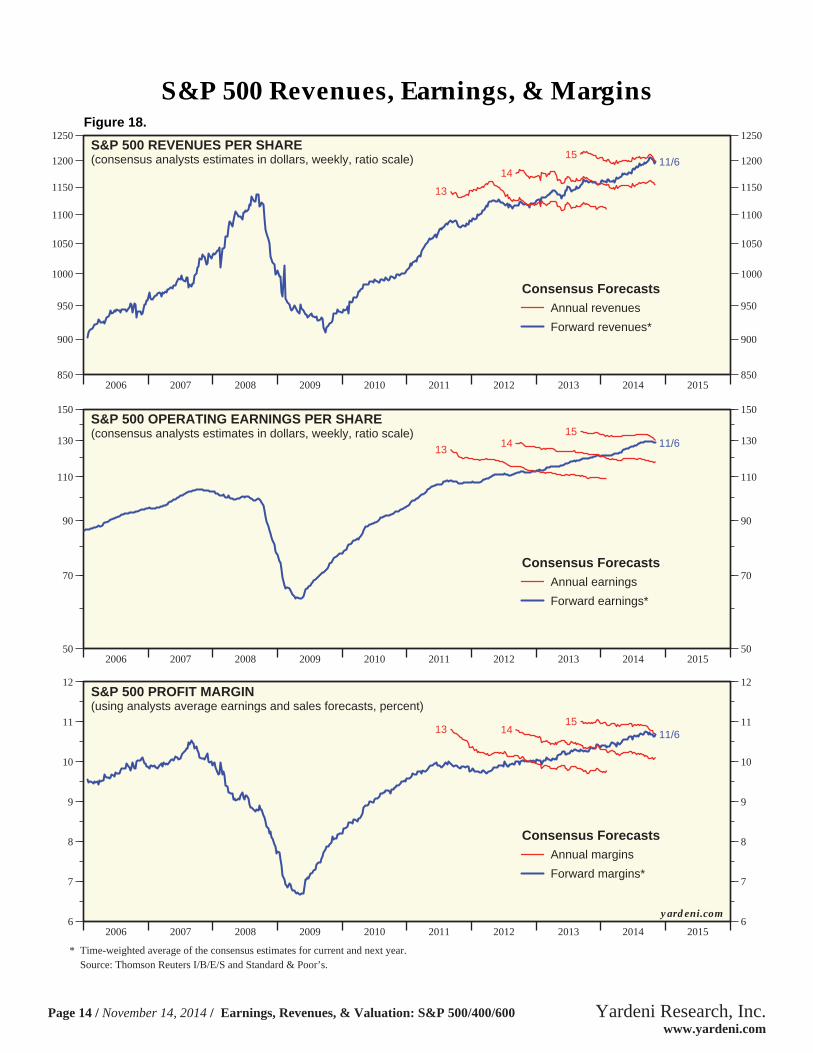
Figure 18.
2006 2007 2008 2009 2010 2011 2012 2013 2014 2015850
900
950
1000
1050
1100
1150
1200
1250
850
900
950
1000
1050
1100
1150
1200
1250
11/6
13
14
15S&P 500 REVENUES PER SHARE(consensus analysts estimates in dollars, weekly, ratio scale)
Consensus ForecastsAnnual revenues
Forward revenues*
2006 2007 2008 2009 2010 2011 2012 2013 2014 201550
70
90
110
130
150
50
70
90
110
130
150
11/613
1415
S&P 500 OPERATING EARNINGS PER SHARE(consensus analysts estimates in dollars, weekly, ratio scale)
Consensus ForecastsAnnual earnings
Forward earnings*
2006 2007 2008 2009 2010 2011 2012 2013 2014 20156
7
8
9
10
11
12
6
7
8
9
10
11
12
11/613 1415
yardeni.com
S&P 500 PROFIT MARGIN(using analysts average earnings and sales forecasts, percent)
Consensus Forecasts
Forward margins*
Annual margins
* Time-weighted average of the consensus estimates for current and next year. Source: Thomson Reuters I/B/E/S and Standard & Poor’s.
S&P 500 Revenues, Earnings, & Margins
Page 14 / November 14, 2014 / Earnings, Revenues, & Valuation: S&P 500/400/600 www.yardeni.com
Yardeni Research, Inc.
2007 2008 2009 2010 2011 2012 2013 2014 2015600
800
1000
1200
1400
1600
1800
2000
2200
600
800
1000
1200
1400
1600
1800
2000
2200
x10
x11
x12
x13
x14
x15
x16
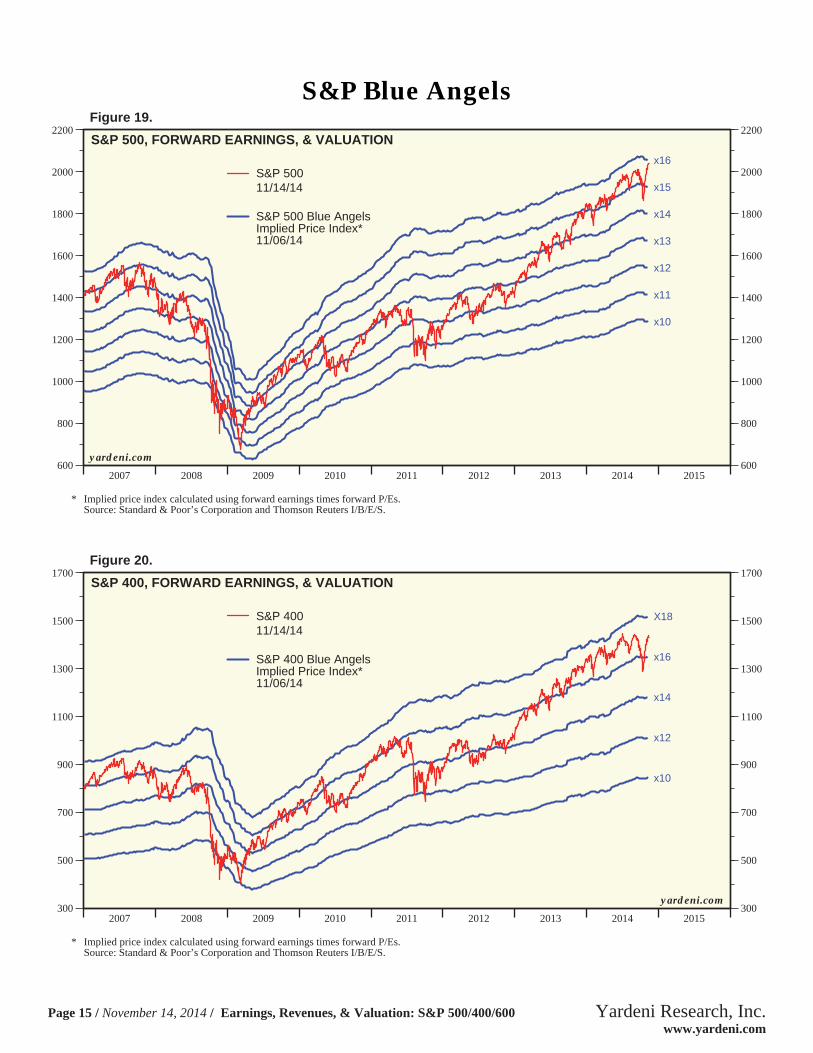
S&P 500, FORWARD EARNINGS, & VALUATION
S&P 50011/14/14
S&P 500 Blue AngelsImplied Price Index*11/06/14
* Implied price index calculated using forward earnings times forward P/Es.Source: Standard & Poor’s Corporation and Thomson Reuters I/B/E/S.
yardeni.com
Figure 19.
2007 2008 2009 2010 2011 2012 2013 2014 2015300
500
700
900
1100
1300
1500
1700
300
500
700
900
1100
1300
1500
1700
x10
x12
x14
x16
X18
S&P 400, FORWARD EARNINGS, & VALUATION
S&P 40011/14/14
S&P 400 Blue AngelsImplied Price Index*11/06/14
* Implied price index calculated using forward earnings times forward P/Es.Source: Standard & Poor’s Corporation and Thomson Reuters I/B/E/S.
yardeni.com
Figure 20.
S&P Blue Angels
Page 15 / November 14, 2014 / Earnings, Revenues, & Valuation: S&P 500/400/600 www.yardeni.com
Yardeni Research, Inc.
2007 2008 2009 2010 2011 2012 2013 2014 2015150
250
350
450
550
650
750
850
150
250
350
450
550
650
750
850
x10
x12
x14
x16
x18
x20
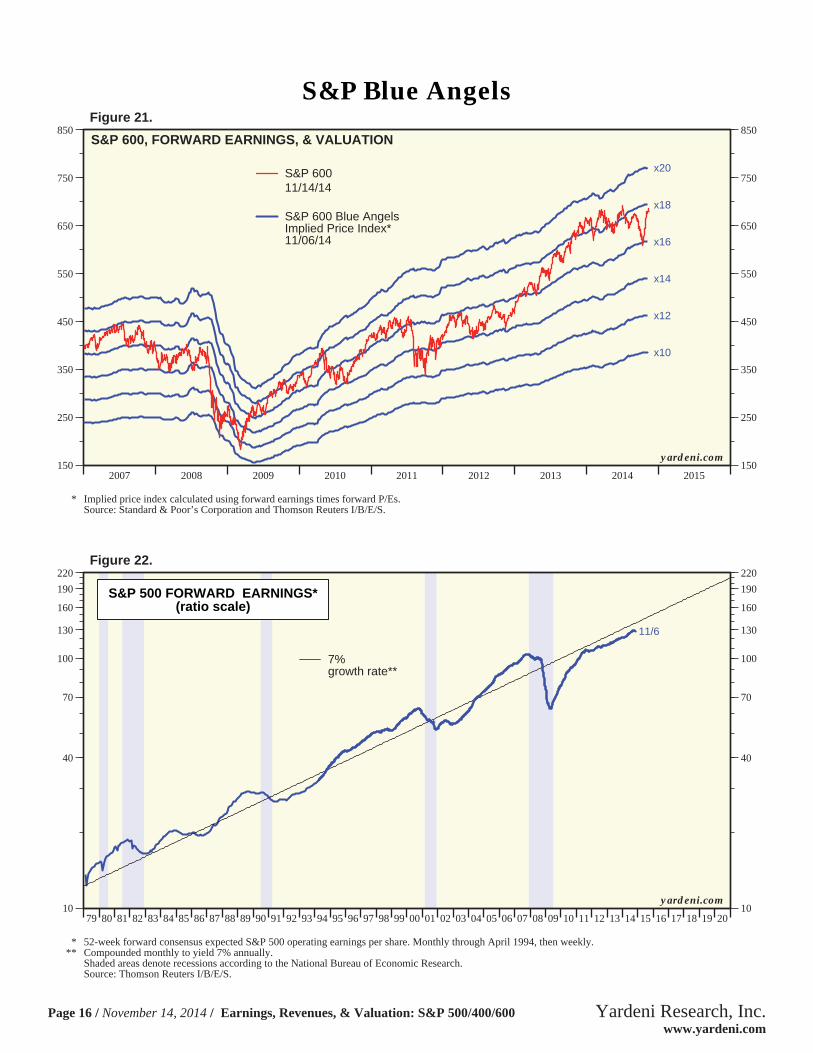
S&P 600, FORWARD EARNINGS, & VALUATION
S&P 60011/14/14
S&P 600 Blue AngelsImplied Price Index*11/06/14
* Implied price index calculated using forward earnings times forward P/Es.Source: Standard & Poor’s Corporation and Thomson Reuters I/B/E/S.
yardeni.com
Figure 21.
79 80 81 82 83 84 85 86 87 88 89 90 91 92 93 94 95 96 97 98 99 00 01 02 03 04 05 06 07 08 09 10 11 12 13 14 15 16 17 18 19 2010
40
70
100
130
160
190
220
10
40
70
100
130
160
190
220
S&P 500 FORWARD EARNINGS*(ratio scale)
11/6
7%growth rate**
* 52-week forward consensus expected S&P 500 operating earnings per share. Monthly through April 1994, then weekly.** Compounded monthly to yield 7% annually.
Shaded areas denote recessions according to the National Bureau of Economic Research.Source: Thomson Reuters I/B/E/S.
yardeni.com
Figure 22.
S&P Blue Angels
Page 16 / November 14, 2014 / Earnings, Revenues, & Valuation: S&P 500/400/600 www.yardeni.com
Yardeni Research, Inc.
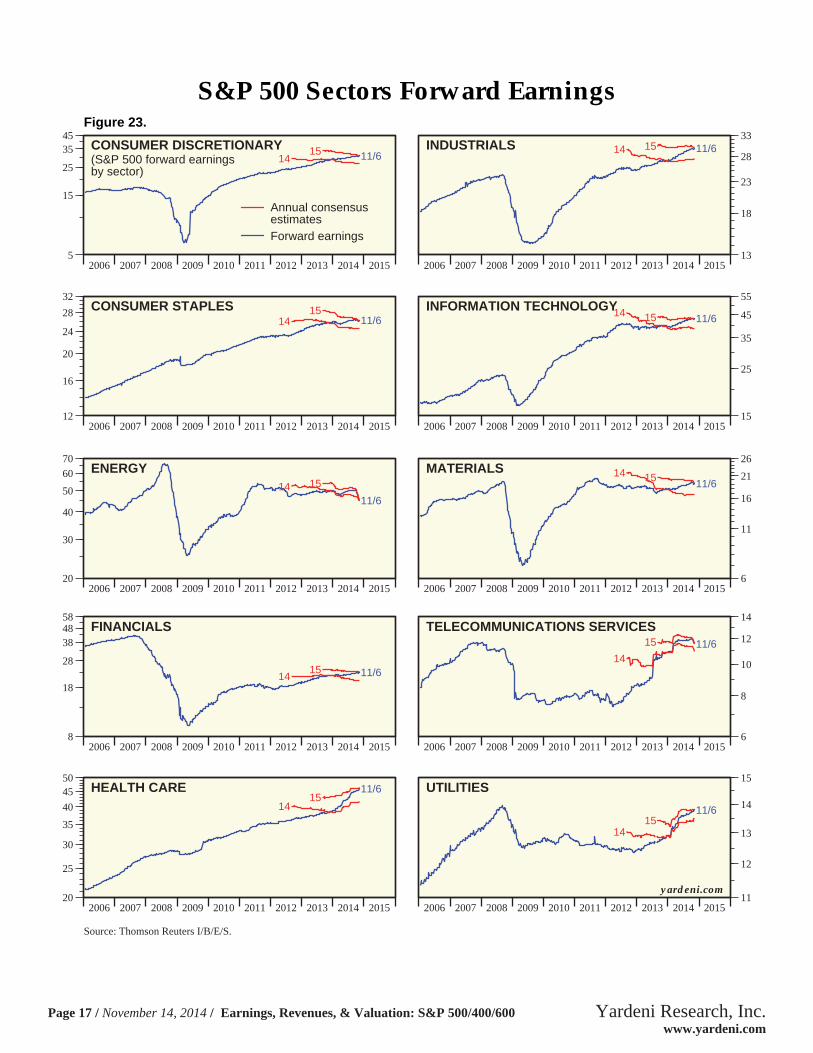
Figure 23.
2006 2007 2008 2009 2010 2011 2012 2013 2014 20155
15
25
3545
11/61415CONSUMER DISCRETIONARY
(S&P 500 forward earningsby sector)
Annual consensusestimatesForward earnings
2006 2007 2008 2009 2010 2011 2012 2013 2014 201513
18
23
28
3311/614 15INDUSTRIALS
2006 2007 2008 2009 2010 2011 2012 2013 2014 201512
16
20
24
28
32
11/61415CONSUMER STAPLES
2006 2007 2008 2009 2010 2011 2012 2013 2014 201515
25
35
45
55
11/614 15INFORMATION TECHNOLOGY
2006 2007 2008 2009 2010 2011 2012 2013 2014 201520
30
40
50
6070
11/614 15
ENERGY
2006 2007 2008 2009 2010 2011 2012 2013 2014 20156
11
16
21
26
11/614 15
MATERIALS
2006 2007 2008 2009 2010 2011 2012 2013 2014 20158
18
28
384858
11/61415
FINANCIALS
2006 2007 2008 2009 2010 2011 2012 2013 2014 20156
8
10
12
14
11/614
15TELECOMMUNICATIONS SERVICES
2006 2007 2008 2009 2010 2011 2012 2013 2014 201520
25
30
35
40
4550
11/6
1415
HEALTH CARE
Source: Thomson Reuters I/B/E/S.
2006 2007 2008 2009 2010 2011 2012 2013 2014 201511
12
13
14
15
1511/6
14
UTILITIES
yardeni.com
S&P 500 Sectors Forward Earnings
Page 17 / November 14, 2014 / Earnings, Revenues, & Valuation: S&P 500/400/600 www.yardeni.com
Yardeni Research, Inc.
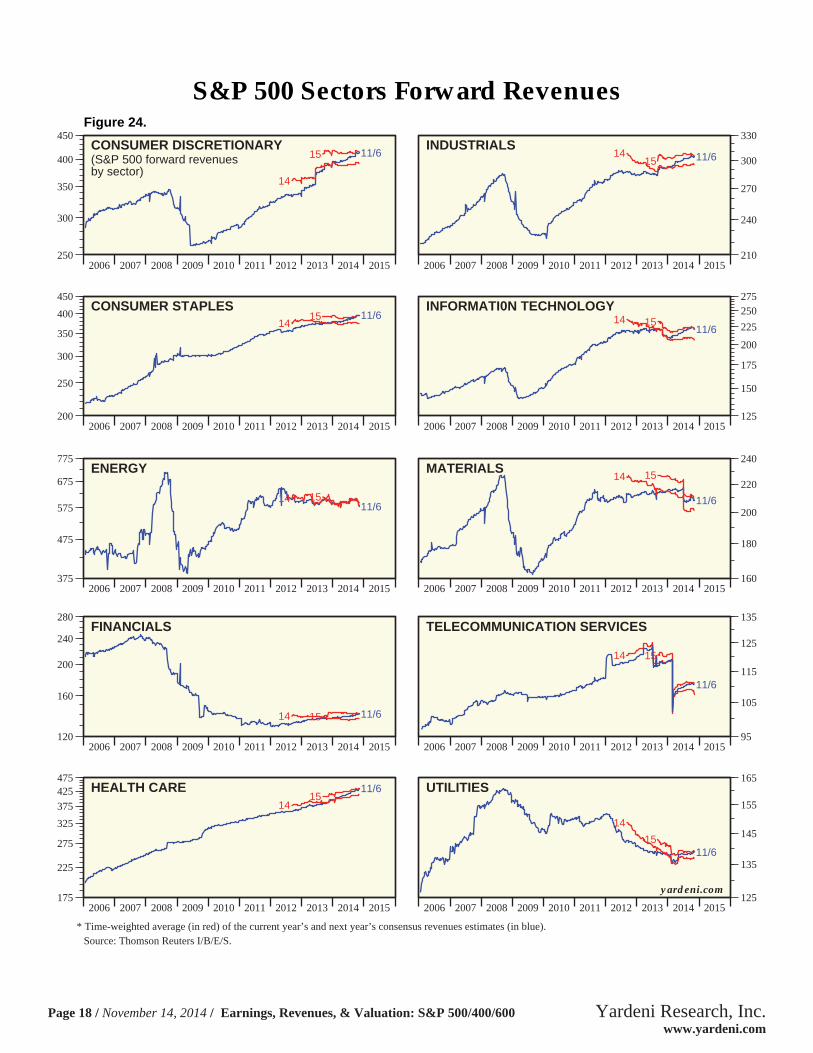
Figure 24.
2006 2007 2008 2009 2010 2011 2012 2013 2014 2015250
300
350
400
450
11/6
14
15CONSUMER DISCRETIONARY(S&P 500 forward revenuesby sector)
2006 2007 2008 2009 2010 2011 2012 2013 2014 2015210
240
270
300
330
11/61415
INDUSTRIALS
2006 2007 2008 2009 2010 2011 2012 2013 2014 2015200
250
300
350
400
450
15 11/614
CONSUMER STAPLES
2006 2007 2008 2009 2010 2011 2012 2013 2014 2015125
150
175
200
225
250275
11/614 15
INFORMATI0N TECHNOLOGY
2006 2007 2008 2009 2010 2011 2012 2013 2014 2015375
475
575
675
775
11/614 15
ENERGY
2006 2007 2008 2009 2010 2011 2012 2013 2014 2015160
180
200
220
240
11/6
14 15MATERIALS
2006 2007 2008 2009 2010 2011 2012 2013 2014 2015120
160
200
240
280
11/614 15
FINANCIALS
2006 2007 2008 2009 2010 2011 2012 2013 2014 201595
105
115
125
135
14 15
11/6
TELECOMMUNICATION SERVICES
2006 2007 2008 2009 2010 2011 2012 2013 2014 2015175
225
275
325
375
425475
11/6
1415
HEALTH CARE
* Time-weighted average (in red) of the current year’s and next year’s consensus revenues estimates (in blue).Source: Thomson Reuters I/B/E/S.
2006 2007 2008 2009 2010 2011 2012 2013 2014 2015125
135
145
155
165
1511/6
14
UTILITIES
yardeni.com
S&P 500 Sectors Forward Revenues
Page 18 / November 14, 2014 / Earnings, Revenues, & Valuation: S&P 500/400/600 www.yardeni.com
Yardeni Research, Inc.
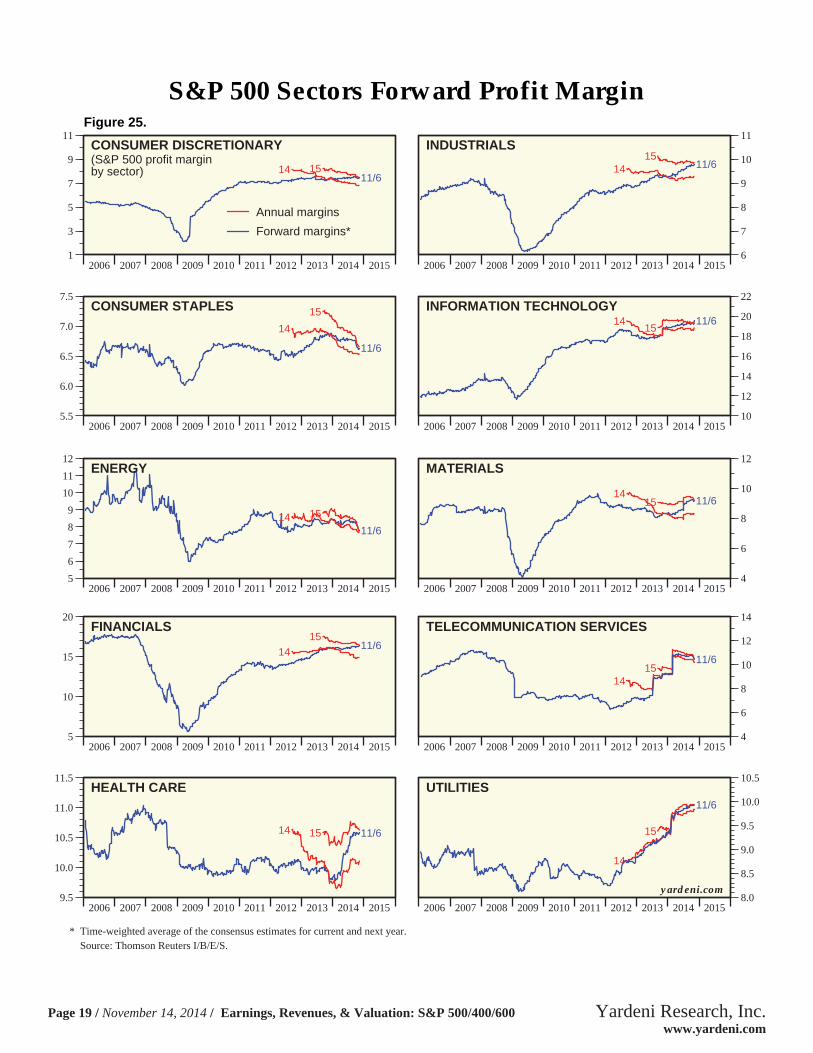
Figure 25.
2006 2007 2008 2009 2010 2011 2012 2013 2014 20151
3
5
7
9
11
11/614 15
CONSUMER DISCRETIONARY(S&P 500 profit marginby sector)
Annual margins
Forward margins*
2006 2007 2008 2009 2010 2011 2012 2013 2014 20156
7
8
9
10
11
11/61415
INDUSTRIALS
2006 2007 2008 2009 2010 2011 2012 2013 2014 20155.5
6.0
6.5
7.0
7.5
11/6
14
15CONSUMER STAPLES
2006 2007 2008 2009 2010 2011 2012 2013 2014 201510
12
14
16
18
20
22
11/61415
INFORMATION TECHNOLOGY
2006 2007 2008 2009 2010 2011 2012 2013 2014 20155
6
7
8
9
10
11
12
11/614 15
ENERGY
2006 2007 2008 2009 2010 2011 2012 2013 2014 20154
6
8
10
12
11/614
15
MATERIALS
2006 2007 2008 2009 2010 2011 2012 2013 2014 20155
10
15
20
11/614
15FINANCIALS
2006 2007 2008 2009 2010 2011 2012 2013 2014 20154
6
8
10
12
14
1415
11/6
TELECOMMUNICATION SERVICES
2006 2007 2008 2009 2010 2011 2012 2013 2014 20159.5
10.0
10.5
11.0
11.5
11/614 15
HEALTH CARE
* Time-weighted average of the consensus estimates for current and next year. Source: Thomson Reuters I/B/E/S.
2006 2007 2008 2009 2010 2011 2012 2013 2014 20158.0
8.5
9.0
9.5
10.0
10.5
14
15
11/6
UTILITIES
yardeni.com
S&P 500 Sectors Forward Profit Margin
Page 19 / November 14, 2014 / Earnings, Revenues, & Valuation: S&P 500/400/600 www.yardeni.com
Yardeni Research, Inc.
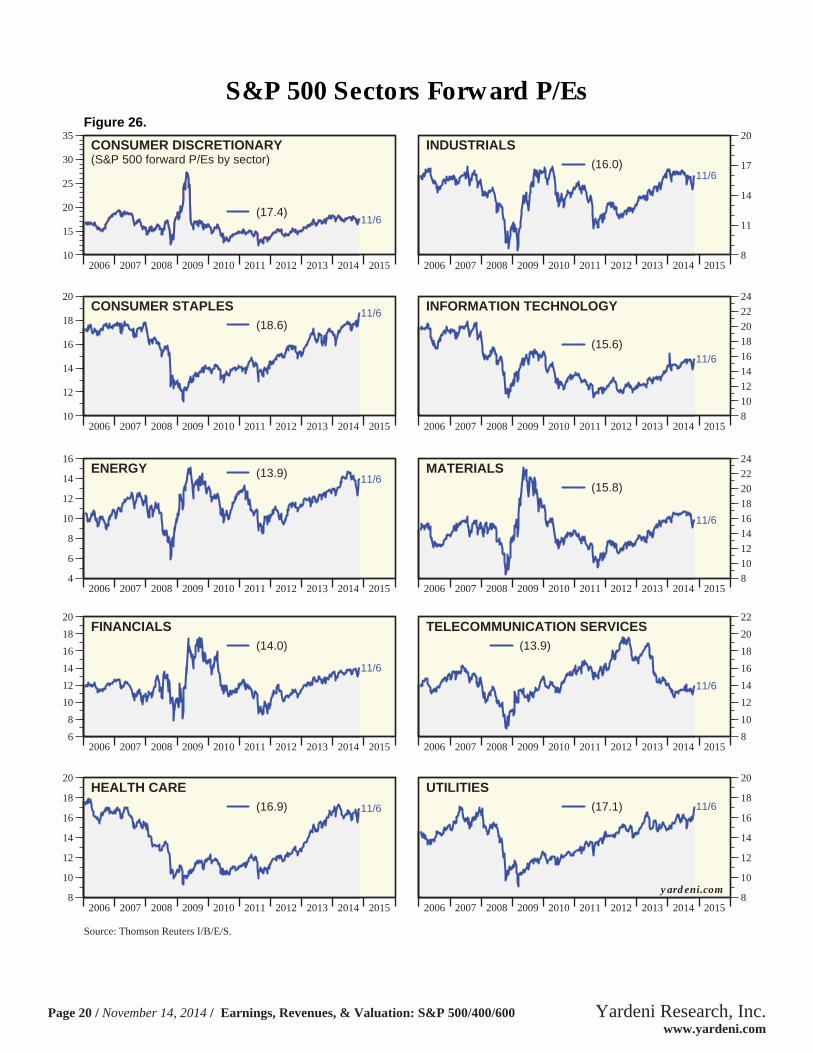
Figure 26.
2006 2007 2008 2009 2010 2011 2012 2013 2014 201510
15
20
25
30
35
11/6
CONSUMER DISCRETIONARY(S&P 500 forward P/Es by sector)
(17.4)
2006 2007 2008 2009 2010 2011 2012 2013 2014 20158
11
14
17
20
11/6
INDUSTRIALS(16.0)
2006 2007 2008 2009 2010 2011 2012 2013 2014 201510
12
14
16
18
20
11/6CONSUMER STAPLES(18.6)
2006 2007 2008 2009 2010 2011 2012 2013 2014 20158
10
12
14
16
18
20
22
24
11/6
INFORMATION TECHNOLOGY
(15.6)
2006 2007 2008 2009 2010 2011 2012 2013 2014 20154
6
8
10
12
14
16
11/6ENERGY (13.9)
2006 2007 2008 2009 2010 2011 2012 2013 2014 20158
10
12
14
16
18
20
22
24
11/6
MATERIALS(15.8)
2006 2007 2008 2009 2010 2011 2012 2013 2014 20156
8
10
12
14
16
18
20
11/6
FINANCIALS(14.0)
2006 2007 2008 2009 2010 2011 2012 2013 2014 20158
10
12
14
16
18
20
22
11/6
TELECOMMUNICATION SERVICES(13.9)
2006 2007 2008 2009 2010 2011 2012 2013 2014 20158
10
12
14
16
18
20
11/6
HEALTH CARE
Source: Thomson Reuters I/B/E/S.
(16.9)
2006 2007 2008 2009 2010 2011 2012 2013 2014 20158
10
12
14
16
18
20
11/6
yardeni.com
UTILITIES(17.1)
S&P 500 Sectors Forward P/Es
Page 20 / November 14, 2014 / Earnings, Revenues, & Valuation: S&P 500/400/600 www.yardeni.com
Yardeni Research, Inc.
http://blog.yardeni.com
http://blog.yardeni.com
Copyright (c) Yardeni Research, Inc. 2014. All rights reserved. The informationcontained herein has been obtained from sources believed to be reliable, but is notnecessarily complete and its accuracy cannot be guaranteed. No representation orwarranty, express or implied, is made as to the fairness, accuracy, completeness, orcorrectness of the information and opinions contained herein. The views and the otherinformation provided are subject to change without notice. All reports posted onwww.yardeni.com, blog.yardeni.com, and YRI’s Apps for iPads and iPhones are issuedwithout regard to the specific investment objectives, financial situation, or particular needsof any specific recipient and are not to be construed as a solicitation or an offer to buy or sellany securities or related financial instruments. Past performance is not necessarily a guideto future results. Company fundamentals and earnings may be mentioned occasionally, butshould not be construed as a recommendation to buy, sell, or hold the company’s stock.Predictions, forecasts, and estimates for any and all markets should not be construed asrecommendations to buy, sell, or hold any security--including mutual funds, futurescontracts, and exchange traded funds, or any similar instruments.
The text, images, and other materials contained or displayed on any Yardeni Research, Inc.product, service, report, email or website are proprietary to Yardeni Research, Inc. andconstitute valuable intellectual property. No material from any part of www.yardeni.com, blog.yardeni.com, and YRI’s Apps for iPads and iPhones may be downloaded, transmitted,broadcast, transferred, assigned, reproduced or in any other way used or otherwisedisseminated in any form to any person or entity, without the explicit written consent ofYardeni Research, Inc. All unauthorized reproduction or other use of material from YardeniResearch, Inc. shall be deemed willful infringement(s) of this copyright and other proprietaryand intellectual property rights, including but not limited to, rights of privacy. YardeniResearch, Inc. expressly reserves all rights in connection with its intellectual property,including without limitation the right to block the transfer of its products and services and/orto track usage thereof, through electronic tracking technology, and all other lawful means,now known or hereafter devised. Yardeni Research, Inc. reserves the right, without furthernotice, to pursue to the fullest extent allowed by the law any and all criminal and civilremedies for the violation of its rights.
The recipient should check any email and any attachments for the presence of viruses.Yardeni Research, Inc. accepts no liability for any damage caused by any virus transmittedby this company’s emails, website, blog and Apps. Additional information available onrequest.