earnings smoothing, corporate social …faculty.bus.olemiss.edu/rvanness/speakers/presentation...2...
TRANSCRIPT
Firms’ Earnings Smoothing, Corporate Social Responsibilities, and Valuation
Lei Gao
Fogelman College of Business and Economics
The University of Memphis
Memphis, TN 38152
Joseph H. Zhang
Fogelman College of Business and Economics
The University of Memphis
Memphis, TN 38152
Preliminary Draft
Comments are welcome.
February 15th
, 2013
2
Firms’ Earnings Smoothing, Corporate Social Responsibilities, and Valuation
ABSTRACT
Income smoothing via accounting discretion could improve or garble actual earnings
information. Although managers prefer a less volatile earnings path and perceive lower risk for
income smoothness, prior studies show that there is no discernible relation between smoothness
and firm valuation. Recent literature documents that socially responsible firms behave differently
from other firms in their earnings management and financial reporting. We conjecture that the
reported earnings of smoothers that are socially responsible deviate less from their permanent
earnings, thus their reported earnings are more value relevant. Our empirical tests show income-
smoothing firms with higher corporate social responsibility (CSR) experience higher
contemporaneous earnings-return relationship, greater Tobin’s Q, and stronger current return-
future earnings relationship. The results show that CSR is proved desirable as it adds a unique
“quality dimension” to the smoothed earning and is useful for firm valuation.
Key Words: Earnings Smoothness, Corporate Social Responsibility, Earning and Return
Relations, Firm Valuation
3
Firms’ Earnings Smoothing, Corporate Social Responsibilities, and Valuation
1. Introduction
Earnings smoothing is at the forefront of executives’ thinking. In the Graham, Harvey and
Rajgopal (2005)’s survey of CFOs, several argue that “…you have to start with the premise that
every company manages earnings” and the survey notes that an “overwhelming 96.9% of the
respondents indicate that they prefer a smooth earnings path”. Even though anecdotal evidence
shows that business enterprises prevalently engage earnings smoothing and managers prefer
smoothed earnings over time, the relationship between smoothed earnings and firm valuation
remains questionable: On the one hand, smoothed earnings by managing reported earnings do
not accurately represent economic earnings at every point of time (e.g., Goel and Thakor 2003;
Jayaraman 2008). On the other hand, smoothing is associated with firm valuation because
mangers’ use of accounting discretion is to reveal more private information about firm’s future
earnings and cash flows (e.g., Chaney and Lewis 1995; Tucker and Zarowin 2006).
Recent studies have found that corporate socially responsible (CSR) firms behave
differently from other firms in financial reporting and provide more value-relevant information.
For instance, CSR disclosure improves analyst forecast accuracy (Dhaliwal, Radhakrishnan,
Tsang, and Yang 2012); Firms that exhibit higher CSR score behave in a responsible manner to
constrain earnings management, thereby delivering more transparent and reliable financial
information to investors (Kim, Park, and Wier 2012); Firms with better CSR score exhibit
cheaper equity financing (Ghoul, Guedhami, Kowk, and Mishra 2011), suggesting that firms
with socially responsible practices have higher valuation and lower risk. Nevertheless, some
argue that engagement in socially responsible activities, if costs exceed the benefits, would
reduce the present value of a firm’s cash flows (e.g., McWilliams and Siegel 2000; Mackey,
Mackey, and Barney 2007; Renneboog, Ter Horst, and Zhang 2008), even though it is difficult to
4
estimate costs and benefits when relying on information that is voluntarily disclosed by firms
(Sprinkle and Maines 2010).
Despite that corporate executives prefer less volatile earnings path,1 income-smoothing
firms are not associated with realized cost of capitals (McInnis 2010) or equity value (Rountree,
Weston, and Allayannis 2008). A potential explanation of inconsistent market performance of
smoothness is partially the reason that earnings smoothing is both informative and opportunistic.
The lack of results in these two recent papers intrigues us to explore whether earnings smoothing
is associated with value relevance when more quality information from different dimensions are
otherwise available. Firms with higher social responsibility are more ethical in their reporting
behaviors with less accounting manipulation, hence, we conjecture that smoothed earnings from
high-CSR firms deviate less than real “undistorted” earnings thus their smoothed earnings are
more value relevant and leads to higher firm valuation.
Our estimates of earnings smoothness use smoothing via total accruals and smoothing via
discretionary accruals. Both measures emphasize that smoothness represents earnings
management when it is measured relative to inherent or fundamental smoothness of the firm’s
operations. Operating cash flow smoothness is used to control for inherent smoothness.2 We use
information on corporate performance from Kinder, Lydenberg and Domini & Co. (hereafter as
KLD), a social choice investment advisory firm), to assess social performance, along dimensions
such as corporate governance, community, diversity, employee relations, environment, and
1 Smoothing could be due to managers’ personal incentives (e.g., their job security and compensations). Moreover,
managers have incentives to smooth earnings to affect market perceptions of earnings volatility, and hence, the
firm’s stock prices (e.g., Levitt 1988; Goel and Thakor 2003).
2 Empirical investigations are hampered by the difficulty associated with separating reported earnings into pre-
smoothed earnings and the accrual component used to moderate reported earnings. While models of
nondiscretionary accruals can be used to estimate earnings before those accruals, concerns have been raised that
estimates of nondiscretionary accruals are associated with considerable measurement errors (e.g., Dechow et al.
1995; Thomas and Zhang 2000). Also, not all discretionary accruals are designed to smooth the reported earnings.
5
product. The KLD data has gained validity to become a widely accepted set of CSR measures, as
it meets Carroll (1979)’s proposed model that delineates a firm’s social obligations, including
economic, legal, ethical, and discretionary responsibilities.3
To test differential effects of earnings smoothing and CSR on firm valuation, we employ
the following major tests: 1) using Tobin’s Q, we examine firm performance for firms with
smoothness attribute and/or higher CSR. 2) We conduct the long-window value relevance test of
earning smoothness from CSR firms, i.e., smoothness and CSR are two moderators in the
earnings-return relationship tests. 3) We conduct the short-window earning response coefficients
(ERC) test for market perception around earnings announcement. 4) We also employ the future
earnings response coefficients-based regression method, the FERC model initiated by Collins et
al. (1994) and used by Tucker and Zarowin (2006). Complementarily, we disaggregate CSR
score to test different components of CSR for their individual effects on firm valuation when
interacting with earnings smoothing.
Using a sample of 2,022 firms and 10,755 firm-year observations over the period 1993-
2010, we find a negative correlation between CSR score and earnings smoothness, suggesting
that CSR firms appear to reduce or avoid earnings manipulation through discretionary
smoothing. In addition, we find a positive correlation between CSR score and Tobin’s Q,
implying that CSR firms appear to be higher firm performance as compared to non-CSR firms.
Empirical results further indicate that CSR score significantly increase the value relevance of
current earnings when investigated separately, and that smoothing alone moderately increases the
value relevance of current earnings. In joint tests with smoothing, CSR score, and their
interaction in the model, we find that smoothing is positive and significant when interacted with
3 The KLD database takes a comprehensive approach that examines six dimensions related to social performance,
namely, community, diversity, employee relations, the environment, human rights, and product characteristics, as
well as controversial business issues.
6
CSR (i.e., when smoothers are socially responsible). The regression results hold for both long-
window and short-window earnings-return relation tests.
Our FERC tests show that the stock returns of income-smoothing firms with higher CSR
have higher future earnings response coefficients than smoothers with lower CSR, namely
higher-CSR smoothness reflects more information about future earnings than lower-CSR
smoothness. The results reveal that the joint attributes of smoothing and CSR represent a
forward-looking indicator of the degree and stability of future profit streams and help investors
to better evaluate future earnings news. Moreover, our tests show that smoothing alone does not
result in higher market valuation, but income-smoothing firms with higher CSR score are
strongly related to higher firm value (proxy by Tobin’s Q). We interpret the results as evidence
that high-CSR smoothness is more value-relevant and rewarded by the market with a premium in
stock prices. Overall, our results are consistent with ethical concerns disciplining financial
reporting and driving higher firm valuation.
This paper contributes to earnings management literature that shows mixed results about
whether smoothing is informational or opportunistic. Smoothing could be driven by managerial
discretion, rather than by economic fundamentals. The perception of smoothing by outside
investors depends on other information quality. We join the debate about whether the earnings
discretion available to managers raises or lowers the informativeness of earnings. It is a common
notion that the discretion present in financial reporting successfully masks, at least for the short
term, the underlying real firm performance. There may exist “value relevance ambiguity” if
earnings are managed. Our study is the first to examine the association between earnings
smoothing and its informativeness that can be interpreted by ethical reporting behaviors.
7
We also contribute the research of social responsibilities of corporate reporting. With the
proliferation of CSR disclosures, many investors now use an investment strategy that explicitly
considers CSR performance criteria in addition to traditional financial measures. Our results shed
lights on the effects of CSR on the quality and valuation implication of earnings management.
CSR is proved desirable as it adds a unique “quality dimension” to the smoothed earnings. In
general, better CSR promotes firm-specific smoothness information. We find that smoothing is
more informative with higher CSR score as more business ethics upholds the representational
faithfulness of the reported earnings. Hence, CSR is decision useful by potentially strengthening
the confidence of market participants, as investors appear to recognize this and accordingly react
more positively to the smoothed earnings when the firm is more socially responsible. Our
findings can be useful to investors in differentiating accurate and transparent financial
information from less reliable information. Finally, evidence from this study can help regulators
and investors better understand firms’ business practices and reporting behaviors in light of
CSR.4
In the next section, we discuss the related literature and develop our hypotheses. Section
3 describes the sample and variable measurements. Section 4 presents the main empirical results.
Section 5 studies some robustness checks. In Section 6 we conclude.
2. Literature Review and Testable Hypotheses
2.1. Earnings Smoothing
4 A prior work is done by Brown, Helland and Smith (2006) who document that for firms operating in industries
with stringent regulations, an improved reputation regarding various CSR issues can induce more positive media
coverage and more favorable treatment by regulators and policy makers. The practical implication of our results is to
directly provide analysts and investors with a tool for identifying firms with different degrees of value-relevant
earnings.
8
Income smoothing activities are pervasive and literature has documented evidence that
firms actively engage in income smoothing (e.g., Beidleman 1973; Healy 1985; DeFond and
Park 1997; Tucker and Zarowin 2006, among many others). Smoothing is managers’ utilization
of accounting discretion to moderate income stream variability.5 Prior literature has documented
evidence that managers prefer less volatile earnings (e.g., Ronen and Sadan 1981; DeFond and
Park 1997; Graham et al. 2005). However, smoothness does not indicate good earnings quality.
Smoothing can either improve or impair firm’s actual earnings information.
Disagreement exists in the literature as to whether smoothness is a desirable property of
accounting earnings for valuation effects. Beidleman (1973) asserts that smoothing is useful for
internal budgeting and in reducing perceived riskiness among outsiders. Barnea et al. (1975)
argue that smoother earnings allow outsiders to better predict future earnings. Ayra et al. (1998)
and Sankar and Subramanyam (2001) view that income smoothing provides future related
information about future profitability. Kirschenheiter and Melumad (2001) develop a model in
which smoothing earnings is part of an equilibrium reporting strategy designed to increase the
inferred precision of reported earnings. Similarly, the model by Chaney and Lewis (1995)
predicts that the informativeness of earnings increases for firms with smooth income. They argue
that smoothness can aid investors in assessing future prospects of firms by enhancing the
5 Smoothing is the reduction of variability in reported earnings that would otherwise exist in the absence of some
actions. Direct actions that smooth earnings commonly take the form of real strategic business decisions and cost
management (Cohen et al. 2008; Roychowdhury 2006). Albrecht and Richardson (1990) describe two types of
income smoothing, natural smoothing and intentional smoothing. The former is no manipulation by the managers.
The type of intentional income smoothing, depends on managerial intent. Managers’ application of available
accounting discretion through the use of estimates, assumptions and alternative choices, is an effective way to
smooth earnings. DeFond and Park (1997) find evidence that when a firm’s current performance is poor (good)
relative to expected future performance, managers tend to smooth income by increasing (decreasing) accruals, i.e.,
“borrow” future earnings for current period (“save” current earnings for future period). This type of income
smoothing was notably referred to as the use of “cookie jar” reserves by the former SEC Chair Arthur Levitt (1998).
Similar to DeFond and Park, Balsam et al. (1995) suggest that firms use discretion to time the adoption of income
increasing accounting methods when the firm’s change in ROA is lowest. Keating and Zimmerman (1999) also
suggest that poorly performing firms use the discretion allowed in accounting standard adoption to their advantage.
9
usefulness of the information conveyed for predictive purposes. Tucker and Zarowin (2006)
focus on the effect of income smoothing on earnings persistence and on the informativeness of
future earnings. They find that income smoothing improves the efficiency of current stock prices
in terms of incorporating future earnings information.
Other researches, however, cast earnings smoothing in a less favorable light. Trueman and
Titman (1988) assert that by smoothing to influence stakeholders, smoothing reduces the
information content of earnings announcements. Leuz et al. (2003) view that firm insiders
protect their private control benefits by smoothing earnings to conceal firm performance.
Bhattacharya et al. (2003) and Jayaraman (2008) contend that discretionary smoothing distorts
the contemporaneous information content of earnings and cash flows, and leads to greater
earnings opacity. Myers et al. (2007) offer evidence that firms use income smoothing as an
earnings management tool to maintain artificially long strings of increasing earnings per share. In
addition, LaFond et al. (2007) find that income smoothing adversely affects the transparency of
accounting data, thus investors’ willingness to trade is abated. In general, these studies consider
that smoothness is artificial and represents opportunistic reporting. The above assertions appear
to be based on an assumption that managers’ unobservable smoothing actions introduce noise
into the income series, lowering its informativeness.
More related to our paper are two recent studies of the relationship between earnings
smoothness and firm valuation: The first paper by Rountree et al. (2008) presents empirical
evidence that cash-flow volatility is negatively valued by investors. The magnitude of the effect
is substantial with a 1% increase in cash-flow volatility, resulting in approximately a 0.15%
decrease in firm value. They show that this increase, however, is not associated with earnings
smoothing resulting from managers’ accrual estimates. Their results are consistent with a
10
preference by the market for less volatile cash flows and suggest that managers’ efforts to
produce smooth financial statements add value, but only via the cash component of earnings. The
second one by McInnis (2010) finds that earnings smoothness, in isolation or combined with
other risk proxies, has no ability to explain average return, either at firm or the portfolio level. He
interprets that analysts estimate the implied cost of capital (ICC) systematically too low (high)
for firms with smooth (volatile) earnings. The lack of the relation between smoothing and stock
returns means that firms fail to signal to the market, or the market reacts to the smoothed
earnings as both informative and opportunistic. McInnis points out that the negative relationship
between smoothness and ICC documented in Francis et al. (2004)6 is driven by the bias in
analysts’ long-term earnings forecasts. This bias, however, could be attenuated by the
availability of other sources of earnings information about smoothers.7
2.2. Corporate Social Responsibility
The perceived importance of corporate environmental, social, and governance programs
has soared in recent years, as executives, investors, and regulators have grown increasingly
aware that such programs can mitigate corporate crises and build reputations. Firms are
increasingly and voluntarily engaging in actions that appear to further some social good,
including environmental protection, community support, fair labor practices, etc. – all of which
fall under the Corporate Social Responsibility (CSR) label (Stanford 2011). Though the
6 Based on the Value-Line estimates of implied cost of capital (ICC), Francis et al. (2004) show that smoothing
tends to reduce the ICC and thus smoothness is a desirable quality attribute. Prior studies examining the relation
between returns and earnings attributes show that better earnings quality enjoys lower cost of capital, and market
prices discretionary accruals (e.g., Subramanyam 1996).
7 McInnis’ findings are important because they call into question the wisdom of smoothing earnings to achieve a
lower risk premium, particularly if such actions sacrifice economic value.
11
definition of CSR is not uncontested,8 the definition offered by Carroll (1979) is most widely
accepted: “The social responsibility of business encompasses the economic, legal, ethical, and
discretionary expectations that society has of organizations at a given point in time”. Carroll’s
delineation of a firm’s social responsibilities suggests that CSR firms should strive to make a
profit, obey the law, be ethical, and, further, be a good corporate citizen by financially supporting
worthy social causes.9
For a long time it has been presumed that CSR strategies were unlikely to reduce a
company’s vulnerability to firm risk (McGuire, Sundgren, and Schneeweis 1988)10
. Market risk
is generally of a macro-economic nature, and includes, for example, economic growth rate
shocks, interest rate shocks, oil price shocks and inflation shocks. McGuire et al. (1988) suggest
that the impact of social responsibility on measures of a firm’s systematic risk may be minimal
“since most events affecting a firm’s level of social responsibility do not systematically affect all
other firms in the marketplace”, a position consistent with that of Cornell and Shapiro (1987).
Barnett (2007) argues that it takes time for firms to acquire the capacity to influence stakeholders
and therefore there might be a lag between investment in CSR strategies and a financial return.
Barnett and Salomon (2012) provide some evidence to support Barnett’s (2007) theory that the
8 Nevertheless, no consensus has emerged to define whether and how such programs create shareholder value, how
to measure that value, or how to benchmark financial performance from company to company (McKinsey Quarterly,
February 2009).
9 Alternatively, focusing on four main aspects of social reality, economics, politics, social integration, and ethics,
Garriga and Mele (2004) classify CSR theories into four groups: (1) ethical theories, (2) political theories, (3)
integrative theories, and (4) instrumental theories. 10
Enquiry as to whether socially responsible actions by companies are financially rewarded has ensued since
Friedman in his 1970 New York Times article re-ignited a debate that had simmered since the 1930s. Narver (1971)
asserts the actual necessity of companies taking voluntary action to address ‘external effects’ if they are to be wealth
maximizing. He elucidates that to ignore the changing expectations of a broad base of stakeholders can induce the
capital market to perceive lower expected earnings and/or impute a higher risk factor resulting in a lower present
value of the firm.
12
relationship between corporate social performance and corporate financial performance may be
U-shaped.
Thanks to the proliferation of CSR disclosures, many investors now use an investment
strategy that explicitly considers CSR performance criteria in addition to traditional financial
measures. A recent report from the Social Investment Forum (2009) estimates that 12.2 percent
of the $25.2 trillion in total assets under management in the U.S. during 2009 was involved in
some strategy of socially responsible investing. Academic research has shown such supporting
evidence as well, for instance, Edmans (2011) documents that employee satisfaction is positively
correlated with shareholder returns. Using data on stock returns, he finds that a portfolio of the
“100 Best Companies to Work for in America” generates an out-performance of between 2.1%
and 3.5% per annum. Similarly, Banker and Mashruwala (2007) find that greater employee
satisfaction is likely to translate into better future financial performance and firm growth. Ghoul
et al. (2011) show that investment in improving responsible employee relations, environmental
policies, and product strategies contributes substantially to reducing firms’ cost of equity, and
Dhaliwal et al. (2012) find that the CSR disclosures increase earnings informativeness to
financial analysts.
2.3. Earnings Smoothing, Corporate Social Responsibility, and Firm Valuation
The properties of earnings category include smoothness, accruals, and investor
responsiveness (Dechow et al. 2010). The market responsiveness to earnings category includes
test of earnings response coefficient (ERC) as a measure of earnings informativeness or earnings
quality. Smoothers’ earnings should be more value-relevant if they are of higher quality. In fact,
Bao and Bao (2004) argue that lower variability of earnings does not guarantee income
smoothers’ higher firm values. Instead, smoothers’ earnings should be more value-relevant if
13
they are of high quality, i.e., earnings quality should be considered simultaneously. They find
that quality earnings smoothers have the highest price-earnings multiple while non-quality non-
smoothers have the lowest price-earnings multiple.
Not long ago accounting researchers have studied whether CSR could contain firms’
misreporting behaviors. A notable work by Kim et al. (2012) reveals that socially responsible
firms are less likely 1) to manage earnings through discretionary accruals, 2) to manipulate real
operating activities, and 3) to be the subject of SEC investigations, as evidenced by Accounting
and Auditing Enforcement Releases against top executives. However, Chih et al. (2008) examine
CSR and earnings management and provide inconsistent results across different earnings
management proxies. They show that CSR firms are more aggressive in accruals management
but are less likely to engage in earnings smoothing and earnings loss avoidance.11
The negative association that Kim et al. (2012) document between CSR activities and
earnings management is consistent with ethical managers engaging in both more CSR activities
and less earnings management. It supports our presumption that CSR disclosure has become a
relatively important source of reassessing individual firm’s earnings information. Using CSR
disclosures, investors can reassess the representational faithfulness of financial information
provided by management. CSR score is useful to aid investor in distinguishing natural vs.
opportunistic smoothing. Smoothed earnings reported by social responsible firms thus help
strengthen investor confidence.
Effects of CSR disclosure on the information richness of income-smoothing firms have
not been probed before. Hence, it is empirically unclear that how CSR affects the
informativeness of smoothed earnings. High-quality earnings should be very informative about
11
Kim et al. (2012) argue that the results in Chih et al. (2008) could be driven by these country differences rather
than differences in CSR activities.
14
current performance, and indicate predictable information about the future. Informativeness
requires that income smoothing not impair investors’ information about a firm’s future cash
flows (Francis et al. 2004).12
The purpose of our study is to examine whether higher-CSR
smoothness raises the informativeness of earnings, as reflected in the earnings multiplier, while
the higher multiplier is consistent with increased earnings informativeness (Ali and Zarowin
1992; Chaney and Lewis 1995).13
Using one-year test window, and short-window ERC test
around earnings announcements, we estimate the earnings-return relationship by regressing
cumulative abnormal returns on unexpected earnings (wherein smoothness and CSR are two
moderators in earnings value-relevance tests). Our first hypothesis is presented as:
H1: Earnings-smoothing firms with higher CSR score are more strongly associated with
the earnings-return relationship (than non-smoother with lower CSR score).
Earnings volatility has been linked to the valuation of firms (e.g., Beidleman 1973;
Gebhardt et al. 2001). Similarly, income smoothing indeed has been studied in the context of
firm valuation as suggested by Dechow and Skinner (2000). Results, however, are mixed.
Rountree et al. (2008) argue that smoothness is valued by the market only to the extent that it is
supported by low cash flow volatility. While Hunt et al. (2000) prove that accrual accounting
practices could lead to lower earnings volatility and smoothing via accruals management is
associated with higher market value of equity. Tucker and Zarowin (2006) provide evidence that
smoothing by discretionary accruals increases the informativeness of current prices in terms of
12
Francis et al. (2004) echoes the FASB Statement No. 1 that describes that the financial reports should help in
assessing the timing, magnitude, and uncertainty of future cash flows. For example, when managers use their private
information about future income to smooth out transitory earnings fluctuation, they might make reporting choices
opportunistically in order to avoid the fluctuation. If those reporting choices fail to convey information about the
future cash flows, then the result will not be a reduction in information risk.
13 The design reflects a joint test of the informativeness hypothesis and two maintained assumptions: First, the
model to partition total accruals into discretionary accruals and non-discretionary accruals is well specified. Second,
the market is efficient. There will be a market response if the current earnings deviates from the market’s (or
analysts’) earnings expectations.
15
incorporating future earnings information. Bao and Bao (2004) find results that smoothers of
higher earnings quality have the highest price-earnings multiples while non-quality non-
smoothers have the lowest price-earnings multiples. Their results provide a practical implication
that market participants should consider both smoothing behavior and other earnings quality
together for firm valuation.
Information risk reflects “value ambiguity, or the degree to which a firm’s value can be
reasonably estimated by even the most knowledgeable investors…” (Jiang et al. 2005). If higher-
CSR smoothness is more informative, it should unequivocally improve value relevance of
income-smoothing firms. A firm’s CSR activities are associated with a reduction of the firms’
cost of equity (Ghoul et al. 2011), and positively related to financial performance (Dhaliwal et al.
2012).14
Hence, CSR is linked with improved information set surrounding and lowers
idiosyncratic risk of smoothers. In the same vein, increased transparency due to management
ethics is demanded by market participants, and likewise they are attracted to firms with less
opaque reporting. In addition, lower cost of capital also leads to higher firm value. As summed
up, the availability to investors of a more responsible and reliable set of information about a
firm’s prospects would provide a richer context in the valuation of smooth earnings. Thus, there
is likely a positive relation between CSR score and market value of smoothers.
We investigate the association between earnings smoothing and firm value related to
ethical reporting. It is a natural extension of the test of earning-return relationship in the first
hypothesis. Presumably ethical activities and smoothness are jointly determined to lead to real
firm performance, and then our second hypothesis test is:
14
Nevertheless, it is possible that ethical managers could still be engaging in CSR activities at the expense of
shareholders. Moser and Martin (2012) argue that findings in Dhaliwal et al. (2012) do not preclude the possibility
that some CSR activities are not profit-maximizing.
16
H2: Higher firm value is strongly related to the interaction of both higher degrees of
earnings smoothing and corporate social responsibilities.
We use Tobin’s Q as a proxy for firm value to test the valuation benefit associated with
earnings smoothing, if the information set of smoothed earnings is reliable to the investor
community. As a summary, the tests of the informativeness of higher-CSR smoothness are
implemented with two different but closely related perspectives, namely the earnings-return
relationship and market valuation tests.
3. Variables and Sample
3.1. Smoothness Measures
Smoothing is treated as a period-specific accounting choice. We construct two income
smoothing measure, total accrual smoothing (TAS) and discretionary accrual smoothing (DAS).
TAS is the volatility of income with respect to the volatility of cash flows, calculated at the
annual level over rolling six-year windows ending in the current fiscal year. The more income
smoothing, the more the variability of cash flows with respect to the variability of income, hence
the higher ratio would signify a smoother income stream. This measure has been used in Francis
et al. (2004) and McInnis (2010). The difference is that they calculate operating cash flows from
operating income less total accruals, and their total accruals are obtained from the balance sheet
variables. We use operating cash flows directly from the cash flow statements since the data are
available for our sample period in this study.15
We also use the reciprocal value to ease the
interpretation of results.
( )
( ) (1)
15
Total accrual is measured using the cash flow method per Hribar and Collins (2002): Income before extraordinary
items (ib) less cash flows from operations less cash flows from extraordinary items (oancf-xidoc).
17
where NI is net income before extraordinary items, CFO is cash flows from operations less cash
flows from extraordinary items, both are scaled by lagged total assets.
DAS is the negative correlation between the change in discretionary accruals and the
change in pre-discretionary income based on Jones (1991) accrual model, adjusted by a firm’s
performance (Kothari et al. 2005).
(
) (2)
where the total accruals (TAcc), change in sales (ΔSales), and net property, plant and equipment
(PPE) are all scaled by the beginning-of-year total assets. Return on assets (ROA) is the
performance matching control variable. The equation (2) is estimated cross-sectional each year
within the same industry group (by two-digit SIC) to obtain the fitted value of accruals and the
estimation errors. The fitted value is the non-discretionary accruals, and the difference between
the observed value and the fitted value, i.e., the residualt̂ , is the discretionary accruals
predicted (DAP). Pre-discretionary income (PDI) is defined as net income minus discretionary
accruals. DAS is the negative correlation of a firms’ change in discretionary accruals and its
change in pre-discretionary income, with six-year rolling window.
( ) (3)
The DAS measure above is similarly used by Leuz et al. (2003), Tucker and Zarowin
(2006) and Myers et al. (2007). The underlying intuition is that the variability of cash flows is
smoothed through the usage of accruals. Therefore, a more negative correlation would signify a
smoother income stream in relationship to the underlying fundamental. The two measures of
smoothness differ in that TAS measure captures income smoothing effect through total accruals,
whereas DAS measure captures income smoothing effect through discretionary accruals.
3.2. Firm Social Activities Metrics
18
Our social responsibility measures are based on data from Kinder, Lydenburg, and
Domini (2006; KLD thereafter), which has been widely used to measure CSR activities. We
consider six social performance related dimensions: corporate governance, community, diversity,
employee relations, environment and product. We exclude the areas of human rights and
firearms because the two areas are not available before 2002.16
Researchers assess these
dimensions in order to determine if a company is socially responsible. KLD compiles
information on CSR beginning in 1991 and since 1993 the data has become steadily increasing.
Besides, we control “reputation” in our multivariate analysis, following Kim et al. (2012).
We obtain the list of firms included in Fortune’s America’s Most Admired Companies from
Fortune Magazine issues from the same 1993 through 2011, since KLD’s evaluation of CSR
performance can also be potentially influenced by a firm’s reputation. We also include firm
governance metrics, as corporate governance is a distinct construct from CSR, and it can affect
firms’ financial reporting behaviors and earnings informativeness.
3.3. Sample Descriptions
We collect the financial statement data from Compustat database, the stock returns/prices
from CRSP, and consensus earnings forecasts from I/B/E/S. We select sample by searching
through the CRSP files for ordinary single class common stocks, and require the sample firms to
be public with a share code of 10 or 11 and to be a single class stock.17
To remain in the sample,
we further require a firm-month to have non-missing return data on CRSP and non-missing
values for the Compustat accounting variables. We require that at least 20 firms within each
industry-year (2-digit SIC code) for obtaining the earnings smoothing (both TAS and DAS). We
16
KLD data exclude screen categories including alcohol, gambling, military contracting, nuclear power, and
tobacco. They use a combination of surveys, financial statements, and articles in the popular press and academic
journals, as well as government reports, to assess strengths and concerns in social performance dimensions.
17 We also exclude the holding firms, the ADRs, and the limited partnerships.
19
then match KLD data with the Compustat database, and we exclude observations of financial
institutions (SIC codes 6000-6999) because characteristics of accruals differ in these firms. Our
final sample covers the period of 1993 to 2010, 2,022 individual firms for a total of 10,755 firm-
year observations.
Table 1 provides the descriptive statistics of the main variables we use in analysis. Table
1 provides the descriptive statistics of the main variables we use in the analysis. The mean
(median) Tobin’s Q is 2.038 (1.616). We include two different measures of smoothing, DAS and
TAS, the mean (median) DAS is 0.704 (0.882), and the mean (median) TAS is 1.686 (1.248),
matching with McInnis (2010) for TAS and Tucker and Zarowin (2006) for DAS. The mean
(median) value of aggregate CSR score is 0.059 (0.000). We now examine our five
subcategories for CSR component score: the mean of community relation rating (ComScore) is
0.095; mean of diversity ratings (DivScore) is 0.347; mean of employee relations ratings
(EmpScore) is -0.083. The results indicate that there is still much room for firms to improve firm
value through improving employee relations (see Edmans 2011). Our sample mean of
environment ratings (EnvScore) is -0.139 and mean of product ratings (ProScore) is -0.162.
These score indicate that half of firms below median have much more their environment and
product concerns than strengths. They may need to improve their environment ratings and
product ratings to become more social responsible corporate citizens.
3.4. Correlation Results
Table 2 reports the pairwise correlations between Tobin’s Q, smoothing measures (DAS
and TAS), CSR score and other control variables. Four results are noteworthy. First, the two
proxies for earnings smoothing are 69.7% (Pearson) or 43.4% (Spearman) positively correlated
at 1% level, indicating that firms that engage in discretionary smoothing also have higher TAS,
20
and a further is needed to check the differential effects between the two measures. Second, the
Tobin’s Q is positively correlated with CSR score at 1% level. Thus, the correlation results
provide preliminary evidence that firms’ social activities are generally value-enhancing. Third,
Tobin’s Q and DAS are weakly correlated (also, Tobin’s Q and TAS are negatively associated),
which directly shows that smoothness does not relate to firm performance and also implies that
investors may need better quality information to value firm in addition to smoothness. Fourth,
CSR score is negatively related to smoothness, indicating CSR firms are less likely to smooth out
earnings.
3.5. Sorting Results
To test whether CSR and smoothing (DAS or TAS) could impact firm value, we calculate
Tobin’s Q mean values within quintiles for both CSR score ranking and smoothing ranking. We
first sort and partition all firms on the basis of CSR ranking. We then calculate Tobin’s Q mean
separately for each smoothing ranking quintile for all CSR ranking based quintiles mentioned
above. Table 3 reports Tobin’s Q for CSR / smoothing sorting. Within each DAS quintile in
Panel A, Tobin’s Q shows an increasing pattern when CSR score increases from the lowest
quintile to the highest quintile. For example, in the third quintile of DAS, Tobin’s Q increases
from 1.629 for lowest CSR ranking quintile to 2.349 for highest CSR ranking quintile, with t-
value of 10.29. A similar pattern is observed when we use TAS to replace DAS (as shown in
Panel B). In the third TAS ranking based quintile, Tobin’s Q increases from 1.755 for lowest
CSR ranking quintile to 2.392 for highest CSR ranking quintile. The difference is both
economically and statistically significant. The Tobin’s Q difference between the highest CSR
quintile and lowest CSR quintile is 0.637 (0.637/1.755 = 36.3%), and the t-value is 8.64. This
21
indicates that there is a strong association between CSR score and firm value, which is in line
with existing literature (e.g., Dhaliwal et al. 2012).
When we look at Table 3 the other way, within each quintile of CSR ranking in Panel A,
Tobin’s Q does not show clearly increasing or decreasing pattern across DAS based-rankings.
However, from Panel B, within each CSR ranking based quintile, Tobin’s Q seems to show a
decreasing pattern with the increasing of TAS. This is supportive to Table 2 correlation results.
Considering Panel A and B together, we conclude that financial markets value total accrual
smoothing more than discretionary accrual smoothing, implying that it is necessary for market
participants to get additional information set to integrate smoothing information into their
valuation process.
4. Empirical Results
4.1. Earning-Return Relation Tests
Table 4 Panel A reports the results from a panel data regression testing the earnings-
return relation. Models 1 to 2 are reduced models (excluding interaction variables) and Model 3
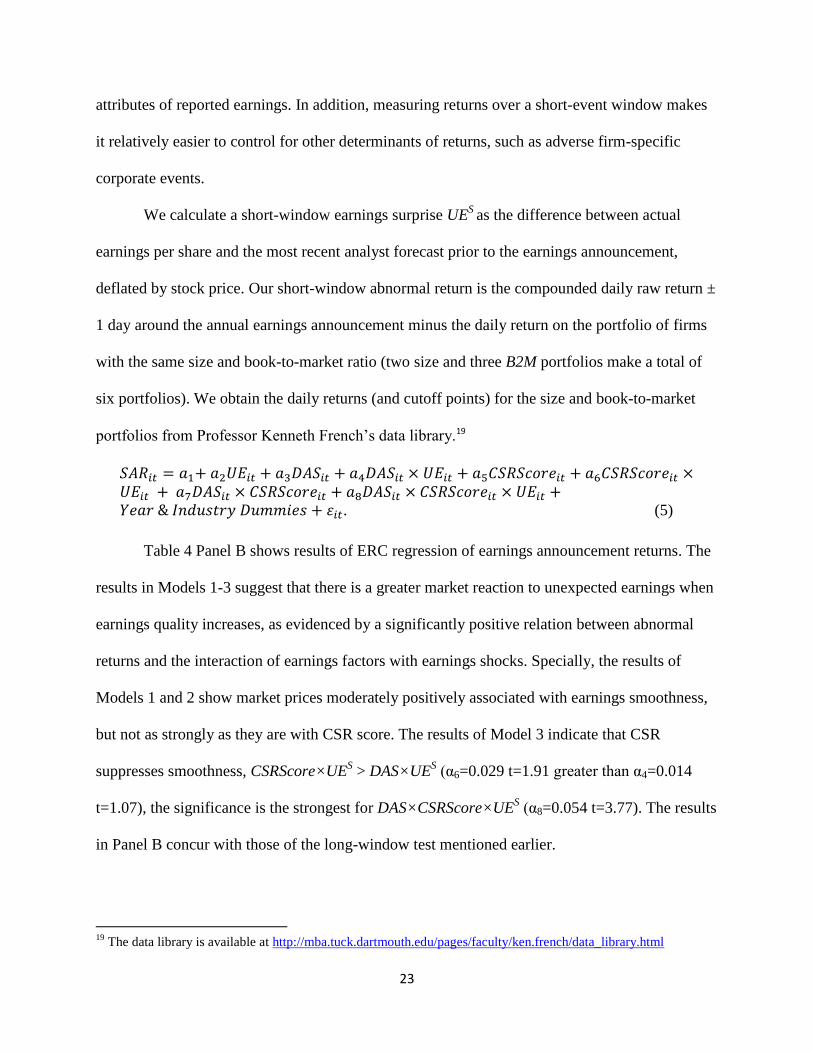
is the full (three-way) model in equation (4):18
. (4)
In Model 1, we regress size-adjusted cumulative abnormal return (SAR) on unexpected earnings
(UE) and the interaction of DAS and UE. The interaction α4, DAS×UE, has a moderate
coefficient of 0.037 (t=1.62, p-value>10%), indicating that smoothing does not significantly
strengthen the contemporaneous earnings-return relation (CERR), consistent with McInnis
18
Our sample is an unbalanced panel. Our specifications include fixed effects in the form of time dummies and
industry dummies based on the two-digit SIC codes. For brevity, estimates of the dummy variables’ coefficients are
not reported.
22
(2010) who documents a weak relation between smoothness and average stock returns, and with
Rountree et al. (2008) who document no price effect for earnings smoothness. Model 2 adds an
interaction of the CSRScore and UE (α6= 0.087, t=2.10, p-value<5%), and shows evidence that
CSR alone improves CERR significantly. Model 3, a fully interacted model, provides evidence
that smoothing alone does not increase the earnings-return relation (t-value of α4 is 1.16), but
CSR strongly increases the earnings-relation relation (t-value of α6 is 2.02). More interestingly,
the joint interaction of smoothing and CSR increases the CERR significantly, with a positive and
strongly significant coefficient, α8 = 0.102 (t=4.38, p-value<1%) on the joint interaction.
In summary, the results of Table 4 Panel A show that, on average, CSR score increases
the contemporaneous earnings-return relation but smoothing alone does not. In addition, the
combination of smoothing and CSR strongly improves the contemporaneous earnings-return
relation, as predicted in our hypothesis. For a sensitivity tests, we find that results hold when
DAS is substituted by TAS. We also eliminate outliers with the absolute value of studentized
residuals greater than two (involving less than 2% of the observations), and re-run our tests. The
results are qualitatively close. As an alternative specification, we also perform the tests by
regressing abnormal returns on unexpected earnings using the change relative to the previous
year (assuming that annual earnings follow a random walk time series process). The results and
conclusions from this specification are not different in any material way from using analyst
forecasts to approximate unexpected earnings.
Although our study mainly focuses on the long-window earnings-return relation, it is
important to have a “sharp” test to explore whether investors react more strongly to smoothed
earnings and/or to high-CSR earnings around earnings announcements. This is because returns
around earnings announcements directly capture whether and how investors price certain
23
attributes of reported earnings. In addition, measuring returns over a short-event window makes
it relatively easier to control for other determinants of returns, such as adverse firm-specific
corporate events.
We calculate a short-window earnings surprise UES
as the difference between actual
earnings per share and the most recent analyst forecast prior to the earnings announcement,
deflated by stock price. Our short-window abnormal return is the compounded daily raw return ±
1 day around the annual earnings announcement minus the daily return on the portfolio of firms
with the same size and book-to-market ratio (two size and three B2M portfolios make a total of
six portfolios). We obtain the daily returns (and cutoff points) for the size and book-to-market
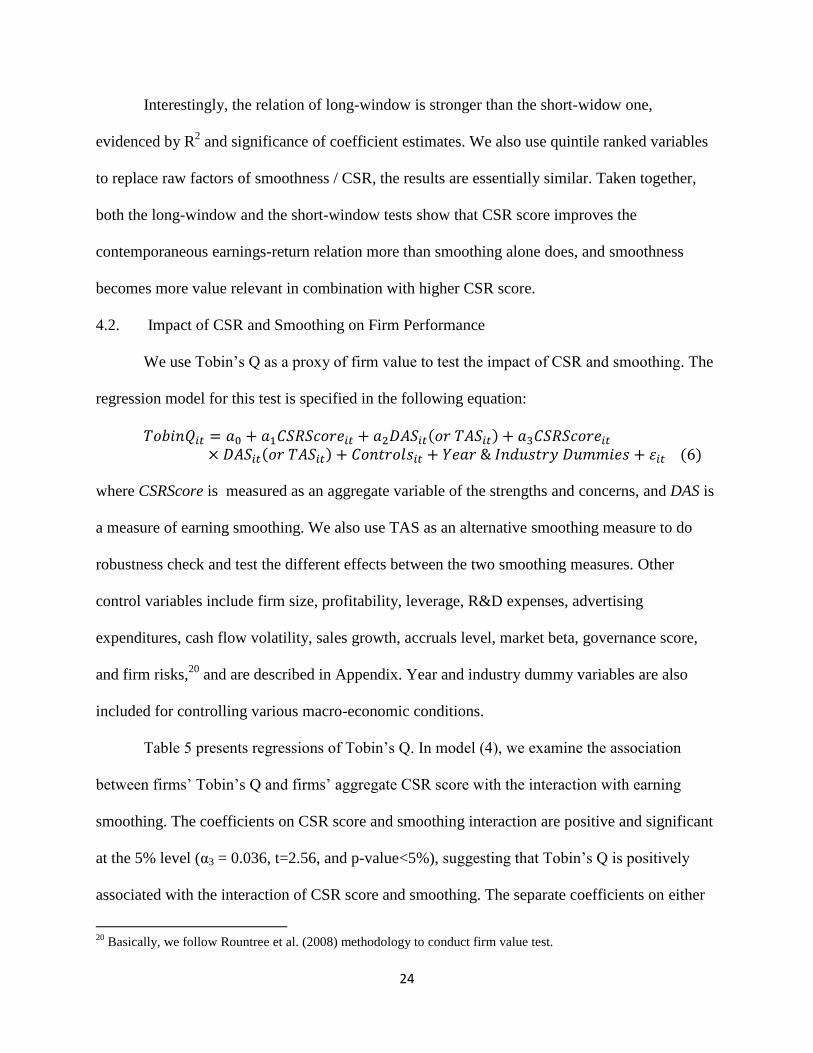
portfolios from Professor Kenneth French’s data library.19
. (5)
Table 4 Panel B shows results of ERC regression of earnings announcement returns. The
results in Models 1-3 suggest that there is a greater market reaction to unexpected earnings when
earnings quality increases, as evidenced by a significantly positive relation between abnormal
returns and the interaction of earnings factors with earnings shocks. Specially, the results of
Models 1 and 2 show market prices moderately positively associated with earnings smoothness,
but not as strongly as they are with CSR score. The results of Model 3 indicate that CSR
suppresses smoothness, CSRScore×UES > DAS×UE
S (α6=0.029 t=1.91 greater than α4=0.014
t=1.07), the significance is the strongest for DAS×CSRScore×UES (α8=0.054 t=3.77). The results
in Panel B concur with those of the long-window test mentioned earlier.
19
The data library is available at http://mba.tuck.dartmouth.edu/pages/faculty/ken.french/data_library.html
24
Interestingly, the relation of long-window is stronger than the short-widow one,
evidenced by R2 and significance of coefficient estimates. We also use quintile ranked variables
to replace raw factors of smoothness / CSR, the results are essentially similar. Taken together,
both the long-window and the short-window tests show that CSR score improves the
contemporaneous earnings-return relation more than smoothing alone does, and smoothness
becomes more value relevant in combination with higher CSR score.
4.2. Impact of CSR and Smoothing on Firm Performance
We use Tobin’s Q as a proxy of firm value to test the impact of CSR and smoothing. The
regression model for this test is specified in the following equation:
( ) ( ) ( )
where CSRScore is measured as an aggregate variable of the strengths and concerns, and DAS is
a measure of earning smoothing. We also use TAS as an alternative smoothing measure to do
robustness check and test the different effects between the two smoothing measures. Other
control variables include firm size, profitability, leverage, R&D expenses, advertising
expenditures, cash flow volatility, sales growth, accruals level, market beta, governance score,
and firm risks,20
and are described in Appendix. Year and industry dummy variables are also
included for controlling various macro-economic conditions.
Table 5 presents regressions of Tobin’s Q. In model (4), we examine the association
between firms’ Tobin’s Q and firms’ aggregate CSR score with the interaction with earning
smoothing. The coefficients on CSR score and smoothing interaction are positive and significant
at the 5% level (α3 = 0.036, t=2.56, and p-value<5%), suggesting that Tobin’s Q is positively
associated with the interaction of CSR score and smoothing. The separate coefficients on either
20
Basically, we follow Rountree et al. (2008) methodology to conduct firm value test.
25
CSR score or smoothing are not significant, indicating that firm performance may not be
associated with either CSR or smoothing alone, which is consistent with existing work (e.g.,
Barnett 2007; Rountree et al. 2008).21
The results are consistent when we use both raw CSR
score (columns 1 and 3) and CSR dummy variable (columns 2 and 4), and when we use DAS
(column 1 and 2) and TAS (columns 3 and 4) as our proxies for smoothing. The same pattern is
observed across the four model specifications.
The joint role of CSR score and smoothness is economically meaningful. Specifically, in
column (2), for firms with higher CSR score, when their smoothness increases by 1%, firm
performance as measured by Tobin’s Q will increase by 0.137% (α3 = 0.137, t=2.59, and p-
value<1%). This result indicates that the reported earnings of smoothers that are socially
responsible are more value-enhancing. We infer that market participants could differentiate
smoothed earnings from natural smoothing or from garbled reporting, for firms’ reporting
behaviors with or without high social responsibilities, and then they respond more positively to
those financial numbers that deviate less from permanent “economic” earnings.
Table 6 presents regression tests of subcategories of CSR and smoothing on Tobin’s Q.
We use the same model as in equation (6) except replacing aggregate CSR score and CSR
dummy variables with their individual component score and dummy variables. We use
ComScore, DivScore, EmpScore, EnvScore, and ProScore to present community relations
ratings, diversity ratings, employee relations ratings, environment ratings, and product ratings.
Columns (1) presents regressions of Tobins’ Q on dimensional CSR raw score and DAS,
columns (2) presents regressions of Tobin’s Q on dimensional CSR raw score and TAS, columns
(3) presents regressions of Tobin’s Q on dimensional CSR dummy variables and DAS, and
21
Recall Barnett (2007) theorizes that the relationship between corporate social responsibilities and corporate
financial performance may be U-shaped. Rountree et al. (2008) conclude that earnings smoothness has no effect on
Tobin’s Q.
26
column (4) presents regressions of Tobin’s Q on dimensional CSR and TAS. It seems that the
coefficients on employee relation ratings and smoothing interaction are both statistically
significant and economically significant. For example, in column (1), the coefficient on the
interaction of employee relation rating and DAS is 0.105 at 1% significant level, and the
coefficient on employee relation rating is -0.073 at 1% significant level. This indicates that for
each employee relation rating increase, when earning smoothing increases 1%, firm Tobin’s Q
will increase by 0.032% (0.105% - 0.073%). The positive association between firm value and
interaction between employee relations ratings and smoothing are in line with the abnormal
return results in Table 5. In fact, our CSR components results are consistent with Edmans (2011).
Taking the results in Table 5 and Table 6 together, we conclude that the net impact of overall
CSR activities could be profitable, but some individual CSR projects could still be unprofitable.
5. Additional Tests
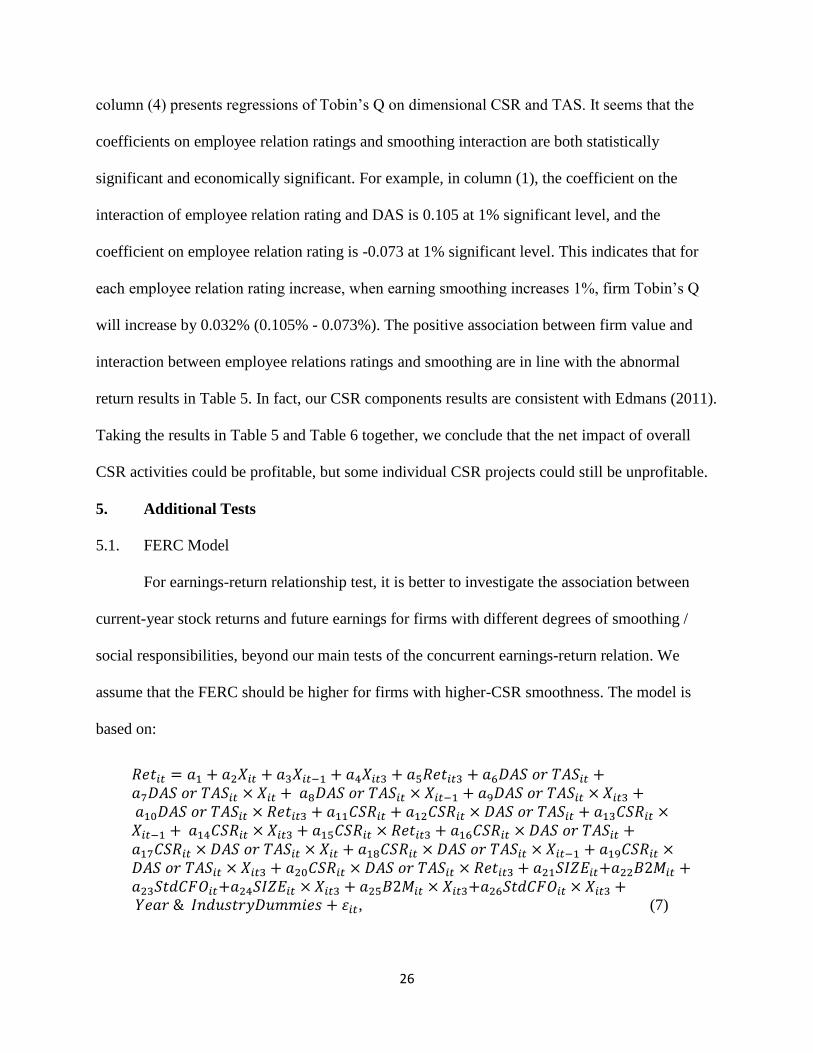
5.1. FERC Model
For earnings-return relationship test, it is better to investigate the association between
current-year stock returns and future earnings for firms with different degrees of smoothing /
social responsibilities, beyond our main tests of the concurrent earnings-return relation. We
assume that the FERC should be higher for firms with higher-CSR smoothness. The model is
based on:
, (7)
27
where Rett is ex-dividend stock return during fiscal year t; Xt is earnings per share for fiscal year
t, deflated by the stock price at the beginning of the year; Xt-1 is earnings per share, adjusted for
stock splits and stock dividends for fiscal year t-1, deflated by the stock price at the beginning of
the year; Xt3 is the sum of earnings per share for fiscal year t+1 through t+3, deflated by the
stock price at the beginning of the year; Rett3 is annually compounded stock return for fiscal year
t+1 through t+3. Refer to Appendix for other variable descriptions.
Table 7 presents the regression results of stock return on CSR score and earning
smoothness. We use the FERC model as in equation (7) to estimate the joint impact of CSR
score and smoothness on current stock return. Again, we use ComScore, DivScore, EmpScore,
EnvScore, and ProScore to presents community relations ratings, diversity ratings, employee
relations ratings, environment ratings, and product ratings. We use aggregate CSR score and
aggregate CSR dummy variables in column (1) through column (4). The coefficient ( ) on the
interaction term between high CSR dummy variable and DAS is 0.032 at 5% significant level,
which indicates that for firms with high CSR there will be extra 3.2 basis points risk adjusted
return when firm increases smoothness by 1%. The impact of CSR and TAS on stock returns is
not as strong as the impact of CSR and DAS, but still positive and significant. The interaction
terms with raw CSR score have similar results. Column (2) shows that the coefficient on the
interaction term between high CSR dummy variable and TAS is 0.006 at 5% significant level,
which indicates that for firms with high CSR there will be extra 0.6 basis points risk adjusted
return when firm increases smoothness by 1%. Column (3) shows that the marginal CSR effects
interaction with DAS is 0.009 at 1% significance level, which means that for each point that a
firm’s CSR score improves, when the firm’ DAS increase by 1%, the firm’s stock return will
increase by 0.9 basis points. A similar but weaker effect is observed on the interaction between
28
CSR score and TAS, Column (4) shows that the corresponding coefficient is 0.002 at 5%
significance level, which means that for each point that a firm’s CSR score improves, when the
firm’ TAS increase by 1%, the firm’s stock return will increase by 0.2 basis points. It is evident
that high CSR firms’ earning smoothing is more value relevant, and CSR treated DAS effects is
stronger than CSR treated TAS.
Columns (5) presents regressions of fiscal year return on dimensional CSR dummy
variables score and DAS, columns (6) presents regressions of fiscal year return on dimensional
CSR dummy variables and TAS, columns (7) presents regressions of fiscal year return on
dimensional CSR raw score and DAS, and column (8) presents regressions of fiscal year return
on dimensional CSR raw score and TAS. The coefficients on employee relation ratings,
diversity, community relations ratings, and smoothing interaction seem to impact stock return.
For example, in column (5), the coefficient on the interaction of employee relation rating dummy
variable and DAS is 0.038 at 10% significant level. This indicates that for firms with high
employee relation ratings, when earning smoothing increases 1%, firm stock return will increase
by 3.8 basis points. The positive association between value and interaction between employee
relations ratings and smoothing are in line with the abnormal return results in Table 5. In column
(6), the coefficient on the interaction of community relations ratings dummy variable and TAS is
0.014 at 5% significant level. This indicates that for firms with high community relations ratings,
when earning smoothing increases 1%, firm stock return will increase by 1.4 basis points. In
column (7), the coefficient on the interaction of diversity ratings score and DAS is 0.010 at 5%
significant level. This indicates that for every 1 point increase of diversity rating, when
smoothness increases 1%, stock returns will correspond to 1 basis point increase.
29
Interestingly, product rating and smoothing interaction does not impact stock return in
any case. It may imply that product rating is very transparent in competitive product market, thus
the real product related information has been priced timely whenever it is available. So product
rating from KLD could no longer change prices when it is released.
5.2. The SOX Effects on the Valuation of CSR and Smoothness
The SOX Act was passed to improve the integrity of financial reports, and it makes CEO
and CFO personally liable to the financial reports. We posit that management will provide better
quality financial reports in post-SOX era, thus earning smoothing carries more fundamental
underlying value-related information, and firms with low CSR ratings will be impacted more
because their reports used to carry less value-related information pre-SOX. Cohen et al. (2008)
document that accrual-based earnings management increased steadily from 1987 until the
passage of the Sarbanes-Oxley Act (SOX) in 2002, followed by a significant decline after the
passage of SOX. We add the SOX indicator variable in the following model equation (control
effects are same as in equation 4):
( ) ( ) ( ) ( ) ( ) ( ) . (8)
Table 8 presents the regression results of CSR score and earning smoothness joint impact
on firm value post-SOX. Our interest of research is the coefficient ( ) on the interaction of CSR,
SOX, and DAS or DAS. It turns out to be significantly negative ( , is
-0.157 at 5% significant level), which indicates that firms with low CSR improve the information
quality in smoothness, relatively compared to firms with high CSR post-SOX.
30
However, when we look at the coefficient on the interaction of CSR and DAS together,
we find that the main results still holds. The sum of and is still positive. The interaction
term coefficient between CSR dummy variable and smoothing (DAS) is 0.256 at 1% level, and
the interaction term coefficient among CSR dummy variable, smoothing (DAS), and SOX is -
0.157 at 5% level. These suggest that for firms with high CSR there will be a 0.246% increase in
Tobin’s Q when firm’s smoothness increases by 1%. The effects of CSR on smoothing
information quality are still both economically and statistically significant post-SOX. For firms
with high CSR there will be 8.9 basis points increase in Tobin’s Q when firm’s smoothness
increases by 1%. Similar results are observed when we use CSR raw score and a different
smoothing measure (i.e., TAS).
5.3. Other Additional Tests
We conduct sensitivity tests to check that our main results hold after controlling other
additional concerns. We also isolate the effect of ethical motivation from other CSR incentives,
such as, reputation concern and real earnings management, which could also drive a positive
impact of CSR and earning smoothing on firm value. We control for reputation indicator and real
earnings activities metrics (see Roychowdhury 2006) in our multivariate analysis. We also
control, in our main tests of the earnings-return relationship, 1) for income-smoothing firms’
information environment, proxy by the percentage of institutional ownership and the number of
analyst providing earnings forecasts (Barnea and Rubin 2010); 2) a loss dummy, (or delete the
loss firms) as low value-relevance for firm loss (Basu 1997). These results, un-tabulated, do not
affect the conclusions drawn from our main tests.
Though, basically TAS and DAS are highly correlated and our results do not indeed alter
whether we use TAS or DAS. We remain inquisitive to explore a delicate difference, if any, of
31
the two smoothness proxies. Compared to DAS, TAS is more a real earning smoothing measure.
However, DAS could measure “abnormal” managed earning smoothing. We find that the
coefficients of interaction between DAS and CSR for firm value regressions and firm short/long-
run earnings-return regressions are more economically significant than the coefficients of the
interaction between TAS and CSR. The results enforce the evidence that ethical dimension of
CSR could improve the information quality of earning.
To address endogeneity concerns, we employ a natural experiment to test the joint impact
of CSR and smoothing. In some states, constituency laws (CL) were enacted in the 1980s and
early 1990s to extend the fiduciary duty of the board of directors beyond maximizing shareholder
value, and to protect constituencies other than shareholders from the externalities associated with
hostile takeovers (see Alexander et al. 1997). The laws allowed corporate directors to consider
not only the interests of shareholders, but also other nonfinancial stakeholders (e.g. employees
and community) when deciding whether to approve or resist a takeover. These laws basically
made firms in these states take their stakeholders other than their shareholders more in
consideration when making decisions. The managers in these states were empowered to increase
their overall attention to stakeholders, while not being concerned that they will be sued by
shareholders for abusing their fiduciary duties. Firms in these states are endogenously more CSR
activities than their peers in other states without such CL enacted. Our results show that the
effects of CSR on earning smoothing information quality in these states with CL enacted are not
as strong as firms in other states, that is to say, spontaneous CSR firms tend to provide better
quality information through their smoothing.
32
6. Conclusions
This paper extends the literature on income smoothing by investigating whether corporate
social responsibilities affect the informational property of smoothed earnings. Since smoothing is
related to unknown managerial incentives and business strategies (Trueman and Titman 1988;
Sankar and Subramanyam 2001), it has mixed effects on earnings informativeness to corporate
outsiders (Dechow et al. 2010). We conjecture that socially responsible firms that expend effort
and resources in implementing CSR practices to meet ethical expectations of society are likely to
contain earnings manipulation and provide more transparent financial information. Thus,
smoothed earnings reported by ethnical management are more value relevant.
Empirically, we find that smoothness does not significantly improve the earnings-return
relation, and smoothness does not turn into higher firm value. Our findings suggest that the
market does not reward smoothers, which is opposed to the findings of Hunt et al. (2000), as well
as against the anecdotal evidences, e.g., in Graham et al. (2005). More importantly, we find that
higher-CSR smoothness incrementally improves the earnings-return relation, and is also
positively and significantly associated with firm performance, consistent with our two
hypotheses under study. Our paper demonstrates that the common perception among CFOs in
their sample that smooth earnings produce a market premium is related to ethical reporting. The
practical implication of the results is to provide analysts and investors with a tool for identifying
firms with different degrees of value-relevant earnings.
Our research designs are based on the market efficiency theory, the model testability of
discretionary accruals, the reliability and completeness of CSR measures and categories. Our
research does not consider managers’ incentives for disclosing CSR information and for income
smooth reporting, and does not consider other earnings quality proxies (e.g., conservatism) as
33
smoothing is the most common earnings management tool (e.g., Graham et al. 2005). Socially
responsible firms seem to consider the long-term view for the CSR effects, so the valuation could
be time-varying. We implement the FERC methodology, long or short window value relevance
test, and concurrent Tobin’s Q tests. We do not specially address the strength of different test
methodology, but generally our results are conclusive that smoothing is more informative with
ethical reporting behaviors.
34
References
Alexander, J., M. Spivey, and M.W. Marr. 1997. Non-shareholder constituency statutes and
shareholder wealth: A note. Journal of Banking and Finance 21(3), 417-432.
Ali, A., and P. Zarowin. 1992. Permanent versus transitory components of annual earnings and
estimation error in earnings response coefficients. Journal of Accounting and Economics 15,
249-264.
Barnea, A., and A. Rubin. 2010. Corporate social responsibility as a conflict between
shareholders. Journal of Business Ethics 97, 71-86.
Bao, B., and D. Bao. 2004. Income smoothing, earnings quality and firm value. Journal of
Business Finance and Accounting 31(9-10), 1525-1557.
Barnett, M.L. 2007. Stakeholder influence capacity and the variability of financial returns to
corporate social responsibility. Academy of Management Review 32(3), 794-816.
Barnett, M. L., and R.M. Salomon. 2012. Does it pay to be really good? Addressing the shape of
the relationship between social and financial performance. Strategic Management Journal
33(11), 1304-1320.
Basu, S. 1997. The conservatism principle and the asymmetric timeliness of earnings. Journal of
Accounting and Economics 24(1), 3-37.
Beidleman, C. 1973. Income smoothing: The role of management. The Accounting Review 48(4),
653-667.
Bhagat, S., and B. Bolton. 2008. Corporate governance and firm performance. Journal of
Corporate Finance 14, 257-273.
Bhattacharya, U., H. Daouk, and M. Welker. 2003. The world price of earnings opacity. The
Accounting Review 78(3), 641-678.
Brown, S., K. Lo, and T. Lys. 1999. Using R2 in accounting research: measuring changes in
value relevance over the last four decades. Journal of Accounting and Economics 28(2), 83-115.
Brown, W., E. Helland, and J. Smith. 2006. Corporate philanthropic practices. Journal of
Corporate Finance 12(5), 855-877.
Chaney, P.K., and C.M. Lewis. 1995. Earnings management and firm valuation under
asymmetric information. Journal of Corporate Finance 1(3-4), 319-345.
Chih, H., C. Shen, and F. Kang. 2008. Corporate social responsibility, investor protection, and
earnings management: Some international evidence. Journal of Business Ethics 79, 179-198.
Cohen, D.A., A. Dey, and T.Z. Lys. 2008. Real and accrual-based earnings management in the
pre- and post-Sarbanes-Oxley periods. The Accounting Review 83(3), 757-787.
Collins, D., S.P. Kothari, J. Shanken, and R. Sloan. 1994. Lack of timeliness and noise as
explanations for the low contemporaneous return-earnings association. Journal of Accounting
and Economics 18(3), 289-324.
Dechow, P., W. Ge, and C. Schrand. 2010. Understanding earnings quality: a review of the
proxies, their determinants and their consequences. Journal of Accounting and Economics 50(2-
3), 344-401.
35
Dichev, I., and V. Tang. 2009. Earnings volatility and earnings predictability. Journal of
Accounting and Economics 47(1-2), 160-181.
Dhaliwal, D.S., S. Radhakrishnan, A. Tsang, and Y.G. Yang. 2012. Nonfinancial disclosure and
analyst forecast accuracy: International evidence on corporate social responsibility disclosure.
The Accounting Review 87(3), 723-759.
Fama, E.F., and K. French. 1993. Common risk factors in the returns on stocks and bonds.
Journal of Financial Economics 33, 3-56.
Fama, E. F., and J. MacBeth. 1973. Risk, return, and equilibrium: empirical tests. Journal of
Political Economy 81, 607-636.
Francis, J., R. LaFond, P. Olsson, and K. Schipper. 2004. Costs of equity and earnings attributes.
The Accounting Review 79, 967-1010.
Frankel, R., and X. Li. 2004. Characteristics of a firm’s information environment and the information
asymmetry between insiders and outsiders. Journal of Accounting and Economics 37(2), 229-259.
Fudenberg, D., and J. Tirole. 1995. A theory of income and dividend smoothing based on
incumbency rents. Journal of Political Economy 103(1), 75-93.
Garriga, E., and E. Mele. 2004. Corporate social responsibility theories: Mapping and territory.
Journal of Business Ethics 53, 51-74.
Ghoul, S., O., Guedhami, C.C.Y. Kowk, and D.R. Mishra. 2011. Does corporate social
responsibility affect the cost of capital? Journal of Banking and Financing 35(9), 2388-2406.
Goel, A.M., and A.V. Thakor. 2003. Why do firms smooth earnings? Journal of Business 76(1),
151-191.
Gow, I.D., G. Ormazabal, and D.J. Taylor. 2010. Correcting for cross-sectional and time-series
dependence in accounting research. The Accounting Review 85(2), 483-512.
Graham, J.R., C.R. Harvey, and S. Rajgopal. 2005. The economic implications of corporate
financial reporting. Journal of Accounting and Economics 40(1-3), 3-73.
Healy, P. M., 1985. The effect of bonus schemes on accounting decisions. Journal of Accounting
and Economics 7, 85-107.
Heinkel, R., A. Kraus, and J. Zechner. 2001. The effect of green investment on corporate
behavior. Journal of Financial and Quantitative Analysis 35, 431-449.
Hribar, P., and D. Collins. 2002. Errors in estimating accruals: implications for empirical
research. Journal of Accounting Research 40(1), 105-134.
Hunt, A., S.E. Moyer, and T. Shevlin. 2000. Earnings volatility, earnings management, and
equity value. Working paper. University of Washington.
Hutton, P., A.J. Marcus, and H. Tehranian. 2009. Opaque financial reports and R2, and crash
risk. Journal of Financial Economics 94(1), 67-86.
Jayaraman, S. 2008. Earnings volatility, cash flow volatility, and informed trading. Journal of
Accounting Research 46(4), 809-851.
Jiang, G., C.M.C. Lee, and Y. Zhang. 2005. Information uncertainty and expected returns.
Review of Accounting Studies 10(2-3), 185-221.
36
Jones, J., 1991. Earnings management during import relief investigations. Journal of Accounting
Research 29(2), 193-228.
Keating, A.S., and J.L. Zimmerman. 1999. Depreciation policy changes: tax, earnings
management, and investment opportunity incentives. Journal of Accounting and Economics
28(3), 359-389.
Kirschenheiter, M., and N. Melumad. 2001. Can “big bath” and earnings smoothing co-exist as
equilibrium financial reporting strategies? Journal of Accounting Research 40(3), 761-796.
Kinder, P.D. 2008. Getting started with KLD stats and KLD’s ratings definitions. Boston, MA:
KLD Research & Analytics, Inc.
Kothari, S.P., A.J. Leone, and C.E. Wasley. 2005. Performance matched discretionary accrual
measures. Journal of Accounting and Economics 39, 163-197.
Lang, M., K.V. Lins, and D. Miller. 2003. ADRs, analysts, and accuracy: Does cross listing in
the U.S. improve a firm’s information environment and increase market value? Journal of
Accounting Research 41(2), 317-345.
Leuz, C., D. Nanda, and P. Wysocki, 2003. Investor protection and earnings management: an
international comparison. Journal of Financial Economics 69(3), 505-527.
Levitt, A. 1998. The numbers game. Speech delivered at the NYU Center for Law and Business,
New York, NY, September 28, 1998.
McGuire, J.B., A. Sundgren, and T. Schneeweis. 1988. Corporate social responsibility and firm
financial performance. The Academy of Management Journal 31(4), 854-872.
McInnis, J. 2010. Earnings smoothness, average returns, and implied cost of equity capital. The
Accounting Review 85(1), 315-341.
McWilliams, A., and D. Siegel. 2000. Corporate social responsibility and financial performance:
Correlation or misspecification? Strategic Management Journal 21(5), 603-609.
Mackey, A., T.B. Mackey, and J.B. Barney. 2007. Corporate social responsibility and firm
performance: Investor preferences and corporate strategies. The Academy of Management
Review 32(3), 817-835.
Moser, D.V., and P.R. Martin. 2012. A broad perspective on corporate social responsibility
research in accounting. The Accounting Review 87(3), 797-806.
Myers, J., L. Myers, and D. Skinner. 2007. Earnings momentum and earnings management.
Journal of Accounting, Auditing, and Finance 22(2), 249-284.
Narver, J.C. 1971. Rational management responses to external effects. The Academy of
Management Journal 14(1), 99-115.
Renneboog, L., J. Ter Horst, and C. Zhang. 2008. The price of ethics and stakeholder governance: The
performance of socially responsible mutual funds. Journal of Corporate Finance 14, 302-322.
Ronen, J., and S. Sadan. 1981. Smoothing income numbers: Objectives, means and implications.
Reading, MA: Addison Wesley.
Rountree, B., J. Weston, and G. Allayannis. 2008. Do investors value smooth performance?
Journal of Financial Economics 90(3), 237-251.
37
Roychowdhury, S. 2006. Earnings management through real activities manipulation. Journal of
Accounting and Economics 42(3), 335-370.
Sankar, M., and K.R. Subramanyam. 2001. Reporting discretion and private information
communication through earnings. Journal of Accounting Research 39(2), 365-386.
Sprinkle, G.B., and L.A. Maines. 2010. The benefits and costs of corporate social responsibility.
Business Horizons 53, 445-453.
Trueman, B., and S. Titman. 1988. An explanation for accounting income smoothing. Journal of
Accounting Research 26, 127-139.
Tucker, J., and P. Zarowin. 2006. Does income smoothing improve earnings informativeness?
The Accounting Review 81(1), 251-270.
38
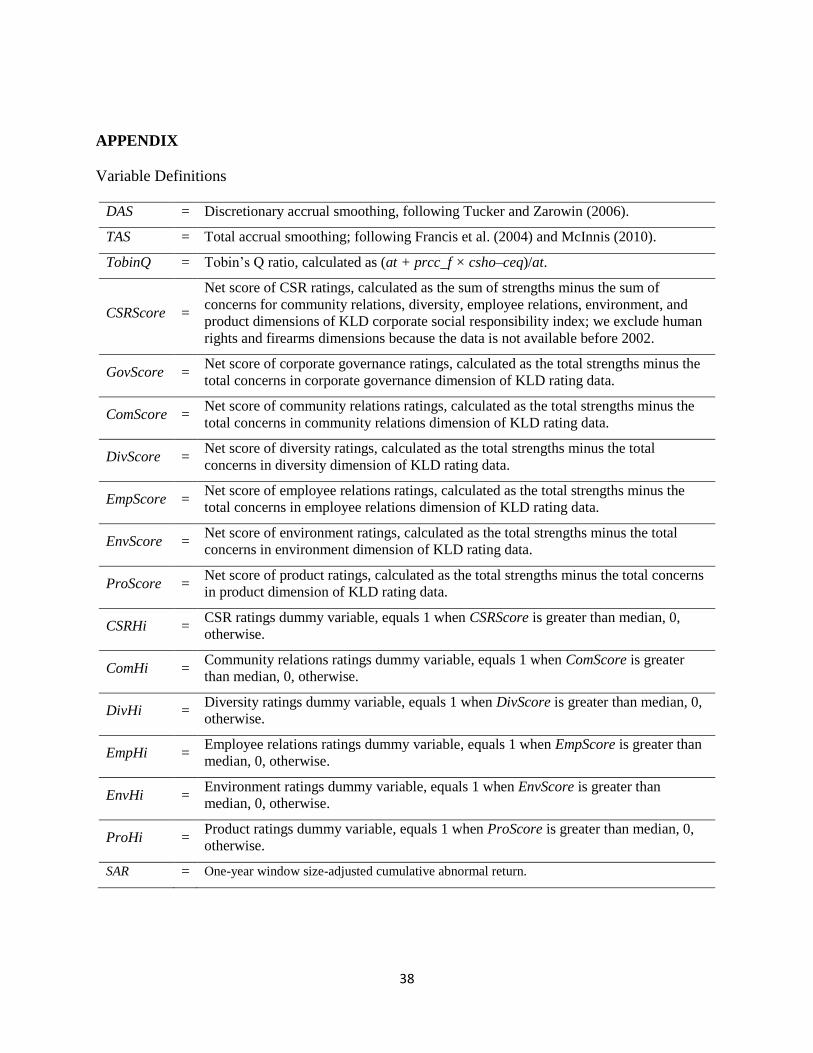
APPENDIX
Variable Definitions
DAS = Discretionary accrual smoothing, following Tucker and Zarowin (2006).
TAS = Total accrual smoothing; following Francis et al. (2004) and McInnis (2010).
TobinQ = Tobin’s Q ratio, calculated as (at + prcc_f × csho–ceq)/at.
CSRScore =
Net score of CSR ratings, calculated as the sum of strengths minus the sum of
concerns for community relations, diversity, employee relations, environment, and
product dimensions of KLD corporate social responsibility index; we exclude human
rights and firearms dimensions because the data is not available before 2002.
GovScore = Net score of corporate governance ratings, calculated as the total strengths minus the
total concerns in corporate governance dimension of KLD rating data.
ComScore = Net score of community relations ratings, calculated as the total strengths minus the
total concerns in community relations dimension of KLD rating data.
DivScore = Net score of diversity ratings, calculated as the total strengths minus the total
concerns in diversity dimension of KLD rating data.
EmpScore = Net score of employee relations ratings, calculated as the total strengths minus the
total concerns in employee relations dimension of KLD rating data.
EnvScore = Net score of environment ratings, calculated as the total strengths minus the total
concerns in environment dimension of KLD rating data.
ProScore = Net score of product ratings, calculated as the total strengths minus the total concerns
in product dimension of KLD rating data.
CSRHi = CSR ratings dummy variable, equals 1 when CSRScore is greater than median, 0,
otherwise.
ComHi = Community relations ratings dummy variable, equals 1 when ComScore is greater
than median, 0, otherwise.
DivHi = Diversity ratings dummy variable, equals 1 when DivScore is greater than median, 0,
otherwise.
EmpHi = Employee relations ratings dummy variable, equals 1 when EmpScore is greater than
median, 0, otherwise.
EnvHi = Environment ratings dummy variable, equals 1 when EnvScore is greater than
median, 0, otherwise.
ProHi = Product ratings dummy variable, equals 1 when ProScore is greater than median, 0,
otherwise.
SAR = One-year window size-adjusted cumulative abnormal return.
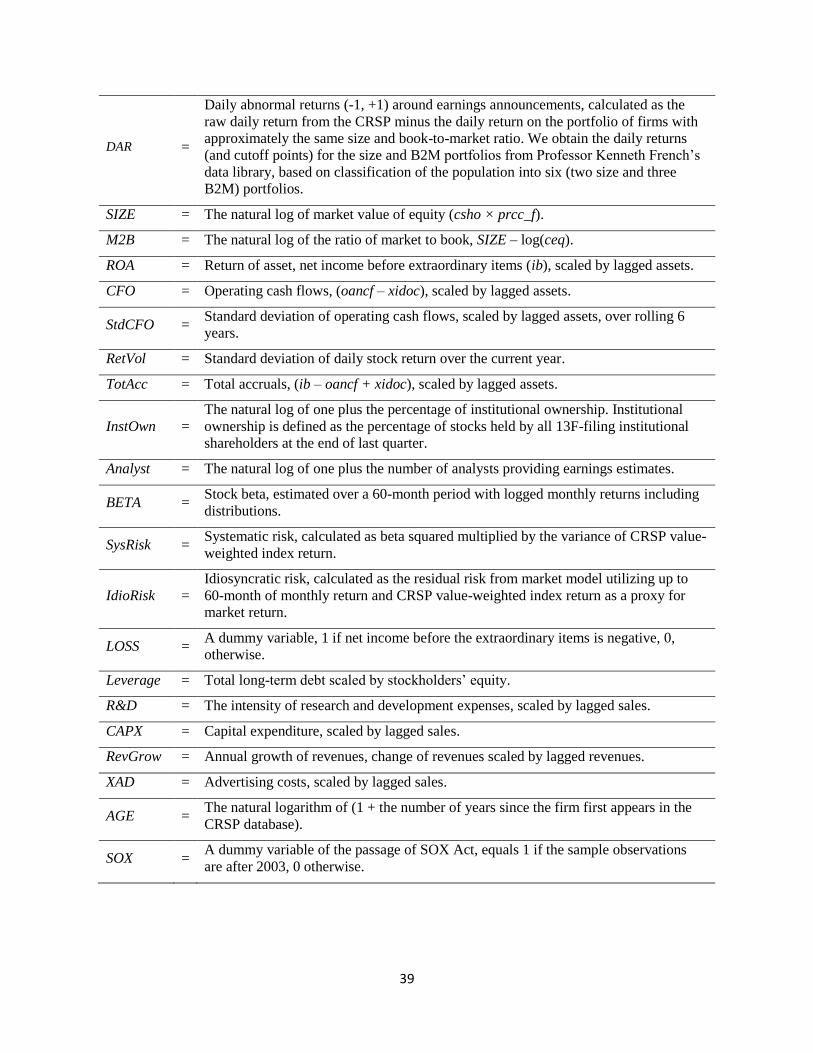
39
DAR =
Daily abnormal returns (-1, +1) around earnings announcements, calculated as the
raw daily return from the CRSP minus the daily return on the portfolio of firms with
approximately the same size and book-to-market ratio. We obtain the daily returns
(and cutoff points) for the size and B2M portfolios from Professor Kenneth French’s
data library, based on classification of the population into six (two size and three
B2M) portfolios.
SIZE = The natural log of market value of equity (csho × prcc_f).
M2B = The natural log of the ratio of market to book, SIZE – log(ceq).
ROA = Return of asset, net income before extraordinary items (ib), scaled by lagged assets.
CFO = Operating cash flows, (oancf – xidoc), scaled by lagged assets.
StdCFO = Standard deviation of operating cash flows, scaled by lagged assets, over rolling 6
years.
RetVol = Standard deviation of daily stock return over the current year.
TotAcc = Total accruals, (ib – oancf + xidoc), scaled by lagged assets.
InstOwn =
The natural log of one plus the percentage of institutional ownership. Institutional
ownership is defined as the percentage of stocks held by all 13F-filing institutional
shareholders at the end of last quarter.
Analyst = The natural log of one plus the number of analysts providing earnings estimates.
BETA = Stock beta, estimated over a 60-month period with logged monthly returns including
distributions.
SysRisk = Systematic risk, calculated as beta squared multiplied by the variance of CRSP value-
weighted index return.
IdioRisk =
Idiosyncratic risk, calculated as the residual risk from market model utilizing up to
60-month of monthly return and CRSP value-weighted index return as a proxy for
market return.
LOSS = A dummy variable, 1 if net income before the extraordinary items is negative, 0,
otherwise.
Leverage = Total long-term debt scaled by stockholders’ equity.
R&D = The intensity of research and development expenses, scaled by lagged sales.
CAPX = Capital expenditure, scaled by lagged sales.
RevGrow = Annual growth of revenues, change of revenues scaled by lagged revenues.
XAD = Advertising costs, scaled by lagged sales.
AGE = The natural logarithm of (1 + the number of years since the firm first appears in the
CRSP database).
SOX = A dummy variable of the passage of SOX Act, equals 1 if the sample observations
are after 2003, 0 otherwise.
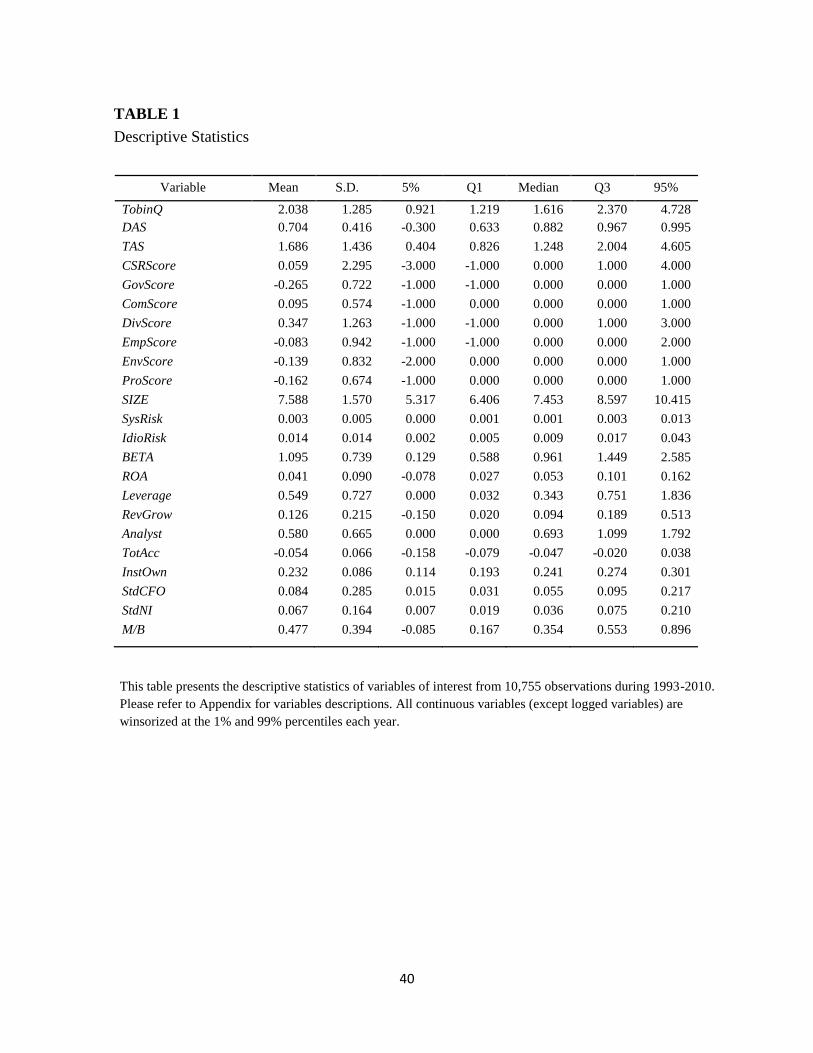
40
TABLE 1
Descriptive Statistics
Variable Mean S.D. 5% Q1 Median Q3 95%
TobinQ 2.038 1.285 0.921 1.219 1.616 2.370 4.728
DAS 0.704 0.416 -0.300 0.633 0.882 0.967 0.995
TAS 1.686 1.436 0.404 0.826 1.248 2.004 4.605
CSRScore 0.059 2.295 -3.000 -1.000 0.000 1.000 4.000
GovScore -0.265 0.722 -1.000 -1.000 0.000 0.000 1.000
ComScore 0.095 0.574 -1.000 0.000 0.000 0.000 1.000
DivScore 0.347 1.263 -1.000 -1.000 0.000 1.000 3.000
EmpScore -0.083 0.942 -1.000 -1.000 0.000 0.000 2.000
EnvScore -0.139 0.832 -2.000 0.000 0.000 0.000 1.000
ProScore -0.162 0.674 -1.000 0.000 0.000 0.000 1.000
SIZE 7.588 1.570 5.317 6.406 7.453 8.597 10.415
SysRisk 0.003 0.005 0.000 0.001 0.001 0.003 0.013
IdioRisk 0.014 0.014 0.002 0.005 0.009 0.017 0.043
BETA 1.095 0.739 0.129 0.588 0.961 1.449 2.585
ROA 0.041 0.090 -0.078 0.027 0.053 0.101 0.162
Leverage 0.549 0.727 0.000 0.032 0.343 0.751 1.836
RevGrow 0.126 0.215 -0.150 0.020 0.094 0.189 0.513
Analyst 0.580 0.665 0.000 0.000 0.693 1.099 1.792
TotAcc -0.054 0.066 -0.158 -0.079 -0.047 -0.020 0.038
InstOwn 0.232 0.086 0.114 0.193 0.241 0.274 0.301
StdCFO 0.084 0.285 0.015 0.031 0.055 0.095 0.217
StdNI 0.067 0.164 0.007 0.019 0.036 0.075 0.210
M/B 0.477 0.394 -0.085 0.167 0.354 0.553 0.896
This table presents the descriptive statistics of variables of interest from 10,755 observations during 1993-2010.
Please refer to Appendix for variables descriptions. All continuous variables (except logged variables) are
winsorized at the 1% and 99% percentiles each year.
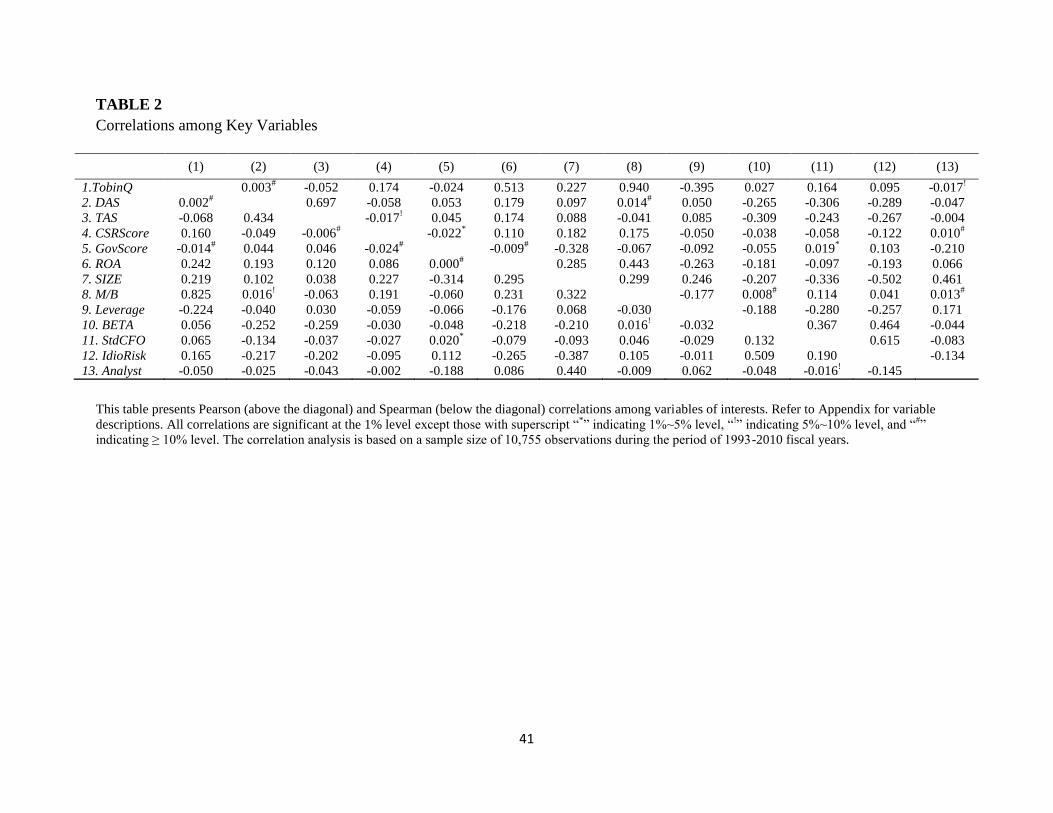
41
TABLE 2
Correlations among Key Variables
(1) (2) (3) (4) (5) (6) (7) (8) (9) (10) (11) (12) (13)
1.TobinQ
0.003# -0.052 0.174 -0.024 0.513 0.227 0.940 -0.395 0.027 0.164 0.095 -0.017
!
2. DAS 0.002#
0.697 -0.058 0.053 0.179 0.097 0.014# 0.050 -0.265 -0.306 -0.289 -0.047
3. TAS -0.068 0.434
-0.017! 0.045 0.174 0.088 -0.041 0.085 -0.309 -0.243 -0.267 -0.004
4. CSRScore 0.160 -0.049 -0.006#
-0.022* 0.110 0.182 0.175 -0.050 -0.038 -0.058 -0.122 0.010
#
5. GovScore -0.014# 0.044 0.046 -0.024
#
-0.009# -0.328 -0.067 -0.092 -0.055 0.019
* 0.103 -0.210
6. ROA 0.242 0.193 0.120 0.086 0.000#
0.285 0.443 -0.263 -0.181 -0.097 -0.193 0.066
7. SIZE 0.219 0.102 0.038 0.227 -0.314 0.295
0.299 0.246 -0.207 -0.336 -0.502 0.461
8. M/B 0.825 0.016! -0.063 0.191 -0.060 0.231 0.322
-0.177 0.008# 0.114 0.041 0.013
#
9. Leverage -0.224 -0.040 0.030 -0.059 -0.066 -0.176 0.068 -0.030
-0.188 -0.280 -0.257 0.171
10. BETA 0.056 -0.252 -0.259 -0.030 -0.048 -0.218 -0.210 0.016! -0.032
0.367 0.464 -0.044
11. StdCFO 0.065 -0.134 -0.037 -0.027 0.020* -0.079 -0.093 0.046 -0.029 0.132
0.615 -0.083
12. IdioRisk 0.165 -0.217 -0.202 -0.095 0.112 -0.265 -0.387 0.105 -0.011 0.509 0.190 -0.134
13. Analyst -0.050 -0.025 -0.043 -0.002 -0.188 0.086 0.440 -0.009 0.062 -0.048 -0.016! -0.145
This table presents Pearson (above the diagonal) and Spearman (below the diagonal) correlations among variables of interests. Refer to Appendix for variable
descriptions. All correlations are significant at the 1% level except those with superscript “*” indicating 1%~5% level, “
!” indicating 5%~10% level, and “
#”
indicating ≥ 10% level. The correlation analysis is based on a sample size of 10,755 observations during the period of 1993-2010 fiscal years.
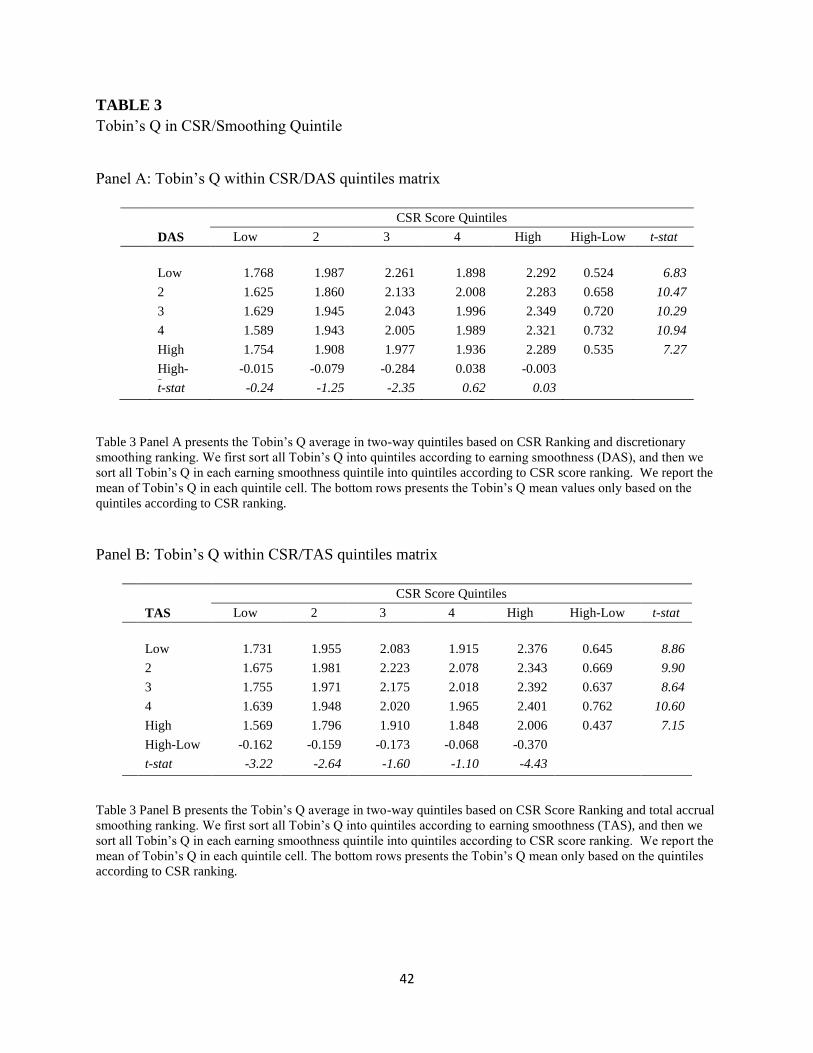
42
TABLE 3
Tobin’s Q in CSR/Smoothing Quintile
Panel A: Tobin’s Q within CSR/DAS quintiles matrix
CSR Score Quintiles
DAS Low 2 3 4 High High-Low t-stat
Low 1.768 1.987 2.261 1.898 2.292 0.524 6.83
2 1.625 1.860 2.133 2.008 2.283 0.658 10.47
3 1.629 1.945 2.043 1.996 2.349 0.720 10.29
4 1.589 1.943 2.005 1.989 2.321 0.732 10.94
High 1.754 1.908 1.977 1.936 2.289 0.535 7.27
High-
Low
-0.015 -0.079 -0.284 0.038 -0.003
t-stat -0.24 -1.25 -2.35 0.62 0.03
Table 3 Panel A presents the Tobin’s Q average in two-way quintiles based on CSR Ranking and discretionary
smoothing ranking. We first sort all Tobin’s Q into quintiles according to earning smoothness (DAS), and then we
sort all Tobin’s Q in each earning smoothness quintile into quintiles according to CSR score ranking. We report the
mean of Tobin’s Q in each quintile cell. The bottom rows presents the Tobin’s Q mean values only based on the
quintiles according to CSR ranking.
Panel B: Tobin’s Q within CSR/TAS quintiles matrix
CSR Score Quintiles
TAS Low 2 3 4 High High-Low t-stat
Low 1.731 1.955 2.083 1.915 2.376 0.645 8.86
2 1.675 1.981 2.223 2.078 2.343 0.669 9.90
3 1.755 1.971 2.175 2.018 2.392 0.637 8.64
4 1.639 1.948 2.020 1.965 2.401 0.762 10.60
High 1.569 1.796 1.910 1.848 2.006 0.437 7.15
High-Low -0.162 -0.159 -0.173 -0.068 -0.370
t-stat -3.22 -2.64 -1.60 -1.10 -4.43
Table 3 Panel B presents the Tobin’s Q average in two-way quintiles based on CSR Score Ranking and total accrual
smoothing ranking. We first sort all Tobin’s Q into quintiles according to earning smoothness (TAS), and then we
sort all Tobin’s Q in each earning smoothness quintile into quintiles according to CSR score ranking. We report the
mean of Tobin’s Q in each quintile cell. The bottom rows presents the Tobin’s Q mean only based on the quintiles
according to CSR ranking.
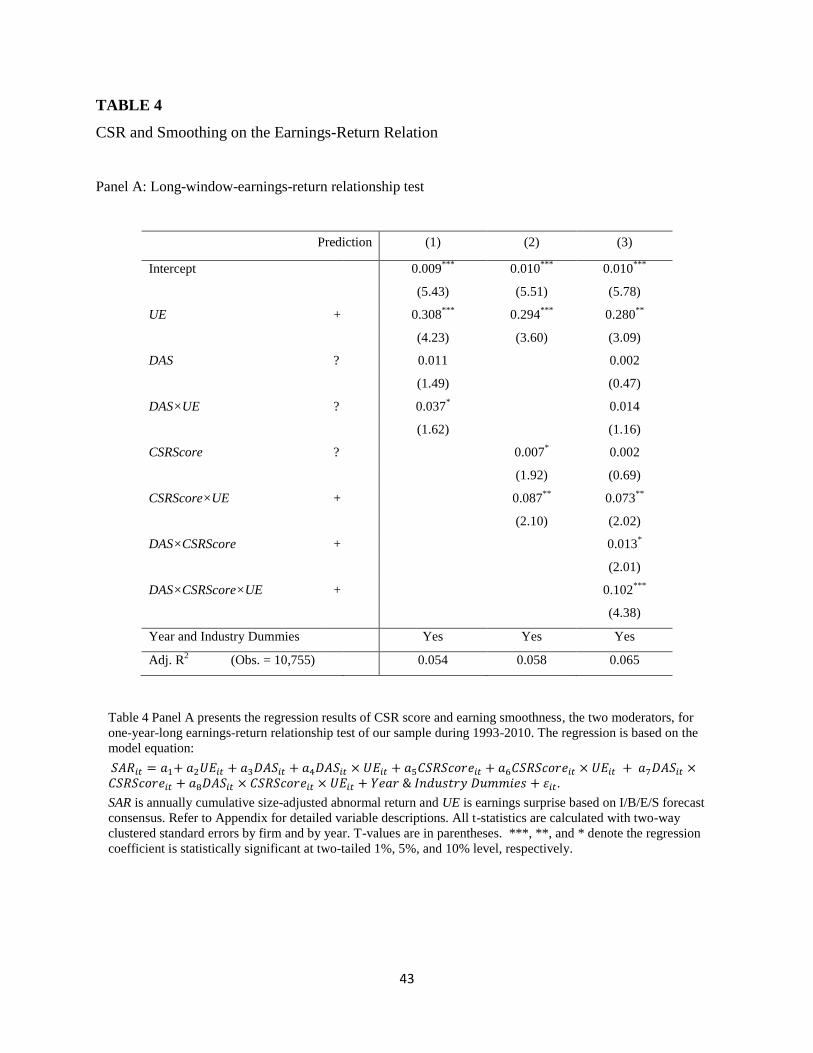
43
TABLE 4
CSR and Smoothing on the Earnings-Return Relation
Panel A: Long-window-earnings-return relationship test
Prediction (1) (2) (3)
Intercept 0.009***
0.010***
0.010***
(5.43) (5.51) (5.78)
UE + 0.308***
0.294***
0.280**
(4.23) (3.60) (3.09)
DAS ? 0.011 0.002
(1.49) (0.47)
DAS×UE ? 0.037* 0.014
(1.62) (1.16)
CSRScore ? 0.007* 0.002
(1.92) (0.69)
CSRScore×UE + 0.087**
0.073**
(2.10) (2.02)
DAS×CSRScore + 0.013*
(2.01)
DAS×CSRScore×UE + 0.102***
(4.38)
Year and Industry Dummies Yes Yes Yes
Adj. R2 (Obs. = 10,755) 0.054 0.058 0.065
Table 4 Panel A presents the regression results of CSR score and earning smoothness, the two moderators, for
one-year-long earnings-return relationship test of our sample during 1993-2010. The regression is based on the
model equation:
.
SAR is annually cumulative size-adjusted abnormal return and UE is earnings surprise based on I/B/E/S forecast
consensus. Refer to Appendix for detailed variable descriptions. All t-statistics are calculated with two-way
clustered standard errors by firm and by year. T-values are in parentheses. ***, **, and * denote the regression
coefficient is statistically significant at two-tailed 1%, 5%, and 10% level, respectively.
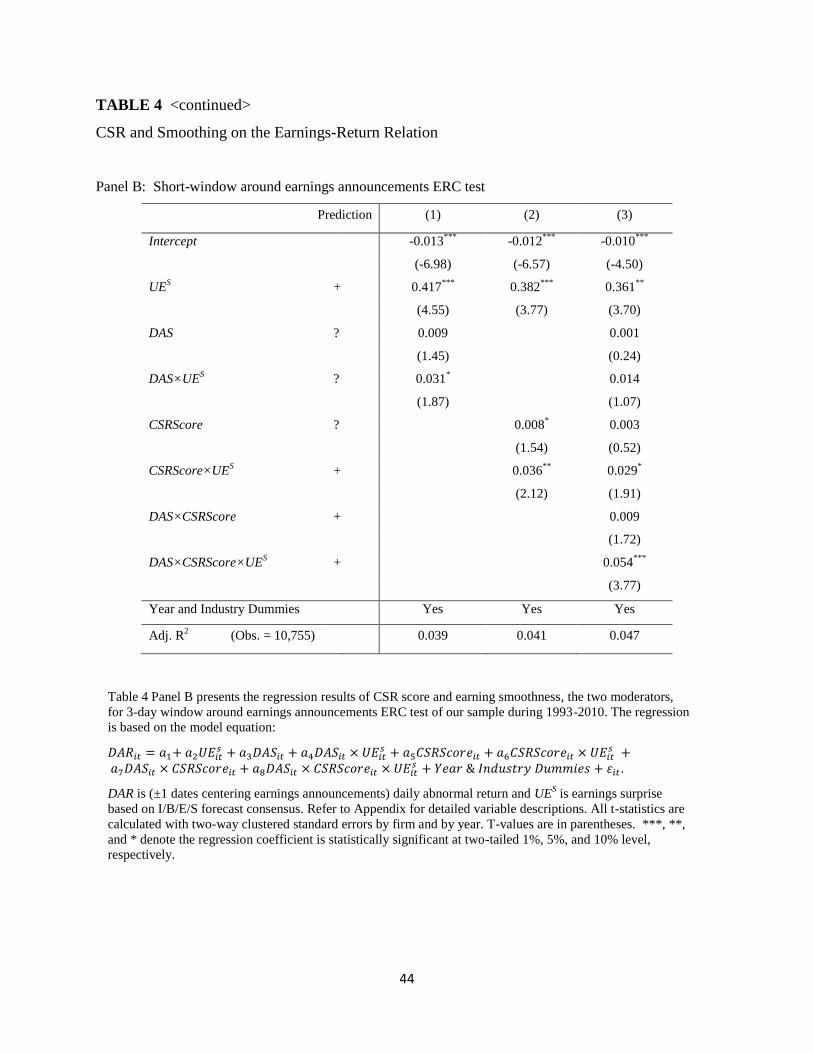
44
TABLE 4 <continued>
CSR and Smoothing on the Earnings-Return Relation
Panel B: Short-window around earnings announcements ERC test
Prediction (1) (2) (3)
Intercept -0.013***
-0.012***
-0.010***
(-6.98) (-6.57) (-4.50)
UES + 0.417
*** 0.382
*** 0.361
**
(4.55) (3.77) (3.70)
DAS ? 0.009 0.001
(1.45) (0.24)
DAS×UES ? 0.031
* 0.014
(1.87) (1.07)
CSRScore ? 0.008* 0.003
(1.54) (0.52)
CSRScore×UES + 0.036
** 0.029
*
(2.12) (1.91)
DAS×CSRScore + 0.009
(1.72)
DAS×CSRScore×UES + 0.054
***
(3.77)
Year and Industry Dummies Yes Yes Yes
Adj. R2 (Obs. = 10,755) 0.039 0.041 0.047
Table 4 Panel B presents the regression results of CSR score and earning smoothness, the two moderators,
for 3-day window around earnings announcements ERC test of our sample during 1993-2010. The regression
is based on the model equation:
.
DAR is (±1 dates centering earnings announcements) daily abnormal return and UES is earnings surprise
based on I/B/E/S forecast consensus. Refer to Appendix for detailed variable descriptions. All t-statistics are
calculated with two-way clustered standard errors by firm and by year. T-values are in parentheses. ***, **,
and * denote the regression coefficient is statistically significant at two-tailed 1%, 5%, and 10% level,
respectively.
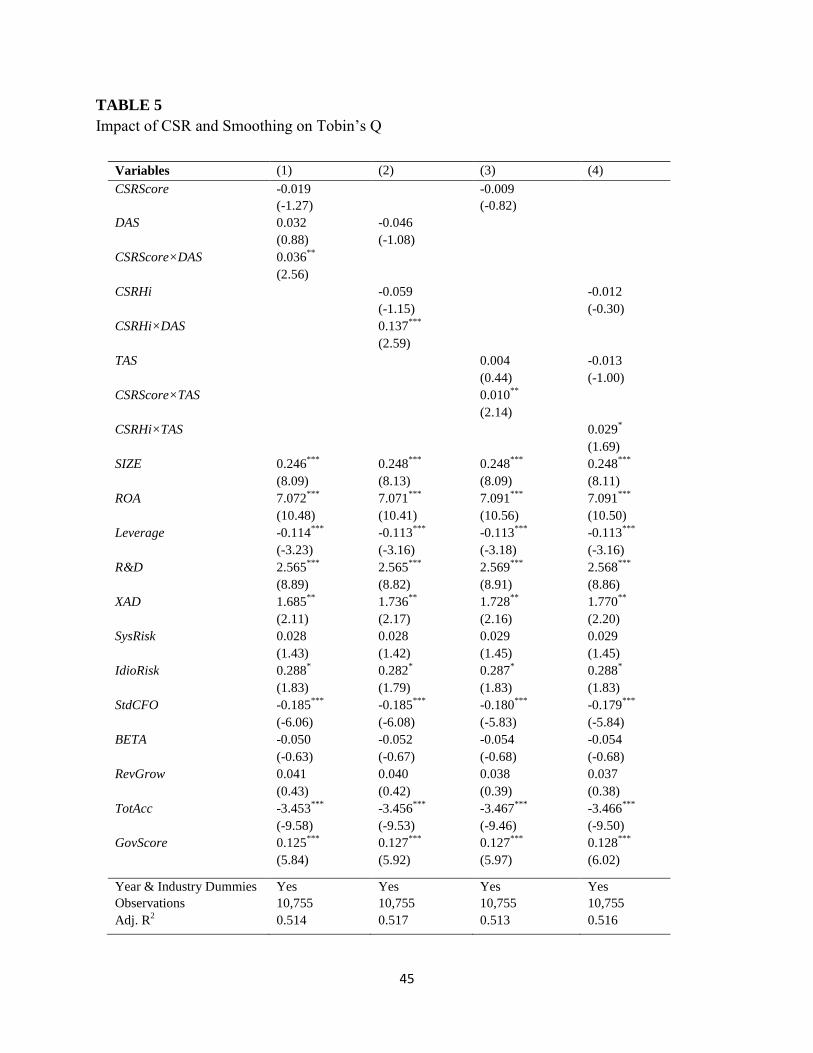
45
TABLE 5
Impact of CSR and Smoothing on Tobin’s Q
Variables (1) (2) (3) (4)
CSRScore -0.019 -0.009
(-1.27) (-0.82)
DAS 0.032 -0.046
(0.88) (-1.08)
CSRScore×DAS 0.036**
(2.56)
CSRHi -0.059 -0.012
(-1.15) (-0.30)
CSRHi×DAS 0.137***
(2.59)
TAS 0.004 -0.013
(0.44) (-1.00)
CSRScore×TAS 0.010**
(2.14)
CSRHi×TAS 0.029*
(1.69)
SIZE 0.246***
0.248***
0.248***
0.248***
(8.09) (8.13) (8.09) (8.11)
ROA 7.072***
7.071***
7.091***
7.091***
(10.48) (10.41) (10.56) (10.50)
Leverage -0.114***
-0.113***
-0.113***
-0.113***
(-3.23) (-3.16) (-3.18) (-3.16)
R&D 2.565***
2.565***
2.569***
2.568***
(8.89) (8.82) (8.91) (8.86)
XAD 1.685**
1.736**
1.728**
1.770**
(2.11) (2.17) (2.16) (2.20)
SysRisk 0.028 0.028 0.029 0.029
(1.43) (1.42) (1.45) (1.45)
IdioRisk 0.288* 0.282
* 0.287
* 0.288
*
(1.83) (1.79) (1.83) (1.83)
StdCFO -0.185***
-0.185***
-0.180***
-0.179***
(-6.06) (-6.08) (-5.83) (-5.84)
BETA -0.050 -0.052 -0.054 -0.054
(-0.63) (-0.67) (-0.68) (-0.68)
RevGrow 0.041 0.040 0.038 0.037
(0.43) (0.42) (0.39) (0.38)
TotAcc -3.453***
-3.456***
-3.467***
-3.466***
(-9.58) (-9.53) (-9.46) (-9.50)
GovScore 0.125***
0.127***
0.127***
0.128***
(5.84) (5.92) (5.97) (6.02)
Year & Industry Dummies Yes Yes Yes Yes
Observations 10,755 10,755 10,755 10,755
Adj. R2 0.514 0.517 0.513 0.516
46
This table presents the regression results of testing the effects of CSR score and earning smoothness on Tobin’s
Q for our sample during 1993-2010. The regression is based on the model equation:
( ) ( ) .
Refer to Appendix for variable descriptions. All t-statistics are calculated with two-way clustered standard
errors by firm and by year. T-values are in parentheses. ***, **, and * denote the regression coefficient is
statistically significant at two-tailed 1%, 5%, and 10% level, respectively. For columns (3) and (4), we use
TAS to substitute DAS. For columns (1) and (3), we use raw CSR score. However, we use CSR dummy
variable in columns (2) and (4), where CSRHi equals 1 when CSR is greater than the median (by year and SIC2
industry classification), 0, otherwise.
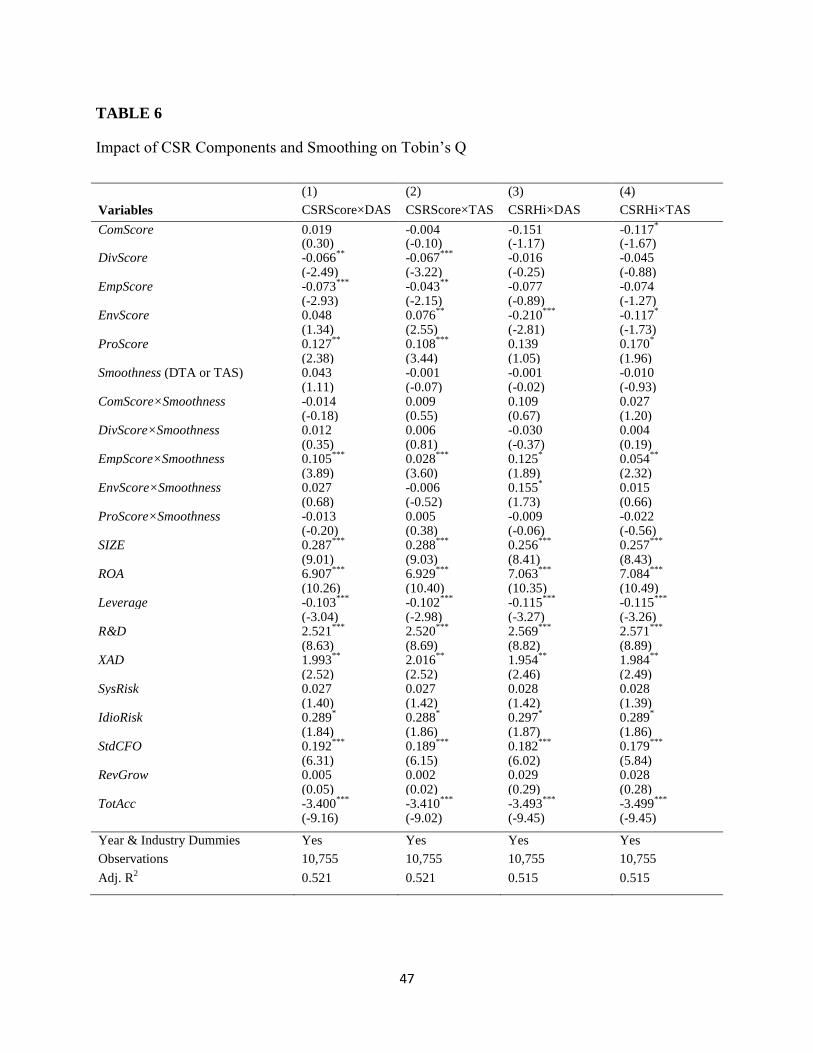
47
TABLE 6
Impact of CSR Components and Smoothing on Tobin’s Q
(1) (2) (3) (4)
Variables CSRScore×DAS CSRScore×TAS CSRHi×DAS CSRHi×TAS
ComScore 0.019 -0.004 -0.151 -0.117*
(0.30) (-0.10) (-1.17) (-1.67) DivScore -0.066
** -0.067
*** -0.016 -0.045
(-2.49) (-3.22) (-0.25) (-0.88) EmpScore -0.073
*** -0.043
** -0.077 -0.074
(-2.93) (-2.15) (-0.89) (-1.27) EnvScore 0.048 0.076
** -0.210
*** -0.117
*
(1.34) (2.55) (-2.81) (-1.73) ProScore 0.127
** 0.108
*** 0.139 0.170
*
(2.38) (3.44) (1.05) (1.96) Smoothness (DTA or TAS) 0.043 -0.001 -0.001 -0.010 (1.11) (-0.07) (-0.02) (-0.93) ComScore×Smoothness -0.014 0.009 0.109 0.027 (-0.18) (0.55) (0.67) (1.20) DivScore×Smoothness 0.012 0.006 -0.030 0.004 (0.35) (0.81) (-0.37) (0.19) EmpScore×Smoothness 0.105
*** 0.028
*** 0.125
* 0.054
**
(3.89) (3.60) (1.89) (2.32) EnvScore×Smoothness 0.027 -0.006 0.155
* 0.015
(0.68) (-0.52) (1.73) (0.66) ProScore×Smoothness -0.013 0.005 -0.009 -0.022 (-0.20) (0.38) (-0.06) (-0.56) SIZE 0.287
*** 0.288
*** 0.256
*** 0.257
***
(9.01) (9.03) (8.41) (8.43) ROA 6.907
*** 6.929
*** 7.063
*** 7.084
***
(10.26) (10.40) (10.35) (10.49) Leverage -0.103
*** -0.102
*** -0.115
*** -0.115
***
(-3.04) (-2.98) (-3.27) (-3.26) R&D 2.521
*** 2.520
*** 2.569
*** 2.571
***
(8.63) (8.69) (8.82) (8.89) XAD 1.993
** 2.016
** 1.954
** 1.984
**
(2.52) (2.52) (2.46) (2.49) SysRisk 0.027 0.027 0.028 0.028 (1.40) (1.42) (1.42) (1.39) IdioRisk 0.289
* 0.288
* 0.297
* 0.289
*
(1.84) (1.86) (1.87) (1.86) StdCFO 0.192
*** 0.189
*** 0.182
*** 0.179
***
(6.31) (6.15) (6.02) (5.84) RevGrow 0.005 0.002 0.029 0.028 (0.05) (0.02) (0.29) (0.28) TotAcc -3.400
*** -3.410
*** -3.493
*** -3.499
***
(-9.16) (-9.02) (-9.45) (-9.45)
Year & Industry Dummies Yes Yes Yes Yes
Observations 10,755 10,755 10,755 10,755
Adj. R2 0.521 0.521 0.515 0.515
48
Table 5 presents the regression results of testing the effects of CSR score and earning smoothness on Tobin’s Q
for our sample during 1993-2010. The regression is based on the model equation:
( ) ( )
where CSRScore stands for all five dimensions of CSR (ComScore, DivScore, EmpScore, EnvScore, and
ProScore), and Smoothness stands for either TAS (in Columns 2 and 4) or DAS (in Columns 1 and 3).All t-
statistics are calculated with two-way clustered standard errors by firm and by year. ***
, **
, and * denote the
regression coefficient is statistically significant at two-tailed 1%, 5%, and 10% level, respectively. Refer to
Appendix for variable descriptions. The dependent variable is Tobin’s Q for all four columns. CSRScore means
that the raw score of the five dimensions of CSR score (ComScore, DivScore, EmpScore, EnvScore, and
ProScore) are used in the regressions. Smoothness in the independent variable list includes two different
smoothing measures (TAS and DAS as noted below column numbers). For columns (1) and (2), we use raw CSR
component score individually. However, we use CSR dimensions dummy variables in columns (3) and (4),
where CSRHi equals 1 when a firm’s CSR component score is greater than the median (by year and SIC2
industry classification), 0, otherwise.
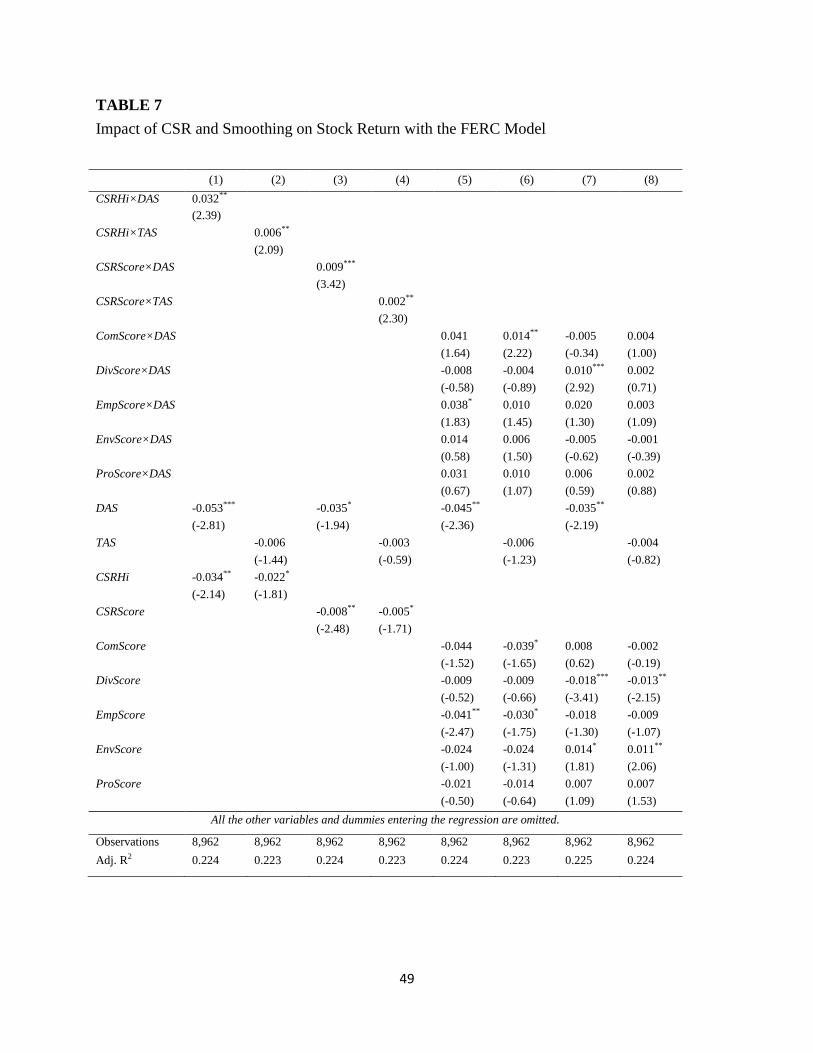
49
TABLE 7
Impact of CSR and Smoothing on Stock Return with the FERC Model
(1) (2) (3) (4) (5) (6) (7) (8)
CSRHi×DAS 0.032**
(2.39)
CSRHi×TAS 0.006**
(2.09)
CSRScore×DAS 0.009***
(3.42)
CSRScore×TAS 0.002**
(2.30)
ComScore×DAS 0.041 0.014** -0.005 0.004
(1.64) (2.22) (-0.34) (1.00)
DivScore×DAS -0.008 -0.004 0.010*** 0.002
(-0.58) (-0.89) (2.92) (0.71)
EmpScore×DAS 0.038* 0.010 0.020 0.003
(1.83) (1.45) (1.30) (1.09)
EnvScore×DAS 0.014 0.006 -0.005 -0.001
(0.58) (1.50) (-0.62) (-0.39)
ProScore×DAS 0.031 0.010 0.006 0.002
(0.67) (1.07) (0.59) (0.88)
DAS -0.053*** -0.035* -0.045** -0.035**
(-2.81) (-1.94) (-2.36) (-2.19)
TAS -0.006 -0.003 -0.006 -0.004
(-1.44) (-0.59) (-1.23) (-0.82)
CSRHi -0.034** -0.022*
(-2.14) (-1.81)
CSRScore -0.008** -0.005*
(-2.48) (-1.71)
ComScore -0.044 -0.039* 0.008 -0.002
(-1.52) (-1.65) (0.62) (-0.19)
DivScore -0.009 -0.009 -0.018*** -0.013**
(-0.52) (-0.66) (-3.41) (-2.15)
EmpScore -0.041** -0.030* -0.018 -0.009
(-2.47) (-1.75) (-1.30) (-1.07)
EnvScore -0.024 -0.024 0.014* 0.011**
(-1.00) (-1.31) (1.81) (2.06)
ProScore -0.021 -0.014 0.007 0.007
(-0.50) (-0.64) (1.09) (1.53)
All the other variables and dummies entering the regression are omitted.
Observations 8,962 8,962 8,962 8,962 8,962 8,962 8,962 8,962
Adj. R2 0.224 0.223 0.224 0.223 0.224 0.223 0.225 0.224
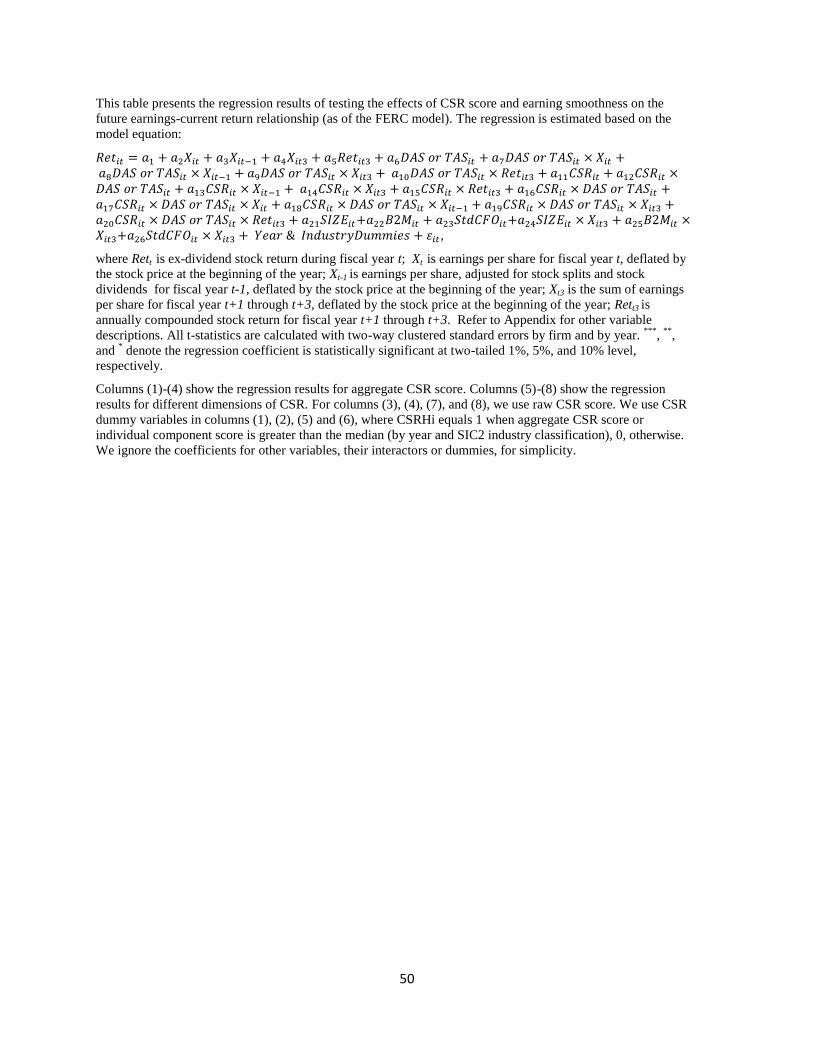
50
This table presents the regression results of testing the effects of CSR score and earning smoothness on the
future earnings-current return relationship (as of the FERC model). The regression is estimated based on the
model equation:
,
where Rett is ex-dividend stock return during fiscal year t; Xt is earnings per share for fiscal year t, deflated by
the stock price at the beginning of the year; Xt-1 is earnings per share, adjusted for stock splits and stock
dividends for fiscal year t-1, deflated by the stock price at the beginning of the year; Xt3 is the sum of earnings
per share for fiscal year t+1 through t+3, deflated by the stock price at the beginning of the year; Rett3 is
annually compounded stock return for fiscal year t+1 through t+3. Refer to Appendix for other variable
descriptions. All t-statistics are calculated with two-way clustered standard errors by firm and by year. ***
, **
,
and * denote the regression coefficient is statistically significant at two-tailed 1%, 5%, and 10% level,
respectively.
Columns (1)-(4) show the regression results for aggregate CSR score. Columns (5)-(8) show the regression
results for different dimensions of CSR. For columns (3), (4), (7), and (8), we use raw CSR score. We use CSR
dummy variables in columns (1), (2), (5) and (6), where CSRHi equals 1 when aggregate CSR score or
individual component score is greater than the median (by year and SIC2 industry classification), 0, otherwise.
We ignore the coefficients for other variables, their interactors or dummies, for simplicity.
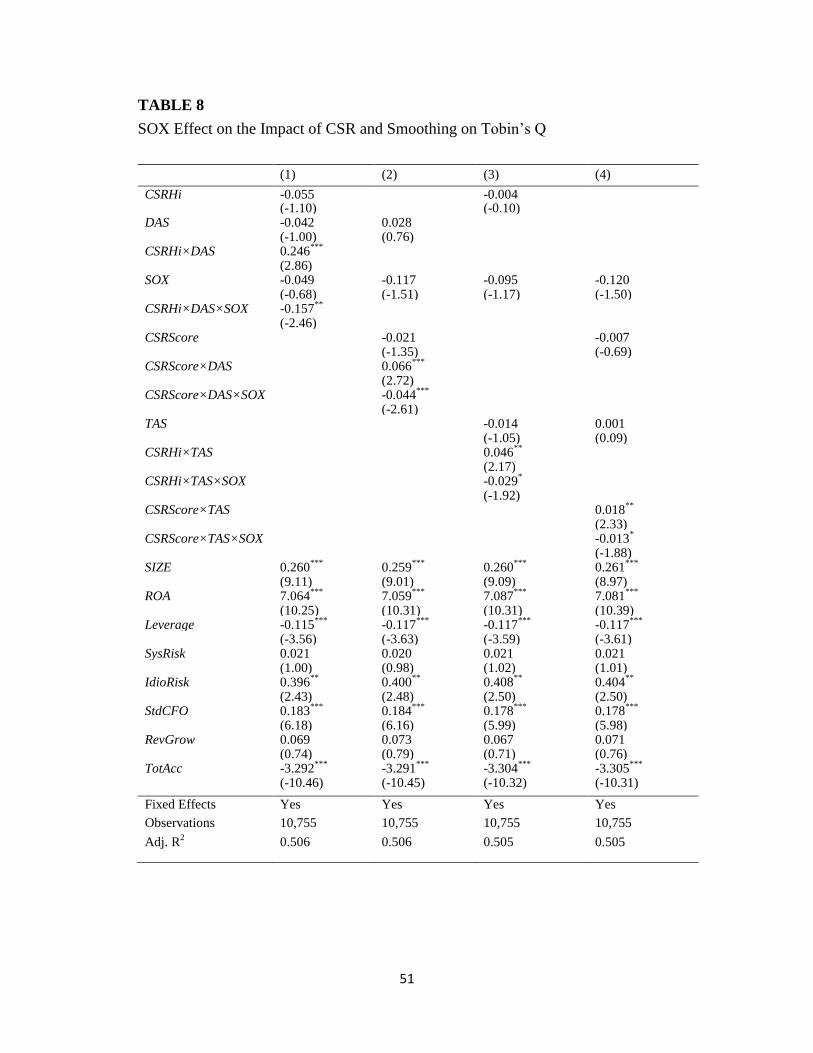
51
TABLE 8
SOX Effect on the Impact of CSR and Smoothing on Tobin’s Q
(1) (2) (3) (4)
CSRHi -0.055 -0.004 (-1.10) (-0.10) DAS -0.042 0.028 (-1.00) (0.76) CSRHi×DAS 0.246
***
(2.86) SOX -0.049 -0.117 -0.095 -0.120 (-0.68) (-1.51) (-1.17) (-1.50) CSRHi×DAS×SOX -0.157
**
(-2.46) CSRScore -0.021 -0.007 (-1.35) (-0.69) CSRScore×DAS 0.066
***
(2.72) CSRScore×DAS×SOX -0.044
***
(-2.61) TAS -0.014 0.001 (-1.05) (0.09) CSRHi×TAS 0.046
**
(2.17) CSRHi×TAS×SOX -0.029
*
(-1.92) CSRScore×TAS 0.018
**
(2.33) CSRScore×TAS×SOX -0.013
*
(-1.88) SIZE 0.260
*** 0.259
*** 0.260
*** 0.261
***
(9.11) (9.01) (9.09) (8.97) ROA 7.064
*** 7.059
*** 7.087
*** 7.081
***
(10.25) (10.31) (10.31) (10.39) Leverage -0.115
*** -0.117
*** -0.117
*** -0.117
***
(-3.56) (-3.63) (-3.59) (-3.61) SysRisk 0.021 0.020 0.021 0.021 (1.00) (0.98) (1.02) (1.01) IdioRisk 0.396
** 0.400
** 0.408
** 0.404
**
(2.43) (2.48) (2.50) (2.50) StdCFO 0.183
*** 0.184
*** 0.178
*** 0.178
***
(6.18) (6.16) (5.99) (5.98) RevGrow 0.069 0.073 0.067 0.071 (0.74) (0.79) (0.71) (0.76) TotAcc -3.292
*** -3.291
*** -3.304
*** -3.305
***
(-10.46) (-10.45) (-10.32) (-10.31)
Fixed Effects Yes Yes Yes Yes
Observations 10,755 10,755 10,755 10,755
Adj. R2 0.506 0.506 0.505 0.505
52
This table presents the regression results of CSR score and earning smoothness on Tobin’s Q with the
SOX Act effect. The regression is based on the model equation:
( ) ( ) ( ) ( ) ( ) ( ) .
All t-statistics are calculated with two-way clustered standard errors by firm and by year. ***
, **
, and *
denote the regression coefficient is statistically significant at two-tailed 1%, 5%, and 10% level,
respectively. Refer to Appendix for variable descriptions. We use DAS as an earning smoothing
measure in columns (1) and (2). For columns (3) and (4), we use TAS to substitute DAS. For columns
(2) and (4), we use raw CSR score. We use CSR dummy variable in columns (1) and (3), where CSRHi
equals 1 when CSR is greater than the median (by year and SIC2 industry classification), equals 0,
otherwise.