earnings update for q1'fy21 - zee
TRANSCRIPT
Earnings Update for Q1’FY21
Zee Entertainment Enterprises Limited – 18th August, 2020
1
Safe Harbor Statement
This Release/Communication, except for the historical information, may contain statements, including the words or phrases such as ‘expects, anticipates, intends, will, would, undertakes, aims, estimates, contemplates, seeks to, objective, goal, projects, should’ and similar expressions or variations of these expressions or negatives of these terms indicating future performance or results, financial or otherwise, which are forward looking statements. These forward looking statements are based on certain expectations, assumptions, anticipated developments and other factors which are not limited to, risk and uncertainties regarding fluctuations in earnings, market growth, intense competition and the pricing environment in the market, consumption level, ability to maintain and manage key customer relationship and supply chain sources and those factors which may affect our ability to implement business strategies successfully, namely changes in regulatory environments, political instability, change in international oil prices and input costs and new or changed priorities of the trade. The Company, therefore, cannot guarantee that the forward-looking statements made herein shall be realized. The Company, based on changes as stated above, may alter, amend, modify or make necessary corrective changes in any manner to any such forward looking statement contained herein or make written or oral forward looking statements as may be required from time to time on the basis of subsequent developments and events. The Company does not undertake any obligation to update forward looking statements that may be made from time to time by or on behalf of the Company to reflect the events or circumstances after the date hereof.
2
ZEE 4.0 in action
3
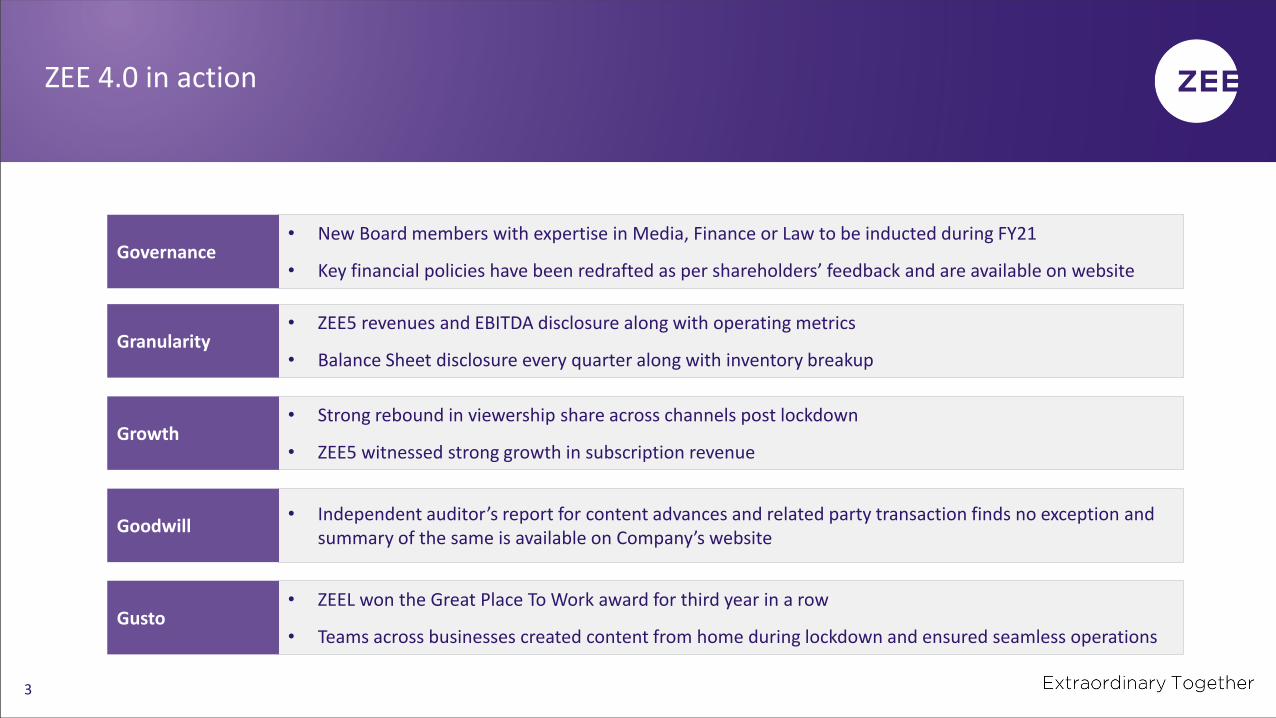
• New Board members with expertise in Media, Finance or Law to be inducted during FY21
• Key financial policies have been redrafted as per shareholders’ feedback and are available on websiteGovernance
• ZEE5 revenues and EBITDA disclosure along with operating metrics
• Balance Sheet disclosure every quarter along with inventory breakupGranularity
• Strong rebound in viewership share across channels post lockdown
• ZEE5 witnessed strong growth in subscription revenueGrowth
• Independent auditor’s report for content advances and related party transaction finds no exception and summary of the same is available on Company’s website
Goodwill
• ZEEL won the Great Place To Work award for third year in a row
• Teams across businesses created content from home during lockdown and ensured seamless operationsGusto
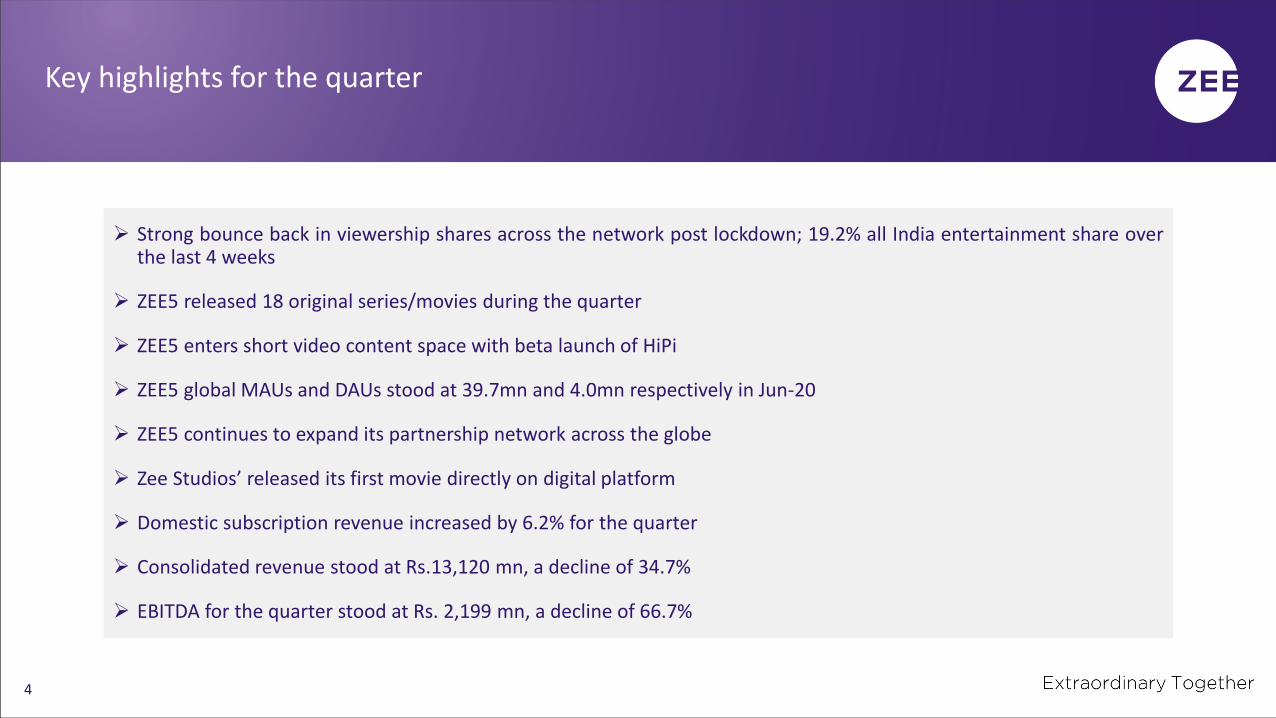
➢ Strong bounce back in viewership shares across the network post lockdown; 19.2% all India entertainment share overthe last 4 weeks
➢ ZEE5 released 18 original series/movies during the quarter
➢ ZEE5 enters short video content space with beta launch of HiPi
➢ ZEE5 global MAUs and DAUs stood at 39.7mn and 4.0mn respectively in Jun-20
➢ ZEE5 continues to expand its partnership network across the globe
➢ Zee Studios’ released its first movie directly on digital platform
➢ Domestic subscription revenue increased by 6.2% for the quarter
➢ Consolidated revenue stood at Rs.13,120 mn, a decline of 34.7%
➢ EBITDA for the quarter stood at Rs. 2,199 mn, a decline of 66.7%
Key highlights for the quarter
4

Business Performance
5
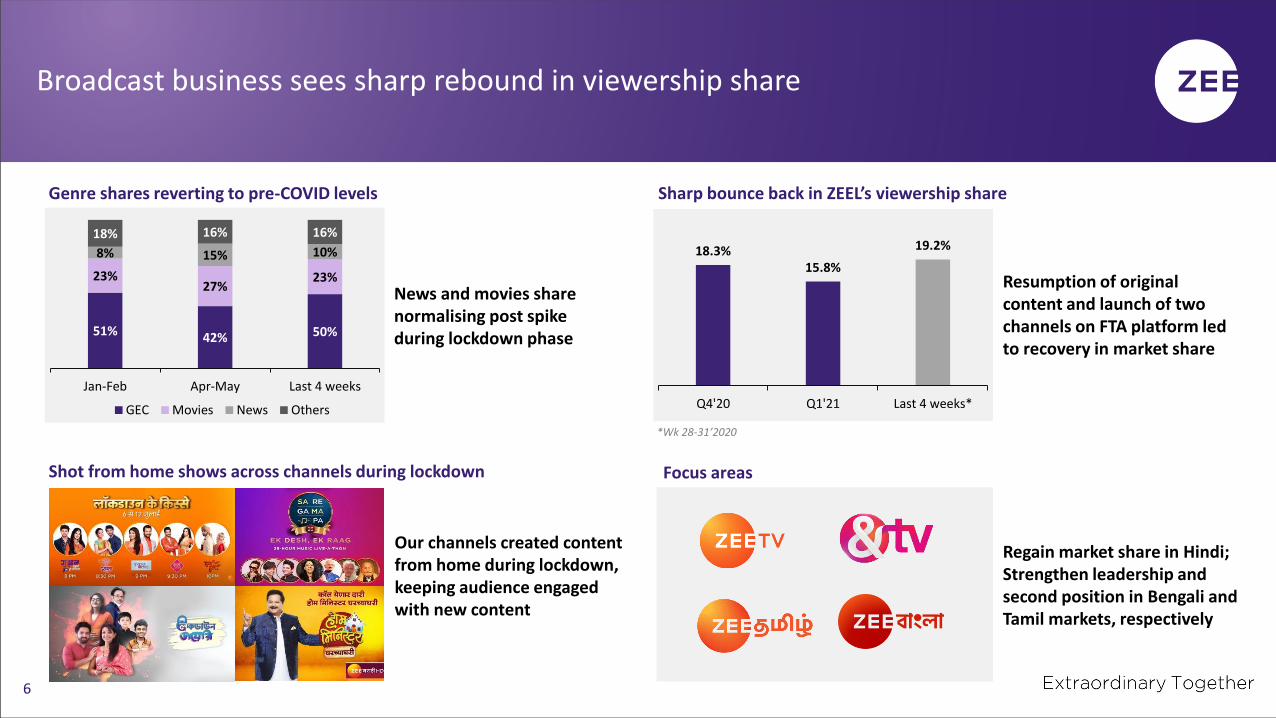
Broadcast business sees sharp rebound in viewership share
6
Resumption of original content and launch of two channels on FTA platform led to recovery in market share
Sharp bounce back in ZEEL’s viewership share
Shot from home shows across channels during lockdown
News and movies share normalising post spike during lockdown phase
Genre shares reverting to pre-COVID levels
51% 42% 50%
23%27%
23%
8% 15% 10%
18% 16% 16%
Jan-Feb Apr-May Last 4 weeks
GEC Movies News Others
18.3%15.8%
19.2%
Q4'20 Q1'21 Last 4 weeks*
Our channels created content from home during lockdown, keeping audience engaged with new content
Focus areas
Regain market share in Hindi; Strengthen leadership and second position in Bengali and Tamil markets, respectively
*Wk 28-31’2020

ZEE5 enters short-video space with beta launch of HiPi
HiPi launch to accelerate ZEE5 growth
18 original shows and movies released during the quarter
➢ 39.7 mn* global MAUs, 4.0 mn global DAUs in Jun’20
➢ 112 minutes average watch time per viewer per month in Jun’20
➢ Fall in metrics due to lack of original TV content during lockdown
➢ ZEE5 continues to expand its partnership network, globally
➢ Q1 Revenue and EBITDA# stand at Rs. 949 mn and Rs. (1,451) mn
*India MAU based on Comscore data, rest of the data based on internal data analytics#EBITDA loss excludes costs incurred by the business on ZEEL network
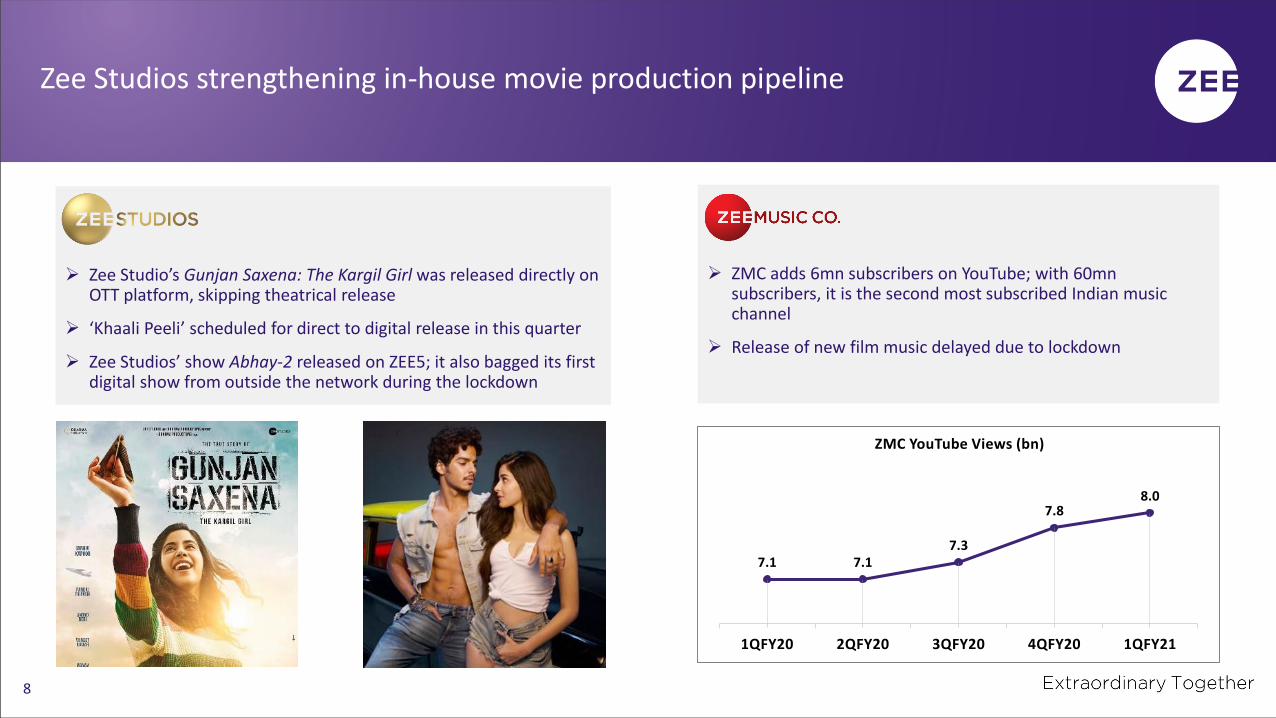
➢ ZMC adds 6mn subscribers on YouTube; with 60mn subscribers, it is the second most subscribed Indian music channel
➢ Release of new film music delayed due to lockdown
Zee Studios strengthening in-house movie production pipeline
➢ Zee Studio’s Gunjan Saxena: The Kargil Girl was released directly on OTT platform, skipping theatrical release
➢ ‘Khaali Peeli’ scheduled for direct to digital release in this quarter
➢ Zee Studios’ show Abhay-2 released on ZEE5; it also bagged its first digital show from outside the network during the lockdown
8
7.1 7.17.3
7.88.0
1QFY20 2QFY20 3QFY20 4QFY20 1QFY21
ZMC YouTube Views (bn)
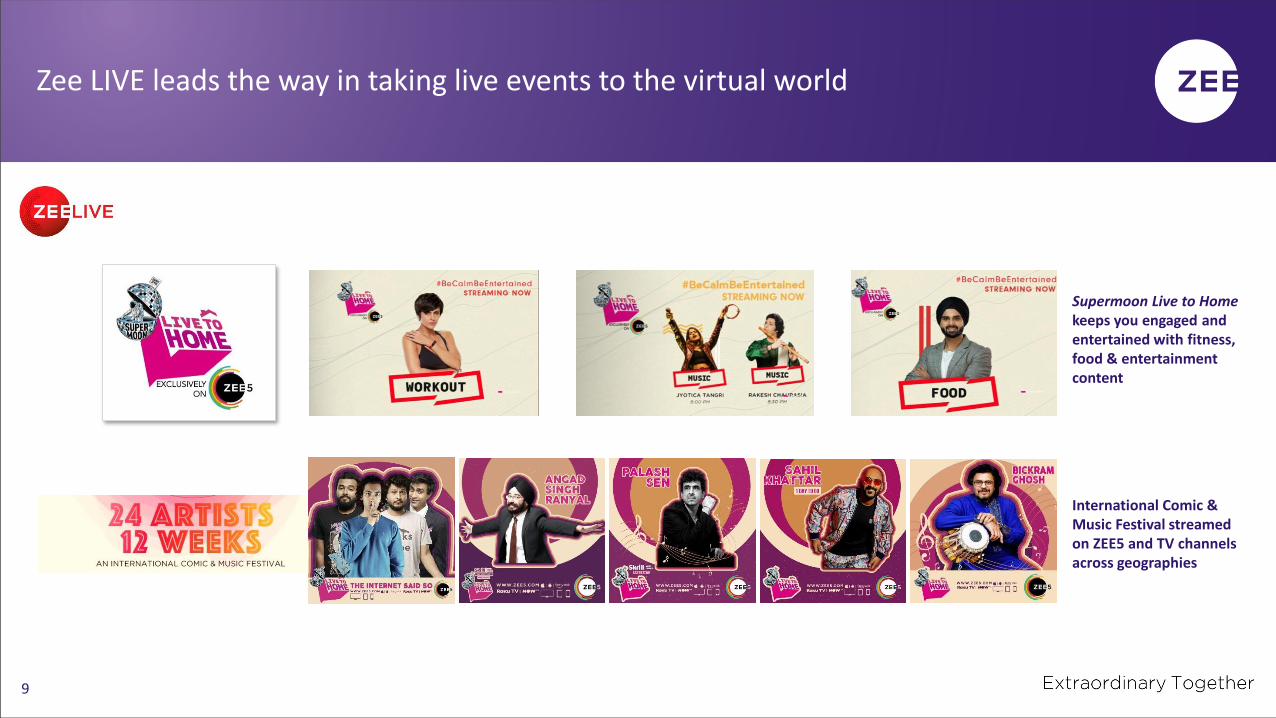
Zee LIVE leads the way in taking live events to the virtual world
9
International Comic & Music Festival streamed on ZEE5 and TV channels across geographies
Supermoon Live to Home keeps you engaged and entertained with fitness, food & entertainment content

Financial Performance
10
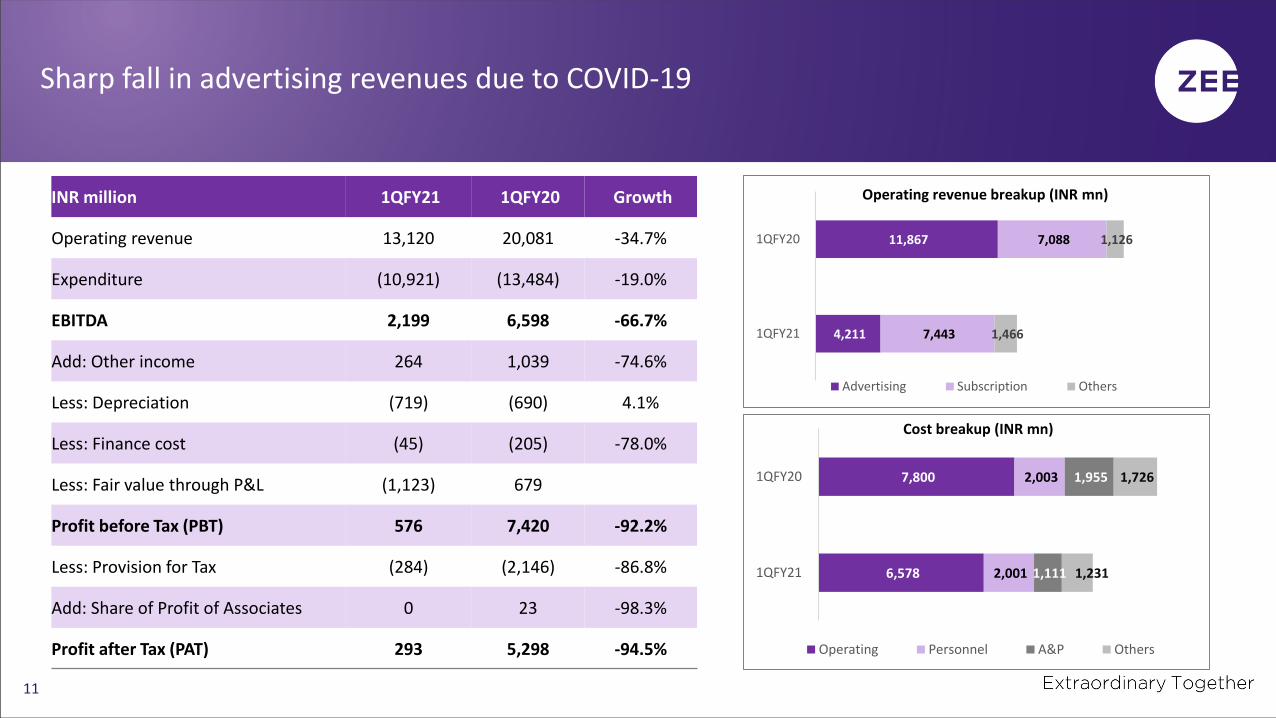
Sharp fall in advertising revenues due to COVID-19
11
INR million 1QFY21 1QFY20 Growth
Operating revenue 13,120 20,081 -34.7%
Expenditure (10,921) (13,484) -19.0%
EBITDA 2,199 6,598 -66.7%
Add: Other income 264 1,039 -74.6%
Less: Depreciation (719) (690) 4.1%
Less: Finance cost (45) (205) -78.0%
Less: Fair value through P&L (1,123) 679
Profit before Tax (PBT) 576 7,420 -92.2%
Less: Provision for Tax (284) (2,146) -86.8%
Add: Share of Profit of Associates 0 23 -98.3%
Profit after Tax (PAT) 293 5,298 -94.5%
4,211
11,867
7,443
7,088
1,466
1,126
1QFY21
1QFY20
Advertising Subscription Others
Operating revenue breakup (INR mn)
6,578
7,800
2,001
2,003
1,111
1,955
1,231
1,726
1QFY21
1QFY20
Operating Personnel A&P Others
Cost breakup (INR mn)
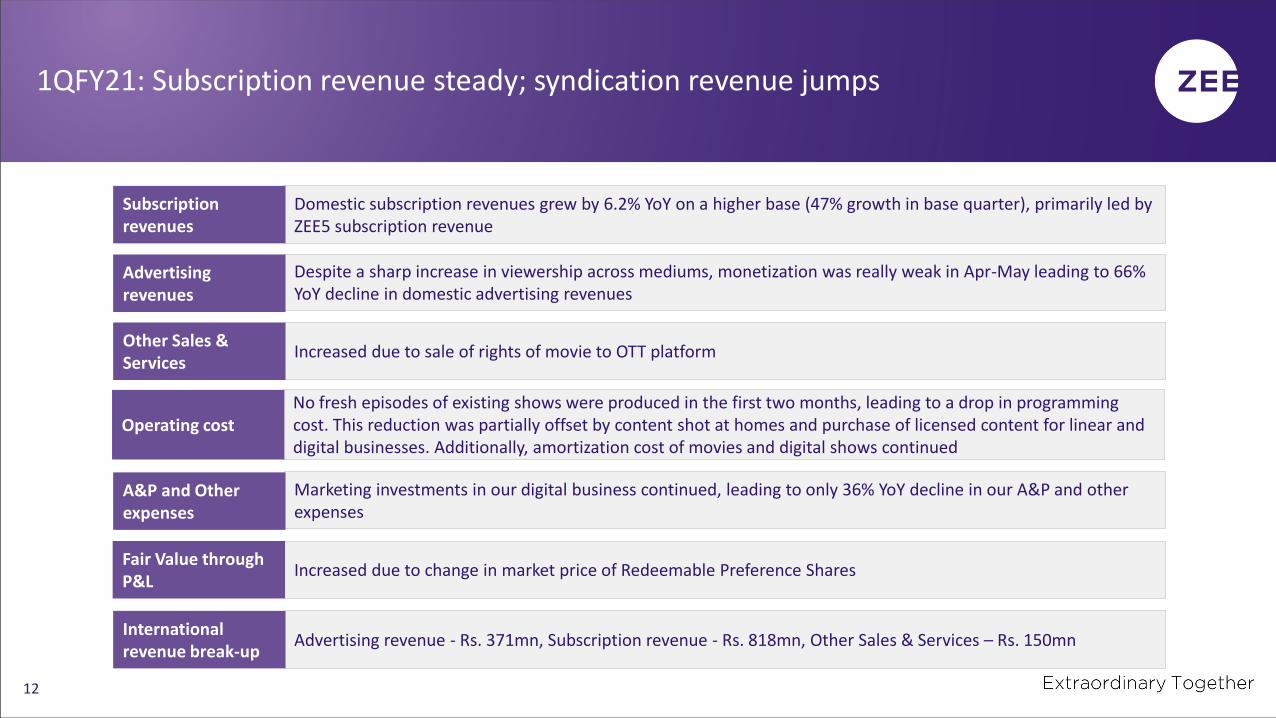
1QFY21: Subscription revenue steady; syndication revenue jumps
12
Domestic subscription revenues grew by 6.2% YoY on a higher base (47% growth in base quarter), primarily led by ZEE5 subscription revenue
No fresh episodes of existing shows were produced in the first two months, leading to a drop in programming cost. This reduction was partially offset by content shot at homes and purchase of licensed content for linear and digital businesses. Additionally, amortization cost of movies and digital shows continued
Subscriptionrevenues
Operating cost
Despite a sharp increase in viewership across mediums, monetization was really weak in Apr-May leading to 66% YoY decline in domestic advertising revenues
Advertising revenues
Increased due to sale of rights of movie to OTT platformOther Sales & Services
Marketing investments in our digital business continued, leading to only 36% YoY decline in our A&P and other expenses
A&P and Other expenses
Advertising revenue - Rs. 371mn, Subscription revenue - Rs. 818mn, Other Sales & Services – Rs. 150mnInternationalrevenue break-up
Increased due to change in market price of Redeemable Preference SharesFair Value through P&L
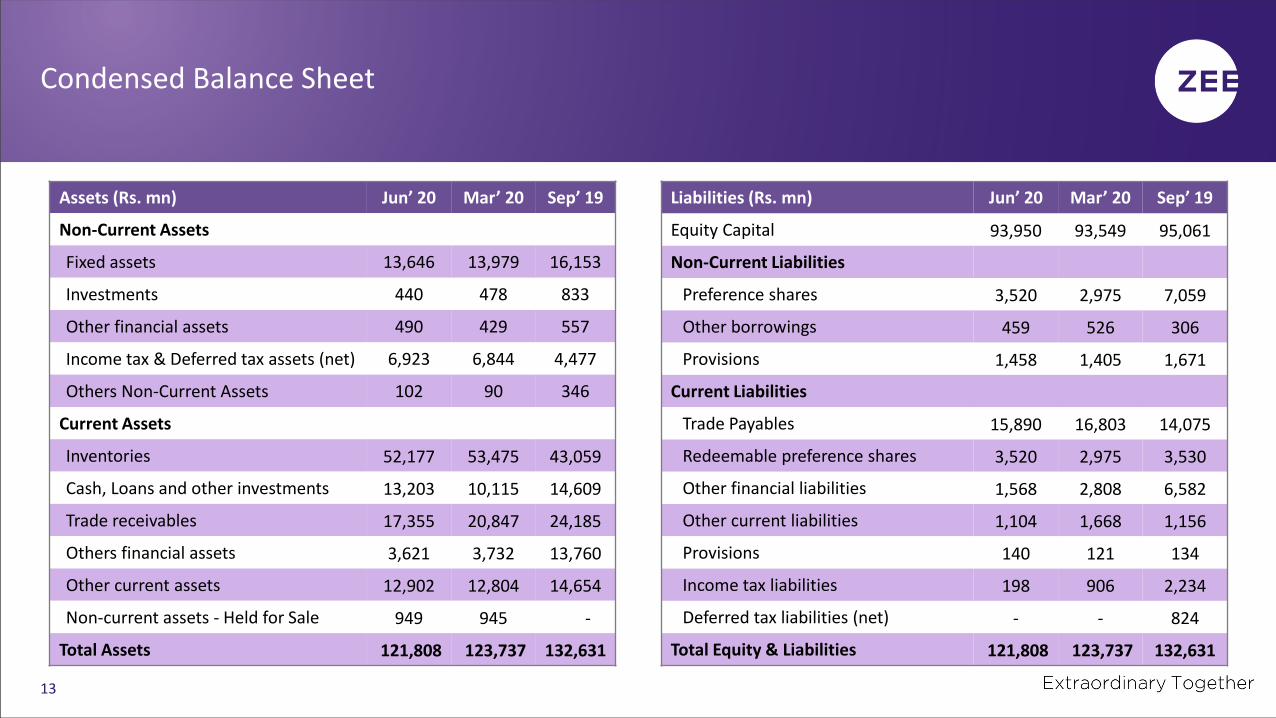
Condensed Balance Sheet
13
Assets (Rs. mn) Jun’ 20 Mar’ 20 Sep’ 19
Non-Current Assets
Fixed assets 13,646 13,979 16,153
Investments 440 478 833
Other financial assets 490 429 557
Income tax & Deferred tax assets (net) 6,923 6,844 4,477
Others Non-Current Assets 102 90 346
Current Assets
Inventories 52,177 53,475 43,059
Cash, Loans and other investments 13,203 10,115 14,609
Trade receivables 17,355 20,847 24,185
Others financial assets 3,621 3,732 13,760
Other current assets 12,902 12,804 14,654
Non-current assets - Held for Sale 949 945 -
Total Assets 121,808 123,737 132,631
Liabilities (Rs. mn) Jun’ 20 Mar’ 20 Sep’ 19
Equity Capital 93,950 93,549 95,061
Non-Current Liabilities
Preference shares 3,520 2,975 7,059
Other borrowings 459 526 306
Provisions 1,458 1,405 1,671
Current Liabilities
Trade Payables 15,890 16,803 14,075
Redeemable preference shares 3,520 2,975 3,530
Other financial liabilities 1,568 2,808 6,582
Other current liabilities 1,104 1,668 1,156
Provisions 140 121 134
Income tax liabilities 198 906 2,234
Deferred tax liabilities (net) - - 824
Total Equity & Liabilities 121,808 123,737 132,631
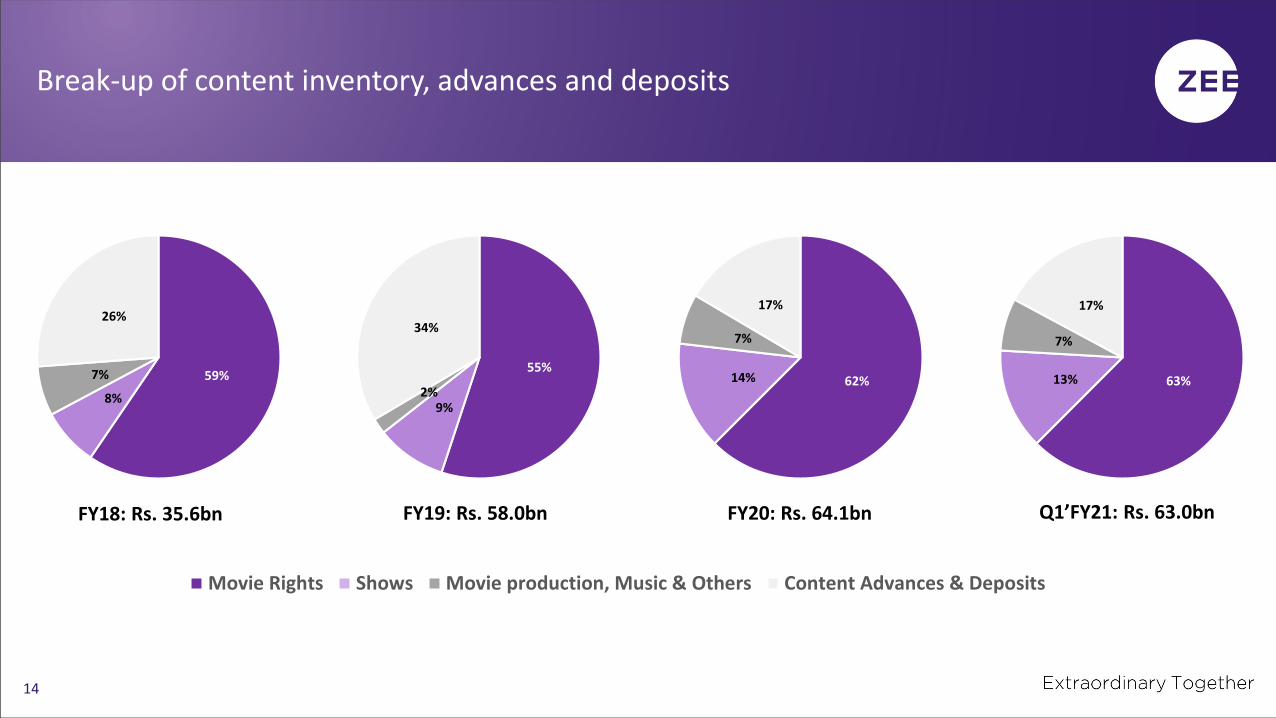
Break-up of content inventory, advances and deposits
14
FY18: Rs. 35.6bn FY19: Rs. 58.0bn FY20: Rs. 64.1bn Q1’FY21: Rs. 63.0bn
Movie Rights Shows Movie production, Music & Others Content Advances & Deposits
59%
8%
7%
26%
62%14%
7%
17%
63%13%
7%
17%
55%
9%2%
34%

15