earnings volatility, cash flow volatility and informed trading
TRANSCRIPT

Earnings Volatility, Cash Flow Volatility, and Informed Trading
Sudarshan Jayaraman Olin School of Business
Washington University in St. Louis Campus Box 1133
One Brookings Drive St. Louis, MO 63130
August 2007
Abstract
I examine whether earnings that are smoother or more volatile than cash flows provide or garble information. Consistent with theories that predict more informed trading when public information is less informative, I find that bid-ask spreads and the probability of informed trading are higher both when earnings are smoother than cash flows and also when earnings are more volatile than cash flows. Additional tests suggest that managers’ discretionary choices that lead to smoother or more volatile earnings than cash flows garble information, on average. However, I find that informed trading is attenuated in settings in which theory suggests that discretionary smoothing or volatizing of earnings is likely to be informative.
This paper is based on my doctoral dissertation at the University of North Carolina at Chapel Hill. I am indebted to my committee members Robert Bushman, Wayne Landsman, Mark Lang, and Gunter Strobl, and especially to my dissertation chairman, Jeffery Abarbanell. I also appreciate helpful comments from Phil Berger (editor), an anonymous referee, Donal Byard, Hemang Desai, Scott Dyreng, Richard Frankel, John Hand, Doug Hanna, Chris Petrovits, Jana Raedy, Kartik Raman, Steve Stubben, Anjan Thakor, Kumar Venkataraman, S. Viswanathan, Wendy Wilson, and workshop participants at Baruch College, Southern Methodist University, the University of North Carolina at Chapel Hill, and Washington University in St. Louis. I am grateful to Joel Hasbrouck and Soeren Hvidkjaer for sharing their data with me.

Earnings Volatility, Cash Flow Volatility, and Informed Trading
1. Introduction
In this paper I investigate whether earnings that are smoother or more volatile than cash
flows provide or garble information for market participants. It is well understood that accounting
rules such as the required matching of expenses and revenues are designed to smooth out
fluctuations in cash flows and present a smooth stream of earnings (e.g., Dechow [1994]). Other
accounting conventions, such as conservatism, and the inherent difficulty in predicting future
cash flows can result in earnings that are more volatile than cash flows (e.g., Basu [1997],
Dechow and Dichev [2002]). On the other hand, it is possible that earnings that are smoother
than cash flows result from managers’ proactive discretionary choices, such as income
smoothing (e.g., Leuz et al. [2003], Levitt [1998], Kirschenheiter and Melumad [2002], Arya et
al. [2003]), while earnings that are more volatile than cash flows may result from discretionary
choices such as “big baths” and timely loss recognition (e.g., Kirschenheiter and Melumad
[2002], Givoly and Hayn [2000], Ball and Shivakumar [2006], Turner [2001], Riedl [2004]).
Thus, earnings that are either smoother or more volatile than cash flows may be due to either the
neutral application of accounting rules and conventions or to proactive discretionary choices, or
both. Regardless of the underlying reason for smoother or more volatile earnings, an empirical
question arises whether these outcomes either provide or garble information.
I refer to the difference between the volatility of earnings and the volatility of cash flows
as the accrual component of earnings volatility (ACEV). Using bid-ask spreads and the
probability of informed trading as proxies for informed trading, I find that when earnings are
smoother than cash flows (i.e., for negative values of the accrual component), there is, on
average, more informed trading. Similarly, when earnings are more volatile than cash flows (i.e.,
1

for positive values of the accrual component), there is, on average, more informed trading. These
results suggest that earnings that are smoother or more volatile than cash flows garble
information and thus attract informed traders. Because earnings volatility can differ from cash
flow volatility either because of accounting conventions or due to proactive period-by-period
managerial discretion, I perform additional tests to parse out the individual effects of neutral
application and proactive discretion.
To establish my hypotheses, I rely on theories from information economics that link the
informativeness of public information to informed trading (e.g., Grossman and Stiglitz [1980],
Verrecchia [1982], Diamond [1985], Easley and O’Hara [2004], Baiman and Verrecchia [1996]).
These theories predict that the informational advantage of informed traders, and therefore the
level of informed trading, is inversely related to the informativeness of public disclosure.1
Following prior research in market microstructure, I use bid-ask spreads and the probability of
informed trading as proxies for the level of informed trading. According to the above theories, if
earnings that are smoother or more volatile than cash flows provide information, then these
reporting outcomes would be associated with lower bid-ask spreads and lower probabilities of
informed trading. On the other hand, if earnings that are smoother or more volatile than cash
flows garble information, then these reporting outcomes would be associated with higher bid-ask
spreads and higher probabilities of informed trading.2 Alternatively, it is possible that these
reporting outcomes are unrelated to informed trading.3
1 I use the term public disclosure to correspond to the notion of disclosure in the analytical literature. Following Kim and Verrecchia [1994, pp. 43], I use the phrase provide information to indicate “public disclosure that ameliorates the adverse selection problem by partially or fully revealing to market makers information known by informed traders.” Similarly, I use garble information to indicate public disclosures that “stimulate informed judgments among traders who process public disclosure into private information. The ability of information processors to produce superior assessments of a firm’s performance on the basis of an earnings announcement provides them with a comparative information advantage over market makers (pp, 44).” 2 It is possible that earnings that are smoother or more volatile than cash flows provide information but are associated with more informed trading because public and private information are complements. Lundholm [1998]
2

Volatility of earnings is defined in this paper as the variance of five years’ earnings
before extraordinary items, scaled by assets, and the volatility of cash flows as the variance of
five years’ annual cash flow from operations, scaled by assets. I use the difference between
these two volatility measures, which is the accrual component or ACEV, to classify earnings as to
whether they are smoother or more volatile than cash flows. Negative (positive) values of the
accrual component indicate earnings that are smoother (more volatile) than cash flows.4
The empirical results indicate that higher levels of informed trading are associated with
more negative values of the accrual component (i.e., earnings smoother than cash flows).
Further, higher informed trading is also associated with more positive values of the accrual
component (i.e., earnings more volatile than cash flows). Informed trading is the lowest when the
accrual component is close to zero (i.e., earnings volatility similar to cash flow volatility). The
relation between the accrual component and informed trading is robust in a multivariate
regression that includes controls for firm size, turnover, illiquidity, and the inverse of stock price.
Having established the overall relation between informed trading and the accrual
component of earnings volatility, I next examine the role of proactive discretion in the relation and Manzano [1999] consider correlated public and private signals, while Indjejikian [1991] considers correlated private signals. Alles and Lundholm [1993] present a general representation of the asset payoff and information structures and derive predictions based on modifications to the underlying structures. Substitutability versus complementarity of public and private signals also depends on whether the private signal is about the asset payoff or the public signal (Verrecchia [2001]). Although I perform additional tests to investigate the possibility of complementarity, I cannot conclusively rule out this interpretation. 3 Prior studies have generally used associations with contemporaneous or future stock prices/returns (value-relevance) to assess informativeness of reporting outcomes. While contemporaneous association-based studies might be intuitively appealing, they face the problem of correlated omitted variables, because these studies do not account directly for the mechanism through which information is impounded in stock prices. That is, do earnings that are smoother or more volatile than cash flows provide information and directly impound information into stock prices, or do they garble information and thus attract informed traders who impound the private information into stock prices through informed trading? A related limitation of future stock price/returns–based associations is that they do not address the reasons that the ability of current earnings to predict future stock prices/returns is not arbitraged away. Informed trading, on the other hand, is based on informativeness of public information and does not rely on associations with future realizations. 4 The characterization of earnings that are either smoother or more volatile than cash flows as the difference between earnings volatility and cash flow volatility (i.e., the second moment) is in the spirit of prior studies that characterize accruals as the difference between earnings and cash flows (i.e., the first moment). In subsequent sections, I discuss the robustness of my results to alternate measures currently used in the literature.
3

between informed trading and the accrual component. Studies in the accounting literature have
allowed for the possibility that proactive discretion in the reporting process is aimed at either
providing or garbling information. In a recent survey of more than 400 corporate executives,
Graham et al. [2005] find that an overwhelming majority of CFOs (97%) prefer to report smooth
earnings, holding cash flows constant. The main reasons offered by survey participants for their
preference for smooth earnings are the perception of lower risk, the lower cost of equity and
debt, and improved earnings predictability by analysts. Prior research has not reached a
consensus on whether income smoothing either provides or garbles information for equity
market participants. While some researchers (e.g., Arya et al. [2003], Sankar and Subramanyam
[2001], and Demski [1998]) argue that income smoothing is informative, other studies,
regulators, and anecdotal evidence (e.g., Leuz et al. [2003], Levitt [1998], Lang et al. [2003],
Bhattacharya et al. [2003], LaFond et al. [2007], and Barth et al. [2006]) suggest that income
smoothing is an act of earnings management that garbles information.
There is also no consensus in the literature on whether proactive discretionary choices
that make earnings more volatile than cash flows reveal or garble information. While some
researchers argue that big baths and timely loss recognition can be informative (Kirschenheiter
and Melumad [2002], Basu [1997], Givoly and Hayn [2000], Ball and Shivakumar [2006]), other
studies and regulators contend that such reporting choices reflect opportunistic behavior and can
distort the information in earnings (Turner [2001], Riedl [2004]).
I perform three tests to examine the role of proactive discretion in the relation between
informed trading and the accrual component. First, I control for the effect of neutral application
by including industry fixed effects to capture constant accounting rules and by incorporating
additional controls such as leverage, market-to-book ratio, firm age, institutional ownership,
4

analyst following, and cash flow volatility. As prior research (e.g., Dechow and Dichev [2002])
has shown that the accrual component is more likely to occur due to neutral application in firms
with high cash flow volatility, I also include an interaction term of the accrual component with
cash flow volatility. I find that the relation between the (stand-alone) accrual component and
informed trading persists, consistent with the argument that proactive discretion contributes, on
average, to the garbling of information and an increase in the level of informed trading.
Second, I use standard discretionary accrual models (Dechow et al. [1995]) to decompose
the accrual component of earnings volatility into nondiscretionary and discretionary components.
I find that the discretionary component is associated with higher informed trading. In contrast,
the nondiscretionary component is generally insignificant.
Third, I examine a situation in which theory suggests that proactive discretionary choices
are likely to be informative. Exploiting the analysis of Kirschenheiter and Melumad [2002], in
which big baths taken during periods of extremely poor performance and income smoothing
during periods of extremely good performance perfectly reveal underlying cash flows, I
investigate the relation between the accrual component and informed trading during periods of
extreme performance. Consistent with their theory, I find that the relation between the magnitude
of the accrual component and informed trading is attenuated during these periods, suggesting that
proactive discretion does not always garble information and may in fact be informative when
performance is extremely good or bad.
Because some theories argue that characteristics of the reporting environment and private
information markets evolve endogenously as part of an overall equilibrium and are expected to
be stable, I conduct additional tests to determine whether realization of the accrual component in
every period affects informed trading. Results show that the most recent accrual component is
5

positively associated with the following year’s informed trading after contemporaneous (i.e., this
year’s) informed trading is controlled for. This suggests that realizations of the accrual
component in a given year can affect the level of informed trading in future years.5
Two additional tests explore how changes in the accrual component affect changes in
bid-ask spreads. I compute changes from small magnitudes to more negative values of the
accrual component (smoother earnings) and to more positive values of the accrual component
(more volatile earnings) and examine the relation between these changes and (i) future annual
bid-ask spreads and (ii) earnings announcement (short-window) bid-ask spreads with controls for
contemporaneous bid-ask spreads. Results indicate that changes in the accrual component from
small magnitudes to more negative values and to more positive values are associated with higher
incremental future annual spreads. In the case of the short-window test, changes from small
magnitudes to more positive values are associated with larger incremental announcement
spreads, whereas the relation between changes from small magnitudes to more negative values is
insignificantly associated with incremental announcement spreads. On balance, these results
suggest that the increase in informed trading for these firms occurs subsequent to the earnings
announcement period. I also find that when the accrual component does not change, there is no
change in bid-ask spreads.
While the higher level of informed trading is consistent with a greater informational
advantage for all informed traders, there is one group that deserves special attention—insiders.
Insiders are a subset of the group of informed traders who are endowed with private information
due to their strategic association with the firm. In order to assess whether the relation between
the accrual component and informed trading is driven by insider trading, I include the level of
5 The implicit inference is that changes in the accrual component are associated with changes in bid-ask spreads. In subsequent tests, I explicitly explore changes in the accrual component and in bid-ask spreads.
6

insider sales and purchases as an additional explanatory variable. Results show that the higher
level of informed trading is due to informed traders external to the firm and not merely insiders.6
This paper provides three contributions to the earnings informativeness literature. First, it
uses theories from information economics to investigate whether earnings that are smoother or
more volatile than cash flows either provide or garble information. Second, by examining the
relation between informed trading and managerial discretion, it provides evidence regarding
whether reporting choices such as income smoothing and big baths are informative or whether
they garble information. Finally, this study also contributes to the market microstructure
literature by elucidating the mechanism through which reporting outcomes impound information
into stock prices.
The rest of the paper is organized as follows. Section 2 presents the hypothesis
development, followed by the research design in section 3. In section 4 I describe the primary
results, and in section 5 I report the results of tests exploring the individual effects of proactive
managerial discretion and the influence of accounting rules. Section 6 investigates a number of
extensions and robustness tests, and section 7 concludes.
2. Hypothesis development
Theories of endogenous information acquisition hold that the incentives to acquire
private information are inversely related to the informativeness of public information (Grossman
and Stiglitz [1980], Verrecchia [1982], Diamond [1985]). Further, theories argue that incentives
to exploit existing private information are also inversely related to the informativeness of public
6 Aboody et al. [2005] find that firms with low earnings quality have high levels of insider trading. Similarly, Frankel and Li [2004] find more insider trading in firms whose financial statements are less value-relevant. To the extent that more informed trading is associated with the accrual component, earnings affected by the accrual component can be considered, on average, to be of “low quality.”
7

information (Baiman and Verrecchia [1996], Easley and O’Hara [2004]). The relation between
informed trading and earnings that are smoother or more volatile than cash flows depends on the
extent to which the reporting outcomes either provide or garble information.
2.1. Earnings that are smoother than cash flows
The preference of financial markets for smooth earnings is evident from a recent survey
of corporate executives by Graham et al. [2005], who find that approximately 97% of
respondents prefer to report smooth earnings, holding cash flows constant. The results of this
study are suggestive, but they do not directly address the empirical question of how investors
interpret smoother earnings.7
Prior academic research has not reached a theoretical or empirical consensus on whether
earnings that are smoother than cash flows provide or, rather, garble information. For example,
Arya et al. [2003] argue that by smoothing earnings, managers remove the transient portion of
earnings and communicate the permanent portion, thereby enabling equity markets to arrive at an
efficient estimate of the firm’s stock price. Chaney and Lewis [1995] argue that income
smoothing plays an informational role, as it is high-valued, rather than low-valued, firms that
smooth income. In Sankar and Subramanyam [2001], a risk-averse manager smooths reported
earnings to smooth his consumption, revealing his private information about future earnings in
doing so. A similar idea is developed in Demski [1998], who suggests that a hard-working
manager is able to better predict future earnings, which will enable her to smooth reported
earnings. On the other hand, other studies find that choices such as income smoothing are acts of
7 Some prior studies (e.g., Dechow [1994]) have emphasized how the neutral application of accounting rules such as the matching of expenses and revenues naturally leads to accruals smoothing out fluctuations in cash flows. Similarly, earnings can be smoother than cash flows due to the exercise of proactive discretion in the form of income smoothing, where managers purposefully make reported earnings smoother than cash flows in every period.
8
earnings management that garble information. For example, Leuz et al. [2003] find that
managers in economies with more private benefits of control use income smoothing to conceal
firm performance from outsiders. Other studies find that firms that cross-list in better investor-
protection regimes or adopt international accounting standards indulge in less income smoothing
(Lang et al. [2003], Barth et al. [2006]).
2.2. Earnings that are more volatile than cash flows
There is also no consensus in the literature regarding whether earnings that are more
volatile than cash flows either provide or garble information. These reporting outcomes could be
due to neutral application of accounting rules and conventions such as conservatism (Basu
[1997]) and the inherent difficulty of predicting future cash flows (Dechow and Dichev [2002])
or to proactive discretion such as big baths (Kirschenheiter and Melumad [2002]), timely loss
recognition (Givoly and Hayn [2000], Ball and Shivakumar [2006]), and choices that entail
increasing and then reversing earnings without a corresponding change in cash flows. While
some studies argue that earnings that are more volatile than cash flows reveal private information
(Kirschenheiter and Melumad [2002], Basu [1997], Givoly and Hayn [2000], Ball and
Shivakumar [2006]), other studies find that these more volatile earnings do not reveal private
information, but rather reflect opportunistic behavior (Turner [2001], Riedl [2004]).
2.3. Hypothesis
If earnings that are smoother than cash flows provide information, they will be associated
with less informed trading, because private information has been publicly revealed. Similarly, if
earnings that are more volatile than cash flows provide information, they will also be associated
9

with less informed trading. Thus, in this case, I expect an inverted-U-shaped relation to obtain
between earnings that are smoother or more volatile than cash flows and informed trading.
On the other hand, if earnings that are smoother or more volatile than cash flows garble
information, they will be associated with more informed trading. In such a case, I expect a U-
shaped relation to obtain between earnings that are smoother or more volatile than cash flows
and informed trading. My two-sided hypothesis therefore is as follows:
H1 (a): There is an inverted-U-shaped relation between earnings that are smoother or more volatile than cash flows and informed trading.
H1 (b): There is a U-shaped relation between earnings that are smoother or more volatile
than cash flows and informed trading.
3. Research design
3.1. Accrual component of earnings volatility (ACEV)
To measure the degree to which earnings are smoother or more volatile than cash flows, I
use the difference between earnings volatility and cash flow volatility. I begin with the standard
definition of earnings:
tititi ACCFE ,,, +=
where Ei,t is earnings for firm i in year t; CFi,t is cash flows for firm i in year t; and ACi,t is
accruals for firm i in year t. The variance of earnings is given by
)1(),(2)()()( ,,,,, tititititi ACCFCovACVarCFVarEVar ++=
I define the accrual component of earnings volatility (ACEV) as
, , , ,( ) 2 ( , ) (i t i t i t i tACEV Var AC Cov CF AC= + 2)
)
Replacing in (1),
, , ,( ) ( ) (3i t i t i tACEV Var E Var CF= −
10

ACEV captures the difference between earnings volatility and cash flow volatility. This
characterization (i.e., the second moment) is in the spirit of prior studies that represent accruals
as the difference between earnings and cash flows (i.e., the first moment).
The advantage of ACEV is that it captures the combined effect of the cash flow–accrual
covariance (Cov (CF,AC)) and the variance of accruals (Var (AC)) to represent a comprehensive
measure of income smoothing (Gu [2005] also makes a similar argument). It is clear from
equation (1) that neither Cov (CF,AC) nor Var (AC) in isolation can determine whether earnings
are smoother or more volatile than cash flows. In additional tests reported in section 6.3, I
illustrate how the use of existing proxies of income smoothing such as the ratio of earnings
volatility to cash flow volatility might lead to problematic inferences.
The variance of five years’ annual earnings before extraordinary items, scaled by assets
(EARNINGS_VOL) is the proxy for earnings volatility, or Var(E). The proxy for the volatility of
cash flows, Var (CF), is the variance of five years’ operating cash flows, scaled by assets
(CFO_VOL).8 Equation (3) shows that when ACEV = 0, earnings volatility equals cash flow
volatility [i.e., Var (E) = Var (CF)]. When ACEV < 0, earnings are smoother than cash flows.
When ACEV > 0, earnings are more volatile than cash flows. These scenarios are depicted in
figure 1.
<< Insert figure 1 about here >>
The SMOOTH regime comprises earnings that are smoother than cash flows. The
VOLATILE regime comprises earnings that are more volatile than cash flows. The horizontal line
(ACEV = 0) represents the instances in which earnings volatility equals cash flow volatility.
8 Results based on standard deviations of these variables are similar.
11

3.2. Proxies for informed trading
The proxies I use to measure informed trading are the bid-ask spread (SPREAD) and the
probability of informed trading (PIN).
3.2.1. Bid-ask spread (SPREAD)
The relation between the extent of informed trading and bid-ask spreads was first
discussed in Bagehot [1971]. Bagehot argues that market makers trade with two kinds of
traders—informed and uninformed. While the market maker loses to informed traders, he
recoups these losses from uninformed traders by increasing the bid-ask spread. Thus, a high level
of informed trading leads to higher bid-ask spreads. Bagehot’s intuition has been subsequently
modeled by Copeland and Galai [1983], Kyle [1985], and Glosten and Milgrom [1985].
There are many measures of bid-ask spreads commonly used in the literature. However,
Hasbrouck [2005] finds a high degree of correlation (above 0.9) among these alternate measures.
Since CRSP-based measures are available for a large sample of firms and over a long time
period, I use them for my primary results. However, my results are robust to the alternate bid-ask
spread measure of Hasbrouck [2005]. Following Amihud and Mendelson [1986], I define
SPREAD as the annual relative bid-ask spread using daily closing bids and asks.9 Specifically,
,
,1,
( )1 ( 4 )( ) / 2
i tDi i
i ti t i i
A S K B IDS P R E A DD A S K B ID
−=
+∑
where Di,t is the number of days in year t for firm i for which closing daily bids (BIDi) and
closing daily asks (ASKi) are available.
9 Results are identical when I use the effective spread, defined by Stoll [2000] as the bid-ask spread scaled by price.
12

3.2.2. Probability of informed trading (PIN)
Easley and O’Hara [1992] and Easley et al. [1996, 1997], use a market-microstructure
framework to construct a measure of the probability of informed trading (PIN) using trade data.
The underlying parameters—the arrival rates of informed and uninformed traders and the
probability of an information event—determine the likelihood that the market maker will transact
with an informed investor. The higher the ratio of informed to uninformed investors, the higher
the PIN. Easley et al. [2002] and Easley and O’Hara [2004] argue that PIN captures information
risk (the market maker’s probability of trading with an informed trader) and depends on the mix
of public versus private information. I use the probability of informed trading as a second proxy
for the level of informed trading. PIN is more comprehensive than the extent of insider trading,
because it incorporates trading by all kinds of informed traders, both insiders endowed with
private information and private-information arbitrageurs who acquire private information at a
cost. Because theories state that anyone who has expended resources and gathered private
information (or who is endowed with private information due to his/her association with the
firm) is an informed trader, the definition of an informed trader is not necessarily restricted to
either large institutions or to information intermediaries.
3.3. Sample
As bid-ask spreads are available for a large number of firms and for a longer time period
than PIN, I employ two distinct samples in the study, the SPREAD sample and the PIN sample.10
The SPREAD sample is obtained from the combined CRSP and Compustat tapes and consists of
69,218 firm-year observations from 10,245 firms in the nonregulated and nonfinancial services
industries for the period 1988–2005. The year 1988 was selected as the first year for the sample 10 Results are robust to a common sample containing both SPREAD and PIN data.
13

because cash flow variables are available beginning only in 1987.11 The PIN sample is obtained
from Easley et al. [2002]12 and comprises 18,625 firm-year observations for 2,817 firms for the
period 1988–2001.13
For each fiscal year-end t, ACEV is defined as of the end of year t, while informed trading
(SPREAD and PIN) is measured as of year t + 1. The control variables employed in the
multivariate regressions are measured as of the end of year t. For example, in the year 2000, for a
firm with a December year-end, ACEV and the control variables are measured as of December
31, 2000, while SPREAD and PIN are measured as of December 31, 2001. For firms with a non-
December fiscal year-end, for instance, June 30, 2000, ACEV and the control variables are
measured as of June 30, 2000, and SPREAD and PIN are measured as of Dec 31, 2001.14 In
appendix 1 I present a timeline for the measurement of the variables.
The primary variables are ACEV, SPREAD, and PIN. The mean ACEV is 0.01, while the
median is −0.0001. Computing ACEV based on standard deviations (instead of variances) and
imposing similar restrictions on the data as in Gu [2005] yields a median ACEV of −0.005, which
compares closely with Gu’s median value of −0.007 (not tabulated). The mean (median)
SPREAD is 4% (2%), which is similar to that reported in prior studies.15 When the sample is
restricted to 1983–1998, the (unwinsorized) mean PIN is 0.19, which is similar to the 0.191
11 Although ACEV is based on the variance of five annual observations, those based on two observations or more (equivalent to earnings changes) are retained. None of my inferences is altered when the sample is restricted to ACEV based on five historical observations. 12 http://www.smith.umd.edu/faculty/hvidkjaer/ 13 The last year for the PIN sample is 2001 because of the difficulty of estimating the parameters of the estimation model when trading intensity is very high. See Easley et al. [2004, n. 5, p. 7]. 14 The PIN parameters in Easley et al. [2002] are estimated using the calendar year. I use the calendar year for SPREAD to maintain consistency across the informed trading proxies. Although December year-end firms comprise the majority of my sample (about 60%), I perform some sensitivity checks to ensure robustness of my results. In Section 6.1, I use bid-ask spreads around earnings announcement dates and find consistent results. My results for both SPREAD and PIN are also robust to a sample of December year-end firms. 15 Hasbrouck [2005], for instance, reports a mean Trade and Quote (TAQ)–based spread of approximately 4% for his sample of randomly selected firms from 1993–2003, while Wahal [1997] reports a mean spread of 5.79% for a sample of NASDAQ firms for the period 1982–1993. The mean spread of my sample for the Wahal time period is 6%, and the mean PIN is 0.20.
14

reported by Easley et al. [2002]. See table 1 for detailed descriptive statistics for the samples.
Approximately 33% of the SPREAD sample is centered around zero (figure 2, panel A),
indicating that earnings volatility is similar to cash flow volatility for these firms. For about 45%
of the PIN sample, earnings volatility is similar to cash flow volatility (figure 2, panel B).
<< Insert table 1 and figure 2 about here >>
To provide better intuitions about ACEV, I identify accounting items that cause a
mismatch between earnings before extraordinary items and cash flow from operations, thereby
possibly leading to large absolute values of ACEV (in the extreme SMOOTH and VOLATILE
deciles). In appendix 2, I present a characterization of the accounting items underlying ACEV in
the most SMOOTH and in the most VOLATILE deciles. I find that ACEV in the most SMOOTH
decile is associated with periods of capital expenditures (14% of the time); increases in accounts
receivable (14%); changes in accounts payable (11%); and increases in inventory (10%). ACEV
in the most VOLATILE decile is associated with capital expenditures (16% of the time); changes
in accounts payable (15%); increases in accounts receivable (8%); increases in other special
items (8%); profit/loss on sale of property, plant, and equipment (7%); and decreases in accounts
receivable accompanied by a special item (7%). The values of ACEV in both of these extreme
deciles are associated with periods of growth, as evidenced by capital expenditures and changes
in accounts payable. However, increases in accounts receivable are more common among most
SMOOTH firms (14%) than among the most VOLATILE firms (8%). Increases in inventory are
also more common for companies in the most SMOOTH decile (10%), compared to those in the
most VOLATILE decile (4%). Finally, decreases in accounts receivable accompanied by a special
item (7%) are more prevalent among firms with more volatile earnings than among those with
smoother earnings (1%). In appendix 3 I provide a 1-year and 5-year transition matrix of ACEV.
15

4. Empirical results
4.1. Preliminary evidence
Results indicate a U-shaped relation between earnings that are smoother or more volatile
than cash flows and informed trading (fig. 3, panel A). Earnings that are smoother than cash
flows appear to be associated with larger bid-ask spreads. SPREAD is the lowest at the center of
the distribution, where ACEV is close to zero (i.e., where earnings volatility is equal to cash flow
volatility).16 As earnings become more volatile than cash flows, SPREAD increases. Thus,
earnings that are more volatile than cash flows also appear to be associated with larger bid-ask
spreads. A similar pattern obtains for PIN (figure 3, panel B).
<< Insert figure 3 about here >>
4.2. Correlations
Correlations between ACEV and SPREAD and between ACEV and PIN are statistically
significant (table 2).17 There is a negative and significant correlation between SPREAD and
ACEV (–0.18) and also between PIN and ACEV (–0.20) in the SMOOTH regime. Further, there is
a positive and significant correlation between SPREAD and ACEV (0.11) and between PIN and
ACEV (0.14) for firms in the VOLATILE regime. The accrual component of earnings volatility
thus appears to be significantly associated with informed trading in both of these regimes,
consistent with the U-shaped relation between ACEV and informed trading.
<< Insert table 2 about here >>
16 Empirical results show that informed trading is the lowest around zero values of the accrual component. There was no reason, ex ante, to expect zero values of the accrual component to be the point at which informed trading was lowest or highest, nor was it necessarily expected that zero values of the accrual component would lead to the lowest or highest level of informed trading for all firms. 17 All correlations are statistically significant at the 1% level, except as otherwise stated.
16

As correlations do not control for differences in innate characteristics between firms and
over time, they should be interpreted cautiously. Nevertheless, an association between SPREAD
and ACEV and between PIN and ACEV in univariate correlations suggests a first-order relation
between informed trading and the accrual component of earnings volatility.
4.3. Multivariate regressions
In this section, I discuss variables related to SPREAD and PIN used in prior literature and
incorporate them in a multivariate regression to ascertain whether the explanatory power of
ACEV with respect to SPREAD and PIN is incremental to that of these firm-level characteristics.
4.3.1. Firm-level determinants
Following prior research, I include market value of equity (SIZEi,t), because larger firms
have less information asymmetry (Atiase [1985], Bamber [1987]).18 I also include proxies for
the inventory component of spreads so that the cross-sectional variation in spreads that remains
can be interpreted as capturing the adverse selection component (Glosten and Harris [1988]). I
use turnover, TURNi,t, as the proxy for liquidity. I include the Amihud [2002] measure of
illiquidity, AMIHUDi,t, defined as daily unsigned movements in stock returns divided by dollar
trading volume. AMIHUD is a price impact measure and is highly related to the inventory
component (Amihud [2002], Hasbrouck [2005]).19 Finally, I include the inverse of the stock
price, PRC_INV, in the regression, as firms with lower stock prices have larger bid-ask spreads
(Stoll [2000]).20
18 Defining SIZE as the book value of assets yields similar results. 19 As trading volume is measured differently between NYSE/AMEX and NASDAQ, in unreported robustness tests I split both TURN and AMIHUD into two variables—one for NYSE/AMEX and the other for NASDAQ (following Brennan et al. [1998])—and find similar results. 20 I do not include stock return volatility as an additional control because the AMIHUD measure already contains the volatility of stock returns in the numerator. Although both AMIHUD and stock return volatility are highly correlated, I use the AMIHUD measure, as it explains a greater proportion of spreads than does stock return volatility. Further,
17
Following Petersen [2005], I estimate the OLS regressions with year indicators and
standard errors clustered at the firm level (table 3, panel A). The year indicators control for
common shocks, which could cause cross-sectional correlation in the errors. The firm-level
clustering of standard errors corrects for the possibility of serial correlation attributable to
unobserved firm effects that cause serial correlation in the errors, as well as for serial correlation
potentially arising from the fact that ACEV is based on five annual observations, with each
earnings observation influencing both current and future ACEV. I also use robust regressions
(table 3, panel B) as an additional specification to mitigate the effects of outliers.21
<< Insert table 3 about here >>
4.3.2. Regression specification and results
The multivariate regressions of informed trading (SPREAD and PIN) on ACEV in the
SMOOTH and VOLATILE regimes are as follows:
, 1 , 1 0 1 , 2 , 3 , 4 ,
5 ,
/
_ (
i t i t i t i t i t i t
i t k
SPREAD PIN ACEV SIZE TURN AMIHUD
PRC INV YEAR 5)
α α α α α
α α ε
+ + = + + + +
+ + +∑
In the SMOOTH regime (table 3, panel A), the coefficient of ACEV is negative (-0.21)
and significant (t-statistic –8.20). More negative values of ACEV are associated with larger
spreads, suggesting that earnings that are smoother than cash flows are associated with more
informed trading. A one-standard-deviation (0.01) decrease in ACEV is associated with a 21-
basis-point increase in bid-ask spreads. In the VOLATILE regime, there is a positive (0.04) and
significant (t-statistic 7.62) relation between SPREAD and ACEV, suggesting that earnings that
I do not include the number of trades as an additional control in the main specification because it is available only on the TAQ database, which would drastically reduce the sample size. However, in unreported robustness tests I include the number of trades for this smaller TAQ-based sample and find similar results. 21 A robust regression uses iteratively reweighted least squares and assigns higher weights to better-behaved observations. See Baker and Hall [2004] for a description of robust regressions and their use.
18

are more volatile than cash flows are associated with larger bid-ask spreads. A one-standard-
deviation (0.07) increase in ACEV is associated with a 28-basis-point increase in bid-ask spreads.
The relations between SPREAD and ACEV in the SMOOTH and VOLATILE regimes are
robust to outliers (table 3, panel B). The coefficients of ACEV are –0.08 and 0.02 and significant
(t-statistics -15.76 and 9.16) in the robust regression for the SMOOTH and VOLATILE regimes,
respectively. The control variables have been scaled for exposition (SIZE by 106; AMIHUD by
104; MB, AGE, ANALYSTS, and TURN by 102; and INST by 101) and are in the direction
consistent with prior research. SPREAD is larger for smaller firms, less-liquid firms, and firms
with lower stock prices.
I also conduct OLS and robust regressions of PIN on ACEV and controls (table 4, panels
A and B). Consistent with the intuition from the SPREAD results, there is a negative and
significant relation between PIN and ACEV in the SMOOTH regime. The coefficients of ACEV
are -1.05 and -1.14 and the associated t-statistics are -7.15 and -16.10 in the OLS and robust
regressions, respectively.22 These results indicate that earnings that are smoother than cash flows
are associated with higher probabilities of informed trading. A positive relation similarly obtains
between PIN and ACEV in the VOLATILE regime. The coefficients of ACEV in the OLS and
robust regressions (0.11 and 0.13, t-statistics 3.48 and 5.84, respectively) indicate that earnings
that are more volatile than cash flows are associated with higher probabilities of informed
trading. Results of the multivariate regressions confirm that the explanatory power of ACEV with
respect to informed trading is incremental to underlying economic characteristics of the firm.
<< Insert table 4 about here >>
22 Although the coefficients are greater than 1, the confidence intervals vary from 0.76 to 1.34.
19

5. Proactive discretion versus neutral application of accounting rules
Having established the overall relation between earnings that are either smoother or more
volatile than cash flows and informed trading, I now investigate the roles of proactive managerial
discretion versus neutral or conventional application of accounting rules in the relation between
ACEV and informed trading. To disentangle these individual effects, I perform three tests. First, I
attempt to control for the influence of accounting rules and evaluate whether the relation between
ACEV and informed trading persists, thus providing evidence of either a dominant or incremental
role for proactive discretion. Second, I use the discretionary accrual model of Dechow et al.
[1995] to decompose ACEV into nondiscretionary and discretionary components. I then examine
the relation between informed trading and the individual components. Third, I examine a
situation in which managerial reporting discretion is hypothesized to be informative and test
whether the overall relation between ACEV and informed trading is attenuated, strengthened, or
of no incremental importance.
5.1. Controlling for the influence of accounting rules
I include additional controls in the regressions to capture the influence of longstanding
accounting rules and choices on the relation between ACEV and informed trading.23 My
modified two-sided hypothesis is as follows:
H2 (a): When the influence of accounting rules is controlled for, managerial discretion is associated with less informed trading.
23 This is not to suggest that accounting rules and choices are completely exogenous and can never be changed, but that they are costly and/or hard to change from period to period. In this I follow the views of Francis et al. [2004, p. 985] on “innate” factors who state “… (innate factors) capture the notion that they are predetermined with respect to each period’s reporting and implementation decisions. We do not characterize them as exogenous because they can be changed, albeit slowly and at perhaps considerable cost by management…Our identification of these factors as innate is merely intended to capture the fact that these variables are difficult to change in the short-run.” See also footnote 27.
20

H2 (b): When the influence of accounting rules is controlled for, managerial discretion is associated with more informed trading.
I include industry fixed effects using two-digit SIC codes to capture constant accounting
rules, and I incorporate additional firm factors to capture the interaction between accounting
rules and the underlying economic characteristics of the firm. These factors capture differences
in managers’ accounting choices and/or differences in underlying risk/uncertainty in the
operating environment. I include leverage (LEVi,t), as it influences managers’ preferences for
alternative accounting standards (Holthausen and Leftwich [1983], Watts and Zimmerman
[1990]) and managers’ incentives to take on risky projects (Jensen and Meckling [1976]).
As prior research (Dechow and Dichev [2002], Francis et al. [2004]) has found that the
quality of accruals depends on the uncertainty of the firm’s operating environment, I use firm age
(AGEi,t), defined as the number of years the firm has been listed on Compustat; the market-to-
book ratio (MBi,t); and reported cash flow volatility (CFO_VOLi,t) to capture the uncertainty of
the operating environment. I hypothesize that the presence of analysts and institutional investors
is likely to reduce the flexibility of managers to choose accounting methods to manipulate
earnings. Thus, I include analyst following (ANALYSTSi,t), defined as the number of analysts
following the firm, obtained from I/B/E/S; and institutional holding (INSTi,t), defined as the
percentage of the firm’s shares held by institutions based on data from the 13-F filings, as
additional controls.24
Prior studies argue that accruals naturally smooth out fluctuations in cash flows and
present a smooth stream of earnings (see, e.g., Dechow [1994)). Thus, earnings that are smoother
24 It is possible that analyst following and institutional ownership in fact capture the ability of managers to exercise discretion in the reporting process. In this case, including these variables as controls would bias against finding an association between ACEV and informed trading. I estimate all the regressions excluding analyst following and institutional ownership (together as well as sequentially) and find similar results.
21
than cash flows are expected to arise naturally (i.e., due to accounting rules) in firms with high
cash flow volatility. Further, studies show that difficulty in estimating future cash flows in highly
volatile environments leads to greater estimation errors in accruals (Dechow and Dichev [2002]).
One consequence of greater estimation errors is that earnings become more volatile than cash
flows due to the reversing nature of accruals. As larger values of ACEV are more likely to occur
due to accounting rules in firms with high cash flow volatility, I interact ACEV with CFO_VOL
(ACEV*CFO_VOL) and include this interaction term as an additional control. The stand-alone
coefficient of ACEV can now be interpreted as the role of managerial discretion. The extended
regression specification is
, 1 , 1 0 1 , 2 , 3 , 4 , 5 ,
6 , 7 , 8 , 9 , 10 , 11
12 ,
/ __
* _ (
i t i t i t i t i t i t i t
i t i t i t i t i t i t
i t j k
SPREAD PIN ACEV SIZE TURN AMIHUD PRC INV
,
6)
LEV MB AGE INST ANALYSTS CFO VOL
ACEV CFO VOL SIC YEAR
α α α α α α
α α α α α α
α α α ε
+ + = + + + + +
+ + + + + +
+ + + +∑ ∑ Results of the relation between ACEV and SPREAD (PIN) with controls for the influence
of accounting rules are presented in table 5, panel A (panel B). In the SMOOTH regime, the
stand-alone coefficients of ACEV are negative (-0.45 and -0.16) and significant (t-statistics -8.60
and -13.54) for the SPREAD sample in both the OLS and robust regressions. The coefficients of
ACEV in the PIN sample are also negative (-1.19 and -1.32) and significant (t-statistics -4.02 and
-7.37) in both regressions. Similarly, ACEV is positive and significant in the regressions for both
the SPREAD and the PIN samples in the VOLATILE regime. Because ACEV is related to
informed trading in the presence of controls for accounting rules, I interpret these results as
evidence that proactive discretionary reporting choices, on average, contribute to rather than
mitigate the overall relation between ACEV and informed trading, consistent with hypothesis H2
22

(b). This evidence is consistent with cross-country studies like those of Bhattacharya et al. [2003]
and LaFond et al. [2007].25
<< Insert table 5 about here >>
5.2. Decomposing ACEV into nondiscretionary and discretionary components
I now examine whether the relation between informed trading and the accrual component
is pronounced or attenuated by the discretionary component of accruals. The percentage of
smoothest-decile firms that narrowly beat analyst forecasts is higher (14%) than the
corresponding percentage in the most VOLATILE decile (7%) (see appendix 2). This result, in
conjunction with studies such as that of Abarbanell and Lehavy [2003], who find that firms use
discretionary accruals to increase the incidence of small positive forecast errors—suggests a role
for managerial discretion.
Following previous studies in the earnings management literature (e.g., Jones [1991],
Dechow et al. [1995]), I decompose ACEV into two components, nondiscretionary (ACEV_NDA)
and discretionary (ACEV_DA), and examine the relation between informed trading and these
individual components. I first decompose earnings into cash flows, nondiscretionary accruals,
and discretionary accruals.
, , , , (7)i t i t i t i tE CF NDA DA= + +
25 Bhattacharya et al. [2003] and LaFond et al. [2007] find that income smoothing is associated with lower liquidity in the equity market. LaFond et al. [2007] decompose income smoothing into nondiscretionary and discretionary components and find that the discretionary component lowers liquidity. This paper finds evidence consistent with this in a single-country (i.e., U.S.) setting, where economy-wide and institutional variables are held constant. Moreover, in subsequent tests, I explore specific situations in which theory predicts that managerial discretion is informative. Results indicate that the relation between informed trading and income smoothing is attenuated in these settings. Thus, this paper also provides evidence that there are situations where managers use discretion in the reporting process to provide information to market participants.
23

where Ei,t is earnings for firm i in year t; CFi,t is cash flows for firm i in year t; NDAi,t is
nondiscretionary accruals for firm i in year t; and DAi,t is discretionary accruals for firm i in year
t. The variance of earnings is given by the following equation: 26
26( ) ( ) ( ) ( ) 2 ( , ) 2 ( , ) (8Var E Var CF Var NDA Var DA Cov CF NDA Cov CF DA= + + + + )
(9)
(10)
(11)
I define the nondiscretionary accrual component of earnings volatility (ACEV_NDA) as
, , , ,_ ( ) 2 ( , )i t i t i t i tACEV NDA Var NDA Cov CF NDA= +
and the discretionary accrual component of earnings volatility (ACEV_DA) as
, , , ,_ ( ) 2 ( , )i t i t i t i tACEV DA Var DA Cov CF DA= +
Replacing in (8),
, , , ,_ _ ( ) ( )i t i t i t i tACEV NDA ACEV DA Var E Var CF+ = −
As the nondiscretionary and discretionary components can each either provide or garble
information, the relations between informed trading and ACEV_NDA and ACEV_DA are
empirical questions. In the SPREAD sample, ACEV_DA is negative (-0.46 and -0.16) and
significant (t-stats -6.54 and -9.70) in both the OLS and robust regressions in the SMOOTH
regime (table 6, panel A). Further, it is positive (0.04 and 0.01) and significant (t-stats 4.68 and
6.09) in both regressions in the VOLATILE regime. ACEV_DA is significant in both regimes and
for both regressions in the PIN sample (table 6, panel B). Overall, ACEV_DA appears to garble
information and is associated with more informed trading. ACEV_NDA is generally insignificant.
This is not surprising, as the regression includes firm-level factors that also capture the influence
of neutral application of accounting rules.27
26 Cov (NDA, DA) is zero (by construction) and hence excluded. 27 In their examination of the relation between cost of equity and earnings attributes, Francis et al. [2004, p. 991] find that inclusion of the “innate controls” in the multivariate regression renders book-to-market ratio insignificant and also reduces the economic and statistical significance of beta. My results are consistent with the notion that the
24

<< Insert table 6 about here >>
5.3. Situations in which managerial discretion is informative
I next exploit the analysis in Kirschenheiter and Melumad [2002] to investigate settings
in which theory suggests that managerial discretion plays a role and, in particular, is informative.
Specifically, I explore the relation between ACEV and informed trading during periods of
extreme performance. According to Kirschenheiter and Melumad [2002], investors infer the
precision of reported earnings and managers take a big bath when the firm experiences a
sufficiently negative outcome, while managers smooth income when the firm experiences a
positive (or a less negative) outcome. Kirschenheiter and Melumad’s model predicts a pooling
equilibrium for periods of moderate performance and a separating equilibrium for big baths
(income smoothing) during periods of extremely bad (good) performance. Thus, big baths (i.e.,
ACEV in the VOLATILE regime) during extremely bad performance and income smoothing (i.e.,
ACEV in the SMOOTH regime) during extremely good performance are both expected to reveal
information about underlying cash flows.
I measure firm performance using the current year’s annual stock returns (RET). I denote
extreme performance by setting the indicator variable EXTREME to 1 for firms in the SMOOTH
regime with returns in the tenth decile (extremely good performance). Similarly, I set EXTREME
to 1 for firms in the VOLATILE regime with returns in the first decile to denote extremely bad
performance (inferences based on quartiles are similar but slightly weaker in statistical
significance). To capture the impact of extreme performance on the relation between ACEV and
informed trading, I interact ACEV with EXTREME and define this term as ACEV*EXTREME. As
nondiscretionary component (or “innate factors”) and firm-level controls such as leverage, market-to-book ratio, etc., capture (in part) the same underlying constructs.
25

income smoothing and big baths are expected to be informative during periods of extremely
good and poor performance, respectively, I expect the relation between ACEV and SPREAD (and
ACEV and PIN) to be attenuated during these periods; that is, I expect ACEV*EXTREME to be
positive (negative) in the SMOOTH (VOLATILE) regime.
As predicted, in the SMOOTH regime, the coefficients of ACEV*EXTREME are positive
and significant (0.21 and 0.10, t-statistics 4.52 and 8.89, respectively) in the SPREAD sample in
the OLS and robust regressions (table 7, panel A). The coefficient of ACEV*EXTREME is
positive and insignificant in the OLS regression but positive and significant in the robust
regression for the PIN sample (table 7, panel B). This indicates that income smoothing during
periods of extremely good performance is associated with relatively less informed trading. In the
VOLATILE regime, the coefficient of ACEV*EXTREME is insignificant in the OLS regression
but negative and significant in the robust regression (−0.01, t-statistic −2.20). Further, the
coefficient of ACEV*EXTREME in the VOLATILE regime is negative and significant in both the
OLS and robust regressions in the PIN sample. This indicates that earnings that are more volatile
than cash flows during extremely poor performance are associated with less informed trading.
These results suggest that the relation between informed trading and the accrual component is
attenuated in situations in which managerial discretion is expected to be informative. Thus, while
the overall relation between ACEV associated with proactive discretion and informed trading
suggests that earnings that are smoother or more volatile than cash flows tend, on average, to
garble information, it appears that proactive discretion can in certain contexts be informative.
<< Insert table 7 about here >>
26

6. Extensions and robustness tests
6.1. Effect of realization of ACEV on informed trading
Some theories argue that characteristics of the information environment and private
information markets evolve endogenously and remain stable in equilibrium. In such an
equilibrium, one would not expect realization of the accrual component to have any effect on
informed trading. However, it is an empirical question whether the realization of ACEV in a
given period alters the level of informed trading. I conduct two tests relevant to this question.
First, I examine whether the accrual component is associated with next year’s informed
trading after controlling for this year’s level of informed trading. If the accrual component has no
relation to future informed trading incremental to contemporaneous informed trading (measured
as of the same period as the most recent ACEV), this would suggest that new realizations of the
accrual component have very little effect on the level of informed trading in any given year. I
find that, after controlling for SPREAD and PIN as of year t, ACEV as of year t is significantly
associated with SPREAD and PIN as of year t + 1 (table 8, panel A). The OLS coefficient of
ACEV in the SMOOTH (VOLATILE) regime is -0.08 (0.03) and the t-statistic is -5.19 (6.78).
<< Insert table 8 about here >>
Second, I examine whether changes in ACEV are related to changes in bid-ask spreads. I
do not expect a monotonic relation between changes in ACEV and short-window spreads. This is
because an increase in ACEV could be associated with smaller or larger spreads depending on
whether it makes earnings less smooth or more volatile than cash flows. I partition the sample
into quintiles of ACEV, where quintile 1 denotes the most negative ACEV and quintile 5 denotes
the most positive ACEV. I compute changes in ACEV between quintiles 3 and 2 (change in
earnings smoother than cash flows), between quintiles 3 and 4 (change in earnings more volatile
27

than cash flows) as well as between quintile 3 and quintile 3 (no change).28 I then explore the
relation between changes in ACEV and (i) future annual bid-ask spreads and (ii) earnings
announcement bid-ask spreads, with controls for contemporaneous bid-ask spreads.29
Results show that changes in ACEV from small magnitudes to more negative values
(ACEV_CHNG is -0.95 and t-statistic is -1.66) and from small magnitudes to more positive
values (coefficient is 0.84 and t-statistic is 1.68) are associated with changes in future annual bid-
ask spreads (table 8, panel B). I also find that changes in ACEV from small magnitudes to more
positive values are associated with changes in earnings announcement spreads (coefficient is
0.70 and t-statistic is 1.78). The relation between changes in ACEV from small values to more
negative values is negative but insignificant for short-window bid-ask spreads. Finally, in
unreported tests, I find that when ACEV does not change, there is no change in bid-ask spreads.
The above results are significant only at the 10% level. It is not clear whether the lower
significance is due to the weakness in the relation, to the nature of the test, or to the substantial
reduction in power because of the reduced sample size (about 2,000 observations, compared to
approximately 30,000 observations for the main tests).
28 I exclude observations in the extreme quintiles for two reasons. First, there are very few observations that move from quintile 3 to the extreme quintiles. Second, observations in the extremes might have a differential relation with informed trading, as seen in the prior section. However, including these observations does not alter the inferences. 29 There are certain caveats. First, the accrual component is based on five annual earnings observations, and so the notion of an earnings expectation and an earnings realization, and hence the appropriateness of an event-study, is unclear. Second, it is not clear that the announcement/10-K filing period is the only time when informed traders acquire and/or trade on their private information. Further, there is ambiguity about the announcement period. As studies state that cash flow information is publicly available only after the 10-K has been filed, I define the short window from the date of the release of the earnings announcement until five days after the date of the filing of the 10-K with the SEC. Based on a random sample of one hundred firm-year observations, the average difference between the earnings announcement date and the filing date is thirty-five days. Hence, the short window for the entire sample is taken as forty days. Defining the end date as three days after the filing date yields similar results.
28

6.2. Role of insiders
While the hypotheses are based on the behavior of all informed traders, I explore in
unreported tests whether the relation between the accrual component and informed trading is
driven by insider trading (as suggested in Baiman and Verrecchia [1996]). I include the level of
insider trading (defined as the total of insider sales and purchases) as an explanatory variable. I
find that higher levels of informed trading are due to informed traders external to the firms as
well as to insiders. For example, in the SMOOTH regime, the coefficient of ACEV in the PIN
regression declines from 1.05 to 1.03 with controls for insider trading (the coefficient for insider
trading is 0.01 and the t-statistic is 5.29).
6.3. Existing proxies for income smoothing
I also explore the relation between informed trading and an existing proxy for income
smoothing—the ratio of earnings volatility to cash flow volatility (RATIO). In unreported tests, I
find a positive relation between informed trading and RATIO; that is, firms with smaller values
of RATIO have less informed trading. This might lead one to inadvertently conclude that income
smoothing is associated with less informed trading for two important reasons.
First, RATIO is generally interpreted in the literature as a proxy for the extent of income
smoothing, wherein smaller values of RATIO indicate more income smoothing and larger values
indicate less income smoothing. However, prior studies do not take into account that larger
values of RATIO might indicate choices such as big baths, which do not necessarily reflect a
lesser degree of income smoothing. ACEV, on the other hand, distinguishes between the two
regimes in which negative values of ACEV denote earnings that are smoother than cash flows
and positive values of ACEV indicate earnings that are more volatile than cash flows.
29

Second, RATIO mathematically represents ACEV divided by cash flow volatility
(CFO_VOL). Low values of RATIO can arise due to either low values of ACEV (holding
CFO_VOL constant) or high values of CFO_VOL (holding ACEV constant). Thus, the relation
between RATIO and informed trading combines the relations between ACEV and informed
trading and between CFO_VOL and informed trading. Results presented in figure 3 indicate that
lower values of ACEV are associated with less informed trading. Further, prior studies as well as
results from my own (unreported) tests have shown that firms with higher cash flow volatility
have more informed trading (Kyle [1985], Brennan and Subrahmanyam [1998], Copeland and
Galai [1983]). Thus, the relation between RATIO and informed trading is potentially confounded
by the positive relations between ACEV and informed trading (in the numerator) and between
CFO_VOL and informed trading (in the denominator). Studies that are interested in examining
earnings that are smoother or more volatile than cash flows are therefore better served by the use
of ACEV rather than RATIO.
6.4. Alternate measure of bid-ask spread
Hasbrouck [2005] develops a Gibbs estimate of bid-ask spreads based on Roll [1984]. I
find that my results are insensitive to this measure. The coefficients of ACEV are significant in
the SMOOTH and VOLATILE regimes for the OLS and robust regressions.
6.5. Addressing the possibility of serial correlation
Although the standard errors are clustered by firm, I employ a cross-sectional regression
to ensure that my results are unaffected by serial correlation. The cross-sectional regression uses
the firm-level mean of each variable across all years in the sample and contains only one
30

observation per firm. The coefficients of ACEV are significant in the SPREAD and PIN samples,
in the SMOOTH and VOLATILE regimes, and for the OLS and robust regressions.
6.6. Other robustness tests
The main results are robust to the use of standard deviations instead of variances to
compute ACEV; the calculation of variances based on ten observations instead of five; the
definition of earnings as operating income or net income; the use of effective spreads; the
computation of ACEV for the pre-1987 period using the balance sheet; the estimation of ACEV as
the residual of a regression of earnings volatility on cash flow volatility; and the inclusion of the
level of accruals as an additional control.
7. Conclusion
This paper investigates whether earnings that are smoother or more volatile than cash
flows—and, specifically, reporting choices such as income smoothing and big baths—provide or
garble information. Consistent with theories that predict more informed trading when public
information is less informative, I find that the difference between earnings and cash flow
volatility is associated with a larger bid-ask spread and a higher probability of informed trading.
More informed trading occurs when earnings are smoother than cash flows as well as when
earnings are more volatile than cash flows. Further, I find evidence consistent with this in a
changes specification, where changes in earnings that are smoother than cash flows and in
earnings that are more volatile than cash flows are significantly associated with changes in
informed trading.
31

I also explore the extent to which the relation between the accrual component and
informed trading is due to individual effects of proactive managerial discretion and/or
application of conventional accounting rules. I find that the above-mentioned relations with
informed trading persist when additional controls intended to capture the influence of accounting
rules are included. Further, when the accrual component is decomposed into nondiscretionary
and discretionary components, I find that the discretionary component is associated with more
informed trading. This suggests that managers’ exercise of proactive discretion in the form of
income smoothing and big baths contributes on average to the garbling of information and
reinforces the relation between the accrual component and informed trading. However, in a
setting in which theory suggests that managerial discretion is informative (i.e., extreme
performance), the relation between the accrual component and informed trading is attenuated.
This suggests that proactive discretion can be informative in certain contexts.
32

References
ABARBANELL, J.; AND R. LEHAVY. “Can Stock Recommendations Predict Earnings Management and Analysts’ Earnings Forecast Errors?” Journal of Accounting Research 41(2003): 1–31
ABOODY, D.; J. HUGHES; AND J. LIU. “Earnings Quality, Insider Trading, and Cost of Capital.”
Journal of Accounting Research 43 (2005): 651–673. ALLES, M., AND R. J. LUNDHOLM. “On the optimality of public signals in the presence of private
information.” The Accounting Review 68 (1993): 93–112. AMIHUD, Y. “Illiquidity and Stock Returns: Cross-Section and Time-Series Effects.” Journal of
Financial Markets 5 (2002): 31–56. AMIHUD, Y., AND H. MENDELSON. “Asset Pricing and the Bid-Ask Spread.” Journal of Financial
Economics 17 (1986): 223–249. ARYA, A.; J. C. GLOVER; AND S. SUNDER. “Are Unmanaged Earnings Always Better for
Shareholders?” Accounting Horizons 17 (2003): 111–116. ATIASE, R. “Predisclosure Information, Firm Capitalization, and Security Price Behavior
Earnings Announcements.” Journal of Accounting Research 23 (1985): 21–36. BAGEHOT, W. [J. TREYNOR]. “The Only Game in Town.” Financial Analysts Journal 27 (1971):
12–22. BAIMAN, S., AND R. VERRECCHIA. “The Relation among Capital Markets, Financial Disclosure,
Production Efficiency, and Insider Trading.” Journal of Accounting Research 34 (1996): 1–22.
BAKER, G., AND B. HALL. “CEO Incentives and Firm Size.” Journal of Labor Economics 22
(2004): 767–798. BALL, R., AND L. SHIVAKUMAR. “The Role of Accruals in Asymmetrically Timely Gain and Loss
Recognition.” Journal of Accounting Research 44 (2006): 207–242. BAMBER, L. S. “Unexpected Earnings, Firm Size, and Trading Volume around Quarterly
Earnings Announcements.” Accounting Review 62 (1987): 510–532. BARTH, M.; W. LANDSMAN; AND M. LANG. “International Accounting Standards and Accounting
Quality.” Working paper, University of North Carolina–Chapel Hill, 2006. BASU, S. “The Conservatism Principle and Asymmetric Timeliness of Earnings.” Journal of
Accounting & Economics 24 (1997): 3–37. BHATTACHARYA U.; H. DAOUK; AND M. WELKER. “The World Price of Earnings Opacity.” The
Accounting Review 78 (2003): 641–678.

BRENNAN M.; T. CHORDIA; AND A. SUBRAHMANYAM. “Alternative Factor Specifications, Security Characteristics and the Cross-Section of Expected Stock Returns.” Journal of Financial Economics 49 (1998): 345–373.
BRENNAN, M. J., AND A. SUBRAHMANYAM. “The Determinants of Average Trade Size.” Journal
of Business 71 (1998): 1–25. CHANEY, P., AND C. LEWIS. “Earnings Management and Firm Valuation under Asymmetric
Information.” Journal of Corporate Finance 1 (1995): 319–345. COPELAND, T. E., AND D. GALAI. “Information Effects on the Bid-Ask Spread.” The Journal of
Finance 38 (1983): 1457–1469. DECHOW, P. “Accounting Earnings and Cash Flows as Measures of Firm Performance: The Role
of Accounting Accruals.” Journal of Accounting & Economics 18 (1994): 3–42. DECHOW, P., AND I. DICHEV. “The Quality of Accruals and Earnings: The Role of Accrual
Estimation Errors.” The Accounting Review 77 (2002): 35–59. DECHOW, P.; R. SLOAN; AND A. SWEENEY. “Detecting Earnings Management.” The Accounting
Review 70 (1995): 193–225. DEMSKI, J. “Performance Measure Manipulation.” Contemporary Accounting Research 15
(1998): 261–285. DIAMOND, D. “Optimal Release of Information by Firms.” Journal of Finance 40 (1985): 1071–
1094. EASLEY, D.; S. HVIDKJAER; AND M. O'HARA. “Is Information Risk a Determinant of Asset
Returns?” Journal of Finance 57 (2002): 2185–2221. EASLEY, D.; S. HVIDKJAER; AND M. O'HARA. "Factoring Information Into Returns." EFA 2004
Maastricht Meetings Paper (2004). EASLEY, D.; N. M. KIEFER; AND M. O'HARA. “One Day in the Life of a Very Common Stock.”
Review of Financial Studies 10 (1997): 805–835. EASLEY, D.; N. M. KIEFER; M. O'HARA; AND J. PAPERMAN. “Liquidity, Information and
Infrequently Traded Stocks.” Journal of Finance 51 (1996): 1405–1436. EASLEY, D., AND M. O'HARA. “Time and the Process of Security Price Adjustment.” Journal of
Finance 47 (1992): 577–605. EASLEY, D., AND M. O'HARA. “Information and the Cost of Capital.” Journal of Finance 59
(2004): 1553–1583.
FRANCIS, J.; R. LAFOND; P. OLSSON; AND K. SCHIPPER. “Costs of Equity and Earnings Attributes.” The Accounting Review 79 (2004): 967–1010.
FRANKEL, R., AND X. LI. “Characteristics of a Firm’s Information Environment and the
Information Asymmetry between Insiders and Outsiders.” Journal of Accounting & Economics 37 (2004): 229–259.
GIVOLY, D., AND C. HAYN. “The Changing Time-Series Properties of Earnings, Cash Flows and
Accruals: Has Financial Reporting Become More Conservative?” Journal of Accounting & Economics 29 (2000): 287–320.
GLOSTEN, L. R., AND L. E. HARRIS. “Estimating the Components of the Bid/Ask Spread.” Journal
of Financial Economics 21 (1988): 123–142. GLOSTEN, L. R., AND P. R. MILGROM. “Bid, Ask, and Transaction Prices in a Specialist Market
with Heterogeneously Informed Traders.” Journal of Financial Economics 14 (1985): 71–100.
GRAHAM, J.; H. CAMPBELL; AND S. RAJGOPAL. “The Economic Implications of Corporate
Financial Reporting.” Journal of Accounting & Economics 40 (2005): 3–73. GROSSMAN, S. J., AND J. E. STIGLITZ. “On the Impossibility of Informationally Efficient
Markets.” American Economic Review 70 (1980): 393–408. GU, Z. “Income Smoothing and the Prediction of Future Cash Flows.” Working paper, 2005. HASBROUCK, J. “Trading Costs and Returns for U.S. Equities: The Evidence from Daily Data.”
Working paper, Department of Finance, Stern School of Business, New York University, 2005.
HOLTHAUSEN, R., AND R. LEFTWICH. “The Economic Consequences of Accounting Choice.”
Journal of Accounting and Economics 5 (1983): 77–117. INDJEJIKIAN, R. “The Impact of Costly Information Interpretation on Firm Disclosure Decisions.”
Journal of Accounting Research 29 (1991): 277–301. JENSEN, M. C., AND M. H. MECKLING. “Theory of the Firm: Managerial Behavior, Agency Costs,
and Ownership Structure.” Journal of Financial Economics 3 (1976): 305–360. JONES, J. J. “Earnings Management During Import Relief Investigations.” Journal of Accounting
Research 29 (1991): 193–228. KIM, O., AND R. VERRECCHIA. “Market Liquidity and Volume around Earnings
Announcements.” Journal of Accounting & Economics 17 (1994): 41–68.

KIRSCHENHEITER, M., AND N. MELUMAD. “Can 'Big Bath' and Earnings Smoothing Coexist as Equilibrium Financial Reporting Strategies?” Journal of Accounting Research 40 (2002): 761–796.
KYLE, A. S. “Continuous Auctions and Insider Trading.” Econometrica 53 (1985): 1315–1336. LAFOND, R.; M. LANG; AND H. ASHBAUGH-SKAIFE. "Earnings Smoothing, Governance and
Liquidity: International Evidence.” Working Paper, 2007 LANG, M.; J. RAEDY; AND M. YETMAN. “How Representative Are Firms That Are Cross-Listed in
the United States? An Analysis of Accounting Quality.” Journal of Accounting Research 41 (2003): 363–386.
LEUZ, C.; D. NANDA; AND P. WYSOCKI. “Earnings Management and Investor Protection: An
International Comparison.” Journal of Financial Economics 69 (2003): 505–527. LEVITT, A. The Numbers Game. NYU Center for Law and Business, New York, N.Y., 1998. LUNDHOLM, R. J. “Price-Signal Relations in the Presence of Correlated Public and Private
Information.” Journal of Accounting Research 26 (1988): 107–118. MANZANO, C. “Price Signal Relations in an Imperfectly Competitive Financial Market with
Public and Private Information.” Journal of Accounting Research 37 (1999): 451–463. PETERSEN, M. “Estimating Standard Errors in Finance Panel Data Sets: Comparing Approaches.”
Working paper, National Bureau of Economic Research, 2005. RIEDL, E. “An Examination of Long-Lived Asset Impairments.” Accounting Review 79 (2004):
823–852. ROLL, R. “A Simple Implicit Measure of the Effective Bid-Ask Spread in an Efficient Market.”
Journal of Finance 39 (1984): 1127–1139. SANKAR, M. R., AND K. R. SUBRAMANYAM. “Reporting Discretion and Private Information
Communication through Earnings.” Journal of Accounting Research 39 (2001): 365–386. STOLL, H. “Friction.” Journal of Finance 55 (2000): 1479–1514. TUCKER, J., AND P. ZAROWIN. “Does Income Smoothing Improve Earnings
Informativeness?” The Accounting Review 81 (2006): 251–270. TURNER, L. “The State of Financial Reporting Today: An Unfinished Chapter II.” Speech by
SEC Staff, June 7, 2001. http://www.sec.gov/news/speech/spch506.htm (accessed 6 June 2007).
VERRECCHIA, R. E. “The Use of Mathematical Models in Financial Accounting.” Journal of
Accounting Research 20 (1982): 1–42.

VERRECCHIA, R. E. “Essays on disclosure.” Journal of Accounting & Economics 32 (2001): 97–180.
WAHAL, S. “Entry, Exit, Market Makers, and the Bid-Ask Spread.” Review of Financial Studies
10 (1997): 871–901. WATTS, R., AND J. ZIMMERMAN. “Positive Accounting Theory: A Ten Year Perspective.” The
Accounting Review 65 (1990): 131–156.

Table 1: Descriptive statistics ACEV represents the accrual component of earnings volatility, defined as the difference between the variance of earnings and the variance of cash flows. Earnings is defined as earnings before extraordinary items (Compustat data item 18), scaled by assets (data item 6), while cash flow represents cash flow from operations (data item 308) scaled by assets. SPREAD is the relative bid-ask spread (defined as the closing ask minus the closing bid divided by the average of closing ask and bid). PIN stands for the probability of informed trading. SIZE denotes the market value of equity (data item 199 multiplied by data item 25) in $ millions. TURN is annual turnover, defined as the ratio of shares traded divided by shares outstanding (data item 25). AMIHUD is the Amihud [2002] measure of illiquidity. PRC_INV is the inverse of the stock price. LEV is the amount of total debt (data item 9 plus data item 34) scaled by total assets. MB stands for the market-to-book ratio, defined as the ratio of the market value of assets (data item 199 times data item 25 plus data item 6 less data item 60) divided by the book value of assets (data item 6). AGE is the number of years the firm has been listed on Compustat. The percentage of institutional ownership is denoted by INST. ANALYSTS is the number of analysts covering the firm. CFO_VOL denotes variance of cash flows (data item 308). Mean Min. Q1 Median Q3 Max. Std. Dev.
Primary variables ACEV 0.01 -0.22 -0.002 -0.0001 0.004 0.40 0.05SPREAD 0.04 0.00 0.01 0.02 0.05 0.34 0.06PIN 0.20 0.07 0.14 0.19 0.25 0.46 0.08Firm-level characteristics SIZE 1475.90 1.90 28.48 117.63 594.54 36977.81 4935.00TURN 1.17 0.03 0.36 0.74 1.46 7.20 1.28AMIHUD 6.45 0.00 0.01 0.20 2.39 152.82 20.90PRC_INV 0.23 0.01 0.04 0.10 0.25 2.35 0.37LEV 0.23 0.00 0.00 0.19 0.36 0.94 0.21MB 2.07 0.56 1.08 1.46 2.26 11.79 1.82AGE 12.62 2.00 4.00 9.00 18.00 50.00 11.07INST 0.27 0.00 0.02 0.19 0.47 0.95 0.27ANALYSTS 6.20 0.00 0.00 2.00 9.00 44.00 9.04CFO_VOL 0.01 0.00 0.001 0.003 0.01 0.22 0.03

Table 2: Correlations ACEV is the accrual component of earnings volatility. SPREAD is the relative bid-ask spread. PIN is the probability of informed trading. SMOOTH (VOLATILE) is the regime in which earnings are smoother (more volatile) than cash flows. SIZE denotes the market value of equity. TURN is annual turnover. AMIHUD is the Amihud [2002] measure of illiquidity. PRC_INV is the inverse of the stock price. LEV is debt scaled by total assets. MB is the market-to-book ratio. AGE is the number of years the firm exists on Compustat. INST is the percentage of institutional ownership. ANALYSTS is the number of analysts covering the firm. CFO_VOL represents cash flow volatility. All correlations are significant at the 1% level. Correlations marked with an asterisk (*) are not significant. See table 1 for detailed definitions of the variables. Panel A: Correlations between ACEV, SPREAD, and PIN
ACEV
(SMOOTH) ACEV
(VOLATILE) SPREAD PIN
ACEV (SMOOTH) 1.00 ACEV (VOLATILE) – 1.00
SPREAD –0.18 0.11 1.00
PIN –0.20 0.14 0.45 1.00 Panel B: Correlations between ACEV and firm-level determinants
ACEV
(S
MO
OTH
)
ACEV
(V
OLA
TILE
)
SPRE
AD
PIN
SIZE
TURN
AMIH
UD
PRC
_IN
V
LEV
MB
AGE
INST
ANAL
YSTS
CFO
_VO
L
ACEV (SMOOTH) 1.00
ACEV (VOLATILE) – 1.00
SPREAD -0.18 0.11 1.00
PIN -0.20 0.14 0.45 1.00
SIZE 0.10 -0.10 -0.19 -0.40 1.00
TURN -0.06 0.12 -0.25 -0.34 0.05 1.00
AMIHUD -0.11 0.08 0.59 0.33 -0.09 -0.18 1.00
PRC_INV -0.23 0.23 0.57 0.37 -0.16 -0.15 0.60 1.00
LEV 0.06 -0.03 0.13 0.06 0.01 -0.13 0.07 0.07 1.00
MB -0.15 0.17 -0.13 -0.22 0.11 0.26 -0.11 -0.06 -0.18 1.00
AGE 0.15 -0.16 -0.15 -0.21 0.28 -0.17 -0.06 -0.14 0.04 -0.13 1.00
INST 0.18 -0.15 -0.40 -0.39 0.13 0.21 -0.24 -0.36 -0.05 0.01* 0.25 1.00
ANALYSTS 0.15 -0.09 -0.34 -0.49 0.49 0.24 -0.20 -0.29 -0.01 0.07 0.24 0.58 1.00
CFO_VOL -0.81 0.36 0.12 0.16 -0.10 0.11 0.06 0.22 -0.10 0.33 -0.16 -0.18 -0.15 1.00

Table 3: Multivariate regression of SPREAD on ACEV The dependent variable is the bid-ask spread (SPREAD). ACEV is the accrual component of earnings volatility. SMOOTH (VOLATILE) is the regime in which earnings are smoother (more volatile) than cash flows. SIZE denotes the market value of equity. TURN is annual turnover. AMIHUD is the Amihud [2002] measure of illiquidity. PRC_INV is the inverse of the stock price. The regressions include year indicators and robust standard errors clustered by firm in the OLS regression. Although the relation between SPREAD and ACEV is based on a two-sided hypothesis, the negative (positive) prediction for ACEV in the SMOOTH (VOLATILE) regime is based on the preliminary evidence in figure 3, panel A. See table 1 for detailed definitions of the variables. Panel A: OLS regression ACEV regime SMOOTH
(n = 37,249) VOLATILE (n = 30,676)
Predicted sign Coeff. t-stat. Coeff. t-stat.
Intercept 0.03 13.08 0.04 11.35 ACEV +/– -0.21 -8.20 0.04 7.62 SIZE – -0.73 -23.47 -0.86 -19.58 TURN – -0.48 -28.14 -0.49 -25.91 AMIHUD + 0.10 24.54 0.09 28.39 PRC_INV + 0.05 23.09 0.05 30.20 Adjusted R2 0.53 0.52
Panel B: Robust regression ACEV regime SMOOTH
(n = 37,249) VOLATILE (n = 30,676)
Predicted
sign Coeff. t-stat. Coeff. t-stat. Intercept 0.02 14.11 0.03 14.09 ACEV +/– -0.08 -15.76 0.02 9.16 SIZE – -0.40 -26.77 -0.55 -22.92 TURN – -0.21 -31.50 -0.24 -27.86 AMIHUD + 0.18 344.84 0.15 264.41 PRC_INV + 0.05 142.18 0.03 94.25

Table 4: Multivariate regression of PIN on ACEV The dependent variable is the probability of informed trading (PIN). ACEV is the accrual component of earnings volatility. SMOOTH (VOLATILE) is the regime in which earnings are smoother (more volatile) than cash flows. SIZE denotes the market value of equity. TURN is annual turnover. AMIHUD is the Amihud [2002] measure of illiquidity. PRC_INV is the inverse of the stock price. The regressions include year indicators and robust standard errors clustered by firm in the OLS regression. Although the relation between PIN and ACEV is based on a two-sided hypothesis, the negative (positive) prediction for ACEV in the SMOOTH (VOLATILE) regime is based on the preliminary evidence in figure 3, panel B. See table 1 for detailed definitions of the variables. Panel A: OLS regression ACEV regime SMOOTH
(n = 11,392) VOLATILE (n = 7,111)
Predicted
sign Coeff. t-stat. Coeff. t-stat.
Intercept 0.23 33.40 0.22 42.07 ACEV +/– -1.05 -7.15 0.11 3.48 SIZE – -5.33 -22.47 -5.13 -19.38 TURN – -4.38 -19.99 -3.68 -17.82 AMIHUD + 0.06 2.79 0.08 5.98 PRC_INV + 0.08 6.60 0.04 6.30 Adjusted R2 0.36 0.35
Panel B: Robust regression ACEV regime SMOOTH
(n = 11,392) VOLATILE (n = 7,111)
Predicted sign Coeff. t-stat. Coeff. t-stat.
Intercept 0.22 33.91 0.21 37.01 ACEV +/– -1.14 -16.10 0.13 5.84 SIZE – -4.71 -42.38 -4.61 -33.62 TURN – -3.36 -31.70 -2.88 -22.22 AMIHUD + 0.04 4.23 0.09 11.13 PRC_INV + 0.11 22.24 0.05 13.21

Table 5: Relation between SPREAD and ACEV with controls for the influence of accounting rules (Panel A) The dependent variable is SPREAD, the bid-ask spread. ACEV is accrual component of earnings volatility. SMOOTH (VOLATILE) is the regime in which earnings are smoother (more volatile) than cash flows. SIZE denotes the market value of equity. TURN is annual turnover. AMIHUD is the Amihud [2002] measure of illiquidity. PRC_INV is the inverse of the stock price. LEV is the amount of leverage, scaled by total assets. MB stands for the market-to-book ratio. AGE is the number of years the firm has been listed on Compustat. The percentage of institutional ownership is denoted by INST. ANALYSTS is the number of analysts covering the firm. CFO_VOL represents cash flow volatility. ACEV*CFO_VOL is the interaction of ACEV with CFO_VOL. The regressions include two-digit SIC code indicators, year indicators, and robust standard errors clustered by firm in the OLS regression. The predicted sign for ACEV is indeterminate, because the relation between SPREAD and the stand-alone coefficient of ACEV with controls for the influence of accounting rules is based on a two-sided hypothesis [H2 (a) and H2 (b)]. See table 1 for detailed definitions of the variables. ACEV regime
SMOOTH (n = 37,249)
VOLATILE (n = 30,676)
OLS regression Robust regression OLS regression Robust regression
Predicted sign
Coeff. t-stat. Coeff. t-stat. Coeff. t-stat. Coeff. t-stat. Intercept 0.04 6.08 0.03 15.19 0.05 7.53 0.04 13.94 ACEV ? -0.45 -8.60 -0.16 -13.54 0.05 6.94 0.02 7.87 SIZE – -0.06 -1.30 -0.09 -4.80 -0.14 -2.42 -0.17 -6.24 TURN – -0.35 -19.49 -0.16 -23.10 -0.34 -17.12 -0.16 -18.37 AMIHUD + 0.10 24.66 0.18 351.38 0.09 28.48 0.16 289.93 PRC_INV + 0.04 18.53 0.03 89.88 0.04 23.52 0.02 65.72 LEV + 0.01 6.96 0.01 4.02 0.02 12.71 0.01 11.54 MB – -0.20 -12.04 -0.12 -24.59 -0.20 -13.49 -0.11 -18.02 AGE – -0.02 -10.20 -0.01 -16.86 -0.02 -7.30 -0.01 -12.60 INST – -0.15 -14.73 -0.06 -16.12 -0.18 -13.58 -0.10 -17.21 ANALYSTS – -0.04 -13.62 -0.02 -18.60 -0.04 -11.34 -0.02 -13.32 CFO_VOL + 0.06 2.74 0.04 8.85 0.12 7.40 0.06 11.33 ACEV*CFO_VOL ? 2.27 7.64 0.95 14.56 -0.60 -4.75 -0.25 -6.34 Adjusted R2 0.56 – 0.55 –

Table 5: Relation between PIN and ACEV with controls for the influence of accounting rules (Panel B) The dependent variable is the probability of informed trading (PIN). ACEV is accrual component of earnings volatility. SMOOTH (VOLATILE) is the regime in which earnings are smoother (more volatile) than cash flows. SIZE denotes the market value of equity. TURN is annual turnover. AMIHUD is the Amihud [2002] measure of illiquidity. PRC_INV is the inverse of the stock price. LEV is the amount of leverage, scaled by total assets. MB stands for the market-to-book ratio. AGE is the number of years the firm has been listesd on Compustat. The percentage of institutional ownership is denoted by INST. ANALYSTS is the number of analysts covering the firm. CFO_VOL represents cash flow volatility. ACEV*CFO_VOL is the interaction of ACEV with CFO_VOL. The regressions include two-digit SIC code indicators, year indicators, and robust standard errors clustered by firm in the OLS regression. The predicted sign for ACEV is indeterminate, because the relation between PIN and the stand-alone coefficient of ACEV with controls for the influence of accounting rules is based on a two-sided hypothesis [H2 (a) and H2 (b)]. See table 1 for detailed definitions of the variables. ACEV regime
SMOOTH (n = 11,392)
VOLATILE (n = 7,111)
OLS regression Robust regression OLS regression Robust regression
Predicted sign
Coeff. t-stat. Coeff. t-stat. Coeff. t-stat. Coeff. t-stat. Intercept 0.25 17.24 0.24 21.32 0.23 30.91 0.22 9.79 ACEV ? -1.19 -4.02 -1.32 -7.37 0.11 2.76 0.12 4.35 SIZE – -2.66 -10.60 -2.37 -17.60 -2.78 -10.02 -2.47 -14.78 TURN – -3.59 -18.48 -2.88 -25.93 -3.05 -16.70 -2.40 -18.56 AMIHUD + 0.09 4.79 0.09 8.85 0.09 6.99 0.10 13.00 PRC_INV + 0.03 3.09 0.05 10.25 0.01 1.42 0.02 5.75 LEV + -0.01 -2.26 -0.01 -3.24 -0.01 -1.07 -0.01 -0.56 MB – -0.81 -9.19 -0.66 -11.95 -0.69 -7.65 -0.55 -8.27 AGE – -0.06 -7.02 -0.07 -16.38 -0.04 -4.16 -0.05 -8.43 INST – -0.30 -6.12 -0.17 -6.41 -0.27 -5.20 -0.17 -4.79 ANALYSTS – -0.13 -12.25 -0.12 -16.60 -0.13 -11.58 -0.12 -13.22 CFO_VOL + 0.44 2.72 0.33 3.00 0.71 4.31 0.63 6.31 ACEV*CFO_VOL ? 16.46 4.26 15.27 7.04 -4.84 -2.84 -4.69 -4.32 Adjusted R2 0.45 – 0.43 –

Table 6: Multivariate regression of SPREAD on ACEV_NDA and ACEV_DA (Panel A) The dependent variable is SPREAD, the bid-ask spread. ACEV_NDA (ACEV_DA) is the nondiscretionary (discretionary) component of ACEV. SMOOTH (VOLATILE) is the regime in which earnings are smoother (more volatile) than cash flows. SIZE denotes the market value of equity. TURN is annual turnover. AMIHUD is the Amihud [2002] measure of illiquidity. PRC_INV is the inverse of the stock price. LEV is the amount of leverage, scaled by total assets. MB stands for the market-to-book ratio. AGE is the number of years the firm has been listed on Compustat. The percentage of institutional ownership is denoted by INST. ANALYSTS is the number of analysts covering the firm. CFO_VOL represents cash flow volatility. ACEV_DA*CFO_VOL is the interaction of ACEV_DA with CFO_VOL. The regressions include two-digit SIC code indicators, year indicators, and robust standard errors clustered by firm in the OLS regression. The predicted signs for ACEV_NDA and ACEV_DA are indeterminate, because the relation between SPREAD and the stand-alone coefficient of ACEV with controls for the influence of accounting rules is based on a two-sided hypothesis [H2 (a) and H2 (b)]. See table 1 for detailed definitions of the variables. ACEV regime
SMOOTH (n = 23,657)
VOLATILE (n = 18,077)
OLS regression Robust regression OLS regression Robust regression
Predicted sign
Coeff. t-stat. Coeff. t-stat. Coeff. t-stat. Coeff. t-stat. Intercept 0.03 11.56 0.02 12.59 0.04 10.53 0.03 13.05 ACEV_NDA ? -0.91 -2.27 -0.35 -1.46 0.45 1.27 0.34 1.36 ACEV_DA ? -0.46 -6.54 -0.16 -9.70 0.04 4.68 0.01 6.09 SIZE – -0.20 -3.37 -0.14 -6.48 -0.24 -3.06 -0.23 -6.44 TURN – -0.35 -16.27 -0.16 -18.92 -0.32 -12.39 -0.15 -13.55 AMIHUD + 0.10 19.75 0.18 286.77 0.09 21.79 0.16 237.86 PRC_INV + 0.04 13.24 0.03 76.71 0.04 17.97 0.02 48.11 LEV + 0.01 4.91 0.01 0.24 0.02 11.27 0.01 8.76 MB – -0.22 -10.83 -0.12 -18.50 -0.20 -9.93 -0.11 -13.37 AGE – -0.02 -7.29 -0.01 -12.44 -0.02 -4.33 -0.01 -8.52 INST – -0.14 -11.55 -0.05 -10.67 -0.15 -9.73 -0.08 -12.20 ANALYSTS – -0.03 -10.95 -0.02 -15.02 -0.04 -10.13 -0.02 -11.69 CFO_VOL + 0.04 1.34 0.04 5.33 0.13 5.30 0.07 10.11 ACEV_DA*CFO_VOL ? 2.33 5.66 1.05 10.77 -0.70 -4.01 -0.39 -7.04 Adjusted R2 0.56 – 0.55 –

Table 6: Multivariate regression of PIN on ACEV_NDA and ACEV_DA (Panel B) The dependent variable is the probability of informed trading (PIN). ACEV_NDA (ACEV_DA) is the nondiscretionary (discretionary) component of ACEV. SMOOTH (VOLATILE) is the regime in which earnings are smoother (more volatile) than cash flows. SIZE denotes the market value of equity. TURN is annual turnover. AMIHUD is the Amihud [2002] measure of illiquidity. PRC_INV is the inverse of the stock price. LEV is the amount of leverage, scaled by total assets. MB stands for the market-to-book ratio. AGE is the number of years the firm has been listed on Compustat. The percentage of institutional ownership is denoted by INST. ANALYSTS is the number of analysts covering the firm. CFO_VOL represents cash flow volatility. ACEV_DA*CFO_VOL is the interaction of ACEV_DA with CFO_VOL. The regressions include two-digit SIC code indicators, year indicators, and robust standard errors clustered by firm in the OLS regression. The predicted signs for ACEV_NDA and ACEV_DA are indeterminate, because the relation between PIN and the stand-alone coefficient of ACEV with controls for the influence of accounting rules is based on a two-sided hypothesis [H2 (a) and H2 (b)]. See table 1 for detailed definitions of the variables. ACEV regime
SMOOTH (n = 7,702)
VOLATILE (n = 4,693)
OLS regression Robust regression OLS regression Robust regression
Predicted sign
Coeff. t-stat. Coeff. t-stat. Coeff. t-stat. Coeff. t-stat. Intercept 0.28 26.97 0.26 32.75 0.27 34.45 0.25 35.13 ACEV_NDA ? -196.56 -2.22 -198.15 -3.57 -159.56 -2.34 -158.62 -3.08 ACEV_DA ? -1.25 -3.09 -1.54 -6.61 0.10 1.92 0.13 3.78 SIZE – -2.89 -8.48 -2.59 -14.41 -2.88 -8.37 -2.50 -10.88 TURN – -3.53 -14.77 -2.82 -20.92 -2.88 -12.56 -2.23 -14.61 AMIHUD + 0.10 4.12 0.09 6.76 0.08 5.27 0.08 8.70 PRC_INV + 0.03 2.10 0.05 8.00 0.01 1.66 0.03 5.69 LEV + -0.02 -3.07 -0.01 -4.40 -0.01 -0.85 0.01 0.20 MB – -0.92 -8.57 -0.76 -11.16 -0.78 -6.87 -0.66 -7.76 AGE – -0.05 -4.55 -0.06 -11.22 -0.03 -2.97 -0.04 -6.00 INST – -0.32 -5.42 -0.17 -5.17 -0.30 -4.67 -0.17 -3.90 ANALYSTS – -0.15 -11.08 -0.13 -14.56 -0.14 -10.78 -0.14 -12.10 CFO_VOL + 0.73 3.53 0.57 3.92 0.83 3.55 0.92 6.69 ACEV_DA*CFO_VOL ? 21.51 4.58 22.18 7.83 -7.10 -3.18 -8.34 -5.69 Adjusted R2 0.43 – 0.42 –

Table 7: Relation between SPREAD and ACEV during periods of extreme performance (Panel A) The dependent variable is SPREAD, the bid-ask spread. ACEV is the accrual component of earnings volatility. SMOOTH (VOLATILE) is the regime in which earnings are smoother (more volatile) than cash flows. EXTREME is an indicator variable set to 1 for firms with a current-year annual stock return in the tenth (first) decile of the annual stock return distribution in the SMOOTH (VOLATILE) regime. ACEV*EXTREME is the interaction of ACEV with EXTREME. SIZE denotes the market value of equity. TURN is annual turnover. AMIHUD is the Amihud [2002] measure of illiquidity. PRC_INV is the inverse of the stock price. LEV is the amount of leverage. MB stands for the market-to-book ratio. AGE is the number of years the firm has been listed on Compustat. INST is the percentage of institutional ownership. ANALYSTS is the number of analysts covering the firm. CFO_VOL represents cash flow volatility. ACEV*CFO_VOL is the interaction of ACEV with CFO_VOL. The regressions include two-digit SIC code indicators, year indicators, and robust standard errors clustered by firm in the OLS regression. The positive (negative) predicted sign for ACEV*EXTREME in the SMOOTH (VOLATILE) regime is based on the predictions in section 5.3. See table 1 for detailed definitions of the variables.
ACEV regime
SMOOTH (n = 37,249)
VOLATILE (n = 30,676)
OLS regression Robust regression OLS regression Robust regression
Predicted sign
Coeff. t-stat. Coeff. t-stat. Coeff. t-stat. Coeff. t-stat. Intercept 0.03 6.05 0.03 15.05 0.05 7.49 0.04 13.80 ACEV +/– -0.49 -9.52 -0.18 -15.58 0.03 4.69 0.01 5.77 ACEV*EXTREME +/– 0.21 4.52 0.10 8.89 0.01 0.13 -0.01 -2.20 EXTREME ? -0.01 -13.51 -0.01 -13.65 0.03 24.54 0.02 37.83 SIZE – -0.08 -1.66 -0.09 -5.01 -0.11 -1.91 -0.16 -5.76 TURN – -0.30 -16.62 -0.14 -19.88 -0.40 -20.24 -0.18 -21.31 AMIHUD + 0.10 25.08 0.18 355.76 0.09 28.92 0.16 292.77 PRC_INV + 0.04 18.87 0.03 95.48 0.04 22.65 0.02 62.80 LEV + 0.01 7.26 0.01 4.67 0.02 11.16 0.01 10.65 MB – -0.15 -9.08 -0.10 -20.19 -0.13 -8.50 -0.08 -13.27 AGE – -0.02 -10.10 -0.01 -16.73 -0.02 -5.68 -0.01 -11.30 INST – -0.16 -15.36 -0.06 -16.60 -0.15 -12.11 -0.09 -16.03 ANALYSTS – -0.04 -14.69 -0.02 -19.73 -0.04 -12.60 -0.03 -14.78 CFO_VOL + 0.05 2.70 0.04 8.79 0.07 5.02 0.04 8.32 ACEV*CFO_VOL ? 2.27 7.64 0.96 14.67 -0.44 -3.68 -0.18 -4.77 Adjusted R2 0.57 – 0.57 –

Table 7: Relation between PIN and ACEV during periods of extreme performance (Panel B) The dependent variable is the probability of informed trading (PIN). ACEV is the accrual component of earnings volatility. SMOOTH (VOLATILE) is the regime in which earnings are smoother (more volatile) than cash flows. EXTREME is an indicator variable set to 1 for firms with a current-year annual stock return in the tenth (first) decile of the annual stock return distribution in the SMOOTH (VOLATILE) regime. ACEV*EXTREME is the interaction of ACEV with EXTREME. SIZE denotes the market value of equity. TURN is annual turnover. AMIHUD is the Amihud [2002] measure of illiquidity. PRC_INV is the inverse of the stock price. LEV is the amount of leverage. MB stands for the market-to-book ratio. AGE is the number of years the firm has been listed on Compustat. INST is the percentage of institutional ownership. ANALYSTS is the number of analysts covering the firm. CFO_VOL represents cash flow volatility. ACEV*CFO_VOL is the interaction of ACEV with CFO_VOL. The regressions include two-digit SIC code indicators, year indicators, and robust standard errors clustered by firm in the OLS regression. The positive (negative) predicted sign for ACEV*EXTREME in the SMOOTH (VOLATILE) regime is based on the predictions in section 5.3. See table 1 for detailed definitions of the variables.
ACEV regime
SMOOTH (n = 11,392)
VOLATILE (n = 7,111)
OLS regression Robust regression OLS regression Robust regression
Predicted sign
Coeff. t-stat. Coeff. t-stat. Coeff. t-stat. Coeff. t-stat. Intercept 0.25 17.42 0.24 21.32 0.23 30.62 0.22 9.70 ACEV +/– -1.22 -4.02 -1.41 -7.81 0.12 2.83 0.13 4.35 ACEV*EXTREME +/– 0.35 1.35 0.62 3.63 -0.11 -1.87 -0.11 -2.47 EXTREME ? 0.01 3.18 0.01 4.34 0.02 6.45 0.02 7.16 SIZE – -2.66 -10.64 -2.36 -17.56 -2.78 -10.13 -2.46 -14.76 TURN – -3.65 -18.70 -2.94 -26.03 -3.13 -16.99 -2.48 -19.21 AMIHUD + 0.09 4.83 0.09 8.76 0.09 7.33 0.10 13.54 PRC_INV + 0.03 3.00 0.05 10.04 0.01 0.70 0.02 4.70 LEV + -0.13 -2.31 -0.01 -3.35 -0.01 -1.51 -0.01 -1.20 MB – -0.83 -9.32 -0.69 -12.33 -0.63 -7.02 -0.50 -7.50 AGE – -0.06 -6.97 -0.07 -16.20 -0.04 -3.91 -0.04 -8.14 INST – -0.30 -6.13 -0.17 -6.42 -0.26 -5.01 -0.15 -4.41 ANALYSTS – -0.13 -12.11 -0.12 -16.37 -0.13 -11.65 -0.12 -13.27 CFO_VOL + 0.44 2.71 0.34 3.06 0.68 4.22 0.60 6.06 ACEV*CFO_VOL ? 16.02 4.25 15.19 7.00 -4.74 -2.84 -4.55 -4.20 Adjusted R2 0.45 – 0.43 –

Table 8: Multivariate regression of SPREAD on ACEV controlling for LAG_SPREAD (Panel A) The dependent variable is the bid-ask spread (SPREAD). ACEV is the accrual component of earnings volatility. SMOOTH (VOLATILE) is the regime in which earnings are smoother (more volatile) than cash flows. SIZE denotes the market value of equity. TURN is annual turnover. AMIHUD is the Amihud [2002] measure of illiquidity. PRC_INV is the inverse of the stock price. LAG_SPREAD is the lagged value of the bid-ask spread. The regressions include year indicators and robust standard errors clustered by firm in the OLS regression. The predicted sign for ACEV is indeterminate, because the relation between SPREAD and ACEV with controls for LAG_SPREAD is an empirical question. See table 1 for detailed definitions of the variables. SMOOTH regime
(n = 35,932) VOLATILE regime
(n = 29,640) OLS regression Robust regression OLS regression Robust regression
Predicted
sign Coeff. t-stat. Coeff. t-stat. Coeff. t-stat. Coeff. t-stat. Intercept -0.01 -2.91 0.01 1.59 0.01 2.23 0.01 3.26 ACEV ? -0.08 -5.19 -0.01 -4.02 0.03 6.78 0.01 6.29 SIZE – -0.05 -4.98 -0.04 -4.02 -0.09 -5.70 -0.06 -3.99 TURN – -0.03 -2.62 -0.01 -2.25 -0.01 -0.71 -0.01 -0.61 AMIHUD + 0.01 0.15 0.01 31.21 -0.01 -2.58 -0.02 -35.45 PRC_INV + 0.01 4.24 0.01 10.31 0.01 3.84 0.01 10.07 LAG_SPREAD + 0.87 78.17 0.78 426.23 0.93 70.03 0.81 316.64 Adjusted R2 0.74 – 0.71 –

Table 8: Multivariate regression of changes in SPREAD on changes in ACEV (Panel B) Columns 1 and 2 represent those firm-year observations where the value of ACEV has moved from the third quintile to the second quintile (i.e., earnings have become smoother than cash flows). Columns 3 and 4 represent those firm-year observations for which the value of ACEV has moved from the third quintile to the fourth quintile (i.e., earnings have become more volatile than cash flows). The dependent variable in columns 1 and 3 is the annual bid-ask spread (Annual SPREAD) and that in columns 2 and 4 is the earnings announcement bid-ask spread (Short-Window SPREAD). ACEV_CHNG is the change in the accrual component of earnings volatility (ACEV) defined as this year’s value of ACEV minus last year’s value of ACEV. SIZE denotes the market value of equity. TURN is annual turnover. AMIHUD is the Amihud [2002] measure of illiquidity. PRC_INV is the inverse of the stock price. LAG_SPREAD is the lagged value of the bid-ask spread. The regressions include year indicators and robust standard errors clustered by firm in the OLS regression. The predicted sign for ACEV_CHNG is indeterminate, because the relation between changes in SPREAD and changes in ACEV is an empirical question. See table 1 for detailed definitions of the variables. Change in ACEV between
quintiles 3 and 2
Col. 1 Col.2
Change in ACEV between quintiles 3 and 4
Col. 3 Col.4 Annual
SPREAD (n = 2,138)
Short-Window SPREAD
(n = 1,856)
Annual SPREAD
(n = 1,523)
Short-Window SPREAD
(n = 1,279)
Predicted sign
Coeff. t-stat. Coeff. t-stat. Coeff. t-stat. Coeff. t-stat. Intercept 0.01 1.72 0.01 1.55 0.01 1.17 0.01 3.15 ACEV_CHNG ? -0.95 -1.66 -0.33 -0.68 0.84 1.68 0.70 1.78 SIZE – -0.01 -0.22 0.01 0.11 -0.08 -1.40 -0.09 -1.99 TURN – -0.04 -1.16 -0.04 -1.43 -0.02 -0.37 -0.10 -2.69 AMIHUD + -0.03 -2.07 -0.03 -1.54 -0.01 -0.15 -0.02 -1.76 PRC_INV + 0.01 1.33 -0.01 -0.26 0.01 0.73 0.01 0.32 LAG_SPREAD + 0.89 16.70 0.95 21.61 0.91 12.23 0.90 13.06 Adjusted R2 0.77 0.78 0.73 0.75

Figure 1: ACEV and the SMOOTH and VOLATILE regimes ACEV denotes the accrual component of earnings volatility. Var (E) represents the variance of annual earnings before extraordinary items, scaled by assets. Var (CF) is the variance of cash flow from operations over five years, scaled by assets. SMOOTH (VOLATILE) is the regime in which earnings are smoother (more volatile) than cash flows. See table 1 for detailed definitions of the variables.

Figure 2: Distribution of ACEV SPREAD denotes the relative bid-ask spread. PIN is the probability of informed trading. ACEV is the accrual component of earnings volatility. SMOOTH (VOLATILE) is the regime in which earnings are smoother (more volatile) than cash flows. See table 1 for detailed definitions of the variables. Panel A: SPREAD sample

Figure 2: Distribution of ACEV (cont’d.) Panel B: PIN sample

Figure 3: Relation between informed trading (SPREAD and PIN) and ACEV SPREAD is the relative bid-ask spread. PIN is the probability of informed trading. ACEV is the accrual component of earnings volatility. The horizontal axes plot ACEV deciles and the vertical axes plot deciles of SPREAD (panel A) and PIN (panel B). SMOOTH (VOLATILE) is the regime in which earnings are smoother (more volatile) than cash flows. See table 1 for detailed definitions of the variables. Panel A: SPREAD and ACEV

Figure 3: Relation between informed trading (SPREAD and PIN) and ACEV (cont’d.) Panel B: PIN and ACEV

Appendix 1: Timeline of variable definitions ACEV denotes the accrual component of earnings volatility. EARNINGS_VOL measures the variance of five years’ annual earnings before extraordinary items, scaled by assets. CFO_VOL is the variance of cash flow from operations over five years, scaled by assets. SIZE denotes the market value of equity. TURN is annual turnover. AMIHUD is the Amihud [2002] measure of illiquidity. PRC_INV is the inverse of the stock price. LEV is the amount of leverage. MB stands for the market-to-book ratio. AGE is the number of years the firm has been listed on Compustat. INST is the percentage of institutional ownership. ANALYSTS is the number of analysts covering the firm. SPREAD is the relative bid-ask spread. PIN stands for the probability of informed trading. See table 1 for detailed definitions of the variables.

Appendix 2: Accounting items associated with ACEV in the most SMOOTH and most VOLATILE deciles
To provide better intuitions about ACEV, I identify accounting items that cause a
mismatch between earnings before extraordinary items and cash flow from operations, thereby
possibly leading to large absolute values of ACEV (in the extreme SMOOTH and VOLATILE
deciles). One example of a mismatch is profit/loss on sale of property, plant and equipment,
which affects earnings before extraordinary items but does not affect cash flow from operations.
In categorizing the accounting items associated with ACEV in the most SMOOTH and
most VOLATILE deciles, I make the following assumptions. (i) Items that affect the balance
sheet (income statement) and represent more than 10% (5%) of total assets are considered. (ii)
“Capex” refers to capital expenditures incurred during the year. (iii) Profit or loss on sale of
property, plant, and equipment is classified as “Profit/loss on sale of PPE.” (iv) Income from
discontinued operations and extraordinary income are classified under “Discontinued
operations.” (v) Unrealized income or losses from unconsolidated subsidiaries are reported as
“Noncash share of subsidiary.” (vi) Changes in accounts receivables (AR) and changes in
inventory are classified into increases, decreases, and decreases with an accompanying charge to
special items. The rationale is that if accounts receivable or inventory reductions are
accompanied by a charge to special items, they might indicate write-offs. (vii) Changes in
accounts payable (AP) are classified under a single category. (viii) Amortizations classified as
special items are categorized separately. (ix) Other amortizations (such as customer acquisition
expenditures) that are considered operating expenses are shown as “Amortization—operating.”
(x) Items affecting the balance sheet (B/S) but not the income statement (I/S) (such as
cumulative translation adjustments, deferred compensation, etc.) are classified under “Items
affecting B/S and not I/S.” This category includes changes in current deferred assets. (xi) “Other

special items” indicates charges to special items that have not been considered in (iii), (vi), or
(viii) above. (xii) The category “Narrowly beat analyst forecast” includes instances in which the
firm beats the median analyst forecast by less than one cent. Although meeting or missing
analyst forecasts would not by itself lead to larger absolute values of ACEV, this category
captures incentives to smooth earnings or to take earnings baths.
In panels A and B below I present the frequency of the above items for the most
SMOOTH and most VOLATILE deciles respectively. Earnings that are smoother than cash flows
are associated with the following: periods of capital expenditures (14% of the time); increases in
accounts receivable (14%), presumably due to increases in sales; periods of beating the median
analyst forecast by less than one cent (14%); changes in accounts payable (11%); and increases
in inventory (10%). Accrual components that make earnings more volatile than cash flows are
associated with capital expenditures (16% of the time); changes in accounts payable (15%);
increases in accounts receivable (8%); increases in other special items (8%); profit/loss on sale of
property, plant and equipment (7%); decreases in accounts receivable accompanied by a special
item (7%); and beating analyst forecasts (7% of the time). The values of ACEV in both the
deciles are associated with periods of growth, as evidenced by capital expenditures and changes
in accounts payable. However, increases in accounts receivable are more common among firms
with earnings that are smoother than cash flows (14%) than among firms with earnings that are
more volatile than cash flows (8%). Increases in inventory are also more common for the most
SMOOTH decile (10%) compared to the most VOLATILE decile (4%). The percentage of firms
that smooth earnings and narrowly beat analyst forecasts is higher (14%) than the percentage that
make earnings more volatile than cash flows and narrowly beat analyst forecasts (7%). Finally,
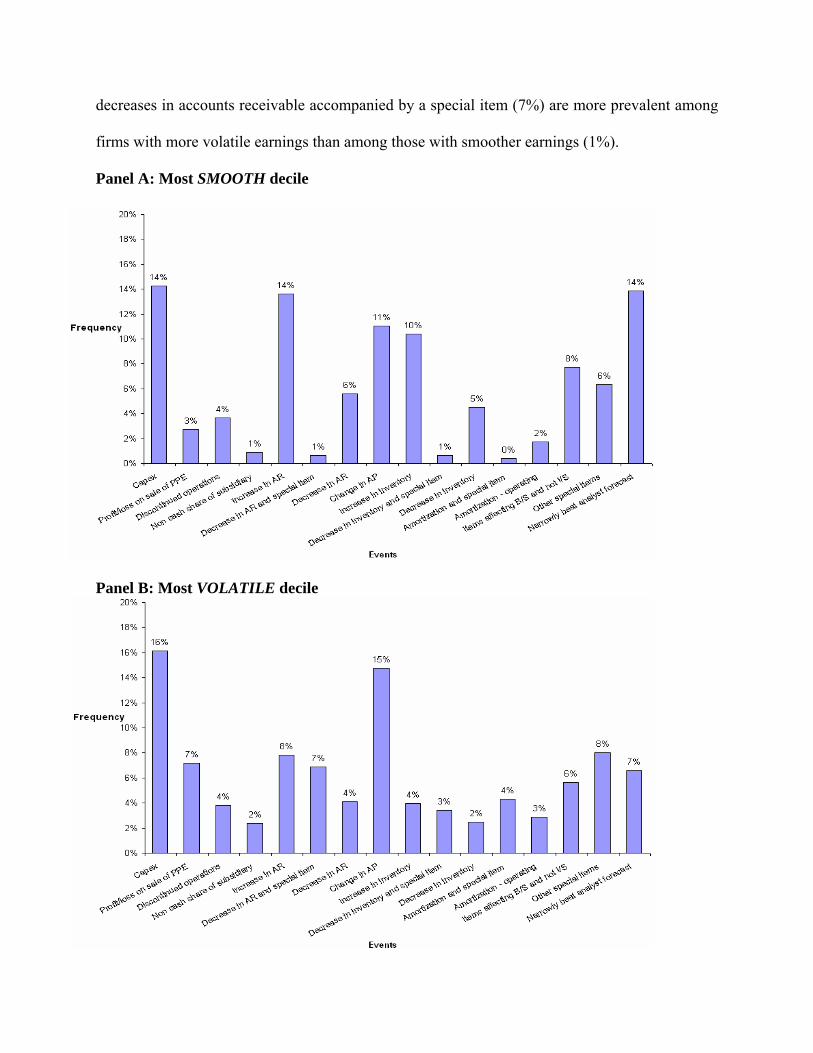
decreases in accounts receivable accompanied by a special item (7%) are more prevalent among
firms with more volatile earnings than among those with smoother earnings (1%).
Panel A: Most SMOOTH decile
Panel B: Most VOLATILE decile

Appendix 3: Transition matrix of ACEV ACEV denotes the accrual component of earnings volatility. The quintiles are formed on the basis of the values of ACEV: the first quintile (MOST SMOOTH) comprises observations with earnings that are the smoothest relative to cash flows, while the fifth quintile (MOST VOLATILE) consists of observations with earnings that are the most volatile relative to cash flows. Panel A: One year later
ACEV quintiles in year t + 1
Most
SMOOTH 2 3 4 Most
VOLATILE Missing TotalMost SMOOTH 0.60 0.16 0.04 0.03 0.04 0.13 1.00 2 0.13 0.46 0.18 0.07 0.04 0.12 1.00 3 0.04 0.17 0.45 0.17 0.04 0.13 1.00 4 0.03 0.07 0.17 0.46 0.12 0.15 1.00
ACEV quintiles in year t
Most VOLATILE 0.02 0.02 0.03 0.11 0.60 0.22 1.00 Panel B: Five years later
ACEV quintiles in year t + 5
Most
SMOOTH 2 3 4 Most
VOLATILE Missing Total
Most SMOOTH 0.13 0.10 0.07 0.07 0.07 0.56 1.00 2 0.08 0.12 0.12 0.08 0.05 0.55 1.00 3 0.05 0.10 0.14 0.10 0.05 0.56 1.00 4 0.05 0.08 0.09 0.11 0.07 0.60 1.00
ACEV quintiles in year t
Most VOLATILE 0.04 0.04 0.04 0.06 0.10 0.72 1.00
In panel A I report the quintiles that ACEV moves to in the following year, while in panel
B I present the quintiles that ACEV moves to after 5 years. 60% of the observations in the
extreme ACEV quintiles remain in that quintile one year later (panel A). Firms with persistently
smoother earnings do differ from those with more volatile earnings. However, the percentage of
observations in the MOST VOLATILE quintile that drop out of the sample (22%) is larger than in
the MOST SMOOTH quintile (13%). There is a high level of attrition in the sample (panel B):
almost half of the sample drops out over five years. The percentage of drop-outs is higher for the
MOST VOLATILE quintile (72%) than for all the other quintiles. Firms with persistently smooth
earnings (13%) are more frequent than those having more volatile earnings (10%).