earth and planetary science letters -...
TRANSCRIPT

Earth and Planetary Science Letters 274 (2008) 499–510
Contents lists available at ScienceDirect
Earth and Planetary Science Letters
j ourna l homepage: www.e lsev ie r.com/ locate /eps l
Advance–retreat history of the East-Asian summer monsoon rainfall belt overnorthern China during the last two glacial–interglacial cycles
Shiling Yang ⁎, Zhongli DingKey Laboratory of Cenozoic Geology and Environment, Institute of Geology and Geophysics, Chinese Academy of Sciences, Beijing 100029, China
⁎ Corresponding author. Key Laboratory of CenozoInstitute of Geology and Geophysics, Chinese AcBeiTuChengXi Road, Beijing 100029, China. Tel.: +8662010846.
E-mail address: [email protected] (S. Yang).
0012-821X/$ – see front matter © 2008 Elsevier B.V. Aldoi:10.1016/j.epsl.2008.08.001
a b s t r a c t
a r t i c l e i n f oArticle history:
In northern China, the his Received 9 March 2008Received in revised form 18 July 2008Accepted 4 August 2008Available online 16 September 2008Editor: P. DeMenocal
Keywords:East-Asian summer monsoonrainfall beltChinese loessgrain sizeMu Us desertglacial–interglacial cycle
tory of desert migration provides a good measure of the East-Asian summermonsoon variations, since the desert margin environment is very sensitive to changes in summer monsoonrainfall. Desert margin migration can be well documented in the downwind loess deposits, since the grainsize of Chinese loess is principally controlled by source-to-sink distance and hence the loess grain size is aneffective proxy for reconstructing the history of the East-Asian summer monsoon. In order to investigate thepattern and migration of the summer monsoon rainfall belt over northern China during the past two glacial–interglacial cycles, contour maps of loess grain size were constructed for MIS 2, 3, 4, 5, 6 and 7. All the grain-size isolines show a near north–south gradient for both glacials and interglacials, indicating a dominant dustsource region in north and an approximately north–south dust transport pathway for dust deposits in themain body of the Loess Plateau, at least for the past two glacial–interglacial cycles. The reconstructedsoutheast desert margin for MIS 2, 3, 4, 5, 6 and 7 roughly parallels the present isohyets, implying that thepattern of the East-Asian summer monsoon rainfall belt during the past two glacial–interglacial cycles issimilar to the present, i.e. a northeast–southwest trend for the isohyets of the summer monsoon, despite theglacial–interglacial cycles. Using the grain-size isolines of MIS 2 as a reference, we derive a northerly desertretreat of ∼160 km, ∼19 km, ∼225 km and ∼223 km for MIS 3, 4, 5 and 7, respectively, and a southerly desertadvance of ∼29 km for MIS 6, that could be preliminarily regarded as the relative migration distance for theEast-Asian summer monsoon rainfall belt. In addition, the inferred climate conditions in MIS 3 are cool andhumid in northern China, while the driest and coldest interval of the last two glacial periods occurs in MIS 6.
© 2008 Elsevier B.V. All rights reserved.
1. Introduction
The East-Asian summer monsoon, a product of dynamic interac-tions between ocean, atmosphere and continent, is one of the mostenergetic elements of the global climate system. Variations inmonsoon intensity can result in severe droughts or floods that havedevastating effects on society in densely populated East Asia (e.g.Webster et al., 1998). Meteorologists have shown that changes in theintensity of the East-Asian summer monsoon are essentially reflectedby the advance or retreat of the monsoon frontal rainfall belt. It isgenerally accepted that the more northerly the penetration of thefrontal rainfall belt, the greater the intensity of the summer monsoon(Tao and Chen, 1987).
At present, the annual precipitation increases from northwest tosoutheast across China. The isohyets run from northeast to southwestin the arid to semi-arid regions (Figs. 1 and 2). In the last two decades,researchers have convincingly demonstrated that the Pleistocene
ic Geology and Environment,ademy of Sciences, No. 19,
10 82998526; fax: +86 10
l rights reserved.
East-Asian summer monsoon variability is closely associated withglobal glacial–interglacial cycles (e.g. An et al., 1990; Ding et al., 1995;Liu and Ding, 1998; Hao and Guo, 2005). However, two majorquestions still remain unanswered. First, is the pattern of themonsoon rainfall belt during the geological past similar to thepresent? Second, to what extent can the monsoon rainfall beltmigrate during glacial–interglacial cycles? Answers to both questionsare the key to better understanding of the forcing mechanisms forvariations of the East-Asian monsoon, and would provide a basis forthe projection of future climatic trends.
In northern China, desert environment changes are very sensitiveto the advance or retreat of the summermonsoon rainfall belt, and thedesert–loess transitional area is thought to be the marginal zone ofthe present East-Asian summer monsoon. As shown in Fig. 1, thedistribution of 100- to 600-mm isohyets today roughly parallelthe southeast margin of the deserts, indicating a close relationshipbetween desert environment and monsoon rainfall amount. Previousstudies (e.g. Dong et al., 1998; Sun et al., 1998; Ding et al., 2005) haveconvincingly shown that the deserts retreated northwestward duringinterglacials due to a stronger summer monsoon, and expandedsoutheastward during glacials as the summer monsoon weakened. Inthis context, if desert margin migration could be quantitativelyreconstructed, the extent of monsoon rainfall belt migration would

Fig.1. Schematic map showing the distribution of loess, desert andmean annual precipitation isohyets (mm, dashed lines) in China. The arrows indicate the advance of the East-Asiansummer monsoon rainfall belt. Deserts: A, Taklimakan; B, Gurbantunggut (Junggar); C, Kumtag; D, Qaidam; E, Badain Jaran; F, Tengger; G, Mu Us; H, Hobq; I, Otindag; J, Horqin; K,Hulun Buir.
500 S. Yang, Z. Ding / Earth and Planetary Science Letters 274 (2008) 499–510
bewell assessed. However, this reconstruction on orbital time scales ishindered by the paucity of long, continuous, well-dated geologicalrecords inside the deserts.
The loess deposits downwind of the deserts potentially provideenvironmental records for the reconstruction of the extent of desertmargin migrations. Recent studies have shown that the grain-sizedistribution of loess is principally controlled by the source-to-sinkdistance, i.e. generally speaking, the greater the dust transportdistance the finer the grain size for dust deposits (Yang and Ding,2004; Ding et al., 2005). Thus, it should be possible to estimate theextent of past desert margin migrations by determining the spatialdisplacement of the loess grain-size isolines. In this paper, we firstpresent grain-size contour maps for marine isotope stages (MIS) 2, 3,4, 5, 6 and 7, for the main body of the Chinese Loess Plateau (Fig. 1).Then we attempt to characterize the pattern and the migrationdistance of the East-Asian summer monsoon rainfall belt for the lasttwo glacial–interglacial cycles.
2. Locations and lithostratigraphy
In this study, 53 loess sections (Fig. 2; Table 1) were systematicallysampled and analyzed in the main body of the Loess Plateau, which issurrounded by the Mu Us desert, Liupan Mts., Qinling Mts., andLüliang Mts. (Fig. 1). Thirty-seven sections consist of loess depositsabove soil unit S2, 11 sections above S1 and at 5 sites (HLGE, PG-I, AS,ZD andWQ) in the northern Loess Plateau, only the sequence S0-L1 orpart of it was found (Figs. 3 and 4). Thirty-nine sites constitute four
approximately north–south loess transects, stretching fromHD to YAL,YL to WN, JB to LAT and HLGE to WX (Fig. 2).
The Holocene soil, S0, is dark in color because of its relatively highorganic matter content, and has been partly or totally eroded, ordisturbed by agricultural activities atmost sites across the Loess Plateau.The loessunits L1and L2weredepositedduring the last andpenultimateglacial periods, respectively. Both L1 and L2 are yellowish in color andmassive in structure. The L1 loess unit can be generally subdivided intofive sub-units, termed L1-1, L1-2, L1-3, L1-4, and L1-5 (Figs. 3 and 4). L1-2 and L1-4 are weakly developed soils, and the others are typical loesshorizons. Previous studies (Kukla,1987; Lu et al.,1987; Ding et al., 2002;Luet al., 2007b) have shown that L1-1 is correlatedwithMIS2, L1-5withMIS 4, and L1-2, L1-3 and L1-4 together with MIS 3. The fivefoldsubdivision of L1 is clearly expressed in the grain-size curves (Figs. 3 and4). The L2 loess unit is also composed of three typical loess layers (L2-1,L2-3 and L2-5) and two weakly developed soils (L2-2 and L2-4), assuggested by the grain-size curves (Figs. 3 and 4). The L2 loess unit iscorrelativewithMIS 6. The soil units S1 and S2 developed in the last andpenultimate interglacial periods and correlate with MIS 5 and 7,respectively (Kukla, 1987; Lu et al., 1987; Ding et al., 2002; Lu et al.,2007b). Both of the soils are brownishor reddish in color, andhave anA–Bw–C or A–Bt–C horizon sequence. Soil unit S2 is composed of two soils(S2-1 and S2-2) and a thin intervening loess horizon. The horizons of L1-1, L1-4, L1-5, S1, L2-3 and S2-1 can be regarded as the representativedust deposits for MIS 2, 3, 4, 5, 6 and 7, respectively. The stratigraphy ofall the sections is correlative in the field, suggesting near-continuousdust accumulation during the last two glacial–interglacial cycles.
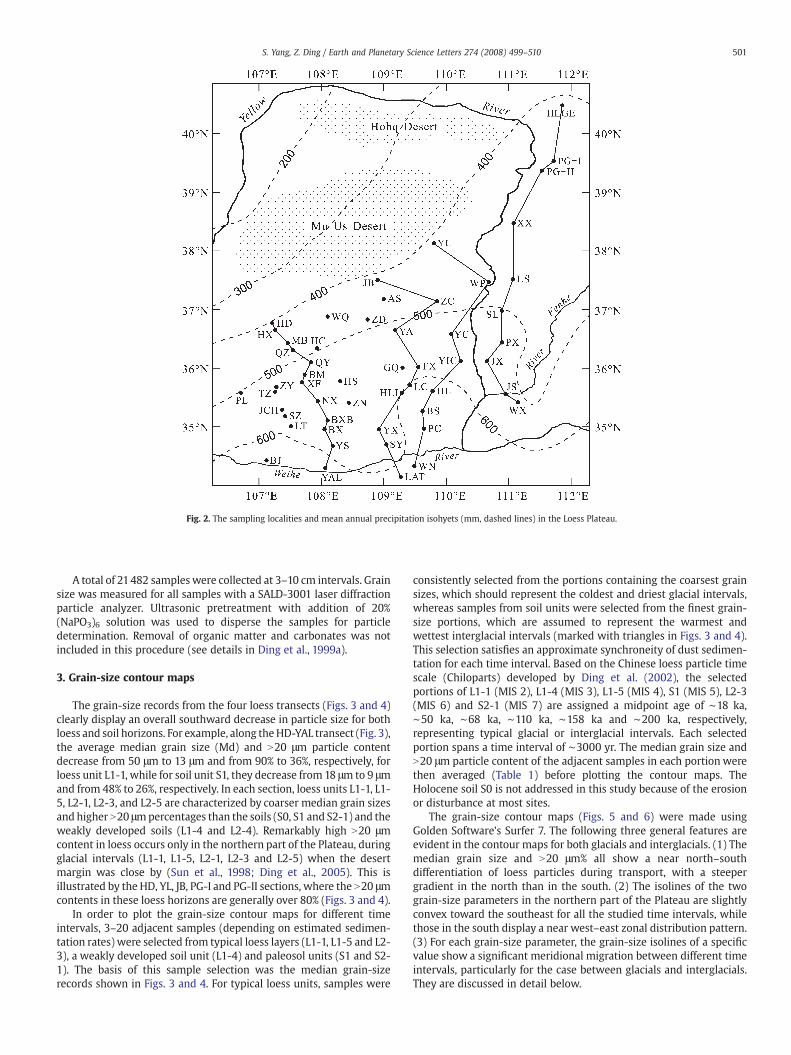
Fig. 2. The sampling localities and mean annual precipitation isohyets (mm, dashed lines) in the Loess Plateau.
501S. Yang, Z. Ding / Earth and Planetary Science Letters 274 (2008) 499–510
A total of 21482 samples were collected at 3–10 cm intervals. Grainsize was measured for all samples with a SALD-3001 laser diffractionparticle analyzer. Ultrasonic pretreatment with addition of 20%(NaPO3)6 solution was used to disperse the samples for particledetermination. Removal of organic matter and carbonates was notincluded in this procedure (see details in Ding et al., 1999a).
3. Grain-size contour maps
The grain-size records from the four loess transects (Figs. 3 and 4)clearly display an overall southward decrease in particle size for bothloess and soil horizons. For example, along theHD-YAL transect (Fig. 3),the average median grain size (Md) and N20 μm particle contentdecrease from 50 μm to 13 μm and from 90% to 36%, respectively, forloess unit L1-1, while for soil unit S1, they decrease from 18 μm to 9 μmand from 48% to 26%, respectively. In each section, loess units L1-1, L1-5, L2-1, L2-3, and L2-5 are characterized by coarser median grain sizesand higher N20 μmpercentages than the soils (S0, S1 and S2-1) and theweakly developed soils (L1-4 and L2-4). Remarkably high N20 μmcontent in loess occurs only in the northern part of the Plateau, duringglacial intervals (L1-1, L1-5, L2-1, L2-3 and L2-5) when the desertmargin was close by (Sun et al., 1998; Ding et al., 2005). This isillustrated by the HD, YL, JB, PG-I and PG-II sections, where the N20 μmcontents in these loess horizons are generally over 80% (Figs. 3 and 4).
In order to plot the grain-size contour maps for different timeintervals, 3–20 adjacent samples (depending on estimated sedimen-tation rates) were selected from typical loess layers (L1-1, L1-5 and L2-3), a weakly developed soil unit (L1-4) and paleosol units (S1 and S2-1). The basis of this sample selection was the median grain-sizerecords shown in Figs. 3 and 4. For typical loess units, samples were
consistently selected from the portions containing the coarsest grainsizes, which should represent the coldest and driest glacial intervals,whereas samples from soil units were selected from the finest grain-size portions, which are assumed to represent the warmest andwettest interglacial intervals (marked with triangles in Figs. 3 and 4).This selection satisfies an approximate synchroneity of dust sedimen-tation for each time interval. Based on the Chinese loess particle timescale (Chiloparts) developed by Ding et al. (2002), the selectedportions of L1-1 (MIS 2), L1-4 (MIS 3), L1-5 (MIS 4), S1 (MIS 5), L2-3(MIS 6) and S2-1 (MIS 7) are assigned a midpoint age of ∼18 ka,∼50 ka, ∼68 ka, ∼110 ka, ∼158 ka and ∼200 ka, respectively,representing typical glacial or interglacial intervals. Each selectedportion spans a time interval of ∼3000 yr. The median grain size andN20 μm particle content of the adjacent samples in each portion werethen averaged (Table 1) before plotting the contour maps. TheHolocene soil S0 is not addressed in this study because of the erosionor disturbance at most sites.
The grain-size contour maps (Figs. 5 and 6) were made usingGolden Software's Surfer 7. The following three general features areevident in the contour maps for both glacials and interglacials. (1) Themedian grain size and N20 μm% all show a near north–southdifferentiation of loess particles during transport, with a steepergradient in the north than in the south. (2) The isolines of the twograin-size parameters in the northern part of the Plateau are slightlyconvex toward the southeast for all the studied time intervals, whilethose in the south display a near west–east zonal distribution pattern.(3) For each grain-size parameter, the grain-size isolines of a specificvalue show a significant meridional migration between different timeintervals, particularly for the case between glacials and interglacials.They are discussed in detail below.

Table 1Sites and averaged grain-size data (median grain size (Md) and N20 μm particle content) for different time intervals
Section Abbr. Lat.(°N)
Long.(°E)
L1-1 (MIS 2) L1-4 (MIS 3) L1-5 (MIS 4) S1 (MIS 5) L2-3 (MIS 6) S2-1 (MIS 7)
Md(μm)
N20 μm(%)
Md(μm)
N20 μm(%)
Md(μm)
N20 μm(%)
Md(μm)
N20 μm(%)
Md(μm)
N20 μm(%)
Md(μm)
N20 μm(%)
Hongde HD 36.8 107.2 54.3 91.9 22.4 53.9 40.7 75.6 16.1 43.5 64.2 91.6 14.1 39.8Huanxian HX 36.7 107.3 44.4 80.5 20.8 51.4 36.4 72.2 16.0 43.2 57.6 88.2 14.0 40.0Mubo MB 36.4 107.5 40.7 77.7 18.2 46.7 33.9 70.8 15.1 42.2 48.9 85.1 13.4 39.1Quzi QZ 36.3 107.5 35.7 72.1 16.5 43.7 27.9 62.3 13.9 39.4Qingyang QY 36.1 107.8 31.7 67.9 16.7 44.1 24.9 58.5 12.2 36.0 38.9 73.2 12.7 37.1Baimapu BM 35.9 107.7 30.0 65.3 15.1 41.0 25.1 58.6 11.8 36.2 33.6 67.8 12.0 35.9Xifeng XF 35.8 107.7 25.9 59.5 13.6 37.4 24.3 57.7 9.3 29.6 25.1 57.2 11.1 32.6Ningxian NX 35.4 107.9 23.2 55.2 12.1 35.4 20.3 50.5 10.6 32.7 22.0 53.0 10.7 32.7Binxianbei BXB 35.1 108.1 17.6 45.7 11.9 34.2 17.3 45.1 9.3 29.3 24.9 57.4 9.4 29.8Binxian BX 35.0 108.1 17.5 45.4 10.9 31.9 14.8 40.3 8.8 27.1 18.5 47.1 8.1 25.7Yongshou YS 34.7 108.2 16.4 43.3 9.8 28.8 14.3 38.3 8.4 26.3 23.6 56.1 7.1 24.0Yangling YAL 34.3 108.1 14.3 39.1 9.2 26.8 10.6 30.4 8.3 26.1 19.6 49.2 9.0 27.6Jingbian JB 37.5 108.9 25.1 56.8 38.5 68.1Zichang ZC 37.1 109.9 52.0 89.5 22.3 53.5 43.1 80.0 17.8 46.5 58.3 89.2 15.2 42.9Yan'an YA 36.7 109.2 36.1 71.5 20.1 50.1 33.8 70.9 12.8 39.7 47.3 80.5Ganquan GQ 36.0 109.3 23.9 56.2 14.2 39.3 27.5 62.7 10.9 35.1 26.8 59.1 10.8 33.5Fuxian FX 36.0 109.6 26.5 60.2 13.5 38.4 23.5 55.9 8.3 29.1 23.9 55.6 11.4 34.8Luochuan LC 35.7 109.4 23.0 54.6 13.1 36.8 18.8 47.9 10.0 32.3 26.8 59.4 11.0 34.5Huangling HLI 35.6 109.3 21.4 52.3 14.4 39.4 20.2 50.3 11.5 34.6 26.8 59.6 10.1 32.4Yaoxian YX 35.0 108.9 18.6 47.5 12.7 36.3 15.0 41.0 8.7 28.8 22.7 54.5 9.2 29.8Sanyuan SY 34.7 109.0 17.1 44.7 12.1 33.9 15.7 42.0 8.5 27.7 20.7 51.3 8.7 28.1Lantian LAT 34.2 109.3 11.1 32.7 8.4 26.0 9.9 29.8 7.8 26.2 16.3 43.4 7.9 26.2Yulin YL 38.1 109.8 161.4 93.0 45.4 78.1 303.6 95.6 23.1 54.1Wupu WP 37.5 110.7 36.6 70.6 18.0 46.2 33.5 68.4 12.6 35.7Yanchang YC 36.6 110.1 36.8 72.6 18.4 47.0 31.8 68.5 14.4 41.1 43.8 77.4 12.6 37.9Yichuan YIC 36.1 110.2 28.9 63.3 15.7 42.2 25.3 58.8 11.1 33.9 33.8 68.4 11.3 34.6Huanglong HL 35.6 109.8 18.9 48.3 13.0 36.8 20.1 50.3 6.5 25.9 25.5 57.9 10.8 33.4Baishui BS 35.3 109.6 16.0 42.8 13.2 37.2 20.8 51.5 13.3 38.7 22.0 53.3 11.6 35.3Pucheng PC 35.0 109.6 16.3 43.3 8.4 28.0 14.2 38.9 4.8 22.7Weinan WN 34.3 109.5 13.6 31.7 7.4 21.0 10.3 21.8 5.6 12.4 17.5 37.3 5.9 14.5Pianguan-I PG-I 39.5 111.7 82.9 98.3Pianguan-II PG-II 39.4 111.5 24.5 56.4 80.2 91.2 19.2 48.9 54.4 79.1 14.4 43.0Xingxian XX 38.5 111.1 64.8 98.7 24.8 57.2 53.0 90.5 19.0 48.3Lishi LS 37.5 111.1 19.7 49.5 38.2 74.5 17.0 45.2Shilou SL 37.0 110.9 19.9 49.8 32.8 69.4 16.2 44.4Puxian PX 36.4 110.9 33.7 69.2 16.1 43.0 29.5 65.6 11.8 37.4 38.1 72.5 12.9 38.7Jixian JX 36.1 110.7 28.1 62.4 15.5 41.4 25.8 60.0 12.5 37.4Jishan JS 35.6 111.0 26.4 60.2 14.0 39.5 20.5 50.9 8.4 33.3Wenxi WX 35.4 111.2 19.5 49.0 11.5 33.4 19.9 49.8 11.5 35.7Pingliang PL 35.6 106.7 28.4 62.8 14.6 40.2 22.3 54.2 10.6 32.8 26.8 60.0 11.4 34.8Zhenyuan ZY 35.7 107.3 24.8 57.9 13.8 38.4 19.7 49.4 11.8 35.6Tunzi TZ 35.6 107.3 23.9 56.4 12.7 35.5 20.5 51.0 9.4 29.0 22.4 53.6 10.2 29.9Jingchuan JCH 35.3 107.4 20.4 50.6 11.8 34.9 17.4 45.4 9.4 29.8 24.8 57.4 8.7 29.2Shizi SZ 35.2 107.4 16.5 43.5 10.9 31.7 16.6 43.7 9.8 31.2 21.5 52.5 9.2 29.2Lingtai LT 35.0 107.5 13.6 38.2 8.7 24.5 12.4 34.1 7.3 19.1 17.5 46.1 8.6 28.1Baoji BJ 34.4 107.1 14.5 41.3 8.0 25.6 10.5 31.4 7.3 23.7 18.2 46.9 7.8 25.0Zhengning ZN 35.4 108.4 21.7 52.8 11.3 33.0 18.4 47.2 10.1 31.3 24.9 57.6 8.1 27.7Heshui HS 35.8 108.3 25.6 59.1 12.8 37.0 22.4 54.3 9.9 31.9 28.2 62.1 10.4 33.3Huachi HC 36.3 107.9 35.3 71.1 16.6 43.9 30.7 66.9 13.5 38.8 43.5 77.5 12.4 37.7Ansai AS 37.2 109.0 61.8 88.3 28.6 62.6Zhidan ZD 36.8 108.7 43.4 81.2 18.9 48.1Wuqi WQ 36.9 108.1 45.4 81.9 20.1 50.2Helingeer HLGE 40.5 111.9 100.0 100.0
502 S. Yang, Z. Ding / Earth and Planetary Science Letters 274 (2008) 499–510
3.1. Median grain-size contour maps
From north to south, the median grain size decreases fromN50 μm to b18 μm during MIS 2, 4 and 6, from N22 μm to 8 μm duringMIS 3, and from N16 μm to b8 μm during MIS 5 and 7 (Fig. 5). DuringMIS 2, 4 and 6, 50–80 μm isolines are observed in the northern LoessPlateau. These isolines are roughly replaced by 20–28 μm isolinesduring MIS 3, and by 14–20 μm isolines during MIS 5 and 7. The 14–18 μm isolines in the southern part of the Plateau during MIS 2, 4 and
Fig. 3. Changes in median grain size (Md) and N20 μm particle content for the HD-YAL (upppositions for the selected samples used in Figs. 5 and 6 aremarked in solid triangles in each sein the JB section was neglected for constructing the contour maps because the fivefold subd
6, moved to the central part during MIS 3, and to the northern partduring MIS 5 and 7.
3.2. N20 μm particle content contour maps
From north to south, the N20 μm particle contents decreasefrom N80% to b40% during MIS 2, 4 and 6, from N55% to ∼25%during MIS 3, and from N45% to ∼20% during MIS 5 and 7 (Fig. 6).The 70–90% isolines in the northern part of the Plateau during MIS
er panel), YL-WN (middle panel) and JB-LAT (lower panel) transects. The stratigraphicction. The shaded zones indicate interglacials. The grain size of the L1 and L2 loess unitsivision of the two loess units is not as clearly expressed as in other sections.

503S. Yang, Z. Ding / Earth and Planetary Science Letters 274 (2008) 499–510

ig. 4. Changes inmedian grain size (Md) and N20 μmparticle content for the HLGE-WX transect (upper panel) and some additional sites (middle and lower panels). The stratigraphic
504 S. Yang, Z. Ding / Earth and Planetary Science Letters 274 (2008) 499–510
F
positions for the selected samples used in Figs. 5 and 6 are marked in solid triangles in each section. The shaded zones indicate interglacials.
505S. Yang, Z. Ding / Earth and Planetary Science Letters 274 (2008) 499–510
Fig. 5. Median grain-size (μm) contour maps for MIS 2, 3, 4, 5, 6 and 7. The dashed lines indicate the present-day mean annual precipitation isohyets (mm).

Fig. 6. N20 μm particle content (%) contour maps for MIS 2, 3, 4, 5, 6 and 7. The dashed lines indicate the present-day mean annual precipitation isohyets (mm).
506 S. Yang, Z. Ding / Earth and Planetary Science Letters 274 (2008) 499–510

Fig. 7. Changes in median grain size (Md) and N20 μm particle content for the L0–L1-1 portion at GQ, LC and YX (enlarged from Figs. 3 and 4). The shaded zones indicate the lateHolocene loess (L0).
507S. Yang, Z. Ding / Earth and Planetary Science Letters 274 (2008) 499–510
2, 4 and 6 are roughly replaced by the 40–60% isolines during MIS3, 5 and 7. The 40–50% isolines in the southern part of the Plateauduring MIS 2, 4 and 6, moved to the northern part during MIS 3, 5and 7.
4. Estimation of desert migration
4.1. Validity of loess gain size as a proxy for source-to-sink distance
The grain size of the loess in the Loess Plateau can be affected byseveral factors, including source-to-sink distance, transporting windintensity and post-depositional weathering. Previous studies empha-sized theeffect ofwind intensity on loess grain size (An et al.,1991a;Xiaoet al.,1995; Sun et al., 2006). Thewinter monsoonwindsmay have beenstronger during glacials than during interglacials and are thoughtresponsible for the coarsening of the glacial loess. Our recent studiessuggested the dominant role of source-to-sink distance, i.e. a southwardadvance of the deserts leads to the increase in loess grain size and viceversa (Dinget al.,1999b;Yang andDing, 2004;Dinget al., 2005). Herewepresent more observations and provide further support for thedominance of source-to-sink distance effect.
On the Loess Plateau, a thin loess layer overlying the Holocene soil(S0) is observed and termed L0 (e.g. An et al., 1993; Lu et al., 2007b).
Table 2Estimation of northerly retreat (negative values) or southerly advance (positive values) distan2 using the median grain size and N20 μm particle content
MIS 3 (L1-4) MIS 4 (L1-5) MIS 5 (S1)
Isoline Distance(km)
Isoline Distance(km)
Isoline
Md (μm) Md (μm) Md (μm)22 −159 30 −19 1820 −158 25 −21 1618 −159 22 −18 14Mean −159 −19N20 μm% N20 μm% N20 μm%55 −163 75 −26 4550 −159 70 −17 4045 −160 65 −15Mean −161 −19Averagea −160 −19
For each isoline, the migration distance between MIS 2 and other time intervals is obtaineda Distance averaged from estimates of Md and N20 μm% for different time intervals.
This loess unit has been accumulating since the late Holocene andpreserved in a few sections (e.g. GQ, LC and YX) (Fig. 7), although itwas eroded or disturbed at most sites. The L0 loess unit in each sectionis much coarser than the S0 soil and even roughly as coarse as the lastglacial maximum (LGM) loess unit (L1-1) (Fig. 7). According to thereconstruction of Sun et al. (1998), the southeast margin of the Mu Usdesert during the Holocene Optimum (∼8–4 ka BP) migrated far northof its LGM limit in response to increased monsoon rainfall. Then thelast glacial sand dunes have been reactivated under the disturbance ofpoor land-use practice since ∼2300 yr ago (Sun et al., 1998; Sun,2000), leading to the similarity of the present southeast desert marginto that of the LGM. It is believed that the mean velocity of wintermonsoon winds during the LGM has been higher than during theHolocene. Thus the great similarity of grain-size distribution betweenL0 (late Holocene) and L1-1 (LGM) suggests the dominant effect ofsource-to-sink distance on the downwind loess grain size rather thanwind intensity. Moreover, the climate conditions during the entireHolocene are relatively stable (Dansgaard et al., 1993; Grootes et al.,1993), and it is assumable that the winter monsoon intensity duringthis period could not change significantly. Therefore, the greatcontrast in grain size between L0 (late Holocene) and S0 (HoloceneOptimum) demonstrates again the dominant role of source-to-sinkdistance in grain-size changes. It follows that the meridional
ce for the southeast margin of theMu Us desert duringMIS 3, 4, 5, 6 and 7 relative toMIS
MIS 6 (L2-3) MIS 7 (S2-1)
Distance(km)
Isoline Distance(km)
Isoline Distance(km)
Md (μm) Md (μm)−223 50 29 16 −220−228 40 40 14 −238−239 35 36−230 35 −229
N20 μm% N20 μm%−219 85 20 45 −214−217 80 25 40 −220
75 26−218 24 −217−225 29 −223
by averaging the measured distances along 108°E, 109°E and 110°E.

508 S. Yang, Z. Ding / Earth and Planetary Science Letters 274 (2008) 499–510
displacement of loess grain-size isolines provides a good measure forestimating desert margin migration.
Humidity is the most important factor affecting desert marginshift, since desert margin advance can occur only when the vegetationcover there is destroyed with a critical reduction of humidity. In theloess–desert transitional region of northern China, about 80% ofrainfall is attributable to the East-Asian summer monsoon. When thissummer frontal rainfall belt penetrates farther to the north, theincreased rainfall leads to an increase in vegetation cover in the loess–desert transitional area, which makes the active sand dunes stable.Thus the southeast desert margin shows a corresponding northwardshift, as in the case of the Holocene Optimum (Sun et al., 1998). In thiscontext, the grain size of Chinese loess can be used to reconstruct thehistory of the East-Asian summer monsoon.
In most previous studies, loess magnetic susceptibility (Kukla andAn,1989; An et al.,1991b) and various chemical element ratios (Liu et al.,1995;Gallet et al.,1996; Chen et al.,1999;Guoet al., 2000) of theChineseloess–paleosol series have been used as summer monsoon proxies.However, the processes and factors affecting variations in loess–paleosolsusceptibility remain controversial (Kukla et al., 1988; Zhou et al., 1990;Lu et al., 2000; Sun and Liu, 2000). Recent studies have shown thatincreasedmagnetic susceptibility inpaleosolsmaynot result solely fromintensified pedogenic processes arising from increased monsoonalprecipitation (Lu et al., 2000; Sun and Liu, 2000). Changes in elementalconcentrations within loess–paleosol sequences may be determinedlargely by three factors: chemical weathering in source regions, grain-size distribution, and post-depositional weathering. It is only thesignature resulting from post-depositional weathering that can belinked to summer monsoon intensity. Unfortunately, the detailedstudies required to distinguish the major controlling factors in loess
Fig. 8. Southeast margin of the Mu Us desert (heavy dashed lines) estimated from loess graina location similar to that of the present (Sun et al., 1998). The light dashed lines indicate th
element ratios are still pending. In this study, we employ median grainsize, awidely used grain-size parameter, and N20 μmparticle content, toreconstruct the history of desert migrations. The advantages of N20 μmparticle fraction are that: (1) it is a considerable component in loessdeposits (varying from∼20% to 100% in content; Figs. 3, 4 and 6), and (2)it is sensitive to changes in source-to-sink distance, since N20 μm siltparticles are transported by short-term suspension during moderatewindstorms (Pye, 1987; Tsoar and Pye, 1987).
4.2. Extent of desert margin migration for MIS 3, 4, 5, 6 and 7
As mentioned earlier, the southeast margin of the Mu Us desertduring the last glacial maximum (MIS 2) was broadly similar to that oftoday (Sun et al., 1998). In order to estimate the location of the desertmargin for other time intervals, the grain-size isoline distribution andthe location of the southeast desert margin during MIS 2 are used asstandards. The estimation is done by measuring the migrationdistance of a specific grain-size isoline between MIS 2 and othertime intervals. This distance is therefore regarded as the desert marginmigration relative to MIS 2. For example, the 55% isoline of N20 μmcontent during MIS 3 is located ∼163 km north of that in MIS 2 (Fig. 6;Table 2), thus the southeast desert margin duringMIS 3 should also belocated at ∼163 km north of that in MIS 2. To minimize any possiblesedimentation effect (e.g. landform changes and local sourcecontributions) on grain-size distribution, the distance estimates aremainly based on the isolines from the northern part of the LoessPlateau (Table 2), since changes in grain size of loess in north are moresensitive to desert margin migrations.
For each time interval, the estimates using median grain size andN20 μm particle content are very similar (Table 2), indicating both
size for MIS 3, 4, 5, 6 and 7. The southeast margin of the Mu Us desert during MIS 2 lay ine present-day mean annual precipitation isohyets (mm).

509S. Yang, Z. Ding / Earth and Planetary Science Letters 274 (2008) 499–510
parameters being effective for reconstructing desert margin migra-tion. The migration distance of the different grain-size isolines duringeach time interval were averaged for the desert margin reconstruc-tion. As shown in Table 2 and Fig. 8, the desert margin retreatednorthward ∼160 km, ∼19 km, ∼225 km and ∼223 km, respectively,relative to MIS 2 during MIS 3, 4, 5 and 7, while it advanced ∼29 kmsouth during MIS 6. These distance estimates could be approximatelyregarded as the relative migration distance for the East-Asian summermonsoon rainfall belt.
5. Discussion
All the grain-size isolines show a near north–south gradient forboth glacials and interglacials, indicating an approximately north–south dust transport pathway for dust deposition in the main body ofthe Loess Plateau, at least for the past two glacial–interglacial cycles.This differs from a previous contention that emphasized the north-westerly andwesterly winds for the dust input to the Loess Plateau (Luand Sun, 2000). Our results further suggest that the Mu Us desert andthe arid region further north are the dominant sources for the loessdeposits south of the desert. This is close to the conclusion by Sun(2002), but notably different from those that suggested the westerndeserts (e.g. Kumtag, Qaidam and Badain Jaran) as the main sources(Chen et al., 2007; Li et al., 2007).
The grain-size isolines in the northern part of the Loess Plateau areslightly convex toward the southeast duringMIS 2, roughly parallelingthe southeast margin of the Mu Us Desert reconstructed from thedistribution of last glacial sand dunes (Sun et al., 1998). This suggeststhat the distribution of the desert margin is well mirrored by the loessgrain-size isolines in the areas close to the dust source region. Thegrain-size isolines during MIS 3, 4, 5, 6 and 7 all display a similardistribution pattern to that shown in MIS 2, indicating a northeast–southwest trend of the southeast desert margin for the past twoglacial–interglacial cycles. As the distribution of the arid regions innorthern China is closely related to the summer monsoon rainfall(Fig. 1), it is inferred that the pattern of the summer monsoon rainfallbelt during MIS 2, 3, 4, 5, 6 and 7 is similar to the present, i.e. anortheast–southwest trend for themonsoon isohyets through the pasttwo glacial–interglacial cycles, although the rainfall amountsmay varyconsiderably between glacials and interglacials in response to theretreat or advance of the summer monsoon rainfall belt.
On the basis of the spatial grain-size records, the location of thesoutheast margin of the Mu Us desert during MIS 3 is comparable tothe case in MIS 5 and 7, indicating a relatively strong summermonsoon in MIS 3. However, the soil units S1 (MIS 5) and S2-1 (MIS 7)have stronger pedogenic characteristics than the weakly developedsoil unit L1-4 (MIS 3), as indicated by their much redder color (Yangand Ding, 2003), better developed soil structure (Rutter et al., 1991),and greater chemical weathering intensity (Yang et al., 2006). As thedesert environment is very sensitive to changes in humidity, it istherefore inferred that northern China was characterized by arelatively cool and humid climate in MIS 3. This is consistent withthe high lake levels in arid regions of northwestern China duringMIS 3(Pachur et al., 1995; Zhang et al., 2002).
The Mu Us desert retreated northward during MIS 4 and advancedsouthward during MIS 6 relative to MIS 2. This implies that the driestand coldest interval over northern China during the past two glacialperiods occurs in MIS 6 rather than in MIS 2. This is supported by thequantitative estimates of paleotemperature and paleorainfall based onmoraine deposits, lake sediments and loess deposits from northernChina (Pan and Wu, 1997; Wu et al., 2000; Lu et al., 2007a). A recentstudy (Svendsen et al., 2004) has also shown that a huge ice sheetcomplex formed over northern Eurasia during the Late Saalian (∼160–140 ka, MIS 6), which was one of the most extensive Quaternaryglaciations in this part of the world. It thus follows that middle-lateMIS 6 was a period of super-glaciation in Eurasia.
The East-Asian monsoon system arises from the differentialheating of the Asian continent and the Indo-Pacific Oceans (e.g.Webster et al., 1998; Ding, 2004). For orbital time scale variations ofthe summer monsoon, orbitally produced insolation changes arethought to be the initial controlling factor, while the amplitude andphase response relative to the insolation forcing are modulated byglacial age boundary conditions (e.g. Kutzbach, 1981; Prell andKutzbach, 1987; Imbrie et al., 1992; de Noblet et al., 1996; Wang etal., 2005). During glacials, development and expansion of polar icesheets and sea ice cover driven by decreased insolation would haveresulted in a weakened summer monsoon, i.e. a southward retreat ofthe monsoon rainfall belt. This may be explained by three physicalprocesses. (1) Intensified northerly winter monsoon winds wouldimpede northward movement of moisture-laden summer monsoonairflows (Ding et al., 1995). (2) Lowered sea-level and exposure of vastcontinental shelves in the Western Pacific marginal seas wouldincrease the distances between inland and ocean moisture sources,affecting monsoon rainfall belt migration towards the inland desertmargins (Wang, 1999). (3) Lowered sea surface temperatures atmiddle-to-low latitudes, particularly in the Western Pacific marginalseas, would lead to weakened water evaporation and a decreasedsummermonsoon season via delayed onset. These processes would bereversed during interglacials.
6. Conclusions
The grain-size isolines show a consistent, near north–south gradientfor loess deposits south of theMuUs desert, indicating a dominant dustsource region in the north, and an approximately north–south dusttransport pathway for dust deposits in the main body of the LoessPlateau, at least for the past two glacial–interglacial cycles. Thereconstructed southeast desert margin forMIS 2, 3, 4, 5, 6 and 7 roughlyparallels the present isohyets, implying that the pattern of the East-Asian summer monsoon rainfall belt during the past two glacial–interglacial cycles is similar to the present, i.e. a northeast–southwesttrend for the monsoon isohyets, despite the glacial–interglacial cycles.Comparison of the locations of the grain-size isolines betweenMIS2 andMIS 3, 4, 5, 6 and 7 indicates a northerly desert retreat of ∼160 km,∼19 km, ∼225 km and ∼223 km for MIS 3, 4, 5 and 7, respectively, and asoutherly desert advance of ∼29 km for MIS 6. These distance estimatescould be preliminarily regarded as the migration distance of the East-Asian summer monsoon rainfall belt, which may be closely related tochanges in insolation and glacial age boundary conditions. In addition, itis inferred that the climate conditions in MIS 3 are cool and humid innorthern China, while the driest and coldest interval of the last twoglacial periods occurs in MIS 6.
Acknowledgements
This study is funded by the National Natural Science Foundation ofChina (Grant 40572106). We are indebted to E. Arnold for valuablecomments on an earlier version of this paper. We are grateful to P.deMenocal and five anonymous reviewers for critical comments. Wealso thank J.T. Han, Z.Y. Gu, J.L. Xiao and Z.H. Tang for thoughtfuldiscussions, W.Y. Jiang for providing climatic data over China, and J.M.Sun, X. Wang, S.S. Hou, F. Ding, B. Zhou and S.F. Xiong for fieldassistance.
References
An, Z., Liu, T., Lu, Y., Porter, S., Kukla, G., Wu, X., Hua, Y., 1990. The long-termpaleomonsoon variation recorded by the loess–paleosol sequence in central China.Quat. Int. 7/8, 91–95.
An, Z.S., Kukla, G., Porter, S.C., Xiao, J.L., 1991a. Late Quaternary dust flow on the ChineseLoess Plateau. Catena 18, 125–132.
An, Z., Kukla, G.J., Porter, S.C., Xiao, J., 1991b. Magnetic susceptibility evidence ofmonsoon variation on the Loess Plateau of central China during the last130,000 years. Quat. Res. 36, 29–36.

510 S. Yang, Z. Ding / Earth and Planetary Science Letters 274 (2008) 499–510
An, Z., Porter, S.C., Zhou, W., Lu, Y., Donahue, D.J., Head, M.J., Wu, X., Ren, J., Zheng, H.,1993. Episode of strengthened summer monsoon climate of Younger Dryas age onthe Loess Plateau of Central China. Quat. Res. 39, 45–54.
Chen, J., An, Z.S., Head, J., 1999. Variation of Rb/Sr ratios in the loess–paleosol sequencesof central China during the last 130 000 years and their implications for monsoonpaleoclimatology. Quat. Res. 51, 215–219.
Chen, J., Li, G., Yang, J., Rao, W., Lu, H., Balsam, W., Sun, Y., Ji, J., 2007. Nd and Sr isotopiccharacteristics of Chinese deserts: implications for the provenances of Asian dust.Geochim. Cosmochim. Acta 71, 3904–3914.
Dansgaard, W., Johnsen, S.J., Clausen, H.B., Dahl-Jensen, D., Gundestrup, N.S., Hammer,C.U., Hvidberg, C.S., Steffensen, J.P., Sveinbjörnsdottir, A.E., Jouzel, J., Bond, G., 1993.Evidence for general instability of past climate from a 250-kyr ice-core record.Nature 364, 218–220.
de Noblet, N., Braconnot, P., Joussaume, S., Masson, V., 1996. Sensitivity of simulatedAsian and African summer monsoons to orbitally induced variations in insolation126, 115 and 6 kBP. Clim. Dyn. 12, 589–603.
Ding, Y., 2004. Seasonalmarch of the East-Asian summermonsoon. In: Chang, C.-P. (Ed.),East Asian Monsoon. World Scientific Publishing Co. Pte. Ltd., Singapore, pp. 3–53.
Ding, Z., Liu, T., Rutter, N.W., Yu, Z., Guo, Z., Zhu, R., 1995. Ice-volume forcing of the EastAsia winter monsoon variations in the past 800,000 years. Quat. Res. 44, 149–159.
Ding, Z.L., Ren, J.Z., Yang, S.L., Liu, T.S., 1999a. Climate instability during the penultimateglaciation: evidence from two high-resolution loess records, China. J. Geophys. Res.104, 20123–20132.
Ding, Z., Sun, J., Rutter, N.W., Rokosh, D., Liu, T., 1999b. Changes in sand content of loessdeposits along a north–south transect of the Chinese Loess Plateau and theimplication for desert variations. Quat. Res. 52, 56–62.
Ding, Z.L., Derbyshire, E., Yang, S.L., Yu, Z.W., Xiong, S.F., Liu, T.S., 2002. Stacked 2.6-Magrain size record from the Chinese loess based on five sections and correlationwiththe deep-sea δ18O record. Paleoceanography 17, 1033. doi:10.1029/2001PA000725.
Ding, Z.L., Derbyshire, E., Yang, S.L., Sun, J.M., Liu, T.S., 2005. Stepwise expansion ofdesert environment across northern China in the past 3.5 Ma and implications formonsoon evolution. Earth Planet. Sci. Lett. 237, 45–55.
Dong, G., Wang, G., Li, X., Chen, H., Jin, J., 1998. Palaeomonsoon vicissitudes in easterndesert region of China since last interglacial period. Sci. China (Ser. D) 41, 215–224.
Gallet, S., Jahn, B.M., Torii, M., 1996. Geochemical characterization of the Luochuanloess–paleosol sequence, China, and paleoclimatic implications. Chem. Geol. 133,67–88.
Grootes, P.M., Stuiver, M., White, J.W.C., Johnsen, S., Jouzel, J., 1993. Comparison ofoxygen isotope records from the GISP2 and GRIP Greenland ice cores. Nature 366,552–554.
Guo, Z., Biscaye, P., Wei, L., Chen, X., Peng, S., Liu, T., 2000. Summer monsoon variationsover the last 1.2 Ma from the weathering of loess-soil sequences in China. Geophys.Res. Lett. 27, 1751–1754.
Hao, Q., Guo, Z., 2005. Spatial variations of magnetic susceptibility of Chinese loess forthe last 600 kyr: implications for monsoon evolution. J. Geophys. Res. 110, B12101.doi:10.1029/2005JB003765.
Imbrie, J., Boyle, E.A., Clemens, S.C., Duffy, A., Howard, W.R., Kukla, G., Kutzbach, J.,Martinson, D.G., McIntyre, A., Mix, A.C., Molfino, B., Morley, J.J., Peterson, L.C., Pisias,N.G., Prell, W.L., Raymo, M.E., Shackleton, N.J., Toggweiler, J.R., 1992. On thestructure and origin of major glaciation cycles. 1. Linear responses to Milankovitchforcing. Paleoceanography 7, 701–738.
Kukla, G., 1987. Loess stratigraphy in central China. Quat. Sci. Rev. 6, 191–219.Kukla, G., An, Z.S., 1989. Loess stratigraphy in central China. Palaeogeogr. Palaeoclimatol.
Palaeoecol. 72, 203–225.Kukla, G., Heller, F., Liu, X.M., Xu, T.C., Liu, T.S., An, Z.S., 1988. Pleistocene climates in
China dated by magnetic susceptibility. Geology 16, 811–814.Kutzbach, J.E., 1981. Monsoon climate of the early Holocene: climate experiment with
the earth's orbital parameters for 9000 years ago. Science 214, 59–61.Li, G., Chen, J., Chen, Y., Yang, J., Ji, J., Liu, L., 2007. Dolomite as a tracer for the source
regions of Asian dust. J. Geophys. Res. 112, D17201. doi:10.1029/2007JD008676.Liu, T., Ding, Z., 1998. Chinese loess and the paleomonsoon. Annu. Rev. Earth Planet. Sci.
26, 111–145.Liu, T.S., Guo, Z.T., Liu, J.Q., Han, J.M., Ding, Z.L., Gu, Z.Y., Wu, N.Q., 1995. Variations of
Eastern Asianmonsoon over the last 140,000 years. Bull. Soc. Geol. Fr. 166, 221–229.Lu, H., Sun, D., 2000. Pathways of dust input to the Chinese Loess Plateau during the last
glacial and interglacial periods. Catena 40, 251–261.Lu, Y., Prescott, J.R., Robertson, G.B., Hutton, J.T., 1987. Thermoluminescence dating of
the Malan loess at Zhaitang, China. Geology 15, 603–605.
Lu, H., Liu, T., Gu, Z., Liu, B., Zhou, L., Han, J., Wu, N., 2000. Effect of burning C3 and C4plants on the magnetic susceptibility signal in soils. Geophys. Res. Lett. 27,2013–2016.
Lu, H.Y., Wu, N.Q., Liu, K.B., Jiang, H., Liu, T.S., 2007a. Phytoliths as quantitative indicatorsfor the reconstruction of past environmental conditions in China II: palaeoenviron-mental reconstruction in the Loess Plateau. Quat. Sci. Rev. 26, 759–772.
Lu, Y.C., Wang, X.L., Wintle, A.G., 2007b. A new OSL chronology for dust accumulation inthe last 130,000 yr for the Chinese Loess Plateau. Quat. Res. 67, 152–160.
Pachur, H.J., Wünnemann, B., Zhang, H., 1995. Lake evolution in the Tengger Desert,northwestern China, during the last 40,000 years. Quat. Res. 44, 171–180.
Pan, B., Wu, G., 1997. Preliminary estimation on the drop range in temperature duringthe last two glaciations in the northeastern Qinghai-Xizang Plateau. Arid LandGeogr. 20, 17–24 (in Chinese with English abstract).
Prell, W.L., Kutzbach, J.E., 1987. Monsoon variability over the past 150,000 years. J.Geophys. Res. 92, 8411–8425.
Pye, K., 1987. Aeolian Dust and Dust Deposits. Academic Press, London.Rutter, N., Ding, Z., Evans, M.E., Liu, T., 1991. Baoji-type pedostratigraphic section, Loess
Plateau, north-central China. Quat. Sci. Rev. 10, 1–22.Sun, J., 2000. Origin of eolian sandmobilization during the past 2300 years in the Mu Us
Desert, China. Quat. Res. 53, 78–88.Sun, J., 2002. Provenance of loess material and formation of loess deposits on the
Chinese Loess Plateau. Earth Planet. Sci. Lett. 203, 845–859.Sun, J., Liu, T., 2000. Multiple origins and interpretations of the magnetic susceptibility
signal in Chinese wind-blown sediments. Earth Planet. Sci. Lett. 180, 287–296.Sun, J., Ding, Z., Liu, T., 1998. Desert distributions during the glacial maximum and
climatic optimum: example of China. Episodes 21, 28–31.Sun, Y., Clemens, S.C., An, Z., Yu, Z., 2006. Astronomical timescale and palaeoclimatic
implication of stacked 3.6-Myr monsoon records from the Chinese Loess Plateau.Quat. Sci. Rev. 25, 33–48.
Svendsen, J.I., Alexanderson, H., Astakhov, V.I., Demidov, I., Dowdeswell, J.A., Funder, S.,Gataullin, V., Henriksen, M., Hjort, C., Houmark-Nielsen, M., Hubberten, H.W.,Ingólfsson, Ó., Jakobsson, M., Kjær, K.H., Larsen, E., Lokrantz, H., Lunkka, J.P., Lyså, A.,Mangerud, J., Matioushkov, A., Murray, A., Möller, P., Niessen, F., Nikolskaya, O.,Polyak, L., Saarnisto, M., Siegert, C., Siegert, M.J., Spielhagen, R.F., Stein, R., 2004. LateQuaternary ice sheet history of northern Eurasia. Quat. Sci. Rev. 23, 1229–1271.
Tao, S.Y., Chen, L.X., 1987. A review of recent research on the East Asian SummerMonsoon in China. In: Chang, C.P., Krishnamurti, T.N. (Eds.), Monsoon Meteorology.Oxford University Press, Oxford, pp. 60–92.
Tsoar, H., Pye, K., 1987. Dust transport and the question of desert loess formation.Sedimentology 34, 139–153.
Wang, P., 1999. Response of West Pacific margin seas to glacial cycles: paleoceano-graphic and sedimentological features. Mar. Geol. 156, 5–39.
Wang, P., Clemens, S., Beaufort, L., Braconnot, P., Ganssen, G., Jian, Z., Kershaw, P.,Sarnthein, M., 2005. Evolution and variability of the Asianmonsoon system: state ofthe art and outstanding issues. Quat. Sci. Rev. 24, 595–629.
Webster, P.J., Magaña, V.O., Palmer, T.N., Shukla, J., Tomas, R.A., Yanai, M., Yasunari, T.,1998. Monsoons: processes, predictability, and the prospects for prediction. J.Geophys. Res. 103, 14451–14510.
Wu, J., Wang, S., Shi, Y., Ji, L., 2000. Temperature estimation by oxygen-stable recordover the past 200 ka in Zoigê basin. Sci. China (Ser. D) 43, 577–586.
Xiao, J.L., Porter, S.C., An, Z.S., Kumai, H., Yoshikawa, S., 1995. Grain size of quartz as anindicator of winter monsoon strength on the Loess Plateau of central China duringthe last 130,000 yr. Quat. Res. 43, 22–29.
Yang, S.L., Ding, Z.L., 2003. Color reflectance of Chinese loess and its implications forclimate gradient changes during the last two glacial–interglacial cycles. Geophys.Res. Lett. 30 (20), 2058. doi:10.1029/2003GL018346.
Yang, S.L., Ding, Z.L., 2004. Comparison of particle size characteristics of the Tertiary ‘redclay’ and Pleistocene loess in the Chinese Loess Plateau: implications for origin andsources of the ‘red clay’. Sedimentology 51, 77–93.
Yang, S., Ding, F., Ding, Z., 2006. Pleistocene chemical weathering history of Asian aridand semi-arid regions recorded in loess deposits of China and Tajikistan. Geochim.Cosmochim. Acta 70, 1695–1709.
Zhang, H.,Wünnemann, B.,Ma, Y., Peng, J., Pachur, H.J., Li, J., Qi, Y., Chen, G., Fang, H., Feng,Z., 2002. Lake level and climate changes between 42,000 and 18,000 14C yr B.P. in theTengger Desert, northwestern China. Quat. Res. 58, 62–72.
Zhou, L.P., Oldfield, F., Wintle, A.G., Robinson, S.G., Wang, J.T., 1990. Partly pedogenicorigin of magnetic variations in Chinese loess. Nature 346, 737–739.