earth and planetary science letters - u-bordeaux.fr
TRANSCRIPT
Earth and Planetary Science Letters 290 (2010) 459–473
Contents lists available at ScienceDirect
Earth and Planetary Science Letters
j ourna l homepage: www.e lsev ie r.com/ locate /eps l
The first estimation of Fleuve Manche palaeoriver discharge during the lastdeglaciation: Evidence for Fennoscandian ice sheet meltwater flow in the EnglishChannel ca 20–18 ka ago
Samuel Toucanne a,b,⁎, Sébastien Zaragosi a, Jean-François Bourillet b, Vincent Marieu a, Michel Cremer a,Masa Kageyama c, Brigitte Van Vliet-Lanoë d, Frédérique Eynaud a, Jean-Louis Turon a, Philip L. Gibbard e
a Université de Bordeaux, UMR 5805, Avenue des Facultés, F-33405 Talence, Franceb IFREMER, Laboratoire Environnements Sédimentaires, BP70, 29280 Plouzané, Francec Laboratoire des Sciences du Climat et de l'Environnement LSCE/IPSL (UMR CEA-CNRS-UVSQ 1572), CE Saclay, L'Orme des Merisiers, Bât. 701, 91191 Gif-sur-Yvette cedex, Franced Institut Européen Universitaire de la Mer, Domaines Océaniques (UMR CNRS 6538), Place Nicolas Copernic, 29280 Plouzané, Francee Cambridge Quaternary, Department of Geography, University of Cambridge, Cambridge, CB2 3EN, UK
⁎ Corresponding author. IFREMER, Laboratoire Environ29280 Plouzané, France. Tel.: +33 298 22 4249; fax: +
E-mail address: [email protected] (S. Tou
0012-821X/$ – see front matter © 2010 Elsevier B.V. Adoi:10.1016/j.epsl.2009.12.050
a b s t r a c t
a r t i c l e i n f oArticle history:Received 21 July 2009Received in revised form 18 December 2009Accepted 30 December 2009Available online 25 January 2010
Editor: P. DeMenocal
Keywords:Fleuve Manche palaeoriverEnglish Channelsediment and meltwater dischargeEuropean ice sheetdeglaciationTermination 1North Sea areaEuropean drainage network
The Fleuve Manche (English Channel) palaeoriver represents the largest river system that drained theEuropean continent during Pleistocene lowstands, particularly during the Elsterian (Marine Isotope Stage12) and Saalian Drenthe (MIS 6) glaciations when extensive ice advances into the North Sea area forced thecentral European rivers to flow southwards to the Bay of Biscay (NE Atlantic). Numerous long piston coresand high-resolution acoustic data from the northern Bay of Biscay have been correlated using a well-constrained chronostratigraphical framework, and for the first time allow the estimation of the discharge ofthe Fleuve Manche palaeoriver at the end of the last glacial period (i.e. Weichselian). Our results, discussed inthe light of relationships between river loads and drainage area characteristics, strongly suggest that the Bayof Biscay collected sediment-laden meltwater from the Northern European lowlands and the southern partof the Fennoscandian ice sheet at the end of the last glacial period and particularly during the paroxysmalphase of the European deglaciation ca 20–18 ka ago. This demonstrates that the Fleuve Manche drainage areaat that time was equivalent to those dating from the major Elsterian and Saalian Drenthe glaciations. Basedon our data, we propose a revision of the palaeogeographical and palaeoglaciological evolution of the NorthSea area while showing that the British and Fennoscandian ice sheets entered the North Sea basin until ca18 ka initiating isostatic adjustment of the basin. This allowed the North Sea fluvial system to flowsouthwards through the Dover Strait. Finally, we discuss the Fleuve Manche freshwater discharge during themaximum European ice sheet retreat ca 18 ka. The estimated discharge at this time appears important andsufficiently sustained to possibly contribute to the profound destabilisation of the thermohaline circulationrecognised in the North Atlantic from ca 18 to 16 ka.
nements Sédimentaires, BP70,33 298 22 4570.canne).
ll rights reserved.
© 2010 Elsevier B.V. All rights reserved.
1. Introduction
Reconstruction of the extent and evolution of the Pleistocene icesheets and the determination of their interaction with the ocean,through quantification of icebergs andmeltwater discharges, is crucialin our understanding of Earth's climate. Indeed, former ice sheetsplayed an active role by amplifying, pacing and driving local, regionaland global climate changes (e.g. Clark et al., 1999). This was achievedpartially through their ability to reroute continental meltwater runoff,with resultant modification of oceanic circulation and climate, asdemonstrated around the North American (Broecker et al., 1989;
Clark et al., 2001) and European ice sheets (Gibbard, 1988; Mangerudet al., 2004; Toucanne et al., 2009a). Through the correlation of theEuropean continental glaciation-derived chronology with marinerecords from the Bay of Biscay (NE Atlantic), recent studiesdemonstrate that advance of Pleistocene ice masses into the NorthernEuropean lowlands during MIS (Marine Isotope Stage) 12 (Elsterianglaciation) and MIS 6 (Saalian Drenthe Substage ice-advance)strongly modified the flow directions of central European rivers(Toucanne et al., 2009a, b). These diversions induced massivesouthwards discharges of meltwaters through the English Channel,and hence caused significant increases in the Fleuve Manchepalaeoriver runoff, particularly during subsequent deglaciation(Fig. 1). This drainage pattern, supported by the complex networkof shelf valley systems on both sides of the Dover Strait and in theEnglish Channel (Larsonneur et al., 1982; Lericolais, 1997; Lericolais
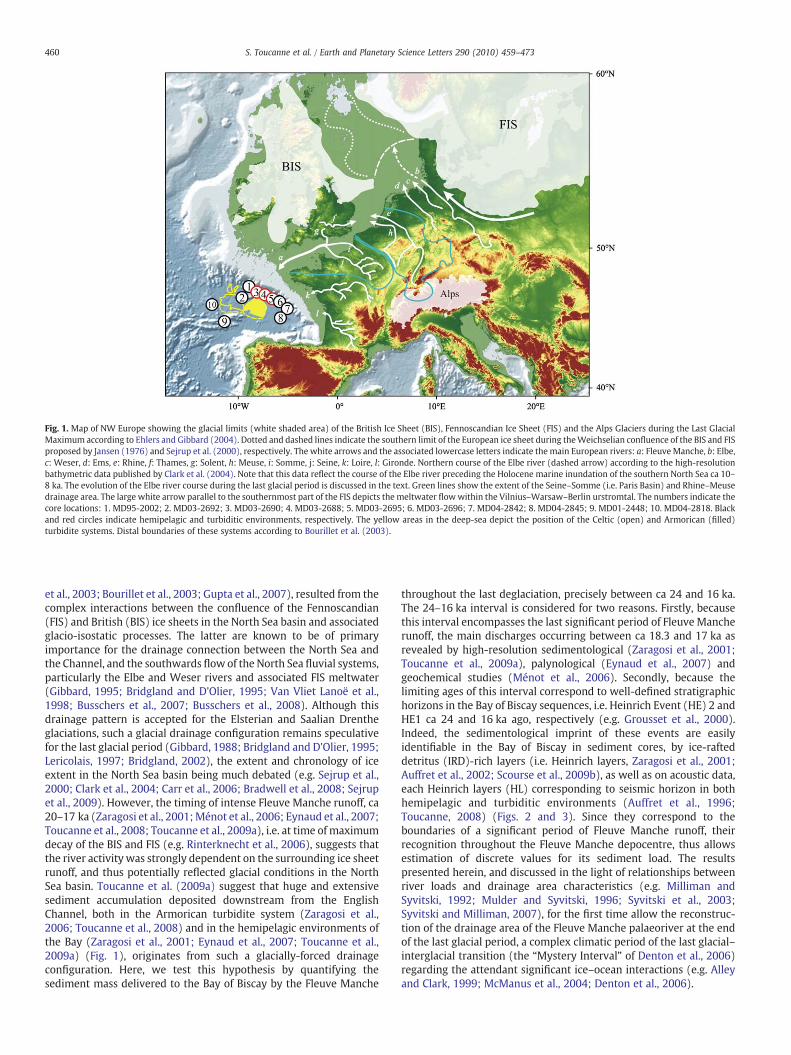
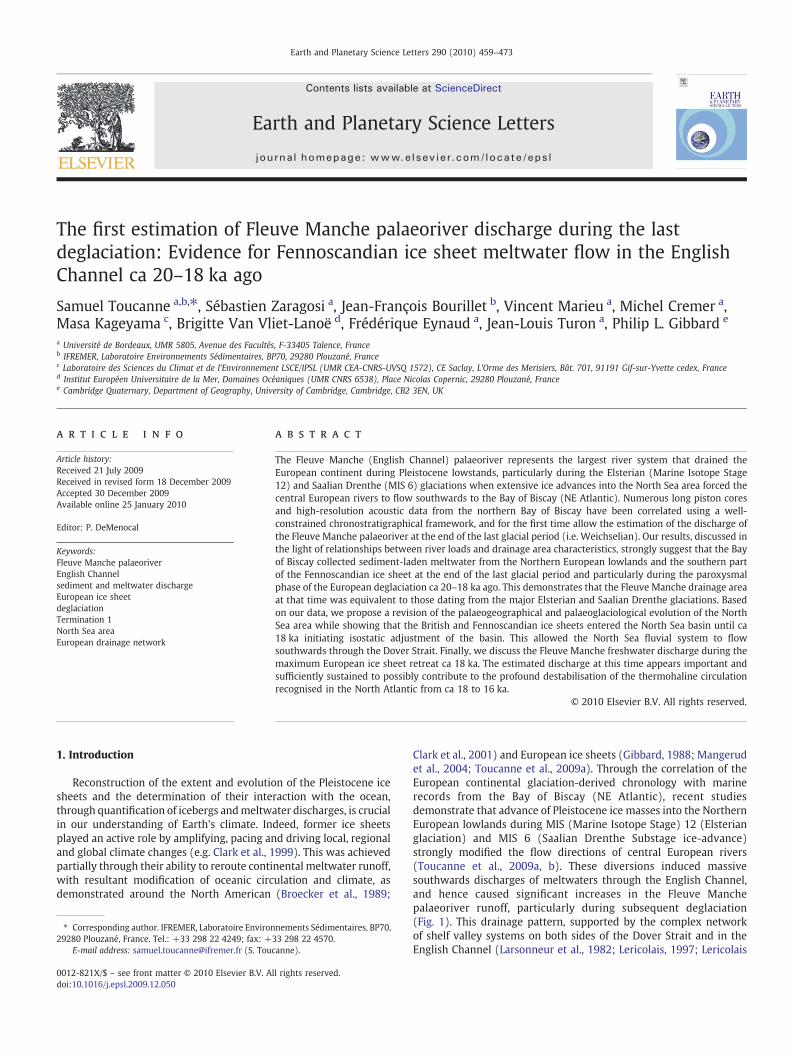
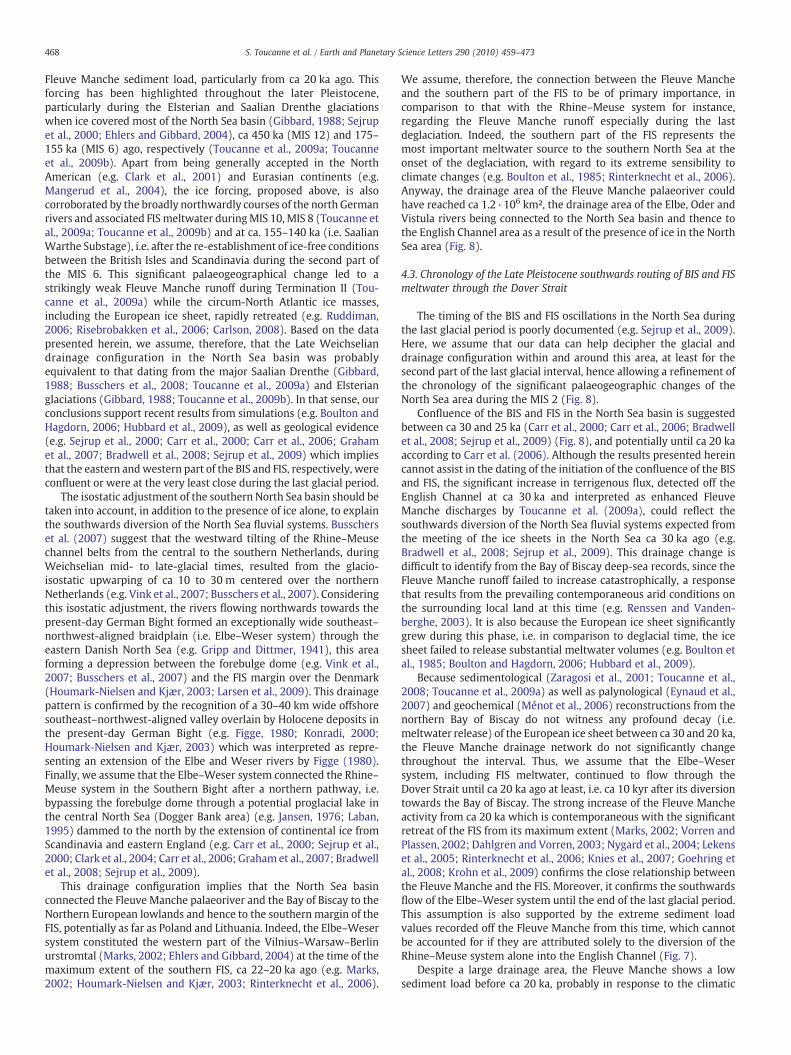
Fig. 1. Map of NW Europe showing the glacial limits (white shaded area) of the British Ice Sheet (BIS), Fennoscandian Ice Sheet (FIS) and the Alps Glaciers during the Last GlacialMaximum according to Ehlers and Gibbard (2004). Dotted and dashed lines indicate the southern limit of the European ice sheet during theWeichselian confluence of the BIS and FISproposed by Jansen (1976) and Sejrup et al. (2000), respectively. The white arrows and the associated lowercase letters indicate the main European rivers: a: Fleuve Manche, b: Elbe,c: Weser, d: Ems, e: Rhine, f: Thames, g: Solent, h: Meuse, i: Somme, j: Seine, k: Loire, l: Gironde. Northern course of the Elbe river (dashed arrow) according to the high-resolutionbathymetric data published by Clark et al. (2004). Note that this data reflect the course of the Elbe river preceding the Holocene marine inundation of the southern North Sea ca 10–8 ka. The evolution of the Elbe river course during the last glacial period is discussed in the text. Green lines show the extent of the Seine–Somme (i.e. Paris Basin) and Rhine–Meusedrainage area. The large white arrow parallel to the southernmost part of the FIS depicts the meltwater flowwithin the Vilnius–Warsaw–Berlin urstromtal. The numbers indicate thecore locations: 1. MD95-2002; 2. MD03-2692; 3. MD03-2690; 4. MD03-2688; 5. MD03-2695; 6. MD03-2696; 7. MD04-2842; 8. MD04-2845; 9. MD01-2448; 10. MD04-2818. Blackand red circles indicate hemipelagic and turbiditic environments, respectively. The yellow areas in the deep-sea depict the position of the Celtic (open) and Armorican (filled)turbidite systems. Distal boundaries of these systems according to Bourillet et al. (2003).
460 S. Toucanne et al. / Earth and Planetary Science Letters 290 (2010) 459–473
et al., 2003; Bourillet et al., 2003; Gupta et al., 2007), resulted from thecomplex interactions between the confluence of the Fennoscandian(FIS) and British (BIS) ice sheets in the North Sea basin and associatedglacio-isostatic processes. The latter are known to be of primaryimportance for the drainage connection between the North Sea andthe Channel, and the southwards flow of the North Sea fluvial systems,particularly the Elbe and Weser rivers and associated FIS meltwater(Gibbard, 1995; Bridgland and D'Olier, 1995; Van Vliet Lanoë et al.,1998; Busschers et al., 2007; Busschers et al., 2008). Although thisdrainage pattern is accepted for the Elsterian and Saalian Drentheglaciations, such a glacial drainage configuration remains speculativefor the last glacial period (Gibbard, 1988; Bridgland and D'Olier, 1995;Lericolais, 1997; Bridgland, 2002), the extent and chronology of iceextent in the North Sea basin being much debated (e.g. Sejrup et al.,2000; Clark et al., 2004; Carr et al., 2006; Bradwell et al., 2008; Sejrupet al., 2009). However, the timing of intense Fleuve Manche runoff, ca20–17 ka (Zaragosi et al., 2001;Ménot et al., 2006; Eynaud et al., 2007;Toucanne et al., 2008; Toucanne et al., 2009a), i.e. at time of maximumdecay of the BIS and FIS (e.g. Rinterknecht et al., 2006), suggests thatthe river activity was strongly dependent on the surrounding ice sheetrunoff, and thus potentially reflected glacial conditions in the NorthSea basin. Toucanne et al. (2009a) suggest that huge and extensivesediment accumulation deposited downstream from the EnglishChannel, both in the Armorican turbidite system (Zaragosi et al.,2006; Toucanne et al., 2008) and in the hemipelagic environments ofthe Bay (Zaragosi et al., 2001; Eynaud et al., 2007; Toucanne et al.,2009a) (Fig. 1), originates from such a glacially-forced drainageconfiguration. Here, we test this hypothesis by quantifying thesediment mass delivered to the Bay of Biscay by the Fleuve Manche
throughout the last deglaciation, precisely between ca 24 and 16 ka.The 24–16 ka interval is considered for two reasons. Firstly, becausethis interval encompasses the last significant period of Fleuve Mancherunoff, the main discharges occurring between ca 18.3 and 17 ka asrevealed by high-resolution sedimentological (Zaragosi et al., 2001;Toucanne et al., 2009a), palynological (Eynaud et al., 2007) andgeochemical studies (Ménot et al., 2006). Secondly, because thelimiting ages of this interval correspond to well-defined stratigraphichorizons in the Bay of Biscay sequences, i.e. Heinrich Event (HE) 2 andHE1 ca 24 and 16 ka ago, respectively (e.g. Grousset et al., 2000).Indeed, the sedimentological imprint of these events are easilyidentifiable in the Bay of Biscay in sediment cores, by ice-rafteddetritus (IRD)-rich layers (i.e. Heinrich layers, Zaragosi et al., 2001;Auffret et al., 2002; Scourse et al., 2009b), as well as on acoustic data,each Heinrich layers (HL) corresponding to seismic horizon in bothhemipelagic and turbiditic environments (Auffret et al., 1996;Toucanne, 2008) (Figs. 2 and 3). Since they correspond to theboundaries of a significant period of Fleuve Manche runoff, theirrecognition throughout the Fleuve Manche depocentre, thus allowsestimation of discrete values for its sediment load. The resultspresented herein, and discussed in the light of relationships betweenriver loads and drainage area characteristics (e.g. Milliman andSyvitski, 1992; Mulder and Syvitski, 1996; Syvitski et al., 2003;Syvitski and Milliman, 2007), for the first time allow the reconstruc-tion of the drainage area of the Fleuve Manche palaeoriver at the endof the last glacial period, a complex climatic period of the last glacial–interglacial transition (the “Mystery Interval” of Denton et al., 2006)regarding the attendant significant ice–ocean interactions (e.g. Alleyand Clark, 1999; McManus et al., 2004; Denton et al., 2006).
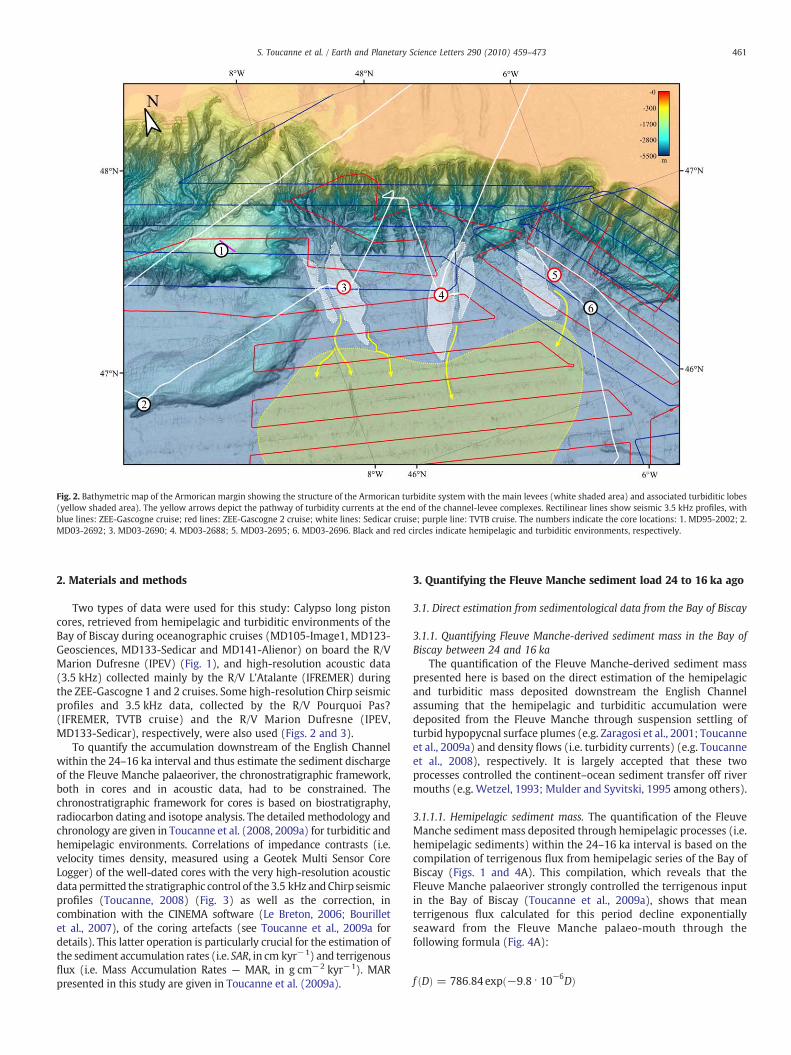
Fig. 2. Bathymetric map of the Armorican margin showing the structure of the Armorican turbidite system with the main levees (white shaded area) and associated turbiditic lobes(yellow shaded area). The yellow arrows depict the pathway of turbidity currents at the end of the channel-levee complexes. Rectilinear lines show seismic 3.5 kHz profiles, withblue lines: ZEE-Gascogne cruise; red lines: ZEE-Gascogne 2 cruise; white lines: Sedicar cruise; purple line: TVTB cruise. The numbers indicate the core locations: 1. MD95-2002; 2.MD03-2692; 3. MD03-2690; 4. MD03-2688; 5. MD03-2695; 6. MD03-2696. Black and red circles indicate hemipelagic and turbiditic environments, respectively.
461S. Toucanne et al. / Earth and Planetary Science Letters 290 (2010) 459–473
2. Materials and methods
Two types of data were used for this study: Calypso long pistoncores, retrieved from hemipelagic and turbiditic environments of theBay of Biscay during oceanographic cruises (MD105-Image1, MD123-Geosciences, MD133-Sedicar and MD141-Alienor) on board the R/VMarion Dufresne (IPEV) (Fig. 1), and high-resolution acoustic data(3.5 kHz) collected mainly by the R/V L'Atalante (IFREMER) duringthe ZEE-Gascogne 1 and 2 cruises. Some high-resolution Chirp seismicprofiles and 3.5 kHz data, collected by the R/V Pourquoi Pas?(IFREMER, TVTB cruise) and the R/V Marion Dufresne (IPEV,MD133-Sedicar), respectively, were also used (Figs. 2 and 3).
To quantify the accumulation downstream of the English Channelwithin the 24–16 ka interval and thus estimate the sediment dischargeof the Fleuve Manche palaeoriver, the chronostratigraphic framework,both in cores and in acoustic data, had to be constrained. Thechronostratigraphic framework for cores is based on biostratigraphy,radiocarbon dating and isotope analysis. The detailed methodology andchronology are given in Toucanne et al. (2008, 2009a) for turbiditic andhemipelagic environments. Correlations of impedance contrasts (i.e.velocity times density, measured using a Geotek Multi Sensor CoreLogger) of the well-dated cores with the very high-resolution acousticdata permitted the stratigraphic control of the 3.5 kHz andChirp seismicprofiles (Toucanne, 2008) (Fig. 3) as well as the correction, incombination with the CINEMA software (Le Breton, 2006; Bourilletet al., 2007), of the coring artefacts (see Toucanne et al., 2009a fordetails). This latter operation is particularly crucial for the estimation ofthe sediment accumulation rates (i.e. SAR, in cm kyr−1) and terrigenousflux (i.e. Mass Accumulation Rates — MAR, in g cm−2 kyr−1). MARpresented in this study are given in Toucanne et al. (2009a).
3. Quantifying the Fleuve Manche sediment load 24 to 16 ka ago
3.1. Direct estimation from sedimentological data from the Bay of Biscay
3.1.1. Quantifying Fleuve Manche-derived sediment mass in the Bay ofBiscay between 24 and 16 ka
The quantification of the Fleuve Manche-derived sediment masspresented here is based on the direct estimation of the hemipelagicand turbiditic mass deposited downstream the English Channelassuming that the hemipelagic and turbiditic accumulation weredeposited from the Fleuve Manche through suspension settling ofturbid hypopycnal surface plumes (e.g. Zaragosi et al., 2001; Toucanneet al., 2009a) and density flows (i.e. turbidity currents) (e.g. Toucanneet al., 2008), respectively. It is largely accepted that these twoprocesses controlled the continent–ocean sediment transfer off rivermouths (e.g. Wetzel, 1993; Mulder and Syvitski, 1995 among others).
3.1.1.1. Hemipelagic sediment mass. The quantification of the FleuveManche sediment mass deposited through hemipelagic processes (i.e.hemipelagic sediments) within the 24–16 ka interval is based on thecompilation of terrigenous flux from hemipelagic series of the Bay ofBiscay (Figs. 1 and 4A). This compilation, which reveals that theFleuve Manche palaeoriver strongly controlled the terrigenous inputin the Bay of Biscay (Toucanne et al., 2009a), shows that meanterrigenous flux calculated for this period decline exponentiallyseaward from the Fleuve Manche palaeo-mouth through thefollowing formula (Fig. 4A):
f ðDÞ = 786:84 expð−9:8 ⋅ 10−6DÞ
Fig. 3. Site-to-site correlations of very high-resolution acoustic data (Chirp, 3.5 kHz) from turbiditic and hemipelagic environments of the Bay of Biscay. Correlations of acousticdata with impedance contrasts (i.e. velocity times density) of in-situ well-dated sediment cores permitted to interpret the main acoustic horizons as the sedimentologicalimprint of the Heinrich Events (i.e. Heinrich Layers, HL), as demonstrated for the Blavet Ridge with core MD03-2696 (see Toucanne (2008) for details). The significant differencebetween the depth of high impedance layers into the Blavet Ridge (i.e. acoustic horizons on 3.5 kHz data) and within core MD03-2696 indicates that stretching occurs in theupper part of the core (i.e. coring artefact). The high impedance of the HL results from their cementation through early diagenetic processes as demonstrated by Auffret et al.(1996; 1998; 2002). The grey shaded zone displays the sediment accumulation deposited between HL2 and HL1, i.e. within the ca 24–16 ka interval, in response to the lastsignificant period of Fleuve Manche discharge. Note that sediment accumulations are important within this interval, the mean accumulation rates reaching up to 250 cm ka−1 atsite MD03-2690.
462 S. Toucanne et al. / Earth and Planetary Science Letters 290 (2010) 459–473
where D is the distance (in metres) to the Fleuve Manche palaeo-mouth (about 49°N/7°W, in accordance to Bourillet et al. (2003)).
The hemipelagic sediment mass, Mh, deposited each millennia bythe Fleuve Manche between ca 24 and 16 ka can be calculatedintegrating f over the preferential depositional area (i.e. depocentre)of the Fleuve Manche (Fig. 4B). Here, this area is modelled taking intoaccount the expected position of the Fleuve Manche palaeo-mouthand the NW–SE direction of the shelf palaeovalleys onto thecontinental shelf (e.g. Bourillet et al., 2003) and the longitudinalextension of the turbid plumes of the Fleuve Manche which inducedhigh terrigenous input as far as sites MD04-2818, MD01-2448 andMD04-2845 (Toucanne et al., 2009a) (Figs. 1 and 4A). The lateralextension of the depositional area is deduced from the position of thecores, in agreement with the geometry of a turbid hypopycnal plumeemanating from a river mouth (Fig. 4B). In detail, the depositionalarea is limited from 180 km (shelf edge) to 550 km (distal sitesMD04-2818 and MD01-2448) to the Fleuve Manche palaeo-mouth, i.e. thedeep-sea part of the described area (Fig. 4B). Indeed, it is assumed thatparticles deposited onto the continental shelf moved rapidly to thedeep-sea, through canyons via density flows, due to the strong SWorientated tidal currents which drove sediment towards the shelfbreak and canyon heads (i.e. tidal pumping, Scourse et al., 2009a).As a result, the particles deposited on the shelf finally fed the deep-sea turbidite systems and thus are quantified with the turbiditicsediment mass.
The hemipelagic sediment mass, Mh, deposited each millenniumby the Fleuve Manche between ca 24 and 16 ka in the defineddepositional area can thus be calculated as follow (Fig. 4B):
Mh = ∫π2φ = 0∫
550;000D = 180;0007:8684⋅10
6 expð−9:8⋅10−6DÞdDDdφ
This function can be calculated analytically:
Mh =7:8684⋅106
−9:8⋅10−6
19:8⋅10−6 + D
� �expð−9:8⋅10−6DÞφ
" #550;000
D = 180;000
24
35
π2
φ = 0
We obtain Mh=458 Gigatons (Gt, i.e. 109 tons) over the deposi-tional areawithin the ca 24–16 ka interval. Considering an error of±5%for the carbonate content (CaCO3% ranging from ca 15 to 25% over theperiod in the studied cores) and ±100 kg m−3 for the dry sedimentdensity (ranging from ca 800 to 1000 kg m−3) in the calculation ofMAR(Toucanne et al., 2009a) (Fig. 4A), we obtain:
414Gt b Mh b 504Gt
3.1.1.2. Turbiditic sediment mass. The Fleuve Manche palaeoriverdirectly fed the Armorican turbidite system, and to a lesser extent theCeltic system, during the last glacial period (e.g. Bourillet et al., 2003;
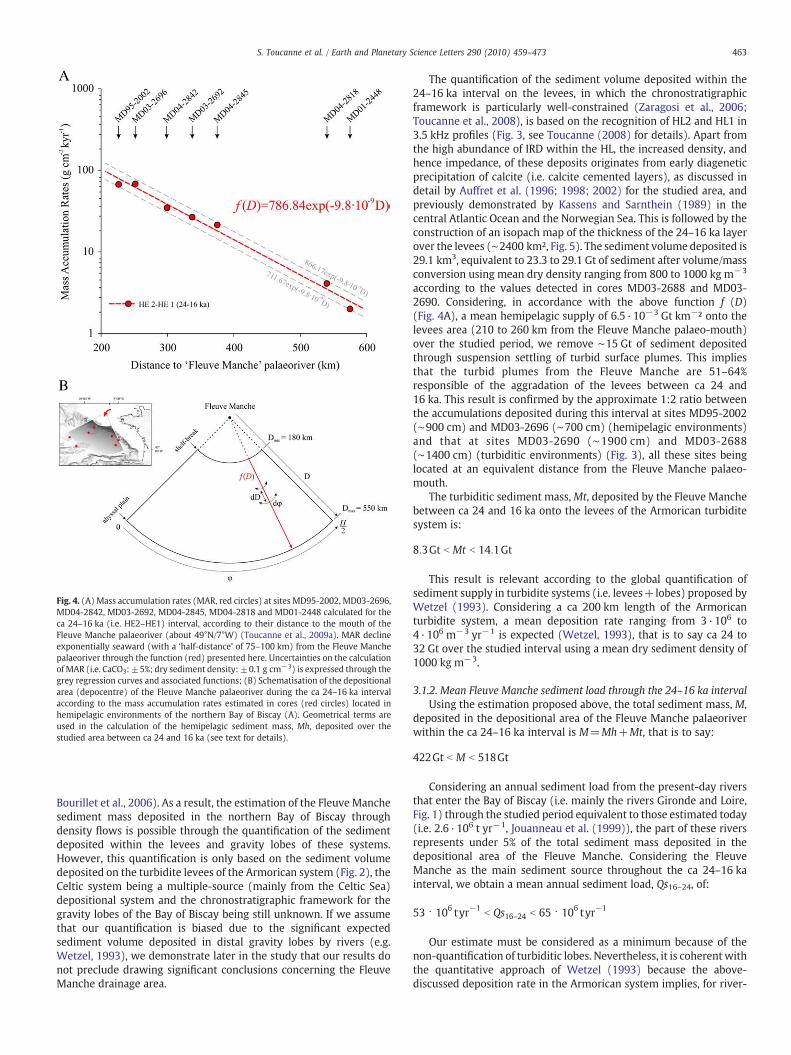
Fig. 4. (A) Mass accumulation rates (MAR, red circles) at sites MD95-2002, MD03-2696,MD04-2842, MD03-2692, MD04-2845, MD04-2818 and MD01-2448 calculated for theca 24–16 ka (i.e. HE2–HE1) interval, according to their distance to the mouth of theFleuve Manche palaeoriver (about 49°N/7°W) (Toucanne et al., 2009a). MAR declineexponentially seaward (with a ‘half-distance’ of 75–100 km) from the Fleuve Manchepalaeoriver through the function (red) presented here. Uncertainties on the calculationofMAR (i.e. CaCO3:±5%; dry sediment density: ±0.1 g cm−3) is expressed through thegrey regression curves and associated functions; (B) Schematisation of the depositionalarea (depocentre) of the Fleuve Manche palaeoriver during the ca 24–16 ka intervalaccording to the mass accumulation rates estimated in cores (red circles) located inhemipelagic environments of the northern Bay of Biscay (A). Geometrical terms areused in the calculation of the hemipelagic sediment mass, Mh, deposited over thestudied area between ca 24 and 16 ka (see text for details).
463S. Toucanne et al. / Earth and Planetary Science Letters 290 (2010) 459–473
Bourillet et al., 2006). As a result, the estimation of the Fleuve Manchesediment mass deposited in the northern Bay of Biscay throughdensity flows is possible through the quantification of the sedimentdeposited within the levees and gravity lobes of these systems.However, this quantification is only based on the sediment volumedeposited on the turbidite levees of the Armorican system (Fig. 2), theCeltic system being a multiple-source (mainly from the Celtic Sea)depositional system and the chronostratigraphic framework for thegravity lobes of the Bay of Biscay being still unknown. If we assumethat our quantification is biased due to the significant expectedsediment volume deposited in distal gravity lobes by rivers (e.g.Wetzel, 1993), we demonstrate later in the study that our results donot preclude drawing significant conclusions concerning the FleuveManche drainage area.
The quantification of the sediment volume deposited within the24–16 ka interval on the levees, in which the chronostratigraphicframework is particularly well-constrained (Zaragosi et al., 2006;Toucanne et al., 2008), is based on the recognition of HL2 and HL1 in3.5 kHz profiles (Fig. 3, see Toucanne (2008) for details). Apart fromthe high abundance of IRD within the HL, the increased density, andhence impedance, of these deposits originates from early diageneticprecipitation of calcite (i.e. calcite cemented layers), as discussed indetail by Auffret et al. (1996; 1998; 2002) for the studied area, andpreviously demonstrated by Kassens and Sarnthein (1989) in thecentral Atlantic Ocean and the Norwegian Sea. This is followed by theconstruction of an isopach map of the thickness of the 24–16 ka layerover the levees (∼2400 km², Fig. 5). The sediment volume deposited is29.1 km3, equivalent to 23.3 to 29.1 Gt of sediment after volume/massconversion using mean dry density ranging from 800 to 1000 kg m−3
according to the values detected in cores MD03-2688 and MD03-2690. Considering, in accordance with the above function f (D)(Fig. 4A), a mean hemipelagic supply of 6.5·10−3 Gt km−² onto thelevees area (210 to 260 km from the Fleuve Manche palaeo-mouth)over the studied period, we remove ∼15 Gt of sediment depositedthrough suspension settling of turbid surface plumes. This impliesthat the turbid plumes from the Fleuve Manche are 51–64%responsible of the aggradation of the levees between ca 24 and16 ka. This result is confirmed by the approximate 1:2 ratio betweenthe accumulations deposited during this interval at sites MD95-2002(∼900 cm) and MD03-2696 (∼700 cm) (hemipelagic environments)and that at sites MD03-2690 (∼1900 cm) and MD03-2688(∼1400 cm) (turbiditic environments) (Fig. 3), all these sites beinglocated at an equivalent distance from the Fleuve Manche palaeo-mouth.
The turbiditic sediment mass,Mt, deposited by the Fleuve Manchebetween ca 24 and 16 ka onto the levees of the Armorican turbiditesystem is:
8:3Gt b Mt b 14:1Gt
This result is relevant according to the global quantification ofsediment supply in turbidite systems (i.e. levees+lobes) proposed byWetzel (1993). Considering a ca 200 km length of the Armoricanturbidite system, a mean deposition rate ranging from 3·106 to4·106 m−3 yr−1 is expected (Wetzel, 1993), that is to say ca 24 to32 Gt over the studied interval using a mean dry sediment density of1000 kg m−3.
3.1.2. Mean Fleuve Manche sediment load through the 24–16 ka intervalUsing the estimation proposed above, the total sediment mass, M,
deposited in the depositional area of the Fleuve Manche palaeoriverwithin the ca 24–16 ka interval is M=Mh+Mt, that is to say:
422Gt b M b 518Gt
Considering an annual sediment load from the present-day riversthat enter the Bay of Biscay (i.e. mainly the rivers Gironde and Loire,Fig. 1) through the studied period equivalent to those estimated today(i.e. 2.6·106 t yr−1, Jouanneau et al. (1999)), the part of these riversrepresents under 5% of the total sediment mass deposited in thedepositional area of the Fleuve Manche. Considering the FleuveManche as the main sediment source throughout the ca 24–16 kainterval, we obtain a mean annual sediment load, Qs16–24, of:
53 ⋅ 106 tyr−1b Qs16–24 b 65 ⋅ 106 tyr−1
Our estimate must be considered as a minimum because of thenon-quantification of turbiditic lobes. Nevertheless, it is coherent withthe quantitative approach of Wetzel (1993) because the above-discussed deposition rate in the Armorican system implies, for river-

Fig. 5. Isopach map of the thickness of Fleuve Manche-derived sediment deposited within the turbidite levees (coloured areas, ∼2400 km²) of the Armorican margin between ca 24to 16 ka. This sediment is contained within the interval circumscribed over the levees between HL2 and HL1, respectively, which are recognised in cores, as well as in high-resolutionacoustic data (Fig. 3). The numbers indicate the core locations (see Figs. 1 and 2 for details). The black lines show seismic 3.5 kHz profiles (see Fig. 2 for details). Note that thesediment deposited in the uncoloured deep-sea area of the map is estimated using the function f (D) (see Fig. 4A and text for details).
464 S. Toucanne et al. / Earth and Planetary Science Letters 290 (2010) 459–473
fed turbidite systems, a river sediment load ranging from 10·106 to90·106 t yr−1, these values representing the part, very differentaccording to the systems, between the sediment mass expulsed fromthe sediment source and that finally deposited in the turbidite system(Wetzel, 1993).
3.1.3. Fleuve Manche sediment load evolution over the 24–16 ka intervalNumerous studies demonstrate a significant Fleuve Manche runoff
variability throughout the studied time interval. Indeed, high-resolution studies based on BIT (Branched and Isoprenoid Tetra-ether)-index (Ménot et al., 2006), Pediastrum sp. (freshwater alga)concentration (Eynaud et al., 2007), sediment accumulation (Tou-canne et al., 2009a) and turbidite deposit frequency (Toucanne et al.,2008) reveal that the Fleuve Manche discharges significantlyincreased from ca 20 ka then reached a maximum between ca 18.3and 17 ka. SAR reconstructed with a 500-year resolution for coringsites of the Fleuve Manche depositional area depicts this evolution(Fig. 6 and Table 1). A normalized SAR is obtained from SAR divided bythe mean sediment accumulation rate calculated over the ca 24–16 kainterval, SAR16–24 (Table 1):
SARnorm =SAR
SAR16−24
As a result, we estimate the time history of the sediment load ofthe FleuveManche, Qs, from the mean annual sediment load (Qs16–24)discussed above and the evolution of SAR (Fig. 6 and Table 1) asfollows:
Qs = Qs16–24 ⋅ SARnorm
where SARnorm is the mean SARnorm obtained for discrete periods fromthe whole coring sites.
Our results suggest that the sediment load of the Fleuve Manchepalaeoriver increases by a factor of up to 5 within the ca 24–16 kainterval, ranging from ca 26·106 t yr−1 to 130·106 t yr−1 during the23–22 ka and 18–17 ka intervals, respectively (Fig. 6 and Table 1).
3.2. Fleuve Manche sediment-load modelling
In order to evaluate the significance of the estimated (minimal)Fleuve Manche sediment load ca 24 to 16 ka ago, we compare ourresults with the predicted sediment load based on sediment-fluxsimulations. Although quantifying the sediment-flux to ocean is adifficult challenge (e.g. Milliman and Syvitski, 1992), Syvitski et al.(2003) and Syvitski and Milliman (2007) provide relevant models(ART and BQART models, respectively) for predicting the long-termflux of sediment, Qs, from river basins to the ocean. These approachesare based, in agreement with previous studies (e.g. Milliman andSyvitski, 1992; Mulder and Syvitski, 1996; Syvitski and Morehead,1999) and using a significant database, on the basin area, the basinrelief and the basin-averaged temperature. The BQART model offersrefinement to the ART model by taking into account the role of icesheets and lithology, both of which play an important influencing rolein their application. Despite some uncertainties in model boundaryconditions, such an approach provides significant insights into theimpacts of palaeoenvironmental changes on the seaward sedimenttransfer (e.g. Overeem et al., 2005; Kettner and Syvitski, 2008; Kettnerand Syvitski, 2009).
The Fleuve Manche sediment load has been estimated from theART and BQART models, respectively, and for two different environ-mental scenarios. In the first instance (Case 1), we consider the Fleuve
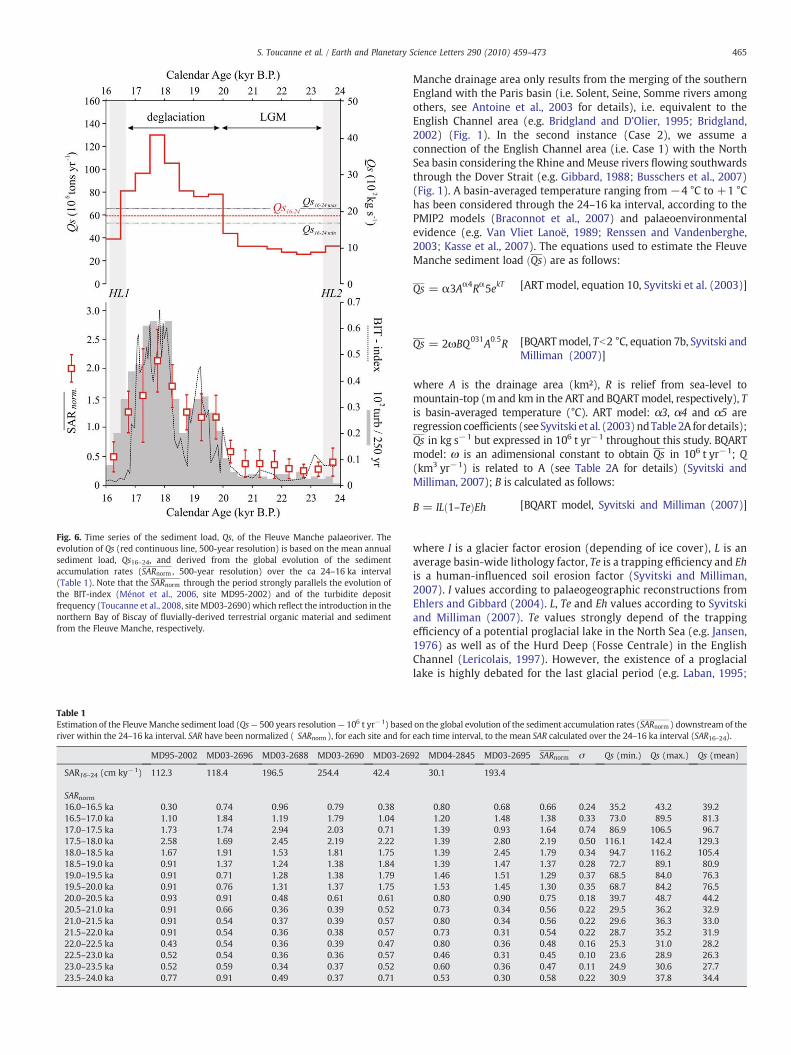
Fig. 6. Time series of the sediment load, Qs, of the Fleuve Manche palaeoriver. Theevolution of Qs (red continuous line, 500-year resolution) is based on the mean annualsediment load, Qs16–24, and derived from the global evolution of the sedimentaccumulation rates (SARnorm , 500-year resolution) over the ca 24–16 ka interval(Table 1). Note that the SARnorm through the period strongly parallels the evolution ofthe BIT-index (Ménot et al., 2006, site MD95-2002) and of the turbidite depositfrequency (Toucanne et al., 2008, site MD03-2690) which reflect the introduction in thenorthern Bay of Biscay of fluvially-derived terrestrial organic material and sedimentfrom the Fleuve Manche, respectively.
Table 1Estimation of the FleuveManche sediment load (Qs— 500 years resolution— 106 t yr−1) basedriver within the 24–16 ka interval. SAR have been normalized ( SARnorm ), for each site and for
MD95-2002 MD03-2696 MD03-2688 MD03-2690 MD03-26
SAR16–24 (cm ky−1) 112.3 118.4 196.5 254.4 42.4
SARnorm16.0–16.5 ka 0.30 0.74 0.96 0.79 0.3816.5–17.0 ka 1.10 1.84 1.19 1.79 1.0417.0–17.5 ka 1.73 1.74 2.94 2.03 0.7117.5–18.0 ka 2.58 1.69 2.45 2.19 2.2218.0–18.5 ka 1.67 1.91 1.53 1.81 1.7518.5–19.0 ka 0.91 1.37 1.24 1.38 1.8419.0–19.5 ka 0.91 0.71 1.28 1.38 1.7919.5–20.0 ka 0.91 0.76 1.31 1.37 1.7520.0–20.5 ka 0.93 0.91 0.48 0.61 0.6120.5–21.0 ka 0.91 0.66 0.36 0.39 0.5221.0–21.5 ka 0.91 0.54 0.37 0.39 0.5721.5–22.0 ka 0.91 0.54 0.36 0.38 0.5722.0–22.5 ka 0.43 0.54 0.36 0.39 0.4722.5–23.0 ka 0.52 0.54 0.36 0.36 0.5723.0–23.5 ka 0.52 0.59 0.34 0.37 0.5223.5–24.0 ka 0.77 0.91 0.49 0.37 0.71
465S. Toucanne et al. / Earth and Planetary Science Letters 290 (2010) 459–473
Manche drainage area only results from the merging of the southernEngland with the Paris basin (i.e. Solent, Seine, Somme rivers amongothers, see Antoine et al., 2003 for details), i.e. equivalent to theEnglish Channel area (e.g. Bridgland and D'Olier, 1995; Bridgland,2002) (Fig. 1). In the second instance (Case 2), we assume aconnection of the English Channel area (i.e. Case 1) with the NorthSea basin considering the Rhine andMeuse rivers flowing southwardsthrough the Dover Strait (e.g. Gibbard, 1988; Busschers et al., 2007)(Fig. 1). A basin-averaged temperature ranging from −4 °C to +1 °Chas been considered through the 24–16 ka interval, according to thePMIP2 models (Braconnot et al., 2007) and palaeoenvironmentalevidence (e.g. Van Vliet Lanoë, 1989; Renssen and Vandenberghe,2003; Kasse et al., 2007). The equations used to estimate the FleuveManche sediment load ðQsÞ are as follows:
Qs = α3Aα4Rα5ekT [ART model, equation 10, Syvitski et al. (2003)]
Qs = 2ωBQ031A0:5R [BQARTmodel, Tb2 °C, equation 7b, Syvitski andMilliman (2007)]
where A is the drainage area (km²), R is relief from sea-level tomountain-top (m and km in the ART and BQARTmodel, respectively), Tis basin-averaged temperature (°C). ART model: α3, α4 and α5 areregression coefficients (see Syvitski et al. (2003) ndTable 2A for details);Qs in kg s−1 but expressed in 106 t yr−1 throughout this study. BQARTmodel: ω is an adimensional constant to obtain Qs in 106 t yr−1; Q(km3 yr−1) is related to A (see Table 2A for details) (Syvitski andMilliman, 2007); B is calculated as follows:
B = ILð1–TeÞEh [BQART model, Syvitski and Milliman (2007)]
where I is a glacier factor erosion (depending of ice cover), L is anaverage basin-wide lithology factor, Te is a trapping efficiency and Ehis a human-influenced soil erosion factor (Syvitski and Milliman,2007). I values according to palaeogeographic reconstructions fromEhlers and Gibbard (2004). L, Te and Eh values according to Syvitskiand Milliman (2007). Te values strongly depend of the trappingefficiency of a potential proglacial lake in the North Sea (e.g. Jansen,1976) as well as of the Hurd Deep (Fosse Centrale) in the EnglishChannel (Lericolais, 1997). However, the existence of a proglaciallake is highly debated for the last glacial period (e.g. Laban, 1995;
on the global evolution of the sediment accumulation rates (SARnorm ) downstream of theeach time interval, to the mean SAR calculated over the 24–16 ka interval (SAR16–24).
92 MD04-2845 MD03-2695 SARnorm σ Qs (min.) Qs (max.) Qs (mean)
30.1 193.4
0.80 0.68 0.66 0.24 35.2 43.2 39.21.20 1.48 1.38 0.33 73.0 89.5 81.31.39 0.93 1.64 0.74 86.9 106.5 96.71.39 2.80 2.19 0.50 116.1 142.4 129.31.39 2.45 1.79 0.34 94.7 116.2 105.41.39 1.47 1.37 0.28 72.7 89.1 80.91.46 1.51 1.29 0.37 68.5 84.0 76.31.53 1.45 1.30 0.35 68.7 84.2 76.50.80 0.90 0.75 0.18 39.7 48.7 44.20.73 0.34 0.56 0.22 29.5 36.2 32.90.80 0.34 0.56 0.22 29.6 36.3 33.00.73 0.31 0.54 0.22 28.7 35.2 31.90.80 0.36 0.48 0.16 25.3 31.0 28.20.46 0.31 0.45 0.10 23.6 28.9 26.30.60 0.36 0.47 0.11 24.9 30.6 27.70.53 0.30 0.58 0.22 30.9 37.8 34.4
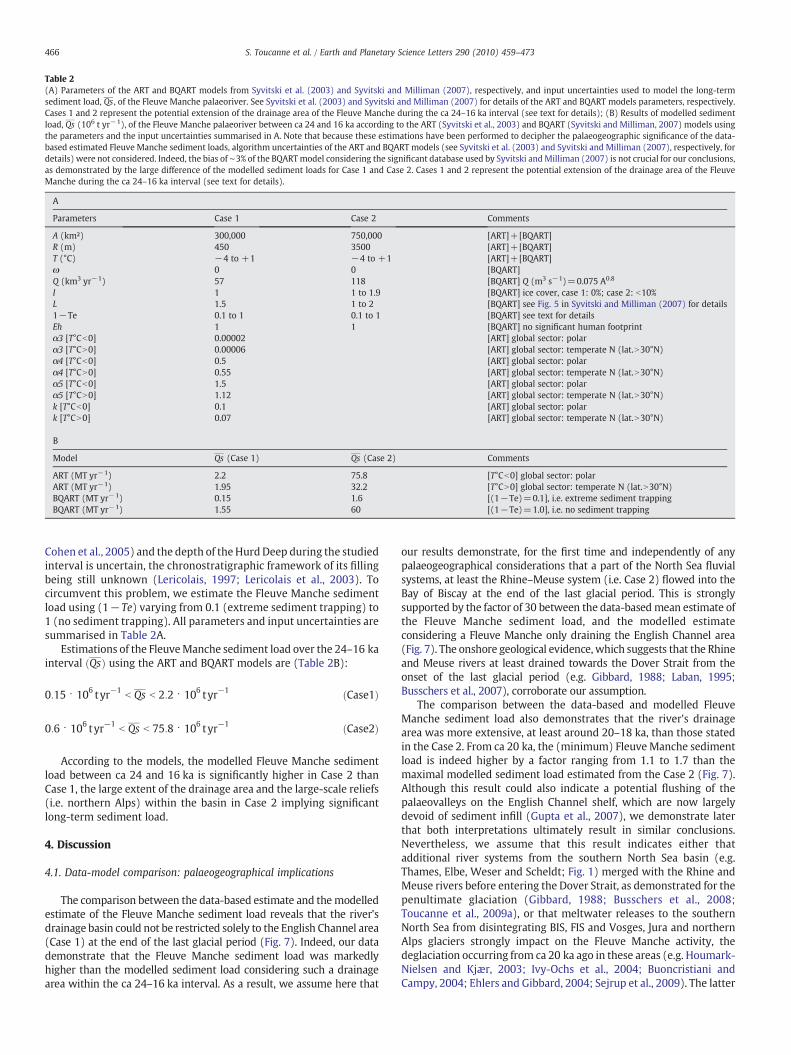
Table 2(A) Parameters of the ART and BQART models from Syvitski et al. (2003) and Syvitski and Milliman (2007), respectively, and input uncertainties used to model the long-termsediment load, Qs , of the Fleuve Manche palaeoriver. See Syvitski et al. (2003) and Syvitski and Milliman (2007) for details of the ART and BQART models parameters, respectively.Cases 1 and 2 represent the potential extension of the drainage area of the Fleuve Manche during the ca 24–16 ka interval (see text for details); (B) Results of modelled sedimentload, Qs (106 t yr−1), of the Fleuve Manche palaeoriver between ca 24 and 16 ka according to the ART (Syvitski et al., 2003) and BQART (Syvitski and Milliman, 2007) models usingthe parameters and the input uncertainties summarised in A. Note that because these estimations have been performed to decipher the palaeogeographic significance of the data-based estimated Fleuve Manche sediment loads, algorithm uncertainties of the ART and BQART models (see Syvitski et al. (2003) and Syvitski and Milliman (2007), respectively, fordetails) were not considered. Indeed, the bias of ∼3% of the BQARTmodel considering the significant database used by Syvitski andMilliman (2007) is not crucial for our conclusions,as demonstrated by the large difference of the modelled sediment loads for Case 1 and Case 2. Cases 1 and 2 represent the potential extension of the drainage area of the FleuveManche during the ca 24–16 ka interval (see text for details).
A
Parameters Case 1 Case 2 Comments
A (km²) 300,000 750,000 [ART]+[BQART]R (m) 450 3500 [ART]+[BQART]T (°C) −4 to +1 −4 to +1 [ART]+[BQART]ω 0 0 [BQART]Q (km3 yr−1) 57 118 [BQART] Q (m3 s−1)=0.075 A0.8
I 1 1 to 1.9 [BQART] ice cover, case 1: 0%; case 2: b10%L 1.5 1 to 2 [BQART] see Fig. 5 in Syvitski and Milliman (2007) for details1−Te 0.1 to 1 0.1 to 1 [BQART] see text for detailsEh 1 1 [BQART] no significant human footprintα3 [T°Cb0] 0.00002 [ART] global sector: polarα3 [T°CN0] 0.00006 [ART] global sector: temperate N (lat.N30°N)α4 [T°Cb0] 0.5 [ART] global sector: polarα4 [T°CN0] 0.55 [ART] global sector: temperate N (lat.N30°N)α5 [T°Cb0] 1.5 [ART] global sector: polarα5 [T°CN0] 1.12 [ART] global sector: temperate N (lat.N30°N)k [T°Cb0] 0.1 [ART] global sector: polark [T°CN0] 0.07 [ART] global sector: temperate N (lat.N30°N)
B
Model Qs (Case 1) Qs (Case 2) Comments
ART (MT yr−1) 2.2 75.8 [T°Cb0] global sector: polarART (MT yr−1) 1.95 32.2 [T°CN0] global sector: temperate N (lat.N30°N)BQART (MT yr−1) 0.15 1.6 [(1−Te)=0.1], i.e. extreme sediment trappingBQART (MT yr−1) 1.55 60 [(1−Te)=1.0], i.e. no sediment trapping
466 S. Toucanne et al. / Earth and Planetary Science Letters 290 (2010) 459–473
Cohen et al., 2005) and the depth of the Hurd Deep during the studiedinterval is uncertain, the chronostratigraphic framework of its fillingbeing still unknown (Lericolais, 1997; Lericolais et al., 2003). Tocircumvent this problem, we estimate the Fleuve Manche sedimentload using (1−Te) varying from 0.1 (extreme sediment trapping) to1 (no sediment trapping). All parameters and input uncertainties aresummarised in Table 2A.
Estimations of the FleuveManche sediment load over the 24–16 kainterval ðQsÞ using the ART and BQART models are (Table 2B):
0:15 ⋅ 106 tyr−1b Qs b 2:2 ⋅ 106 tyr−1 ðCase1Þ
0:6 ⋅ 106 tyr−1b Qs b 75:8 ⋅ 106 tyr−1 ðCase2Þ
According to the models, the modelled Fleuve Manche sedimentload between ca 24 and 16 ka is significantly higher in Case 2 thanCase 1, the large extent of the drainage area and the large-scale reliefs(i.e. northern Alps) within the basin in Case 2 implying significantlong-term sediment load.
4. Discussion
4.1. Data-model comparison: palaeogeographical implications
The comparison between the data-based estimate and themodelledestimate of the Fleuve Manche sediment load reveals that the river'sdrainage basin could not be restricted solely to the English Channel area(Case 1) at the end of the last glacial period (Fig. 7). Indeed, our datademonstrate that the Fleuve Manche sediment load was markedlyhigher than the modelled sediment load considering such a drainagearea within the ca 24–16 ka interval. As a result, we assume here that
our results demonstrate, for the first time and independently of anypalaeogeographical considerations that a part of the North Sea fluvialsystems, at least the Rhine–Meuse system (i.e. Case 2) flowed into theBay of Biscay at the end of the last glacial period. This is stronglysupported by the factor of 30 between the data-basedmean estimate ofthe Fleuve Manche sediment load, and the modelled estimateconsidering a Fleuve Manche only draining the English Channel area(Fig. 7). The onshore geological evidence, which suggests that the Rhineand Meuse rivers at least drained towards the Dover Strait from theonset of the last glacial period (e.g. Gibbard, 1988; Laban, 1995;Busschers et al., 2007), corroborate our assumption.
The comparison between the data-based and modelled FleuveManche sediment load also demonstrates that the river's drainagearea was more extensive, at least around 20–18 ka, than those statedin the Case 2. From ca 20 ka, the (minimum) Fleuve Manche sedimentload is indeed higher by a factor ranging from 1.1 to 1.7 than themaximal modelled sediment load estimated from the Case 2 (Fig. 7).Although this result could also indicate a potential flushing of thepalaeovalleys on the English Channel shelf, which are now largelydevoid of sediment infill (Gupta et al., 2007), we demonstrate laterthat both interpretations ultimately result in similar conclusions.Nevertheless, we assume that this result indicates either thatadditional river systems from the southern North Sea basin (e.g.Thames, Elbe, Weser and Scheldt; Fig. 1) merged with the Rhine andMeuse rivers before entering the Dover Strait, as demonstrated for thepenultimate glaciation (Gibbard, 1988; Busschers et al., 2008;Toucanne et al., 2009a), or that meltwater releases to the southernNorth Sea from disintegrating BIS, FIS and Vosges, Jura and northernAlps glaciers strongly impact on the Fleuve Manche activity, thedeglaciation occurring from ca 20 ka ago in these areas (e.g. Houmark-Nielsen and Kjær, 2003; Ivy-Ochs et al., 2004; Buoncristiani andCampy, 2004; Ehlers and Gibbard, 2004; Sejrup et al., 2009). The latter
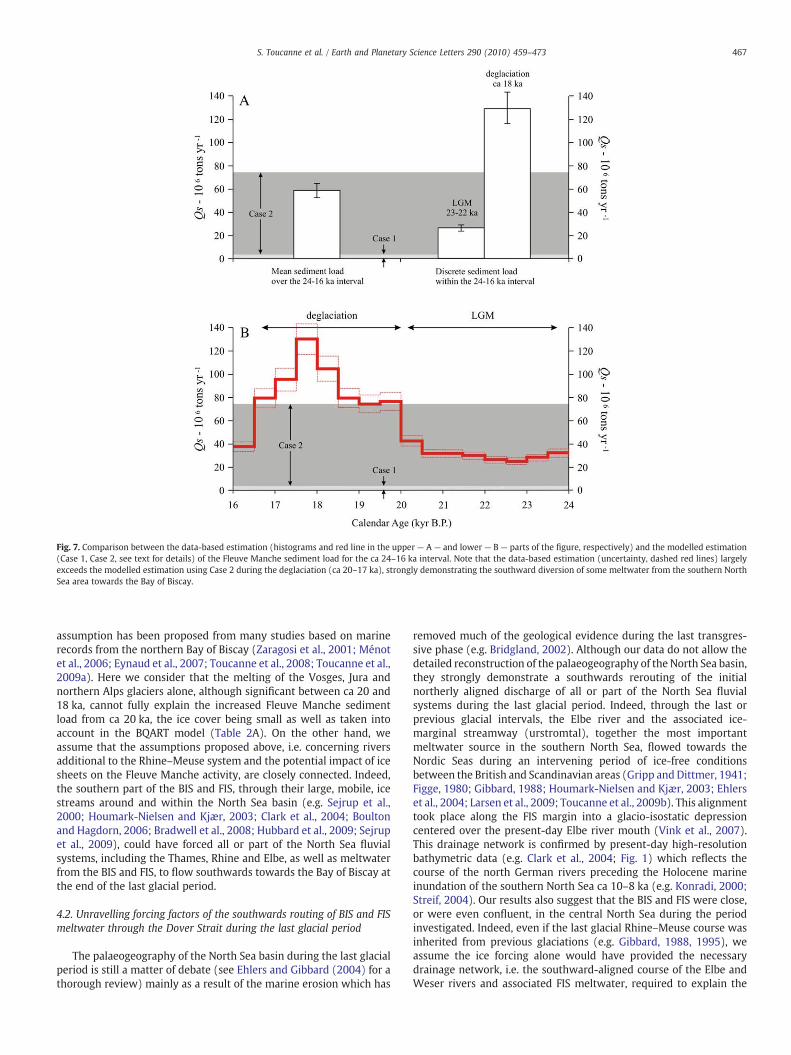
Fig. 7. Comparison between the data-based estimation (histograms and red line in the upper — A — and lower — B — parts of the figure, respectively) and the modelled estimation(Case 1, Case 2, see text for details) of the Fleuve Manche sediment load for the ca 24–16 ka interval. Note that the data-based estimation (uncertainty, dashed red lines) largelyexceeds the modelled estimation using Case 2 during the deglaciation (ca 20–17 ka), strongly demonstrating the southward diversion of some meltwater from the southern NorthSea area towards the Bay of Biscay.
467S. Toucanne et al. / Earth and Planetary Science Letters 290 (2010) 459–473
assumption has been proposed from many studies based on marinerecords from the northern Bay of Biscay (Zaragosi et al., 2001; Ménotet al., 2006; Eynaud et al., 2007; Toucanne et al., 2008; Toucanne et al.,2009a). Here we consider that the melting of the Vosges, Jura andnorthern Alps glaciers alone, although significant between ca 20 and18 ka, cannot fully explain the increased Fleuve Manche sedimentload from ca 20 ka, the ice cover being small as well as taken intoaccount in the BQART model (Table 2A). On the other hand, weassume that the assumptions proposed above, i.e. concerning riversadditional to the Rhine–Meuse system and the potential impact of icesheets on the Fleuve Manche activity, are closely connected. Indeed,the southern part of the BIS and FIS, through their large, mobile, icestreams around and within the North Sea basin (e.g. Sejrup et al.,2000; Houmark-Nielsen and Kjær, 2003; Clark et al., 2004; Boultonand Hagdorn, 2006; Bradwell et al., 2008; Hubbard et al., 2009; Sejrupet al., 2009), could have forced all or part of the North Sea fluvialsystems, including the Thames, Rhine and Elbe, as well as meltwaterfrom the BIS and FIS, to flow southwards towards the Bay of Biscay atthe end of the last glacial period.
4.2. Unravelling forcing factors of the southwards routing of BIS and FISmeltwater through the Dover Strait during the last glacial period
The palaeogeography of the North Sea basin during the last glacialperiod is still a matter of debate (see Ehlers and Gibbard (2004) for athorough review) mainly as a result of the marine erosion which has
removed much of the geological evidence during the last transgres-sive phase (e.g. Bridgland, 2002). Although our data do not allow thedetailed reconstruction of the palaeogeography of the North Sea basin,they strongly demonstrate a southwards rerouting of the initialnortherly aligned discharge of all or part of the North Sea fluvialsystems during the last glacial period. Indeed, through the last orprevious glacial intervals, the Elbe river and the associated ice-marginal streamway (urstromtal), together the most importantmeltwater source in the southern North Sea, flowed towards theNordic Seas during an intervening period of ice-free conditionsbetween the British and Scandinavian areas (Gripp and Dittmer, 1941;Figge, 1980; Gibbard, 1988; Houmark-Nielsen and Kjær, 2003; Ehlerset al., 2004; Larsen et al., 2009; Toucanne et al., 2009b). This alignmenttook place along the FIS margin into a glacio-isostatic depressioncentered over the present-day Elbe river mouth (Vink et al., 2007).This drainage network is confirmed by present-day high-resolutionbathymetric data (e.g. Clark et al., 2004; Fig. 1) which reflects thecourse of the north German rivers preceding the Holocene marineinundation of the southern North Sea ca 10–8 ka (e.g. Konradi, 2000;Streif, 2004). Our results also suggest that the BIS and FIS were close,or were even confluent, in the central North Sea during the periodinvestigated. Indeed, even if the last glacial Rhine–Meuse course wasinherited from previous glaciations (e.g. Gibbard, 1988, 1995), weassume the ice forcing alone would have provided the necessarydrainage network, i.e. the southward-aligned course of the Elbe andWeser rivers and associated FIS meltwater, required to explain the
468 S. Toucanne et al. / Earth and Planetary Science Letters 290 (2010) 459–473
Fleuve Manche sediment load, particularly from ca 20 ka ago. Thisforcing has been highlighted throughout the later Pleistocene,particularly during the Elsterian and Saalian Drenthe glaciationswhen ice covered most of the North Sea basin (Gibbard, 1988; Sejrupet al., 2000; Ehlers and Gibbard, 2004), ca 450 ka (MIS 12) and 175–155 ka (MIS 6) ago, respectively (Toucanne et al., 2009a; Toucanneet al., 2009b). Apart from being generally accepted in the NorthAmerican (e.g. Clark et al., 2001) and Eurasian continents (e.g.Mangerud et al., 2004), the ice forcing, proposed above, is alsocorroborated by the broadly northwardly courses of the north Germanrivers and associated FISmeltwater duringMIS 10, MIS 8 (Toucanne etal., 2009a; Toucanne et al., 2009b) and at ca. 155–140 ka (i.e. SaalianWarthe Substage), i.e. after the re-establishment of ice-free conditionsbetween the British Isles and Scandinavia during the second part ofthe MIS 6. This significant palaeogeographical change led to astrikingly weak Fleuve Manche runoff during Termination II (Tou-canne et al., 2009a) while the circum-North Atlantic ice masses,including the European ice sheet, rapidly retreated (e.g. Ruddiman,2006; Risebrobakken et al., 2006; Carlson, 2008). Based on the datapresented herein, we assume, therefore, that the Late Weichseliandrainage configuration in the North Sea basin was probablyequivalent to that dating from the major Saalian Drenthe (Gibbard,1988; Busschers et al., 2008; Toucanne et al., 2009a) and Elsterianglaciations (Gibbard, 1988; Toucanne et al., 2009b). In that sense, ourconclusions support recent results from simulations (e.g. Boulton andHagdorn, 2006; Hubbard et al., 2009), as well as geological evidence(e.g. Sejrup et al., 2000; Carr et al., 2000; Carr et al., 2006; Grahamet al., 2007; Bradwell et al., 2008; Sejrup et al., 2009) which impliesthat the eastern andwestern part of the BIS and FIS, respectively, wereconfluent or were at the very least close during the last glacial period.
The isostatic adjustment of the southern North Sea basin should betaken into account, in addition to the presence of ice alone, to explainthe southwards diversion of the North Sea fluvial systems. Busscherset al. (2007) suggest that the westward tilting of the Rhine–Meusechannel belts from the central to the southern Netherlands, duringWeichselian mid- to late-glacial times, resulted from the glacio-isostatic upwarping of ca 10 to 30 m centered over the northernNetherlands (e.g. Vink et al., 2007; Busschers et al., 2007). Consideringthis isostatic adjustment, the rivers flowing northwards towards thepresent-day German Bight formed an exceptionally wide southeast–northwest-aligned braidplain (i.e. Elbe–Weser system) through theeastern Danish North Sea (e.g. Gripp and Dittmer, 1941), this areaforming a depression between the forebulge dome (e.g. Vink et al.,2007; Busschers et al., 2007) and the FIS margin over the Denmark(Houmark-Nielsen and Kjær, 2003; Larsen et al., 2009). This drainagepattern is confirmed by the recognition of a 30–40 km wide offshoresoutheast–northwest-aligned valley overlain by Holocene deposits inthe present-day German Bight (e.g. Figge, 1980; Konradi, 2000;Houmark-Nielsen and Kjær, 2003) which was interpreted as repre-senting an extension of the Elbe and Weser rivers by Figge (1980).Finally, we assume that the Elbe–Weser system connected the Rhine–Meuse system in the Southern Bight after a northern pathway, i.e.bypassing the forebulge dome through a potential proglacial lake inthe central North Sea (Dogger Bank area) (e.g. Jansen, 1976; Laban,1995) dammed to the north by the extension of continental ice fromScandinavia and eastern England (e.g. Carr et al., 2000; Sejrup et al.,2000; Clark et al., 2004; Carr et al., 2006; Graham et al., 2007; Bradwellet al., 2008; Sejrup et al., 2009).
This drainage configuration implies that the North Sea basinconnected the Fleuve Manche palaeoriver and the Bay of Biscay to theNorthern European lowlands and hence to the southern margin of theFIS, potentially as far as Poland and Lithuania. Indeed, the Elbe–Wesersystem constituted the western part of the Vilnius–Warsaw–Berlinurstromtal (Marks, 2002; Ehlers and Gibbard, 2004) at the time of themaximum extent of the southern FIS, ca 22–20 ka ago (e.g. Marks,2002; Houmark-Nielsen and Kjær, 2003; Rinterknecht et al., 2006).
We assume, therefore, the connection between the Fleuve Mancheand the southern part of the FIS to be of primary importance, incomparison to that with the Rhine–Meuse system for instance,regarding the Fleuve Manche runoff especially during the lastdeglaciation. Indeed, the southern part of the FIS represents themost important meltwater source to the southern North Sea at theonset of the deglaciation, with regard to its extreme sensibility toclimate changes (e.g. Boulton et al., 1985; Rinterknecht et al., 2006).Anyway, the drainage area of the Fleuve Manche palaeoriver couldhave reached ca 1.2·106 km², the drainage area of the Elbe, Oder andVistula rivers being connected to the North Sea basin and thence tothe English Channel area as a result of the presence of ice in the NorthSea area (Fig. 8).
4.3. Chronology of the Late Pleistocene southwards routing of BIS and FISmeltwater through the Dover Strait
The timing of the BIS and FIS oscillations in the North Sea duringthe last glacial period is poorly documented (e.g. Sejrup et al., 2009).Here, we assume that our data can help decipher the glacial anddrainage configuration within and around this area, at least for thesecond part of the last glacial interval, hence allowing a refinement ofthe chronology of the significant palaeogeographic changes of theNorth Sea area during the MIS 2 (Fig. 8).
Confluence of the BIS and FIS in the North Sea basin is suggestedbetween ca 30 and 25 ka (Carr et al., 2000; Carr et al., 2006; Bradwellet al., 2008; Sejrup et al., 2009) (Fig. 8), and potentially until ca 20 kaaccording to Carr et al. (2006). Although the results presented hereincannot assist in the dating of the initiation of the confluence of the BISand FIS, the significant increase in terrigenous flux, detected off theEnglish Channel at ca 30 ka and interpreted as enhanced FleuveManche discharges by Toucanne et al. (2009a), could reflect thesouthwards diversion of the North Sea fluvial systems expected fromthe meeting of the ice sheets in the North Sea ca 30 ka ago (e.g.Bradwell et al., 2008; Sejrup et al., 2009). This drainage change isdifficult to identify from the Bay of Biscay deep-sea records, since theFleuve Manche runoff failed to increase catastrophically, a responsethat results from the prevailing contemporaneous arid conditions onthe surrounding local land at this time (e.g. Renssen and Vanden-berghe, 2003). It is also because the European ice sheet significantlygrew during this phase, i.e. in comparison to deglacial time, the icesheet failed to release substantial meltwater volumes (e.g. Boulton etal., 1985; Boulton and Hagdorn, 2006; Hubbard et al., 2009).
Because sedimentological (Zaragosi et al., 2001; Toucanne et al.,2008; Toucanne et al., 2009a) as well as palynological (Eynaud et al.,2007) and geochemical (Ménot et al., 2006) reconstructions from thenorthern Bay of Biscay do not witness any profound decay (i.e.meltwater release) of the European ice sheet between ca 30 and 20 ka,the Fleuve Manche drainage network do not significantly changethroughout the interval. Thus, we assume that the Elbe–Wesersystem, including FIS meltwater, continued to flow through theDover Strait until ca 20 ka ago at least, i.e. ca 10 kyr after its diversiontowards the Bay of Biscay. The strong increase of the Fleuve Mancheactivity from ca 20 ka which is contemporaneous with the significantretreat of the FIS from its maximum extent (Marks, 2002; Vorren andPlassen, 2002; Dahlgren and Vorren, 2003; Nygard et al., 2004; Lekenset al., 2005; Rinterknecht et al., 2006; Knies et al., 2007; Goehring etal., 2008; Krohn et al., 2009) confirms the close relationship betweenthe Fleuve Manche and the FIS. Moreover, it confirms the southwardsflow of the Elbe–Weser system until the end of the last glacial period.This assumption is also supported by the extreme sediment loadvalues recorded off the Fleuve Manche from this time, which cannotbe accounted for if they are attributed solely to the diversion of theRhine–Meuse system alone into the English Channel (Fig. 7).
Despite a large drainage area, the Fleuve Manche shows a lowsediment load before ca 20 ka, probably in response to the climatic
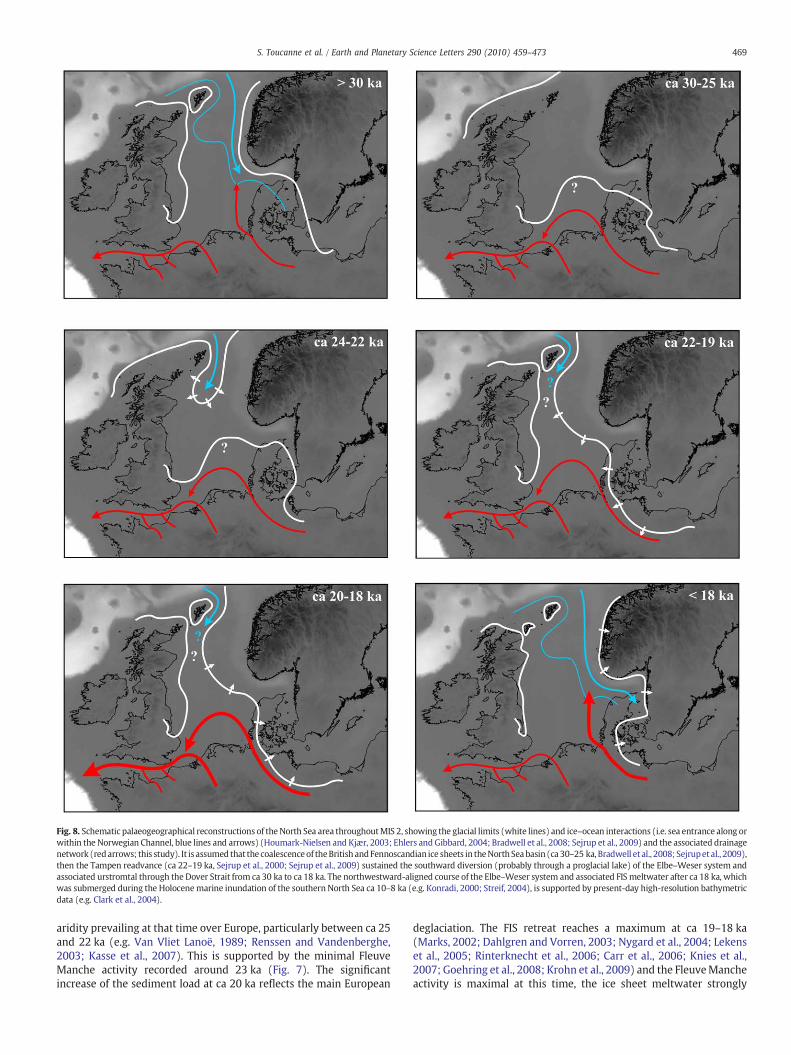
Fig. 8. Schematic palaeogeographical reconstructions of the North Sea area throughoutMIS 2, showing the glacial limits (white lines) and ice–ocean interactions (i.e. sea entrance along orwithin the Norwegian Channel, blue lines and arrows) (Houmark-Nielsen and Kjær, 2003; Ehlers and Gibbard, 2004; Bradwell et al., 2008; Sejrup et al., 2009) and the associated drainagenetwork (redarrows; this study). It is assumed that the coalescenceof theBritish andFennoscandian ice sheets in theNorthSeabasin (ca30–25 ka, Bradwell et al., 2008; Sejrupet al., 2009),then the Tampen readvance (ca 22–19 ka, Sejrup et al., 2000; Sejrup et al., 2009) sustained the southward diversion (probably through a proglacial lake) of the Elbe–Weser system andassociated urstromtal through the Dover Strait from ca 30 ka to ca 18 ka. The northwestward-aligned course of the Elbe–Weser system and associated FIS meltwater after ca 18 ka, whichwas submerged during the Holocenemarine inundation of the southern North Sea ca 10–8 ka (e.g. Konradi, 2000; Streif, 2004), is supported by present-day high-resolution bathymetricdata (e.g. Clark et al., 2004).
469S. Toucanne et al. / Earth and Planetary Science Letters 290 (2010) 459–473
aridity prevailing at that time over Europe, particularly between ca 25and 22 ka (e.g. Van Vliet Lanoë, 1989; Renssen and Vandenberghe,2003; Kasse et al., 2007). This is supported by the minimal FleuveManche activity recorded around 23 ka (Fig. 7). The significantincrease of the sediment load at ca 20 ka reflects the main European
deglaciation. The FIS retreat reaches a maximum at ca 19–18 ka(Marks, 2002; Dahlgren and Vorren, 2003; Nygard et al., 2004; Lekenset al., 2005; Rinterknecht et al., 2006; Carr et al., 2006; Knies et al.,2007; Goehring et al., 2008; Krohn et al., 2009) and the FleuveMancheactivity is maximal at this time, the ice sheet meltwater strongly
470 S. Toucanne et al. / Earth and Planetary Science Letters 290 (2010) 459–473
increasing the ability of the river and its tributaries to transportsediment to the Bay of Biscay (Fig. 7). The concomitant rapid tunnel-valley formation beneath the receding south-western FIS (Sandersenet al., 2009), which displays strong erosional processes and sedimenttransport through large quantities of meltwater to the southern NorthSea, could also have enhanced the contemporaneous Fleuve Manchesediment load, thus showing that the expected proglacial lakebetween the FIS and the Dover Strait, if it existed, did not act as asignificant sediment trap. Anyway, the minimummean sediment loadis estimated at ca 130·106 t yr−1 around 18 ka but the seasonalbehaviour of the Fleuve Manche runoff in response to the seasonalvariability of the meltwater production from the ice sheet at this time(Eynaud et al., 2007; Toucanne et al., 2009a) probably implies a strongsediment load variability around the estimated value.
It is largely accepted that the significant decrease of FleuveMancheactivity after ca 18 ka occurs in response to the initiation of a deglacialpause corresponding to the HE1 (e.g. Zaragosi et al., 2001; Toucanneet al., 2009a) (Fig. 7). Here, we assume that the decrease of the FleuveManche sediment load could also reflect a profound change of itsdrainage network, i.e. the disconnection of the Fleuve Manche fromthe FIS through the northwards rerouting of the Elbe–Weser system(Fig. 8). We assume that the suggested drainagemodification requiresa profound change of the glacial conditions in the North Sea basinaround 18 ka. Nevertheless, such a change occurred around 24 kawith the isolation of the BIS and FIS, in the northern North Sea at least(Sejrup et al., 2000; Bradwell et al., 2008; Sejrup et al., 2009), andhence the formation of a corridor between both ice sheets in whichthe Elbe river system could potentially flow (Fig. 8). In order toreconcile our results, i.e. an expected southwards direction of theElbe–Weser system until ca 18 ka, with the palaeoglaciologicalreconstructions, two assumptions can be proposed: either the BISand FIS were confluent until late in the central North Sea, either theBIS and FIS, although isolated, entered the North Sea basin enoughuntil ca 19–18 ka to induce a isostatic adjustment which allowed theElbe–Weser system to continue flowing towards the Bay of Biscay.
The first assumption could explain why no significant FleuveManche discharge, comparable to that reported during the penulti-mate glaciation in response to the ice sheet decay in the North Sea (ca150 ka), occurred within the ca 30–20 ka interval (Toucanne et al.,2009a). This assumption also appears to correspond to the decaypattern of the ice sheet in the northernNorth Sea recently proposed byBradwell et al. (2008). Indeed, the BIS and FIS decouple in this areaalong a north–south axis from ca 25 ka, through initiation of a calving-bay then the progressive embayment of the northern North Sea as faras the Witch Ground basin at ca 24 ka (Graham et al., 2007; Bradwellet al., 2008; Sejrup et al., 2009) (Fig. 8). Considering the rising sea-levelforcing decay of the ice sheet in the North Sea proposed by Bradwellet al. (2008), the gradual and moderate eustatic sea-level rise withinthe ca 24–18 ka interval (20 to 30 m, Peltier and Fairbanks, 2006)could have produced a relatively slow southwards disconnection ofthe BIS and FIS over the period. This could have potentially allowedtheir coalescence in the central North Sea basin until around 18 ka.
However, the second hypothesis appearsmore plausible because itagrees with numerous studies which suggest isolated BIS and FIS ca25 ka onwards (Sejrup et al., 2000; Bradwell et al., 2008; Sejrup et al.,2009). Moreover, the expected closeness of the BIS and FIS until ca19–18 ka is corroborated by some significant ice advances in theNorth Sea before the deglaciation (e.g. Sejrup et al., 2000; Carr et al.,2006; Larsen et al., 2009; Sejrup et al., 2009; Krohn et al., 2009), themost significant being the expansion of the FIS westwards from theNorwegian Channel to the North Sea plateau between ca 22 and 19 ka(Tampen readvance, e.g. Sejrup et al., 2009) (Fig. 8). The subsequentretreat of the FIS onto the North Sea plateau (Sejrup et al., 2009), aswell as over the Northern European lowlands from 19 ka (Rinter-knecht et al., 2006), then the rapid disintegration of the NorwegianChannel ice stream at ca 18.5 ka (Sejrup et al., 2009), all coinciding
with the maximum Fleuve Manche activity, probably induced thedeflection of the Elbe–Weser system thereafter (Fig. 8). From this timeonwards, and in agreement with the palaeogeographical reconstruc-tions proposed by Houmark-Nielsen and Kjær (2003) and Larsen et al(2009), the Elbe–Weser system and associated FIS meltwater flowedwithin the Norwegian Channel, which was ice-free and becamesubmerged from 18 ka according to Sejrup et al. (2009) (Fig. 8).
4.4. Comments on the Fleuve Manche meltwater discharge and thepotential impact on the Atlantic thermohaline circulation at ca. 18 ka
The determination of the Fleuve Manche water discharge is adifficult challenge but such an estimate can be discussed on the basisof our results. Considering realistic average suspended–sedimentconcentrations of 10, 100 and 500 mg l−1, the latter being a maximalvalue for rivers flowing in periglacial environments (e.g. Mulder andSyvitski, 1995), we obtain a Fleuve Manche water discharge rangingfrom 8 to 400·103 m3 s−1 within the 18–17.5 ka interval. Althoughboth values appear extreme, this estimate strongly demonstrates thatthe Fleuve Manche was at this time equivalent to the most importantpresent-day rivers. Beside the sedimentological evidence, this issupported by the BIT-index values recorded at the deep-sea siteMD95-2002 (ca 200 km from the Fleuve Manche palaeo-mouth,Figs. 1 and 4A) (Ménot et al., 2006) which lie in the range of thoserecordedwithin and around the present-daymouth of the Congo river(Hopmans et al., 2004), i.e. the second most important world riverwith regard to water discharge.
The increased discharge of the FleuveManche detected between ca18.3 and 17 ka correlates with a sharp increase of the sedimentary231Pa/230Th signals from distinct areas of the North Atlantic region(McManus et al., 2004; Gherardi et al., 2005; Hall et al., 2006; Gherardiet al., 2009), thereby demonstrating coincident reduction in thestrength of the Atlantic thermohaline circulation (THC). This decreaseof the THC strength, which significantly slowed the poleward oceanicheat transport then caused glaciomarine conditions in the NorthAtlantic (e.g. Elliot et al., 2001; McManus et al., 2004), reaches itsmaximum around 16 ka (e.g. Gherardi et al., 2009). If massive icebergreleases from the circum-North Atlantic ice sheets sustained aweakened THC between ca. 17 and 16 ka by freshening and increasingbuoyancy of the Northern Atlantic surface water (Vidal et al., 1997;Elliot et al., 2001; McManus et al., 2004), we assume that thesynchronicity between the increased meltwater discharge from theFleuve Manche and the sharp reduction of the deep-water formationfrom ca 18 ka strongly suggest that the river's discharges may wellhave acted as a trigger, or at the least an amplifier, in weakening thestrength of the THC. Such a mechanism could explain the synchro-neity between contradictory events around 18 ka (i.e. the onset of the“Mystery Interval”, Denton et al., 2006), i.e. the hypercold climate overthe North Atlantic and north-western Europe in response to thedecrease of the THC (e.g. Bard et al., 2000), and the rapiddisintegration of the European ice sheet and glaciers (e.g. Rinter-knecht et al., 2006; this study). Indeed, numerical models demon-strate that the THC is highly sensitive to the freshwater forcing (e.g.Rahmstorf, 1995), and some abrupt decreases of the THC and climatecooling during the last glacial period have been directly linked toincreased freshwater flux into the North Atlantic (e.g. Broecker et al.,1989; Clark et al., 2001; Clement and Peterson, 2008). Considering theabove estimates, the FleuveManche freshwater discharge ranges fromca 0.01 to 0.4 Sv over the 18.3–17.5 ka interval, i.e. a meltwater releaseimportant and sufficiently sustained to reduce significantly the THCstrength according to many simulations (see Clement and Peterson(2008) for a thorough review). Modelling experiments could assist inthe evaluation of the impact of the Fleuve Manche discharge at ca18 ka on the concomitant THC strength reduction. Nevertheless, ourconclusions suggest that the Fleuve Manche palaeoriver, through itsmassive meltwater runoff to the North Atlantic from the onset of
471S. Toucanne et al. / Earth and Planetary Science Letters 290 (2010) 459–473
increasing Northern Hemisphere summer insolation, could have beena significant factor in the complex mechanism recently proposed byCheng et al. (2009) that led to Termination 1. As a result, we concludethat our results support previous studies (e.g. Scourse et al., 2000;Grousset et al., 2000; Zaragosi et al., 2001; Clark et al., 2004; Pecket al., 2007; Knutz et al., 2007; Toucanne et al., 2009a), as well asrecent simulations (Roche et al., in press), that suggest theparticipation of the European ice sheet in the modulation of somemillennial-scale climate changes during the last glacial intervals.
5. Summary
We quantify for the first time both the sediment load andfreshwater discharge of the Fleuve Manche palaeoriver during thelast deglaciation. Our results definitely demonstrate that the FleuveManche was equivalent in discharge to the most important present-day rivers, particularly during 20–18 ka period, due to the southwardsflow of the Fennoscandian ice sheet derived meltwater through theDover Strait. Such a drainage network is indeed required to explainthe Fleuve Manche sediment load estimated during the Europeandeglaciation, while implying the significant advance, and the potentialconfluence, of the BIS and FIS in the North Sea during the last glacialinterval and a subsequent redirection of the northward Elbe courseand associated meltwater volume. Finally, the estimated FleuveManche freshwater discharge between ca 18.3 and 17.5 ka appearsimportant and sufficiently sustained to contribute to the profoundTHC destabilisation recognised in the North Atlantic from ca 18 ka.
Acknowledgments
The authors warmly thank Kim Cohen, Bernard Dennielou, GeorgeDenton, Gilles Lericolais, Julien Moreau, Thierry Mulder, Didier Rocheand Guillaume Soulet for invaluable discussions at various stages ofthis work; and the Editor Peter deMenocal, James Scourse and twoanonymous reviewers whose constructive criticism improved thequality of the manuscript and figures. The authors also thank the crewand scientific teams of the R/V L'Atalante (IFREMER, ZEE-Gascognecruises), R/V Marion Dufresne (IPEV, MD105-Image1, MD123-Geos-ciences, MD133-Sedicar cruise, MD141-Alienor) and R/V PourquoiPas? (IFREMER, TVTB cruise) for the recovery of the long piston coresand the acoustic dataset, and the French Programmes ‘ARTEMIS’,‘ACTION MARGES’, ‘RELIEFS DE LA TERRE’ and the ANR ‘IDEGLACE’ fortheir financial support. This is a UMR 5805 ‘EPOC’ (University ofBordeaux 1 — CNRS) contribution no. 1758.
References
Alley, R.B., Clark, P.U., 1999. The deglaciation of the northern hemisphere: a globalperspective. Annu. Rev. Earth Planet. Sci. 27, 149–182.
Antoine, P., Coutard, J.P., Gibbard, P., Hallegouet, B., Lautridou, J.P., Ozouf, J.C., 2003. ThePleistocene rivers of the English Channel region. J. Quatern. Sci. 18, 227–243.
Auffret, G.A., Boelaert, A., Vergnaud-Grazzini, C., Muller, C., Kerbrat, R., 1996.Identification of Heinrich Layers in core KS 01 North-Eastern Atlantic (46°N,17°W), implications for their origin. Mar. Geol. 131, 5–20.
Auffret, J.P., Dennielou, B., Boelaert, A., Bassinot, F., Labeyrie, L., Pujol, C., Loncaric, N.,1998. Physical properties and environmental implications of thick Heinrich layersfrom the Meriadzek Terrace (Bay of Biscay, NE Atlantic Ocean). VI InternationalConference on Paleoceanography (ICP6), August 1998, Lisbon (Portugal).
Auffret, G., Zaragosi, S., Dennielou, B., Cortijo, E., Van Rooij, D., Grousset, F., Pujol, C.,Eynaud, F., Siegert, M., 2002. Terrigenous fluxes at the Celtic margin during the lastglacial cycle. Mar. Geol. 188, 79–108.
Bard, E., Rostek, F., Turon, J.L., Gendreau, S., 2000. Hydrological impact of Heinrichevents in the subtropical Northeast Atlantic. Science 289, 1321–1324.
Boulton, G., Hagdorn, M., 2006. Glaciology of the British Isles Ice Sheet during the lastglacial cycle: form, flow, streams and lobes. Quatern. Sci. Rev. 25, 3359–3390.
Boulton, G.S., Smith, G.D., Jones, A.S., Newsome, J., 1985. Glacial geology and glaciologyof the last mid-latitude ice sheets. J. Geol. Soc. London 142, 447–474.
Bourillet, J.F., Reynaud, J.Y., Baltzer, A., Zaragosi, S., 2003. The “Fleuve Manche”: thesubmarine sedimentary features from the outer shelf to the deep-sea fans. J.Quatern. Sci. 18, 261–282.
Bourillet, J.F., Zaragosi, S., Mulder, T., 2006. The French Atlantic margin and the deep seasubmarine systems. Geo-Mar. Lett. 26, 311–315.
Bourillet, J.F., Damy, G., Dussud, L., Sultan, N., Woerther, P., Migeon, S., 2007. Behaviourof a piston corer from accelerometers and new insights on quality of the recovery.Proceedings of the 6th International Offshore Site Investigation and GeotechnicsConference: Confronting New Challenges and Sharing Knowledge, 11–13 Septem-ber 2007, London, UK.
Braconnot, P., Otto-Bliesner, B., Harrison, S., Joussaume, S., Peterchmitt, J.Y., Abe-Ouchi, A.,Crucifix,M., Driesschaert, E., Fichefet, T., Hewitt, C.D., Kageyama,M., Kitoh, A., Laîne, A.,Loutre, M.F., Marti, O., Merkel, U., Ramstein, G., Valdes, P., Weber, S.L., Yu, Y., Zhao, Y.,2007. Results of PMIP2 coupled simulations of the Mid-Holocene and Last GlacialMaximum— part 1: experiments and large-scale features. Clim. Past 3, 261–277.
Bradwell, T., Stoker, M.S., Golledge, N.R., Wilson, C.K., Merritt, J.W., Long, D., Everest, J.D.,Hestvik, O.B., Stevenson, A.G., Hubbard, A.L., Finlayson, A.G., Mathers, H.E., 2008.The northern sector of the last British Ice Sheet: maximum extent and demise.Earth-Sci. Rev. 88, 207–226.
Bridgland, D.R., 2002. Fluvial deposition on periodically emergent shelves in theQuaternary: examples records from the shelf around Britain. Quatern. Int. 92, 25–34.
Bridgland, D.R., D'Olier, B., 1995. The Pleistocene evolution of the Thames and Rhinedrainage systems in the southern North Sea Basin. In: Preece, R.C. (Ed.), IslandBritain: A Quaternary Perspective. Geological Society of London Special PublicationNo. 96, London, pp. 27–45.
Broecker, W., Kennett, J.P., Flower, B.P., Teller, J.T., Trumbore, S., Bonami, G., Wolfli, W.,1989. Routing of meltwater from the Laurentide Ice Sheet during the YoungerDryas cold episode. Nature 341, 318–321.
Buoncristiani, J.F., Campy, M., 2004. Expansion and retreat of the Jura ice sheet (France)during the last glacial maximum. Sed. Geol. 165, 253–264.
Busschers, F.S., Kasse, C., Van Balen, R.T., Vandenberghe, J., Cohen, K.M., Weerts, H.J.T.,Wallinga, J., Johns, C., Cleveringa, P., Bunnik, F.P.M., 2007. Late Pleistocene evolutionof the Rhine–Meuse system in the southern North-Sea Basin: imprints of climatechange, sea-level oscillation and glacio-isostacy. Quatern. Sci. Rev. 26, 3216–3248.
Busschers, F.S., Van Balen, R.T., Cohen, K.M., Kasse, C., Weerts, H.J.T., Wallinga, J., Bunnik,F.P.M., 2008. Response of the Rhine–Meuse fluvial system to Saalian ice-sheetdynamics. Boreas 37, 377–398.
Carlson, A.E., 2008. Why there was not a Younger Dryas-like event during thePenultimate Deglaciation. Quatern. Sci. Rev. 27, 882–887.
Carr, S.J., Haflidason, H., Sejrup, H.P., 2000. Micromorphological evidence supportingLate Weichselian glaciation of the northern North Sea. Boreas 29, 315–328.
Carr, S.J., Holmes, R., Van der Meer, J.J.M., Rose, J., 2006. The Last Glacial Maximum in theNorth Sea Basin: micromorphological evidence of extensive glaciation. J. Quatern.Sci. 21, 131–153.
Cheng, H., Edwards, R.L., Broecker, W.S., Denton, G.H., Kong, X., Wang, Y., Zhang, R.,Wang, X., 2009. Ice age terminations. Science 326, 248–252.
Clark, P.U., Alley, R.B., Pollard, D., 1999. Northern Hemisphere ice-sheet influences onglobal climate change. Science 286, 1104–1111.
Clark, P.U., Marshall, S.J., Clarke, G.K.C., Hostetler, S.W., Licciardi, J.M., Teller, J.T., 2001.Freshwater forcing of abrupt climate change during the last glaciation. Science 293,283–287.
Clark, C.D., Sejrup, H.P., Bigg, G., Stocker, M., Lonergan, L., Raunholm, S., Haflidason, H.,2004. Did the punctuated demise of glacial ice in the North Sea affect thermohalinecirculation of the ocean? Eos Trans. AGU 85. doi:10.1029/2004EO310006.
Clement, A.C., Peterson, L.C., 2008. Mechanisms of abrupt climate change of the lastglacial period. Rev. Geophys. 46. doi:10.1029/2006RG000204.
Cohen, K.M., Busschers, F.S., Gibbard, P.L., 2005. Stratigraphical implications of an Elsterianpro-glacial ‘North Sea’ lake. In: Dehnert, A., Preusser, F. (Eds.), SEQS SubcommissionEuropean Quaternary Stratigraphy 2005 annual meeting, Bern, Switzerland.
Dahlgren, K.I.T., Vorren, T.O., 2003. Sedimentary environment and glacial history duringthe last 40 ka of the Vøring continental margin, mid-Norway. Mar. Geol. 193, 93–127.
Denton, G.H., Broecker, W., Alley, R.B., 2006. The mystery interval 17.5 to 14.5 kyr ago.In: Brigham-Grette, J., Kull, C., Kiefer, T. (Eds.), PAGES News, pp. 14–16.
Ehlers, J., Gibbard, P.L., 2004. Quaternary Glaciations — Extent and Chronology Part I:Europe. Elsevier, Amsterdam.
Ehlers, J., Eissmann, L., Lippstreu, L., Stephan,H.J.,Wansa, S., 2004. Pleistocene glaciationsofNorth Germany. Developments in Quaternary Science. Elsevier, pp. 135–146.
Elliot, M., Labeyrie, L., Dokken, T., Manthe, S., 2001. Coherent patterns of ice-rafteddebris deposits in the Nordic regions during the last glacial (10–60 ka). EarthPlanet. Sci. Lett. 194, 151–163.
Eynaud, F., Zaragosi, S., Scourse, J.D., Mojtahid, M., Bourillet, J.F., Hall, I.R., Penaud, A.,Locascio, M., Reijonen, A., 2007. Deglacial laminated facies on the NW Europeancontinental margin: the hydrographic significance of British Ice sheet deglaciationand Fleuve Manche paleoriver discharges. Geochem. Geophys. Geosyst. 8.doi:10.1029/2006GC001496.
Figge, K., 1980. Das Elbe-Urstromtal im Bereich der Deutschen Bucht (Nordsee). Eiszeit.Gegenw. 30, 203–211.
Gherardi, J.M., Labeyrie, L., McManus, J.F., Francois, R., Skinner, L.C., Cortijo, E., 2005.Evidence from the Northeastern Atlantic basin for variability in the rate of themeridional overturning circulation through the last deglaciation. Earth Planet. Sci.Lett. 240, 710–723.
Gherardi, J.M., Labeyrie, L., Nave, S., Francois, R., McManus, J.F., Cortijo, E., 2009. Glacial–interglacial circulation changes inferred from 231Pa/230Th sedimentary record inthe North Atlantic region. Palaeoceanography 24. doi:10.1029/2008PA001696.
Gibbard, P.L., 1988. The history of great northwest European rivers during the pastthree millions years. Phil. Trans. R. Soc. Lond. B318, 559–602.
Gibbard, P.L., 1995. The formation of the Strait of Dover. In: Preece, R.C. (Ed.), IslandBritain: A Quaternary Perspective. Geological Society of London Special PublicationNo. 96, London, pp. 15–26.
472 S. Toucanne et al. / Earth and Planetary Science Letters 290 (2010) 459–473
Goehring, B.M., Brook, E.J., Linge, H., Raisbeck, G.M., Yiou, F., 2008. Beryllium-10exposures ages of erratic boulders in southern Norway and implications for thehistory of the Fennoscandian Ice Sheet. Quatern. Sci. Rev. 27, 320–336.
Graham, A.G.C., Lonergan, L., Stoker, M.S., 2007. Evidence for Late Pleistocene ice streamactivity in the Witch Ground Basin, central North Sea, from 3D seismic reflectiondata. Quatern. Sci. Rev. 26, 627–643.
Gripp, K., Dittmer, E., 1941. Die Entstehung Nord-Frieslands. Die Naturwissenschaften29, 577–581.
Grousset, F.E., Pujol, C., Labeyrie, L., Auffret, G., Boelaert, A., 2000. Were the NorthAtlantic Heinrich events triggered by the behavior of the European ice sheets?Geology 28, 123–126.
Gupta, S., Collier, J.S., Palmer-Felgate, A., Potter, G., 2007. Catastrophic flooding origin ofshelf valley systems in the English Channel. Nature 448, 342–345.
Hall, I.R., Moran, S.B., Zahn, R., Knutz, P.C., Shen, C.C., Edwards, R.L., 2006. Accelerateddrawdown of meridional overturning in the late-glacial Atlantic triggered bytransient pre-H event freshwater perturbation. Geophys. Res. Lett. 33, L16616.doi:10.1029/2006GL026239.
Hopmans, E.C., Weijers, J.W.H., Schefuß, E., Herfort, L., Sinninghe Damsté, J.S., Schouten,S., 2004. A novel proxy for terrestrial organic matter in sediments based onbranched and isoprenoid tetraether lipids. Earth Planet. Sci. Lett. 224, 107–116.
Houmark-Nielsen, M., Kjær, K.H., 2003. Southwest Scandinavia, 40–15 kyr BP:palaeogeography and environmental change. J. Quatern. Sci. 18, 769–786.
Hubbard, A., Bradwell, T., Golledge, N., Hall, A., Patton, H., Sugden, D., Cooper, R., Stoker,M., 2009. Dynamic cycles, ice streams and their impact on the extent, chronologyand deglaciation of the British–Irish ice sheet. Quatern. Sci. Rev. 28, 758–776.
Ivy-Ochs, S., Schäfer, J., Kubik, P.W., Synal, H.-A., Schlüchter, C., 2004. Timing ofdeglaciation on the northern Alpine foreland (Switzerland). Eclogae Geol. Helv. 97,47–55.
Jansen, F., 1976. Late Pleistocene and Holocene history of the northern North Sea, basedon acoustic reflection records. Neth. J. Sea Res. 10, 1–43.
Jouanneau, J.M., Weber, O., Cremer, M., Castaing, P., 1999. Fine-grained sedimentbudget on the continental margin of the Bay of Biscay. Deep-Sea Res. Part II: Topic.Stud. Oceanogr. 46, 2205–2220.
Kasse, C., Vandenberghe, J., De Corte, F., Van den Haute, P., 2007. Late Weichselianfluvio-aeolian sands and coversands of the type locality Grubbenvorst (southernNetherlands): sedimentary environments, climate record and age. J. Quatern. Sci.22, 695–708.
Kassens, H., Sarnthein, M., 1989. A link between paleoceanography, early diageneticcementation, and shear strength maxima in Late Quaternary deep-sea sediments?Paleoceanography 4, 253–269.
Kettner, A.J., Syvitski, J.P.M., 2008. Predicting discharge and sediment flux of the PoRiver, Italy since the Late Glacial Maximum. In: P.L. de Boer, G. Postma, C.J. van derZwan, P.M. Burgess and P. Kukla (Eds.) Analogue and Numerical ForwardModellingof Sedimentary Systems: from Understanding to Prediction. Spec. Publ. Int. Assoc.Sedimentol. 40, 171–189.
Kettner, A.J., Syvitski, J.P.M., 2009. Fluvial responses to environmental perturbations inthe Northern Mediterranean since the Last Glacial Maximum. Quatern. Sci. Rev. 28,2386–2397.
Knies, J., Vogt, C., Matthiessen, J., Nam, S.I., Ottesen, D., Rise, L., Bargel, T., Eilertsen, R.S.,2007. Re-advance of the Fennoscandian Ice Sheet during Heinrich Event 1. Mar.Geol. 240, 1–18.
Knutz, P.C., Zahn, R., Hall, I.R., 2007. Centennial-scale variability of the British Ice Sheet:implications for climate forcing and Atlantic meridional overturning circulationduring the last deglaciation. Paleoceanography 22, PA1207. doi:10.1029/2006PA001298.
Konradi, P., 2000. Biostratigraphy and environment of the Holocene marine transgres-sion in the Heligoland Channel, North Sea. Bull. Geol. Soc. Denmark 47, 71–79.
Krohn, C.F., Larsen, N.K., Kronborg, C., Nielsen, O.B., Knudsen, K.L., 2009. Litho- andchronostratigraphy of the Late Weichselian in Vendsyssel, northern Denmark, withspecial emphasis on tunnel-valley infill in relation to a receding ice margin. Boreas38, 811–833.
Laban, C., 1995. The Pleistocene glaciations in the Dutch sector of the North Sea. Asynthesis of sedimentary and seismic data. PhD Thesis, University of Amsterdam,194 p.
Larsen, N.K., Knudsen, K.L., Krohn, C.F., Kronborg, C., Murray, A.S., Nielsen, O.B., 2009.Late Quaternary ice sheet, lake and sea history of southwest Scandinavia — asynthesis. Boreas 38, 732–761.
Larsonneur, C., Auffret, J.P., Smith, A.J., 1982. Carte des paléo-vallées et des bancs de laManche orientale (1/50000). BRGM, Brest.
Le Breton, E., 2006. Amélioration de la qualité du carottage Küllenberg. UnpublishedMaster thesis, Ifremer — Institut National des Sciences Appliquées de Strasbourg,pp. 80.
Lekens, W.A.H., Sejrup, H.P., Haflidason, H., Petersen, G.O., Hjelstuen, B., Knorr, G., 2005.Laminated sediments preceding Heinrich event 1 in the northern North Sea andSouthern Norwegian Sea: origin, processes and regional linkage. Mar. Geol. 216,27–50.
Lericolais, G., 1997. Evolution du Fleuve Manche depuis l'Oligocène: stratigraphie etgéomorphologie d'une plate-forme continentale en régime périglaciaire. Unpub-lished PhD thesis, University Bordeaux 1, n°1730, pp. 265.
Lericolais, G., Auffret, J.P., Bourillet, J.F., 2003. The Quaternary Channel River: seismicstratigraphy of its palaeo-valleys and deeps. J. Quatern. Sci. 18, 245–260.
Mangerud, J., Jakobsson, M., Alexanderson, H., Astakhov, V., Clarke, G.K.C., Henriksen,M., Hjort, C., Krinner, G., Lunkka, J.P., Moller, P., Murray, A., Nikolskaya, O., Saarnisto,M., Svendsen, J.I., 2004. Ice-dammed lakes and rerouting of the drainage ofnorthern Eurasia during the Last Glaciation. Quatern. Sci. Rev. 23, 1313–1332.
Marks, L., 2002. Last Glacial Maximum in Poland. Quatern. Sci. Rev. 21, 103–110.
McManus, J.F., Francois, R., Gherardi, J.M., Kelgwin, L., Drown-Leger, S., 2004. Collapseand rapid resumption of Atlantic meridional circulation linked to deglacial climatechanges. Nature 428, 834–837.
Ménot, G., Bard, E., Rostek, F., Weijers, J.W.H., Hopmans, E.C., Schouten, S., SinningheDamsté, J.S., 2006. Early reactivation of European Rivers during the lastdeglaciation. Science 313, 1623–1625.
Milliman, J.D., Syvitski, J.P.M., 1992. Geomorphic/tectonic control of sediment dischargeto the ocean: the importance of small mountainous rivers. J. Geol. 100, 525–544.
Mulder, T., Syvitski, J.P.M., 1995. Turbidity currents generated at river mouths duringexceptional discharges to the world oceans. J. Geol. 103, 285–299.
Mulder, T., Syvitski, J.P.M., 1996. Climatic and morphologic relationships of rivers:implications of sea-level fluctuations on river loads. J. Geol. 104, 509–523.
Nygard, A., Sejrup, H.P., Haflidason, H., Cecchi, M., Ottesen, D., 2004. Deglaciationhistory of the southwestern Fennoscandian Ice Sheet between 15 and 13 14C ka BP.Boreas 33, 1–17.
Overeem, I., Syvitski, J.P.M., Hutton, E.W.H., Kettner, A.J., 2005. Stratigraphic variabilitydue to uncertainty in model boundary conditions: a case-study of the New JerseyShelf over the last 40,000 years. Mar. Geol. 224, 23–41.
Peck, V.L., Hall, I.R., Zahn, R., Grousset, F., Hemming, S.R., Scourse, J.D., 2007. Therelationship of Heinrich events and their European precursors over the past 60 kaBP: a multi-proxy ice-rafted debris provenance study in the North East Atlantic.Quatern. Sci. Rev. 26, 862–875.
Peltier, W.R., Fairbanks, R.G., 2006. Global glacial ice volume and Last Glacial Maximumduration froman extendedBarbados sea level record.Quatern. Sci. Rev. 25, 3322–3337.
Rahmstorf, S., 1995. Bifurcations of the Atlantic thermohaline circulation in response tochanges in the hydrological cycle. Nature 378, 145–149.
Renssen, H., Vandenberghe, J., 2003. Investigation of the relationship betweenpermafrost distribution in NW Europe and extensive winter sea-ice cover in theNorth Atlantic Ocean during the cold phases of the Last Glaciation. Quatern. Sci.Rev. 22, 209–223.
Rinterknecht, V.R., Clark, P.U., Raisbeck, G.M., Yiou, F., Bitinas, A., Brook, E.J., Marks, L.,Zelcs, V., Lunkka, J.P., Pavlovskaya, I.E., Piotrowski, J.A., Raukas, A., 2006. The lastdeglaciation of the southeastern sector of the Scandinavian ice sheet. Science 311,1449–1452.
Risebrobakken, B., Balbon, E., Dokken, T., Jansen, E., Kissel, C., Labeyrie, L., Richter, T.,Senneset, L., 2006. The penultimate deglaciation: high-resolution paleoceano-graphic evidence from a north–south transect along the eastern Nordic Seas. EarthPlanet. Sci. Lett. 241, 505–516.
Roche, D., Wiersma, A. P., Renssen, H., in press. A systematic study of the impact offreshwater pulses with respect to different geographical locations. ClimateDynamics, doi:10.1007/s00382-009-0578-8.
Ruddiman, W.F., 2006. Orbital changes and climate. Quatern. Sci. Rev. 25, 3092–3112.Sandersen, P.B.E., Jorgenson, F., Larsen, N.K., Westergaard, J., Auken, E., 2009. Rapid
tunnel-valley formation beneath the receding Late Weichselian ice sheet inVendyssel, Denmark. Boreas 38, 834–851.
Scourse, J.D., Hall, I.R., McCave, I.N., Young, J.R., Sugdon, C., 2000. The origin of Heinrichlayers: evidence from H2 for European precursor events. Earth Planet. Sci. Lett. 182,187–195.
Scourse, J., Uehara, K., Wainwright, A., 2009a. Celtic Sea linear tidal sand ridges, the IrishSea Ice Stream and the Fleuve Manche: palaeotidal modelling of a transitionalpassive margin depositional system. Mar. Geol. 259, 102–111.
Scourse, J.D., Haapaniemi, A.I., Colmenero-Hidalgo, E., Peck, V.L., Hall, I.R., Austin,W.E.N.,Knutz, P.C., Zahn, R., 2009b. Growth, dynamics and deglaciation of the last British–Irish ice sheet: the deep-sea ice-rafted detritus record. Quatern. Sci. Rev. 28,3066–3084.
Sejrup, H.P., Larsen, E., Landvik, J., King, E.L., Haflidason, H., Nesje, A., 2000. Quaternaryglaciations in southern Fennoscandia: evidence from southwestern Norway andthe northern North Sea region. Quatern. Sci. Rev. 19, 667–685.
Sejrup, H.P., Nygård, A., Hall, A.M., Haflidason, H., 2009. Middle and Late Weichselian(Devensian) glaciation history of south-western Norway, North Sea and easternUK. Quatern. Sci. Rev. 28, 370–380.
Streif, H., 2004. Sedimentary record of Pleistocene and Holocene marine inundationsalong the North Sea coast of Lower Saxony, Germany. Quatern. Int. 112, 3–28.
Syvitski, J.P.M., Milliman, J.D., 2007. Geology, geography, and humans battle fordominance over the delivery of fluvial sediment to the coastal ocean. J. Geol. 115,1–19.
Syvitski, J.P., Morehead, M.D., 1999. Estimating river-sediment discharge to the ocean:application to the Eel margin, northern California. Mar. Geol. 154, 13–28.
Syvitski, J.P.M., Peckham, S.D., Hilberman, R., Mulder, T., 2003. Predicting the terrestrialflux of sediment to the global ocean: a planetary perspective. Sed. Geol. 162, 5–24.
Toucanne, S., 2008. Reconstruction des transferts sédimentaires en provenance dusystème glaciaire de Mer d'Irlande et du paléofleuve Manche au cours des dernierscycles climatiques. Unpublished PhD thesis, University Bordeaux 1, n°3699,pp. 340. http://www.ifremer.fr/docelec/doc/2008/these-6328.pdf.
Toucanne, S., Zaragosi, S., Bourillet, J.F., Naughton, F., Cremer, M., Eynaud, F., Dennielou,B., 2008. Activity of the turbidite levees of the Celtic-armorican margin (Bay ofBiscay) during the last 30,000 years: imprints of the last European deglaciation andHeinrich events. Mar. Geol. 247, 84–103.
Toucanne, S., Zaragosi, S., Bourillet, J.F., Cremer, M., Eynaud, F., Turon, J.L., Fontanier, C.,VanVliet Lanoë, B., Gibbard, P., 2009a. Timing ofmassive ‘FleuveManche’ dischargesover the last 350 kyr: insights into the European Ice Sheet oscillations and theEuropean drainage network from MIS 10 to 2. Quatern. Sci. Rev. 28, 1238–1256.
Toucanne, S., Zaragosi, S., Bourillet, J.F., Gibbard, P.L., Eynaud, F., Giraudeau, J., Turon, J.L.,Cremer, M., Cortijo, E., Martinez, P., Rossignol, L., 2009b. A 1.2 My record ofglaciation and fluvial discharges from theWest European Atlantic margin. Quatern.Sci. Rev. 28, 2974–2981.

473S. Toucanne et al. / Earth and Planetary Science Letters 290 (2010) 459–473
Van Vliet Lanoë, B., 1989. Dynamics and extent of the Weichselian Permafrost inWestern Europe (Stages 5e to 1). Quatern. Int. 3–4, 109–114.
Van Vliet Lanoë, B., Mansy, J.L., Margerel, J.P., Vidier, J.P., Lamarche, J., Everaerts, M.,1998. Le Pas de Calais, un détroit cénozoïque à ouvertures multiples — the DoverStrait, a discretely open Cenozoic strait. C. R. Acad. Sci.— Ser. IIA— Earth Planet. Sci.326, 729–736.
Vidal, L., Labeyrie, L., Cortijo, E., Arnold, M., Duplessy, J.C., Michel, E., Becque, S., VanWeering, T.C.E., 1997. Evidence for changes in the North Atlantic DeepWater linkedto meltwater surges during the Heinrich events. Earth Planet. Sci. Lett. 146, 13–27.
Vink, A., Steffen, H., Reinhardt, L., Kaufmann, G., 2007. Holocene relative sea-levelchange, isostatic subsidence and the radial viscosity structure of the mantle ofnorthwest Europe (Belgium, the Netherlands, Germany, southern North Sea).Quatern. Sci. Rev. 26, 3249–3275.
Vorren, T., Plassen, L., 2002. Deglaciation and palaeoclimate of the Andfjord-Vågsfjordarea, North Norway. Boreas 31, 97–125.
Wetzel, A., 1993. The transfer of river load to deep-sea fans: a quantitative approach.Bull. Am. Assoc. Petrol. Geol. 77, 1679–1692.
Zaragosi, S., Eynaud, F., Pujol, C., Auffret, G.A., Turon, J.L., Garlan, T., 2001. Initiation ofthe European deglaciation as recorded in the northwestern Bay of Biscay slopeenvironments (Meriadzek Terrace and Trevelyan Escarpment): a multi-proxyapproach. Earth Planet. Sci. Lett. 188, 493–507.
Zaragosi, S., Bourillet, J.F., Eynaud, F., Toucanne, S., Denhard, B., Van Toer, A., Lanfumey, V.,2006. The impact of the last European deglaciation on the deep-sea turbidite systemsof the Celtic–Armorican margin (Bay of Biscay). Geo-Mar. Lett. V26, 317–329.