earth, life & social sciences - unece homepage of the district court in the hague and with the...
TRANSCRIPT
Earth, Life & Social Sciences
Van Mourik Broekmanweg 6
2628 XE Delft
P.O. Box 49
2600 AA Delft
The Netherlands
www.tno.nl
T +31 88 866 30 00
Date
2 June 2015
Our reference
2015-TL-LTR-0100286069
Direct dialling
+31 88 866 27 05
Project number
060.08196
The General Terms and Conditions for
commissions to TNO, as filed with the
Registry of the District Court in the Hague
and with the Chamber of Commerce and
Industry in The Hague, shall apply to all
commissions to TNO.
Our General Terms and Conditions are also
available on our website www.tno.nl.
A copy will be sent upon request.
Trade register number 27376655.
Return address: P.O. Box 49, 2600 AA Delft, The Netherlands
Subject
Potential benefits of energy-efficient tyres and correct tyre pressure maintenance
for the vehicle fleet of the Dutch National Road Authority (RWS), the municipal
fleet of Amsterdam and the municipal fleet of Rotterdam
Dear Mr Sliggers,
This document is a collection of three studies performed by order of the Dutch
Ministry of Infrastructure and Environment on the potential benefits of energy-
efficient tyres and correct tyre pressure maintenance for the vehicle fleet of the
Dutch National Road Authority (RWS), the municipal fleet of Amsterdam and the
municipal fleet of Rotterdam.
Though each study was conducted and is published apart, the same methodology
was used for all fleets with fleet-specific information on the annual mileage, fuel
consumption number of vehicles. This document provides an overview of the
results of all three studies in one.
Yours faithfully,
Stephan van Zyl
Ministry of Infrastructure and Environment
Attn. Johan Sliggers
Plesmanweg 1-6
2597 JG THE HAGUE

Memorandum
Earth, Life & Social Sciences
Van Mourik Broekmanweg 6
2628 XE Delft
P.O. Box 49
2600 AA Delft
The Netherlands
www.tno.nl
T +31 88 866 30 00
F +31 88 866 30 10
Date
2 June 2015
Our reference
2015-TL-NOT-0100285848
Direct dialling
+31 88 866 27 05
Project number
060.08196
To
Ministry of Infrastructure and Environment, the Netherlands
Attn. Johan Sliggers
From
Ryan Geerdink (TNO)
Stephan van Zyl (TNO)
Subject
Potential benefits of energy-efficient tyres and correct tyre pressure maintenance
for the vehicle fleet of the Dutch National Road Authority (RWS)
Summary
In two previous studies performed by TNO and M+P, it has been shown that
energy-efficient tyres can have a large effect on the fuel consumption of Dutch and
EU road transport. In this study, the specific fuel savings potential is calculated for
the vehicle fleet of the Dutch National Road Authority (RWS). Apart from energy-
efficient tyres (as indicated by the tyre label), the impact of correct tyre pressure
maintenance on the RWS fleet are studied. This memo documents the order-of-
magnitude fuel savings potential of both measures.
The RWS fleet consists of 1634 vehicles of which 1575 have been included in the
calculations of this study. In total, these 1575 vehicles drive a cumulative annual
mileage of 41 million kilometres which corresponds to an average mileage of
26000 kilometres per year per vehicle.
The results show that energy-efficient tyres and tyre pressure have a large impact
on fuel consumption. The use of energy-efficient tyres in the RWS fleet could
annually save up to 127 thousand litres of fuel and reduce CO2 emissions by
roughly 324 ton, an equivalent of about 5% of the annual CO2 emissions from the
vehicle fleet of RWS. Maintaining the required tyre pressure for vehicles in the
RWS fleet could annually save up to 26 thousand litres of fuel and reduce CO2
emissions by roughly 67 ton, an equivalent of roughly 1%. When combined the
measures could annually save up to 152 thousand litres of fuel and reduce
CO2 emissions by roughly 388 ton, an equivalent of roughly 6% of the annual
CO2 emissions of the RWS fleet. The annual fuel cost savings from switching to
energy-efficient A-label tyres would be in the order of 197 thousand Euros and
approximately 42 thousand Euros for the maintenance of the required tyre
pressure. Combining the two measures results in annual fuel costs savings of
roughly 237 thousand Euros.
Given the large potential benefits of energy-efficient tyres, an accelerated market
uptake could help in making road transport more environmentally friendly, safer
and quieter. Whether the full potential can be realized in practice largely depends
on the vehicle’s driving behaviour and the degree to which advertised tyre label

Date
2 June 2015
Our reference
2015-TL-NOT-0100285848
Page
2/16
values comply with EU-mandated values. The calculated savings potential of
energy-efficient tyres is in the same order-of-magnitude of on-road measurements
performed by TNO for light-duty and heavy-duty vehicles.
1. Introduction
In two previous studies performed by TNO and M+P it was determined that large
cost savings and CO2 reductions can be achieved in the Netherlands and in the
EU by switching to energy-efficient tyres [TNOa, 2014][TNOb, 2014]. Apart from
the choice of the tyre, correct tyre pressure maintenance plays a significant role
for optimized fuel consumption. The Dutch government has a clear vision for
sustainable transport in 2020 and 2030 [BSV, 2015]. Energy-efficient tyres as well
as correct tyre pressure maintenance can contribute to this vision and are
considered low hanging fruit with little extra costs and large impact. Based on
these insights, a number of governmental and municipal fleet owners have shown
interest in the implementation of tyre-related measures.
Aim and scope
This report is part of a study where the potential benefits of energy-efficient tyres
and correct tyre pressure maintenance are quantified for three specific vehicle
fleets:
the vehicle fleet of the Dutch National Road Authority (RWS);
the municipal fleet of Amsterdam;
the municipal fleet of Rotterdam.
This memorandum solely reports the potential benefit for the fleet of RWS. The potential benefit of the two municipalities (Amsterdam and Rotterdam) are documented and published separately. Benefits are calculated for the following measures:
Switching from average (D-label) tyres to energy-efficient A-label tyres;
Correct tyre pressure maintenance.
Benefits are expressed in terms of fuel savings: reduced fuel consumption (in
litres), fuel cost savings for the end-user (in Euros) and CO2 reduction (in tons).
Approach
The savings potential of energy-efficient A-labelled tyres is determined based on
the average distribution of tyre labels in the Netherlands as determined in the
previous Triple-A studies. Statistical adjustments are made where information on
the actual tyre use is available. The savings potential of correct tyre pressure
maintenance is determined based on the average tyre pressure distribution of
vehicles on Dutch and European roads.
Structure
This report is structured in the following way: In chapter 2, an overview is given of
the methodology and assumptions that are used in order to determine the savings
potential. Results are displayed and discussed in chapter 3. Items for conclusion,

Date
2 June 2015
Our reference
2015-TL-NOT-0100285848
Page
3/16
discussion and recommendations are documented in the final chapter 4. A short
note of acknowledgements is added in chapter 5.
2. Methodology and assumptions
This chapter describes the methodology and assumptions used for the calculation
of the savings potential of energy-efficient A-label tyres and correct tyre pressure
maintenance.
The fuel savings of energy-efficient tyres and correct tyre pressure maintenance
are calculated separately and in combination. Apart from the knowledge of the
impact of tyre choice and tyre pressure (as determined in the previous chapter),
the following knowledge is required:
fleet composition (annual mileage, average fuel consumption)
distribution of tyre labels across the fleet;
distribution of tyre pressure across the fleet;
savings potential of energy-efficient A-label tyres;
savings potential of correct tyre pressure maintenance;
combined savings potential of energy-efficient A-label tyres and correct tyre
pressure maintenance;
fuel costs.
Below, the available information on the RWS fleet is discussed. Where specific
data is not available, explicit assumptions are made based on national default
values.
2.1. Fleet composition Information on the RWS fleet composition was gained directly from RWS. The
database contains the following entries for each vehicle:
vehicle brand and model;
real world fuel consumption;
expected and actual yearly mileage;
start and end date of leasing.
An overview of the RWS vehicle fleet is provided in Table 1.

Date
2 June 2015
Our reference
2015-TL-NOT-0100285848
Page
4/16
Table 1: RWS vehicle fleet (status March 2015) aggregated per general vehicle category:
Number of vehicles, (summed) annual mileage, average fuel consumption
Tyre
class
Vehicle
Category
Number of
vehicles
Annual
mileage
Average fuel
consumption
[#] [kms] [l/100 km]
C1
Passenger cars (electric) 38 170,400 0
Passenger cars (petrol) 401 9,013,400 6.7
Passenger cars (diesel) 768 20,191,000 5.6
Service delivery (diesel) 368 11,424,000 8.3
SUBTOTAL 1575 40,998,800
EXCLUDED 59 1,697,600
TOTAL 1634 42,696,400
In total, the RWS fleet consists of 1634 vehicles, of which roughly two thirds are
passenger cars and one third are service delivery vans and small pickup trucks.
406 vehicles, nearly a 25% of the fleet, are younger than one year. This is due to a
recent renewal of old vehicles starting from June 2014. A large share of these new
vehicles are Renault Mégane Estates (114), Renault Clio Estates (106) and Isuzu
D-MAX pickup vans (121). A small share of the vehicle fleet consists of electric
“zero-emission” vehicles (38). 59 vehicles are excluded from further calculations
because data was either not available or not applicable. This was the case for 22
lease contracts, 30 motorcycles (no tyre label required) and 7 vehicles of which
the fuel consumption could not be determined. Since the fleet does not include
any heavy-duty vehicles, only C1 tyres are considered in the further calculations.
In a few cases, the available data on fuel consumption was conditioned to correct
for faulty or lacking entries. Fuel consumption entries in the database were
considered faulty when either the fuel consumption was negative or above 40
l/100km. In some cases values of more than a 100l/100km were recorded for
passenger cars, which indicate a fault. In cases where the fuel consumption was
not available for a specific vehicle or license plate the average fuel consumption of
the same vehicle category or of the same vehicle type was used.
The reduction potential of energy efficient tyres and correct tyre pressure
maintenance also depend on the driving behaviour. This is expressed in terms of
the share of kilometres driven on urban and highway roads. For the vehicle fleet of
RWS no specific data was available on the actual shares per road type. Since the
vehicles are used country-wide with no large differentiation to average vehicles,
national default values were used.
2.2. Distribution of tyre labels across the fleet The distribution of tyre labels in the RWS fleet was assumed to be the same as for
the Dutch fleet, unless specific knowledge was available on the originally equipped

Date
2 June 2015
Our reference
2015-TL-NOT-0100285848
Page
5/16
tyre-label. The Dutch tyre label distribution was taken from [TNOa, 2014]. Specific
knowledge for the vehicle models Renault Clio and Renault Mégane was used to
calculate a more representative tyre label distribution for the RWS vehicle fleet.
Vehicle models can be equipped with a large range of different tyres. This
depends largely on the specification of the tyre, the vehicle type (sport vs. eco),
but also the demand of the customer. As a result, the tyre label for energy-
efficiency can vary between A to G. Based on information from Renault, vehicle
models Clio and Mégane offer a choice of labels between B to F1. On demand of
RWS, these vehicles are equipped with the following labels (see Table 2). It can
be seen that both B-labels and C-labels are offered for Clios. According to RWS,
in practise B-labels are installed.
Table 2: Tyre labels offered by Renault on demand of RWS, the label (X-X-00) combines the
values for fuel consumption, wet grip and noise
Vehicle
brand
Tyre
specs
Vehicle
Model
OE
brand
Tyre
label
Renault 185/65
R15 88T Clio dci Expression
Bridgestone
Ecopia B-C-69
Renault 185/65
R15 88T Clio dci Expression
Michelin
ENERGYSAVER+ C-A-68
Renault 185/60
R15 88T Mégane dci expression
Michelin
ENERGYSAVER+ B-A-70
Replacing the Dutch tyre label distribution with the specific tyre labels for Clio and
Mégane yields a RWS specific distribution for passenger cars, as shown in Figure
1 and Figure 2. Figure 1 presents the distribution of C1 tyres within petrol
passenger cars. Figure 2 shows the distribution of C1 tyres within diesel
passenger cars. The distribution was determined by replacing 100 petrol cars (of
the 399 in total) and 530 diesel cars (of the 763 in total) to be equipped with B
label tyres. The tyre label distribution of other vehicle categories remain the same
as for the Dutch average.
1 As of November 2014, G-labels for energy-efficiency are no longer available.

Date
2 June 2015
Our reference
2015-TL-NOT-0100285848
Page
6/16
Figure 1: C1 tyre label distribution of summer tyres shown for petrol passenger cars in the
RWS vehicle fleet in comparison to the Dutch average
Figure 2: C1 tyre label distribution of summer tyres shown for diesel passenger cars in the
RWS vehicle fleet in comparison to the Dutch average

Date
2 June 2015
Our reference
2015-TL-NOT-0100285848
Page
7/16
2.3. Distribution of tyre pressure across the fleet The distribution of tyre pressure in the RWS fleet was assumed to be the same as
for the Dutch fleet, unless more specific knowledge was available. The tyre
pressure distribution for Dutch passenger cars is reported in [GRRF, 2008] and
shown in Figure 3 as a function of the difference between recorded pressure and
recommended pressure. Based on this data, approximately 30% of the cars on the
road drive with an under inflation of up to 10%.
For the calculation of the tyre pressure, the distribution in the RWS fleet is
assumed to be the same as the Dutch fleet for passenger cars (Figure 3). The
following points have to be noted however for passenger cars and service delivery
vans / small pickup trucks:
Summer- and winter-tyres are changed twice a year. At this point, the tyre
pressure is set to the recommended tyre pressure.
50% of all cars within the RWS fleet are person-bound, another 50% are
pooling cars. It can be assumed that tyres on person-bound cars are
pressurized more often than pooling cars, since pooling cars do not have an
official owner who could feel responsible for the maintenance. If this is the
case, the tyre distribution in the RWS fleet would be less under-inflated that on
average in the Netherlands. Since no information is available on the amount of
times that person-bound tyres are pressurized, this effect is not included in the
calculation. It is noted though, that the savings potential is an upper-bound.
The tyre pressure of service delivery vans and pick-up trucks in the RWS fleet
are bi-weekly checked and intentionally over-pressured. It was therefore
assumed that no under-inflation occurs in the RWS fleet for this vehicle
category.
The adjusted distribution of the tyre pressure is shown below in Figure 3.

Date
2 June 2015
Our reference
2015-TL-NOT-0100285848
Page
8/16
Figure 3: Distribution of tyre pressure in NL (C1 tyres only) [GRRF, 2008]
2.4. Saving potentials of energy efficient A-label tyres The fuel savings potential of energy-efficient A-label tyres is determined by using
the same methodology as in [TNOa, 2014]. The basis of all calculations is the
coefficient of rolling resistance (RRC) as documented in regulation EC 1222
[EC1222, 2009] and UNECE R117. The table below documents the range of
rolling resistances of each tyre class and different vehicle categories.
Table 3: Coefficient of rolling resistance (RRC) in kilograms per ton in % [EC1222, 2009]
Tyre label Coefficient of rolling resistance (RRC)
[in kilograms per ton in %]
C1 (Passenger car)
C2 (Light Truck)
C3 (Heavy truck &
bus)
A RRC ≤ 6.5 RRC ≤ 5.5 RRC ≤ 4.0
B 6.6 ≤ RRC ≤ 7.7 5.6 ≤ RRC ≤ 6.7 4.1 ≤ RRC ≤ 5.0
C 7.8 ≤ RRC ≤ 9.0 6.8 ≤ RRC ≤ 8.0 5.1 ≤ RRC ≤ 6.0
D None None 6.1 ≤ RRC ≤ 7.0
E 9.1 ≤ RRC ≤ 10.5 8.1 ≤ RRC ≤ 9.2 7.1 ≤ RRC ≤ 8.0
F 10.6 ≤ RRC ≤ 12.0 9.3 ≤ RRC ≤ 10.5 RRC ≥ 8.1
G None None None
The fuel savings potential is calculated by multiplication of the difference in RRC
(due to a switch from tyre label B, C D, E or F to tyre label A) with the share of
rolling resistance in the overall driving resistances (as a function of the driving
behaviour). Based on fleet-specific shares of the driving pattern (equal to Dutch

Date
2 June 2015
Our reference
2015-TL-NOT-0100285848
Page
9/16
average), the savings potential of switching to energy-efficient A-label tyres is
recalculated for summer tyres and presented in Table 4. In analogy to [TNOa,
2014], it is assumed that summer and winter tyres are replaced by energy-efficient
A-label tyres and that the tyres are changed twice a year, from winter to summer
and back. It is assumed that tyres are replaced at the end of their lifetime and at
the moment of new vehicle purchase. The presented savings potential is therefore
not instantly achieved for the entire fleet.
Table 4: Fuel savings potential of energy-efficient A-label tyres in the RWS fleet
Tyre
class
Vehicle
category
Driving
Pattern
Fuel
savings
potential
(summer)
Fuel
savings
potential
(winter)
Fuel
savings
potential
(average)
[%] urban /
[%] highway [%] [%] [%]
C1
Passenger cars (petrol) 42 / 58 3.9% 5.7% 4.8%
Passenger cars (diesel) 33 / 67 2.6% 5.8% 4.2%
Service delivery (diesel) 34 / 66 4.9% 5.8% 5.3%
Since the RWS fleet already has a large share of B-label summer tyres, the
savings potential is lower than on average in the Netherlands. In comparison to
the Dutch fleet, petrol cars in the RWS fleet save 0.4% less fuel, diesel cars save
1.2% less. Service delivery vans are not affected since the same tyre label
distribution is assumed as in the Dutch average.
2.5. Savings potential of correct tyre pressure maintenance For the calculation of the impact of correct tyre pressure maintenance, the relation
between tyre pressure and rolling resistance is required. This relation has been
extensively studied by several tyre manufacturers and is described by [Exxon,
2008]:
RR ~ (preference/ptest)0.5-0.7
The effect of tyre pressure on RRC is thus equal for all vehicles for the same
relative difference from the recommended tyre pressure.
The savings potential of correct tyre pressure maintenance is determined by
reducing all under-inflation to zero. It is assumed that over-inflation remains
unchanged with correct tyre pressure maintenance. The resulting savings potential
is shown in Table 5.

Date
2 June 2015
Our reference
2015-TL-NOT-0100285848
Page
10/16
Table 5: Fuel savings potential of correct tyre pressure maintenance in the RWS fleet
Tyre
class
Vehicle
category
Driving
Behaviour
Fuel
savings
potential
(summer)
Fuel
savings
potential
(winter)
Fuel
savings
potential
(average)
[%] urban /
[%] highway [%] [%] [%]
C1
Passenger cars (petrol) 42 / 58 1.5% 1.5% 1.5%
Passenger cars (diesel) 33 / 67 1.5% 1.5% 1.5%
Service/delivery (diesel) 34 / 66 0% 0% 0%
Since it is assumed that under-inflation does not occur for service delivery vans
and pickups, the savings potential is 0%. In the RWS vehicle fleet, about 50% of
the passenger cars are person-bound, i.e. registered on and used by only one
specific person. The other 50% are pooling cars which means that they can be
used by anyone in the organization. It is conceivable that the tyre pressure of
pooling cars are less frequently maintained than person-bound cars, since the
responsibility of tyre pressure maintenance for pooling cars is not clear. In the
following calculations, this aspect is not taken into account.
2.6. Combined savings potential of energy-efficient A-label tyres and correct tyre pressure maintenance
The combined savings potential of energy-efficient A-label tyres and correct tyre
pressure maintenance is shown in Table 6. It is determined through multiplication
of the savings potentials in the following way: %c = 1 – (1-%a)*(1-%b), where %a,
%b and %c represent the savings potentials of measures A and B and the
combined savings potential of measure C.
Table 6: Fuel savings potential of energy-efficient A-label tyres and correct tyre pressure
maintenance in the RWS fleet
Tyre
class
Vehicle
category
Driving
Behaviour
Fuel
savings
potential
(summer)
Fuel
savings
potential
(winter)
Fuel
savings
potential
(average)
[%] urban /
[%] highway [%] [%] [%]
C1
Passenger cars (petrol) 42 / 58 5.4% 7.1% 6.3%
Passenger cars (diesel) 33 / 67 4.1% 7.2% 5.7%
Service/delivery (diesel) 34 / 66 4.9% 5.8% 5.3%
2.7. Fuel costs Fuel cost savings are calculated from an end-user perspective. For reasons of
consistency, the same fuel costs are used as in the Triple-A tyre study for the
Netherlands (see Table 7). It is acknowledged however, that fuel costs vary over
time and are currently lower than one year ago.

Date
2 June 2015
Our reference
2015-TL-NOT-0100285848
Page
11/16
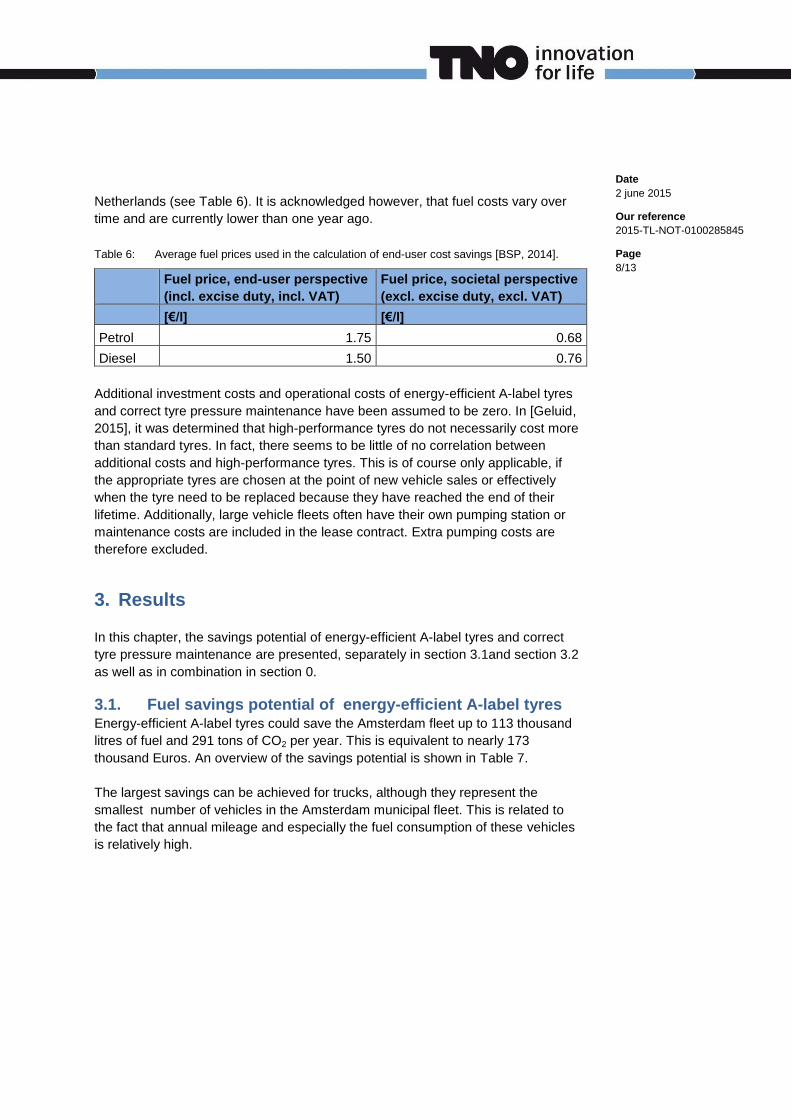
Table 7: Average fuel prices used in the calculation of end-user cost savings [BSP, 2014].
Fuel price, end-user perspective
(incl. excise duty, incl. VAT)
Fuel price, societal perspective
(excl. excise duty, excl. VAT)
[€/l] [€/l]
Petrol 1.75 0.68
Diesel 1.50 0.76
Additional investment costs and operational costs of energy-efficient A-label tyres
and correct tyre pressure maintenance have been assumed to be zero. In [Geluid,
2015], it was determined that high-performance tyres do not necessarily cost more
than standard tyres. In fact, there seems to be little of no correlation between
additional costs and high-performance tyres. This is of course only applicable, if
the appropriate tyres are chosen at the point of new vehicle sales or effectively
when the tyre need to be replaced because they have reached the end of their
lifetime. Additionally, large vehicle fleets often have their own pumping station or
maintenance costs are included in the lease contract. Extra pumping costs are
therefore excluded.
3. Results
In this chapter, the savings potential of energy-efficient A-label tyres and correct
tyre pressure maintenance are presented, separately in section 3.1and section 3.2
as well as in combination in section 3.3.
3.1. Fuel savings potential of energy-efficient A-label tyres Energy-efficient A-label tyres could save the RWS fleet up to 127 thousand litres
of fuel and 324 tons of CO2. This is equivalent to nearly 200 thousand Euros. An
overview of the savings potential is shown in Table 8. This culminates to 85 litres
per vehicle.
Table 8: Fuel savings potential, annual fuel savings, cost savings and CO2 reduction of
energy-efficient A-label
Tyre
class Vehicle category
Fuel
savings
potential
(average)
Annual
fuel
savings
Annual
cost
savings
Annual
CO2
reduction
[] [%] [l] [€] [tCO2]
C1
Passenger cars (petrol) 4.8% 28,900 50,600 68
Passenger cars (diesel) 4.2% 47,300 70,900 123
Service delivery (diesel) 5.3% 50,600 75,900 132
TOTAL 126,800 197,400 324
The largest savings can be achieved within the service delivery vans, although
they represent the smallest number of vehicles in the RWS fleet. This is related to

Date
2 June 2015
Our reference
2015-TL-NOT-0100285848
Page
12/16
the fact that passenger cars have better tyre labels than service delivery vans.
Service delivery vans and pick-ups also have a higher fuel consumption.
3.2. Fuel savings potential of correct tyre pressure maintenance
Correct tyre pressure maintenance could save the RWS fleet nearly 27 thousand
litres of fuel and 67 tons of CO2. This is equivalent to more than 41 thousand
Euros. An overview of the savings potential is shown in Table 9. This corresponds
to 18 litre of fuel per vehicle.
Table 9: Fuel savings potential, annual fuel savings, cost savings and CO2 reduction of
correct tyre pressure maintenance
Tyre
class Vehicle category
Fuel
savings
potential
(average)
Annual
fuel
savings
Annual
cost
savings
Annual
CO2
reduction
[] [%] [l] [€] [tCO2]
C1
Passenger cars (petrol) 1.5% 9,000 15,900 21
Passenger cars (diesel) 1.5% 17,400 26,000 45
Service delivery (diesel) 0% 0 0 0
TOTAL 26,400 41,900 66
The largest savings can be achieved for diesel cars. Service delivery vans have
no savings potential, since tyre pressures are already maintained at set pressure.
3.3. Combined fuel savings potential of energy-efficient A-label tyres and correct tyre pressure maintenance
In combination, energy-efficient A-label tyres and correct tyre pressure
maintenance could save the RWS fleet about 150 thousand litres of fuel and 380
tons of CO2. This is equivalent to about 240 thousand Euros. An overview of the
savings potential is shown in Table 10.

Date
2 June 2015
Our reference
2015-TL-NOT-0100285848
Page
13/16
Table 10: Fuel savings potential, annual fuel savings, cost savings and CO2 reduction of
energy-efficient A-label tyres and correct tyre pressure maintenance
Tyre
class Vehicle category
Fuel
savings
potential
(average)
Annual
fuel
savings
Annual
cost
savings
Annual
CO2
reduction
[] [%] [l] [€] [tCO2]
C1
Passenger cars (petrol) 6.3% 37,500 65,700 89
Passenger cars (diesel) 5.7% 64,000 95,900 167
Service delivery (diesel) 5.3% 50,600 75,900 132
TOTAL 152,100 237,500 388
4. Discussion and Recommendation
In above chapters the fuel savings potential of energy-efficient tyres and correct
tyre pressure maintenance are quantified and discussed for the vehicle fleet of
RWS. It is concluded that both measures have a large potential and come at little
or no costs. It is therefore advisable to apply both measures, for as far as this is
practical.
Below several notes are made on the accuracy and specific boundary conditions
of the above calculation. Furthermore, recommendations for improvement are
made.
Tested tyre label values and real-world performance
Tyre label values for fuel-efficiency refer to a specific rolling resistance value that
has been measured using the harmonized testing method UNECE R117.02,
referring to ISO standard 28580. The measured value is corrected according to
the alignment procedure as described by EU regulation 1235/2001, amending EU
Regulation 1222/2009 [ETRMA, 2012].
It is acknowledged that several sources indicate an incoherence between the
labelled performance and the measured performance of tyres ([IN2, 2013][ADAC,
2015]). In both [IN2, 2013] and [ADAC, 2015] on average a clear correlation is
observed between rolling resistance (RRC) and the tyre label, however the
variance of the measured rolling resistance is large within one label. As a result,
there is overlap between RRC and label values. In [ADAC, 2015], B label tyres
perform best on average, A label tyres have not been tested. Except for two
outliers in the measurement (Pirelli Cinturato P1 Verde and Nokian Line), a
downward trend is observed towards reduced RRC with improved tyre label. From
the test specifications defined in [ADAC, 2015], it remains unclear what the
reasons are for this deviation. Fuel consumption is measured at a constant speed
of 100 km/h over a distance of 2 km and measurements are repeated at least

Date
2 June 2015
Our reference
2015-TL-NOT-0100285848
Page
14/16
three times. At this test condition, the external influences of wind and other must
not be neglected.
Generally, stakeholders have questioned the accuracy of the tyre RRC test. Tyre
manufacturers have shown that the R117 test is reproducible and repeatable
across the different laboratories with an accuracy which is much higher than the
width of a tyre label class as described in Table 3. The relevance of the test for on-
road performances of tyres is as yet an open question. The test is performed on a
smooth steel drum (unlike the noise test) at a fixed velocity, and tyre
manufacturers suggest that the additional rolling resistance due to the radius of
the drum is about 10%-20% which should be comparable to a 10%-20% increase
from the road surface texture. This would make the R117 absolute value relevant
for on-road performances. Aspects at turning, toe-in and road undulation are not
covered by this tests. Alternative test procedures may produce a large variation in
test results, which may however, lie outside the control of the tyre manufacturer.
The test procedure R117 is designed to provide a standard value, which may have
is drawbacks but is the best available, comparable and relevant number at
present.
TNO tests of low-rolling resistance tyres have shown on light-duty as well as
heavy-duty vehicles that fuel savings in the order of 3 to 4 % can be achieved
[TvdT, 2013][WLTP, 2014]. Such evaluation requires large monitoring programs.
On road testing is affected by many external circumstances for which must be
corrected, and the tests must be performed with exact identical vehicle state, to
exclude unwanted variations. Two aspects in particular are important. First, the
warm tyre pressure is the result of the conditioning due to driving, this varies
greatly from tests to test, by up to 12% variation in warm tyre pressure. Secondly,
wind will affect the results, and is almost impossible to correct for as wind
gustiness may vary from location to location, and time to time.
Availability of energy-efficient A-label winter tyres
While there is a large abundance of energy-efficient A-label summer tyres, the
choice for winter tyres is limited. In practise, this could result in a lower savings
potential for winter tyres simply because the end-user cannot buy the tyre of
choice. Tyre conditioning
It is known that the rolling resistance of a tyre depends on its stiffness. Since the
stiffness of rubber is to a large degree dependent on the tyre temperature, the
rolling resistance changes over the drive time and generally leads to a lower
rolling resistance after a few minutes of driving. Once the tyre is conditioned, the
rolling resistance does not decrease any further. In this study, the hysteresis of
tyre stiffness is not taken into account, thus calculations are based on a warm
conditioned tyre. The different hysteresis of tyres and tyre labels can be relevant if
an existential share of the fleet only travel very short distances.

Date
2 June 2015
Our reference
2015-TL-NOT-0100285848
Page
15/16
Emissions of particulate matter (PM)
Several sources are of influence to emissions of particulate matter (PM): the
engine, after-treatment technologies, abrasive wear of brakes and abrasive wear
of tyres. Tyre wear is not part of the tyre label and yet little research has been
done to document the difference in PM emissions between tyre labels. In [ADAC,
2015], tyre wear has been quantified with a grade however no numbers of
particulate numbers, nor amount of grams, have been published. In order to
compare the different performance of tyres on particulate matter emissions, it is
recommended to perform further research.
Distribution of tyre labels across the RWS fleet The tyre label distribution across the RWS fleet was assumed to be the same as in
the Netherlands. For summer tyres, the distribution was adjusted according to
specific input from RWS. The calculation of the savings potential could be further
improved if more information is available on winter tyre labels.
Distribution of tyre pressure across the RWS fleet The distribution of tyre pressures across the RWS fleet is to a large extend
unknown. Therefore, the Dutch average tyre pressure distribution has been
assumed based on information from [GRRF, 2008]. According to
www.bandopspanning.nl, more specific data on the RWS fleet has been gathered
in the past and could be used for more accuracy.
5. Acknowledgement
TNO thanks André de Boer (RWS) for the delivery of RWS-specific data on the
vehicle fleet composition, fuel consumption and average vehicle mileage.
6. References
[ADAC, 2015] http://www.adac.de/_mmm/pdf/Sommerreifen%20185%
2060%20R14%20H_76738.pdf (01.03.2015)
[Exxon, 2008] Inflation pressure retention effects on tire rolling resistance and
vehicle fuel economy, Exxon Mobile Chemical, CA, 2008
[Band, 2015] www.bandopspanning.nl (01.05.2015).
[BSP, 2014] http://www.brandstofprijzen.info/ (15.01.2014)
[BSV, 2015] Een duurzame brandstofvisie met LEF, De belangrijke uitkomsten
uit het SER-visietraject naar een duurzame brandstoffenmix in
Nederland, SER, juni 2014
[EC1222, 2009] Regulation (EC) No. 1222/2009 of the European Parliament and
the council of 25 November 2009, On the labelling of tyres with

Date
2 June 2015
Our reference
2015-TL-NOT-0100285848
Page
16/16
respect to fuel efficiency and other essential parameters, Official Journal of the European Union, 2009
[ETRMA, 2012] EU tyre Labelling Regulation 1222/2009 – Industry Guideline on
tyre labelling to promote the use of fuel efficient and safe tyres
with low noise levels, version 4
[Geluid, 2015] Blad Geluid, no. 1, 2015, Geluidlabels voor de consument (3): Een
bandenlabel, Johan Sliggers, Erik de Graaff, Stephan van Zyl
[GRRF, 2008] GRRF TPMS Task Force Conclusions, Version 05, June 2008
[IN2, 2013] Kragh, J., Oddershede, J., e.a.: Nord-Tyre – Car labelling and
Nordic traffic noise, 15.-18. September 2013, Internoise, Innsbruck
[TNOa, 2014] TNO 2014 R10735, Potential benefits of Triple-A tyres in The
Netherlands, Zyl et al. 2014.
[TNOb, 2014] Zyl et al., Potential benefits of Triple-A tyres in the EU, 2014-TM-
NOT-0100105861, 2014.
[TvdT, 2013] Truck van de Toekomst – Brandstof- en CO2-besparing anno
2013, TNO, 2013
[TPMS, 2013] Study on Tyre Pressure Monitoring Systems (TPMS) as a means
to reduce Light-Commercial and Heavy-Duty Vehicles fuel
consumption and CO2-emissions, van Zyl et al., 2013
[WLTP, 2014] The Effect on Road Load due to Variations in Valid Coast Down
Tests for Passenger Cars, P. van Mensch*, N.E. Ligterink, and
R.F.A. Cuelenaere, TAP 2014, Graz
Memorandum
Earth, Life & Social Sciences
Van Mourik Broekmanweg 6
2628 XE Delft
P.O. Box 49
2600 AA Delft
The Netherlands
www.tno.nl
T +31 88 866 30 00
F +31 88 866 30 10
Date
2 june 2015
Our reference
2015-TL-NOT-0100285845
Direct dialling
+31 88 866 27 05
Project number
060.08196
To
Ministry of Infrastructure and Environment, the Netherlands
Attn. Johan Sliggers
From
Maarten Verbeek (TNO)
Stephan van Zyl (TNO)
Subject
Potential benefits of energy-efficient tyres and correct tyre pressure maintenance
for the municipal fleet of Amsterdam
Summary
In two previous studies performed by TNO and M+P, it has been shown that
energy-efficient tyres can have a large effect on the fuel consumption of Dutch
and EU road transport. In this study, the specific fuel savings potential is
calculated for the municipal fleet of Amsterdam. Apart from energy-efficient tyres
(as indicated by the tyre label), the impact of correct tyre pressure maintenance on
the municipal fleet of Amsterdam are studied. This memo documents the order-of-
magnitude fuel savings potential of both measures.
The municipal fleet of Amsterdam consists of 908 vehicles of which 781 have
been included in the calculations of this study. In total, these 781 vehicles drive a
cumulative annual mileage of 13 million kilometres which corresponds to an
average mileage of 17200 kilometres per year per vehicle.
The results show that energy-efficient tyres and tyre pressure have a large impact
on fuel consumption. The use of energy-efficient tyres in the municipal fleet of
Amsterdam could annually save up to 113 thousand litres of fuel and reduce
CO2 emissions by roughly 291 ton, an equivalent of about 4% of the annual CO2
emissions from the municipal fleet of Amsterdam. Maintaining the required tyre
pressure for vehicles in the Amsterdam fleet could annually save up to 33
thousand litres of fuel and reduce CO2 emissions by roughly 86 ton, an
equivalent of about 1%. When combined the measures could annually save up to
147 thousand litres of fuel and reduce CO2 emissions by roughly 379 ton, an
equivalent of roughly 5% of the annual CO2 emissions of the municipal fleet of
Amsterdam. The annual fuel cost savings from switching to energy-efficient A-
label tyres would be in the order of 173 thousand Euros and approximately 51
thousand Euros for the maintenance of the required tyre pressure. Combining
the two measures results in annual fuel costs savings of roughly 224 thousand
Euros.
Given the large potential benefits of energy-efficient tyres, an accelerated market
uptake could help in making road transport more environmentally friendly, safer
and quieter. Whether the full potential can be realized in practice largely depends

Date
2 june 2015
Our reference
2015-TL-NOT-0100285845
Page
2/13
on the vehicle’s driving behaviour and the degree to which advertised tyre label
values comply with EU-mandated values. The calculated savings potential of
energy-efficient tyres is in the same order-of-magnitude of on-road measurements
performed by TNO for light-duty and heavy-duty vehicles.
1. Introduction
In two previous studies performed by TNO and M+P it was determined that large
cost savings and CO2 reductions can be achieved in the Netherlands and in the
EU by switching to energy-efficient tyres [TNOa, 2014][TNOb, 2014]. Apart from
the choice of the tyre, correct tyre pressure maintenance plays a significant role
for optimized fuel consumption. The Dutch government has a clear vision for
sustainable transport in 2020 and 2030 [BSV, 2015]. Energy-efficient tyres as well
as correct tyre pressure maintenance can contribute to this vision and are
considered low hanging fruit with little extra costs and large impact. Based on
these insights, a number of governmental and municipal fleet owners have shown
interest in the implementation of tyre-related measures.
Aim and scope
This report is part of a study where the potential benefits of energy-efficient tyres
and correct tyre pressure maintenance are quantified for three specific vehicle
fleets:
the vehicle fleet of the Dutch National Road Authority (RWS);
the municipal fleet of Amsterdam;
the municipal fleet of Rotterdam.
This memorandum solely reports the potential benefit for the municipal fleet of Amsterdam. The potential benefit of the municipality of Rotterdam and RWS are documented and published separately. Benefits are calculated for the following measures:
Switching from average (D-label) tyres to energy-efficient A-label tyres;
Correct tyre pressure maintenance.
Benefits are expressed in terms of fuel savings: reduced fuel consumption (in
litres), fuel cost savings for the end-user (in Euros) and CO2 reduction (in tons).
Approach
The savings potential of energy-efficient A-labelled tyres is determined based on
the average distribution of tyre labels in the Netherlands as determined in the
previous Triple-A studies. The savings potential of correct tyre pressure
maintenance is determined based on the average tyre pressure distribution of
vehicles on Dutch and European roads.
Structure
This report is structured in the following way: In chapter 2, an overview is given of
the methodology and assumptions that are used in order to determine the savings
potential. Results are displayed and discussed in chapter 3. Items for conclusion,

Date
2 june 2015
Our reference
2015-TL-NOT-0100285845
Page
3/13
discussion and recommendations are documented in the final chapter 4. A short
note of acknowledgements is added in chapter 5.
2. Methodology and assumptions
This chapter describes the methodology and assumptions used for the calculation
of the savings potential of energy-efficient A-label tyres and correct tyre pressure
maintenance.
The fuel savings of energy-efficient tyres and correct tyre pressure maintenance
are calculated separately and in combination. Apart from the knowledge of the
impact of tyre choice and tyre pressure (as determined in the previous chapter),
the following knowledge is required:
fleet composition (annual mileage, average fuel consumption)
distribution of tyre labels across the fleet;
distribution of tyre pressure across the fleet;
savings potential of energy-efficient A-label tyres;
savings potential of correct tyre pressure maintenance;
combined savings potential of energy-efficient A-label tyres and correct tyre
pressure maintenance;
fuel costs.
Below, the available information on the municipal fleet of Amsterdam is discussed.
Where specific data is not available, explicit assumptions are made based on
national default values.
2.1. Fleet composition Information on the Amsterdam municipal fleet composition was gained directly
from Amsterdam Municipality. The database contains the following entries:
vehicle brand and model;
real world fuel consumption;
expected and actual yearly mileage;
start and end date of leasing.
An overview of the Amsterdam vehicle fleet is provided in Table 1.

Date
2 june 2015
Our reference
2015-TL-NOT-0100285845
Page
4/13
Table 1: Amsterdam vehicle fleet (status March 2015) aggregated per general vehicle
category: Number of vehicles, (summed) annual mileage, average fuel consumption
Tyre
class
Vehicle
Category
Number of
vehicles
Annual
mileage
Average fuel
consumption
[#] [kms] [l/100 km]
C1
Passenger cars (petrol) 234 4,048,000 6.7
Passenger cars (diesel) 13 408,700 6.2
Service delivery (petrol) 24 297,400 11.1
Service delivery (diesel) 365 5,026,400 10.7
C3 Heavy-duty truck (diesel) 145 3,616,400 55.2
SUBTOTAL 781 13,396,900
EXCLUDED 127 n/a
TOTAL 908 13,396,900
In total, the municipal fleet of Amsterdam fleet consists of 908 vehicles. The
largest share of vehicles are cars and vans. A small share of the vehicle fleet
consists of heavy-duty trucks. 127 vehicles are excluded from further calculations
because data was either not available or not applicable. This was the case for 77
cleaning vehicles and 50 mopeds.
In a few cases, the available data on fuel consumption was conditioned to correct
for faulty or lacking entries. Fuel consumption entries in the database were
considered faulty if the fuel consumption was lower than the type approval value
or higher than one and a half times the type approval value plus a certain factor.
This factor was taken to be 2 l/100km for passenger cars and 1.5 l/100km for
service delivery vans. For trucks the faulty value was replaced by the value of a
similar vehicle which had a realistic real world fuel consumption.
The reduction potential of energy efficient tyres and correct tyre pressure
maintenance also depend on the driving behaviour. This is expressed in terms of
the share of kilometres driven on urban and highway roads. For the municipal fleet
of Amsterdam no specific data was available on the actual shares per road type.
However, since these vehicles are mainly used within the city, it is assumed for all
vehicle categories that 90% of the kilometres are driven in urban areas and 10%
on highways.
2.2. Distribution of tyre labels across the fleet The distribution of tyre labels was assumed to be the same as in [TNOa, 2014].
2.3. Distribution of tyre pressure across the fleet The distribution of tyre pressure in the Amsterdam fleet was assumed to be the
same as for the Dutch fleet (light duty) and EU fleet (heavy duty), unless more
specific knowledge was available. The tyre pressure distribution for Dutch
passenger cars is reported in [GRRF, 2008] and shown in Figure 1 as a function of
the difference between recorded pressure and recommended pressure. Based on

Date
2 june 2015
Our reference
2015-TL-NOT-0100285845
Page
5/13
this data, approximately 30% of the cars on the road drive with an under-inflation
of up to 10%. The tyre pressure distribution heavy duty trucks was assumed to be
the same as reported in [TPMS, 2013] and is also shown in Figure 1.
Figure 1: Distribution of tyre pressure in NL (C1 and C3 tyres) [GRRF, 2008][TPMS, 2013]
2.4. Saving potentials of energy efficient A-label tyres The fuel savings potential of energy-efficient A-label tyres is determined by using
the same methodology as in [TNOa, 2014]. The basis of all calculations is the
coefficient of rolling resistance (RRC) as documented in regulation EC 1222
[EC1222, 2009] and UNECE R117. The table below documents the range of
rolling resistances of each tyre class and different vehicle categories.
Table 2: Coefficient of rolling resistance (RRC) in kilograms per ton in % [EC1222, 2009]
Tyre label Coefficient of rolling resistance (RRC)
[in kilograms per ton in %]
C1 (Passenger car)
C2 (Light Truck)
C3 (Heavy truck &
bus)
A RRC ≤ 6.5 RRC ≤ 5.5 RRC ≤ 4.0
B 6.6 ≤ RRC ≤ 7.7 5.6 ≤ RRC ≤ 6.7 4.1 ≤ RRC ≤ 5.0
C 7.8 ≤ RRC ≤ 9.0 6.8 ≤ RRC ≤ 8.0 5.1 ≤ RRC ≤ 6.0
D None None 6.1 ≤ RRC ≤ 7.0
E 9.1 ≤ RRC ≤ 10.5 8.1 ≤ RRC ≤ 9.2 7.1 ≤ RRC ≤ 8.0
F 10.6 ≤ RRC ≤ 12.0 9.3 ≤ RRC ≤ 10.5 RRC ≥ 8.1
G None None None

Date
2 june 2015
Our reference
2015-TL-NOT-0100285845
Page
6/13
The fuel savings potential is calculated by multiplication of the difference in RRC
(due to a switch from tyre label B, C D, E or F to tyre label A) with the share of
rolling resistance in the overall driving resistances (as a function of the driving
behaviour). Based on fleet-specific shares of the driving pattern, the savings
potential of switching to energy-efficient A-label tyres is recalculated and
presented in Table 3. In analogy to [TNOa, 2014], it is assumed that summer and
winter tyres are replaced by energy-efficient A-label tyres and that the tyres are
changed twice a year, from winter to summer and back. It is assumed that tyres
are replaced at the end of their lifetime and at the moment of new vehicle
purchase. The presented savings potential is therefore not instantly achieved for
the entire fleet.
Table 3: Fuel savings potential of energy-efficient A-label tyres in the Amsterdam fleet
Tyre
class
Vehicle
category
Driving
Pattern
Fuel
savings
potential
(summer)
Fuel
savings
potential
(winter)
Fuel
savings
potential
(average)
[%] urban /
[%] highway [%] [%] [%]
C1
Passenger cars (petrol) 90 / 10 4.3% 5.0% 4.7%
Passenger cars (diesel) 90 / 10 4.3% 5.0% 4.7%
Service delivery (petrol) 90 / 10 4.3% 5.0% 4.7%
Service delivery (diesel) 90 / 10 4.3% 5.0% 4.7%
C3 Heavy-duty truck (diesel) 90 / 10 3.2% 4.0% 3.6%
2.5. Savings potential of correct tyre pressure maintenance For the calculation of the impact of correct tyre pressure maintenance, the relation
between tyre pressure and rolling resistance is required. This relation has been
extensively studied by several tyre manufacturers and is described by [Exxon,
2008]:
RR ~ (preference/ptest)0.5-0.7
The effect of tyre pressure on RRC is thus equal for all vehicles for the same
relative difference from the recommended tyre pressure. The resulting savings
potential is shown in Table 4.

Date
2 june 2015
Our reference
2015-TL-NOT-0100285845
Page
7/13
Table 4: Fuel savings potential of correct tyre pressure maintenance in the Amsterdam fleet
Tyre
class
Vehicle
category
Driving
Behaviour
Fuel
savings
potential
(summer)
Fuel
savings
potential
(winter)
Fuel
savings
potential
(average)
[%] urban /
[%] highway [%] [%] [%]
C1
Passenger cars (petrol) 90 / 10 1.5% 1.5% 1.5%
Passenger cars (diesel) 90 / 10 1.5% 1.5% 1.5%
Service delivery (petrol) 90 / 10 1.5% 1.5% 1.5%
Service delivery (diesel) 90 / 10 1.5% 1.5% 1.5%
C3 Heavy-duty truck
(diesel) 90 / 10 1.0% 1.0% 1.0%
The savings potential of correct tyre pressure maintenance is determined by
reducing all under-inflation to zero. It is assumed that over-inflation remains
unchanged with correct tyre pressure maintenance.
2.6. Combined savings potential of energy-efficient A-label tyres and correct tyre pressure maintenance
The combined savings potential of energy-efficient A-label tyres and correct tyre
pressure maintenance is shown in Table 5. It is determined through multiplication
of the savings potentials in the following way: %c = 1 – (1-%a)*(1-%b), where %a,
%b and %c represent the savings potentials of measures A and B and the
combined savings potential of measure C.
Table 5: Fuel savings potential of energy-efficient A-label tyres and correct tyre pressure
maintenance in the Amsterdam fleet
Tyre
class
Vehicle
category
Driving
Behaviour
Fuel
savings
potential
(summer)
Fuel
savings
potential
(winter)
Fuel
savings
potential
(average)
[%] urban /
[%] highway [%] [%] [%]
C1
Passenger cars (petrol) 90 / 10 5.8% 6.6% 6.2%
Passenger cars (diesel) 90 / 10 5.9% 6.6% 6.2%
Service delivery (petrol) 90 / 10 5.9% 6.6% 6.2%
Service delivery (diesel) 90 / 10 5.9% 6.6% 6.2%
C3 Heavy-duty truck
(diesel) 90 / 10 4.2% 5.0% 4.6%
2.7. Fuel costs Fuel cost savings are calculated from an end-user perspective. For reasons of
consistency, the same fuel costs are used as in the Triple-A tyre study for the
Date
2 june 2015
Our reference
2015-TL-NOT-0100285845
Page
8/13
Netherlands (see Table 6). It is acknowledged however, that fuel costs vary over
time and are currently lower than one year ago.
Table 6: Average fuel prices used in the calculation of end-user cost savings [BSP, 2014].
Fuel price, end-user perspective
(incl. excise duty, incl. VAT)
Fuel price, societal perspective
(excl. excise duty, excl. VAT)
[€/l] [€/l]
Petrol 1.75 0.68
Diesel 1.50 0.76
Additional investment costs and operational costs of energy-efficient A-label tyres
and correct tyre pressure maintenance have been assumed to be zero. In [Geluid,
2015], it was determined that high-performance tyres do not necessarily cost more
than standard tyres. In fact, there seems to be little of no correlation between
additional costs and high-performance tyres. This is of course only applicable, if
the appropriate tyres are chosen at the point of new vehicle sales or effectively
when the tyre need to be replaced because they have reached the end of their
lifetime. Additionally, large vehicle fleets often have their own pumping station or
maintenance costs are included in the lease contract. Extra pumping costs are
therefore excluded.
3. Results
In this chapter, the savings potential of energy-efficient A-label tyres and correct
tyre pressure maintenance are presented, separately in section 3.1and section 3.2
as well as in combination in section 0.
3.1. Fuel savings potential of energy-efficient A-label tyres Energy-efficient A-label tyres could save the Amsterdam fleet up to 113 thousand
litres of fuel and 291 tons of CO2 per year. This is equivalent to nearly 173
thousand Euros. An overview of the savings potential is shown in Table 7.
The largest savings can be achieved for trucks, although they represent the
smallest number of vehicles in the Amsterdam municipal fleet. This is related to
the fact that annual mileage and especially the fuel consumption of these vehicles
is relatively high.

Date
2 june 2015
Our reference
2015-TL-NOT-0100285845
Page
9/13
Table 7: Fuel savings potential, annual fuel savings, cost savings and CO2 reduction of
energy-efficient A-label
Tyre
class Vehicle category
Fuel
savings
potential
(average)
Annual
fuel
savings
Annual
cost
savings
Annual
CO2
reduction
[] [%] [l] [€] [tCO2]
C1
Passenger cars (petrol) 4.7% 12,700 22,300 30
Passenger cars (diesel) 4.7% 1,200 1,800 3
Service delivery (petrol) 4.7% 1,500 2,700 4
Service delivery (diesel) 4.7% 25,000 37,500 65
C3 Heavy-duty truck
(diesel) 3.6% 72,300 108,500 189
TOTAL 112,700 172,700 291
3.2. Fuel savings potential of correct tyre pressure maintenance
Correct tyre pressure maintenance could save the Amsterdam fleet nearly 33
thousand litres of fuel and 86 tons of CO2. This is equivalent to more than 51
thousand Euros. An overview of the savings potential is shown in Table 8.
Table 8: Fuel savings potential, annual fuel savings, cost savings and CO2 reduction of
correct tyre pressure maintenance
Tyre
class Vehicle category
Fuel
savings
potential
(average)
Annual
fuel
savings
Annual
cost
savings
Annual
CO2
reduction
[] [%] [l] [€] [tCO2]
C1
Passenger cars (petrol) 1.5% 4,100 7,200 10
Passenger cars (diesel) 1.5% 400 600 1
Service delivery (petrol) 1.5% 500 900 1
Service delivery (diesel) 1.5% 8,200 12,300 21
C3 Heavy-duty truck
(diesel) 1.0% 20,000 30,000 52
TOTAL 33,200 51,000 86
The largest savings can be achieved for trucks. Service delivery vans have no
savings potential, since tyre pressures are already maintained at set pressure.

Date
2 june 2015
Our reference
2015-TL-NOT-0100285845
Page
10/13
3.3. Combined fuel savings potential of energy-efficient A-label tyres and correct tyre pressure maintenance
In combination, energy-efficient A-label tyres and correct tyre pressure
maintenance could save the Amsterdam fleet about 147 thousand litres of fuel and
379 tons of CO2. This is equivalent to about 225 thousand Euros. An overview of
the savings potential is shown in Table 9.
Table 9: Fuel savings potential, annual fuel savings, cost savings and CO2 reduction of
energy-efficient A-label tyres and correct tyre pressure maintenance
Tyre
class Vehicle category
Fuel
savings
potential
(average)
Annual
fuel
savings
Annual
cost
savings
Annual
CO2
reduction
[] [%] [l] [€] [tCO2]
C1
Passenger cars (petrol) 6.2% 17,000 29,700 40
Passenger cars (diesel) 6.2% 1,600 2,400 4
Service delivery (petrol) 6.2% 2,100 3,700 5
Service delivery (diesel) 6.2% 33,400 50,100 87
C3 Heavy-duty truck
(diesel) 4.6% 92,600 138,900 242
TOTAL 146,700 224,800 379
4. Discussion and Recommendation
In above chapters the fuel savings potential of energy-efficient tyres and correct
tyre pressure maintenance are quantified and discussed for the municipal fleet of
Amsterdam. It is concluded that both measures have a large potential and come at
little or no costs. It is therefore advisable to apply both measures, for as far as this
is practical.
Below several notes are made on the accuracy and specific boundary conditions
of the above calculation. Furthermore, recommendations for improvement are
made.
Tested tyre label values and real-world performance
Tyre label values for fuel-efficiency refer to a specific rolling resistance value that
has been measured using the harmonized testing method UNECE R117.02,
referring to ISO standard 28580. The measured value is corrected according to
the alignment procedure as described by EU regulation 1235/2001, amending EU
Regulation 1222/2009 [ETRMA, 2012].
It is acknowledged that several sources indicate an incoherence between the
labelled performance and the measured performance of tyres ([IN2, 2013][ADAC,
2015]). In both [IN2, 2013] and [ADAC, 2015] on average a clear correlation is
Date
2 june 2015
Our reference
2015-TL-NOT-0100285845
Page
11/13
observed between rolling resistance (RRC) and the tyre label, however the
variance of the measured rolling resistance is large within one label. As a result,
there is overlap between RRC and label values. In [ADAC, 2015], B label tyres
perform best on average, A label tyres have not been tested. Except for two
outliers in the measurement (Pirelli Cinturato P1 Verde and Nokian Line), a
downward trend is observed towards reduced RRC with improved tyre label. From
the test specifications defined in [ADAC, 2015], it remains unclear what the
reasons are for this deviation. Fuel consumption is measured at a constant speed
of 100 km/h over a distance of 2 km and measurements are repeated at least
three times. At this test condition, the external influences of wind and other must
not be neglected.
Generally, stakeholders have questioned the accuracy of the tyre RRC test. Tyre
manufacturers have shown that the R117 test is reproducible and repeatable
across the different laboratories with an accuracy which is much higher than the
width of a tyre label class as described in Table 2. The relevance of the test for on-
road performances of tyres is as yet an open question. The test is performed on a
smooth steel drum (unlike the noise test) at a fixed velocity, and tyre
manufacturers suggest that the additional rolling resistance due to the radius of
the drum is about 10%-20% which should be comparable to a 10%-20% increase
from the road surface texture. This would make the R117 absolute value relevant
for on-road performances. Aspects at turning, toe-in and road undulation are not
covered by this tests. Alternative test procedures may produce a large variation in
test results, which may however, lie outside the control of the tyre manufacturer.
The test procedure R117 is designed to provide a standard value, which may have
is drawbacks but is the best available, comparable and relevant number at
present.
TNO tests of low-rolling resistance tyres have shown on light-duty as well as
heavy-duty vehicles that fuel savings in the order of 3 to 4 % can be achieved
[TvdT, 2013][WLTP, 2014]. Such evaluation requires large monitoring programs.
On road testing is affected by many external circumstances for which must be
corrected, and the tests must be performed with exact identical vehicle state, to
exclude unwanted variations. Two aspects in particular are important. First, the
warm tyre pressure is the result of the conditioning due to driving, this varies
greatly from tests to test, by up to 12% variation in warm tyre pressure. Secondly,
wind will affect the results, and is almost impossible to correct for as wind
gustiness may vary from location to location, and time to time.
Availability of energy-efficient A-label winter tyres
While there is a large abundance of energy-efficient A-label summer tyres, the
choice for winter tyres is limited. In practise, this could result in a lower savings
potential for winter tyres simply because the end-user cannot buy the tyre of
choice.
Tyre conditioning
It is known that the rolling resistance of a tyre depends on its stiffness. Since the
stiffness of rubber is to a large degree dependent on the tyre temperature, the

Date
2 june 2015
Our reference
2015-TL-NOT-0100285845
Page
12/13
rolling resistance changes over the drive time and generally leads to a lower
rolling resistance after a few minutes of driving. Once the tyre is conditioned, the
rolling resistance does not decrease any further. In this study, the hysteresis of
tyre stiffness is not taken into account, thus calculations are based on a warm
conditioned tyre. The different hysteresis of tyres and tyre labels can be relevant if
an existential share of the fleet only travel very short distances.
Emissions of particulate matter (PM)
Several sources are of influence to emissions of particulate matter (PM): the
engine, after-treatment technologies, abrasive wear of brakes and abrasive wear
of tyres. Tyre wear is not part of the tyre label and yet little research has been
done to document the difference in PM emissions between tyre labels. In [ADAC,
2015], tyre wear has been quantified with a grade however no numbers of
particulate numbers, nor amount of grams, have been published. In order to
compare the different performance of tyres on particulate matter emissions, it is
recommended to perform further research.
Distribution of tyre labels across the Amsterdam fleet
The tyre label distribution across the Amsterdam fleet was assumed to be the
same as in the Netherlands. The calculation of the savings potential could be
further improved if more information is available on the specific tyre labels
distribution within Amsterdam.
Distribution of tyre pressure across the Amsterdam fleet
The distribution of tyre pressures across the Amsterdam fleet is to a large extend
unknown. Therefore, the Dutch average tyre pressure distribution has been
assumed based on information from [GRRF, 2008] and [TPMS, 2013].
5. Acknowledgement
TNO thanks Carlo Schoonebeek and Hans de Booij (City of Amsterdam) for the
delivery of Amsterdam-specific data on the municipal fleet composition, fuel
consumption and average vehicle mileage.
6. References
[ADAC, 2015] http://www.adac.de/_mmm/pdf/Sommerreifen%20185%
2060%20R14%20H_76738.pdf (01.03.2015)
[Exxon, 2008] Inflation pressure retention effects on tire rolling resistance and
vehicle fuel economy, Exxon Mobile Chemical, CA, 2008
[Band, 2015] www.bandopspanning.nl (01.05.2015).
[BSP, 2014] http://www.brandstofprijzen.info/ (15.01.2014)

Date
2 june 2015
Our reference
2015-TL-NOT-0100285845
Page
13/13
[BSV, 2015] Een duurzame brandstofvisie met LEF, De belangrijke uitkomsten
uit het SER-visietraject naar een duurzame brandstoffenmix in
Nederland, SER, juni 2014
[EC1222, 2009] Regulation (EC) No. 1222/2009 of the European Parliament and
the council of 25 November 2009, On the labelling of tyres with respect to fuel efficiency and other essential parameters, Official Journal of the European Union, 2009
[ETRMA, 2012] EU tyre Labelling Regulation 1222/2009 – Industry Guideline on
tyre labelling to promote the use of fuel efficient and safe tyres
with low noise levels, version 4
[Geluid, 2015] Blad Geluid, no. 1, 2015, Geluidlabels voor de consument (3): Een
bandenlabel, Johan Sliggers, Erik de Graaff, Stephan van Zyl
[GRRF, 2008] GRRF TPMS Task Force Conclusions, Version 05, June 2008
[IN2, 2013] Kragh, J., Oddershede, J., e.a.: Nord-Tyre – Car labelling and
Nordic traffic noise, 15.-18. September 2013, Internoise, Innsbruck
[TNOa, 2014] TNO 2014 R10735, Potential benefits of Triple-A tyres in The
Netherlands, Zyl et al. 2014.
[TNOb, 2014] Zyl et al., Potential benefits of Triple-A tyres in the EU, 2014-TM-
NOT-0100105861, 2014.
[TvdT, 2013] Truck van de Toekomst – Brandstof- en CO2-besparing anno
2013, TNO, 2013
[TPMS, 2013] Study on Tyre Pressure Monitoring Systems (TPMS) as a means
to reduce Light-Commercial and Heavy-Duty Vehicles fuel
consumption and CO2-emissions, van Zyl et al., 2013
[WLTP, 2014] The Effect on Road Load due to Variations in Valid Coast Down
Tests for Passenger Cars, P. van Mensch*, N.E. Ligterink, and
R.F.A. Cuelenaere, TAP 2014, Graz

Memorandum
Earth, Life & Social Sciences
Van Mourik Broekmanweg 6
2628 XE Delft
P.O. Box 49
2600 AA Delft
The Netherlands
www.tno.nl
T +31 88 866 30 00
F +31 88 866 30 10
Date
2 June 2015
Our reference
2015-TL-NOT-0100285843
Direct dialling
+31 88 866 27 05
Project number
060.08196
To
Ministry of Infrastructure and Environment, the Netherlands
Attn. Johan Sliggers
From
Uilke Stelwagen (TNO)
Stephan van Zyl (TNO)
Subject
Potential benefits of energy-efficient tyres and correct tyre pressure maintenance
for the municipal fleet of Rotterdam
Summary
In two previous studies performed by TNO and M+P, it has been shown that
energy-efficient tyres can have a large effect on the fuel consumption of Dutch and
EU road transport. In this study, the specific fuel savings potential is calculated for
the municipal fleet of Rotterdam. Apart from energy-efficient tyres (as indicated by
the tyre label), the impact of correct tyre pressure maintenance on the municipal
fleet of Rotterdam are studied. This memo documents the order-of-magnitude fuel
savings potential of both measures.
The municipal fleet of Rotterdam consists of1211 vehicles of which 1097 have
been included in the calculations of this study. In total, these 1097 vehicles drive a
cumulative annual mileage of 19 million kilometres which corresponds to an
average mileage of 17200 kilometres per year per vehicle.
The results show that energy-efficient tyres and tyre pressure have a large impact
on fuel consumption. The use of energy-efficient tyres in the municipal fleet of
Rotterdam could annually save about 153 thousand litres of fuel and reduce
CO2 emissions by about 396 ton, an equivalent of about 4% of the annual CO2
emissions of the municipal fleet of Rotterdam. Maintaining the required tyre
pressure for vehicles in the Rotterdam fleet could annually save about 45
thousand litres of fuel and reduce CO2 emissions by about 116 ton, an
equivalent of roughly 1 %. When combined the measures could annually save
nearly 200 thousand litres of fuel and reduce CO2 emissions by roughly 514
ton, an equivalent of roughly 5 % of the annual CO2 emissions of the municipal
fleet of Rotterdam. The annual fuel cost savings from switching to energy-efficient
A-label tyres be in the order of 234 thousand Euros and about 69 thousand
Euros for the maintenance of the required tyre pressure. Combining the two
measures results in annual fuel costs savings of about 304 thousand Euros.
Given the large potential benefits of energy-efficient tyres, an accelerated market
uptake could help in making road transport more environmentally friendly.
Whether the full potential can be realized in practice largely depends on the
vehicle’s driving behaviour and the degree to which advertised tyre label values

Date
2 June 2015
Our reference
2015-TL-NOT-0100285843
Page
2/13
comply with EU-mandated values. The calculated savings potential of energy-
efficient tyres is in the same order-of-magnitude of on-road measurements
performed by TNO for light-duty and heavy-duty vehicles.
1. Introduction
In two previous studies performed by TNO and M+P it was determined that large
cost savings and CO2 reductions can be achieved in the Netherlands and in the
EU by switching to energy-efficient tyres [TNOa, 2014][TNOb, 2014]. Apart from
the choice of the tyre, correct tyre pressure maintenance plays a significant role
for optimized fuel consumption. The Dutch government has a clear vision for
sustainable transport in 2020 and 2030 [BSV, 2015]. Energy-efficient tyres as well
as correct tyre pressure maintenance can contribute to this vision and are
considered low hanging fruit with little extra costs and large impact. Based on
these insights, a number of governmental and municipal fleet owners have shown
interest in the implementation of tyre-related measures.
Aim and scope
This report is part of a study where the potential benefits of energy-efficient tyres
and correct tyre pressure maintenance are quantified for three specific vehicle
fleets:
the vehicle fleet of the Dutch National Road Authority (RWS);
the municipal fleet of Amsterdam;
the municipal fleet of Rotterdam.
This memorandum solely reports the potential benefit for the municipal fleet of
Rotterdam. The potential benefit of the municipality of Amsterdam and RWS are
documented and published separately.
Benefits are calculated for the following measures:
Switching from average (D-label) tyres to energy-efficient A-label tyres;
Correct tyre pressure maintenance.
Benefits are expressed in terms of fuel savings: reduced fuel consumption (in
litres), fuel cost savings for the end-user (in Euros) and CO2 reduction (in tons).
Approach
The savings potential of energy-efficient A-labelled tyres is determined based on
the average distribution of tyre labels in the Netherlands as determined in the
previous Triple-A studies. The savings potential of correct tyre pressure
maintenance is determined based on the average tyre pressure distribution of
vehicles on Dutch and European roads.
Structure
This report is structured in the following way: In chapter 2, an overview is given of
the methodology and assumptions that are used in order to determine the savings
potential. Results are displayed and discussed in chapter 3. Items for conclusion,

Date
2 June 2015
Our reference
2015-TL-NOT-0100285843
Page
3/13
discussion and recommendations are documented in the chapter 4. A short note
of acknowledgements is added in chapter 5.
2. Methodology and assumptions
This chapter describes the methodology and assumptions used for the calculation
of the savings potential of energy-efficient A-label tyres and correct tyre pressure
maintenance.
The fuel savings of energy-efficient tyres and correct tyre pressure maintenance
are calculated separately and in combination. Apart from the knowledge of the
impact of tyre choice and tyre pressure (as determined in the previous chapter),
the following knowledge is required:
fleet composition (annual mileage, average fuel consumption);
distribution of tyre labels across the fleet;
distribution of tyre pressure across the fleet;
savings potential of energy-efficient A-label tyres;
savings potential of correct tyre pressure maintenance;
combined savings potential of energy-efficient A-label tyres and correct tyre
pressure maintenance;
fuel costs.
Below, the available information on the municipal fleet of Rotterdam is discussed.
Where specific data is not available, explicit assumptions are made based on
national default values.
2.1. Fleet composition Information on the Rotterdam municipal fleet composition was obtained directly
from Rotterdam Municipality. The database contains the following entries:
vehicle brand and model;
total fuel tanked, not always accurate (Rotterdam Municipality remark);
vehicle type/usage description;
dashboard read vehicle total mileage and vehicle age at time of reading.
An overview of the Rotterdam vehicle fleet is provided in Table 1.

Date
2 June 2015
Our reference
2015-TL-NOT-0100285843
Page
4/13
Table 1: Rotterdam vehicle fleet (status May 2015) aggregated per general vehicle category:
number of vehicles, (summed) annual mileage, average fuel consumption
Tyre
class
Vehicle
Category
Number of
vehicles
Annual
mileage
Average fuel
consumption
[#] [km] [l/100 km]
C1
Passenger car (petrol) 338 5,999,500 5.8
Passenger car (diesel) 35 1,160,100 6.4
Service delivery (petrol) 15 144,000 6.3
Service delivery (diesel) 503 7,387,100 8.7
C3 Heavy-duty truck (diesel) 206 4,261,100 66.8
SUBTOTAL 1097 18,951,800
EXCLUDED 114 1,144,400
TOTAL 1211 20,096,200
In total, the municipal fleet of Rotterdam fleet consists of 1211 vehicles. The
largest share of vehicles are passenger cars and delivery vans (891). A smaller
share of the vehicle fleet consists of medium to heavy-duty trucks (206). A total of
114 vehicles is excluded from further calculations because data was either not
available or not applicable. This was the case for 58 electrical vehicles, mostly
passenger cars, and 56 other vehicles. The aggregation into the indicated five
general vehicle classes was done mainly on the basis of the brand and model
information and for several tens of vehicles by also using the vehicle type/usage
descriptions.
The annually driven kilometers per individual vehicle were estimated from the total
kilometers driven and the vehicle age. From these the annual vehicle kilometers
per general vehicle class were calculated by summation per class.
In a few cases, the available data on fuel consumption was conditioned to correct
for faulty or lacking entries. A first estimate of the fuel consumption per individual
vehicle was calculated from the total fuel tanked and the total kilometers driven.
This estimate was checked against the type approval value for the vehicle, when
available from the RDW database. When the estimate was lower than the type
approval value or higher than one and a half times the type approval value, it was
replaced by the type approval value plus a certain factor. This factor was taken to
be 2 l/100km for passenger cars and service delivery vans. When no type
approval values were available for a vehicle, i.e. for all trucks and older (>30
months) vans, the estimate was used as such or the value was excluded from
computations. For 84 vehicles, i.e. 56 trucks and 28 excluded vehicles (as
unclassifiable), with a very high estimated fuel consumption (>100 l/100km), the
fuel consumption value was limited to 100 l/100km.
The reduction potential of energy efficient tyres and correct tyre pressure
maintenance also depend on the driving behaviour. This is expressed in terms of
the share of kilometres driven on urban and highway roads. For the municipal fleet
of Amsterdam no specific data was available on the actual shares per road type.

Date
2 June 2015
Our reference
2015-TL-NOT-0100285843
Page
5/13
However, since these vehicles are mainly used within the city, it is assumed for all
vehicle categories that 90% of the kilometres are driven in urban areas and 10%
on highways.
2.2. Distribution of tyre labels across the fleet The distribution of tyre labels was assumed to be the same as in [TNOa, 2014].
2.3. Distribution of tyre pressure across the fleet The distribution of tyre pressure in the Rotterdam municipal fleet was assumed to
be the same as for the Dutch fleet (light duty) and EU fleet (heavy duty), unless
more specific knowledge was available. The tyre pressure distribution for Dutch
passenger cars is reported in [GRRF, 2008] and shown in Figure 1 as a function of
the difference between recorded pressure and recommended pressure. Based on
this data, approximately 30% of the cars on the road drive with an under-inflation
of up to 10%. The tyre pressure distribution heavy duty trucks was assumed to be
the same as reported in [TPMS, 2013] and is also shown in Figure 1.
Figure 1: Distribution of tyre pressure in NL (C1 and C3 tyres) [GRRF, 2008][TPMS, 2013]
2.4. Saving potentials of energy efficient A-label tyres The fuel savings potential of energy-efficient A-label tyres is determined by using
the same methodology as in [TNOa, 2014]. The basis of all calculations is the
coefficient of rolling resistance (RRC) as documented in regulation EC 1222
[EC1222, 2009] and UNECE R117. The table below documents the range of
rolling resistances of each tyre class and different vehicle categories.
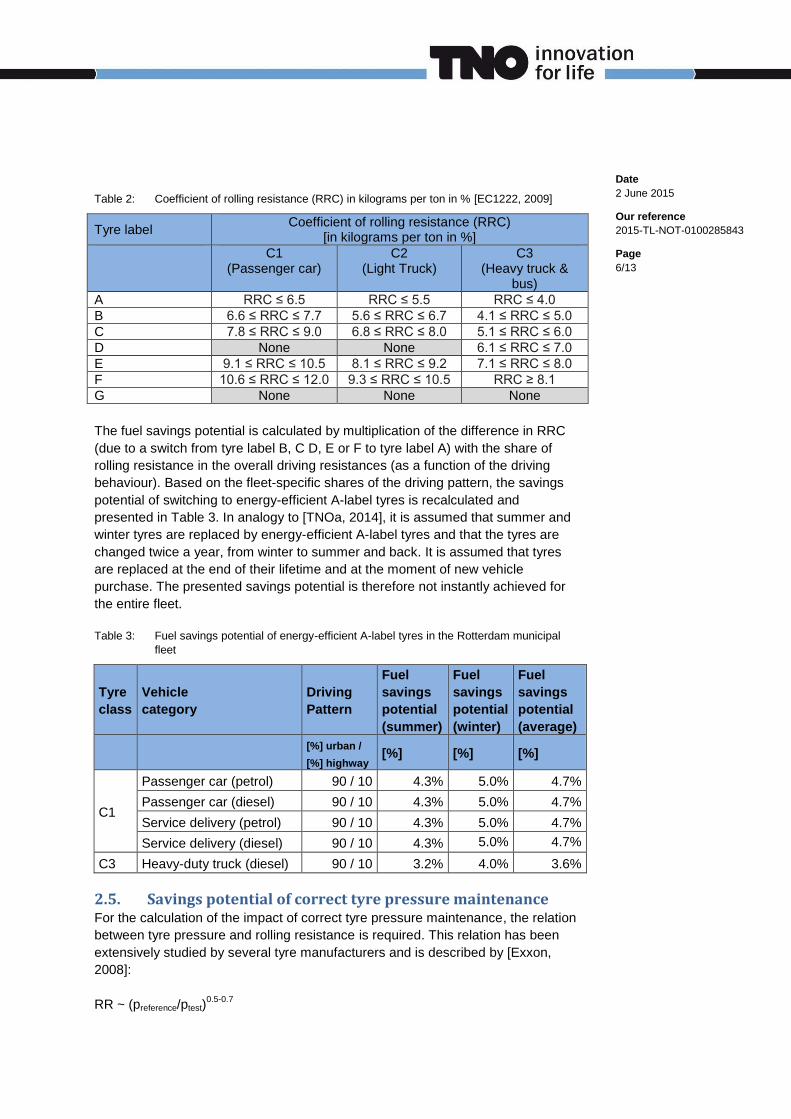
Date
2 June 2015
Our reference
2015-TL-NOT-0100285843
Page
6/13
Table 2: Coefficient of rolling resistance (RRC) in kilograms per ton in % [EC1222, 2009]
Tyre label Coefficient of rolling resistance (RRC)
[in kilograms per ton in %]
C1 (Passenger car)
C2 (Light Truck)
C3 (Heavy truck &
bus)
A RRC ≤ 6.5 RRC ≤ 5.5 RRC ≤ 4.0
B 6.6 ≤ RRC ≤ 7.7 5.6 ≤ RRC ≤ 6.7 4.1 ≤ RRC ≤ 5.0
C 7.8 ≤ RRC ≤ 9.0 6.8 ≤ RRC ≤ 8.0 5.1 ≤ RRC ≤ 6.0
D None None 6.1 ≤ RRC ≤ 7.0
E 9.1 ≤ RRC ≤ 10.5 8.1 ≤ RRC ≤ 9.2 7.1 ≤ RRC ≤ 8.0
F 10.6 ≤ RRC ≤ 12.0 9.3 ≤ RRC ≤ 10.5 RRC ≥ 8.1
G None None None
The fuel savings potential is calculated by multiplication of the difference in RRC
(due to a switch from tyre label B, C D, E or F to tyre label A) with the share of
rolling resistance in the overall driving resistances (as a function of the driving
behaviour). Based on the fleet-specific shares of the driving pattern, the savings
potential of switching to energy-efficient A-label tyres is recalculated and
presented in Table 3. In analogy to [TNOa, 2014], it is assumed that summer and
winter tyres are replaced by energy-efficient A-label tyres and that the tyres are
changed twice a year, from winter to summer and back. It is assumed that tyres
are replaced at the end of their lifetime and at the moment of new vehicle
purchase. The presented savings potential is therefore not instantly achieved for
the entire fleet.
Table 3: Fuel savings potential of energy-efficient A-label tyres in the Rotterdam municipal
fleet
Tyre
class
Vehicle
category
Driving
Pattern
Fuel
savings
potential
(summer)
Fuel
savings
potential
(winter)
Fuel
savings
potential
(average)
[%] urban /
[%] highway [%] [%] [%]
C1
Passenger car (petrol) 90 / 10 4.3% 5.0% 4.7%
Passenger car (diesel) 90 / 10 4.3% 5.0% 4.7%
Service delivery (petrol) 90 / 10 4.3% 5.0% 4.7%
Service delivery (diesel) 90 / 10 4.3% 5.0% 4.7%
C3 Heavy-duty truck (diesel) 90 / 10 3.2% 4.0% 3.6%
2.5. Savings potential of correct tyre pressure maintenance For the calculation of the impact of correct tyre pressure maintenance, the relation
between tyre pressure and rolling resistance is required. This relation has been
extensively studied by several tyre manufacturers and is described by [Exxon,
2008]:
RR ~ (preference/ptest)0.5-0.7

Date
2 June 2015
Our reference
2015-TL-NOT-0100285843
Page
7/13
The effect of tyre pressure on RRC is thus equal for all vehicles for the same
relative difference from the recommended tyre pressure.
The savings potential of correct tyre pressure maintenance is determined by
reducing all under-inflation to zero. It is assumed that over-inflation remains
unchanged with correct tyre pressure maintenance. The resulting savings potential
is shown in Table 4.
Table 4: Fuel savings potential of correct tyre pressure maintenance in the Rotterdam municipal
fleet
Tyre
class
Vehicle
category
Driving
Behaviour
Fuel
savings
potential
(summer)
Fuel
savings
potential
(winter)
Fuel
savings
potential
(average)
[%] urban /
[%] highway [%] [%] [%]
C1
Passenger car (petrol) 90 / 10 1.5% 1.5% 1.5%
Passenger car (diesel) 90 / 10 1.5% 1.5% 1.5%
Service delivery (petrol) 90 / 10 1.5% 1.5% 1.5%
Service delivery (diesel) 90 / 10 1.5% 1.5% 1.5%
C3 Heavy-duty truck (diesel) 90 / 10 1.0% 1.0% 1.0%
2.6. Combined savings potential of energy-efficient A-label tyres and correct tyre pressure maintenance
The combined savings potential of energy-efficient A-label tyres and correct tyre
pressure maintenance is shown in Table 5. It is determined through multiplication
of the savings potentials in the following way: %c = 1 – (1-%a)*(1-%b), where %a,
%b and %c represent the savings potentials of measures A and B and the
combined savings potential of measure C.
Table 5: Fuel savings potential of energy-efficient A-label tyres and correct tyre pressure
maintenance in the Rotterdam municipal fleet
Tyre
class
Vehicle
category
Driving
Behaviour
Fuel
savings
potential
(summer)
Fuel
savings
potential
(winter)
Fuel
savings
potential
(average)
[%] urban /
[%] highway [%] [%] [%]
C1
Passenger car (petrol) 90 / 10 5.8% 6.6% 6.2%
Passenger car (diesel) 90 / 10 5.9% 6.6% 6.2%
Service delivery (petrol) 90 / 10 5.9% 6.6% 6.2%
Service delivery (diesel) 90 / 10 5.9% 6.6% 6.2%
C3 Heavy-duty truck (diesel) 90 / 10 4.2% 5.0% 4.6%

Date
2 June 2015
Our reference
2015-TL-NOT-0100285843
Page
8/13
2.7. Fuel costs Fuel cost savings are calculated from an end-user perspective. For reasons of
consistency, the same fuel costs are used as in the Triple-A tyre study for the
Netherlands (see
Table 6). It is acknowledged however, that fuel costs vary over time and are
currently lower than one year ago.
Table 6: Average fuel prices used in the calculation of end-user cost savings [BSP, 2014].
Fuel price, end-user perspective
(incl. excise duty, incl. VAT)
Fuel price, societal perspective
(excl. excise duty, excl. VAT)
[€/l] [€/l]
Petrol 1.75 0.68
Diesel 1.50 0.76
Additional investment costs and operational costs of energy-efficient A-label tyres
and correct tyre pressure maintenance have been assumed to be zero. In [Geluid,
2015], it was determined that high-performance tyres do not necessarily cost more
than standard tyres. In fact, there seems to be little or no correlation between
additional costs and high-performance tyres. This is of course only applicable, if
the appropriate tyres are chosen at the point of new vehicle sales or effectively
when the tyre need to be replaced because they have reached the end of their
lifetime. Additionally, large vehicle fleets often have their own pumping station or
maintenance costs are included in the lease contract. Extra pumping costs are
therefore excluded.
3. Results
In this chapter, the savings potential of energy-efficient A-label tyres and correct
tyre pressure maintenance are presented, separately in section 3.1and section 0
as well as in combination in section 0.
3.1. Fuel savings potential of energy-efficient A-label tyres Energy-efficient A-label tyres could save the Rotterdam municipal fleet about 153
thousand litres of fuel and about 396 tons of CO2 per year. This is equivalent to an
annual cost saving of about 234 thousand Euros. An overview of the savings
potential is shown in Table 7.

Date
2 June 2015
Our reference
2015-TL-NOT-0100285843
Page
9/13
Table 7: Fuel savings potential, annual fuel savings, cost savings and CO2 reduction of
energy-efficient A-label
Tyre
class Vehicle category
Fuel
savings
potential
(average)
Annual
fuel
savings
Annual
cost
savings
Annual
CO2
reduction
[] [%] [l] [€] [tCO2]
C1
Passenger car (petrol) 4.7% 16,200 28,400 38
Passenger car (diesel) 4.7% 3,500 5,200 9
Service delivery (petrol) 4.7% 400 700 1
Service delivery (diesel) 4.7% 30,000 45,000 78
C3 Heavy-duty truck (diesel) 3.6% 103,100 154,600 269
TOTAL 153,200 234,000 396
The largest savings can be achieved within the trucks, although they represent a
smaller part of vehicles in the Rotterdam municipal fleet. This is related to the fact
that annual mileage and especially the fuel consumption of these vehicles is
relatively high.
3.2. Fuel savings potential of correct tyre pressure maintenance
Correct tyre pressure maintenance could save the Rotterdam municipal fleet about
45 thousand litres of fuel and about 116 tons of CO2. This is equivalent to an
annual cost saving of about 69 thousand Euros. An overview of the savings
potential is shown in Table 8.
Table 8: Fuel savings potential, annual fuel savings, cost savings and CO2 reduction of
correct tyre pressure maintenance
Tyre
class Vehicle category
Fuel
savings
potential
(average)
Annual
fuel
savings
Annual
cost
savings
Annual
CO2
reduction
[] [%] [l] [€] [tCO2]
C1
Passenger car (petrol) 1.5% 5,300 9,200 12
Passenger car (diesel) 1.5% 1,100 1,700 3
Service delivery (petrol) 1.5% 100 200 0.4
Service delivery (diesel) 1.5% 9,900 14,800 26
C3 Heavy-duty truck (diesel) 1.0% 28,500 42,700 74
TOTAL 44,900 68,700 116
The largest savings can be achieved for trucks followed by service delivery vans.
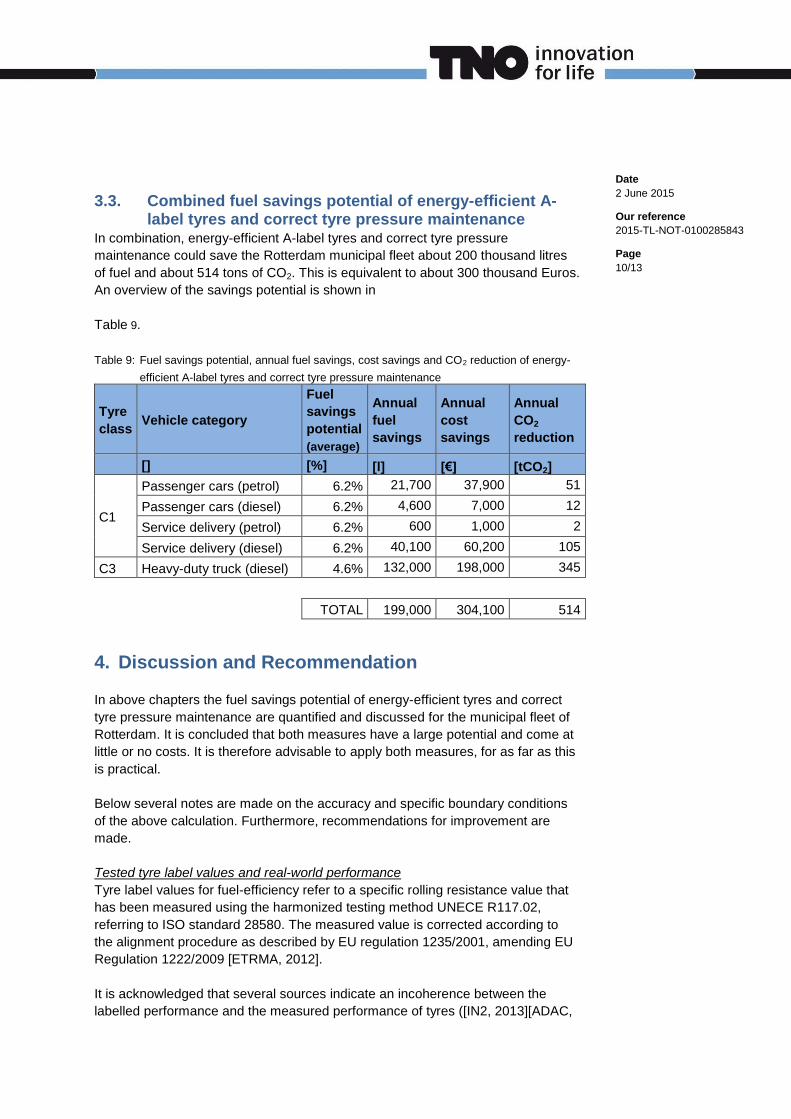
Date
2 June 2015
Our reference
2015-TL-NOT-0100285843
Page
10/13
3.3. Combined fuel savings potential of energy-efficient A-label tyres and correct tyre pressure maintenance
In combination, energy-efficient A-label tyres and correct tyre pressure
maintenance could save the Rotterdam municipal fleet about 200 thousand litres
of fuel and about 514 tons of CO2. This is equivalent to about 300 thousand Euros.
An overview of the savings potential is shown in
Table 9.
Table 9: Fuel savings potential, annual fuel savings, cost savings and CO2 reduction of energy-
efficient A-label tyres and correct tyre pressure maintenance
Tyre
class Vehicle category
Fuel
savings
potential
(average)
Annual
fuel
savings
Annual
cost
savings
Annual
CO2
reduction
[] [%] [l] [€] [tCO2]
C1
Passenger cars (petrol) 6.2% 21,700 37,900 51
Passenger cars (diesel) 6.2% 4,600 7,000 12
Service delivery (petrol) 6.2% 600 1,000 2
Service delivery (diesel) 6.2% 40,100 60,200 105
C3 Heavy-duty truck (diesel) 4.6% 132,000 198,000 345
TOTAL 199,000 304,100 514
4. Discussion and Recommendation
In above chapters the fuel savings potential of energy-efficient tyres and correct
tyre pressure maintenance are quantified and discussed for the municipal fleet of
Rotterdam. It is concluded that both measures have a large potential and come at
little or no costs. It is therefore advisable to apply both measures, for as far as this
is practical.
Below several notes are made on the accuracy and specific boundary conditions
of the above calculation. Furthermore, recommendations for improvement are
made.
Tested tyre label values and real-world performance
Tyre label values for fuel-efficiency refer to a specific rolling resistance value that
has been measured using the harmonized testing method UNECE R117.02,
referring to ISO standard 28580. The measured value is corrected according to
the alignment procedure as described by EU regulation 1235/2001, amending EU
Regulation 1222/2009 [ETRMA, 2012].
It is acknowledged that several sources indicate an incoherence between the
labelled performance and the measured performance of tyres ([IN2, 2013][ADAC,

Date
2 June 2015
Our reference
2015-TL-NOT-0100285843
Page
11/13
2015]). In both [IN2, 2013] and [ADAC, 2015] on average a clear correlation is
observed between rolling resistance (RRC) and the tyre label, however the
variance of the measured rolling resistance is large within one label. As a result,
there is overlap between RRC and label values. In [ADAC, 2015], B label tyres
perform best on average, A label tyres have not been tested. Except for two
outliers in the measurement (Pirelli Cinturato P1 Verde and Nokian Line), a
downward trend is observed towards reduced RRC with improved tyre label. From
the test specifications defined in [ADAC, 2015], it remains unclear what the
reasons are for this deviation. Fuel consumption is measured at a constant speed
of 100 km/h over a distance of 2 km and measurements are repeated at least
three times. At this test condition, the external influences of wind and other must
not be neglected.
Generally, stakeholders have questioned the accuracy of the tyre RRC test. Tyre
manufacturers have shown that the R117 test is reproducible and repeatable
across the different laboratories with an accuracy which is much higher than the
width of a tyre label class as described in Table 2. The relevance of the test for on-
road performances of tyres is as yet an open question. The test is performed on a
smooth steel drum (unlike the noise test) at a fixed velocity, and tyre
manufacturers suggest that the additional rolling resistance due to the radius of
the drum is about 10%-20% which should be comparable to a 10%-20% increase
from the road surface texture. This would make the R117 absolute value relevant
for on-road performances. Aspects at turning, toe-in and road undulation are not
covered by this tests. Alternative test procedures may produce a large variation in
test results, which may however, lie outside the control of the tyre manufacturer.
The test procedure R117 is designed to provide a standard value, which may have
its drawbacks but is the best available, comparable and relevant number at
present.
TNO tests of low-rolling resistance tyres have shown on light-duty as well as
heavy-duty vehicles that fuel savings in the order of 3 to 4 % can be achieved
[TvdT, 2013][WLTP, 2014]. Such evaluation requires large monitoring programs.
On road testing is affected by many external circumstances for which must be
corrected, and the tests must be performed with exact identical vehicle state, to
exclude unwanted variations. Two aspects in particular are important. First, the
warm tyre pressure is the result of the conditioning due to driving, this varies
greatly from tests to test, by up to 12% variation in warm tyre pressure. Secondly,
wind will affect the results, and is almost impossible to correct for as wind
gustiness may vary from location to location, and time to time.
Availability of energy-efficient A-label winter tyres
While there is a large abundance of energy-efficient A-label summer tyres, the
choice for winter tyres is limited. In practise, this could result in a lower savings
potential for winter tyres simply because the end-user cannot buy the tyre of
choice.
Tyre conditioning

Date
2 June 2015
Our reference
2015-TL-NOT-0100285843
Page
12/13
It is known that the rolling resistance of a tyre depends on its stiffness. Since the
stiffness of rubber is to a large degree dependent on the tyre temperature, the
rolling resistance changes over the drive time and generally leads to a lower
rolling resistance after a few minutes of driving. Once the tyre is conditioned, the
rolling resistance does not decrease any further. In this study, the hysteresis of
tyre stiffness is not taken into account, thus calculations are based on a warm
conditioned tyre. The different hysteresis of tyres and tyre labels can be relevant if
an existential share of the fleet only travel very short distances.
Emissions of particulate matter (PM)
Several sources are of influence to emissions of particulate matter (PM): the
engine, after-treatment technologies, abrasive wear of brakes and abrasive wear
of tyres. Tyre wear is not part of the tyre label and yet little research has been
done to document the difference in PM emissions between tyre labels. In [ADAC,
2015], tyre wear has been quantified with a grade however no numbers of
particulate numbers, nor amount of grams, have been published. In order to
compare the different performance of tyres on particulate matter emissions, it is
recommended to perform further research.
Distribution of tyre labels across the Rotterdam fleet
The tyre label distribution across the Rotterdam fleet was assumed to be the same
as in the Netherlands. The calculation of the savings potential could be further
improved if more information is available on the specific tyre labels distribution
within the municipal fleet of Rotterdam.
Distribution of tyre pressure across the Rotterdam fleet The distribution of tyre pressures across the Rotterdam fleet is to a large extend
unknown. Therefore, the Dutch average tyre pressure distribution has been
assumed based on information from [GRRF, 2008]. According to
www.bandopspanning.nl, more specific data on the Rotterdam fleet has been
gathered in the past and could be used for more accuracy.
5. Acknowledgement
TNO thanks René Herlaar (City of Rotterdam) for the delivery of Rotterdam-
specific data on the municipal fleet composition, fuel consumption and average
vehicle mileage.
6. References
[ADAC, 2015] http://www.adac.de/_mmm/pdf/Sommerreifen%20185%
2060%20R14%20H_76738.pdf (01.03.2015)
[Exxon, 2008] Inflation pressure retention effects on tire rolling resistance and
vehicle fuel economy, Exxon Mobile Chemical, CA, 2008

Date
2 June 2015
Our reference
2015-TL-NOT-0100285843
Page
13/13
[Band, 2015] www.bandopspanning.nl (01.05.2015).
[BSP, 2014] http://www.brandstofprijzen.info/ (15.01.2014)
[BSV, 2015] Een duurzame brandstofvisie met LEF, De belangrijke uitkomsten
uit het SER-visietraject naar een duurzame brandstoffenmix in
Nederland, SER, juni 2014
[EC1222, 2009] Regulation (EC) No. 1222/2009 of the European Parliament and
the council of 25 November 2009, On the labelling of tyres with respect to fuel efficiency and other essential parameters, Official Journal of the European Union, 2009
[ETRMA, 2012] EU tyre Labelling Regulation 1222/2009 – Industry Guideline on
tyre labelling to promote the use of fuel efficient and safe tyres
with low noise levels, version 4
[Geluid, 2015] Blad Geluid, no. 1, 2015, Geluidlabels voor de consument (3): Een
bandenlabel, Johan Sliggers, Erik de Graaff, Stephan van Zyl
[GRRF, 2008] GRRF TPMS Task Force Conclusions, Version 05, June 2008
[IN2, 2013] Kragh, J., Oddershede, J., e.a.: Nord-Tyre – Car labelling and
Nordic traffic noise, 15.-18. September 2013, Internoise, Innsbruck
[TNOa, 2014] TNO 2014 R10735, Potential benefits of Triple-A tyres in The
Netherlands, Zyl et al. 2014.
[TNOb, 2014] Zyl et al., Potential benefits of Triple-A tyres in the EU, 2014-TM-
NOT-0100105861, 2014.
[TvdT, 2013] Truck van de Toekomst – Brandstof- en CO2-besparing anno
2013, TNO, 2013
[TPMS, 2013] Study on Tyre Pressure Monitoring Systems (TPMS) as a means
to reduce Light-Commercial and Heavy-Duty Vehicles fuel
consumption and CO2-emissions, van Zyl et al., 2013
[WLTP, 2014] The Effect on Road Load due to Variations in Valid Coast Down
Tests for Passenger Cars, P. van Mensch*, N.E. Ligterink, and
R.F.A. Cuelenaere, TAP 2014, Graz