earth science activity #4 finding plates by plotting quakes · finding plates by plotting quakes...
TRANSCRIPT
Developed for the ShakeOut by the Southern California Earthquake Center (www.scec.org).
1
EARTH SCIENCE ACTIVITY #4 Grades 4-8
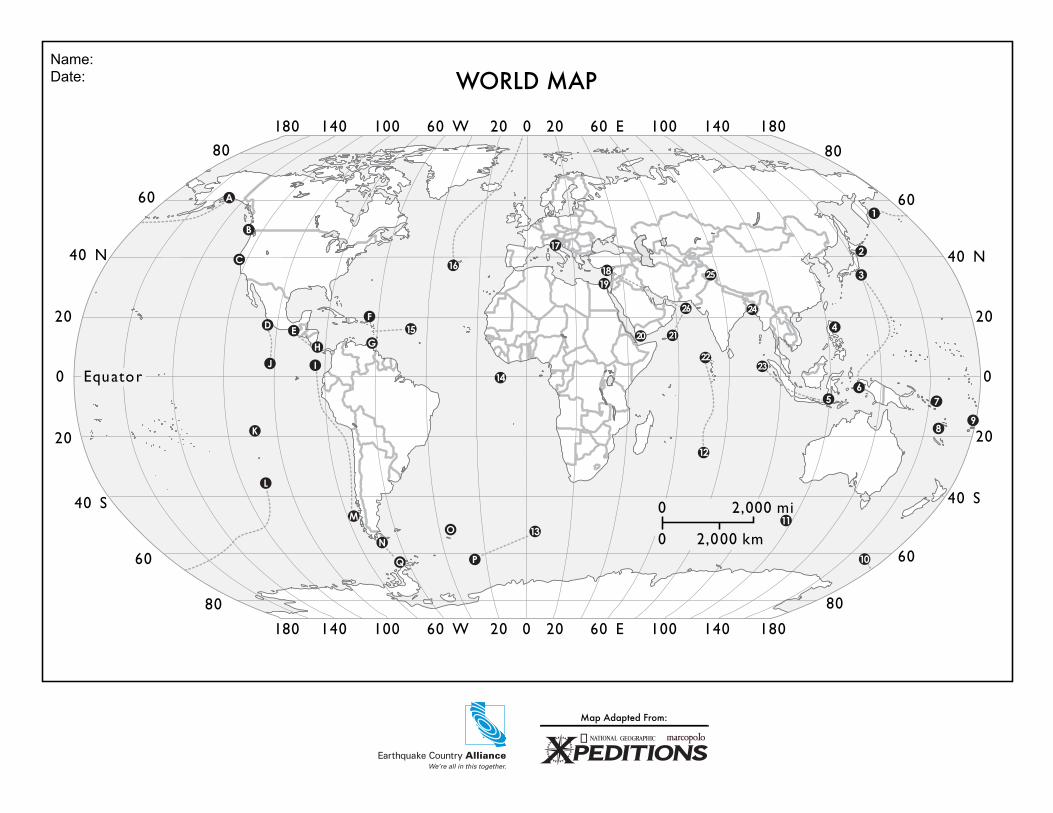
Finding Plates by Plotting Quakes This activity is one of several in a basic curriculum designed to increase student knowledge about earthquake science and preparedness. The activities can be done at any time in the weeks leading up to the ShakeOut drill. Each activity can be used in classrooms, museums, and other educational settings. They are not sequence-bound, but when used together they provide an overview of earthquake information for children and students of various ages. All activities can be found at www.shakeout.org/schools/resources/. Please review the content background (page 3) to gain a full understanding of the material conducted in this activity. OBJECTIVE: For students to learn about plate tectonics by plotting earthquakes on a world map MATERIALS/RESOURCES NEEDED: Xpedition map for each student List of Earthquakes for each student Two different color pencils or crayons
PRIOR KNOWLEDGE: In order to conduct this activity, students must know how to plot longitudinal and latitudinal coordinates on a map. ACTIVITY: Set-Up (10 minutes)
Make enough copies of the Xpedition and List of Earthquakes handouts for each student. As an alternative, the list of earthquakes can be placed onto a transparency to be used on a projector or written on the board ahead of time. Give 2 colored pencils or crayons to students if they do not already have them.
Procedure (40 minutes)
The italicized phrases are spoken suggestions for the instructor and those in parenthesis are possible answers students might provide.
1. Begin a discussion by asking students if they have ever felt an earthquake. Has anyone ever felt an earthquake? Please share your experience. If none have ever felt an earthquake, ask “Do you know of anyone who has felt an earthquake?”
2. Inform students about the activity they will conduct. Earthquakes can happen almost anywhere in the world. We are going to plot where
Developed for the ShakeOut by the Southern California Earthquake Center (www.scec.org).
2
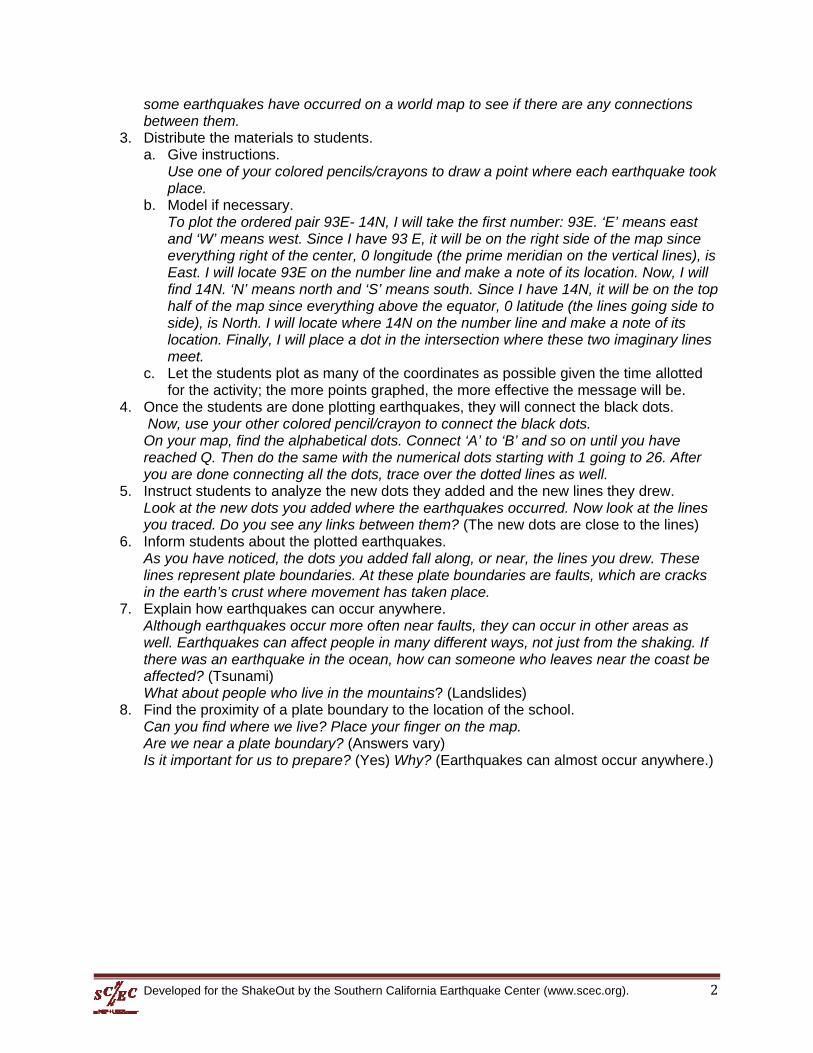
some earthquakes have occurred on a world map to see if there are any connections between them.
3. Distribute the materials to students. a. Give instructions.
Use one of your colored pencils/crayons to draw a point where each earthquake took place.
b. Model if necessary. To plot the ordered pair 93E- 14N, I will take the first number: 93E. ‘E’ means east and ‘W’ means west. Since I have 93 E, it will be on the right side of the map since everything right of the center, 0 longitude (the prime meridian on the vertical lines), is East. I will locate 93E on the number line and make a note of its location. Now, I will find 14N. ‘N’ means north and ‘S’ means south. Since I have 14N, it will be on the top half of the map since everything above the equator, 0 latitude (the lines going side to side), is North. I will locate where 14N on the number line and make a note of its location. Finally, I will place a dot in the intersection where these two imaginary lines meet.
c. Let the students plot as many of the coordinates as possible given the time allotted for the activity; the more points graphed, the more effective the message will be.
4. Once the students are done plotting earthquakes, they will connect the black dots. Now, use your other colored pencil/crayon to connect the black dots. On your map, find the alphabetical dots. Connect ‘A’ to ‘B’ and so on until you have reached Q. Then do the same with the numerical dots starting with 1 going to 26. After you are done connecting all the dots, trace over the dotted lines as well.
5. Instruct students to analyze the new dots they added and the new lines they drew. Look at the new dots you added where the earthquakes occurred. Now look at the lines you traced. Do you see any links between them? (The new dots are close to the lines)
6. Inform students about the plotted earthquakes. As you have noticed, the dots you added fall along, or near, the lines you drew. These lines represent plate boundaries. At these plate boundaries are faults, which are cracks in the earth’s crust where movement has taken place.
7. Explain how earthquakes can occur anywhere. Although earthquakes occur more often near faults, they can occur in other areas as well. Earthquakes can affect people in many different ways, not just from the shaking. If there was an earthquake in the ocean, how can someone who leaves near the coast be affected? (Tsunami) What about people who live in the mountains? (Landslides)
8. Find the proximity of a plate boundary to the location of the school. Can you find where we live? Place your finger on the map. Are we near a plate boundary? (Answers vary) Is it important for us to prepare? (Yes) Why? (Earthquakes can almost occur anywhere.)
Developed for the ShakeOut by the Southern California Earthquake Center (www.scec.org). 3
CONTENT BACKGROUND: The Earth’s Plates Most earthquakes are caused by movements of the Earth’s lithospheric plates and occur at the boundaries between the plates. Earth scientists recognize seven to twelve major plates and a number of smaller ones. The plates take their names from continents (the North American plate), from oceans (the Pacific plate), and from geographic areas (the Arabian plate). During the 20th century, improvements in seismic instrumentation and greater use of earthquake-recording instruments (seismographs) worldwide enabled scientists to learn that earthquakes tend to be concentrated in certain areas. Most earthquakes and volcanic eruptions do not strike randomly but occur in specific areas, such as along plate boundaries. One such area is the circum-Pacific Ring of Fire, where the Pacific Plate meets many surrounding plates. The Ring of Fire is the most seismically and volcanically active zone in the world. Many major population centers are located near active fault zones, such as the San Andreas. When an earthquake occurs along these zones, millions of people can suffer personal and economic losses. Not surprisingly, some people believe that, when the “Big One” hits, California will suddenly “break off” and “fall into the Pacific,” or that the Earth will “open up” along the fault and “swallow” people, cars, and houses. Such beliefs have no scientific basis whatsoever. Continents do not float in the ocean and cannot fall since they are on large slabs of rock called tectonic plates. Mid-plate earthquakes - those occurring in the interiors of plates – are much less frequent than those along plate boundaries and more difficult to explain. Earthquakes along the Atlantic seaboard of the United States are most likely related in some way to the westward movement of the North American Plate away from the Mid-Atlantic Ridge, a continuing process begun with the break of the Pangaea. However, the causes of these infrequent earthquakes are still not understood. Information from This Dynamic Earth: the Story of Plate Tectonics by W. Jacquelyne Kious and Robert I. Tilling, distributed by U.S. Department of the Interior / U.S. Geological Survey
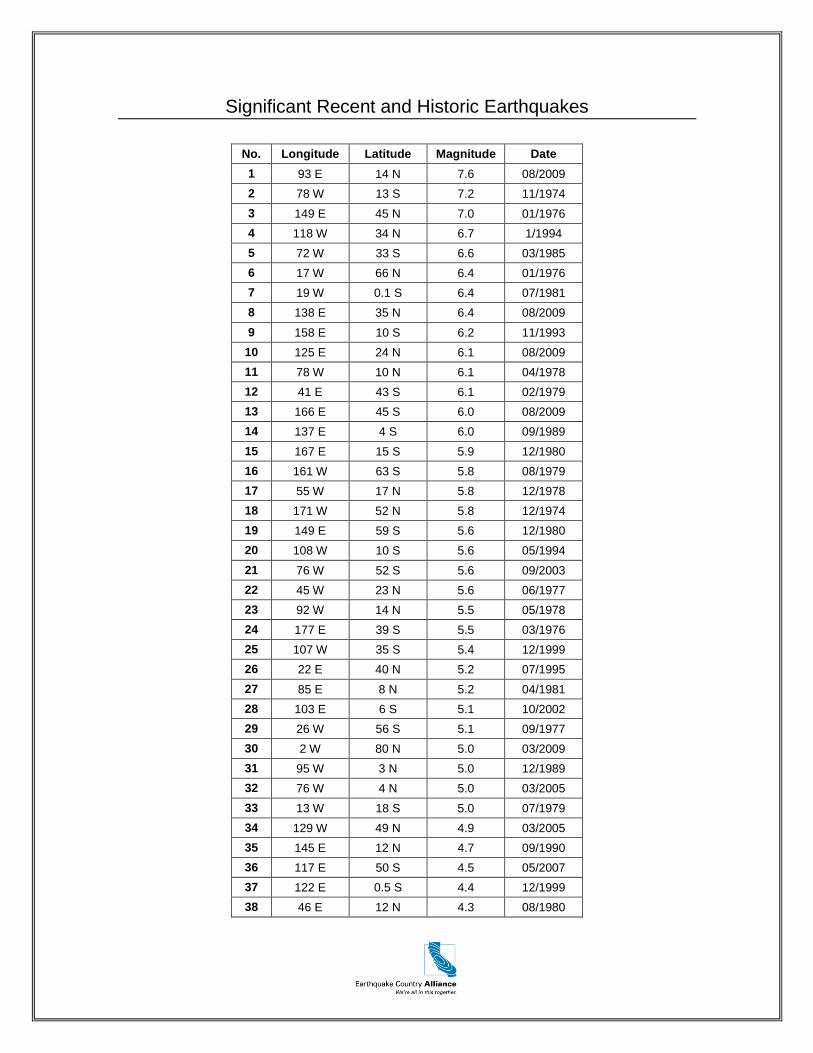
Significant Recent and Historic Earthquakes
No. Longitude Latitude Magnitude Date
1 93 E 14 N 7.6 08/2009
2 78 W 13 S 7.2 11/1974
3 149 E 45 N 7.0 01/1976
4 118 W 34 N 6.7 1/1994
5 72 W 33 S 6.6 03/1985
6 17 W 66 N 6.4 01/1976
7 19 W 0.1 S 6.4 07/1981
8 138 E 35 N 6.4 08/2009
9 158 E 10 S 6.2 11/1993
10 125 E 24 N 6.1 08/2009
11 78 W 10 N 6.1 04/1978
12 41 E 43 S 6.1 02/1979
13 166 E 45 S 6.0 08/2009
14 137 E 4 S 6.0 09/1989
15 167 E 15 S 5.9 12/1980
16 161 W 63 S 5.8 08/1979
17 55 W 17 N 5.8 12/1978
18 171 W 52 N 5.8 12/1974
19 149 E 59 S 5.6 12/1980
20 108 W 10 S 5.6 05/1994
21 76 W 52 S 5.6 09/2003
22 45 W 23 N 5.6 06/1977
23 92 W 14 N 5.5 05/1978
24 177 E 39 S 5.5 03/1976
25 107 W 35 S 5.4 12/1999
26 22 E 40 N 5.2 07/1995
27 85 E 8 N 5.2 04/1981
28 103 E 6 S 5.1 10/2002
29 26 W 56 S 5.1 09/1977
30 2 W 80 N 5.0 03/2009
31 95 W 3 N 5.0 12/1989
32 76 W 4 N 5.0 03/2005
33 13 W 18 S 5.0 07/1979
34 129 W 49 N 4.9 03/2005
35 145 E 12 N 4.7 09/1990
36 117 E 50 S 4.5 05/2007
37 122 E 0.5 S 4.4 12/1999
38 46 E 12 N 4.3 08/1980
� �
�
�
�
�
�
�
�
�
�
�
�
�
�
�
�
�
� � � � � ��
�
� � � �
� � � � � � � � � �
� �� �� � � �� � � � �
� � � �� � � �
� � � � �
� � � �� � � �
� � � � �
� � � �� � � � � � �
� � � � �
� �� �� � � � � � �� � � � �
� � � �� � � � �
� � � � � � � � � �
� �� �� � �
�
� � � � �� � � �
� �
� � �� �� � �
� � � � �
� � � � � �
� � � � � �� �
� � � � � �� �
�
17
Q P
C
B
A
K
L
M
I
H
EF
G15
N13
12
11
23
24
5 7
98
4
6
3
2
1
25
20
1819
26
16
O
14J
D
22
10
21
Map Adapted From:
WORLD MAPName:Date: