earth summit 2012 v3
TRANSCRIPT

nZ
EARTH SUMMIT
201120

May 2012
ConTEnTSForeword 03
At a glance 05
Introduction 06
CHApTER 1 Greenhouse Gas Emissions 08
CHApTER 2 Water Quality 12
CHApTER 3 Education for Sustainability 16
CHApTER 4 Biodiversity: Land 20
CHApTER 5 Biodiversity: Marine 24
CHApTER 6 Fisheries 28
ConClUSIonS 32
REFEREnCES 34
Beyond Rio: New Zealand’s environmental record since the original Earth Summit 3
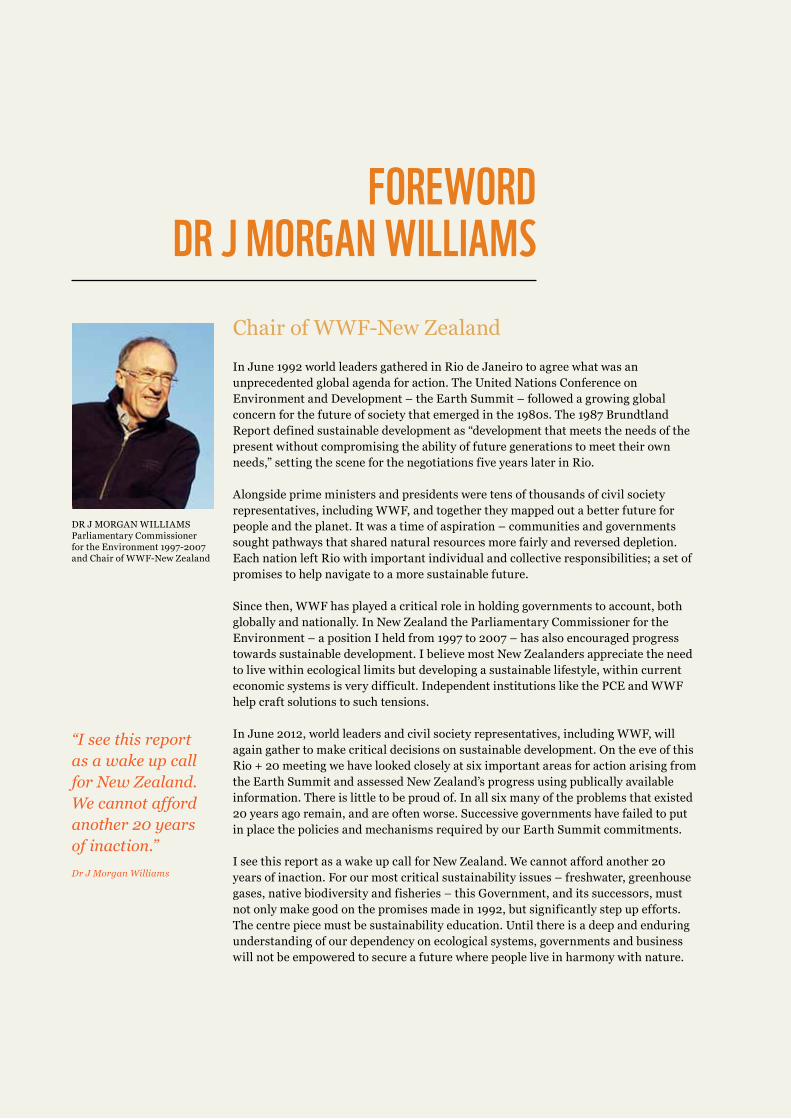
Chair of WWF-New Zealand
In June 1992 world leaders gathered in Rio de Janeiro to agree what was an unprecedented global agenda for action. The United Nations Conference on Environment and Development – the Earth Summit – followed a growing global concern for the future of society that emerged in the 1980s. The 1987 Brundtland Report defined sustainable development as “development that meets the needs of the present without compromising the ability of future generations to meet their own needs,” setting the scene for the negotiations five years later in Rio.
Alongside prime ministers and presidents were tens of thousands of civil society representatives, including WWF, and together they mapped out a better future for people and the planet. It was a time of aspiration – communities and governments sought pathways that shared natural resources more fairly and reversed depletion. Each nation left Rio with important individual and collective responsibilities; a set of promises to help navigate to a more sustainable future.
Since then, WWF has played a critical role in holding governments to account, both globally and nationally. In New Zealand the Parliamentary Commissioner for the Environment – a position I held from 1997 to 2007 – has also encouraged progress towards sustainable development. I believe most New Zealanders appreciate the need to live within ecological limits but developing a sustainable lifestyle, within current economic systems is very difficult. Independent institutions like the PCE and WWF help craft solutions to such tensions. In June 2012, world leaders and civil society representatives, including WWF, will again gather to make critical decisions on sustainable development. On the eve of this Rio + 20 meeting we have looked closely at six important areas for action arising from the Earth Summit and assessed New Zealand’s progress using publically available information. There is little to be proud of. In all six many of the problems that existed 20 years ago remain, and are often worse. Successive governments have failed to put in place the policies and mechanisms required by our Earth Summit commitments.
I see this report as a wake up call for New Zealand. We cannot afford another 20 years of inaction. For our most critical sustainability issues – freshwater, greenhouse gases, native biodiversity and fisheries – this Government, and its successors, must not only make good on the promises made in 1992, but significantly step up efforts. The centre piece must be sustainability education. Until there is a deep and enduring understanding of our dependency on ecological systems, governments and business will not be empowered to secure a future where people live in harmony with nature.
FoREwoRd dR J MoRgAn wIllIAMS
DR J MORGAN WILLIAMSParliamentary Commissioner for the Environment 1997-2007 and Chair of WWF-New Zealand
“I see this report as a wake up call for New Zealand. We cannot afford another 20 years of inaction.”Dr J Morgan Williams
4 Beyond Rio: New Zealand’s environmental record since the original Earth Summit
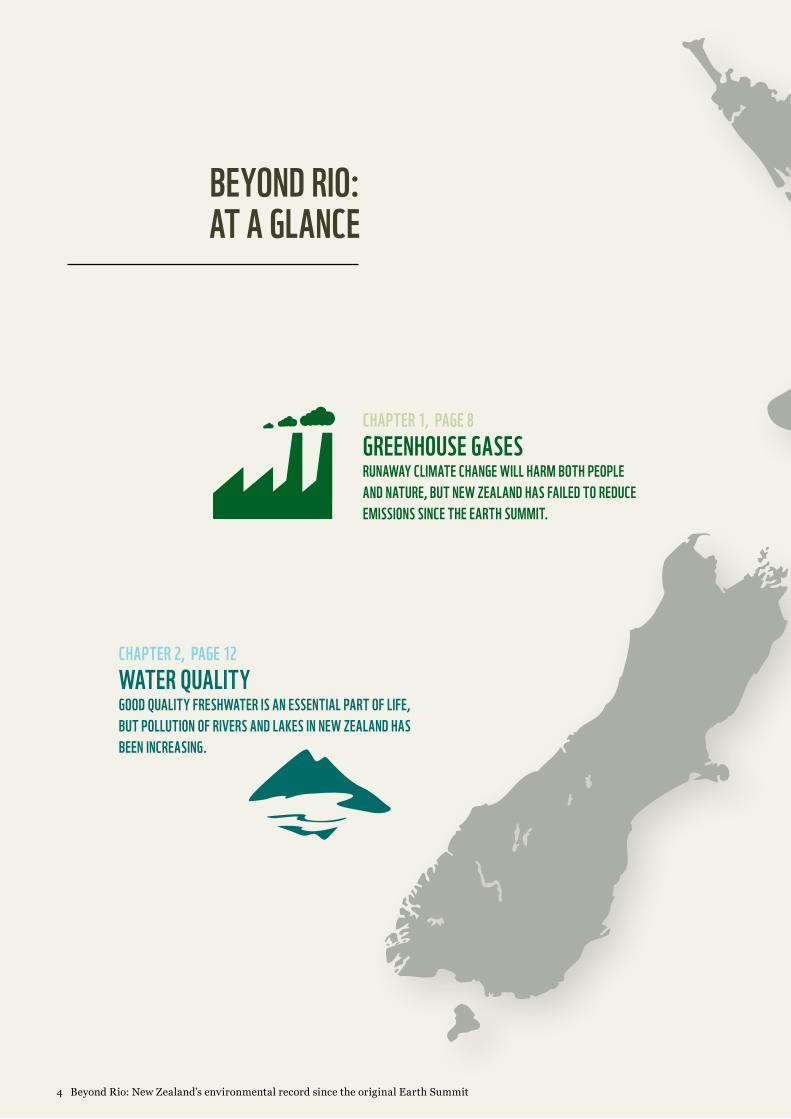
BEyond RIo: AT A glAnCE
CHApTER 1, pAgE 8 gREEnHoUSE gASESRUnAwAy ClIMATE CHAngE wIll HARM BoTH pEoplE And nATURE, BUT nEw ZEAlAnd HAS FAIlEd To REdUCE EMISSIonS SInCE THE EARTH SUMMIT.
CHApTER 2, pAgE 12 wATER QUAlITygood QUAlITy FRESHwATER IS An ESSEnTIAl pART oF lIFE, BUT pollUTIon oF RIvERS And lAkES In nEw ZEAlAnd HAS BEEn InCREASIng.

Beyond Rio: New Zealand’s environmental record since the original Earth Summit 5
CHApTER 4, pAgE 20BIodIvERSITy: lAndnEw ZEAlAnd IS HoME To A HIgH pRopoRTIon oF SpECIES FoUnd nowHERE ElSE In THE woRld, yET THE nUMBER oF THREATEnEd SpECIES ConTInUES To RISE.
CHApTER 3, pAgE 16EdUCATIon FoR SUSTAInABIlITySUSTAInABIlITy EdUCATIon IS CRITICAl To pRoTECTIng THE EnvIRonMEnT. AFTER SoME pRogRESS In THE EARly 2000s, ARE wE STIll MAkIng THE gRAdE?
CHApTER 6, pAgE 28FISHERIESnEw ZEAlAnd USEd To lEAd THE woRld on FISHERIES MAnAgEMEnT BUT ARE wE now USIng BEST pRACTICE In MAnAgIng oUR FISH SToCkS And REdUCIng THE IMpACTS oF FISHIng?
CHApTER 5, pAgE 24BIodIvERSITy: MARInEoUR MARInE EnvIRonMEnT IS HUgE And oUR oCEAnS TEEM wITH lIFE, BUT THE FUTURE FoR SEvERAl IMpoRTAnT MARInE MAMMAlS lookS BlEAk.

6 Beyond Rio: New Zealand’s environmental record since the original Earth Summit
Twenty years on from the original 1992 United Nations Conference on Environment and Development held in Rio de Janeiro, world leaders will be returning to Brazil’s largest city on 20-22 June 2012 for a major international meeting on sustainable development.
At the original Earth Summit, 178 governments agreed to: the Rio Declaration, a set of 27 Sustainable Development ‘principles’; Agenda 21, a massive 40 chapter Action Plan to achieve sustainable development; and a Statement of Forest Principles. The Summit also saw two new conventions opened for signatories: The United Nations Framework Convention on Climate Change and the United Nations Convention on Biological Diversity.
Taken together, these documents were recognition both of the need to radically improve people’s well-being in many countries of the world and of the need for major changes to production and consumption patterns due to the massive adverse impact humans are having on the planet.
A decade later, in 2002, governments once again gathered, this time in Johannesburg, and once again committed to achieving sustainable development. Although some progress had been made on reducing poverty (mainly due to rapid economic expansion in China) massive inequalities still existed and the environmental crisis had, if anything, become more severe. An implementation plan was agreed that was intended to provide more specifics on how governments would make good on the promises made in Rio.
Another ten years on, and governments are back in Rio for another major international conference on sustainable development. The question is: 20 years after the original Earth Summit, what has been achieved? In this report, WWF-New Zealand experts in marine and terrestrial conservation, climate change and education, along with a guest chapter by a leading authority on water quality, seek to answer that question. What follows is an assessment of whether New Zealand has made good on the key promises it made at Rio and Johannesburg and, importantly, looks at the prospects for the future.
InTRodUCTIon

Beyond Rio: New Zealand’s environmental record since the original Earth Summit 7
Last call to action. WWF’s light message to world leaders on the night the world leaders arrived at the World Summit of Sustainable Development in Johannesburg, 2002 (Rio + 10).
© C
hR
IS MA
RA
IS / WW
F-CA
NO
N

8 Beyond Rio: New Zealand’s environmental record since the original Earth Summit
By Peter hardstaff, Climate Change Programme Manager, WWF-New Zealand
The Issue
Responding to climate change is arguably the biggest challenge we face over the coming decades. Rising concentrations of greenhouse gases in the atmosphere - caused primarily by burning fossil fuels, cutting down forests and expanding ever more intensive agriculture - are trapping more heat and leading to a rising average global temperature. Without action to drastically cut greenhouse gas emissions and limit this temperature increase, humanity and many other species face potential disaster as ice sheets melt, the sea level rises and weather becomes more extreme.
Promises made 20 years ago at the Rio Earth Summit
The problem of global warming has been recognised for decades. The original Rio Earth Summit in 1992 saw the United Nations Framework Convention on Climate Change (UNFCCC) open for signatories. This convention amounted to an official recognition that climate change is a major global issue requiring governments to act.
New Zealand signed the UNFCCC on the first day of the Earth Summit, 4 June 1992. In signing and subsequently ratifying the UNFCCC, the New Zealand Government committed to “Stabilization of greenhouse gas concentrations in the atmosphere at a level that would prevent dangerous anthropogenic interference with the climate system.” 1
In Article 4 of the Convention, New Zealand also committed to “Adopt national policies and take corresponding measures on the mitigation of climate change, by limiting its anthropogenic emissions of greenhouse gases and protecting and enhancing its greenhouse gas sinks and reservoirs. These policies and measures will demonstrate that developed countries are taking the lead.” 2
Promises made at Rio +10 in Johannesburg 2002
At the Rio+10 conference in Johannesburg in 2002, governments, including New Zealand, reaffirmed their commitment to achieving the objectives of the UNFCCC. 3 They also made specific pledges on issues such as transport, for example committing to “Implement transport strategies for sustainable development…so as to improve the affordability, efficiency and convenience of transportation, as well as improving urban air quality and health, and reduce greenhouse gas emissions.” 4
Progress in New Zealand: 1992 - 2012
After the pledge made by New Zealand in 1992 to “adopt national policies and take corresponding measures on the mitigation of climate change”, no significant policies or measures were introduced for a further 14 years and the country’s greenhouse gas emissions continued to increase.
gREEnHoUSE gAS EMISSIonS

Beyond Rio: New Zealand’s environmental record since the original Earth Summit 9
New Zealand Greenhouse Gas Emissions, 1992 - 20125
The fact that emissions flattened off after 2007 is mainly due to a major drought affecting agriculture and then the subsequent recession.
Following years of debate and prevarication over whether to introduce a carbon tax, an Emissions Trading Scheme (ETS), or neither, an ETS was finally enacted in 2008. The already modest scheme was further weakened in 2009 so has had a very limited impact on emissions. In summary, in the 20 years since the Earth Summit and signing the Framework Convention on Climate Change, New Zealand has clearly failed to set emissions on a downward trajectory.
An obvious example of New Zealand’s lack of action is in the transport sector. As the graph below shows, despite the commitment made at Johannesburg in 2002 to reduce emissions from transport, New Zealand’s transport emissions have continued to climb, except for during the recent recession and oil price spike. Transport emissions are projected to continue climbing between now and 2020, although this increase is likely to be affected by ongoing fluctuations in oil prices.
New Zealand Transport Emissions, 1992 - 20206
0
10000
20000
30000
40000
50000
60000
70000
80000
90000
1992
1993
1994
1995
1997
1998
1999
2001
200
0
20
02
2003
200
4
200
5
200
6
200
7
200
8
200
9
2010
2011
2012
1996
Net Emissions
Y E A R
Gross Emissions
Gg
CO
2 E
qu
ival
ent
0
2000
4000
6000
8000
10000
12000
14000
16000
18000
1992
1994
1996
1998
200
0
200
2
200
6
200
8
2010
2012
2014
2018
2020
2016
200
4
Y E A R
Gg
CO
2 E
qu
ival
ent
10% AMoUnT nZ’S gRoSS EMISSIonS CoUld RISE By IF plAnS To ConvERT lIgnITE InTo UREA And dIESEl gET THE gREEn lIgHT
Projected

10 Beyond Rio: New Zealand’s environmental record since the original Earth Summit
Emissions have also steadily increased in other major sectors such as agriculture, which accounts for around half of New Zealand’s total emissions, and industry. 7 In the electricity sector, after increasing by almost 81 per cent between 1992 and 2005, due to an expansion in coal and gas-fired generation, by 2010 emissions had dropped back closer to their 1992 level but were still 7.5 per cent higher. 8
Prospects in New Zealand: Beyond 2012
After the Emissions Trading Scheme was further watered-down in 2009, WWF-New Zealand called it “a complicated, expensive and bureaucratic way of achieving very little.” The ultimate proof of the efficacy of the ETS and other government policies is whether they will set emissions on a downward trajectory and whether the rate of reduction is in line with what the best science tells us is necessary.
New Zealand Projected Emissions “With Measures” up to 2020 9
The graph above shows emissions since 1992 and the Government’s own projection of emissions up to 2020, including the impact of the ETS. The period beyond 2012 shows a modest increase in ‘gross emissions’ (i.e. excluding CO2 absorbed by, and released from, forestry and other land use changes) and a large increase in ‘net emissions’ (i.e. including forestry and other land use change).
The ‘net emissions’ line is bound to fluctuate significantly over time due to the structure of New Zealand’s plantation forests estate. The most important of these two lines therefore is ‘gross emissions’ because this tells us whether New Zealand is making the transition towards being a low carbon economy across the different sectors of energy, transport, industry and agriculture.
In light of current policy directions, including expanding oil drilling,10 a major road building programme,11 facilitating the expansion of dairy farming 12 and encouraging the exploitation of lignite, 13 the dirtiest form of coal, it is likely that the ‘gross emissions’ projection above could turn out to be highly optimistic. For example, the proposed industrial facilities to convert lignite into urea and diesel could alone increase New Zealand’s gross emissions by 10 per cent beyond the projection shown above.14 Since the above projection was done, the Government has also proposed further weakening the ETS. 15 The only positive sign in an otherwise bleak picture is that both wind and geothermal electricity are currently cost-competitive compared to coal and gas, so renewable electricity generation is expanding.
0
1992
Y E A R
Gg
CO
2 E
qu
ival
ent
Net Emissions
Gross Emissions
10000
20000
30000
40000
50000
60000
70000
80000
90000
1994
1996
1998
200
0
200
2
200
6
200
8
2010
2012
2014
2018
2020
2016
200
4
Projected

Beyond Rio: New Zealand’s environmental record since the original Earth Summit 11
New Zealand, along with other nations, made a commitment in 2010 to draw up a low carbon development plan. 16 The New Zealand Government has since reneged on this commitment, claiming it was not a binding promise. In contrast, other countries including Brazil, Germany, Mexico, Scotland, South Africa and the UK have moved ahead in developing their strategies and plans for achieving low carbon economies.17
New Zealand’s position in the international negotiations is also cause for concern. WWF’s detailed analysis of the Government’s position on carbon accounting strongly suggests that the intention is to create a system of calculating emissions reduction commitments up to 2020 that will enable New Zealand to continue with business as usual – which means steadily rising emissions rather than emissions reductions.18 This stands in stark contrast to the science which tells us our emissions need to peak by around 2015 19 and be reduced by at least 80 per cent by 2050.20
The absence of concerted action to set emissions on a downward path and kick-start the transition towards a low carbon economy suggests New Zealand has no intention of making good on the promises first made 20 years ago. This is not only contributing to the climate crisis, it is also ultimately a damaging strategy for the New Zealand economy.
There are huge potential gains from pursuing low carbon development including a more secure domestic energy supply, reduced pollution and improved health, reinforcing the clean green reputation of existing industries and tapping into the massive, and rapidly growing, global market for clean technologies.21 Also, the sooner we start making this transition, the cheaper it will be economically, and the smoother it will be socially.
As a first step, WWF urges the government to create a low carbon development plan that can help direct action across different sectors of the economy and society and provide a safer, more secure future for New Zealanders.

12 Beyond Rio: New Zealand’s environmental record since the original Earth Summit
Guest chapter by Dr Mike Joy, Senior Lecturer, Freshwater Ecology, Massey University
The Issue
Water is life. human beings cannot survive without access to clean water and water is an integral and essential part of the natural world that surrounds us. In New Zealand, our freshwater environment – lakes and rivers – is critical for biological diversity, is an important part of our cultural and natural heritage and is widely used for leisure, electricity generation, agriculture and domestic water supply.
however, human beings are having a massive impact on the freshwater environment both in terms of abstracting water to use and in terms of the pollution we dump into lakes and rivers. The issue has affected every country in the world, including ‘clean green’ New Zealand.
Promises made 20 years ago at the Rio Earth Summit
The importance of the freshwater environment was recognised in Chapter 18 of Agenda 21. In this document, amongst other things, governments agreed to “[maintain] ecosystem integrity, according to a management principle of preserving aquatic ecosystems, including living resources, and of effectively protecting them from any form of degradation on a drainage basin basis.”
The ‘polluter pays principle’ was also enshrined in Principle 16 of the Rio Declaration.22
Promises made at Rio +10 in Johannesburg 2002
In the Johannesburg Plan of Implementation, New Zealand signed up to the following commitments:
“To reverse the current trend in natural resource degradation as soon as possible, it is necessary to implement strategies…to protect ecosystems and to achieve integrated management of land, water and living resources.” 23
“Intensify water pollution prevention to reduce health hazards and protect ecosystems by introducing technologies for affordable sanitation and industrial and domestic wastewater treatment, by mitigating the effects of groundwater contamination, and by establishing, at the national level, monitoring systems and effective legal frameworks.” 24
Progress in New Zealand: 1992 - 2012
Analysis of New Zealand’s national water quality monitoring network data reveals significant declines in almost all measured water quality parameters over the last 20 years.25 A 2004 study of more than 300 lowland waterways revealed that 96 per cent of them in pastoral catchments and all in urban catchments failed the pathogen standard for contact recreation. More than eighty per cent of the sites in pasture catchments exceeded guideline levels for phosphorous and nitrogen.26 Forty-three per cent of monitored lakes in New Zealand are now classed as polluted27
and groundwater nitrate levels are rising as well with 39 per cent of monitored sites nationally showing increases.28 human health is also directly impacted with an estimated 18,000 – 34,000 people annually contracting waterborne diseases.29
The commitment made at Rio to “maintain ecosystem integrity” has clearly not been
wATER QUAlITy

Beyond Rio: New Zealand’s environmental record since the original Earth Summit 13
met when it comes to the freshwater environment. Alongside pollution data, perhaps the starkest evidence of the decline in freshwater ecosystem integrity is the increasing number of threatened freshwater fish species. More than sixty per cent of New Zealand’s native freshwater fish as well as the only freshwater crayfish and mussel species are now listed as threatened with extinction.30 These native fish communities are effectively the ‘canaries in the coalmine’ of freshwater ecosystems and their decline reveals failures to protect freshwater ecosystems over the last 20 years.
Per centage of New Zealand Native Freshwater Fish Species listed as Threatened
A recent analysis of data on the distribution of native fish in New Zealand31 showed declines in native fish populations accelerating in the last 20 years. A robust and internationally used measure of the health of freshwater ecosystems is the Index of Biotic Integrity (IBI)32 and it has been applied to a large database of freshwater fish distribution collected throughout New Zealand over the last 40 years. A trend analysis of these IBI scores clearly shows the decline in fish communities at all land-use types in New Zealand over the last 4 decades but particularly since 1990.
New Zealand Average Fish IBI Scores over all Land-cover Types, Last 4 Decades
Note: Number in bars is the number of sites from the New Zealand freshwater fish database.
26
1970s
1142
1980s
4598
1990s
7415
2000s
9390
D E C A D E
28
30
32
34
36
38
A ll landcover classes
IBI
Sco
re
0
1992 2002 2005 2010
Y E A R
10
20
30
40
50
60
70
Per
cen
tage

14 Beyond Rio: New Zealand’s environmental record since the original Earth Summit
The declines in fish communities reflecting poor ecosystem health are even more obvious at freshwater sites in pasture catchments.
Average Fish IBI Scores at Pasture Catchment Sites, Last 4 Decades
These declines in the health of freshwaters are for the most part related to agricultural impacts; excess sediment, phosphorous and nitrogen as well as faecal pathogens.33 The major driver of the deterioration in the health of New Zealand’s lakes, groundwater, rivers and streams is agricultural expansion and intensification, mainly in the dairy sector.34 Put simply, more cows have meant more nutrient and pathogen pollution of waterways.
Across the whole country, the number of dairy cows increased by over two million between 1992 and 2011 – an 86 per cent expansion. During the same period, average dairy herd size in New Zealand more than doubled from 169 to 386.35 Looking at a specific area, between 1990 and 2002 the number of cows in the Waikato River catchment increased by 37 per cent and over that period nitrogen levels in the river increased by 40 per cent and phosphorus by 25 per cent.36
The intensity of dairy farming has also increased with stocking rates reaching a peak in the year 2009/10, almost 20 per cent above 1990/91 levels.37 These stocking rates are achieved by increasing use of ‘off-farm’ feed supplements like palm kernel and fossil fuel derived nitrogenous fertiliser and imported phosphate. Imports of palm kernel have shot up from virtually zero to 14 million tonnes in the space of the past 10 years, and the use of nitrogen fertiliser in New Zealand, according to the Ministry for the Environment, “has increased by about 10 times since 1985 and doubled since the mid-1990s.” 38
Contrary to Principle 16 of the Rio Declaration, to date there has not been a charge or even any attempt to internalise the costs of the pollution of freshwaters in New Zealand. The only cost for ‘out of pipe’ (point source) polluters is a one-off ‘consent fee’ which is essentially an administration charge required by Regional Councils. The problem though is that for freshwaters the biggest pollution source in New Zealand does not come out of a pipe, it is diffuse and this pollution is not controlled at all.
The only exception to this has been in the Lake Taupo catchment where dairy farms make up only 18 per cent of the catchment but contribute 90 per cent of the nitrogen load to the lake. Recently, in order to protect lake water quality, farm intensification has been reduced by means of a cap on nitrogen fertiliser.
26
1970s
384
1980s
2087
1990s
3075
2000s
4390
D E C A D E
28
30
IBI
Sco
re
34
36
38
Pasture

Beyond Rio: New Zealand’s environmental record since the original Earth Summit 15
43% MonIToREd lAkES In nEw ZEAlAnd THAT ARE now ClASSEd AS pollUTEd
Prospects in New Zealand: Beyond 2012
The Government’s response to the issues set out above has been to draw up a National Policy Statement (NPS) on freshwater to influence local and regional council decision-making. While the freshwater NPS is considered by many to be a modest step forward it is also too weak to address the problem.39 There is also currently a voluntary scheme in operation – the Clean Streams Accord 40 - and although this scheme has made some progress in areas such as farm nutrient budgeting, it lacks robust monitoring and enforcement so is not likely to deliver a significant reduction in pollution.
Ultimately, without significant further action from both central and local government, the future prospects for freshwater health in New Zealand look bleak. Limits need to be set on how much pollution our rivers can handle and local, regional and national policies set in place so that these limits are not exceeded.
A precedent for reducing pollution has now been set by the ‘cap and trade’ scheme limiting nutrient use to protect Lake Taupo. Thus, a template is now available for that process to be adopted nationally. Another potentially positive change is the agreements made to protect and improve the health of the Waikato River resulting from a claim over the river taken to the Waitangi Tribunal by Tainui-Raupatu. Under this co-management agreement41 Tainui-Raupatu’s vision and strategy for cleaning up the Waikato River has been legislated, including the objective: “restoration of water quality within the Waikato River so that it is safe for people to swim in and take food from over its entire length”. If steps are taken to deliver this objective and reduce pollution it could offer another example of a way forward.
New Zealand faces an unprecedented freshwater crisis. This stands in stark contrast to the ideals and goals endorsed in the Rio Declaration and subsequent agreements. The hands-off approach of the New Zealand Government over the last 20 years has lead to a major overshoot of the carrying capacity of New Zealand’s soils and water. There is a way out of the crisis but it requires full acknowledgement of the causes, setting limits on pollution and policies to ensure those limits are not exceeded.

16 Beyond Rio: New Zealand’s environmental record since the original Earth Summit
By Wendy Barry, Education Programme Manager, WWF-New Zealand
The Issue
Education for sustainability is a positive response to the global challenge of how to live life well today without compromising the ability of future generations to do the same. It’s a dynamic, student centred, action-oriented approach to teaching and learning that brings together the social, economic and environmental aspects of sustainability. In order to achieve the massive social shift that is required to ensure we live within the Earth’s capacity to sustain life, education for sustainability must be central to all learning from early childhood through to tertiary level and also in non-formal education.
Promises made 20 years ago at the Earth Summit
In 1992 New Zealand became a signatory to the Earth Summit’s Agenda 21. While all 40 chapters of Agenda 21 call for education, Chapter 36 specifically focuses on the issue, stating:
“Education is critical for achieving environmental and ethical awareness, values and attitudes, skills and behaviour consistent with sustainable development and for effective public participation in decision-making. Both formal and non-formal education are indispensable to… sustainable development.” 42
Chapter 36 established broad proposals to “reorient education towards sustainable development, increase public awareness and promote training” and provided clear directions for developed countries like New Zealand, including:
• Integrating environmental and development concepts into all educational programmes
• Making environmental and development education available to people of all ages
• Involving schoolchildren in studies on environmental health, including safe drinking water, sanitation, food and the various impacts of resource use
• Strengthening existing advisory bodies or establishing new ones for public environment and development information
• Making better use of advertising and entertainment methods to shape public behaviour and consumption patterns.43
Following the Earth Summit, UNESCO became the Task Manager for Chapter 36 of Agenda 21. UNESCO clarified the concept and key messages of ‘education for sustainable development.’ 44 In 1992 they commented that:
“…UNESCO, and the international community in general, believe that we need to foster – through education – the values, behaviour and lifestyles required for a sustainable future… Sustainable development involves learning how to make decisions that consider the long term future of the economy, ecology and well-being of all communities. Building the capacity for such futures-oriented thinking is a key task of education.” 45
EdUCATIon FoR SUSTAInABIlITy
94% pRopoRTIon oF nEw ZEAlAndERS wHo THInk All SCHoolS SHoUld InClUdE THE IMpoRTAnCE oF CARIng FoR THE nATURAl EnvIRonMEnT And lIvIng In A wAy THAT pRESERvES IT FoR THE FUTURE

Beyond Rio: New Zealand’s environmental record since the original Earth Summit 17
Promises made at Rio +10 in Johannesburg 2002
The New Zealand Government reaffirmed its commitment to “the full implementation of Agenda 21” at Rio +10.46
New Zealand also agreed to “integrate sustainable development into education systems at all levels of education in order to promote education as a key agent for change.” 47
To emphasise the importance of education for sustainability, the World Summit Implementation Plan recommended the United Nations General Assembly adopt a Decade of Education for Sustainable Development. Members of the United Nations, including New Zealand, subsequently agreed to this decade starting in 2005 and with UNESCO as the lead agency. 48
Progress 1992-2012
With a well functioning state education sector and a culture of connection to the natural environment, on the face of it New Zealand had a head start on sustainability education. however, it was another six years after Rio before the New Zealand Government released ‘Learning to Care for Our Environment: a national strategy for environmental education’ in 1998. This strategy established a set of priorities, including:
• Incorporating the aims of environmental education across the school curriculum
• Enhancing the capacity of tangata whenua in environmental education
• Promoting environmental education in business education and training
• Providing individuals and communities with the information and understanding to enable them to make environmentally sound decisions.49
Government planned to monitor these priorities as part of its broader ‘Environment 2010’ strategy that was released in 1995. however, this monitoring never happened.
Another six years after the ‘Learning to Care’ strategy was released, the Parliamentary Commissioner for the Environment conducted an independent review of education for sustainability in New Zealand in 2004.50 The Commissioner was broadly critical of progress to date, finding that various goals and strategies were in place, although sometimes outdated, but action, coordination and commitment were lacking. The Commissioner found that local government had been more involved in environmental education than central government but funding and support were precarious. To date, environmental education was not a priority for central government in the formal education system.
These criticisms seemed to have some effect. In 2007 the Commissioner re-investigated progress made by Government since the 2004 report and found that sustainability now featured prominently in the Government’s priority areas, including a more prominent status for sustainability within the New Zealand Curriculum.51 The Commissioner also found that progress had been made in primary and secondary schools through a $13 million package of government spending over four years on Enviroschools, and Education for Sustainability advisory services for teachers in schools and kura. Other signs of progress included a central/local government partnership to deliver social marketing campaigns for water awareness and rubbish reduction and the introduction of the National Certificate of Educational Achievement (NCEA), which enabled new cross-curricula courses (including ‘Sustainable Futures’ classes) to be developed. Government was also developing a sustainability campaign to deliver on priorities for water, climate change and sustainable households.52
“To ACHIEvE THE MASSIvE SoCIAl SHIFT THAT IS REQUIREd To EnSURE wE lIvE wITHIn THE EARTH’S CApACITy To SUSTAIn lIFE, EdUCATIon FoR SUSTAInABIlITy MUST BE CEnTRAl To All lEARnIng”

18 Beyond Rio: New Zealand’s environmental record since the original Earth Summit
Wellington School children planting dune plants. 94 per cent of Kiwis think all schools should include the importance of caring for the natural environment and living in a way that preserves it for the future.
© D
hA
NSF
OR
D

Beyond Rio: New Zealand’s environmental record since the original Earth Summit 19
Unfortunately this momentum for positive change has not been maintained. Since 2008, central government has reduced its support for sustainability education, including:
• Ceasing funding of Education for Sustainability advisors for schools and kura
• Ceasing funding for Enviroschools
• A new strategy for Tertiary Education with no environmental priorities
• Abandoning the government programme of action for sustainability, with its associated plans for a sustainability campaign
Prospects in New Zealand: Beyond 2012
Education for sustainability has evolved considerably in New Zealand over the last two decades. Significant progress was made from 2004 to 2008 in particular to meet the commitments of the Earth Summit’s Agenda 21. The positive momentum that emerged during this period needs to be regained.
The New Zealand Government signed up to the United Nations Decade of Education for Sustainable Development in 2005. It has not yet delivered on its commitment to “integrate sustainable development into education systems at all levels of education in order to promote education as a key agent for change.” The government would need to do enormous work to meet the milestones of this decade, such as developing a clear action plan, strategies, indicators of progress, and mechanisms for monitoring performance.
In 2011, growing concern about Government’s dwindling commitments to education for sustainability led a group of environmental NGOs to identify priorities for the incoming government.53 These priorities include instigating a working group to explore emerging education models, providing support for sustainability teaching in schools, kura and early childhood centres and making sustainability a priority in tertiary education via the Tertiary Education Commission.
In direct contrast to recent budget cuts, the New Zealand Government has a strong public mandate to support education for sustainability. In 2011 WWF-New Zealand commissioned a Colmar Brunton survey of public attitudes towards environmental education. More than 9 out of 10 people (94 per cent) agreed that all schools—from early childhood to tertiary level—should include the importance of caring for the natural environment and living in a way that preserves it for the future.54 Although the 2012 Budget has now reinstated funding for the Enviroschools Programme, the Government is still falling short on delivering the commitments made 20 years ago. WWF New Zealand urges the Government to respond, not only to those commitments, but also to meet the wishes of the majority of New Zealanders.

20 Beyond Rio: New Zealand’s environmental record since the original Earth Summit
By Marc Slade, Terrestrial Conservation Programme Manager, and Lee Barry, Conservation Advocate, WWF-New Zealand
The Issue
Biodiversity is, literally, all life on Earth. It can be defined as the number and variety of living species in a particular area, region or the whole planet. It is the result of the complex interwoven relationships between animal and plant species, soils and climatic conditions.
The International Union for the Conservation of Nature (IUCN) estimates current rates of extinction are between 1,000 and 10,000 higher then they would naturally be without human pressures from land conversion, invasive species, unsustainable harvesting, pollution and overexploitation of resources.55 This loss of biodiversity is nothing short of a global crisis.
Promises made 20 years ago at the Rio Earth Summit
Recognising the global biodiversity crisis, in the run up to Rio governments negotiated the United Nations Convention on Biological Diversity (CBD) which opened for signatures at the Earth Summit. New Zealand was one of the first nations to sign up and make a clear commitment to “The conservation of biological diversity, the sustainable use of its components and the fair and equitable sharing of the benefits arising out of the utilization of genetic resources.” 56
Promises made at Rio +10 in Johannesburg 2002
At Rio +10, governments acknowledged the deepening biodiversity crisis, saying “biodiversity is currently being lost at unprecedented rates due to human activities” and, in the Johannesburg Plan of Implementation, committed to “the achievement by 2010 of a significant reduction in the current rate of loss of biological diversity.” 57
Of particular relevance to New Zealand, the government also committed to “Strengthen national, regional and international efforts to control invasive alien species, which are one of the main causes of biodiversity loss, and encourage the development of effective work programme on invasive alien species at all levels.” 58
Progress in New Zealand: 1992 – 2012
Prior to the original Earth Summit, New Zealand already had a poor record of native biodiversity loss with heavy modification of the landscape and dozens of species made extinct since human settlement, including 32 per cent of all endemic land and freshwater birds. 59 The main threats to New Zealand’s biodiversity remain the destruction of ecosystems – particularly for farming – and introduced animal and plant pests. 60
The New Zealand Biodiversity Strategy (NZBS) was developed in 2000 as a direct response to New Zealand ratifying the CBD in 1993, and to the first New Zealand Environment Report in 1997. This report stated that indigenous biodiversity decline was our “most pervasive environmental issue” with 1,000 known indigenous taxa
BIodIvERSITy: lAnd
>3,800 nZ TERRESTRIAl, FRESHwATER And MARInE SpECIES ARE lISTEd AS THREATEnEd

Beyond Rio: New Zealand’s environmental record since the original Earth Summit 21
(800 species, 200 sub-species) threatened with extinction.61 Consequently, a principal goal of the NZBS was to halt the decline in New Zealand’s indigenous biodiversity.
however, as the number of threatened species continues to climb, the strategy is falling short and neither this goal, nor the commitment made at Rio +10 is being achieved.
Some progress has been made since Rio on land protection. For example, the area of land that is legally protected has increased since 1997 with an increase of 14.5 per cent over a two year period between 2004-2006. The area of private land under legal protection through either QEII or Nga Whenua Rahui covenants increased by 51.4 per cent in the same two year period.63
Also positive is the fact that the land area under some form of predator control (mainly possum) increased by 60 per cent between 2000 and 2006.64
Sadly, these positive statistics sit along side worrying trends both for habitats and species. Despite New Zealand having the highest levels of native land protection in the OECD,65 habitats are still declining. Recent research shows that more than half (53 per cent) of acutely threatened habitats have suffered a net loss of indigenous vegetation cover between 1996/7 and 2001/2002. More than four-fifths (84 per cent) of this remaining indigenous cover is not legally protected. Most of these habitats are in coastal or lowland areas.66
Despite efforts to control introduced species, indigenous wildlife continues to decline. As of the 2008/11 Threat Classification List, over 3,800 terrestrial, freshwater and marine species are listed as threatened, a dramatically worsening trend since the 1990s.67
One of the national indicators used to assess biodiversity status in New Zealand is a range of 10 selected indicator species, seven of which are threatened. In the 2007 Environment New Zealand report, six of the seven threatened indicator species have shown a continuing decline in their range since 1970.
1997 2002 2005 2008 / 11
Y E A R
No. of New Zealand Species Threatened and At Risk68
0
Tax
a th
reat
ened
an
d a
t ri
sk
500
1000
1500
2000
2500
3000
3500
4000

22 Beyond Rio: New Zealand’s environmental record since the original Earth Summit
Other species have also fared badly including 13 bird species (such as the banded dotterel and New Zealand pipit) and two species of skink whose status has worsened since 2005. 70, 71
There has been an increase in the number of plants72 listed as ‘Threatened’ (from 122 to 180) and ‘At Risk’ (from 499 to 651), partly due to changes in the threat classification system, but also due to the worsening situation of many indigenous plants in New Zealand.73
Not all native species have declined, however, and some more common native birds have shown an increase, especially in areas where councils are undertaking extensive pest control and community groups and individuals are planting increasing numbers of native plants. Tui, bellbird/korimako and kereru are amongst the 27 native species that have shown an increase in distribution. Some of the native species that have increased are those that benefit from the creation of more open habitat caused by human land-use. Despite the number of species increasing their distribution the same number, 27, have decreased their distribution – the majority of these (93 per cent) being endemic to New Zealand. 74
Prospects in New Zealand: Beyond 2012
The most recent Briefing to the Incoming Minister by the Department of Conservation issued in 2011 states:
“While biodiversity protection and recovery is being achieved in areas under intensive management, the overall trend outside of these areas is that biodiversity is declining and ecosystem services are being reduced.
“On public conservation land, possums, rats and stoats devastate forests, plants and native species...Without active management, many of our iconic species cannot survive in the wild and are in danger of extinction. Many other native bird species are also vulnerable to declines.” 75
The outlook for native biodiversity is therefore not good. Of particular concern is loss of rare and threatened lowland habitats not currently represented in the protected areas network, including wetlands and swamp forest (only 10 per cent of their original area remains) and dune systems. Also worrying is the continuing decline of native biodiversity due to invasive pests and land use change (usually urbanisation or agricultural expansion).
Indicator Species Contraction in range since 1970s
Contraction in pre-human range
Lesser Short tailed bat -25% -95%
Kiwi (5 species, bird) -20% -83%
Kaka (bird) -6% -80%
Kokako (bird) -90% -98%
Mohua (bird) -70% -95%
Wrybill (bird) Data unavailable -40%
Dactylanthus taylorii (flowering plant) -32% -96%
Threatened “Indicator” Species in NZ, 200769

Beyond Rio: New Zealand’s environmental record since the original Earth Summit 23
If we are serious as a nation about stemming the decline of biodiversity and delivering on the promises made in Rio, something has to change; current approaches are failing to adequately protect many of our animal and plant species from invasive species and habitat loss.
We need a more representative network of protected areas and we must ensure they are properly managed to restore their function. Clearly we need further investment in eradicating invasive species. We also need to think outside protected areas at a larger, landscape scale, restoring healthy ecosystems and connecting habitats. This means building a new approach to conservation and land management policy that creates a living landscape that makes space for nature as well as accommodating people’s sustainable livelihoods.

24 Beyond Rio: New Zealand’s environmental record since the original Earth Summit
By Rebecca Bird, Marine Programme Manager, WWF-New Zealand
The Issue
From the poles to the tropics, the marine environment teams with life. At one time it would have been unthinkable that human beings could have a major impact on the world’s vast oceans but this is now a reality.
Despite their beauty and importance, marine ecosystems the world over face a range of threats from over-fishing to pollution and unless we can mitigate these threats the marine environment will continue to degrade, possibly beyond its ability to regenerate. With a vast marine area – the fifth largest in the world – New Zealand has a major responsibility to take action.
Promises made 20 years ago at the Rio Earth Summit
Alongside the Convention on Biological Diversity (CBD), the original Earth Summit specifically recognised the importance of the marine environment. In signing up to Agenda 21, the New Zealand Government committed to Chapter 17, addressing sustainable development in the marine environment through, amongst other things, marine environmental protection, and sustainable use and conservation of marine living resources. 76
Promises made at Rio +10 in Johannesburg 2002
Ten years after the original Earth Summit, alarm was expressed over continuing biodiversity loss and governments once again committed to take action. Beyond the broader pledge to achieve a significant reduction in the rate of biodiversity loss by 2010, New Zealand also made specific pledges about protecting and managing the marine environment, including: 77
• Maintaining the productivity and biodiversity of important and vulnerable marine and coastal areas
• Elimination of destructive fishing practices and the establishment of marine protected area networks by 2012
• Making every effort to protect the marine environment from land-based activities
• Improving the scientific understanding and assessment of marine and coastal ecosystems
Progress in New Zealand: 1992–2012
New Zealand’s marine area is 20 times greater than its land - more than 5.7 million square kilometres.78 These waters hold an estimated 65,000 species, many of which are not yet known to science, and 44 per cent of which are thought to be found nowhere else in the world.79 Scientists estimate that as much as 80 per cent of New Zealand’s native biodiversity may be in the sea.80 The imperative for New Zealand to make good on promises to conserve its marine environment is clear.
Some progress has been made on Marine Protected Areas (MPAs). The area of marine reserves grew by 67 per cent between 1995 and 2007, although this was largely due to the 2003 creation of the 498,000-hectare Auckland Island marine reserve.81 As
BIodIvERSITy: MARInE

Beyond Rio: New Zealand’s environmental record since the original Earth Summit 25
at February 2012, the total area covered by 33 marine reserves in New Zealand’s combined territorial sea and Exclusive Economic Zone (EEZ) was just over 0.3 per cent - or about 7 per cent of the territorial sea. Because most of these reserves are around the remote Auckland and Kermadec Islands - only 1 per cent of the territorial sea around mainland New Zealand has this high level of protection.82
Within the EEZ, a degree of protection has been achieved through closing 19 seamounts to bottom trawl fishing techniques in 2000, and the subsequent closure in 2007 of 30 per cent of the EEZ (1.25 million square kilometres) to bottom trawl fishing (Benthic Protected Areas – BPAs).83 however, these BPAs were created as an ad hoc response to the problem and, as the fisheries section of this report explains, are flawed. Also, critically, BPAs do not provide adequate protection for the wider marine environment beyond the sea bed so cannot be seen as a substitute for full marine reserves.
New Zealand also has six marine mammal sanctuaries, covering 2,400 square kilometres.84 These sanctuaries are however insufficient to protect several endangered species.
In March 2012, the New Zealand Government announced that the population estimate for Maui’s dolphin had fallen since 2006 from 111 individuals to just 55 animals over the age of one year. The main cause of the Maui’s decline, and of its cousin Hector’s dolphin, is monofilament gillnets and trawl fishing. Protection measures implemented in 2008 have been a substantial improvement over previous protection for these dolphins, but are clearly insufficient to ensure the species’ recovery. 85 The extinction of Maui’s dolphins would be only the second disappearance of a whale or dolphin due to human influence since the 1800s.86
The New Zealand sea lion is one of the world’s rarest sea lion species. It breeds on the subantarctic Auckland and Campbell Islands. In 2010 it was classified as ‘nationally critical’, New Zealand’s highest threat category. Pup numbers at the Auckland Islands, their main breeding area, have declined by 50 per cent over the past 12 years.
New Zealand Sea Lion Pup Production Estimates from the Auckland Islands Rookeries Combined, 1997-2011 87
Bycatch from trawl fishing in one of New Zealand’s major squid fishing areas is the main known human-induced cause of sea lion mortality.88 Fisheries bycatch at current estimated levels at the Auckland Islands could result in that population becoming functionally extinct by 2035.89
1995
1997
1998
1999
2001
200
0
20
02
2003
200
4
200
5
200
6
200
7
200
8
200
9
2010
2011
1996
Y E A R
0
Pu
p p
rod
uct
ion
est
imat
es
500
1000
1500
2000
2500
3000
3500
JUST
55 MAUI’S
dolpHInS ovER onE yEAR old ARE
ESTIMATEd To REMAIn

26 Beyond Rio: New Zealand’s environmental record since the original Earth Summit
The southern right whale is classified as nationally endangered. They were once abundant throughout New Zealand’s EEZ but now fewer than 1,000 adults remain, primarily around the Auckland Islands. 90 While in general the population of southern right whales in the Southern Ocean has been making a slow recovery, this recovery hasn’t been apparent to the same extent around the New Zealand mainland.91
Almost two-thirds of New Zealand’s ocean-going seabirds 92 are listed as threatened with extinction. 93 Seven species were increasingly threatened during 2006–2009 – the most endangered are the Fiordland crested penguin and the New Zealand fairy tern. Over that same period, the Campbell albatross showed some signs of recovery.94 The population of black petrels has been declining at 1.4 per cent per year since 1995.95 Sixteen of the 22 acutely threatened species or subspecies, and eight of the 14 chronically threatened species breed only in New Zealand. 96
The main threats to seabirds are: 97
• Predation by introduced mammals (34 species)
• Fisheries related mortality (25 species)
• Human disturbance (15 species)
Overall, about 30 per cent of New Zealand’s marine environment is thought to be experiencing disturbance from human activities. Pressures are varied and, beyond commercial fishing, include pollution, sediment run-off, invasive species as well as climate change.98 While time series data is not always available on all of these issues, WWF-New Zealand believes there is evidence that these threats have increased, rather than declined, over the past 20 years.
Prospects in New Zealand: Beyond 2012
There is no doubt that successive New Zealand governments have implemented policies and enacted laws relating to the marine environment. Using the data available, there is also no doubt that, despite these laws and policies, many marine species continue to decline.
There is a very real prospect that Maui’s dolphins will become extinct over the next decade if urgent action to remove nets from their habitat is not taken. The prospects for New Zealand sea lions also look bleak, as well as the future for some species of seabird.
Twenty years after Rio there is still a lack of information, coordination and clear strategy. The need for integrated management of New Zealand’s complex marine environment was highlighted back in 1999 by the Parliamentary Commissioner for the Environment.99 In 2007, the OECD recommended that New Zealand “… finalise and implement the ocean policy and pursue the further expansion of marine reserves.” 100
This has not happened. Instead we now have an Exclusive Economic Zone Bill 101 passing through Parliament that does not promote sustainable management and environmental protection.102 The Government is encouraging the development of petroleum,103 minerals,104 aquaculture,105 and fisheries.106 This risks increasing the negative impacts of current activities as well as the potential impacts of deep-sea mining 107 and oil spills.108
At this time when Maui’s dolphins are on the very edge of extinction, symbolising to the world New Zealand’s failure to adequately protect our marine wildlife, the need for action is more urgent than ever. We need to reduce threats to marine biodiversity rather than increase them. We need to expand protected areas and develop a coordinated approach to sustainably managing our marine environment in order for species to recover and once again thrive. We need to deliver on the promises made two decades ago.

Beyond Rio: New Zealand’s environmental record since the original Earth Summit 27
NZ sea lion pups at Enderby Island, on the subantarctic Auckland Islands. Since 1998 the number of pups has halved, putting the population at risk of functional extinction by 2035.
© R
ICh
AR
D R
OB
INSO
N

28 Beyond Rio: New Zealand’s environmental record since the original Earth Summit
By Bob Zuur, Marine Advocate, WWF-New Zealand
The Issue
The world’s oceans are in crisis. Overfishing is rife in many parts of the globe and the ‘bycatch’ or accidental killing of wildlife such as sharks, seabirds and dolphins is having a devastating impact. Unless humanity adopts more sustainable fishing practices both the fish species that we catch and the complex ecosystems of which they are part will continue to decline, degrade or even disappear.
New Zealand is not immune to these problems and, as a major exporter of seafood, and with a special marine environment over which we have jurisdiction, it is imperative they are addressed.
Promises made 20 years ago at the Rio Earth Summit
The importance of fisheries was recognised at the original Earth Summit. Chapter 17 of Agenda 21 specifically addresses sustainable fisheries, through marine environmental protection and the sustainable use and conservation of marine living resources. 109 The Government also committed to the conservation and sustainable use of biological resources through the Convention on Biological Diversity (CBD).
Promises made at Rio +10 in Johannesburg 2002
At Rio +10, governments acknowledged the oceans’ crisis and the need for sustainable fisheries, making specific pledges including: 110
• By 2010, encourage the application of the ecosystem approach
• Maintain or restore fish stocks to levels that can produce the maximum sustainable yield (MSY) – for depleted stocks, no later than 2015
Progress in New Zealand: 1992 – 2012
Healthy fisheries are critical for New Zealand. Our seafood exports are worth in excess of $1.4 billion annually and we are about the 20th largest exporter of seafood.111 By the time of the first Earth Summit, New Zealand led the world in fisheries management through the creation of the Quota Management System (QMS) in 1986; a system of establishing and managing rights over specific fisheries through setting individually transferable quotas.
Although this system is still claimed by some to be world leading,112 and although independent research in 2008 ranked New Zealand’s fishery management regime eighth out of 53 countries assessed,113 a number of major problems exist with the QMS and fisheries management more broadly.
New Zealand’s total fish catch climbed during the 1990s to a peak of around 650,000 tonnes in 1998. It then dropped significantly due, in particular, to a drastic cut in the hoki fishery quotas in response to concerns about poor recruitment (breeding). The total catch is now at a similar level to the early 1990s. This highlights one of the concerns with the QMS: the quotas being set for many of our fisheries are not scientifically robust. The fact that five of the eight orange roughy stocks have collapsed (below 10 per cent of unfished levels) is a stark example of this problem. 114
FISHERIES

Beyond Rio: New Zealand’s environmental record since the original Earth Summit 29
More broadly, of the 119 fish stocks for which data has been collected, 37 are known to be below target levels (over-exploited). The proportion of over-exploited stocks more than doubled between 2006 and 2010.115
Stock Status for Fish Stocks Assessed Against Management Targets, 2006 - 2010 116
Another serious problem is the significant information deficit. We lack data for many of the fish stocks managed under the New Zealand QMS. According to 2010 Ministry of Fisheries analysis, there is sufficient data for only 119 of the 633 fish stocks within the QMS – so for 81 per cent of fish stocks, representing 34 per cent of fish caught by weight and value, the Government does not know whether they are being over-fished or not.
Therefore, the best that can be said with any degree of certainty for New Zealand’s QMS fisheries is that around 13 per cent of the stocks are known to be fished within limits that the New Zealand Government sets as acceptable, 6 per cent are known to be in trouble and for the other 81 per cent their status is unknown. In 2009, the Ministry of Fisheries said that this lack of data was due to “limited human and financial resources”.117 For an industry of such importance, and for a marine environment of such importance, the fact that we have not invested in finding out what is happening to the fish stocks representing a third of the total fish catch is a serious concern.
It is also critically important to recognise that the health of fish stocks is only one part of sustainable fisheries management. A significant limitation of the QMS is that it focuses solely on target species, with each stock managed in isolation from the other species in its environment. This focus on fish stocks and quota management means New Zealand is rapidly falling behind other fishing nations that have adopted best practice ecosystem-based management – an approach that takes into account the impacts of fishing on the wider marine environment.118
Target fish are not the only species that get killed in commercial fishing operations. Bycatch of albatross, petrels and other seabirds, as well as marine mammals such as sea lions and dolphins is a significant problem for some of New Zealand’s fisheries.
0%
2006 2007 2008 2009 2010
10%
20%
30%
40%
50%
60%
70%
80%
90%
100%
% of stocks assessed to be at or above target level
% of stocks assessed to be at or below target level
THE pRopoRTIon oF ovER ExploITEd FISH SToCkS MoRE THAn doUBlEd BETwEEn 2006 And 2010.

30 Beyond Rio: New Zealand’s environmental record since the original Earth Summit
Regarding sea birds, although the total numbers of birds caught has declined as total fishing effort has declined, the rate of capture for trawling and surface long-lining has remained broadly the same over the past decade, albeit with fluctuations. This suggests the way that we are fishing is not improving and that mitigation measures are either not being used, or are not working.
Sea Bird Capture Rates in New Zealand Fisheries, 1999 - 2009119
On the face of it, the situation for some marine mammals seems to have improved. For example, capture rates for sea lions and fur seals have declined over the past decade. The recent decline in sea lion captures is probably due to the use of sea lion exclusion devices in squid trawls that allow sea lions to escape from the nets. however their subsequent survival rates are unknown and there is a real danger that they are held long enough in nets at such depth as to make it impossible to surface in time for air. 120
Ultimately, the critical issue is the health and viability of the populations of animals subject to bycatch. As this report’s section on Marine Biodiversity sets out, the decline in the populations of New Zealand sea lions, Maui’s dolphins and several sea bird species is evidence that the mortality rate in these cases is still unacceptably high.
Beyond the issue of bycatch, fishing, especially bottom trawling, can also have an impact on the sea bed. Although, as fishing effort declined, the area trawled halved from a peak of 166,000 km2 in 1998 to 85,222 km2 in 2008,121 this area is still massive – representing one-third of the area of terrestrial New Zealand. It is widely accepted that some fishing methods, such as bottom trawling and dredging, impact on the seabed and may cause damage to marine habitats and ecosystems.122 In response to concerns over bottom trawling, the Government closed 30 per cent of the EEZ to bottom fishing in 2007 through benthic protected areas (BPAs). While this may sound impressive, the areas chosen for ‘protection from trawling’ were largely not being fished anyway and they do not comprise a representative sample of sea floor habitats. Research has shown that better defined sea floor areas could deliver two and a half times the conservation benefit at a lower cost to fishers.123
1999
2001
200
0
20
02
2003
200
4
200
5
200
6
200
7
200
8
200
9
Y E A R
0
Nu
mb
er o
f B
ird
s C
aptu
red
50
100
150
200
250
Trawl capture rate (/1000 tows)
SLL capture rate (/mill ion hooks)
BLL capture rate (/mill ion hooks)

Beyond Rio: New Zealand’s environmental record since the original Earth Summit 31
Prospects in New Zealand: Beyond 2012
The Quota Management System was once seen as leading the world, but its limitations are becoming increasingly apparent, not least due to a significant lack of information, an increase in the proportion of overfished stocks and the fact it ignores the complex interactions with other species of fish and wildlife in the marine environment. New Zealand is now behind the curve in terms of fisheries management best practice.
Although successive governments have responded to the issues set out above, including establishment of marine protected areas, fishing method restrictions, observer programmes, imposition of marine mammal by-catch limits, and the requirement for fishers to use bycatch mitigation devices, these initiatives have been largely reactive and lack overall coordination. A systematic approach to managing the environmental effects of fishing has not been implemented.
While market mechanisms such as Marine Stewardship Council certification 124 can help influence fisheries practices and consumer choices, they are a useful accompaniment to, but not a replacement for, coordinated policy measures. The Government urgently needs to assess the effects of fishing on all parts of the marine environment, and it needs to establish environmental standards in defining acceptable fishing limits.
These are key features of ecosystem-based management 125 that must be implemented if New Zealand is to make good on the promises made at, and since, the Earth Summit.

32 Beyond Rio: New Zealand’s environmental record since the original Earth Summit
This report has looked at several key commitments arising from the 1992 Rio and 2002 Johannesburg summits. These can be summarised as follows:
• Stem the loss of New Zealand’s marine and terrestrial biodiversity
• Reduce New Zealand’s greenhouse gas emissions
• Fully incorporate sustainability into education for New Zealanders
• Ensure our fisheries do not exceed ecological limits
• Ensure our use of freshwater does not exceed ecological limits
The sad fact is that, on too many of these promises, we are underachieving. The hard data show that greenhouse gas emissions have been steadily rising since 1992 with no policy measures in place, or on the horizon, that will set emissions on a downward trajectory. The data show the decline of some key species in both the marine and terrestrial environments with a very real possibility of further extinctions. The data show a worsening trend in freshwater pollution with little or no political appetite to regulate the quantity or quality of the major pollution source; dairy farming.
In some areas, there has been action, or at least what looks like action. A range of plans, strategies, policies and initiatives have been put in place across several of the issues analysed in this report. Progress, for example, has been made on increasing the amount of legally protected land in New Zealand as well as the amount of land that is under some form of predator control. however, all too often such strategies and initiatives have not delivered enough change where it matters.
In some cases there is clearly a lack of information leading to ongoing uncertainty over the state of biodiversity and/or the ecological limits we face. This information gap urgently needs to be filled. It is appalling that, 20 years after the Earth Summit, we aren’t sure whether or not some of the promises are being met because we haven’t collected adequate information. Even in the absence of full information, we can still take precautionary action.
In the case of sustainability education – an area fundamental to achieving the huge social shift needed to ensure we do not exceed the planet’s capacity to sustain life – it is disappointing that the progress made between 2004 and 2008 has since been reversed.
This report is not an attempt to compare New Zealand with other countries. Our Government made international commitments to address problems at a national level and, regardless of what others have done, our Government should be delivering on those commitments.
The Rio+20 Summit in 2012 is of course an opportunity to create momentum on addressing critical issues that could enable the world to meet current and future generations’ needs without exceeding ecological limits.
however, we should not lose sight of the raft of Earth Summit promises already made. This report is a timely reminder that New Zealand needs to do much more to fulfill these existing commitments if we are serious about leaving behind a sustainable legacy for future generations.
ConClUSIonS

Beyond Rio: New Zealand’s environmental record since the original Earth Summit 33
Satellite image of New Zealand, acquired by the Moderate Resolution Imaging Spectroradiometer (MODIS) flying aboard NASA’s Terra satellite 23 Oct 2002. The challenge for us today is to protect New Zealand’s environment so that future generations inherit and benefit from healthy, flourishing ecosystems that can sustain all.
© J D
ESC
LO
ITR
ES N
ASA

34 Beyond Rio: New Zealand’s environmental record since the original Earth Summit
1 Article 2. United Nations Framework Convention on Climate Change: http://unfccc.int/resource/docs/convkp/conveng.pdf
2 Article 4.2(a). United Nations Framework Convention on Climate Change: http://unfccc.int/resource/docs/convkp/conveng.pdf
3 Para 36. WSSD Plan of Implementation. 2002: http://www.johannesburgsummit.org/html/documents/summit_docs/2309_planfinal.htm
4 Para 20(a). WSSD Plan of Implementation. 2002: http://www.johannesburgsummit.org/html/documents/summit_docs/2309_planfinal.htm
5 All figures taken from New Zealand’s 5th National Communication to the UNFCCC. See: http://www.mfe.govt.nz/publications/climate/nz-fifth-national-communication/page6.html
6 All figures taken from New Zealand’s 5th National Communication to the UNFCCC. See: http://www.mfe.govt.nz/publications/climate/nz-fifth-national-communication/page6.html
7 MfE. (2010). 5th National Communication to the UNFCCC. See: http://www.mfe.govt.nz/publications/climate/nz-fifth-national-communication/page6.html
8 MED. (2012). Energy Outlook 2011. http://www.med.govt.nz/sectors-industries/energy/energy-modelling/modelling/new-zealands-energy-outlook
9 All figures taken from New Zealand’s 5th National Communication to the UNFCCC. See: http://www.mfe.govt.nz/publications/climate/nz-fifth-national-communication/page6.html
10 Brownlee, G. (2009). Unlocking New Zealand’s Petroleum Potential, 18 November 2009. http://www.beehive.govt.nz/release/unlocking-new-zealand039s-petroleum-potential
11 NZTA. (2010). Road of National Significance. http://www.nzta.govt.nz/network/rons/index.html (updated 16 December 2010).
12 See, for example: Carter, D. (2010). Government widens funding for irrigation schemes. 16 July 2010. http://www.beehive.govt.nz/release/government-widens-funding-irrigation-schemes
13 Gerken, S. (2011). huge benefits seen in lignite industry. Southland Times, 10 September 2011. http://www.stuff.co.nz/southland-times/business/5598805/huge-benefits-seen-in-lignite-industry
14 PCE (2010). Lignite and climate change: The high cost of low grade coal. December 2010. Wellington, Parliamentary Commissioner for the Environment. http://www.pce.parliament.nz/assets/Uploads/PCE-Lignite.pdf
15 Consultation underway on ETS changes, 11 April 2012. http://www.beehive.govt.nz/release/consultation-underway-ets-changes
16 Paragraph 45 of the UNFCCC Cancun Decision states that “[the conference of the Parties] Further decides that developed countries should develop low-carbon development strategies or plans.”
17 WWF. (2012). Planning Development in a Carbon Constrained World. http://www.worldwildlife.org/climate/Publications/WWFBinaryitem25183.pdf
18 WWF-New Zealand. (2012). Creative Accounting and the Climate Negotiations: New Zealand’s Approach to Quantified Emissions Limitation/Reduction Obligations (QELROs). February 2012. http://www.wwf.org.nz/media_centre/publications/?8381/Creative-Accounting-and-the-Climate-Negotiations
19 See Table 5.1 of IPCC Assessment Report 4: Synthesis Report. http://www.ipcc.ch/publications_and_data/ar4/syr/en/mains5-4.html
20 See Box 13.7 on page 776 of IPCC Assessment Report 4, Working Group 3: Mitigation of Climate Change. Chapter 13: Policies, Instruments and Co-operative Arrangements.
http://www.ipcc.ch/pdf/assessment-report/ar4/wg3/ar4-wg3-chapter13.pdf
21 In 2009, Pricewaterhousecoopers estimated the global market for clean tech was worth US$284 billion and forecast it would rise to $US1.3 trillion by 2017: Kilgallon, S. (2012). Is cleantech New Zealand’s way forward? The Dominion Post, 5 February 2012. http://www.stuff.co.nz/dominion-post/business/innovation/6382849/Is-cleantech-New-Zealands-way-forward
22 Principle 16, Rio Declaration on Environment and Development. (1992). http://www.unep.org/Documents.Multilingual/Default.asp?DocumentID=78&ArticleID=1163&l=en
23 Para 23. WSSD Plan of Implementation. 2002: http://www.johannesburgsummit.org/html/documents/summit_docs/2309_planfinal.htm
24 Para 24(d). WSSD Plan of Implementation. 2002: http://www.johannesburgsummit.org/html/documents/summit_docs/2309_planfinal.htm
25 http://www.mfe.govt.nz/publications/water/water-quality-trends-1989-2007/index.html
26 Larned, S. T., M. R. Scarsbrook, et al. (2004). “Water Quality on Low-elevation streams and rivers of New Zealand recent state and trends in contrasting land cover classes. .” New Zealand Journal of Marine and Freshwater Research 38: 347-366.
27 Verburg, P., K. hamill, et al. (2010). Lake Water Quality in New Zealand 2010: Status and Trends. NIWA, Ministry for the Environment.
28 Daughney, C.J. & Wall, M. (2007). Groundwater quality in New Zealand: State and trends 1995-2006. GNS Science Consultancy Report 2007/23.
29 Environmental Science and Research Ltd. (2007). Estimation of the Burden of Water-borne Disease in New Zealand - Preliminary Report. Wellington: Environmental Science and Research Ltd. http://www.health.govt.nz/publication/estimation-burden-water-borne-disease-new-zealand-preliminary-report
30 Allibone, R., David, B., hitchmough, R., Jellyman, D., Ling, N., Ravenscroft, P. & Waters, J. (2010). Conservation status of New Zealand freshwater fish, 2009 in New Zealand Journal of Marine and Freshwater Research, 44:4, pp.271-287, available at http://www.tandfonline.com/doi/abs/10.1080/00288330.2010.514346
31 Joy, M. K. (2009). Temporal and land-cover trends in freshwater fish communities in New Zealand’s rivers: an analysis of data from the New Zealand freshwater fish database -1970-2007.
32 Joy, M. K., & Death, R. G. (2004). Application of the index of biotic integrity methodology to New Zealand freshwater fish communities. Environmental Management, 34(3), 415-428.
33 NIWA. (2010). Water quality trends at NRWQN sites for the period 1989-2007. 2nd Edition. hamilton. National Institute of Water & Atmospheric Research Ltd. http://www.mfe.govt.nz/publications/water/water-quality-trends-1989-2007/final-report-water-quality-trends-NRWQN.pdf
34 Baskaran, R, Cullen, R, Colombo, (2009). Estimating Values of Environmental Impacts of Dairy Farming in New Zealand. New Zealand Journal of Agricultural Research. 52, 377–389.
35 DairyNZ. (2011).New Zealand Dairy Statistics 2010-11. http://www.dairynz.co.nz/file/fileid/39959
36 NIWA. how clean are our rivers? hamilton. National Institute of Water & Atmospheric Research Ltd. http://www.niwa.co.nz/publications/wa/water-atmosphere-1-july-2010/how-clean-are-our-rivers (viewed March 2012)
37 DairyNZ. (2011).New Zealand Dairy Statistics 2010-11. http://www.dairynz.co.nz/file/fileid/39959
38 MfE. (2007). Environment New Zealand 2007: Nitrogen from fertilizers and manure http://www.mfe.govt.nz/environmental-reporting/land/use/fertilisers.html
39 Sinner, J. (2011, June 29). Implications of the National Policy Statement on Freshwater Management, Prepared for Fish & Game New Zealand. Cawthron Report No. 1965, available at http://www.fishandgame.org.nz/.
40 The Clean Streams Accord is an agreement between Fonterra, Regional Councils and the Ministry for the Environment and requires that farmers undertake a number of measures to reduce their impacts on freshwater
41 Waikato-Tainui Raupatu Claims (Waikato River) Settlement Act 2010 No 24 (as at 25 November 2010), Public Act
42 United Nations (1992), Agenda 21. Available at http://www.un.org/esa/sustdev/documents/agenda21/english/Agenda21.pdf
43 United Nations (1992), op cit. This list captures key objectives with an environmental component that were agreed to in Chapter 36. Some of these sentences have been edited for brevity (without changing their meaning).
44 This term is used synonymously with ‘education for sustainability.’
45 UNESCO (2002), Education and Sustainable Development: UNESCO’s Contribution to Agenda 21. Available at http://bit.ly/wsP5us
46 United Nations (2002), Plan of Implementation of the World Summit on Sustainable Development, Available at http://bit.ly/xnZ1mR
47 United Nations (2002), Plan of Implementation of the World Summit on Sustainable Development, Available at http://bit.ly/xnZ1mR
48 United Nations. (2002). Resolution 57/254: United Nations Decade of Education for Sustainable Development. New York, United Nations. http://www.un-documents.net/a57r254.htm
49 Ministry for the Environment (MfE) (1998), Learning to care for our environment: a national strategy for environmental education. Wellington, MfE.
50 Parliamentary Commissioner for the Environment (PCE). (2004). See Change: Learning and Education for Sustainability. Wellington: PCE. http://www.pce.parliament.nz/assets/Uploads/Reports/pdf/See_change_report.pdf
51 Parliamentary Commissioner for the Environment (PCE) (2007), Outcome
evaluation—See Change: Learning and education for sustainability. Wellington, PCE.
52 Parliamentary Commissioner for the Environment (PCE) (2007), Outcome evaluation—See Change: Learning and education for sustainability. Wellington, PCE.
53 Enviroschools Foundation, New Zealand Association for Environmental Education and WWF-NZ (2011), Thriving Now For the Future—Education for the 21st Century: Policy priorities for candidates in the 2011 New Zealand general Election.
54 WWF. (2011). Education for Sustainability. Report of opinion polling conducted by Colmar Brunton in September 2011. http://awsassets.wwfnz.panda.org/downloads/sustainability_education_in_schools_2011.pdf
55 See IUCN website: http://www.iucn.org/what/tpas/biodiversity/
56 Article 1, Convention on Biological Diversity, United Nations, 1992. http://www.cbd.int/convention/text/
57 Para 44. WSSD Plan of Implementation. 2002: http://www.johannesburgsummit.org/html/documents/summit_docs/2309_planfinal.htm
58 Para 44i. WSSD Plan of Implementation. 2002: http://www.johannesburgsummit.org/html/documents/summit_docs/2309_planfinal.htm
59 New Zealand Government. (2000). The New Zealand Biodiversity Strategy, February 2000. http://www.biodiversity.govt.nz/pdfs/picture/nzbs-whole.pdf
60 New Zealand Government. (2000). The New Zealand Biodiversity Strategy, February 2000. http://www.biodiversity.govt.nz/pdfs/picture/nzbs-whole.pdf
61 MfE. (1997). The State of New Zealand’s Environment 1997. Wellington, Ministry for the Environment. http://www.mfe.govt.nz/publications/ser/ser1997/index.html
62 MfE. (1997). The State of New Zealand’s Environment 1997. Wellington, Ministry for the Environment. http://www.mfe.govt.nz/publications/ser/ser1997/index.html and MfE. (2007). Environment New Zealand 2007. Wellington, Ministry for the Environment. http://www.mfe.govt.nz/publications/ser/enz07-dec07/index.html
63 MfE. (1997). The State of New Zealand’s Environment 1997. Wellington, Ministry for the Environment. http://www.mfe.govt.nz/publications/ser/ser1997/index.html and MfE. (2007). Environment New Zealand 2007. Wellington, Ministry for the Environment. http://www.mfe.govt.nz/publications/ser/enz07-dec07/index.html
64 MfE. (1997). The State of New Zealand’s Environment 1997. Wellington, Ministry for the Environment. http://www.mfe.govt.nz/publications/ser/ser1997/index.html
65 OECD. (2007). Environmental Performance Review of New Zealand. Paris, Organisation for Economic Cooperation and Development. http://www.oecd.org/dataoecd/6/6/37915514.pdf
66 Walker et al. (2005). New Zealand’s remaining indigenous cover: recent changes and biodiversity protection needs. Landcare Research Contract Report: LC0405/038. March 2005. http://www.landcareresearch.co.nz/databases/lenz/downloads/New%20Zealand_indigenous_cover.pdf and, Walker et al. (2006). Recent loss of indigenous cover in New Zealand. New Zealand Journal of Ecology (2006) 30(2): 169-177. http://www.nzes.org.nz/nzje/free_issues/NZJEcol30_2_169.pdf
67 DoC. (2011). Department of Conservation, Annual Report for Year
REFEREnCES

Beyond Rio: New Zealand’s environmental record since the original Earth Summit 35
ended 30 June 2011. Wellington, Department of Conservation. http://www.doc.govt.nz/upload/documents/about-doc/annual-report-2011/doc-annual-report-year-ended-30-june-2011.pdf
68 Sources for table: Source 1997: Page 20, Chapter 9, State of New Zealand’s Environment 1997, Ministry for the Environment, New Zealand Government. See: http://www.mfe.govt.nz/publications/ser/ser1997/chap9-1-1.pdf. Note: WWF accepts that the 1997 assessment of threatened species occurred prior to standard methods of classification and measurement of NZ biodiversity being devised and the resulting figure is drawn from data from the 1980s and opinions at the time and is highly uncertain. Nevertheless the figure of 1,000 species threatened with extinction was accepted at the time as shocking and requiring immediate action.
Source 2002: NZ Threat Classification System Lists 2002, Department of Conservation; New Zealand Government http://www.doc.govt.nz/upload/documents/science-and-technical/TSOP23pre.pdf
Source 2005: NZ Threat Classification System Lists 2005, Department of Conservation; New Zealand Government See: http://www.doc.govt.nz/upload/documents/science-and-technical/sap236.pdf
Source 2008/11: Department of Conservation, Annual Report for Year ended 30 June 2011, Department of Conservation; New Zealand Government. See: http://www.doc.govt.nz/publications/about-doc/annual-report-for-year-ended-30-june-2011/5-natural-heritage-report-against-operating-intentions/intermediate-outcome-1/. Note 1: The New Zealand Threat Classification System methodology was revised in 2008. The Department of Conservation notes that in the revised system, ‘threatened’ is roughly equivalent to ‘acutely threatened’ in the previous system, and ‘at risk’ is roughly equivalent to ‘chronically threatened’ in the previous system. Figures in the table from the 2002 and 2005 lists use the previous methodology and the figure provided in each case is for the total number of species listed as ‘threatened’, including ‘acutely threatened’, ‘chronically threatened’ and ‘at risk’ . Figures provided for 2008/11 are the sum of two categories ‘threatened’ and ‘at risk’. In all three cases the figures represent all species evaluated, and not listed as ‘data deficient’, ‘extinct’ or ‘not threatened’. To quote the authors: “Most changes between 2005 and 2008/11 result from improved coverage of groups previously not assessed, and improved knowledge and changes in definitions of categories. however, 57 species have declined sufficiently to trigger a change to a more severely threatened category, and 7 species have recovered under management sufficiently to move to a less severely threatened category.” Note 2: The terrestrial and freshwater invertebrate lists 2008/11 have not yet been published and very minor changes in total numbers are therefore possible.
69 MfE. (2007). Environment New Zealand 2007. Wellington, Ministry for the Environment. http://www.mfe.govt.nz/publications/ser/enz07-dec07/index.html (table uses data sourced from Indicator Species in Biodiversity Chapter , pp378-391
70 Miskelly et al. (2008). Conservation Status of New Zealand Birds 2008. Notornis, Vol 55: 117-135
71 hitchmough et al. (2010). Conservation status of New Zealand reptiles 2009. New Zealand Journal of Zoology, 37: 3, 203-224
72 Statistics refer to vascular plants, which are higher order plants with tissues that transport fluids internally, a category which excludes mosses, liverwort and algae.
73 De Lange et al. (2009). Threatened and
uncommon plants of New Zealand. New Zealand Journal of Botany, Volume 47: 61-96
74 MfE. (2007). Environment New Zealand 2007. Wellington, Ministry for the Environment. http://www.mfe.govt.nz/publications/ser/enz07-dec07/index.html (see p392)
75 DoC. (2011). Briefing to the Incoming Minister, Department of Conservation, 2011 http://www.doc.govt.nz/publications/about-doc/briefing-to-the-incoming-minister-of-conservation-2011/2-overview/2_1-why-conservation-matters/
76 United Nations. (1992). Agenda 21: The United Nations Plan of Action from Rio. Chapter 17. http://www.un.org/esa/dsd/agenda21/res_agenda21_17.shtml
77 All bullet points are taken from: United Nations. 2002: Plan of Implementation of the World Summit on Sustainable Development: Retrieved on 28 February 2012 from: http://www.johannesburgsummit.org/
78 EEZ plus extended continental shelf - http://www.linz.govt.nz/hydro/projects-programmes/continental-shelf/undersea-image.
79 WWF. (2007): The Treasures of the Sea: Nga Taonga a Tangaroa: A summary of the biodiversity in the New Zealand Marine Region. Edited by Dr Alison MacDiarmid. WWF, Wellington.
80 From DOC website. Viewed on 27 February 2012: http://www.doc.govt.nz/conservation/marine-and-coastal/new-zealands-marine-environment/
81 OECD. (2007). OECD Environmental Performance Reviews: New Zealand. Paris: Organisation for Economic Co-operation and Development. Viewed on 15 March 2012 at: http://www.keepeek.com/Digital-Asset-Management/oecd/environment/oecd-environmental-performance-reviews-new-zealand-2007_9789264030589-en
82 From DOC website. Viewed on 27 February 2012: http://www.doc.govt.nz/conservation/marine-and-coastal/marine-protected-areas/marine-reserves-a-z/
83 Department of Conservation. (2007). Evaluation matrix for the review of implementation of the programme of work on protecetd areas. Wellington: Department of Conservation. Retrieved 15 March 2012: http://www.cbd.int/search.shtml?cx=002693159031035132009%3Aetadhtewsy4&cof=FORID%3A11&q=new%20zealand%20EVALUATION%20MATRIX%20FOR%20ThE%20REVIEW%20OF%20IMPLEMENTATION%20OF%20ThE%20PROGRAMME%20OF%20WORK%20ON%20PROTECETD%20AREAS&sa=Search&hl=en
84 Department of Conservation. (2011). Department of Conservation Annual Report: For the year ended 30 June 2011. Wellington: Department of Conservation.
85 Slooten, E. and Dawson, S.M. (2010). Assessing the effectiveness of conservation management decisions: likely effects of new protection measures for hector’s dolphin (Cephalorhynchus hectori). Aquatic Conserv: Mar. Freshw. Ecosyst. 20: 334–347.
86 Five years ago the Chinese announced the extinction of the freshwater dolphin, the Baiji. From the New herald Online. Viewed 20 March 2012: http://www.nzherald.co.nz/nz/news/article.cfm?c_id=1&objectid=10793020
87 Taken from Ministry of Fisheries (2011) SQU6T Operational Plan – Initial position paper. http://www.fish.govt.nz/NR/rdonlyres/AF0DAB4C-524B-4881-A57A-A2EB90A767EA/0/SQU6TIPP201112FINAL.pdf
88 Robertson BC, Chilvers BL. (2011). The population decline of the New Zealand sea lion Phocarctos hookeri: a review of possible causes. Mammal Review 2011. Retrieved 21 March 2012: http://www.sealiontrust.org.nz/
89 Chilvers BL. (2011). Population viability
analysis of New Zealand sea lions, Auckland Islands, New Zealand’s sub-Antarctics: assessing relative impacts and uncertainty. Polar Biology (22 December 2011), pp. 1-9. Abstract viewed 21 March 2012: http://www.citeulike.org/article/10179539
90 CS Baker, BL Chilvers, R Constantine, S DuFresne, Rh Mattlin, A van helden & R hitchmough (2010): Conservation status of New Zealand marine mammals (suborders Cetacea and Pinnipedia), 2009, New Zealand Journal of Marine and Freshwater Research, 44:2, 101-115.
91 DoC. (2012). Facts about southern right whale. Wellington, Department of Conservation. http://www.doc.govt.nz/conservation/native-animals/marine-mammals/whales/southern-right-whales-tohora/facts/ (Viewed March 2012).
92 This excludes waders.
93 Department of Conservation. (2010). New Zealand’s Fourth National Report to the United Nations Convention on Biological Diversity. Wellington: Department of Conservation.
94 Department of Conservation. (2010). New Zealand’s Fourth National Report to the United Nations Convention on Biological Diversity. Wellington: Department of Conservation.
95 Bell, E.A.; Sim, J.L.; Scofield, P.; Francis, C. In press. Population parameters of the black petrel (Procellaria parkinsoni) on Great Barrier Island (Aotea Island), 2009/2010. DOC Marine Conservation Series. Department of Conservation, Wellington.
96 Ministry for the Environment. (2007). Environment New Zealand 2007. Wellington: Ministry for the Environment.
97 Taylor, G. (2010) The State of Auckland’s Seabirds. Research and Development Group, Department of Conservation. April 2010.
98 Department of Conservation. (2010). New Zealand’s Fourth National Report to the United Nations Convention on Biological Diversity. Wellington: Department of Conservation.
99 Parliamentary Commissioner for the Environment. (1999). Setting course for a sustainable future. Wellington: Parliamentary Commissioner for the Environment.
100 From Parliamentary Commissioner for the Environment website. Viewed 21 March 2012: http://www.pce.parliament.nz/publications/submissions-and-advice/submission-on-the-exclusive-economic-zone-and-continental-shelf-environmental-effects-bill/
101 Full name: Exclusive Economic Zone and Continental Shelf (Environmental Effects) Bill
102 From Parliamentary Commissioner for the Environment website. Viewed 21 March 2012: http://www.pce.parliament.nz/media/media-releases/significant-flaws-in-eez-bill/
103 http://www.beehive.govt.nz/release/new-zealand-one-top-five-countries-investment-petroleum-exploration
104 http://www.beehive.govt.nz/release/time-discuss-maximising-our-mineral-potential
105 http://www.beehive.govt.nz/release/aquaculture-enters-new-era
106 http://www.beehive.govt.nz/release/commercial-fisheries-value-cracks-4-billion
107 http://www.edsconference.com/content/docs/2011_presentations/MacDiarmid,%20A%20ppt.pdf
108 Comparative Review of health, Safety and Environmental Legislation for Offshore Petroleum Operations. Ministry of Economic Development. Final Report. Atkins holm Joseph Majurey Limited September 2010.
109 United Nations. (1992). Agenda 21: The United Nations Plan of Action from Rio. Chapter 17. http://www.un.org/esa/
dsd/agenda21/res_agenda21_17.shtml
110 All bullet points are taken from: United Nations. 2002: Plan of Implementation of the World Summit on Sustainable Development: Retrieved on 28 February 2012 from: http://www.johannesburgsummit.org/
111 FAO. (2008). World fish trade exceeds USD 100 billion for the first time in history. Rome, Food and Agriculture Organisation. http://www.globefish.org/world-fish-trade-exceeds-usd-100-billion-for-the-first-time-in-history.html Viewed, March 2012. The European Union is treated as a single country in FAO statistics.
112 See, for example: Seafood Industries Council. Quota Management System. http://www.seafoodindustry.co.nz/qms. Viewed May 2012
113 Pitcher, T.J., Pramod, G., and Short, K. (2008). Safe Conduct? Twelve years fishing under the UN Code. WWF-International and the University of British Columbia’s Fisheries Ecosystem Restoration Research Group.
114 Ministry of Fisheries. (2011). Stock Status Table 2011. Wellington, Ministry of Fisheries. http://fs.fish.govt.nz/Page.aspx?pk=113&dk=22966 (Viewed 7 May 2012).
115 MfE. (2010). Fishing Activity: Fish Stocks. Wellington, Ministry for the Environment. http://www.mfe.govt.nz/environmental-reporting/report-cards/fish-stocks/2010/fish-stocks.html Updated 26 November 2010.
116 MfE. (2010). Fishing Activity: Fish Stocks. Wellington, Ministry for the Environment. http://www.mfe.govt.nz/environmental-reporting/report-cards/fish-stocks/2010/fish-stocks.html Updated 26 November 2010.
117 Ministry of Fisheries. (2009). Updated Status of New Zealand’s Fish Stocks at September 2009. Wellington, Ministry of Fisheries. http://www.fish.govt.nz/NR/rdonlyres/7B36281A-2B26-4148-AF49-6C6A45BB0142/0/Updatedstatusoffishstocks.pdf (Viewed, March 2012)
118 Ward, T., Tarte, T., hegerl, E. and Short, K. ( 2002). Policy Proposals and Operational Guidance for Ecosystem-Based Management of Marine Capture Fisheries. Sydney, WWF Australia.
119 Abraham, E.R.; Thompson, F.N. (2011). Summary of the capture of seabirds, marine mammals, and turtles in New Zealand commercial fisheries, 1998–99 to 2008–09 New Zealand Aquatic Environment and Biodiversity Report No. 80. “BLL” = bottom longline, “SLL” = surface longline.
120 Abraham, E.R.; Thompson, F.N. (2011). Summary of the capture of seabirds, marine mammals, and turtles in New Zealand commercial fisheries, 1998–99 to 2008–09 New Zealand Aquatic Environment and Biodiversity Report No. 80
121 MfE. (2010) Fishing Activity - Seabed Trawling: Environmental Snapshot, March 2010. Wellington, Ministry for the Environment. http://www.mfe.govt.nz/environmental-reporting/report-cards/seabed-trawling/2010/seabed-trawling.pdf
122 Ministry of Fisheries. (2007). habitat Protection and Research. Wellington, Ministry of Fisheries. http://www.fish.govt.nz/en-nz/Environmental/Seabed+Protection+and+Research/default.htm (updated 16 November 2007).
123 Leathwick, J. et al (2008). Novel methods for the design and evaluation of marine protected areas in offshore waters. Conservation Letters 1 (2008) 91–102.
124 MSC. (2012). Pacific. http://www.msc.org/track-a-fishery/certified/pacific
125 Grieve, C and Short, K. (2007). Implementation of ecosystem-based management in marine capture fisheries. Gland, WWF International. assets.panda.org/downloads/wwf_ebm_toolkit_2007.pdf

ww
f.org.nzBeyond rio report 2012
nZ
1961WWF was founded in 1961
+ 100WWF is in over 100 countries on 5 continents
+ 5M + 5,000WWF has over 5 millionsupporters
© 1986 Panda Symbol WWF-World Wide Fund For Nature (also known as World Wildlife Fund) ® “WWF” is a WWF Registered Trademark
WWF New Zealand, Level 6, Davis Langdon house,49 Boulcott Street, Wellington 6141, PO Box 6237, New Zealand.T: 0800 435 7993, E: [email protected]
WWF has over 5,000 staff worldwide
FSC LOGO PLACEMENT