earth system monitor
TRANSCRIPT
U.S. DEPARTMENTOF COMMERCE
National Oceanicand AtmosphericAdministration
A guide toNOAA's data and
informationservices
INSIDE
Vol. 6, No. 2 ● December 1995
EARTH SYSTEM MONITOR
Christine C. Young1
Department of GeosciencesUniversity of Milwaukee - Wisconsin
Arlindo M. da Silva2
Goddard Space Flight CenterNASA
Sydney Levitus3
National Oceanographic Data CenterNOAA/NESDIS
A recent collaboration between researchersat the Department of Geosciences of the Univer-sity of Wisconsin—Milwaukee (UWM) and theOcean Climate Laboratory (OCL) at the NationalOceanographic Data Center (NODC) has culmi-nated in the production of objective analyses ofobserved and derived surface marine parameters.These global analyses are based on individualobservations found in the Comprehensive
Ocean-Atmosphere Data Set (COADS) Release 1complemented by an interim release for the1980’s. Results of the analyses are presented inAtlas of Surface Marine Data 1994, a five-volumeseries depicting 45-year seasonal climatologies(1945-1989), anomalies, and standard deviationsof various quantities characterizing the surfacemarine climate (da Silva et al.1994a,b,c,d,e). Theanalyses of monthly climatologies, anomaliesand standard deviations are available in a set of 3CD-ROMs or on exabyte tape. The raw statisticsare also available on Exabyte tape for those usersdesiring to perform their own objective analysis.
Data overviewThe analyses presented in Atlas of Surface
Marine Data 1994 are derived from the individualobservations found in Compressed Marine Re-ports—Product 5 (CMR-5) of COADS Release 1(Slutz et al. 1985, Woodruff et al. 1987). Observa-
New atlas presents global analysesof surface marine data
– continued on page 2
Joint project between UWM and NODC to aid in global climate research
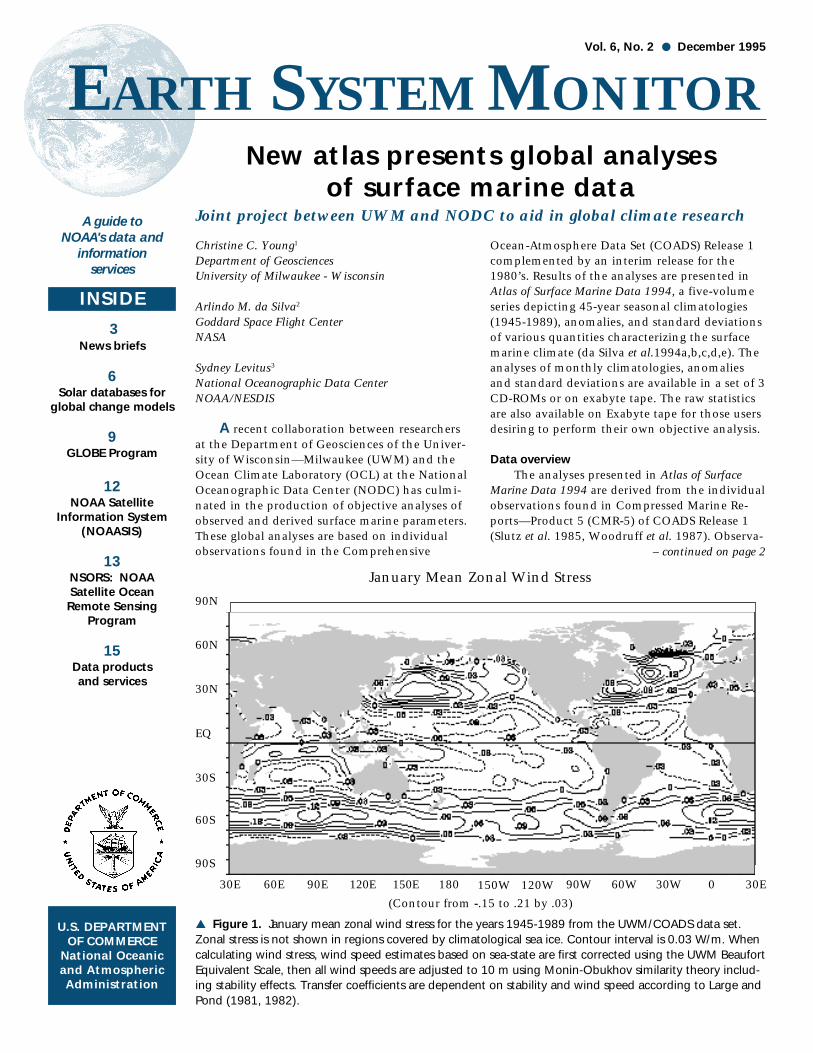
▲ Figure 1. January mean zonal wind stress for the years 1945-1989 from the UWM/COADS data set.Zonal stress is not shown in regions covered by climatological sea ice. Contour interval is 0.03 W/m. Whencalculating wind stress, wind speed estimates based on sea-state are first corrected using the UWM BeaufortEquivalent Scale, then all wind speeds are adjusted to 10 m using Monin-Obukhov similarity theory includ-ing stability effects. Transfer coefficients are dependent on stability and wind speed according to Large andPond (1981, 1982).
3News briefs
6Solar databases for
global change models
9GLOBE Program
12NOAA Satellite
Information System(NOAASIS)
13NSORS: NOAASatellite OceanRemote Sensing
Program
15Data productsand services
90N
30E 60E 90E 120E 150E
(Contour from -.15 to .21 by .03)
180 90W 60W 30W 0 30E
90S
60S
30S
EQ
30N
60N
January Mean Zonal Wind Stress
120W150W
2 December 1995EARTH SYSTEM MONITOR
EARTH SYSTEM MONITORSurface Marine Data, from page 1tions included in COADS/CMR-5 consistof reports of wind, air and sea surfacetemperature, sea level pressure, humid-ity, and present weather made primarilyby ships of the Voluntary ObservingFleet. Observations included in this his-torical collection have also been takenby various military ships, ocean weatherships, light ships, research vessels,buoys, and bathythermographs. In addi-tion to the observations, COADS/CMR-5provides metadata such as quality con-trol flags and measurement type indica-tors. Although COADS/CMR-5 includesobservations as far back as 1854, theanalyses in Atlas of Surface Marine Data1994 cover only the years 1945 through1989.
The joint project between UWMand OCL (known also as the UWM/COADS project) is an effort to improveand expand the standard COADS statis-tics. The first improvement is an at-tempt to reduce known biases in theship reports in addition to the qualitycontrol provided in COADS/CMR-5. Inthe UWM/COADS project, bias correc-tions have been applied to individualobservations of cloudiness, presentweather and Beaufort-estimated winds.
In order to account for biases inwind speed estimates based on sea-state,a new Beaufort equivalent scale wasdeveloped. The other bias correctionsare the interpretation of certain missingpresent weather observations as clearweather, trimming cloudiness observa-tions taken in low light conditions, andinterpreting certain sky obscured cloudi-ness observations as 100% cloud cover.
A second improvement is higher
resolution. The COADS/MST are on a 2o
x 2o grid while the UWM/COADS rawstatistics have been calculated on a 1o x1o grid identical to that used by Levitus(1982), Conkright et al. (1994) andLevitus et al. (1994a,b, c). In addition tothe raw statistics, UWM/COADS in-cludes objectively analyzed fields, wherea successive correction analysis has beenapplied to interpolate values to missingboxes and remove small-scale, noisyfeatures (similar objective analysis ofCOADS/MST has been performed atNOAA’s Geophysical Fluid DynamicsLaboratory.) This analysis is essentiallythe same as that used by Conkright et al.(1994) and Levitus et al. (1994a,b,c).
The UWM/COADS data set alsoextends the COADS/MST by providing acomplete set of heat (sensible, latent,radiational), momentum, and fresh wa-ter (evaporation, precipitation, buoy-ancy) fluxes. These fluxes have beenestimated using wind-speed dependenttransfer coefficients and stability effects(Large and Pond 1981, 1982), unlike thepseudo fluxes found in the COADS/MSTwhere transfer coefficients have beenomitted. Precipitation estimates arebased on Present Weather reports usingthe algorithm of Tucker (1961) with avariant of Dorman and Bourke’s (1978)corrections.
By calculating a complete array ofatmospheric forcing parameters, and byusing the same grid and analysis schemeas in Conkright et al. (1994) and Levituset al. (1994a,b,c), the UWM/COADSdata set is intended to be used as acomplement to the surface and subsur-face marine analyses found inConkright et al. (1994) and Levitus et al.(1994a,b,c).
OrganizationThe multi-volume Atlas of Surface
Marine Data 1994 (da Silva et al.1994a,b,c, d,e) is organized into twomain categories. The first category, in-depth documentation of the data set, isfound in Volume 1. Besides describingall parameterizations, calculations, andanalysis methods used in creating thedata set, this volume discusses possiblebiases the COADS data may contain andexplains the bias corrections employed.Other subjects discussed in Volume 1are the constraining of heat and freshwater fluxes by oceanographic transport
– continued on page 4
1 Department of GeosciencesUniversity of Wisconsin - MilwaukeeP.O. Box 413Milwaukee, WI 53201E-mail: [email protected]
2 Data Assimilation OfficeNASA Goddard Space Flight CenterGreenbelt, MD 20771E-mail: [email protected]
3 Ocean Climate LaboratoryNOAA/NESDIS/NODCSSMC3, 4th Floor1315 East-West HighwaySilver Spring, MD 20910-3282E-mail: [email protected]
NA
TIO
NA
LO
CEA
NICAND ATMOSPHERIC
ADMIN
IST
RA
TIO
N
U.S. DEPARTMENT OF COMMER
CE
The Earth System Monitor (ISSN 1068-2678) is published quarterly by the NOAAEnvironmental Information Services office.Questions, comments, or suggestions forarticles should be directed to the Editor,Sheri A. Phillips. Requests for subscriptionsand changes of address should be directedto the Associate Editor, Nancy O’Donnell.
The mailing address for the EarthSystem Monitor is:
National Oceanographic Data CenterNOAA/NESDIS E/OC21SSMC3, 4th Floor1315 East-West HighwaySilver Spring, MD 20910-3282
EDITORSheri Phillips
Telephone: 202-606-4561Fax: 202-606-4586
E-mail: [email protected]
ASSOCIATE EDITORNancy O’Donnell
Telephone: 202-606-4561Fax: 202-606-4586
E-mail: [email protected]
DISCLAIMERMention in the Earth System Monitor ofcommercial companies or commercialproducts does not constitute an endorse-ment or recommendation by the NationalOceanic and Atmospheric Administrationor the U.S. Department of Commerce.Use for publicity or advertising purposes ofinformation published in the Earth SystemMonitor concerning proprietary productsor the tests of such products is notauthorized.
U.S. DEPARTMENT OF COMMERCERonald H. Brown, Secretary
National Oceanic andAtmospheric Administration
D. James Baker,Under Secretary and Administrator
3December 1995 EARTH SYSTEM MONITOR
News briefsNODC initiates use of new mailingaddress in preparation for move
As part of NOAA‘s consolidation ef-fort, the National Oceanographic DataCenter (NODC) is scheduled to relocate inJanuary 1996 from its current location atthe Universal Building in Washington D.C.to the NOAA complex in Silver Spring,MD. In order to expedite mail deliveryduring this transition, people desiring tocontact the NODC or send materials arerequested to use NODC‘s new address:
National Oceanographic Data CenterNOAA/NESDIS E/OCSSMC3, 4th Floor1315 East-West HighwaySilver Spring, MD 20910-3282
NODC mail deliveries to the UniversalBuilding are being routed through theNOAA complex, so that NODC may con-tinue to provide users with high-qualityproducts and services with a minimum ofdisruption through the relocation period.
Prototype integrated coastalmanagement CD-ROM debuts atUnited Nations Conference
A prototype interactive multi-mediaCD-ROM on integrated coastal manage-ment, which was developed by the Na-tional Ocean Service’s Office of OceanResources Conservation and Assessment(NOS/ORCA), debuted in October 1995 ata week-long United Nations EnvironmentProgramme (UNEP) conference on pro-tecting the marine environment fromland-based activities. The conference, heldat the U.S. State Department and at-tended by 300 delegates from over 100countries, was convened to negotiate anonbinding global agreement to helpprevent, reduce, and eliminate land-basedsources of marine degredation.
The CD-ROM, the second developedthis year by ORCA focusing on coastalissues, was introduced at an environmen-tal management and technology forumco-sponsored by NOAA, the State Depart-ment, and the U.S. EPA. It was designedto test the use of multimedia techniquesto enhance the presentation of conceptsand tools of integrated coastal manage-ment (ICM) to an international audience.Over 400 copies of the CD-ROM weredistributed at the conference.
Entitled “Analysis and Planning forIntegrated Coastal Management ,” the CDcontains still imagery, video, and audio to
States, China, Russia, Japan, and severalEuropean countries.
The general goals of the meetingwere to develop cohesion in the WDCsystem, learn about successes and chal-lenges in each WDC, and discuss the fu-ture of the WDC system. Also, a majordiscussion item of the conference was theInternational Council of the ScientificUnions‘ recent review of the WDC system.
Overall, the conference was a success.A new WDC Guide was drafted, whichaddresses many of the conference goals.In addition, significant progress wasachieved in developing World Wide Webaccess to all WDC‘s Home Pages.
Human Dimensions in the ArcticSystem (HARC) meeting held
Arctic System Science (ARCSS) DataManager David Mcginnis and CoordinatorMatt Cross of the National Snow and IceData Center (NSIDC) attended the firstmeeting of the Human Dimensions in theArctic System (HARC) in Tuscon, Arizonain October. The primary purpose of themeeting was to begin developing thescience plan for the HARC initiative. Meet-ing participants ranged from anthropolo-gists to climatologists to wildliferesearchers. Representatives from theother ARCSS programs were also presentas the group worked to define a scienceplan. The National Science Foundation(NSF) Social Science Program Managerand several representatives from theAlaska Native Science Council also at-tended. A Steering Committee chosenfrom meeting participants will take themeeting results and develop the final sci-ence plan, which will be delivered to theARCSS Program Management office atNSF.
Staff changes at NGDCDr. Michael S. Loughridge, Chief of
the National Geophysical Data Center’s(NGDC) Marine Geology and GeophysicsDivision (MGG), has been appointed asActing Director of the NGDC. The MGGDivision has a new interim management.Dr. Troy R. Holcombe, who served as Se-nior Scientist in the MGG Division, hasbeen appointed Acting Chief of the divi-sion, and Carla J. Moore was also ap-pointed as Acting Assistant Chief. Ms.Moore is the leader of MGG‘s Marine Ge-ology Program and online data accessinitiatives, and is a recipient of NOAA’sBronze Medal and the DOC Silver Medal.
present a framework for ICM; explainsmanagement concepts, processes, andmethods; and presents specific case stud-ies where these concepts have been em-ployed. Much of the conceptual and casestudy description is presented by interna-tional coastal planners and managers fromcountries including the United States,Japan, Ecuador, and Tanzania. In addition,a sample reference list is included, alongwith an electronic questionnaire on easeof use, depth and accuracy of content,and appropriateness of examples. Re-sponses to the questionnaires will enableORCA to evaluate both the content andpotential uses of the final CD.
Complimentary copies of this newinteractive product may be obtained bycontacting NOAA/NOS, Office of OceanResources Conservation and Assessment(N/ORCA1), 1305 East-West Highway, 9thFloor, Silver Spring, MD 20910; Phone:301-713-3000, ext. 114.
NOAA honors employees as part ofits 25th anniversary celebration
As part of NOAA’s 25th AnniversaryCelebration to honor 25 years of scienceand service to the nation, Dr. D. JamesBaker, Under Secretary for Oceans andAtmosphere, held two ceremonies to rec-ognize NOAA employees who have beenwith the agency since its inception onNovember 1, 1970. Dr. Baker and otherNOAA leadership were present at bothceremonies.
One ceremony was held at the NOAAcomplex in Silver Spring, MD, and washighlighted by a featured address from Dr.Robert White, the original administrator ofNOAA. A second ceremony was held inSuitland, MD, with additional commen-tary from NOAA officials. Both ceremonieswere followed by a reception.
NCDC participates in All WorldData Center Conference
Representing the World Data Center-A for Meteorology, Pete Steuer of the Na-tional Climatic Data Center (NCDC)attended the All World Data Center Con-ference held at Wageningen, Netherlandsin October. This was the first gathering ofall 37 World Data Centers (WDC). TheWDC system consists of representativesfrom ten countries including the United

4 December 1995EARTH SYSTEM MONITOR
Surface Marine Data, from page 2▲ Table 1. Quantities available in the surface marine atlases and CD-ROMs.
estimates, sampling and fair weatherbiases, surface layer formulation, equa-tions for astronomical calculations (e.g.,altitude of the sun), and netCDF dataaccess software.
The second main category is thegraphical representation of the data set.Volumes 2 through 5 consist mainly ofseasonal contour plots of climatology,standard deviation, and anomalies ofthe analyzed quantities. The quantitiesare organized according to parametertype. Volume 2 contains directly ob-served quantities and Volume 3 con-tains heat and momentum fluxes. Freshwater fluxes can be found in Volume 4,and Volume 5 has an assortment ofmiscellaneous derived quantities.
The data files associated with Atlasof Surface Marine Data 1994 are availablein both their analyzed and unanalyzedforms on CD-ROM and Exabyte tape.The majority of the analyzed quantitiesare contained in a set of three CD-ROMs, organized by parameter type.Disc 1 contains directly observed quan-tities (and number of observation files).Disc 2 contains heat, momentum, andfresh water fluxes. Disc 3 contains theremaining miscellaneous parameters.
On the CD-ROMs or magnetic tape,the 12 analyzed monthly climatologies(1945-1989) and the 540 analyzedmonthly anomalies (12 months x 45years) are stored in a single binary filefor each quantity using Unidata’s Net-work Common Data Format (netCDF).NetCDF allows access to binary filesfrom most computer platforms, using asingle set of FORTRAN or C subroutines.Easy-to-use FORTRAN access software isprovided for those unfamiliar withnetCDF. Number of observations per 1-by 1-degree square are stored similarly.Standard deviation fields are stored insmaller files (12 monthly fields per file)also using netCDF. Each anomaly ornumber of observations file is approxi-mately 46 megabytes. The standard de-viation files are a little more than 1megabyte in size.
Unanalyzed data for each parameteris stored using netCDF as well, withseparate files for each year. An unana-lyzed file contains the 12 monthly fieldsof mean, standard deviation, and num-ber of observations for a single year.Information is stored for only thosesquares containing 1 or more observa-
Directly observed quantitiesFilename Units Description Volume CD-ROM Rawcloud.nc %/100. fractional cloudiness 2 1 Aq.nc g/kg specific humidity 2 1 Asat.nc C sea level air temperature 2 1 Aslp.nc hPa sea level air pressure 2 1 Asst.nc C sea surface temperature 2 1 Au3.nc m/s zonal wind 2 1 Av3.nc m/s meridional wind 2 1 Aw3.nc m/s wind speed 2 3 A
Heat and momentum flux quantitiesFilename Units Description Volume CD-ROM Rawac.nc W/m2 short wave cloudiness N/A 2 N/A
sensitivity parameterachi.nc W/m2 long wave Chi sensitivity N/A 2 A
parameterae.nc hPa long wave vapor pressure N/A 2 A
sensitivity parameterfvcubed.nc m3/s3 ocean friction velocity cubed 3 3 Alatent3.nc W/m2 latent heat flux 3 2 Alongrad.nc W/m2 net long wave radiation 3 2 Anetheat.nc W/m2 constrained net heat flux 3 2 N/Asensib3.nc W/m2 sensible heat flux 3 2 Ashortrad.nc W/m2 net short wave radiation 3 2 N/Ataux3.nc N/m2 zonal wind stress 3 2 Atauy3.nc N/m2 meridional stress 3 2 A
Fresh water flux quantitiesFilename Units Description Volume CD-ROM Rawbuoyancy.nc kg/(ms3) constrained buoyancy flux 4 2 N/A
minus precipitationeminusp.nc mm/(3 hr) constrained evaporation 4 3 N/A
minus precipitationevaprate.nc mm/(3 hr) evaporation rate 4 2 Aprecip.nc mm/(3 hr) precipitation rate 4 2 Auq.n m/s zonal moisture flux 4 3 Avq.n m/s meridional moisture flux 4 3 A
Miscellaneous Derived QuantitiesFile Name Units Description Volume CD-ROM Rawairdens.nc kg/m sea level air density N/A 3 Aqs_qa.nc g/kg qsea minus q 5 3 Aqsea.nc g/kg sea level saturation 5 3 A
specific humidityrh.nc % relative humidity 5 3 Asst_sat.nc C sea minus air temperature 5 3 Aua.ncK K m/s zonal heat flux 5 N/A* Ava.ncK K m/s meridional heat flux 5 N/A* Avappress.nc hPa vapor pressure 5 3 Avirtemp.nc C virtual temperature N/A 3 Azdl.nc — 10m/Monin Obukhov length 5 3 A
Additional quantitiesFilename Units Description Volume CD-ROM Rawicemask.nc (none) ice masks (Alexander N/A 1,2,3 N/A
and Mobley 1976)salinity.nc p.s.u. monthly salinity (Levitus N/A 2 N/A
et al., 1994b)

5December 1995 EARTH SYSTEM MONITOR
tions during that month. While the sizeof these yearly files varies greatly, thetotal byte count for each parameter isaround 150 megabytes. At this time, theunanalyzed data is available only onExabyte tape. A CD-ROM set is underconsideration.
Products availableThe quantities available in the at-
lases and CD-ROMs are listed in Table 1.The column “Volume” indicates whichvolume of the atlas contains maps ofthe quantity. The column “CD-ROM”indicates which CD-ROM disc containsclimatology, anomaly, and standarddeviation of the analyzed quantity. Inthe column “Raw”, the abbreviation “A”indicates that unanalyzed statistics ofthe quantity are available. In each col-umn, the abbreviation “N/A” indicatesthe variable is not available in thatform. “N/A*” denotes analyzed fileswhich are not included in the 3 CD-ROM set, but are available on Exabytetape on request from NODC.
Ordering informationOrdering information for one or
more volumes of the Atlas of SurfaceMarine Data 1994 or the correspondingdata set (Table 2) is available via theInternet on the NODC World WideWeb site (URL http://www.nodc.noaa.gov/) or from:
National Oceanographic Data CenterUser ServicesNOAA/NESDIS E/OC21SSMC3, 4th Floor1315 East-West HighwaySilver Spring, MD 20910-3282Phone: 202-606-4549Fax: 202-606-4586e-mail: [email protected]
AcknowledgmentsThis research has been supported by NSF
grant ATM 9215811 (AMdS/CCY) and byNOAA’s Climate and Global Change Program(SL/CCY). This work was concluded after A. daSilva joined the Data Assimilation Office ofNASA’s Goddard Space Flight Center; the sup-port of R. Rood is acknowledged. The data setsand products represented by this atlas are fordistribution internationally, without restriction.
ReferencesAlexander, R., and R. Mobley, 1976: Monthly
average sea-surface temperature and ice-
pack limits on a 1o global grid. Mon. Wea.Rev., 104, 143-148.
Conkright, M. E., S. Levitus, and T. P. Boyer,1994: World Ocean Atlas 1994, Volume 1:Nutrients. NOAA Atlas NESDIS 1, U.S.Department of Commerce, NOAA, NES-DIS.
Dorman, C. E., and R. H. Bourke, 1978: A tem-perature correction for Tucker’s oceanrainfall estimates. Q. J. Royal Meteor. Soc.,104, 765-773.
Large, W., and S. Pond, 1981: Open oceanmomentum flux measurements in moder-ate to strong winds. J. Phys. Oceanogr., 11,324-336.
Large, W., and S. Pond, 1982: Sensible andlatent heat flux measurements over theocean. J. Phys. Oceanogr., 12, 464-482.
Levitus, S., 1982: Climatological Atlas of theWorld Ocean. NOAA Prof. Paper No. 13 ,U.S. Government Printing Office, Washing-ton DC, 17 fiches, 173 pp.
Levitus, S., and T. P. Boyer, 1994a: WorldOcean Atlas 1994, Volume 2: Oxygen.NOAA Atlas NESDIS 2, U.S. Department ofCommerce, NOAA, NESDIS.
Levitus, S., R. Burgett and T. P. Boyer, 1994b:World Ocean Atlas 1994, Volume 3: Salinity.NOAA Atlas NESDIS 3, U.S. Department ofCommerce, NOAA, NESDIS.
Levitus, S., and T. P. Boyer, 1994c: WorldOcean Atlas 1994, Volume 4: Temperature.NOAA Atlas NESDIS 4, U.S. Department ofCommerce, NOAA, NESDIS.
da Silva, A. M., C. C. Young and S. Levitus,1994a: Atlas of Surface Marine Data 1994,Volume 1: Algorithms and Procedures.NOAA Atlas NESDIS 6. U.S. Department of
Commerce, NOAA, NESDIS.da Silva, A. M., C. C. Young and S. Levitus,
1994b: Atlas of Surface Marine Data 1994,Volume 2: Anomalies of Directly ObservedQuantities. NOAA Atlas NESDIS 7. U.S.Department of Commerce, NOAA, NES-DIS.
da Silva, A. M., C. C. Young and S. Levitus,1994c: Atlas of Surface Marine Data 1994,Volume 3: Anomalies of Heat and Momen-tum Fluxes. NOAA Atlas NESDIS 8. U.S.Department of Commerce, NOAA, NES-DIS.
da Silva, A. M., C. C. Young and S. Levitus,1994d: Atlas of Surface Marine Data 1994,Volume 4: Anomalies of Fresh Water Fluxes.NOAA Atlas NESDIS 9. U.S. Department ofCommerce, NOAA, NESDIS.
da Silva, A. M., C. C. Young and S. Levitus,1994e: Atlas of Surface Marine Data 1994,Volume 5: Anomalies of Miscellaneous De-rived Quantities. NOAA Atlas NESDIS 10.U.S. Department of Commerce, NOAA,NESDIS.
Slutz, R. J., S. J. Lubker, J. D. Hiscox, S. D. Woo-druff, R. L. Jenne, D. H. Joseph, P. M.Steurer and J. D. Elms, 1985: COADS,Comprehensive Ocean—Atmosphere DataSet, Release 1. Climate Research Program,Environmental Research Laboratory, Boul-der, CO, 262 pp.
Tucker, G. B., 1961: Precipitation over theNorth Atlantic Ocean. Q. J. Royal Meteor.Soc., 87, 147-158.
Woodruff, S. D., R. J. Slutz, R. L. Jenne and P.M. Steurer, 1987: A comprehensiveocean—atmosphere data set. Bul. Amer.Meteor. Soc., 68, 1239-1250. ■
▲ Table 2. Atlas of Surface Marine Data 1994 publications and corresponding data setsavailable on CD-ROM. Analyzed files which are not included on the CD-ROMs can beacquired from the NODC on Exabyte tape.
Publications- Atlas of Surface Marine Data 1994, Volume 1: Algorithms and Procedures (83 pp.)- Atlas of Surface Marine Data 1994, Volume 2: Anomalies of Directly
Observed Quantities (416 pp.)- Atlas of Surface Marine Data 1994, Volume 3: Anomalies of Heat and
Momentum Fluxes (413 pp.)- Atlas of Surface Marine Data 1994, Volume 4: Anomalies of Fresh Water Fluxes (308 pp.)- Atlas of Surface Marine Data 1994, Volume 5: Anomalies of Miscellaneous
Derived Quantities (416 pp.)
CD-ROMs- Atlas of Surface Marine Data 1994: Directly observed quantities and
number of observations (Disc 1)- Atlas of Surface Marine Data 1994: Heat, momentum, and
fresh water fluxes (Disc 2)- Atlas of Surface Marine Data 1994: Miscellaneous derived quantities (Disc 3)
6 December 1995EARTH SYSTEM MONITOR
Solar databases for global change models
Helen E. Coffey, Edward H. Erwin, andChristine D. HanchettNational Geophysical Data CenterNOAA/NESDIS
The National Geophysical DataCenter (NGDC) is compiling a compre-hensive solar database for use in globalchange models. Solar radiation drivesthe Earth’s weather machine, and varia-tions in the Sun’s radiative output im-pact the Earth’s climate. Global changemodels need to discern between varia-tions caused by anthropogenic andnatural occurrences in order to providea sound scientific basis for policy-mak-ing on global change issues. The NGDCdata archives are part of a cross-disci-plinary effort within NOAA to link ob-served changes on the Sun withterrestrial climate.
With the advent of total solar irra-diance satellite measurements since1978, it is now documented that theamount of energy from the Sun variesover decadal time scales. The Sun sup-plies the energy for the Earth’s systemheat budget. The major componentsthat affect this heat budget are changesin the Earth’s orbit, internal processes(such as cloudiness, ice cover, anthro-pogenic effects, etc.), and variations insolar activity. Because the Earth’s cli-mate is changing, it is critical to under-stand the contributions of eachcomponent and take action when nec-essary to curb possible negative effectswe might have control over. A goodexample of this kind of action is theworldwide effort to reduce the amountof chlorofluorocarbons (CFCs) emittedby man. Climate variability is a majorissue and our understanding is still un-certain.
Changes in the Earth’s orbitThe largest effect on the amount of
solar radiation reaching Earth is due to
understood. NOAA scientists recentlyfound that clouds absorb more of theSun’s radiation than previously be-lieved — 15% versus the 4% currentlyaccepted theories predict. Thus, lesssolar radiation reaches the Earth’s sur-face in cloudy areas (39% versus 50%traditionally assumed) (Cess et al.,1995). Other NOAA scientists recentlyfound a significant increase in the lev-els of water vapor in the atmospherefrom 1981-1994, which could lead toglobal warming and a greater ozoneloss (Oltman et. al, 1995). A 1% drop inozone levels causes a 2% increase inskin cancer.
Stone (1995) suggests the effects ofglobal climate warming could contrib-ute to deaths due to a rising incidenceof summer heat waves. Just a 2-degreeCelsius increase would double the num-ber of unusually hot days. Also, infec-tious diseases could contribute tens ofmillions of more cases as mosquitoesand other pests expand their ranges.
Taubes (1995) points to a 2-degreeCelsius warming since the 1880s thataffected forests across Canada, Alaskaand Siberia. Though initially speedinggrowth and driving the forests fartherinto the Arctic at least in the 1930s and1940s, since the 1970s the trees areshowing stress. The stress is probablythe result of increased moisture loss,which leaves the trees open to morefrequent attacks from insects that haveproliferated in the warm weather.
There are many uncertainties inour understanding of the internal pro-cesses. It is to the benefit of mankind tostudy the Sun-climate system and tounderstand the consequences of ourimpact on this system.
Variations in solar activityNOAA’s plan for the U.S. Global
Change Research Program has a strongfocus on solar influences. The solarinfluences research plan, AtmosphericResponses to a Changing Sun (ARCS)studies solar inputs at the top of theEarth’s atmosphere and their effects onthe Earth’s system, whether immediate,secondary or tertiary. This block dia-gram (Figure 3) excerpted from the
NGDC compiles comprehensive solar database for use in global climate change studies
Solar-Terrestrial Physics DivisionNational Geophysical Data CenterNOAA/NESDIS325 BroadwayBoulder, CO 80303E-mail: [email protected]
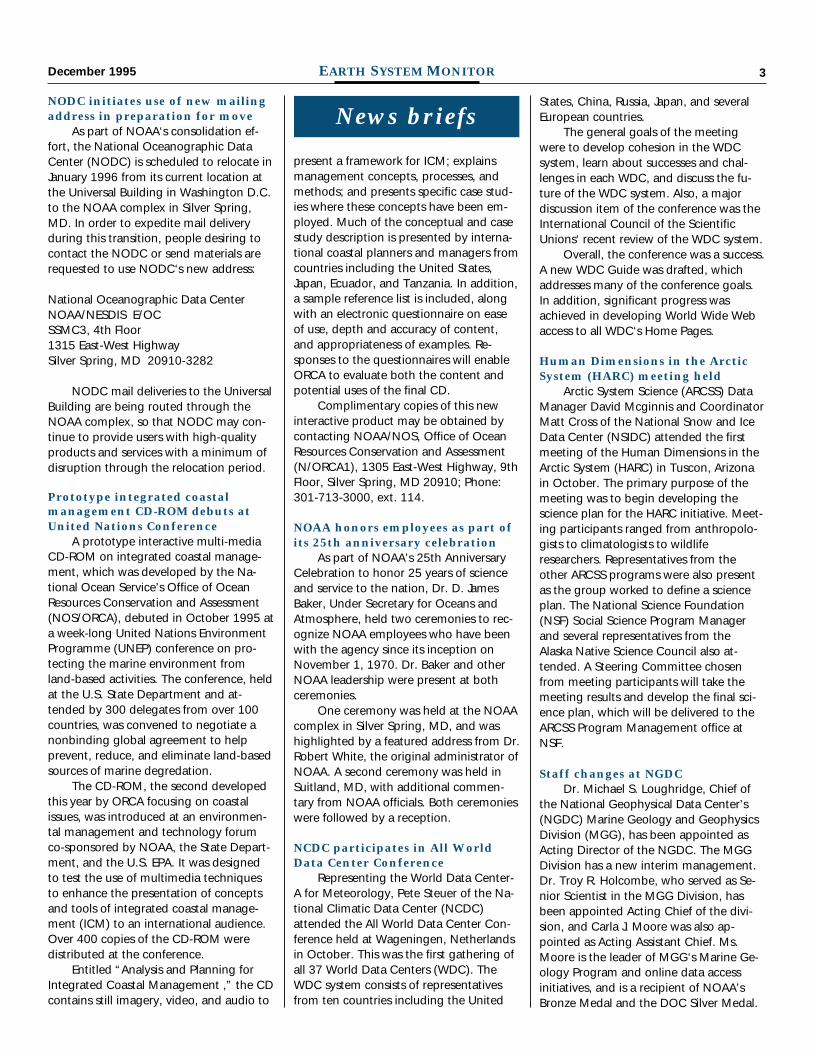
orbital changes in the Sun-Earth sys-tem. The Yugoslav mathematicianMilutin Milankovitch studied the or-bital parameters that cause seasonalvariations on Earth. He calculated inso-lation curves for different latitudes.(These data were kindly supplied by Dr.A. Berger, Catholic University ofLouvain; see Berger et al., 1991, formore details.) The degree of eccentricitychanges the relative Sun-Earth distanceon a 100,000 year cycle (Figure 1).
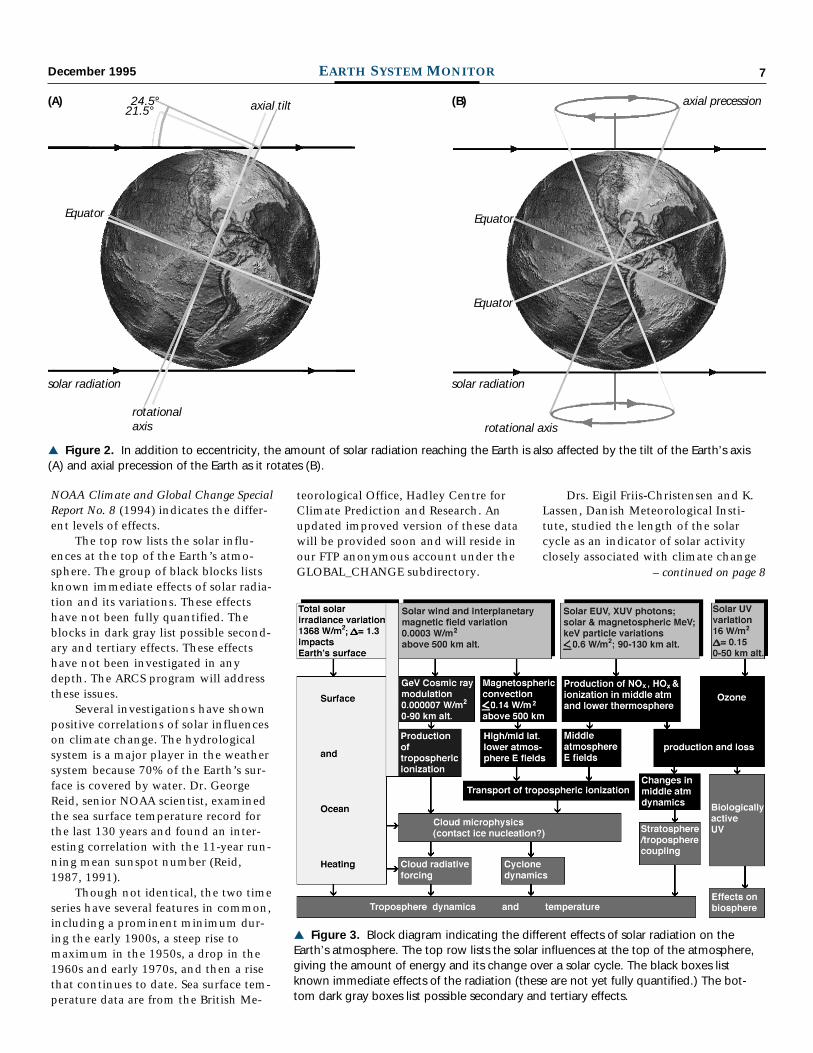
The Earth is in an orbit around theSun that is not quite circular because ofthe interactions with orbits and gravita-tional pull of other planets. The Earth’saxis tilts (obliquity) between 21.5 and24.5 degrees with respect to the orbitalplane (Figure 2A). It has a cycle of41,000 years. Like a spinning top, theEarth precesses around a circular path(Figure 2B) in a 19,000 to 21,000 yearcycle. Combining these effects, one cancalculate when ice ages and warm inter-vals will tend to occur.
The data show that at times of iceages, 60oN would receive as little insola-tion as 80oN today. As noted byThomson (1995), a lot of other smallereffects contribute to the overall totalamount of radiation that the Earth re-ceives, and the picture is very complex.
Complexities of internal processesThe complicated internal processes
that couple the atmosphere, the oceans,and terrestrial ecosystems are not well
▲ Figure 1. The Sun-Earth distancechanges because the Earth’s orbit is notquite circular (eccentricity). Eccenctricityaffects the amount of solar radiationreaching the Earth.
7December 1995 EARTH SYSTEM MONITOR
▲ Figure 2. In addition to eccentricity, the amount of solar radiation reaching the Earth is also affected by the tilt of the Earth’s axis(A) and axial precession of the Earth as it rotates (B).
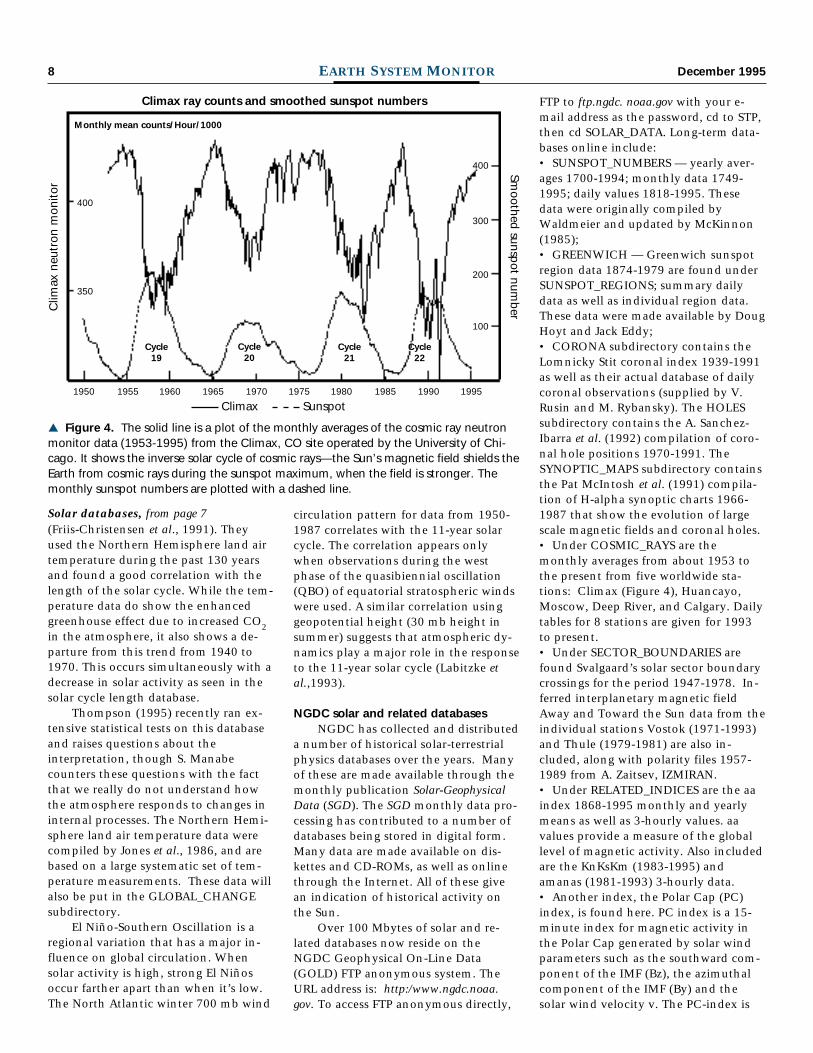
▲ Figure 3. Block diagram indicating the different effects of solar radiation on theEarth’s atmosphere. The top row lists the solar influences at the top of the atmosphere,giving the amount of energy and its change over a solar cycle. The black boxes listknown immediate effects of the radiation (these are not yet fully quantified.) The bot-tom dark gray boxes list possible secondary and tertiary effects.
NOAA Climate and Global Change SpecialReport No. 8 (1994) indicates the differ-ent levels of effects.
The top row lists the solar influ-ences at the top of the Earth’s atmo-sphere. The group of black blocks listsknown immediate effects of solar radia-tion and its variations. These effectshave not been fully quantified. Theblocks in dark gray list possible second-ary and tertiary effects. These effectshave not been investigated in anydepth. The ARCS program will addressthese issues.
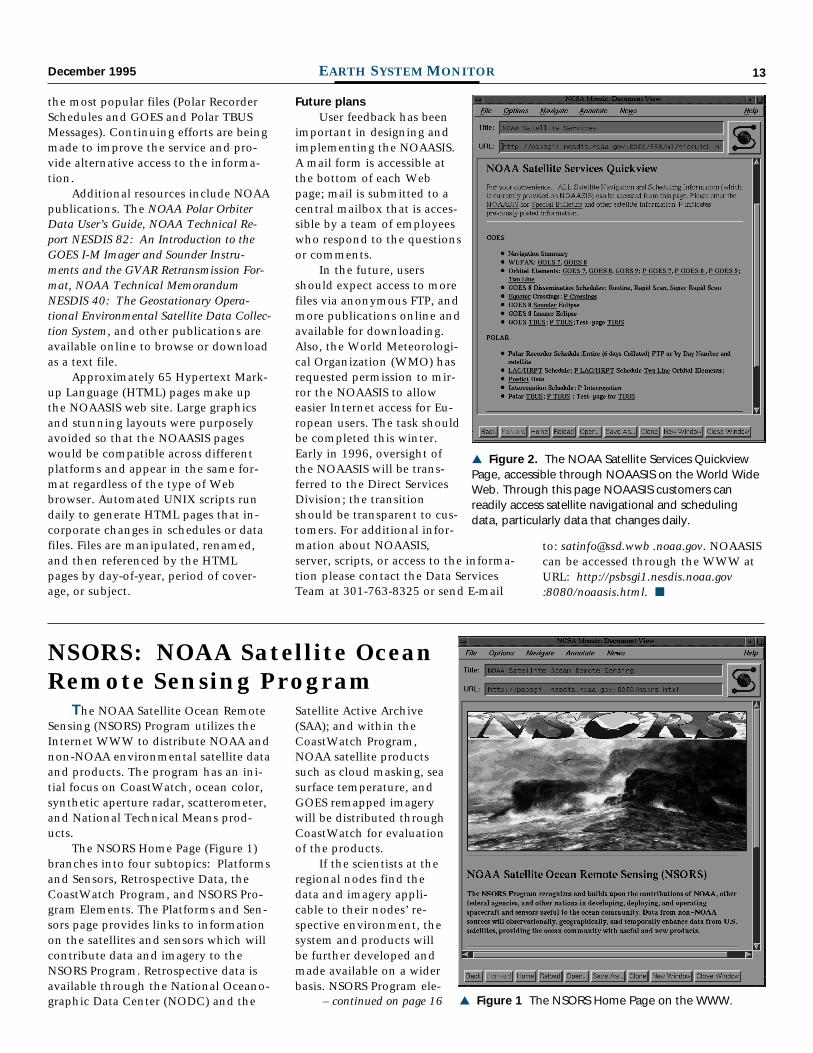
Several investigations have shownpositive correlations of solar influenceson climate change. The hydrologicalsystem is a major player in the weathersystem because 70% of the Earth’s sur-face is covered by water. Dr. GeorgeReid, senior NOAA scientist, examinedthe sea surface temperature record forthe last 130 years and found an inter-esting correlation with the 11-year run-ning mean sunspot number (Reid,1987, 1991).
Though not identical, the two timeseries have several features in common,including a prominent minimum dur-ing the early 1900s, a steep rise tomaximum in the 1950s, a drop in the1960s and early 1970s, and then a risethat continues to date. Sea surface tem-perature data are from the British Me-
Drs. Eigil Friis-Christensen and K.Lassen, Danish Meteorological Insti-tute, studied the length of the solarcycle as an indicator of solar activityclosely associated with climate change
teorological Office, Hadley Centre forClimate Prediction and Research. Anupdated improved version of these datawill be provided soon and will reside inour FTP anonymous account under theGLOBAL_CHANGE subdirectory.
(A) (B)
– continued on page 8
24.5°
Equator
solar radiation solar radiation
rotationalaxis
axial tilt axial precession
Equator
Equator
21.5°
rotational axis
8 December 1995EARTH SYSTEM MONITOR
FTP to ftp.ngdc. noaa.gov with your e-mail address as the password, cd to STP,then cd SOLAR_DATA. Long-term data-bases online include:• SUNSPOT_NUMBERS — yearly aver-ages 1700-1994; monthly data 1749-1995; daily values 1818-1995. Thesedata were originally compiled byWaldmeier and updated by McKinnon(1985);• GREENWICH — Greenwich sunspotregion data 1874-1979 are found underSUNSPOT_REGIONS; summary dailydata as well as individual region data.These data were made available by DougHoyt and Jack Eddy;• CORONA subdirectory contains theLomnicky Stit coronal index 1939-1991as well as their actual database of dailycoronal observations (supplied by V.Rusin and M. Rybansky). The HOLESsubdirectory contains the A. Sanchez-Ibarra et al. (1992) compilation of coro-nal hole positions 1970-1991. TheSYNOPTIC_MAPS subdirectory containsthe Pat McIntosh et al. (1991) compila-tion of H-alpha synoptic charts 1966-1987 that show the evolution of largescale magnetic fields and coronal holes.• Under COSMIC_RAYS are themonthly averages from about 1953 tothe present from five worldwide sta-tions: Climax (Figure 4), Huancayo,Moscow, Deep River, and Calgary. Dailytables for 8 stations are given for 1993to present.• Under SECTOR_BOUNDARIES arefound Svalgaard’s solar sector boundarycrossings for the period 1947-1978. In-ferred interplanetary magnetic fieldAway and Toward the Sun data from theindividual stations Vostok (1971-1993)and Thule (1979-1981) are also in-cluded, along with polarity files 1957-1989 from A. Zaitsev, IZMIRAN.• Under RELATED_INDICES are the aaindex 1868-1995 monthly and yearlymeans as well as 3-hourly values. aavalues provide a measure of the globallevel of magnetic activity. Also includedare the KnKsKm (1983-1995) andamanas (1981-1993) 3-hourly data.• Another index, the Polar Cap (PC)index, is found here. PC index is a 15-minute index for magnetic activity inthe Polar Cap generated by solar windparameters such as the southward com-ponent of the IMF (Bz), the azimuthalcomponent of the IMF (By) and thesolar wind velocity v. The PC-index is
Smoothed sunsp
ot number
Climax ray counts and smoothed sunspot numbers
Clim
ax n
eutr
on m
onito
r
400
400
300
200
100
350
1950 1955 1960 1965 1970 19951990198519801975
Cycle20
Monthly mean counts/Hour/1000
Climax Sunspot
circulation pattern for data from 1950-1987 correlates with the 11-year solarcycle. The correlation appears onlywhen observations during the westphase of the quasibiennial oscillation(QBO) of equatorial stratospheric windswere used. A similar correlation usinggeopotential height (30 mb height insummer) suggests that atmospheric dy-namics play a major role in the responseto the 11-year solar cycle (Labitzke etal.,1993).
NGDC solar and related databasesNGDC has collected and distributed
a number of historical solar-terrestrialphysics databases over the years. Manyof these are made available through themonthly publication Solar-GeophysicalData (SGD). The SGD monthly data pro-cessing has contributed to a number ofdatabases being stored in digital form.Many data are made available on dis-kettes and CD-ROMs, as well as onlinethrough the Internet. All of these givean indication of historical activity onthe Sun.
Over 100 Mbytes of solar and re-lated databases now reside on theNGDC Geophysical On-Line Data(GOLD) FTP anonymous system. TheURL address is: http:/www.ngdc.noaa.gov. To access FTP anonymous directly,
(Friis-Christensen et al., 1991). Theyused the Northern Hemisphere land airtemperature during the past 130 yearsand found a good correlation with thelength of the solar cycle. While the tem-perature data do show the enhancedgreenhouse effect due to increased CO2in the atmosphere, it also shows a de-parture from this trend from 1940 to1970. This occurs simultaneously with adecrease in solar activity as seen in thesolar cycle length database.
Thompson (1995) recently ran ex-tensive statistical tests on this databaseand raises questions about theinterpretation, though S. Manabecounters these questions with the factthat we really do not understand howthe atmosphere responds to changes ininternal processes. The Northern Hemi-sphere land air temperature data werecompiled by Jones et al., 1986, and arebased on a large systematic set of tem-perature measurements. These data willalso be put in the GLOBAL_CHANGEsubdirectory.
El Niño-Southern Oscillation is aregional variation that has a major in-fluence on global circulation. Whensolar activity is high, strong El Niñosoccur farther apart than when it’s low.The North Atlantic winter 700 mb wind
Solar databases, from page 7
▲ Figure 4. The solid line is a plot of the monthly averages of the cosmic ray neutronmonitor data (1953-1995) from the Climax, CO site operated by the University of Chi-cago. It shows the inverse solar cycle of cosmic rays—the Sun’s magnetic field shields theEarth from cosmic rays during the sunspot maximum, when the field is stronger. Themonthly sunspot numbers are plotted with a dashed line.
Cycle19
Cycle21
Cycle22

9December 1995 EARTH SYSTEM MONITOR
based on an idea by Dr. Troshichev anddeveloped by him and others (seeVennerstrom et al., 1994). Files includedata from Vostok (1978-1979 and 1983-1992) and Thule (1975-1995).• Under SUDDEN_COMMENCEMENTSare the geomagnetic sudden storm com-mencements 1868-1975 by Fr. Mayaud(IAGA Bulletin 32) and continuing to thepresent preliminary data issued by theISGI Bulletin, Debilt Netherlands (1983-1987) and now issued monthly by Fr.Cardus, Ebro Magnetic Observatory andthe Institut de Physique du Globe, Paris.• Under ATM_HANDBOOK is the Atmo-spheric Handbook compiled by Dr. VernDerr, NOAA ERL (1984). The data arelargely from results published in jour-nals. The descriptive text is in digitalform along with over 200 data files.
Data include attenuation coeffi-cients for the atmosphere and H2O,atmospheric parameters for 1962 stan-dard atmosphere, cloud drop size distri-butions, solar spectral irradiance, skyspectral irradiance, etc. Several FOR-TRAN programs exist for retrieving se-lect data.• STRATWARMS lists all the strato-spheric warmings issued for 1987-1995by the Frei University of Berlin. ASTRATWARM is a major disturbance ofthe winter polar middle atmosphere(troposphere to D-region) resulting froma breakdown of the polar vortex intotwo cells. Air trapped in the vortex ismixed by the new meridional flow andcan be exposed to sunlight. Solar Lymanalpha ionizes the nitric oxide, enhanc-ing electron density and producingstrong HF absorption.• The total SOLAR_IRRADIANCE datacover the satellite observing time period1978 to present and include data fromNimbus, SMM, NOAA, ERBS and UARS.Earlier proxy data on-line include theGreenwich sunspot area database (1876to present) for sunspot blocking dataand McMath Calcium II K-line plagedata (1942-1987) for brightness data (seeCALCIUM). Most of these Calcium datawere reduced by Dr. Helen DodsonPrince. A digital database of calciumplage imagery from Mt. Wilson willsoon be available from Dr. Peter Foukal.• On-line SOLAR_UV databases includeSME (1982-1988), SERF3, UARS SOL-STICE (HI Lyman alpha, Mg core-to-wing ratio, Ca core-to-wing ration, and200-205 nm integrated flux — Oct 91-
Sep 94), Nimbus-7 (1978-1984) andNOAA9 (1986-1988). Solar UV interactssignificantly with the ozone layer — a1% drop in ozone levels can cause a 2%increase in skin cancer. Solar UV may be50% of the variation of the total solarirradiance. Proxy data for UV includethe Penticton solar radio flux at 2800MHz (10.7 cm). We have on-line datafrom 1947 to the present.• Event data, like solar flares (FINAL_FLARE) and SOLAR_RADIO BURST andPARTICLES data can be found as well asbackground data, such as the CALCIUMplage daily values, the GOES SAT_EN-VIRONMENT ELECTRONS and X-RAYbackground database, sunspot regions(SUNSPOT_REGIONS) and StanfordSun-as-a-Star data (STANFORD_DATA).• In addition to the solar INSOLATIONdatabase, the NGDC Paleoclimate grouphas tree ring data (International Tree-ring Data Bank 6000 B.C. to 1991 A.D.)on-line, along with radio carbon (C14)data (10,000-2,000 ybp). They also holdother relevant databases.
NGDC holds archives of GOES,NOAA/TIROS and DMSP satellite envi-ronment data. Some of these data areavailable on-line and accessible throughthe GOLD on-line system. CD-ROMs of
the data are also available. Extensivecosmic ray archives (hourly values frommore than 100 stations) are available onCD-ROM.
We refer the reader to the NOAAClimate and Global Change ProgramSpecial Report No. 8, Solar Influences onGlobal Change — A Strategic plan for aNOAA Program (available on request) foran in-depth article by Dr. Brian Tinsleyentitled “Review of Correlations, Pro-cesses, and Future Research.” Tinsleyreviews recent work in the field, includ-ing criticisms, and addresses topics forfurther research. The comprehensiveNRC report, Solar Influences on GlobalChange, is also a valuable tool for ad-dressing future research.
AcknowledgmentsInspiration for this work came from the bookClimate — our future? by Ulrich Schotterer thatuses artistic imagery and sophisticated scientifictext to present a global analysis of the issuesand processes affecting climate change. We arealso indebted to the recent National ResearchCouncil report, Solar Influences on GlobalChange, for an in-depth overall study of theeffects of solar variations on our climate. Dr.Peter Sloss, NGDC, provided the planet Earth
▲ Figure 5. Total solar irradiance data from six different satellites are plotted from1978 to 1995. This measures the total amount of energy from the sun hitting the top ofthe Earth’s atmosphere (Watts/m2). A 0.01% change is seen between sunspot maximumand unspot minimum. It is thought that the extended sunspot minimum during theearly 1700s contributed to the Little Ice Age on Earth.
– continued on page 14

10 December 1995EARTH SYSTEM MONITOR
GLOBE program brings relevanceto science activities for today’s students
International education program coordinates work of students, teachers, and scientists
Wayne M. Faas 1
National Climatic Data CenterNOAA/NESDIS
Valerie LaHart 2
Cobb Middle SchoolTallahassee, FL
Global Learning and Observationsto Benefit the Environment (GLOBE) isan international hands-on environmen-tal science and education program thatwas officially started on Earth Day,1995. GLOBE uses scientific instru-ments and state-of-the-art technologyto make science relevant to today’s K-12 students. Vice President Gore articu-lated his vision for the GLOBE programin his book, Earth in the Balance. Heproposed a program “involving asmany countries as possible that will useschool teachers and their students tomonitor the entire earth...” (Gore,1992). Today, GLOBE is a worldwidescience and education program coordi-nating the work of students, teachers,and scientists to study and understandthe global environment.
The GLOBE Program office sentschool districts grant applications inthe fall of 1994. Schools (K-12) couldrequest federal assistance in the form ofcomputer equipment, scientific tools,and/or travel expenses. Hundreds ofproposals were reviewed and selected“GLOBE schools” were based on thegeographic location, the student popu-lation and other factors. By the summerof 1995, over 1,500 schools represent-ing every state were participating in theimplementation of GLOBE. Several
foreign countries have indicated aninterest in GLOBE, and many have re-ceived training.
Teachers attend an intense, three-day workshop session conducted byprofessional teams of meteorologistsand other scientists, computer techni-cians, and educators. Participants re-ceive teaching materials, software,inservice credit, and other support ma-terials to make their participation inGLOBE a success.
Through the GLOBE program, stu-dents monitor certain environmentalparameters for scientists who are study-ing environmental and global changes.Monitoring three Earth systems—theatmosphere, hydrosphere, and bio-sphere—students enter their observa-tions on the GLOBE student data screenthrough the computer, disseminatethem via the World Wide Web onInternet, and receive graphic visualiza-tions of how their data “fits” in theglobal environmental monitoring pro-grams (Figure 1). With GLOBE, “Mea-sure locally, learn globally” enables
students to discover their connection tothe Earth’s systems.
After preparatory activities, stu-dents map out a “pixel” (30m x 30mstudy area) using a Magellan GroundPositioning System. Students read thelatitude, longitude, and determine theelevation of the study area; the numberof satellites that are helping to deter-mine the precise location; and otherrelevant data. By determining the lati-tude and longitude, students are givingNASA their specific school location. A15km x 15km Landsat Thematic Map-per (TM) image, centered on theirschool, is sent to each GLOBE school.Using a computer program calledMultispecTM, students manipulate theimage and learn more about remotesatellite imaging and their specific area.
GLOBE schools establish a atmo-sphere/climate study site where stu-dents take daily readings of minimum,maximum and current temperature,daily rainfall, and cloud coverage. Stu-dents report these data to the NOAAdatabase through a GLOBE student data
National Climatic Data CenterNOAA/NESDIS151 Patton AveAsheville, NC 28801-5001E-mail: [email protected]
Physical SciencesCobb Middle School915 Hillcrest AvenueTallahassee, FL 32308Phone: 904-488-3364
▲ Figure 1. Gray scale rendition of color visualization of temperature collected world-wide. Data utilized in creating this graphic was collected by students participating inGLOBE. Presentations such as this aid in demonstrating to GLOBE students how theirdata is applied in global environmental monitoring programs.

11December 1995 EARTH SYSTEM MONITOR
page on the World Wide Web. Usingthe student data and other NOAA Na-tional Weather Service products,GLOBE transmits maps via the web tothe student’s computer.
Scientists chose temperature andprecipitation to study because they arefundamental weather parameters. Theydetermine the “suitability” of a locationto live or an area to grow certain crops.What is the average temperature? Whatis the range of temperatures? Howmuch precipitation falls in a particulararea?
Reliable temperature and precipita-tion data are unavailable to the scien-tific community for many regions ofthe world. Student-collected data willfill in some of these “data sparse” areas.Data collected in “data-rich” areas arealso important. They can be used tostudy the local effects of cities, groundcover, and topography. These impor-tant weather data help internationalscientists answer questions about globalchange.
When students explore the bio-sphere (biology study site), they mapand study vegetation. Students usespecified scientific protocol to measurethe canopy cover, height and diameterof trees and other plant species. Theyalso specify the land cover type, usingthe Anderson Level II Ground Coverchart. These data are transmitted atleast twice a year so that scientists cantrack changes.
GLOBE students conduct a numberof measurements about the kind andsize of the vegetation that characterizestheir own study areas. Since satellitessuch as Landsat TM have resolutionswhich do not allow scientists to iden-tify individual trees and ground cover,detailed assessment of these conditionsby GLOBE students are making a sig-nificant contribution to the under-standing and use of satellite data.
Student exploration of the hydro-sphere (water study site) includes mea-suring water temperature and pH andsubmitting data once a week. In addi-tion, high school students measure soilmoisture daily. This measurement al-lows students and scientists to monitorhow precipitation patterns influencethis important component of the hy-drologic cycle. Access to the GLOBEnetwork of soil moisture data collectedat different soil depths provide scien-
tists with a unique and importantsource of information.
The international scientific com-munity will use the information col-lected by GLOBE students because thestudents make their measurements fol-lowing strict protocols with calibratedinstruments. Participating GLOBE sci-entists access the data available via In-ternet (http://www.ncdc.noaa.gov). Insome cases, student data constitutes“ground truthing” that supports re-search which use satellite datasets.These satellite data are used to monitorenvironmental parameters from space.
As students observe the normalseasonal changes (phenology) that oc-cur within their study site, their dataallow scientists to monitor the greenwave (spring leaf development) andbrown wave (fall foliar color change)phenomena with greater precision.Subtle changes in phenology are a use-ful indicator of climate change. In addi-tion, differences in phenology withinan area is an early indicator of environ-mental stress on local vegetation. Inboth cases, GLOBE phenology datamakes a valuable contribution to inter-preting satellite-based assessments ofvegetation types and condition.
The GLOBE program addressesboth science and education objectivesand is an equal partnership founded onthe needs of both. Students learn the
▲ Figure 2. Gray scale rendition of the first temperature contour map for the continen-tal U.S. generated solely from GLOBE student data.
rigors and excitement of hands-on sci-ence and scientists have additional datato conduct their research. The GLOBEprogram contributes significantly bygathering important data, educatingstudents and to a better understandingof our world. Take a look at the GLOBEhome page at http://globe.fsl.noaa.gov.
The National Oceanic and Atmo-spheric Administration (NOAA), theNational Aeronautics and Space Admin-istration (NASA), the National ScienceFoundation (NSF), and the Environ-mental Protection Agency (EPA) sup-port the GLOBE program. For furtherinformation contact: GLOBE, 744 Jack-son Place, NW, Washington, DC.20503, or by Internet at URL:[email protected].
ReferencesGore, A., Earth in the Balance (Ecology and the
Human Spirit), Houghton Mifflin Com-pany, New York, NY, June, 1992, 407 pp.
About the authors:W. Faas is a meteorologist with the
NOAA/National Climatic Data Center, Ashe-ville, NC, and one of the principal investigatorswho selected and designed the student mea-surements of atmospheric parameters. V.LaHart teaches 8th grade Physical Science atCobb Middle School, Tallahassee, FL., whereshe is a lead GLOBE teacher. Both are membersof the GLOBE teaching staff. ■

12 December 1995EARTH SYSTEM MONITOR
NOAA Satellite Information System (NOAASIS)
Bulletins” that informs users of activi-ties that impact customer satellite op-erations. The HTML Source pages areautomatically updated daily and on-demand when warranted. Cooperationamong offices provides for the timelyposting of satellite status reports, dataschedules, navigational messages, and“Special Bulletins.”
The data provided is not imagery;rather, it is the information necessaryto collect and process imagery data.Other available information includessatellite and sensor descriptions, somepublications and technical reports, de-scriptions of available data services,links to other satellite related sites, andupcoming events such as user confer-ences and meetings.
NOAASIS focuses on NOAA’s geo-stationary and polar satellites. Descrip-tions of the platforms, data formats,and sources of additional informationare all available through a Satellite In-formation page. Links to othercountry’s satellites such as METEOSATare also provided. The most frequentlyaccessed files are those pertaining tosatellite broadcast schedules, coverage,and navigation.
Customers, whether using Auto-matic Picture Transmission (APT), HighResolution Picture Transmission(HRPT), or Weather Facsimile (WEFAX),require information such as satelliteorbital parameters and data transferperiods to align their antennae andacquire a transmission signal. NOAASISprovides these customers, universities,corporations and commercial entities,the U.S. Government, and other indi-viduals with the information needed toreceive satellite imagery.
Navigation and scheduling infor-mation can be accessed in several ways.The hierarchical “tree” structure of theweb pages leads a user to the data usu-ally within three web pages. Since mostof the NOAASIS customers access dataseveral times a week, all navigationaland scheduling data is presentedon one page (Figure 2). This featureallows users to view or retrieve only thedata that changes daily.
Anonymous FTP has recently beenmade available for automated access to
For this rea-son, the site isconsidered anoperational bul-letin boardrather than sim-ply a HomePage. From itsonset in March1995, usage hasincreasedsteadily withapproximately3000 users rou-tinely accessingthe site perweek.
HistorySSD has pro-
vided the envi-ronmentalsatellite usercommunity withsatellite-relatedinformationsince September1990. Early dis-tribution wasperformed bymailings, elec-tronic mail and a
dial-up bulletin board. Dial-up servicecontinues with direct modem access toa multi-line system, however, datatransfer is costly and quality is poor forout-of-state and international users,due to long distance charges and/ornoisy phone lines.
In March 1995, SSD implementedan Internet version (Figure 1) of thedial-up bulletin board that has becomean invaluable tool for distributing in-formation. Since implementation, dial-up usage has decreased from 600 callsper month to 40 while Internet activityhas grown to 12,000 accesses permonth. However, the dial-up serviceremains available to users without In-ternet connectivity and also serves as aback-up to NOAASIS.
Environmental satellite informationNOAASIS includes information
updated daily, weekly, monthly, andimportant messages called “Special
▲ Figure 1. Gray scale rendition of the NOAASIS Web site, whichis accessible through the Internet version of SSD‘s dial-up bulletinboard.
Lieutenant (jg) Michael SoraccoSatellite Services DivisionNOAA/NESDIS
The Satellite Services Division(SSD) of NOAA’s National Environmen-tal Satellite, Data, and Information Ser-vice (NESDIS) currently maintains aWorld Wide Web (WWW) site on theInternet to distribute NOAA environ-mental satellite information. TheNOAA Satellite Information System(NOAASIS) serves as a central locationfor disseminating satellite informationprovided by various contributors withinNESDIS and the external satellite com-munity.
World Wide Web sites provide access to environmental satellite-related products and information
Satellite Services DivisionNOAA/NESDIS E/SP2NOAA Science Center5200 Auth Road, Room 806Camp Springs, MD 20746E-mail: [email protected]
13December 1995 EARTH SYSTEM MONITOR
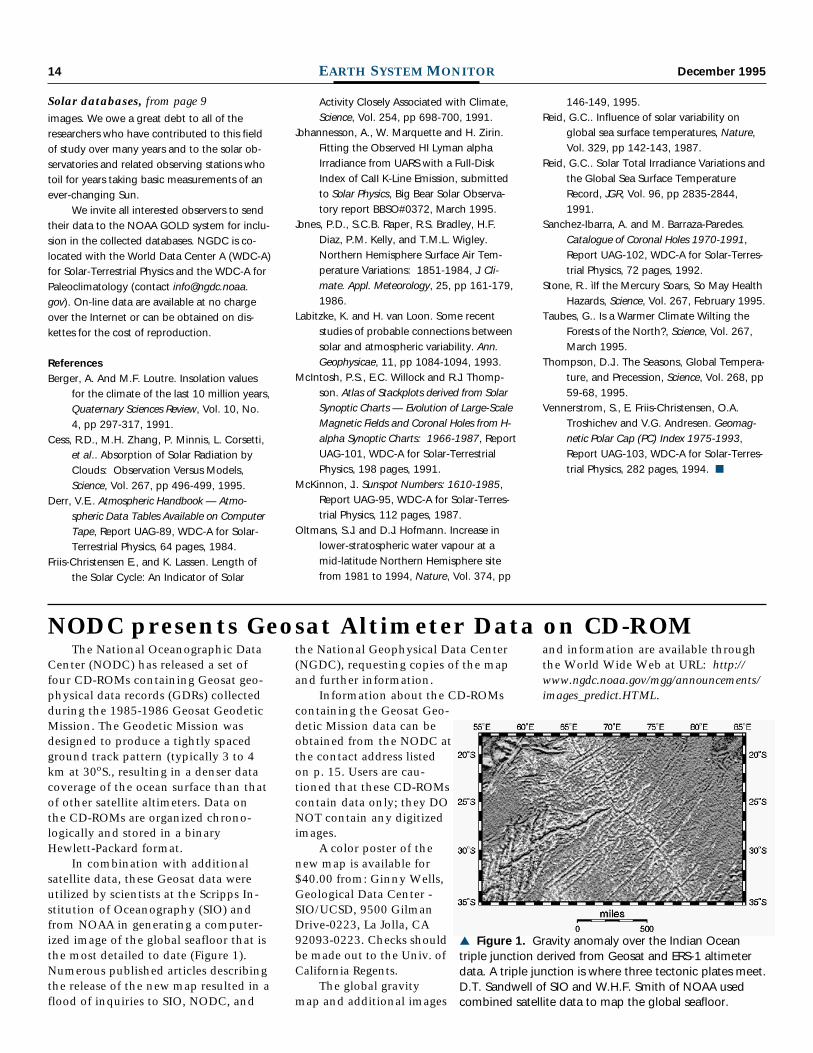
the most popular files (Polar RecorderSchedules and GOES and Polar TBUSMessages). Continuing efforts are beingmade to improve the service and pro-vide alternative access to the informa-tion.
Additional resources include NOAApublications. The NOAA Polar OrbiterData User’s Guide, NOAA Technical Re-port NESDIS 82: An Introduction to theGOES I-M Imager and Sounder Instru-ments and the GVAR Retransmission For-mat, NOAA Technical MemorandumNESDIS 40: The Geostationary Opera-tional Environmental Satellite Data Collec-tion System, and other publications areavailable online to browse or downloadas a text file.
Approximately 65 Hypertext Mark-up Language (HTML) pages make upthe NOAASIS web site. Large graphicsand stunning layouts were purposelyavoided so that the NOAASIS pageswould be compatible across differentplatforms and appear in the same for-mat regardless of the type of Webbrowser. Automated UNIX scripts rundaily to generate HTML pages that in-corporate changes in schedules or datafiles. Files are manipulated, renamed,and then referenced by the HTMLpages by day-of-year, period of cover-age, or subject.
Future plansUser feedback has been
important in designing andimplementing the NOAASIS.A mail form is accessible atthe bottom of each Webpage; mail is submitted to acentral mailbox that is acces-sible by a team of employeeswho respond to the questionsor comments.
In the future, usersshould expect access to morefiles via anonymous FTP, andmore publications online andavailable for downloading.Also, the World Meteorologi-cal Organization (WMO) hasrequested permission to mir-ror the NOAASIS to alloweasier Internet access for Eu-ropean users. The task shouldbe completed this winter.Early in 1996, oversight ofthe NOAASIS will be trans-ferred to the Direct ServicesDivision; the transitionshould be transparent to cus-tomers. For additional infor-mation about NOAASIS,server, scripts, or access to the informa-tion please contact the Data ServicesTeam at 301-763-8325 or send E-mail
▲ Figure 2. The NOAA Satellite Services QuickviewPage, accessible through NOAASIS on the World WideWeb. Through this page NOAASIS customers canreadily access satellite navigational and schedulingdata, particularly data that changes daily.
to: [email protected] .noaa.gov. NOAASIScan be accessed through the WWW atURL: http://psbsgi1.nesdis.noaa.gov:8080/noaasis.html. ■
▲ Figure 1 The NSORS Home Page on the WWW.
The NOAA Satellite Ocean RemoteSensing (NSORS) Program utilizes theInternet WWW to distribute NOAA andnon-NOAA environmental satellite dataand products. The program has an ini-tial focus on CoastWatch, ocean color,synthetic aperture radar, scatterometer,and National Technical Means prod-ucts.
The NSORS Home Page (Figure 1)branches into four subtopics: Platformsand Sensors, Retrospective Data, theCoastWatch Program, and NSORS Pro-gram Elements. The Platforms and Sen-sors page provides links to informationon the satellites and sensors which willcontribute data and imagery to theNSORS Program. Retrospective data isavailable through the National Oceano-graphic Data Center (NODC) and the
Satellite Active Archive(SAA); and within theCoastWatch Program,NOAA satellite productssuch as cloud masking, seasurface temperature, andGOES remapped imagerywill be distributed throughCoastWatch for evaluationof the products.
If the scientists at theregional nodes find thedata and imagery appli-cable to their nodes’ re-spective environment, thesystem and products willbe further developed andmade available on a widerbasis. NSORS Program ele-
NSORS: NOAA Satellite OceanRemote Sensing Program
– continued on page 16
14 December 1995EARTH SYSTEM MONITOR
and information are available throughthe World Wide Web at URL: http://www.ngdc.noaa.gov/mgg/announcements/images_predict.HTML.
images. We owe a great debt to all of theresearchers who have contributed to this fieldof study over many years and to the solar ob-servatories and related observing stations whotoil for years taking basic measurements of anever-changing Sun.
We invite all interested observers to sendtheir data to the NOAA GOLD system for inclu-sion in the collected databases. NGDC is co-located with the World Data Center A (WDC-A)for Solar-Terrestrial Physics and the WDC-A forPaleoclimatology (contact [email protected]). On-line data are available at no chargeover the Internet or can be obtained on dis-kettes for the cost of reproduction.
ReferencesBerger, A. And M.F. Loutre. Insolation values
for the climate of the last 10 million years,Quaternary Sciences Review, Vol. 10, No.4, pp 297-317, 1991.
Cess, R.D., M.H. Zhang, P. Minnis, L. Corsetti,et al.. Absorption of Solar Radiation byClouds: Observation Versus Models,Science, Vol. 267, pp 496-499, 1995.
Derr, V.E.. Atmospheric Handbook — Atmo-spheric Data Tables Available on ComputerTape, Report UAG-89, WDC-A for Solar-Terrestrial Physics, 64 pages, 1984.
Friis-Christensen E., and K. Lassen. Length ofthe Solar Cycle: An Indicator of Solar
Activity Closely Associated with Climate,Science, Vol. 254, pp 698-700, 1991.
Johannesson, A., W. Marquette and H. Zirin.Fitting the Observed HI Lyman alphaIrradiance from UARS with a Full-DiskIndex of CaII K-Line Emission, submittedto Solar Physics, Big Bear Solar Observa-tory report BBSO#0372, March 1995.
Jones, P.D., S.C.B. Raper, R.S. Bradley, H.F.Diaz, P.M. Kelly, and T.M.L. Wigley.Northern Hemisphere Surface Air Tem-perature Variations: 1851-1984, J. Cli-mate. Appl. Meteorology, 25, pp 161-179,1986.
Labitzke, K. and H. van Loon. Some recentstudies of probable connections betweensolar and atmospheric variability. Ann.Geophysicae, 11, pp 1084-1094, 1993.
McIntosh, P.S., E.C. Willock and R.J. Thomp-son. Atlas of Stackplots derived from SolarSynoptic Charts — Evolution of Large-ScaleMagnetic Fields and Coronal Holes from H-alpha Synoptic Charts: 1966-1987, ReportUAG-101, WDC-A for Solar-TerrestrialPhysics, 198 pages, 1991.
McKinnon, J.. Sunspot Numbers: 1610-1985,Report UAG-95, WDC-A for Solar-Terres-trial Physics, 112 pages, 1987.
Oltmans, S.J. and D.J. Hofmann. Increase inlower-stratospheric water vapour at amid-latitude Northern Hemisphere sitefrom 1981 to 1994, Nature, Vol. 374, pp
146-149, 1995.Reid, G.C.. Influence of solar variability on
global sea surface temperatures, Nature,Vol. 329, pp 142-143, 1987.
Reid, G.C.. Solar Total Irradiance Variations andthe Global Sea Surface TemperatureRecord, JGR, Vol. 96, pp 2835-2844,1991.
Sanchez-Ibarra, A. and M. Barraza-Paredes.Catalogue of Coronal Holes 1970-1991,Report UAG-102, WDC-A for Solar-Terres-trial Physics, 72 pages, 1992.
Stone, R.. ìIf the Mercury Soars, So May HealthHazards, Science, Vol. 267, February 1995.
Taubes, G.. Is a Warmer Climate Wilting theForests of the North?, Science, Vol. 267,March 1995.
Thompson, D.J.. The Seasons, Global Tempera-ture, and Precession, Science, Vol. 268, pp59-68, 1995.
Vennerstrom, S., E. Friis-Christensen, O.A.Troshichev and V.G. Andresen. Geomag-netic Polar Cap (PC) Index 1975-1993,Report UAG-103, WDC-A for Solar-Terres-trial Physics, 282 pages, 1994. ■
▲ Figure 1. Gravity anomaly over the Indian Oceantriple junction derived from Geosat and ERS-1 altimeterdata. A triple junction is where three tectonic plates meet.D.T. Sandwell of SIO and W.H.F. Smith of NOAA usedcombined satellite data to map the global seafloor.
the National Geophysical Data Center(NGDC), requesting copies of the mapand further information.
Information about the CD-ROMscontaining the Geosat Geo-detic Mission data can beobtained from the NODC atthe contact address listedon p. 15. Users are cau-tioned that these CD-ROMscontain data only; they DONOT contain any digitizedimages.
A color poster of thenew map is available for$40.00 from: Ginny Wells,Geological Data Center -SIO/UCSD, 9500 GilmanDrive-0223, La Jolla, CA92093-0223. Checks shouldbe made out to the Univ. ofCalifornia Regents.
The global gravitymap and additional images
The National Oceanographic DataCenter (NODC) has released a set offour CD-ROMs containing Geosat geo-physical data records (GDRs) collectedduring the 1985-1986 Geosat GeodeticMission. The Geodetic Mission wasdesigned to produce a tightly spacedground track pattern (typically 3 to 4km at 30oS., resulting in a denser datacoverage of the ocean surface than thatof other satellite altimeters. Data onthe CD-ROMs are organized chrono-logically and stored in a binaryHewlett-Packard format.
In combination with additionalsatellite data, these Geosat data wereutilized by scientists at the Scripps In-stitution of Oceanography (SIO) andfrom NOAA in generating a computer-ized image of the global seafloor that isthe most detailed to date (Figure 1).Numerous published articles describingthe release of the new map resulted in aflood of inquiries to SIO, NODC, and
NODC presents Geosat Altimeter Data on CD-ROM
Solar databases, from page 9

15December 1995 EARTH SYSTEM MONITOR
Data productsand services
NESDIS Office of Satellite Opera-tions announces new Home Page
The National Environmental Satellite,Data, and Information’s (NESDIS) Officeof Satellite Operations now has a HomePage on the Internet World Wide Web(WWW). Although still under develop-ment, the Office of Satellite OperationsHome Page contains information on boththe geostationary and polar satellite sys-tems, as well as the latest GeostationaryOperational Environmental Satellite(GOES-8) images of North America andthe Western Hemisphere.
New links to WWW home pages willalso be incorporated to provide a morecomplete understanding of our opera-tional satellites and ground equipment.The new Home Page is at URL:
http://www.nnic.noaa.gov/SOCC/SOCC_Home.html
(Users should be careful to type the ad-dress exactly, as it is case-sensitive.) TheOffice of Satellite Operations can be con-tacted at: NESDIS/NSDS E/SO, FederalBuilding #4, Room 1035, Suitland, MD,20233-001, Phone: 301-457-5130.Contact: NESDIS/NSDS
USFWS presents new servers nowavailable on the Internet
Dr. Alan R. Fisher, National Data Ad-ministrator for the U.S. Fish and WildlifeService (USFWS), recently announced theavailability of several new USFWS serverson the Internet. These new servers sup-port the USFWS’s goal of sharing dataand information. The new servers are:
- National Education and Training Centerat URL:
http://www.fws.gov/~bennishk/netc.html
- Press Releases and Speeches at URL:http://www.fws.gov/~r9extaff/pubaff.html
- San Francisco Bay National Wildlife Ref-uge at URL:
http://www.r1.fws.gov/sfbnwr/sfbnwr.html
- Endangered Species has updated theirserver at URL:
http://www.fws.gov/~r9endspp/endspp.html
These servers may be directly accessed orthrough the USFWS Home Page at URL:
http://www.fws.gov
In the near future, a list server will beannounced by which subscribers can
CONTACT POINTS
National Climatic Data Center (NCDC)Climate Services:704-271-4800
Fax: 704-271-4876E-mail: [email protected]
Satellite Services:704-271-4800
Fax: 704-271-4876E-mail: [email protected]
National Geophysical Data Center (NGDC)303-497-6958
Fax: 303-497-6513E-mail: [email protected]
National Oceanographic Data Center(NODC)
202-606-4549Fax: 202-606-4586
E-mail: [email protected]
NOAA Environmental Services Data Directory
301-713-0572(Gerry Barton)
Fax: 301-713-1249E-mail: [email protected]
NOAA Central LibraryReference Services:
301-713-2600Fax: 301-713-4599
E-mail: [email protected]
NCDC completes a productive yearwith release of new CD-ROMs
The National Climatic Data Center(NCDC) released a group of four differentCD-ROMs through the fall of 1995, someof which were the result of joint effortswith other Federal agencies. The NCDCmay be contacted at the address listed fordetailed information regarding systemrequirements, data formats, and prices ofthese new CDs.
The MM4-1990 Meteorology DataCD is a 12-disk (23 gbyte) set containingmodeled hourly upper air data on an 80-km grid covering the United States,southern Canada, and northern Mexico.It provides access to wind speed/direc-tion, temperature, height and dew-pointdepression for 23 atmospheric levels forthe year 1990. This product resulted froma joint effort with NOAA‘s AtmosphericResearch Laboratory and the U.S. Environ-mental Protection Agency (EPA) designedto provide modeling tools to assess indi-vidual and cumulative impacts of existingand proposed sources of air pollution onlocal and regional scales.
The Global Gridded Upper Air Statis-tics CD contains summarized monthlysummarized European Center for MediumRange Weather Forecasting (ECMWF)upper air data for 15 levels from the sur-face to 10mb. The period is covered isfrom 1980-1991 on a global 2.5-degreegrid.
The 1994 Cooperative Data Sum-mary of the Day CD-ROM is the latest in aCD-ROM series containing cooperativestation data (daily maximum/minimumtemperature, precipitation, soil tempera-ture, and evaporation) for over 11,000U.S. stations. Preceding volumes of thisdisk contained data from the 1850s to1993. The 1994 disk also contains datainventory and station history information.Copies will be provided to the NationalWeather Service (NWS) for the WeatherForecast Offices (WFOs).
Final copies of the upgraded MarineClimatic Atlas were received for distribu-tion. Funded by the U.S. Navy, this atlasCD adds looping capability to basin con-tours, multiple rose displays, .PCX fileexport, basin-wide narratives of climatol-ogy and oceanography, and SevereWeather Port Guides for 55 Mediterra-nean locations. Copies of this CD will alsobe provided to the NWS for use by theWFOs.Contact: NCDC
receive news releases and bulletins fromthe USFWS Public Affairs headquarteroffice.Contact: [email protected]
NGDC issues new data product forstudies in geomagnetism
The National Geophysical Data Cen-ter (NGDC) has made available a newdata product entitled “Utility Programsfor Beginning Studies of GeomagneticFields.” This DOS-compatible disk con-tains a collection of files designed forthose beginning their studies in geomag-netism, and should be an item of interestfor both high school and college stu-dents. The disk was prepared by WallyCampbell, a guest worker from the U.S.Geological Survey, and is being adver-tised on an announcement that will bemailed to NGDC customers in January1996. The announcement was distributedduring the American Geophysical Unionmeeting in San Francisco in December.Contact: NGDC

16 December 1995EARTH SYSTEM MONITOR
Address C
orrection Requested
OFFIC
IAL BU
SINESS
Penalty for Private Use $300
U.S. D
EPA
RT
MEN
T O
F CO
MM
ERC
EN
ation
al Ocean
ic and
Atm
osp
heric A
dm
inistratio
nPublication D
istribution Facility1315 East-W
est Highw
aySilver Sp
ring, MD
20910A
TTN: Earth System
Monitor
40
Th
ird C
lass R
ate
est CoastWatch regional node forcompletion of local registration anddata access procedures. The NSORSpages distribute the registration proce-dures and point-of-contact informationfor the Alaska and Southeast RegionalNodes whose home pages are still underdevelopment.
Questions about the NSORS Pro-gram can be submitted through theNSORS Home Page at URL: http://psbsgi1.nesdis.noaa.gov:8080/nsors.html or con-tact: Kent Hughes, NOAA/NESDIS (E/SP), FB #4, Room 1069, Suitland, MD20746, E-mail: [email protected].
—Lieutenant (jg) Michael SoraccoSatellite Services Division
NOAA/NESDIS E/SP2NOAA Science Center
5200 Auth Road, Room 607Camp Springs, MD 20746
E-mail: [email protected] ■
NSORS, from page 13ments such as ocean color and Syn-thetic Aperture Radar (SAR) productswill also be available through the homepage.
The NSORS Program currently reliesupon the success and distributive net-work of the NOAA CoastWatch Pro-gram. CoastWatch makes polar satelliteenvironmental data and products avail-able to Federal, state and local marinescientists and coastal resource managers.Eight regional nodes run by NOAA per-sonnel located at NOAA line office fa-cilities (Figure 2) distribute data andprovide a “local” point-of-contact forqualified CoastWatch customers. NSORSwill make use of these distributionpoints for delivery of new data products.
The NSORS Home Page providesinformation on the CoastWatch Pro-gram and registration procedures. TheNSORS web site guides users to the near-
▲ Figure 2. NOAA CoastWatch program regional nodes and sites.