earth + water - seattle.gov homespu/@usm/...memorandum january 10, 2012 project no. 080080 page 3...
TRANSCRIPT

e a r t h + w a t e r Aspect Consulting, LLC 401 2nd Avenue S. Suite 201 Seattle, WA 98104 206.328.7443 www.aspectconsulting.com

MEMORANDUM January 10, 2012 Project No. 080080
Page 2
This memorandum summarizes the results of the workshops and soil testing and presents our recommendations for revisions to the standard permeability testing procedures.
Description of Workshops Five private local laboratories that routinely perform bioretention soil permeability tests were invited to participate in the workshops and testing. These firms were Associated Earth Sciences (AESI), GeoEngineers, GeoTest, HWA Geosciences (HWA), and Shannon & Wilson. Seattle Public Utilities (SPU) and their Materials Laboratory also participated in the process. The first workshop was held with SPU and the laboratories group to determine what issues or concerns they currently have regarding the ASTM standard method, and to discuss proposed modifications that would address those issues. The most significant testing issues identified were: soil compaction, soil swelling, soak time, and permeability testing apparatus.
Based on these discussions, proposed modifications to the permeability procedure were developed and used by the laboratories to test samples of bioretention soil. Following submittal of the testing results using the modified procedure, a second workshop was conducted to report and discuss the permeability testing results and propose additional modifications to the testing procedures.
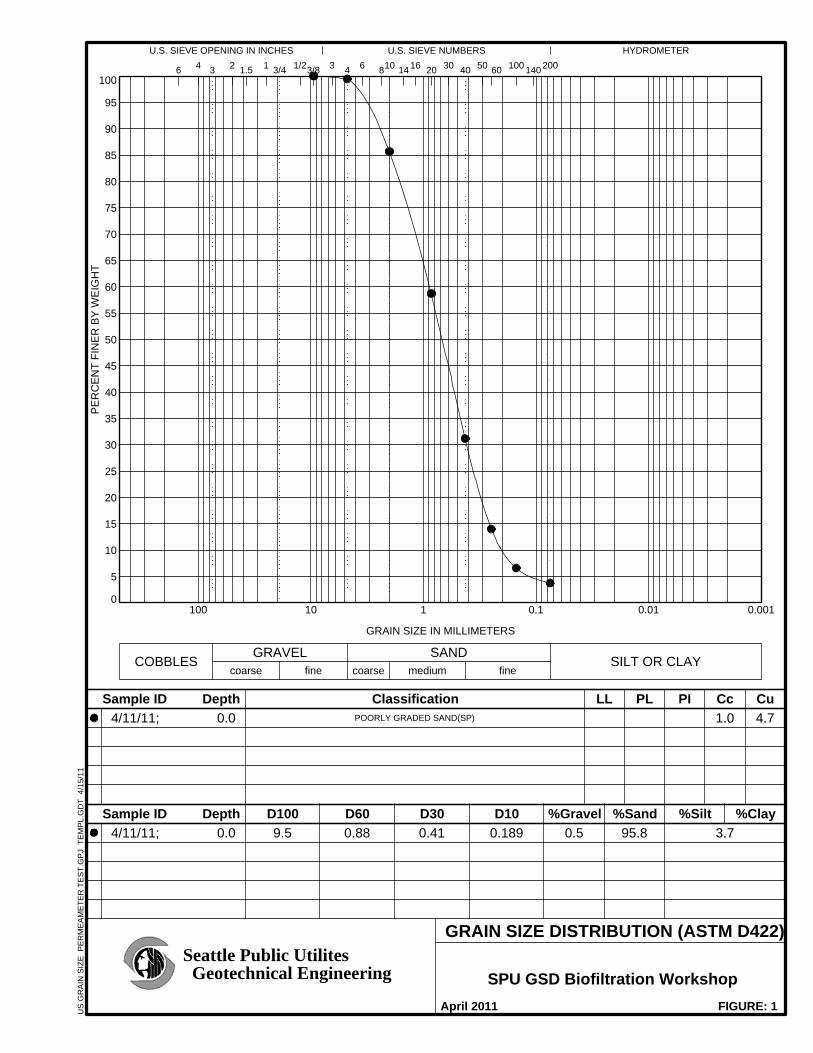
Characteristics of Tested Bioretention Soil Following completion of the first workshop, each laboratory was given approximately 5 to 7 gallons of bioretention soil from the same batch provided by Cedar Grove Composting, a local supplier of bioretention soil. Cedar Grove Composting produces this material by mixing a controlled grade of sand aggregate with compost. Cedar Grove Composting has test results on file for the sand aggregate, the compost, and the bioretention soil, which are provided in Appendix A. The sieve analysis results for the sand aggregate are summarized in Table 1 and shown on Figure 1.
Table 1 – Grainsize Distribution of Sand Aggregate Used to Produce Bioretention Soil
Sieve Size Percent Passing (% by weight) 1 inch 100.0
#4 (0.187 inch) 99.6 #10 (0.0787 inch) 87.6 #40 (0.0165 inch) 34.3
#200 (0.0029 inch) 1.9 Description of Bioretention Soil Testing Procedures In addition to permeability testing, a number of soil tests were conducted to characterize the soil samples and document the degree of variability between the samples provided to each lab. These tests are listed below:
Grainsize analysis;
Moisture content;
Organic content;
Soil moisture-density relationship (modified Proctor) test;
MEMORANDUM January 10, 2012 Project No. 080080
Page 3
Permeability test.
The first three tests provided information regarding the soil constituents. The Proctor test was necessary to quantify the degree of compaction for the permeability test.
Grainsize Analysis Test The grainsize analysis is a laboratory method to determine the particle size distribution of soil. The ASTM D422 method consists of placing a soil sample in a stacked column of sieves with screens or mesh sizes from largest (No. 1 sieve) to smallest (e.g. No. 200 sieve). The soil is dried and agitated, usually in a mechanical shaker, to move particles through the sieves. After the soil sample has been agitated, the sample remaining on each sieve is weighed and the percent of the total soil sample that passed through the sieve is reported. As agreed during the first workshop, all grainsize analyses were performed on bioretention soil samples that had been burned to minimize the organic matter remaining in the sample.
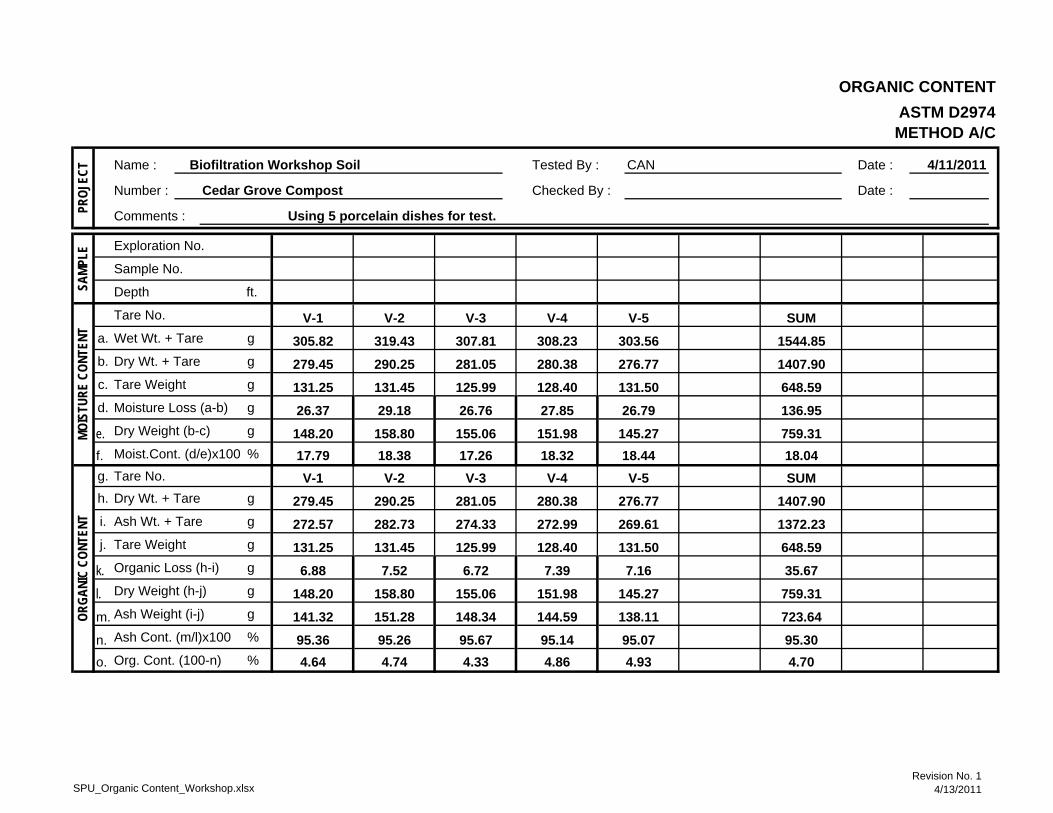
Moisture and Organic Content Tests Moisture content and organic content of the received soil samples was measured using ASTM D2974. Moisture content was measured to document the condition of the soil when it was received by the laboratory. The amount of organic matter in a soil can influence the soil compressibility and compaction, water holding capacity, and permeability. Moisture content is measured by drying the soil at a temperature of 105° C. The weight of the sample before and after drying is measured and the difference represents the moisture content of the sample. Organic content is determined by weighing the dry soil, then burning it at 440° C. The remaining soil is weighed, with the lost weight representing the oxidation of organic matter to inorganic ash. Typical organic content values for bioretention soils are 4 to 10 percent.
Moisture-Density Relationship (Proctor) Test The ASTM D1557 moisture-density relationship (modified Proctor) method is a laboratory compaction test performed to determine the optimal soil moisture required for the soil to achieve its maximum dry density. It is the most commonly used method in Washington State for determining the relationship between soil moisture and soil density.
The ASTM D1557 Proctor testing method provides procedures for three different methods for determining MDD. Which method should be used depends on the grainsize distribution of the sample. Methods A and B use a 4-inch mold and are intended for fine-grained soils, whereas Method C uses a 6-inch mold and is typically intended for coarser-grained soils. All the laboratories used Method A or B (which only differ regarding what size gravels are removed from the sample before testing) although GeoEngineers and AESI also performed Proctor tests using Method C.
These tests are performed by compacting a soil with known moisture content into the cylindrical mold using a specified procedure to place and compact the sample. Soil is placed in the mold in layers of equal thickness, with each layer receiving a specified number of blows from a standard weighted hammer dropped from a specified height. This procedure is repeated at several different soil moisture contents, and later the dry densities are determined for each test. A compaction curve is plotted showing the graphical relationship between the dry density and the moisture content. The graph is usually in the form of a curve with at least three moisture-density points. The peak of the curve is defined as the MDD and optimal moisture content for compaction of the soil.

MEMORANDUM January 10, 2012 Project No. 080080
Page 4
Standard Permeability Testing Method The ASTM D2434 soil permeability rate testing method was developed for granular soils that are free of organics (described as granular soils that occur in natural deposits used for embankments, or pavement base courses). It is not intended for use with soils containing more than 10 percent soil (inorganic) passing the No. 200 sieve. The method allows use of testing equipment between 3 inches and 9 inches in diameter to accommodate the largest grainsize particles in the sample.
In summary, the standard permeability rate testing method is to:
Select a cylinder size, based on the maximum particle size;
Place soil into the cylinder based on a specified procedure;
Tamp the specimen to the desired compaction;
Apply a vacuum to the sample;
Add water until a stable head condition is achieved (no appreciable drift in water manometer levels is seen); then
Run test runs with increasing heads.
For organic soils, swelling of organics in the presence of water can occur and significantly change the permeability of the soil. The standard method does not provide direction on pre-soaking the soils to prevent soil swelling during the test.
Results of the First Workshop Based on discussions during the first workshop, the workshop group identified a number of modifications to the standard permeability test procedures that were believed to be important to improve the consistency of results. In most instances, these modifications involved more specific procedures that those specified in ASTM D2434 and did not actually involve utilizing procedures that were in conflict with the standard method.
Our recommendations for revisions of the existing test procedures included these items:
1) Apparatus: a. 6-inch mold size shall be used for the test. b. If using porous stone disks for the testing, the permeability of the stone disk
should be measured before and after the soil tests to ensure clogging or decreased permeability has not occurred during testing.
c. Use the confined testing method, with a 5- to 10-pound force spring. d. Use de-aired water.
2) Sample: a. Maximum grainsize within the sample shall not be more than ½ inch. b. Snip larger organic particles (if present) into ½ inch long pieces.
3) Preparation of Sample: a. Moisture content of soil should be at optimum moisture (+ or – 0.5 percent). b. Place soil in cylinder via a scoop.

MEMORANDUM January 10, 2012 Project No. 080080
Page 5
c. Place soil in 1-inch lifts and compact using a 2-inch-diameter round tamper. Pre-weigh how much soil is necessary to fill 1-inch lift at 85% of maximum dry density, then tamp to 1-inch thickness. Once mold is full, verify that density is at 85% of maximum dry density (+ or – 0.5%).
d. Apply vacuum (20 inches Hg) for 15 minutes before inundation. e. Inundate sample under a vacuum of 20 inches Hg slowly over a period of 60 to
75 minutes. f. Remove the vacuum slowly over a period of at least 15 seconds. g. Soak the sample in the mold for 16 to 20 hours before starting test.
4) Procedure: a. The permeability test will be conducted over a range of hydraulic heads: 0.5 cm,
1 cm, 1.5 cm, 2 cm, 3 cm, 4 cm, 6 cm, and 8 cm. b. Document steady state flow rates for four consecutive measurements before
increasing the head. c. Repeat the permeability test for 4 consecutive days to determine if results
change after repeated cycles. Each day should repeat the same hydraulic heads. d. On the last day, measure flow rates at hydraulic head values of 16 cm, 32 cm,
and 64 cm (if feasible).
Laboratory Testing Results The laboratory results for grainsize analysis, moisture and organic content, moisture-density relationship, and permeability are discussed below.
Grainsize Analysis Results The grainsize analysis results are provided in Appendix B and summarized in Figure 1. As shown on Figure 1, the grainsize analysis results are quite similar for the different laboratories. Note that the percent passing the # 200 sieve ranges from 3.2 percent (GeoTest) to 3.9 percent (Shannon & Wilson). Grainsize results for the sand aggregate provided by Cedar Grove Composting are also shown on the graph. Note that the grainsize analyses performed by the laboratories were performed on samples after the organic burn and likely contain a small percentage of ash. The aggregate sample tested by Cedar Grove Composting contained 1.9 percent passing the #200 sieve, suggesting that the post-burn samples contained on the order of 1 to 2 percent ash.
Moisture Content and Organic Content Results The moisture content of the received samples and organic content results are provided in Appendix B and are summarized in Table 2 below:

MEMORANDUM January 10, 2012 Project No. 080080
Page 6
Table 2 – Summary of Test Sample Moisture and Organic Content Results
Laboratory % Moisture % Organics
AESI 13.2 3.5 GeoTest Not Provided 5.4 GeoEngineers 19.3 4.8 HWA 10.1 4.7 Shannon & Wilson 14.0 5.6 SPU 19.5 4.7 Average 15.3 4.8 Standard Deviation 3.6 0.7
The moisture content of the received samples ranged from 10.1 percent to 19.5 percent. The organic content ranged from 3.5 percent to 5.6 percent with an average of 4.8 percent. This compares well with the organic content of 4.6 percent provided by Cedar Grove Composting.
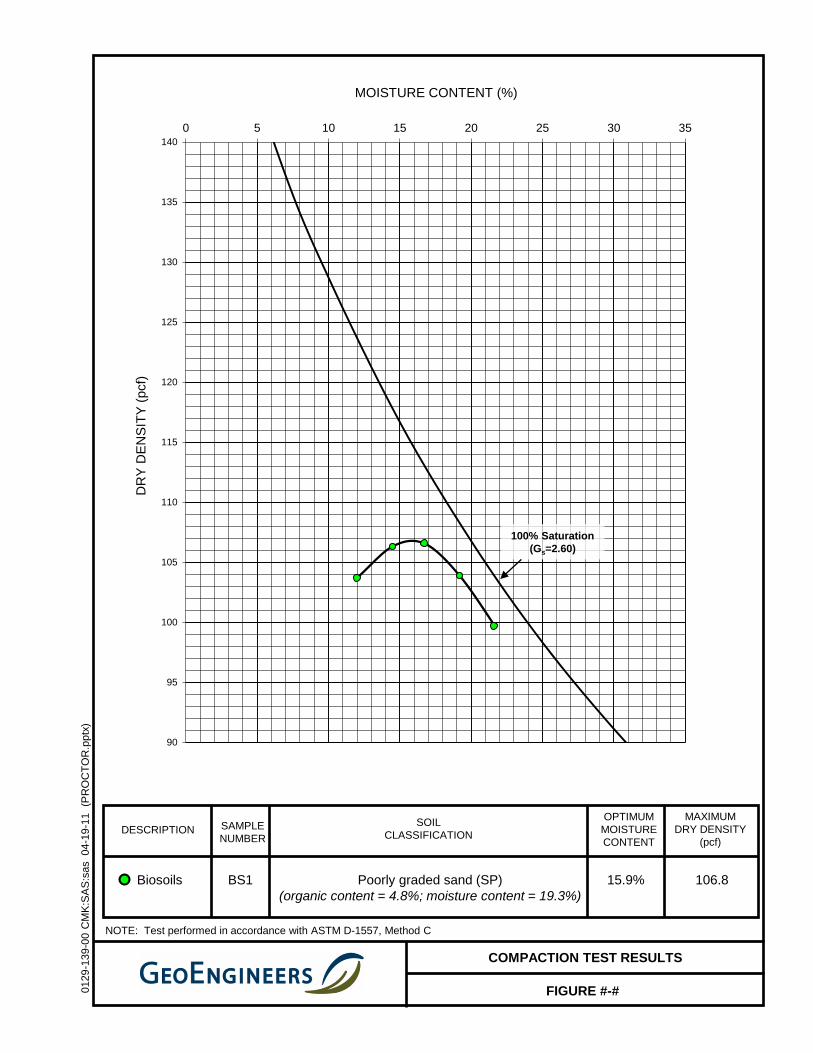
Moisture-Density Relationship (Proctor) Results The Proctor results are provided in Appendix C and summarized below in Table 3. In addition, the actual Proctor curves are shown on Figure 2. Note that most of the laboratories utilized a 4-inch mold (Method A or B) while AESI and GeoEngineers also ran Proctor tests using the 6-inch mold (Method C). The Proctor results range from 108.6 to 113.6 pounds/cubic foot for the 4-inch mold and from 102.6 to 106.8 pounds/cubic foot for the 6-inch mold. The laboratory representatives agreed that based on their experience, this variability in test results for the same soil material is typical.
The 6-inch molds provided a lower maximum dry density and higher optimum moisture content than the 4-inch molds. Permeability is highly dependent on compaction and it is critical that the same proctor method be used to provide more consistent permeability results. Since the permeability test uses a 6-inch mold, our recommended modifications of the permeability procedures specifies that the proctor test be conducted using the 6-inch mold.

MEMORANDUM January 10, 2012 Project No. 080080
Page 7
Table 3 – Summary of Moisture-Density Relationship (Proctor) Results
4" Mold 6" Mold Max. Dry
Density (pcf) Optimum
Moisture % Max. Dry
Density (pcf) Optimum
Moisture % AESI 111.5 14.8 102.6 15.3 GeoTest 108.6 16.5 -- -- GeoEngineers 113.6 12.5 106.8 15.9 HWA 109.6 15.3 -- -- Shannon & Wilson 113.0 14.5 -- -- SPU 111.0 15.0 -- -- Average 111.2 14.8 104.7 15.6 Standard Deviation 1.8 1.2 2.1 0.3
Notes: pcf = pounds/cubic foot
Permeability Testing Results The permeability testing results are provided in Appendix D and summarized below in Table 4.
Table 4 – Summary of Permeability Results
Laboratory Dry Density (pcf)
% Compaction
Mold Diameter (in.)
Day 1 (in./hr)
Day 2 (in./hr)
Day 3 (in./hr)
Day 4 (in./hr)
AESI 94.8 85.0% 6 3.4 3.8 4.1 4.7 GeoTest 91.5 84.3% 6 10 13 16 21 GeoEngineers (85% of MDD)
96.9 85.3% 6 3.8 3.7 3.7 3.8
GeoEngineers (90% of MDD)
102.6 90.3% 6 1.8
HWA 93.1 84.9% 6 19 25 23 22 Shannon & Wilson
95.0 84.1% 6 6.2 5.4 5.2 5.5
HWA 93.1 84.9% 4 17 21 SPU 95.9 86.4% 4 39 39 40 42
Notes: pcf = pounds/cubic foot in. = inches hr = hour
Results at 85% compaction for AESI, GeoEngineers, and Shannon & Wilson are relatively consistent, ranging from 3.4 to 6.2 inches/hour for the first day. GeoEngineers test at 90% compaction provided a lower permeability of 1.8 inches/hour. GeoTest and HWA results are significantly higher (10, 17, and 19 inches/hour on the first day). Because their Proctor values were lower than measured by the other laboratories, their permeability tests were performed at a lower

MEMORANDUM January 10, 2012 Project No. 080080
Page 8
soil density, which is the likely explanation for the higher permeability. The relationship between permeability and compaction (soil density) is shown on Figure 3.
Two labs (HWA and SPU) performed the permeability test using a 4-inch diameter mold. The HWA 4-inch results are similar to their 6-inch results. SPU’s permeability results were significantly higher than the other laboratories. SPU used a 4-inch mold and did not have a de-aired water source. The reason for this difference is not known and therefore the permeability rates will be disregarded for the purposes of this study.
Several labs (AESI, GeoTest, HWA, and SPU) observed an increase in permeability from day one to day four. The most likely explanation offered during the workshop is that some fine grained materials washed out of the mold during the test.
Conclusions and Recommendations In general, testing results indicated that the laboratories received material that was very similar in grainsize distribution, organic content, and maximum dry density. Permeability results for the first day of testing ranged from 1.8 to 19 inches/hour. In general, permeability was inversely proportional to soil density, with a range of 1.8 inches/hour at a dry density of 102.6 pounds/cubic foot to 19 inches/hour at a dry density of 93.1 pounds/cubic foot. Based on these results, controlling soil compaction is probably the most important factor in obtaining consistent permeability results. SPU’s permeability results were substantially higher than the other laboratories (39 inches/hour on the first day). The reason for this difference is unknown.
The final recommended testing procedures for permeability of bioretention soil are found in Appendix E. The primary changes to the original permeability testing procedures include the following:
Obtain the MDD using ASTM D1557 Method C, which utilizes a 6-inch mold. This approach was selected so the Proctor test and permeability test would be conducted in the same size mold.
When adding water to the sample during the Proctor test, allow the sample to pre-soak for at least 48 hours to allow the organics to fully saturate before compacting the sample. The workshop attendees believed that allowing the organics to fully saturate was important to provide consistent Proctor results.
Before running the permeability test, allow the sample to pre-soak for at least 48 hours. During the pre-soak, the moisture content should be higher than optimum moisture but less than full saturation (i.e., there should be no free water). This is to address situations where the sample may arrive in the laboratory relatively dry.
After saturating the sample in the permeability mold, allow it to soak for 24 to 72 hours before running the permeability test. The workshop attendees agreed that this period of time should be sufficient to allow the organics to fully swell.
Conduct permeability testing over a range of hydraulic gradients between 0.1 and 2. This range was considered typical for field conditions.
Complete the permeability testing within one day. It was the opinion of the workshop attendees that repeating the test over multiple days was unnecessary.
MEMORANDUM January 10, 2012 Project No. 080080
Page 9
Limitations Work for this project was performed and this memorandum prepared in accordance with generally accepted professional practices for the nature and conditions of work completed in the same or similar localities, at the time the work was performed. It is intended for the exclusive use of City of Seattle. This memorandum does not represent a legal opinion. No other warranty, expressed or implied, is made.
References ASTM D422 – 63, 2007, Standard Test Method for Particle-Size Analysis of Soils; published by
ASTM International, West Conshohocken, Pennsylvania.
ASTM D1557 – 09 Standard Test Methods for Laboratory Compaction Characteristics of Soil Using Modified Effort (56,000 ft-lbf/ft3 (2,700 kN-m/m3)); published by ASTM International, West Conshohocken, Pennsylvania.
ASTM D2434 – 68, 2006 Standard Test Method for Permeability of Granular Soils (Constant Head), published by ASTM International, West Conshohocken, Pennsylvania.
ASTM D2974 - 07a Standard Test Methods for Moisture, Ash, and Organic Matter of Peat and Other Organic Soils; published by ASTM International, West Conshohocken, Pennsylvania.
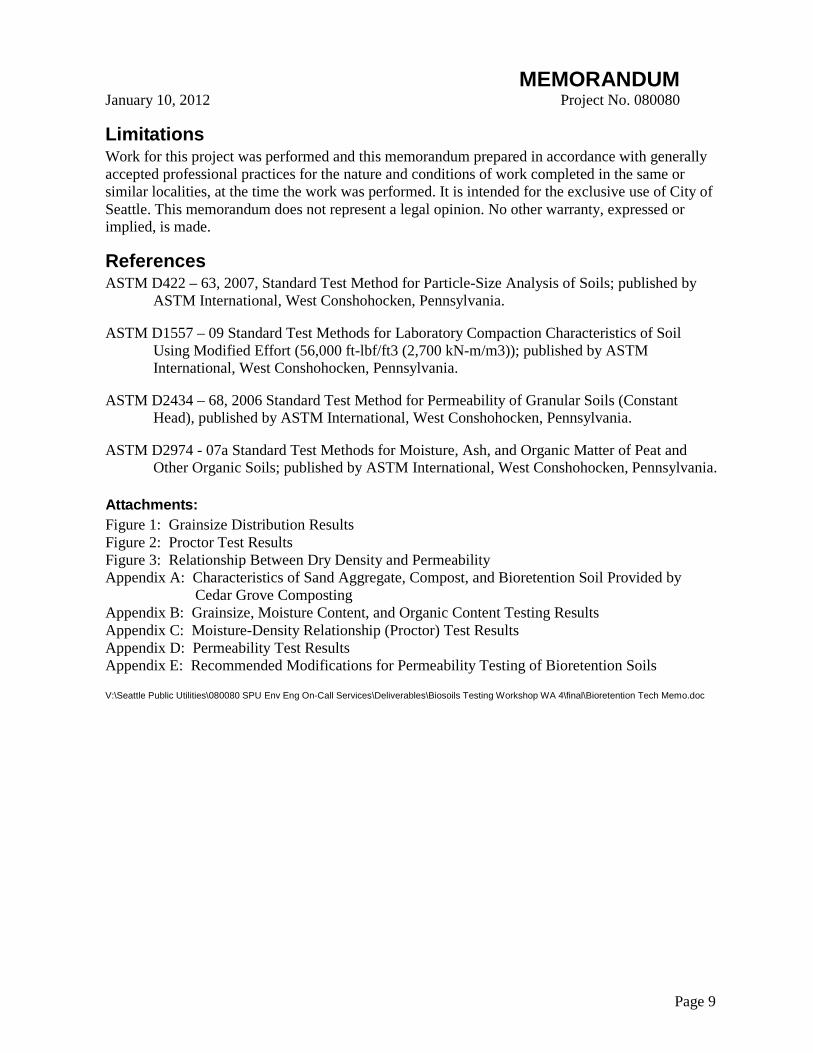
Attachments: Figure 1: Grainsize Distribution Results Figure 2: Proctor Test Results Figure 3: Relationship Between Dry Density and Permeability Appendix A: Characteristics of Sand Aggregate, Compost, and Bioretention Soil Provided by
Cedar Grove Composting Appendix B: Grainsize, Moisture Content, and Organic Content Testing Results Appendix C: Moisture-Density Relationship (Proctor) Test Results Appendix D: Permeability Test Results Appendix E: Recommended Modifications for Permeability Testing of Bioretention Soils
V:\Seattle Public Utilities\080080 SPU Env Eng On-Call Services\Deliverables\Biosoils Testing Workshop WA 4\final\Bioretention Tech Memo.doc

30
40
50
60
70
80
90
100ercent Passing
(%)
AESI
GeoEngineers
GeoTest
HWA
Shannon & Wilson
SPU
Sand Aggregate
Aspect ConsultingOctober 19, 2011S:\City of Seattle\SPU On-Call Environmental Contract\Biosoils Testing Workshop WA 4\Lab Results\Biosoils Lab Results
Figure 1Grainsize Distribution Results
SPU Bioretention Soils, Seattle, WA
0
10
20
30
0.010.1110
Percen
Grainsize (mm)
SPU
Sand Aggregate
Note: Sand aggregate results provided by Cedar Grove.
Aspect ConsultingOctober 19, 2011S:\City of Seattle\SPU On-Call Environmental Contract\Biosoils Testing Workshop WA 4\Lab Results\Biosoils Lab Results
Figure 1Grainsize Distribution Results
SPU Bioretention Soils, Seattle, WA

102
104
106
108
110
112
114
Dry Den
sity (p
cf) AESI 4"
GeoEngineers 4"
GeoTest 4"
HWA 4"
Shannon & Wilson 4"
SPU 4"
GeoEngineers 6"
AESI 6"
Aspect ConsultingOctober 19, 2011S:\City of Seattle\SPU On-Call Environmental Contract\Biosoils Testing Workshop WA 4\Lab Results\Biosoils Lab Results
Figure 2Proctor Test Results
SPU Bioretention Soils, Seattle, WA
98
100
102
8 10 12 14 16 18 20 22
Moisture Content (%)
AESI 6"
Aspect ConsultingOctober 19, 2011S:\City of Seattle\SPU On-Call Environmental Contract\Biosoils Testing Workshop WA 4\Lab Results\Biosoils Lab Results
Figure 2Proctor Test Results
SPU Bioretention Soils, Seattle, WA

4
6
8
10
12
14
16
18
20Pe
rmeability (in
ches/hou
r)
Aspect ConsultingOctober 19, 2011S:\City of Seattle\SPU On-Call Environmental Contract\Biosoils Testing Workshop WA 4\Lab Results\Biosoils Lab Results
Figure 3Relationship Between Dry Density and Permeability
SPU Bioretention Soils, Seattle, WA
0
2
4
90 92 94 96 98 100 102 104
Pe
Soil Dry Density (pounds per cubic foot)
Aspect ConsultingOctober 19, 2011S:\City of Seattle\SPU On-Call Environmental Contract\Biosoils Testing Workshop WA 4\Lab Results\Biosoils Lab Results
Figure 3Relationship Between Dry Density and Permeability
SPU Bioretention Soils, Seattle, WA

APPENDIX A
Characteristics of Sand Aggregate, Compost, and Bioretention Soil Provided by Cedar Grove Composting

TEL: 831-724-5422FAX: 831-724-3188
Account Number:0040690-2-2192
Cedar Grove Composting Reporting Date:17825 Cedar Grove Rd SEMaple Valley, WA 98038 Attn: Martin Okoli
Date Received: Soil sample received April 27, 2010Project #/Name: None / NoneSample Identification: CNW sand 4-26-10Matrix: SoilLaboratory #: 0040690-1/2
Percent PassingSieve Size (% by weight)
1" 100.0 % by wt#4 99.6 % by wt#10 87.6 % by wt#40 34.3 % by wt#200 1.9 % by wt
*Note: Percent Passing by weight is the same thing as Percent Finer by weight.
May 13, 2010

Cedar Grove Composting
Compost Quality Assurance Program 2011
Cedar Grove Fine Grade Compost For CDC Specification Cedar Grove Compost is made from 100% locally recycled yard and food trimmings, and clean wood waste. Cedar Grove Compost is made at facilities that are in compliance with Washington Department of Ecology (WDOE) requirements for compost manufacturing and product quality (WAC 173-350-220). In addition, Cedar Grove voluntarily meets the US Composting Council’s Seal of Testing Assurance (STA) standards. Results of tests for horticultural values are shown in Chart 1, along with applicable STA standards. Details of WDOE compost quality requirements and Cedar Grove Compost results are in Chart 2. See notes on page 2.
Chart 1. Cedar Grove Fine Grade Compost Horticultural Values
US Composting Council Seal of
Testing Assurance Standard Cedar Grove Fine Compost
(2/10/2011) Moisture content 47.4% Organic Matter >40% 49.4% Carbon to Nitrogen Ratio 19 Conductivity “as received” <4 mmhos/cm 2.6 mmhos/cm NOTE 1 Seedling Emergence >80% 100% Seedling Vigor >80% 100% Compost Stability (mg CO-2 C/g OM/day) <7 3.4 - “Stable” NOTE 2 Viable Weed Seeds None detected 12/22/10 Dry weight 29 lbs / cu. Ft. Major Nutrients Total Nitrogen 1.3%
Ammonium (NH-4) 410 mg/kg Nitrate (NO-3) 1.3 mg/kg NOTE 3
Phosphorous (P2O5) 0.68% Potassium (K2O) 1.2%
Chart 2. Compost Quality Requirements - Washington Administrative Code 173-350 Sect. 220
WAC 173-350-220
Standard Cedar Grove
Compost (2/10/2011) Metals Parts per million (mg/kg), dry wt.
Arsenic <=20 8.9 Cadmium <=10 <1.0 Copper <=750 68 Lead <=150 37 Mercury <=8 <1.0 Molybdenum <=9 2.8 Nickel <=210 24 Selenium <=18 <1.0 Zinc <=1400 210 pH 5-10 (range) 7.28 Salmonella (Pathogen indicator) < 3 MPN / 4 grams of total solids Pass Sharps 0 percent None Detected Manufactured Inerts < 1 percent < 0.5 percent
Chart 3. WDOT Particle Size Specifications by Compost Grade
All tests performed by Soil Control Laboratories, Watsonville, CA; using TMECC/STA specified methods.
Sieve size WDOT “Fine” Compost Cedar Grove (2/10/2011) 1” 95-100% 100%
5/8” 90-100% 97.4% NOTE 4 ¼” 75-100% 92%

NOTE 1. “As received” reports conductivity in moist soil. The number reported on the lab report (4.9 mmhos/cm) is a calculation of conductivity of dried material.
NOTE 2. Stability is tested in accordance with TMECC 05.08-B, “Carbon Dioxide Evolution Rate”. This laboratory test is a more accurate CO-2 measure than Solvita tests specified.
NOTE 3. The form of nitrogen present is dynamic, changing with exposures to air, temperature, soil life and other factors. WSU Agronomists advise that laboratory characterizations of Nitrate:Ammonia balances are not meaningful for field applications.
NOTE 4. Cedar Grove Compost is screened to 7/16”. There is no way to remove the small fraction of material that is 3/16” larger and passes a 5/8” screen.
NOTE 5. Neither WAC 173-350-220 nor the STA program requires testing for Cation Exchange Capacity. We do not conduct regular testing for this parameter. When tests have been conducted, Cedar Grove Compost CEC levels are consistently greater than 20.
Notes and additional information added by Howard Stenn, Cedar Grove Staff Horticulturist, 3/10/2011.


Project: Cedar Grove BRSJob No: 21-1-08824-047 MC Before Test= 18.5%Sample: BRS 1-31-11, Rec'd 1/31/2011 Initial Dry Density= 86.0 pcfTest By: AKV 2/8/2011 Percent Compaction= 80.0%
Comp By: AKV 2/9/2011 Final Dry Density= 85.4 pcfCheck By: JFL 2/9/2011 Fines Washout= 9.1 g
Washout= 0.71%
Sample Classification:Brown, slightly silty SAND; numerous organics (SP-SM)
Remarks:
∆h H t Qh1 (cm) h2 (cm) (cm) (cm) (s) (cm3) I Q/at k (in/hr)
1 52.5 47.8 4.7 0.5 774 375.1 0.04 6.1E-03 2.00E+022 47.8 42.4 5.4 1.0 588 430.9 0.09 9.2E-03 1.52E+023 42.4 38.1 4.3 1.5 353 343.1 0.13 1.2E-02 1.34E+024 38.0 33.8 4.2 2.0 273 335.2 0.17 1.5E-02 1.27E+025 33.7 28.6 5.1 2.5 270 407.0 0.21 1.9E-02 1.25E+026 28.6 22.4 6.2 3.0 276 494.8 0.26 2.2E-02 1.24E+027 22.4 15.5 6.9 3.5 271 550.6 0.30 2.5E-02 1.20E+028 15.4 7.3 8.1 4.0 279 646.4 0.34 2.9E-02 1.20E+029 51.8 42.2 9.6 4.5 282 766.1 0.39 3.4E-02 1.25E+02
10 42.2 31.2 11.0 5.0 288 877.8 0.43 3.8E-02 1.26E+0211 31.0 18.7 12.3 6.0 270 981.6 0.52 4.6E-02 1.25E+0212 52.2 36.2 16.0 8.0 270 1276.8 0.69 5.9E-02 1.22E+0213 36.1 15.9 20.2 10.0 268 1612.0 0.86 7.5E-02 1.24E+0214 41.6 17.2 24.4 12.0 264 1947.2 1.03 9.2E-02 1.27E+0215 52.8 36.6 16.2 15.0 146 1292.8 1.29 1.1E-01 1.22E+0216 36.5 20.7 15.8 18.0 115 1260.9 1.55 1.4E-01 1.26E+02
Average k 1.3E+02
h1 : Initial reservoir water levelh2 : Final reservoir water level∆h : Change in reservoir water level during testH : Head difference across the speciment : Elapsed time for changing water level
Q : Volume of water dischargedI : Hydraulic gradient (Head/Height)
a : Cross-section area of the specimenk : Hydraulic conductivity of the specimen
PERMEABILITY TEST ON GRANULAR SOILCONSTANT HEAD (6" MOLD)
ASTM D 2434
Test No.Reservoir Level
Specimen compacted by hand with 2" round tamper to target density (80% Modified MDD) based on preliminary water content.
Fines washout occurred largely during first two testing intervals.

Cedar Grove BRSBRS 1-31-11, Rec'd 1/31/2011
21-1-08824-047Date Reported: 2/9/2011
1.0
10.0
100.0
1000.0
0.0 0.2 0.4 0.6 0.8 1.0 1.2 1.4 1.6 1.8
Hyd
raul
ic C
ondu
ctiv
ity (i
n/hr
)
Gradient
Hydraulic Conductivity vs. Gradient
0.0E+00
2.0E-02
4.0E-02
6.0E-02
8.0E-02
1.0E-01
1.2E-01
1.4E-01
1.6E-01
0.0 0.2 0.4 0.6 0.8 1.0 1.2 1.4 1.6 1.8
Dar
cy V
eloc
ity (c
m/s
ec)
Gradient
Darcy Velocity vs. Gradient

80
85
90
95
100
105
110
115
120
125
130
135
140
145
150
0 5 10 15 20 25 30 35 40
ASTM D1557 Method B
108
Natural Water Content:
Maximum Dry Density:
Optimum Water Content:
G = 2.60
February 2011
Geotechnical and Environmental Consultants FIG. FINAL
Mechanical
19.0 %
Compaction Test Method:
Description of Material:
17.2 %
100% Saturation: G
= 2.80
Checked By:
DR
Y D
EN
SIT
Y,
pcf
G = 2.70
SHANNON & WILSON, INC.
Cedar Grove Bioretention SoilsSeattle, Washington
WATER CONTENT, %
Rammer Type:
Sample Identification:
MOISTURE-DENSITY TEST
Brown, slightly silty SAND;
numerous organics (SP-SM)
TEST RESULTS
JFL
BRS 1-31-11; GRAB; Rec'd
1/31/11
21-1-08824-047

Project Name: Cedar Grove BioretentionJob Number: 21-1-08824-047
Checked By/On: JFL 2/7/11
Organic Content By MassASTM D2974
Boring Sample Depth (ft) WC Wet + Tare
Oven Dry + Tare
Furnace Dry + Tare Tare Wt. WC (%) Organic (%)
BRS 1-31-11 GRAB (1/2) 0 322.82 292.87 284.76 114.89 --- ---BRS 1-31-11 GRAB (2/2) 0 373.87 338.09 328.28 129.79 --- ---
696.69 630.96 613.04 244.68 17.0 4.6Totals


APPENDIX B
Grainsize, Moisture Content, and Organic Content Testing Results


Project Name: Biosoils Testing Workshop Project Number: 0129-039-00
Tested By: SASDate: 4/19/2011
Exploration No.: BiosoilsSample No.: BS1
Depth: n/a
Moisture Content (%) 19.3%
Sieve Size Percent Passing (%) Size Fraction Percent By
Weight
3.0 in. (75.0-mm) 100.0 Coarse Gravel1.5 in. (38.1-mm) 100.0 Fine Gravel 1.23/4 in. (19.0-mm) 100.03/8 in. (9.5-mm) 100.0 Coarse Sand 12.7No. 4 (4.75-mm) 98.8 Medium Sand 53.8No. 10 (2.00-mm) 86.1 Fine Sand 28.6No. 20 (.850-mm) 57.7No. 40 (.425-mm) 32.4 Fines 3.8No. 60 (.250-mm) 14.5 Total 100.0No. 100 (.150-mm) 6.8No. 200 (.075-mm) 3.8
LLPI
D10 0.19D30 0.40D60 0.91
Cc 0.93Cu 4.91
Group Name poorly graded sand Symbol (SP)
moisture content determined during organic content
testing (ASTM D-2974)
FIGURE #-#
SIEVE ANALYSIS DATA
Sieve Analysis
USCS Classification

FIGU
RE #-#
SIEVE ANA
LYSIS RESU
LTS
DESCRIPTION SAMPLE NUMBER SOIL CLASSIFICATION
Biosoils BS1 Poorly graded sand (SP) (organic content = 4.8%; moisture content = 19.3%)
0129-039-00 CMK:SAS: sas 04-19-2011 (SIEVE.pptx)
SYMBOL
3/8” 3” #20 #200 #40 #60 #100 1.5” #10 #4 3/4”
0
10
20
30
40
50
60
70
80
90
100
0.0010.010.11101001000
PE
RC
EN
T P
AS
SIN
G B
Y W
EIG
HT
.
GRAIN SIZE IN MILLIMETERS
U.S. STANDARD SIEVE SIZE
SAND SILT OR CLAY COBBLES
GRAVEL
COARSE MEDIUM FINE COARSE FINE BOULDERS
NOTE: Test performed in accordance with ASTM D-422 organic matter burned off prior to sieve analysis

Tested By: BF Checked By: GR
4-14-11
S01
#11-0162 Bioretention Soil
PL= LL= PI=
D90= D85= D60=D50= D30= D15=D10= Cu= Cc=
USCS= AASHTO=
*
GeoTest - Bioretention Soilpoorly graded sand3/4"
3/8"#4#10#20#40#60
#100#200
100.0100.099.485.460.132.514.5
6.43.2
100.0 - 100.095.0 - 100.075.0 - 90.0
25.0 - 40.0
4.0 - 10.02.0 - 5.0
2.4606 1.9667 0.84830.6547 0.3989 0.25510.2012 4.22 0.93
SP
Organics Content, ASTM D2974(C): 5.4%(Sieve analysis performed after organics burn)
Aspect Consulting
SPU Bioretention Soil Workshop
11-0162
Material Description
Atterberg Limits
Coefficients
Classification
Remarks
Location: Cedar Grove CompostingDate:
Client:Project:
Project No: Report
SIEVE PERCENT SPEC.* PASS?SIZE FINER PERCENT (X=NO)
PE
RC
EN
T FI
NE
R
0
10
20
30
40
50
60
70
80
90
100
GRAIN SIZE - mm.
0.1110
#11-0162 Bioretention Soil
Coarse% Gravel
Fine Coarse Medium% Sand
Fine Silt% Fines
0.0 0.6 14.0 52.9 29.3 3.2
1½ in
.
1 in
.
¾ in
.
½ in
.
3/8
in.
#4 #10
#20
#30
#40
#60
#100
#140
#200
Sieve Analysis Test Report - ASTM D422


0
10
20
30
40
50
60
70
80
90
100
1
6 4
PE
RC
EN
T FI
NE
R B
Y W
EIG
HT
3/4
COARSE MEDIUM
12 20
.001
BORING ANDSAMPLE NO.
DEPTH(feet)
U.S.C.S.SYMBOL
SOILCLASSIFICATION
NAT.W.C. %
14.0 3.9
CKDBY
LL%
PL%
PI%
Poorly Graded Sand; organic content= 5.6% by mass
TESTBY
PASS.#200,%
.06.8
.06
.1
.00660
.003
COBBLES
200
GRAVEL
.3
102 1
5/8
HYDROMETER ANALYSIS
3/8
April 2011
80
.01
1/4
4
.004
SANDCOARSE FINE
.03
40
40 .01
.008
.008
6 100
.4
1 1/
2
GRAIN SIZE DISTRIBUTION.0
4
ASTMSTND
D422
1/2
FIG. B
iosoils
SP
3
Geotechnical and Environmental Consultants
.6
SHANNON & WILSON, INC.
2
10
.004
.08
4
PE
RC
EN
T C
OA
RS
ER
BY
WE
IGH
T
.0028
Biosoils Testing WorkshopSeattle, Washington
100
90
80
70
60
50
40
30
20
10
0
FINE
GRAIN SIZE IN MILLIMETERS
300
.006
200
BS-ShanWil*
3
SIZE OF MESH OPENING IN INCHES
.04
.03
.003
20
SIEVE ANALYSIS
.001
.2
.02
60
GRAIN SIZE IN MILLIMETERS
100
AA
SH
TO_G
SA
_MA
IN 21-63100-004.G
PJ S
HA
N_W
IL.GD
T 4/18/11
.002
.0230
FINES: SILT OR CLAY
NO. OF MESH OPENINGS PER INCH, U.S. STANDARD
FIG. Biosoils21-1-63100-004
0.0 AKV JFL
* Grain size analysis performed on specimen after burning for organic content.
ORGANIC CONTENTASTM D2974METHOD A/C
Name : Biofiltration Workshop Soil Tested By : Date :
Number : Cedar Grove Compost Checked By : Date :
Comments : Using 5 porcelain dishes for test.
Exploration No.
Sample No.
Depth ft.
Tare No.
a. Wet Wt. + Tare g
b. Dry Wt. + Tare g
c. Tare Weight g
d. Moisture Loss (a-b) g
e. Dry Weight (b-c) g
f. Moist.Cont. (d/e)x100 %
g. Tare No.
h. Dry Wt. + Tare g
i. Ash Wt. + Tare g
j. Tare Weight g
k. Organic Loss (h-i) g
l. Dry Weight (h-j) g
m. Ash Weight (i-j) g
n. Ash Cont. (m/l)x100 %
o. Org. Cont. (100-n) %
276.77
319.43
280.38 276.77 1407.90
V-1 V-2 V-3 V-4 V-5 SUM
V-3
4.704.33 4.86 4.93
148.34
272.99 269.61
155.06 151.98 145.27 759.31
95.67 95.14 95.3095.07
6.72
155.06
131.45
305.82
279.45
V-1 V-2 V-4 V-5
7.167.39
648.59
1372.23
SUM
1544.85
18.0418.44
PRO
JEC
T 4/11/2011
SAM
PLE
CAN
648.59
290.25 281.05
303.56307.81 308.23
125.99 128.40
27.85 26.79
131.50
26.76
6.88 7.52
4.6495.26
282.73
136.95
274.33
1407.90
145.27 759.31
281.05 280.38
29.18
290.25
158.8018.38
151.9817.26 18.32
35.67
148.20 158.80
723.64
MO
ISTU
RE
CO
NTE
NT
131.25
26.37
148.2017.79
OR
GA
NIC
CO
NTE
NT
131.25
279.45
272.57
95.36
125.99 128.40
144.59 138.11
131.50131.45
141.32 151.28
4.74
SPU_Organic Content_Workshop.xlsxRevision No. 1
4/13/2011
0
5
10
15
20
25
30
35
40
45
50
55
60
65
70
75
80
85
90
95
100
0.0010.010.1110100
30 40
GRAIN SIZE DISTRIBUTION (ASTM D422)
14 503/4
LL Cc Cu
D1009.5
1/23/8 4
fine coarseSILT OR CLAY
4
Sample ID Classification PL PI
D10 %Gravel
4.7
D60 D300.0
Depth
Depth0.88
%Clay
0.0
16 20
%Sand %Silt
16 60
Sample ID
4/11/11;
4/11/11; 3.7
GRAIN SIZE IN MILLIMETERS
3
1.0
0.5
COBBLESGRAVEL SAND
PE
RC
EN
T FI
NE
R B
Y W
EIG
HT
coarse
95.8
2001.5
0.189
100 1403 2
0.41
medium
6 810
fine
HYDROMETERU.S. SIEVE OPENING IN INCHES U.S. SIEVE NUMBERS
POORLY GRADED SAND(SP)
SPU GSD Biofiltration WorkshopApril 2011 FIGURE: 1U
S G
RA
IN S
IZE
PE
RM
EA
ME
TER
TE
ST.
GP
J T
EM
PL.
GD
T 4
/15/
11
Seattle Public Utilites Geotechnical Engineering

APPENDIX C
Moisture-Density Relationship (Proctor) Test Results


Proctor AnalysisASTM D1557, D698
Modified A
Date Sampled Project Project No. Soil DescriptionCeder Grove KE110139A
Tested By Collected By Location EB/EP No. DepthMSP Percent passing #4 sieve: 100%
A Mold Number 1 2 3 4 5
B Water Added field wet wet wet wet
C Wt. of Wet Soil + Mold (lb)
13.465 13.555 13.665 13.725 13.795
D Wt. of Mold (lb) 9.450 9.450 9.450 9.450 9.450
E Wt. of Wet Soil (lb) 4.015 4.105 4.215 4.275 4.345
F Wet Density, (pcf) 120.571 123.273 126.577 128.378 130.480
G Wt. of Pan (lb) 0.500 0.500 0.485 0.035 0.035
H Wt. of Wet Soil + Pan (lb)
4.355 3.560 2.540 2.170 2.000
J Wt. of Dry Soil + Pan (lb)
4.030 3.250 2.295 1.885 1.705
K Wt. of Water (lb) 0.325 0.310 0.245 0.285 0.295
M Wt. of Dry Soil (lb) 3.530 2.750 1.810 1.850 1.670
N Moisture Content (%)
9.2 11.3 13.5 15.4 17.7
O Dry Density (pcf) 110.4 110.8 111.5 111.2 110.9
Z For a 6 inch mold: Z = 0.074449 For a 4" mold: Z = 0.0333
Optimum Moisture PercentagMaximum Dry Density:
Corrected Moisture PercentaCorrected Maximum Dry Den
Assumed Specific Gravity: 2.7
ASSOCIATED EARTH SCIENCES, INC. 911 Fifth Ave., Suite 100 Kirkland, WA 98033 425-827-7701 FAX 425-827-5424
N/A
111.5
N/A
Test Results:
Correction for oversize: ASTM D4718
14.8
ASTM D1557 Method C
Remarks
5/19/2011
Automatic Tamper
110.0
110.5
111.0
111.5
112.0
9.0 10.0 11.0 12.0 13.0 14.0 15.0 16.0 17.0 18.0
dry
dens
ity.
(pcf
)
moisture content, %
90
95
100
105
110
115
120
125
130
135
1400 5 10 15 20 25 30 35
MOISTURE CONTENT (%)
DR
Y D
ENSI
TY (p
cf)
100% Saturation (Gs=2.60)
FIGURE #-#
NOTE: Test performed in accordance with ASTM D-1557, Method C
DESCRIPTION SAMPLE NUMBER
SOIL CLASSIFICATION
OPTIMUM MOISTURE CONTENT
MAXIMUM DRY DENSITY
(pcf)
Biosoils BS1 Poorly graded sand (SP) (organic content = 4.8%; moisture content = 19.3%)
15.9% 106.8
0129
-139
-00
CM
K:S
AS
:sas
04-
19-1
1 (P
RO
CTO
R.p
ptx)
COMPACTION TEST RESULTS

Tested By: BF Checked By: GR
Maximum dry density = 108.6 pcf
Optimum moisture = 16.5 %
Elev/ Classification Nat.Sp.G. LL PI
% > % <Depth USCS AASHTO Moist. #4 No.200
TEST RESULTS MATERIAL DESCRIPTION
Project No. Client: Remarks:Project:
Date:Location: Cedar Grove Composting
Report
ASTM D 1557-07 Method A Modified
SP 0.6 3.2
GeoTest - Bioretention Soilpoorly graded sand
11-0162 Aspect Consulting
SPG: assumed
4-14-11
S01
Dry
den
sity
, pcf
102
103.5
105
106.5
108
109.5
Water content, %
11 13 15 17 19 21 23
16.5%, 108.6 pcf
ZAV forSp.G. =2.65
Test specification:
Moisture-Density (Proctor) Test Report
SPU Bioretention Soil Workshop


80
85
90
95
100
105
110
115
120
125
130
135
140
145
150
0 5 10 15 20 25 30 35 40
UN
CO
RR
ECTE
D D
RY
DEN
SITY
, pcf
% Fines:
OTHER TEST RESULTS
G = 2.70
% Sand:
% Gravel:
SHANNON & WILSON, INC.
UNCORRECTED WATER CONTENT, %
Rammer Type:
Sample Identification:
MOISTURE-DENSITY TEST
Poorly Graded Sand; organiccontent= 5.6% by mass (SP)
ASTM D1557 Method A
113
Natural Water Content:Maximum Dry Density:
Optimum Water Content:
G = 2.60
April 2011
95.7
3.9
Geotechnical and Environmental Consultants FIG. Biosoils
Mechanical
14.0 %
Compaction Test Method:
Description of Material:
14.5 %
100% Saturation: G = 2.80
Checked By:
0.4
TEST RESULTS
JFL
BS-ShanWil
21-1-63100-004
GRAIN SIZE ANALYSIS:
Biosoils Testing WorkshopSeattle, Washington


APPENDIX D
Permeability Test Results


Biosoils Testing Workshop
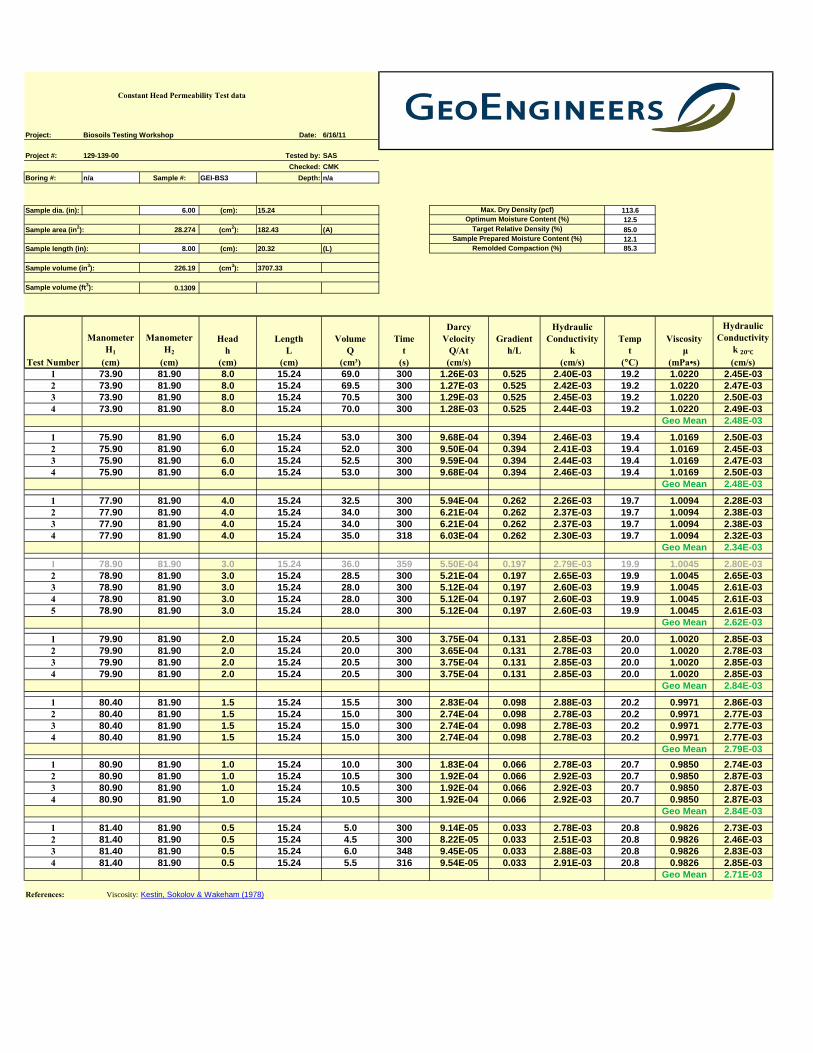
GeoEngineers, Inc. – Permeability Test Results
ASTM D2434 85%MDD (6-inch mold) MC = 12.1%; Percent Compaction = 85.3% MDD
Head cm
Hydraulic Conductivity cm/s
Day 1* Day 2 Day 3* Day 4
0.5 2.21E-03 3.19E-03 2.71E-03 3.77E-03
1.0 2.76E-03 3.02E-03 2.84E-03 3.04E-03
1.5 2.63E-03 2.84E-03 2.79E-03 2.71E-03
2.0 2.56E-03 2.79E-03 2.84E-03 2.78E-03
3.0 2.60E-03 2.75E-03 2.62E-03 2.63E-03
4.0 2.64E-03 2.64E-03 2.34E-03 2.39E-03
6.0 2.76E-03 2.59E-03 2.48E-03 2.41E-03
8.0 2.78E-03 2.57E-03 2.48E-03 2.40E-03
16.0 2.57E-03
32.0 2.69E-03
64.0 2.41E-03
Note: * Hydraulic heads run in reverse order (staring with 8 cm and decreasing to 0.5 cm)
ASTM D2434 90%MDD (6-inch mold) MC = 12.2%; Percent Compaction = 90.3% MDD
Head cm
Hydraulic Conductivity cm/s
Day 1
0.5 1.73E-03
1.0 1.32E-03
1.5 1.28E-03
2.0 1.34E-03
3.0 1.24E-03
4.0 1.26E-03
6.0 1.18E-03
8.0 1.22E-03
16.0 1.17E-03
32.0 1.12E-03
64.0 1.11E-03

2.E-03
3.E-03
4.E-03
0 10 20 30 40 50 60 70
Hyd
rau
lic C
on
du
ctiv
ity
(cm
/s)
Head (cm)
Biosoils Testing Workshop GeoEngineers, Inc. - Permeability Test Results
85% MDD per ASTM D2434
Day 1* Day 2 Day 3* Day 4 Note: * Hydraulic heads run in reverse order (staring with 8 cm and decreasing to 0.5 cm)

2.E-03
3.E-03
4.E-03
0 1 2 3 4 5 6 7 8 9 10
Hyd
rau
lic C
on
du
ctiv
ity
(cm
/s)
Head (cm)
Biosoils Testing Workshop GeoEngineers, Inc. - Permeability Test Results
85% MDD per ASTM D2434
Day 1* Day 2
Day 3* Day 4Note: * Hydraulic heads run in reverse order (staring with 8 cm and decreasing to 0.5 cm)

1.E-03
2.E-03
0 10 20 30 40 50 60 70
Hyd
rau
lic C
on
du
ctiv
ity
(cm
/s)
Head (cm)
Biosoils Testing Workshop GeoEngineers, Inc. - Permeability Test Results
90% MDD per ASTM D2434

Constant Head Permeability Test data
Project: Biosoils Testing Workshop Date: 6/14/11
Project #: 129-139-00 Tested by: SAS Checked: CMKBoring #: n/a Sample #: GEI-BS3 Depth: n/a
Sample dia. (in): 6.00 (cm): 15.24 113.612.5
Sample area (in2): 28.274 (cm2): 182.43 (A) 85.012.1
Sample length (in): 8.00 (cm): 20.32 (L) 85.3
Sample volume (in3): 226.19 (cm3): 3707.33
Sample volume (ft3): 0.1309
1 73.90 81.90 8.0 15.24 48.5 186 1.43E-03 0.525 2.72E-03 20.0 1.0020 2.72E-032 73.90 81.90 8.0 15.24 80.0 300 1.46E-03 0.525 2.78E-03 20.0 1.0020 2.78E-033 73.90 81.90 8.0 15.24 79.5 301 1.45E-03 0.525 2.76E-03 20.0 1.0020 2.76E-034 73.90 81.90 8.0 15.24 80.0 301 1.46E-03 0.525 2.78E-03 20.0 1.0020 2.78E-035 73.90 81.90 8.0 15.24 80.5 301 1.47E-03 0.525 2.79E-03 20.0 1.0020 2.79E-03
Geo Mean 2.78E-03
1 76.00 82.00 6.0 15.24 60.0 300 1.10E-03 0.394 2.78E-03 20.1 0.9995 2.78E-032 76.00 82.00 6.0 15.24 60.0 300 1.10E-03 0.394 2.78E-03 20.1 0.9995 2.78E-033 76.00 82.00 6.0 15.24 59.0 300 1.08E-03 0.394 2.74E-03 20.2 0.9971 2.72E-034 76.00 82.00 6.0 15.24 59.5 300 1.09E-03 0.394 2.76E-03 20.2 0.9971 2.75E-03
Geo Mean 2.76E-03
1 78.00 82.00 4.0 15.24 39.0 300 7.13E-04 0.262 2.72E-03 20.7 0.9850 2.67E-032 78.00 82.00 4.0 15.24 39.0 300 7.13E-04 0.262 2.72E-03 20.7 0.9850 2.67E-033 78.00 82.00 4.0 15.24 38.5 300 7.03E-04 0.262 2.68E-03 20.7 0.9850 2.63E-034 78.00 82.00 4.0 15.24 38.0 300 6.94E-04 0.262 2.65E-03 20.7 0.9850 2.60E-03
Geo Mean 2.64E-03
1 79.00 82.00 3.0 15.24 29.0 300 5.30E-04 0.197 2.69E-03 20.9 0.9803 2.63E-032 79.00 82.00 3.0 15.24 28.5 300 5.21E-04 0.197 2.65E-03 20.9 0.9803 2.59E-033 79.00 82.00 3.0 15.24 28.5 300 5.21E-04 0.197 2.65E-03 20.9 0.9803 2.59E-034 79.00 82.00 3.0 15.24 28.5 300 5.21E-04 0.197 2.65E-03 20.9 0.9803 2.59E-03
Geo Mean 2.60E-03
1 80.00 82.00 2.0 15.24 18.5 300 3.38E-04 0.131 2.58E-03 21.0 0.9779 2.51E-032 80.00 82.00 2.0 15.24 19.0 300 3.47E-04 0.131 2.65E-03 21.0 0.9779 2.58E-033 80.00 82.00 2.0 15.24 19.0 300 3.47E-04 0.131 2.65E-03 21.0 0.9779 2.58E-034 80.00 82.00 2.0 15.24 19.0 300 3.47E-04 0.131 2.65E-03 21.0 0.9779 2.58E-03
Geo Mean 2.56E-03
1 80.50 82.00 1.5 15.24 15.0 300 2.74E-04 0.098 2.78E-03 21.0 0.9779 2.72E-032 80.50 82.00 1.5 15.24 14.0 300 2.56E-04 0.098 2.60E-03 21.0 0.9779 2.54E-033 80.50 82.00 1.5 15.24 14.5 300 2.65E-04 0.098 2.69E-03 21.0 0.9779 2.63E-034 80.50 82.00 1.5 15.24 14.5 300 2.65E-04 0.098 2.69E-03 21.0 0.9779 2.63E-03
Geo Mean 2.63E-031 81.00 82.00 1.0 15.24 10.5 300 1.92E-04 0.066 2.92E-03 20.8 0.9826 2.87E-032 81.00 82.00 1.0 15.24 10.0 300 1.83E-04 0.066 2.78E-03 20.8 0.9826 2.73E-033 81.00 82.00 1.0 15.24 10.0 300 1.83E-04 0.066 2.78E-03 20.8 0.9826 2.73E-034 81.00 82.00 1.0 15.24 10.0 300 1.83E-04 0.066 2.78E-03 20.8 0.9826 2.73E-03
Geo Mean 2.76E-03
1 81.50 82.00 0.5 15.24 6.5 480 7.42E-05 0.033 2.26E-03 21.0 0.9779 2.21E-032 81.50 82.00 0.5 15.24 12.0 940 7.00E-05 0.033 2.13E-03 21.0 0.9779 2.08E-033 81.50 82.00 0.5 15.24 10.0 752 7.29E-05 0.033 2.22E-03 21.0 0.9779 2.17E-034 81.50 82.00 0.5 15.24 8.5 554 8.41E-05 0.033 2.56E-03 21.0 0.9779 2.50E-035 81.50 82.00 0.5 15.24 7.0 479 8.01E-05 0.033 2.44E-03 21.0 0.9779 2.38E-03
Geo Mean 2.21E-03
References: Viscosity: Kestin, Sokolov & Wakeham (1978)
Viscosity μ
(mPa•s)
Hydraulic Conductivity
k 20°C(cm/s)
Volume Q
(cm³)
Timet
(s)
Darcy Velocity
Q/At (cm/s)
Gradient h/L
Hydraulic Conductivity
k (cm/s)
Tempt
(°C)
Max. Dry Density (pcf)Optimum Moisture Content (%)
Target Relative Density (%)Sample Prepared Moisture Content (%)
Remolded Compaction (%)
Test Number
Manometer H1
(cm)
Manometer H2
(cm)
Headh
(cm)
Length L
(cm)

Constant Head Permeability Test data
Project: Biosoils Testing Workshop Date: 6/15/11
Project #: 129-139-00 Tested by: SAS Checked: CMKBoring #: n/a Sample #: GEI-BS3 Depth: n/a
Sample dia. (in): 6.00 (cm): 15.24 113.612.5
Sample area (in2): 28.274 (cm2): 182.43 (A) 85.012.1
Sample length (in): 8.00 (cm): 20.32 (L) 85.3
Sample volume (in3): 226.19 (cm3): 3707.33
Sample volume (ft3): 0.1309
1 81.40 81.90 0.5 15.24 9.0 482 1.02E-04 0.033 3.12E-03 19.5 1.0144 3.16E-032 81.40 81.90 0.5 15.24 13.5 700 1.06E-04 0.033 3.22E-03 19.5 1.0144 3.26E-033 81.40 81.90 0.5 15.24 10.0 526 1.04E-04 0.033 3.18E-03 19.5 1.0144 3.22E-034 81.40 81.90 0.5 15.24 9.5 498 1.05E-04 0.033 3.19E-03 19.5 1.0144 3.23E-035 81.40 81.90 0.5 15.24 9.0 480 1.03E-04 0.033 3.13E-03 19.5 1.0144 3.17E-03
Geo Mean 3.19E-031 80.90 81.90 1.0 15.24 11.0 300 2.01E-04 0.066 3.06E-03 20.1 0.9995 3.06E-032 80.90 81.90 1.0 15.24 11.0 300 2.01E-04 0.066 3.06E-03 20.1 0.9995 3.06E-033 80.90 81.90 1.0 15.24 10.5 300 1.92E-04 0.066 2.92E-03 20.1 0.9995 2.92E-034 80.90 81.90 1.0 15.24 11.0 300 2.01E-04 0.066 3.06E-03 20.1 0.9995 3.06E-03
Geo Mean 3.02E-03
1 80.40 81.90 1.5 15.24 19.5 385 2.78E-04 0.098 2.82E-03 20.5 0.9898 2.79E-032 80.40 81.90 1.5 15.24 15.5 300 2.83E-04 0.098 2.88E-03 20.5 0.9898 2.84E-033 80.40 81.90 1.5 15.24 18.0 347 2.84E-04 0.098 2.89E-03 20.5 0.9898 2.85E-034 80.40 81.90 1.5 15.24 15.5 301 2.82E-04 0.098 2.87E-03 20.5 0.9898 2.83E-035 80.40 81.90 1.5 15.24 15.0 300 2.74E-04 0.098 2.78E-03 20.5 0.9898 2.75E-036 80.40 81.90 1.5 15.24 15.5 300 2.83E-04 0.098 2.88E-03 20.5 0.9898 2.84E-03
Geo Mean 2.84E-03
1 79.90 81.90 2.0 15.24 20.0 300 3.65E-04 0.131 2.78E-03 20.5 0.9898 2.75E-032 79.90 81.90 2.0 15.24 20.5 300 3.75E-04 0.131 2.85E-03 20.5 0.9898 2.82E-033 79.90 81.90 2.0 15.24 20.5 300 3.75E-04 0.131 2.85E-03 20.5 0.9898 2.82E-034 79.90 81.90 2.0 15.24 20.0 300 3.65E-04 0.131 2.78E-03 20.5 0.9898 2.75E-03
Geo Mean 2.79E-03
1 78.90 81.90 3.0 15.24 30.0 300 5.48E-04 0.197 2.78E-03 20.5 0.9898 2.75E-032 78.90 81.90 3.0 15.24 37.5 409 5.03E-04 0.197 2.55E-03 20.5 0.9898 2.52E-033 78.90 81.90 3.0 15.24 30.0 300 5.48E-04 0.197 2.78E-03 20.5 0.9898 2.75E-034 78.90 81.90 3.0 15.24 30.0 300 5.48E-04 0.197 2.78E-03 20.5 0.9898 2.75E-035 78.90 81.90 3.0 15.24 30.0 300 5.48E-04 0.197 2.78E-03 20.5 0.9898 2.75E-03
Geo Mean 2.75E-03
1 77.90 81.90 4.0 15.24 39.0 300 7.13E-04 0.262 2.72E-03 20.4 0.9922 2.69E-032 77.90 81.90 4.0 15.24 38.0 300 6.94E-04 0.262 2.65E-03 20.4 0.9922 2.62E-033 77.90 81.90 4.0 15.24 38.0 300 6.94E-04 0.262 2.65E-03 20.4 0.9922 2.62E-034 77.90 81.90 4.0 15.24 38.0 300 6.94E-04 0.262 2.65E-03 20.4 0.9922 2.62E-03
Geo Mean 2.64E-03
1 75.90 81.90 6.0 15.24 56.0 300 1.02E-03 0.394 2.60E-03 20.3 0.9947 2.58E-032 75.90 81.90 6.0 15.24 56.5 300 1.03E-03 0.394 2.62E-03 20.3 0.9947 2.60E-033 75.90 81.90 6.0 15.24 56.0 300 1.02E-03 0.394 2.60E-03 20.3 0.9947 2.58E-034 75.90 81.90 6.0 15.24 56.5 300 1.03E-03 0.394 2.62E-03 20.3 0.9947 2.60E-03
Geo Mean 2.59E-03
1 73.90 81.90 8.0 15.24 74.5 300 1.36E-03 0.525 2.59E-03 20.1 0.9995 2.59E-032 73.90 81.90 8.0 15.24 74.0 300 1.35E-03 0.525 2.58E-03 20.1 0.9995 2.57E-033 73.90 81.90 8.0 15.24 74.0 300 1.35E-03 0.525 2.58E-03 20.1 0.9995 2.57E-034 73.90 81.90 8.0 15.24 73.0 300 1.33E-03 0.525 2.54E-03 20.1 0.9995 2.53E-03
Geo Mean 2.57E-03
References: Viscosity: Kestin, Sokolov & Wakeham (1978)
Viscosity μ
(mPa•s)
Hydraulic Conductivity
k 20°C(cm/s)
Volume Q
(cm³)
Timet
(s)
Darcy Velocity
Q/At (cm/s)
Gradient h/L
Hydraulic Conductivity
k (cm/s)
Tempt
(°C)
Max. Dry Density (pcf)Optimum Moisture Content (%)
Target Relative Density (%)Sample Prepared Moisture Content (%)
Remolded Compaction (%)
Test Number
Manometer H1
(cm)
Manometer H2
(cm)
Headh
(cm)
Length L
(cm)
Constant Head Permeability Test data
Project: Biosoils Testing Workshop Date: 6/16/11
Project #: 129-139-00 Tested by: SAS Checked: CMKBoring #: n/a Sample #: GEI-BS3 Depth: n/a
Sample dia. (in): 6.00 (cm): 15.24 113.612.5
Sample area (in2): 28.274 (cm2): 182.43 (A) 85.012.1
Sample length (in): 8.00 (cm): 20.32 (L) 85.3
Sample volume (in3): 226.19 (cm3): 3707.33
Sample volume (ft3): 0.1309
1 73.90 81.90 8.0 15.24 69.0 300 1.26E-03 0.525 2.40E-03 19.2 1.0220 2.45E-032 73.90 81.90 8.0 15.24 69.5 300 1.27E-03 0.525 2.42E-03 19.2 1.0220 2.47E-033 73.90 81.90 8.0 15.24 70.5 300 1.29E-03 0.525 2.45E-03 19.2 1.0220 2.50E-034 73.90 81.90 8.0 15.24 70.0 300 1.28E-03 0.525 2.44E-03 19.2 1.0220 2.49E-03
Geo Mean 2.48E-03
1 75.90 81.90 6.0 15.24 53.0 300 9.68E-04 0.394 2.46E-03 19.4 1.0169 2.50E-032 75.90 81.90 6.0 15.24 52.0 300 9.50E-04 0.394 2.41E-03 19.4 1.0169 2.45E-033 75.90 81.90 6.0 15.24 52.5 300 9.59E-04 0.394 2.44E-03 19.4 1.0169 2.47E-034 75.90 81.90 6.0 15.24 53.0 300 9.68E-04 0.394 2.46E-03 19.4 1.0169 2.50E-03
Geo Mean 2.48E-03
1 77.90 81.90 4.0 15.24 32.5 300 5.94E-04 0.262 2.26E-03 19.7 1.0094 2.28E-032 77.90 81.90 4.0 15.24 34.0 300 6.21E-04 0.262 2.37E-03 19.7 1.0094 2.38E-033 77.90 81.90 4.0 15.24 34.0 300 6.21E-04 0.262 2.37E-03 19.7 1.0094 2.38E-034 77.90 81.90 4.0 15.24 35.0 318 6.03E-04 0.262 2.30E-03 19.7 1.0094 2.32E-03
Geo Mean 2.34E-03
1 78.90 81.90 3.0 15.24 36.0 359 5.50E-04 0.197 2.79E-03 19.9 1.0045 2.80E-032 78.90 81.90 3.0 15.24 28.5 300 5.21E-04 0.197 2.65E-03 19.9 1.0045 2.65E-033 78.90 81.90 3.0 15.24 28.0 300 5.12E-04 0.197 2.60E-03 19.9 1.0045 2.61E-034 78.90 81.90 3.0 15.24 28.0 300 5.12E-04 0.197 2.60E-03 19.9 1.0045 2.61E-035 78.90 81.90 3.0 15.24 28.0 300 5.12E-04 0.197 2.60E-03 19.9 1.0045 2.61E-03
Geo Mean 2.62E-03
1 79.90 81.90 2.0 15.24 20.5 300 3.75E-04 0.131 2.85E-03 20.0 1.0020 2.85E-032 79.90 81.90 2.0 15.24 20.0 300 3.65E-04 0.131 2.78E-03 20.0 1.0020 2.78E-033 79.90 81.90 2.0 15.24 20.5 300 3.75E-04 0.131 2.85E-03 20.0 1.0020 2.85E-034 79.90 81.90 2.0 15.24 20.5 300 3.75E-04 0.131 2.85E-03 20.0 1.0020 2.85E-03
Geo Mean 2.84E-03
1 80.40 81.90 1.5 15.24 15.5 300 2.83E-04 0.098 2.88E-03 20.2 0.9971 2.86E-032 80.40 81.90 1.5 15.24 15.0 300 2.74E-04 0.098 2.78E-03 20.2 0.9971 2.77E-033 80.40 81.90 1.5 15.24 15.0 300 2.74E-04 0.098 2.78E-03 20.2 0.9971 2.77E-034 80.40 81.90 1.5 15.24 15.0 300 2.74E-04 0.098 2.78E-03 20.2 0.9971 2.77E-03
Geo Mean 2.79E-031 80.90 81.90 1.0 15.24 10.0 300 1.83E-04 0.066 2.78E-03 20.7 0.9850 2.74E-032 80.90 81.90 1.0 15.24 10.5 300 1.92E-04 0.066 2.92E-03 20.7 0.9850 2.87E-033 80.90 81.90 1.0 15.24 10.5 300 1.92E-04 0.066 2.92E-03 20.7 0.9850 2.87E-034 80.90 81.90 1.0 15.24 10.5 300 1.92E-04 0.066 2.92E-03 20.7 0.9850 2.87E-03
Geo Mean 2.84E-03
1 81.40 81.90 0.5 15.24 5.0 300 9.14E-05 0.033 2.78E-03 20.8 0.9826 2.73E-032 81.40 81.90 0.5 15.24 4.5 300 8.22E-05 0.033 2.51E-03 20.8 0.9826 2.46E-033 81.40 81.90 0.5 15.24 6.0 348 9.45E-05 0.033 2.88E-03 20.8 0.9826 2.83E-034 81.40 81.90 0.5 15.24 5.5 316 9.54E-05 0.033 2.91E-03 20.8 0.9826 2.85E-03
Geo Mean 2.71E-03
References: Viscosity: Kestin, Sokolov & Wakeham (1978)
Viscosity μ
(mPa•s)
Hydraulic Conductivity
k 20°C(cm/s)
Volume Q
(cm³)
Timet
(s)
Darcy Velocity
Q/At (cm/s)
Gradient h/L
Hydraulic Conductivity
k (cm/s)
Tempt
(°C)
Max. Dry Density (pcf)Optimum Moisture Content (%)
Target Relative Density (%)Sample Prepared Moisture Content (%)
Remolded Compaction (%)
Test Number
Manometer H1
(cm)
Manometer H2
(cm)
Headh
(cm)
Length L
(cm)

Constant Head Permeability Test data
Project: Biosoils Testing Workshop Date: 6/17/11
Project #: 129-139-00 Tested by: SAS Checked: CMKBoring #: n/a Sample #: GEI-BS3 Depth: n/a
Sample dia. (in): 6.00 (cm): 15.24 113.612.5
Sample area (in2): 28.274 (cm2): 182.43 (A) 85.012.1
Sample length (in): 8.00 (cm): 20.32 (L) 85.3
Sample volume (in3): 226.19 (cm3): 3707.33
Sample volume (ft3): 0.1309
1 81.4 81.9 0.5 15.24 7.0 300 1.28E-04 0.033 3.90E-03 19.1 1.0245 3.99E-032 81.4 81.9 0.5 15.24 6.5 300 1.19E-04 0.033 3.62E-03 19.1 1.0245 3.70E-033 81.4 81.9 0.5 15.24 6.5 300 1.19E-04 0.033 3.62E-03 19.1 1.0245 3.70E-034 81.4 81.9 0.5 15.24 6.5 300 1.19E-04 0.033 3.62E-03 19.1 1.0245 3.70E-03
Geo Mean 3.77E-031 80.9 81.9 1.0 15.24 10.5 300 1.92E-04 0.066 2.92E-03 19.7 1.0094 2.95E-032 80.9 81.9 1.0 15.24 11.0 304 1.98E-04 0.066 3.02E-03 19.7 1.0094 3.05E-033 80.9 81.9 1.0 15.24 11.0 300 2.01E-04 0.066 3.06E-03 19.7 1.0094 3.09E-034 80.9 81.9 1.0 15.24 11.0 300 2.01E-04 0.066 3.06E-03 19.7 1.0094 3.09E-03
Geo Mean 3.04E-03
1 80.4 81.9 1.5 15.24 13.0 300 2.38E-04 0.098 2.41E-03 19.9 1.0045 2.42E-032 80.4 81.9 1.5 15.24 14.5 300 2.65E-04 0.098 2.69E-03 19.9 1.0045 2.70E-033 80.4 81.9 1.5 15.24 18.0 351 2.81E-04 0.098 2.86E-03 19.9 1.0045 2.86E-034 80.4 81.9 1.5 15.24 15.5 300 2.83E-04 0.098 2.88E-03 19.9 1.0045 2.88E-03
Geo Mean 2.71E-03
1 79.9 81.9 2.0 15.24 21.0 302 3.81E-04 0.131 2.90E-03 20.8 0.9826 2.85E-032 79.9 81.9 2.0 15.24 20.0 300 3.65E-04 0.131 2.78E-03 20.8 0.9826 2.73E-033 79.9 81.9 2.0 15.24 21.5 314 3.75E-04 0.131 2.86E-03 20.8 0.9826 2.80E-034 79.9 81.9 2.0 15.24 21.0 313 3.68E-04 0.131 2.80E-03 20.8 0.9826 2.75E-03
Geo Mean 2.78E-03
1 78.9 81.9 3.0 15.24 31.0 300 5.66E-04 0.197 2.88E-03 21.0 0.9779 2.81E-032 78.9 81.9 3.0 15.24 32.5 350 5.09E-04 0.197 2.59E-03 21.0 0.9779 2.52E-033 78.9 81.9 3.0 15.24 20.5 212 5.30E-04 0.197 2.69E-03 21.0 0.9779 2.63E-034 78.9 81.9 3.0 15.24 28.5 300 5.21E-04 0.197 2.65E-03 21.0 0.9779 2.58E-03
Geo Mean 2.63E-03
1 77.9 81.9 4.0 15.20 35.0 300 6.40E-04 0.263 2.43E-03 21.0 0.9779 2.37E-032 77.9 81.9 4.0 15.20 35.5 300 6.49E-04 0.263 2.46E-03 21.0 0.9779 2.41E-033 77.9 81.9 4.0 15.20 36.0 313 6.30E-04 0.263 2.40E-03 21.0 0.9779 2.34E-034 77.9 81.9 4.0 15.20 36.0 300 6.58E-04 0.263 2.50E-03 21.0 0.9779 2.44E-03
Geo Mean 2.39E-03
1 75.9 81.9 6.0 15.24 52.5 300 9.59E-04 0.394 2.44E-03 21.0 0.9779 2.38E-032 75.9 81.9 6.0 15.24 54.0 300 9.87E-04 0.394 2.51E-03 21.0 0.9779 2.45E-033 75.9 81.9 6.0 15.24 53.0 300 9.68E-04 0.394 2.46E-03 21.0 0.9779 2.40E-034 75.9 81.9 6.0 15.24 53.0 300 9.68E-04 0.394 2.46E-03 21.0 0.9779 2.40E-03
Geo Mean 2.41E-03
1 73.9 81.9 8.0 15.24 69.0 300 1.26E-03 0.525 2.40E-03 21.0 0.9779 2.34E-032 73.9 81.9 8.0 15.24 71.5 300 1.31E-03 0.525 2.49E-03 21.0 0.9779 2.43E-033 73.9 81.9 8.0 15.24 71.0 300 1.30E-03 0.525 2.47E-03 21.0 0.9779 2.41E-034 73.9 81.9 8.0 15.24 71.0 300 1.30E-03 0.525 2.47E-03 21.0 0.9779 2.41E-03
Geo Mean 2.40E-03
1 65.6 81.6 16.0 15.24 81.5 165 2.71E-03 1.050 2.58E-03 21.0 0.9779 2.52E-032 65.6 81.6 16.0 15.24 83.5 165 2.77E-03 1.050 2.64E-03 21.0 0.9779 2.58E-033 65.6 81.6 16.0 15.24 83.5 165 2.77E-03 1.050 2.64E-03 21.0 0.9779 2.58E-034 65.6 81.6 16.0 15.24 84.0 165 2.79E-03 1.050 2.66E-03 21.0 0.9779 2.59E-03
Geo Mean 2.57E-03
1 49.0 81.0 32.0 15.24 94.5 90 5.76E-03 2.100 2.74E-03 21.0 0.9779 2.68E-032 49.0 81.0 32.0 15.24 95.0 90 5.79E-03 2.100 2.76E-03 21.0 0.9779 2.69E-033 49.0 81.0 32.0 15.24 95.0 90 5.79E-03 2.100 2.76E-03 21.0 0.9779 2.69E-03
Hydraulic Conductivity
k 20°C(cm/s)
Remolded Compaction (%)
Volume Q
(cm³)
Gradient h/L
Hydraulic Conductivity
k (cm/s)
Tempt
(°C)
Viscosity μ
(mPa•s)
Timet
(s)
Darcy Velocity
Q/At (cm/s)
Max. Dry Density (pcf)Optimum Moisture Content (%)
Target Relative Density (%)Sample Prepared Moisture Content (%)
Test Number
Manometer H1
(cm)
Manometer H2
(cm)
Headh
(cm)
Length L
(cm)

4 49.0 81.0 32.0 15.24 95.0 90 5.79E-03 2.100 2.76E-03 21.0 0.9779 2.69E-03Geo Mean 2.69E-03
1 16.0 80.0 64.0 15.24 95.5 50 1.05E-02 4.199 2.49E-03 21.0 0.9779 2.43E-032 16.0 80.0 64.0 15.24 95.0 50 1.04E-02 4.199 2.48E-03 21.0 0.9779 2.42E-033 16.0 80.0 64.0 15.24 94.5 50 1.04E-02 4.199 2.47E-03 21.0 0.9779 2.41E-034 16.0 80.0 64.0 15.24 92.5 50 1.01E-02 4.199 2.41E-03 21.0 0.9779 2.36E-035 16.0 80.0 64.0 15.24 94.0 50 1.03E-02 4.199 2.45E-03 21.0 0.9779 2.39E-03
Geo Mean 2.41E-03
References: Viscosity: Kestin, Sokolov & Wakeham (1978)

Constant Head Permeability Test data
Project: Biosoils Testing Workshop Date: 6/21/11
Project #: 129-139-00 Tested by: SAS Checked: CMKBoring #: n/a Sample #: GEI-BS3 Depth: n/a
Sample dia. (in): 6.00 (cm): 15.24 113.612.5
Sample area (in2): 28.274 (cm2): 182.43 (A) 90.012.2
Sample length (in): 8.00 (cm): 20.32 (L) 90.3
Sample volume (in3): 226.19 (cm3): 3707.33
Sample volume (ft3): 0.1309
1 81.40 81.90 0.5 15.2 6.0 312 1.05E-04 0.033 3.20E-03 20.3 0.9947 3.18E-032 81.40 81.90 0.5 15.2 6.5 581 6.13E-05 0.033 1.86E-03 20.3 0.9947 1.85E-033 81.40 81.90 0.5 15.2 7.0 635 6.04E-05 0.033 1.84E-03 20.3 0.9947 1.82E-034 81.40 81.90 0.5 15.2 6.0 601 5.47E-05 0.033 1.66E-03 20.3 0.9947 1.65E-035 81.40 81.90 0.5 15.2 6.0 611 5.38E-05 0.033 1.64E-03 20.3 0.9947 1.62E-03
Geo Mean 1.73E-031 81.00 82.00 1.0 15.2 8.0 327 1.34E-04 0.066 2.04E-03 21.0 0.9779 1.99E-032 81.00 82.00 1.0 15.2 5.5 310 9.73E-05 0.066 1.48E-03 21.0 0.9779 1.44E-033 81.00 82.00 1.0 15.2 7.5 489 8.41E-05 0.066 1.28E-03 21.0 0.9779 1.25E-034 81.00 82.00 1.0 15.2 6.5 402 8.86E-05 0.066 1.35E-03 21.0 0.9779 1.31E-035 81.00 82.00 1.0 15.2 6.5 412 8.65E-05 0.066 1.31E-03 21.0 0.9779 1.28E-03
Geo Mean 1.32E-03
1 80.50 82.00 1.5 15.2 10.0 433 1.27E-04 0.099 1.28E-03 21.0 0.9779 1.25E-032 80.50 82.00 1.5 15.2 10.0 421 1.30E-04 0.099 1.32E-03 21.0 0.9779 1.29E-033 80.50 82.00 1.5 15.2 9.5 387 1.35E-04 0.099 1.36E-03 21.0 0.9779 1.33E-034 80.50 82.00 1.5 15.2 11.0 470 1.28E-04 0.099 1.30E-03 21.0 0.9779 1.27E-03
Geo Mean 1.28E-03
1 80.00 82.00 2.0 15.2 10.0 301 1.82E-04 0.132 1.38E-03 21.2 0.9732 1.34E-032 80.00 82.00 2.0 15.2 10.0 302 1.82E-04 0.132 1.38E-03 21.2 0.9732 1.34E-033 80.00 82.00 2.0 15.2 11.0 334 1.81E-04 0.132 1.37E-03 21.2 0.9732 1.33E-034 80.00 82.00 2.0 15.2 9.0 268 1.84E-04 0.132 1.40E-03 21.2 0.9732 1.36E-03
Geo Mean 1.34E-03
1 79.00 82.00 3.0 15.2 14.5 322 2.47E-04 0.197 1.25E-03 21.5 0.9662 1.21E-032 79.00 82.00 3.0 15.2 12.0 252 2.61E-04 0.197 1.32E-03 21.5 0.9662 1.28E-033 79.00 82.00 3.0 15.2 14.5 317 2.51E-04 0.197 1.27E-03 21.5 0.9662 1.22E-034 79.00 82.00 3.0 15.2 12.5 263 2.61E-04 0.197 1.32E-03 21.5 0.9662 1.27E-03
Geo Mean 1.24E-03
1 78.00 82.00 4.0 15.2 18.5 300 3.38E-04 0.263 1.28E-03 20.8 0.9826 1.26E-032 78.00 82.00 4.0 15.2 17.0 274 3.40E-04 0.263 1.29E-03 20.8 0.9826 1.27E-033 78.00 82.00 4.0 15.2 18.5 300 3.38E-04 0.263 1.28E-03 20.8 0.9826 1.26E-034 78.00 82.00 4.0 15.2 19.0 310 3.36E-04 0.263 1.28E-03 20.8 0.9826 1.25E-03
Geo Mean 1.26E-03
1 76.00 82.00 6.0 15.2 29.0 344 4.62E-04 0.395 1.17E-03 21.0 0.9779 1.14E-032 76.00 82.00 6.0 15.2 26.5 300 4.84E-04 0.395 1.23E-03 21.0 0.9779 1.20E-033 76.00 82.00 6.0 15.2 27.0 303 4.88E-04 0.395 1.24E-03 21.0 0.9779 1.21E-034 76.00 82.00 6.0 15.2 26.5 303 4.79E-04 0.395 1.21E-03 21.0 0.9779 1.19E-03
Geo Mean 1.18E-03
1 73.80 81.80 8.0 15.2 35.5 300 6.49E-04 0.526 1.23E-03 20.8 0.9826 1.21E-032 73.80 81.80 8.0 15.2 36.0 300 6.58E-04 0.526 1.25E-03 20.8 0.9826 1.23E-033 73.80 81.80 8.0 15.2 36.0 300 6.58E-04 0.526 1.25E-03 20.8 0.9826 1.23E-034 73.80 81.80 8.0 15.2 31.0 259 6.56E-04 0.526 1.25E-03 20.8 0.9826 1.22E-03
Geo Mean 1.22E-03
1 65.60 81.60 16.0 15.2 63.0 270 1.28E-03 1.053 1.22E-03 21.3 0.9708 1.18E-032 65.60 81.60 16.0 15.2 63.5 270 1.29E-03 1.053 1.22E-03 21.3 0.9708 1.19E-033 65.60 81.60 16.0 15.2 92.0 404 1.25E-03 1.053 1.19E-03 21.3 0.9708 1.15E-034 65.60 81.60 16.0 15.2 62.0 270 1.26E-03 1.053 1.20E-03 21.3 0.9708 1.16E-03
Geo Mean 1.17E-03
1 49.10 81.10 32.0 15.2 60.5 134 2.47E-03 2.105 1.18E-03 21.1 0.9755 1.14E-03
Viscosity μ
(mPa•s)
Hydraulic Conductivity
k 20°C(cm/s)
Volume Q
(cm³)
Timet
(s)
Darcy Velocity
Q/At (cm/s)
Gradient h/L
Hydraulic Conductivity
k (cm/s)
Tempt
(°C)
Max. Dry Density (pcf)Optimum Moisture Content (%)
Target Relative Density (%)Sample Prepared Moisture Content (%)
Remolded Compaction (%)
Test Number
Manometer H1
(cm)
Manometer H2
(cm)
Headh
(cm)
Length L
(cm)

2 49.10 81.10 32.0 15.2 60.0 134 2.45E-03 2.105 1.17E-03 21.1 0.9755 1.14E-033 49.10 81.10 32.0 15.2 81.0 186 2.39E-03 2.105 1.13E-03 21.1 0.9755 1.10E-034 49.10 81.10 32.0 15.2 66.0 150 2.41E-03 2.105 1.15E-03 21.1 0.9755 1.12E-03
Geo Mean 1.12E-03
1 16.00 80.00 64.0 15.2 63.5 73 4.77E-03 4.211 1.13E-03 21.0 0.9779 1.11E-032 16.00 80.00 64.0 15.2 64.5 73 4.84E-03 4.211 1.15E-03 21.0 0.9779 1.12E-033 16.00 80.00 64.0 15.2 64.0 73 4.81E-03 4.211 1.14E-03 21.0 0.9779 1.11E-034 16.00 80.00 64.0 15.2 64.0 73 4.81E-03 4.211 1.14E-03 21.0 0.9779 1.11E-03
Geo Mean 1.11E-03
References: Viscosity: Kestin, Sokolov & Wakeham (1978)

741 Marine Drive, Bellingham, WA 98225 www.geotest-inc.com 20611 67th Ave. NE, Unit A, Arlington, WA 98223 phone: (360) 733.7318 toll free: (888) 251.5276 fax: (360) 733.7418
This report shall not be reproduced except in full, without the written approval of GeoTest Services, Inc. (2-15-11)
BIORETENTION SOIL PERMEABILITY ANALYSIS
PROJECT: City of Seattle Bioretention Soil Workshop JOB #: 11-0162 CLIENT: Aspect Consulting REPORT #: 01 SOURCE: Cedar Grove DATE: 5/23/11-5/26/11 MATERIAL: Bioretention / Rain Garden Mix PAGE #: 1 of 9 INSPECTOR: DPB
UNIT WEIGHT MOISTURE 1 LENGTH BETWEEN MAN, OUTLETS, L 15.24 cm CONTAINER NO. G8 2 DIAMETER OF SOIL SPECIMENT, D 15.24 cm a WET WEIGHT + TARE 1898.5 g 3 CROSS-SECTIONAL AREA 182.32 cm2 b DRY WEIGHT + TARE 1836.3 g 4 HEIGHT, H1 25.60 cm c TARE WEIGHT 1461.5 g 5 HEIGHT, H2 5.09 cm d WATER WEIGHT 62.2 g 6 HEIGHT OF SPECIMEN 20.51 cm e DRY SOIL WEIGHT 374.8 g 7 VOLUME OF SPECIMEN 3739.4 cm3 12 WATER CONTENT 16.6% 8 WEIGHT OF SOIL TOTAL, W1 7593.4 g 9 WEIGHT OF SOIL UNUSED, W2 1198.9 g 13 DRY DENSITY 91.5 lb/ft3
10 WEIGHT OF SOIL SPECIMENT 6394.5 g 14 MAXIMUM DRY DENSITY - 11 WET DENSITY 106.7 lb/ft3 15 WATER CONTENT 84.3%
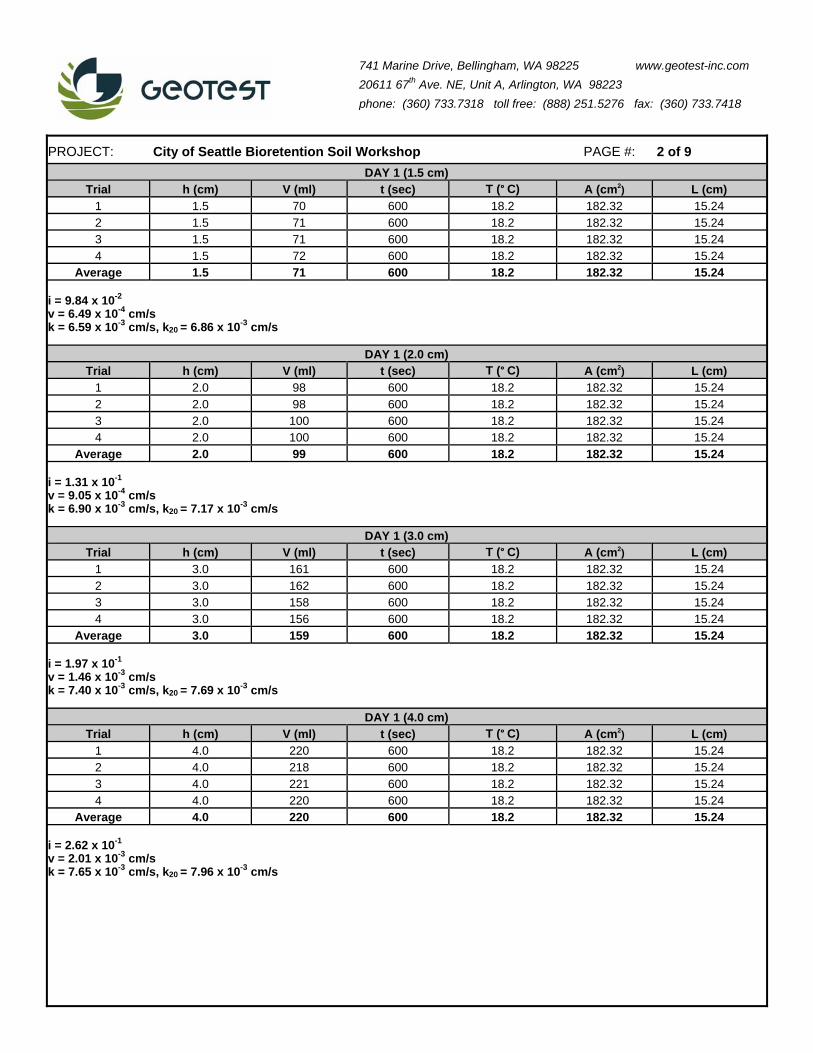
Day 1 Permeability Test Results
DAY 1 (0.5 cm) Trial h (cm) V (ml) t (sec) T (° C) A (cm2) L (cm)
1 0.5 32 600 18.2 182.32 15.24 2 0.5 32 600 18.2 182.32 15.24 3 0.5 32 600 18.2 182.32 15.24 4 0.5 32 600 18.2 182.32 15.24
Average 0.5 32 600 18.2 182.32 15.24 i = 3.28 x 10⁻² v = 2.93 x 10⁻⁴ cm/s k = 8.92 x 10⁻³ cm/s, k20 = 9.28 x 10⁻³ cm/s
DAY 1 (1.0 cm) Trial h (cm) V (ml) t (sec) T (° C) A (cm2) L (cm)
1 1.0 54 600 18.2 182.32 15.24 2 1.0 54 600 18.2 182.32 15.24 3 1.0 54 600 18.2 182.32 15.24 4 1.0 54 600 18.2 182.32 15.24
Average 1.0 54 600 18.2 182.32 15.24 i = 6.56 x 10⁻² v = 4.94 x 10⁻⁴ cm/s k = 7.52 x 10⁻³ cm/s, k20 = 7.83 x 10⁻³ cm/s
741 Marine Drive, Bellingham, WA 98225 www.geotest-inc.com 20611 67th Ave. NE, Unit A, Arlington, WA 98223 phone: (360) 733.7318 toll free: (888) 251.5276 fax: (360) 733.7418
PROJECT: City of Seattle Bioretention Soil Workshop PAGE #: 2 of 9 DAY 1 (1.5 cm)
Trial h (cm) V (ml) t (sec) T (° C) A (cm2) L (cm) 1 1.5 70 600 18.2 182.32 15.24 2 1.5 71 600 18.2 182.32 15.24 3 1.5 71 600 18.2 182.32 15.24 4 1.5 72 600 18.2 182.32 15.24
Average 1.5 71 600 18.2 182.32 15.24 i = 9.84 x 10⁻² v = 6.49 x 10⁻⁴ cm/s k = 6.59 x 10⁻³ cm/s, k20 = 6.86 x 10⁻³ cm/s
DAY 1 (2.0 cm) Trial h (cm) V (ml) t (sec) T (° C) A (cm2) L (cm)
1 2.0 98 600 18.2 182.32 15.24 2 2.0 98 600 18.2 182.32 15.24 3 2.0 100 600 18.2 182.32 15.24 4 2.0 100 600 18.2 182.32 15.24
Average 2.0 99 600 18.2 182.32 15.24 i = 1.31 x 10⁻¹ v = 9.05 x 10⁻⁴ cm/s k = 6.90 x 10⁻³ cm/s, k20 = 7.17 x 10⁻³ cm/s
DAY 1 (3.0 cm) Trial h (cm) V (ml) t (sec) T (° C) A (cm2) L (cm)
1 3.0 161 600 18.2 182.32 15.24 2 3.0 162 600 18.2 182.32 15.24 3 3.0 158 600 18.2 182.32 15.24 4 3.0 156 600 18.2 182.32 15.24
Average 3.0 159 600 18.2 182.32 15.24 i = 1.97 x 10⁻¹ v = 1.46 x 10⁻³ cm/s k = 7.40 x 10⁻³ cm/s, k20 = 7.69 x 10⁻³ cm/s
DAY 1 (4.0 cm) Trial h (cm) V (ml) t (sec) T (° C) A (cm2) L (cm)
1 4.0 220 600 18.2 182.32 15.24 2 4.0 218 600 18.2 182.32 15.24 3 4.0 221 600 18.2 182.32 15.24 4 4.0 220 600 18.2 182.32 15.24
Average 4.0 220 600 18.2 182.32 15.24 i = 2.62 x 10⁻¹ v = 2.01 x 10⁻³ cm/s k = 7.65 x 10⁻³ cm/s, k20 = 7.96 x 10⁻³ cm/s
741 Marine Drive, Bellingham, WA 98225 www.geotest-inc.com 20611 67th Ave. NE, Unit A, Arlington, WA 98223 phone: (360) 733.7318 toll free: (888) 251.5276 fax: (360) 733.7418
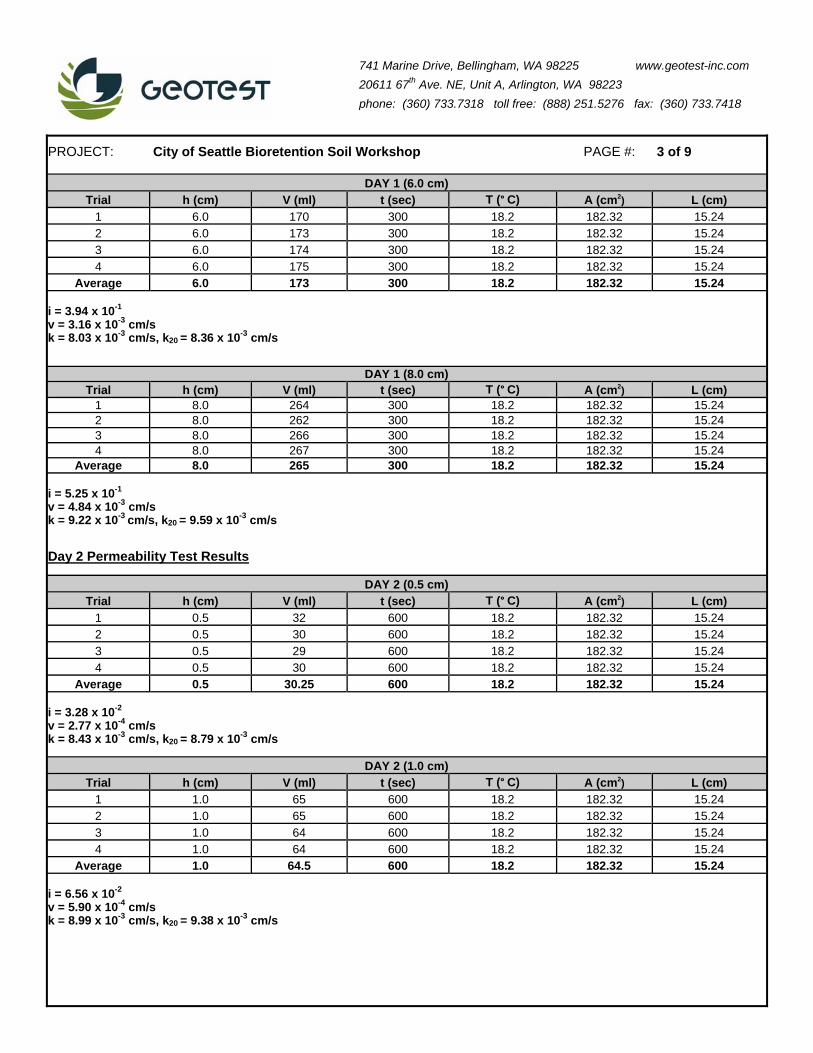
PROJECT: City of Seattle Bioretention Soil Workshop PAGE #: 3 of 9
DAY 1 (6.0 cm) Trial h (cm) V (ml) t (sec) T (° C) A (cm2) L (cm)
1 6.0 170 300 18.2 182.32 15.24 2 6.0 173 300 18.2 182.32 15.24 3 6.0 174 300 18.2 182.32 15.24 4 6.0 175 300 18.2 182.32 15.24
Average 6.0 173 300 18.2 182.32 15.24 i = 3.94 x 10⁻¹ v = 3.16 x 10⁻³ cm/s k = 8.03 x 10⁻³ cm/s, k20 = 8.36 x 10⁻³ cm/s
DAY 1 (8.0 cm)Trial h (cm) V (ml) t (sec) T (° C) A (cm2) L (cm)
1 8.0 264 300 18.2 182.32 15.24 2 8.0 262 300 18.2 182.32 15.24 3 8.0 266 300 18.2 182.32 15.24 4 8.0 267 300 18.2 182.32 15.24
Average 8.0 265 300 18.2 182.32 15.24 i = 5.25 x 10⁻¹ v = 4.84 x 10⁻³ cm/s k = 9.22 x 10⁻³ cm/s, k20 = 9.59 x 10⁻³ cm/s Day 2 Permeability Test Results
DAY 2 (0.5 cm) Trial h (cm) V (ml) t (sec) T (° C) A (cm2) L (cm)
1 0.5 32 600 18.2 182.32 15.24 2 0.5 30 600 18.2 182.32 15.24 3 0.5 29 600 18.2 182.32 15.24 4 0.5 30 600 18.2 182.32 15.24
Average 0.5 30.25 600 18.2 182.32 15.24 i = 3.28 x 10⁻² v = 2.77 x 10⁻⁴ cm/s k = 8.43 x 10⁻³ cm/s, k20 = 8.79 x 10⁻³ cm/s
DAY 2 (1.0 cm) Trial h (cm) V (ml) t (sec) T (° C) A (cm2) L (cm)
1 1.0 65 600 18.2 182.32 15.24 2 1.0 65 600 18.2 182.32 15.24 3 1.0 64 600 18.2 182.32 15.24 4 1.0 64 600 18.2 182.32 15.24
Average 1.0 64.5 600 18.2 182.32 15.24 i = 6.56 x 10⁻² v = 5.90 x 10⁻⁴ cm/s k = 8.99 x 10⁻³ cm/s, k20 = 9.38 x 10⁻³ cm/s

741 Marine Drive, Bellingham, WA 98225 www.geotest-inc.com 20611 67th Ave. NE, Unit A, Arlington, WA 98223 phone: (360) 733.7318 toll free: (888) 251.5276 fax: (360) 733.7418
PROJECT: City of Seattle Bioretention Soil Workshop PAGE #: 4 of 9
DAY 2 (1.5 cm) Trial h (cm) V (ml) t (sec) T (° C) A (cm2) L (cm)
1 1.5 100 600 18.2 182.32 15.24 2 1.5 100 600 18.2 182.32 15.24 3 1.5 100 600 18.2 182.32 15.24 4 1.5 100 600 18.2 182.32 15.24
Average 1.5 100 600 18.2 182.32 15.24 i = 9.84 x 10⁻² v = 9.14 x 10⁻⁴ cm/s k = 9.29 x 10⁻³ cm/s, k20 = 9.69 x 10⁻³ cm/s
DAY 2 (2.0 cm) Trial h (cm) V (ml) t (sec) T (° C) A (cm2) L (cm)
1 2.0 134 600 18.2 182.32 15.24 2 2.0 134 600 18.2 182.32 15.24 3 2.0 134 600 18.2 182.32 15.24 4 2.0 134 600 18.2 182.32 15.24
Average 2.0 134 600 18.2 182.32 15.24 i = 1.31 x 10⁻² v = 1.23 x 10⁻³ cm/s k = 9.33 x 10⁻³ cm/s, k20 = 9.74 x 10⁻³ cm/s
DAY 2 (3.0 cm) Trial h (cm) V (ml) t (sec) T (° C) A (cm2) L (cm)
1 3.0 106 300 18.2 182.32 15.24 2 3.0 106 300 18.2 182.32 15.24 3 3.0 105 300 18.2 182.32 15.24 4 3.0 155 300 18.2 182.32 15.24
Average 3.0 105.5 300 18.2 182.32 15.24 i = 1.97 x 10⁻² v = 1.93 x 10⁻³ cm/s k = 9.80 x 10⁻³ cm/s, k20 = 1.02 x 10⁻² cm/s
DAY 2 (4.0 cm) Trial h (cm) V (ml) t (sec) T (° C) A (cm2) L (cm)
1 4.0 144 300 18.2 182.32 15.24 2 4.0 144 300 18.2 182.32 15.24 3 4.0 144 300 18.2 182.32 15.24 4 4.0 144 300 18.2 182.32 15.24
Average 4.0 144 300 18.2 182.32 15.24 i = 2.62 x 10⁻¹ v = 2.63 x 10⁻³ cm/s k = 1.00 x 10⁻² cm/s, k20 = 1.05 x 10⁻² cm/s

741 Marine Drive, Bellingham, WA 98225 www.geotest-inc.com 20611 67th Ave. NE, Unit A, Arlington, WA 98223 phone: (360) 733.7318 toll free: (888) 251.5276 fax: (360) 733.7418
PROJECT: City of Seattle Bioretention Soil Workshop PAGE #: 5 of 9
DAY 2 (6.0 cm) Trial h (cm) V (ml) t (sec) T (° C) A (cm2) L (cm)
1 6.0 170 300 18.2 182.32 15.24 2 6.0 173 300 18.2 182.32 15.24 3 6.0 174 300 18.2 182.32 15.24 4 6.0 175 300 18.2 182.32 15.24
Average 6.0 173 300 18.2 182.32 15.24 i = 3.94 x 10⁻¹ v = 4.01 x 10⁻³ cm/s k = 1.04 x 10⁻² cm/s, k20 = 1.08 x 10⁻² cm/s
DAY 2 (8.0 cm) Trial h (cm) V (ml) t (sec) T (° C) A (cm2) L (cm)
1 8.0 312 300 18.2 182.32 15.24 2 8.0 312 300 18.2 182.32 15.24 3 8.0 312 300 18.2 182.32 15.24 4 8.0 312 300 18.2 182.32 15.24
Average 8.0 312 300 18.2 182.32 15.24 i = 5.23 x 10⁻¹ v = 5.70 x 10⁻³ cm/s k = 1.09 x 10⁻² cm/s, k20 = 1.13 x 10⁻² cm/s Day 3 Permeability Test Results
DAY 3 (0.5 cm) Trial h (cm) V (ml) t (sec) T (° C) A (cm2) L (cm)
1 0.5 43 600 18.2 182.32 15.24 2 0.5 43 600 18.2 182.32 15.24 3 0.5 42 600 18.2 182.32 15.24 4 0.5 43 600 18.2 182.32 15.24
Average 0.5 42.75 600 18.2 182.32 15.24 i = 3.28 x 10⁻² v = 3.91 x 10⁻⁴ cm/s k = 1.19 x 10⁻² cm/s, k20 = 1.24 x 10⁻² cm/s
DAY 3 (1.0 cm) Trial h (cm) V (ml) t (sec) T (° C) A (cm2) L (cm)
1 1.0 67 600 18.2 182.32 15.24 2 1.0 67 600 18.2 182.32 15.24 3 1.0 67 600 18.2 182.32 15.24 4 1.0 67 600 18.2 182.32 15.24
Average 1.0 67 600 18.2 182.32 15.24 i = 6.56 x 10⁻² v = 6.12 x 10⁻⁴ cm/s k = 9.33 x 10⁻³ cm/s, k20 = 9.74 x 10⁻³ cm/s

741 Marine Drive, Bellingham, WA 98225 www.geotest-inc.com 20611 67th Ave. NE, Unit A, Arlington, WA 98223 phone: (360) 733.7318 toll free: (888) 251.5276 fax: (360) 733.7418
PROJECT: City of Seattle Bioretention Soil Workshop PAGE #: 6 of 9 DAY 3 (1.5 cm)
Trial h (cm) V (ml) t (sec) T (° C) A (cm2) L (cm) 1 1.5 116 600 18.2 182.32 15.24 2 1.5 116 600 18.2 182.32 15.24 3 1.5 116 600 18.2 182.32 15.24 4 1.5 116 600 18.2 182.32 15.24
Average 1.5 116 600 18.2 182.32 15.24 i = 9.84 x 10⁻² v = 1.06 x 10⁻³ cm/s k = 1.08 x 10⁻² cm/s, k20 = 1.12 x 10⁻² cm/s
DAY 3 (2.0 cm) Trial h (cm) V (ml) t (sec) T (° C) A (cm2) L (cm)
1 2.0 85 300 18.2 182.32 15.24 2 2.0 85 300 18.2 182.32 15.24 3 2.0 85 300 18.2 182.32 15.24 4 2.0 85 300 18.2 182.32 15.24
Average 2.0 85 300 18.2 182.32 15.24 i = 1.31 x 10⁻¹ v = 1.55 x 10⁻³ cm/s k = 1.18 x 10⁻² cm/s, k20 = 1.24 x 10⁻² cm/s
DAY 3 (3.0 cm) Trial h (cm) V (ml) t (sec) T (° C) A (cm2) L (cm)
1 3.0 123 300 18.2 182.32 15.24 2 3.0 123 300 18.2 182.32 15.24 3 3.0 123 300 18.2 182.32 15.24 4 3.0 123 300 18.2 182.32 15.24
Average 3.0 123 300 18.2 182.32 15.24 i = 1.97 x 10⁻¹ v = 2.25 x 10⁻³ cm/s k = 1.14 x 10⁻² cm/s, k20 = 1.19 x 10⁻² cm/s
DAY 3 (4.0 cm) Trial h (cm) V (ml) t (sec) T (° C) A (cm2) L (cm)
1 4.0 165 300 18.2 182.32 15.24 2 4.0 165 300 18.2 182.32 15.24 3 4.0 165 300 18.2 182.32 15.24 4 4.0 165 300 18.2 182.32 15.24
Average 4.0 165 300 18.2 182.32 15.24 i = 2.62 x 10⁻¹ v = 3.02 x 10⁻³ cm/s k = 1.15 x 10⁻² cm/s, k20 = 1.20 x 10⁻² cm/s

741 Marine Drive, Bellingham, WA 98225 www.geotest-inc.com 20611 67th Ave. NE, Unit A, Arlington, WA 98223 phone: (360) 733.7318 toll free: (888) 251.5276 fax: (360) 733.7418
PROJECT: City of Seattle Bioretention Soil Workshop PAGE #: 7 of 9 DAY 3 (6.0 cm)
Trial h (cm) V (ml) t (sec) T (° C) A (cm2) L (cm) 1 6.0 251 300 18.2 182.32 15.24 2 6.0 251 300 18.2 182.32 15.24 3 6.0 251 300 18.2 182.32 15.24 4 6.0 251 300 18.2 182.32 15.24
Average 6.0 251 300 18.2 182.32 15.24 i = 3.94 x 10⁻¹ v = 4.59 x 10⁻³ cm/s k = 1.17 x 10⁻² cm/s, k20 = 1.22 x 10⁻² cm/s
DAY 3 (8.0 cm) Trial h (cm) V (ml) t (sec) T (° C) A (cm2) L (cm)
1 8.0 343 300 18.2 182.32 15.24 2 8.0 343 300 18.2 182.32 15.24 3 8.0 343 300 18.2 182.32 15.24 4 8.0 343 300 18.2 182.32 15.24
Average 8.0 343 300 18.2 182.32 15.24 i = 5.25 x 10⁻¹ v = 6.27 x 10⁻³ cm/s k = 1.19 x 10⁻² cm/s, k20 = 1.27 x 10⁻² cm/s Day 4 Permeability Test Results
DAY 4 (0.5 cm) Trial h (cm) V (ml) t (sec) T (° C) A (cm2) L (cm)
1 0.5 62 600 17.8 182.32 15.24 2 0.5 62 600 17.8 182.32 15.24 3 0.5 62 600 17.8 182.32 15.24 4 0.5 63 600 17.8 182.32 15.24
Average 0.5 62.25 600 17.8 182.32 15.24 i = 3.28 x 10⁻² v = 5.69 x 10⁻⁴ cm/s k = 1.73 x 10⁻² cm/s, k20 = 1.83 x 10⁻² cm/s
DAY 4 (1.0 cm) Trial h (cm) V (ml) t (sec) T (° C) A (cm2) L (cm)
1 1.0 103 600 17.8 182.32 15.24 2 1.0 104 600 17.8 182.32 15.24 3 1.0 104 600 17.8 182.32 15.24 4 1.0 104 600 17.8 182.32 15.24
Average 1.0 103.75 600 17.8 182.32 15.24 i = 6.56 x 10⁻² v = 9.48 x 10⁻⁴ cm/s k = 1.45 x 10⁻² cm/s, k20 = 1.52 x 10⁻² cm/s

741 Marine Drive, Bellingham, WA 98225 www.geotest-inc.com 20611 67th Ave. NE, Unit A, Arlington, WA 98223 phone: (360) 733.7318 toll free: (888) 251.5276 fax: (360) 733.7418
PROJECT: City of Seattle Bioretention Soil Workshop PAGE #: 8 of 9 DAY 4 (1.5 cm)
Trial h (cm) V (ml) t (sec) T (° C) A (cm2) L (cm) 1 1.5 162 600 19.1 182.32 15.24 2 1.5 163 600 19.1 182.32 15.24 3 1.5 162 600 19.1 182.32 15.24 4 1.5 162 600 19.1 182.32 15.24
Average 1.5 162 600 19.1 182.32 15.24 i = 9.48 x 10⁻² v = 1.48 x 10⁻³ cm/s k = 1.51 x 10⁻² cm/s, k20 = 1.54 x 10⁻² cm/s
DAY 4 (2.0 cm) Trial h (cm) V (ml) t (sec) T (° C) A (cm2) L (cm)
1 2.0 203 600 19.1 182.32 15.24 2 2.0 202 600 19.1 182.32 15.24 3 2.0 202 600 19.1 182.32 15.24 4 2.0 203 600 19.1 182.32 15.24
Average 2.0 202.5 600 19.1 182.32 15.24 i = 1.31 x 10⁻¹ v = 1.85 x 10⁻³ cm/s k = 1.41 x 10⁻² cm/s, k20 = 1.44 x 10⁻² cm/s
DAY 4 (3.0 cm) Trial h (cm) V (ml) t (sec) T (° C) A (cm2) L (cm)
1 3.0 157 300 19.1 182.32 15.24 2 3.0 157 300 19.1 182.32 15.24 3 3.0 158 300 19.1 182.32 15.24 4 3.0 157 300 19.1 182.32 15.24
Average 3.0 157.25 300 19.1 182.32 15.24 i = 1.97 x 10⁻¹ v = 2.88 x 10⁻³ cm/s k = 1.46 x 10⁻² cm/s, k20 = 1.49 x 10⁻² cm/s
DAY 4 (4.0 cm) Trial h (cm) V (ml) t (sec) T (° C) A (cm2) L (cm)
1 4.0 208 300 19.2 182.32 15.24 2 4.0 207 300 19.2 182.32 15.24 3 4.0 206 300 19.2 182.32 15.24 4 4.0 209 300 19.2 182.32 15.24
Average 4.0 207.5 300 19.2 182.32 15.24 i = 2.62 x 10⁻¹ v = 3.79 x 10⁻³ cm/s k = 1.45 x 10⁻² cm/s, k20 = 1.47 x 10⁻² cm/s

741 Marine Drive, Bellingham, WA 98225 www.geotest-inc.com 20611 67th Ave. NE, Unit A, Arlington, WA 98223 phone: (360) 733.7318 toll free: (888) 251.5276 fax: (360) 733.7418
PROJECT: City of Seattle Bioretention Soil Workshop PAGE #: 9 of 9 DAY 4 (6.0 cm)
Trial h (cm) V (ml) t (sec) T (° C) A (cm2) L (cm) 1 6.0 316 300 19.2 182.32 15.24 2 6.0 320 300 19.2 182.32 15.24 3 6.0 320 300 19.2 182.32 15.24 4 6.0 318 300 19.2 182.32 15.24
Average 6.0 318.5 300 19.2 182.32 15.24 i = 3.94 x 10⁻¹ v = 5.82 x 10⁻³ cm/s k = 1.48 x 10⁻² cm/s, k20 = 1.51 x 10⁻² cm/s
DAY 4 (8.0 cm) Trial h (cm) V (ml) t (sec) T (° C) A (cm2) L (cm)
1 8.0 420 300 19.2 182.32 15.24 2 8.0 421 300 19.2 182.32 15.24 3 8.0 417 300 19.2 182.32 15.24 4 8.0 419 300 19.2 182.32 15.24
Average 8.0 419.25 300 19.2 182.32 15.24 i = 5.25 x 10⁻¹ v = 7.67 x 10⁻³ cm/s k = 1.46 x 10⁻² cm/s, k20 = 1.49 x 10⁻² cm/s
DAY 4 (16.0 cm) Trial h (cm) V (ml) t (sec) T (° C) A (cm2) L (cm)
1 16.0 176 60 19.2 182.32 15.24 2 16.0 175 60 19.2 182.32 15.24 3 16.0 172 60 19.2 182.32 15.24 4 16.0 174 60 19.2 182.32 15.24
Average 16.0 174.25 60 19.2 182.32 15.24 i = 1.05 v = 57.0 cm/s k = 1.52 x 10⁻² cm/s, k20 = 1.55 x 10⁻² cm/s
DAY 4 (32.0 cm) Trial h (cm) V (ml) t (sec) T (° C) A (cm2) L (cm)
1 32.0 173 30 19.2 182.32 15.24 2 32.0 177 30 19.2 182.32 15.24 3 32.0 178 30 19.2 182.32 15.24 4 32.0 177 30 19.2 182.32 15.24
Average 32.0 176.25 30 19.2 182.32 15.24 i = 2.10 v = 29.0 k = 1.53 x 10⁻² cm/s, k20 = 1.57 x 10⁻² cm/s
Test Reference: ASTM D2434
Reviewed by


PERMEABILITY TEST ON GRANULAR SOILCONSTANT HEAD (6" MOLD)
ASTM D 2434
Project: City of Seattle Biosoils Permeability Rate Testing WorkshopJob No: 21-1-63100-004 MC Before Test= 14.2%Sample: Bioretention Soil Initial Dry Density= 95.6 pcfTest By: AKV 8/1/2011 Final Dry Density= 95.0 pcf
Comp By: AKV 8/8/2011 Maximum Dry Density= 113 pcfCheck By: JFL 8/9/2011 Percent Compaction= 85.0%
Fines Washout= 18.8 gWashout= 0.59%
Sample Classification:Bioretention Soil
Remarks:*Bioretention soil held near Optimum Moisture Content (OMC) for 3.7 months prior to testing.
*Day 1- Began after 19hr, 50min soak time.
*Day 2- Unable to achieve flow at 0.5cm of head difference across the specimen.
*Day 3- Unable to achieve flow at 0.5cm and1.0 cm of head
Sample compacted by hand in five lifts of equal mass and equal height with 2" round tamper to 85% Maximum Dry Density at OMC (+/- 0.5%).
Mold Diameter = 5.98inMold Height = 4.50in
Testing confined, with rigid upper and lower porous plate but without spring.
h H t Qh1 (cm) h2 (cm) (cm) (cm) (s) (cm3) I Q/at k (in/hr) k (cm/s)
Day 1-1 47.0 46.2 0.8 0.5 3571 145.0 0.04 2.2E-04 7.3 0.0051 Day 1-2 46.2 45.2 1.0 1.0 2397 181.2 0.09 4.2E-04 6.8 0.0048 Day 1-3 45.2 44.0 1.2 1.5 2134 217.5 0.13 5.6E-04 6.1 0.0043
Day-Increment
Reservoir Level
difference across the specimen.
*Day 4- Unable to achieve flow on second day at 0.5cm, 1.0cm, 1.5cm, 2.0cm, and 3.0cm of head difference across the specimen. Maximum 48.0cm of head difference because of equipment limitations.
No hydro-compaction observed.
y Day 1-4 44.0 43.0 1.0 2.0 1320 181.2 0.18 7.6E-04 6.1 0.0043 Day 1-5 43.0 40.6 2.4 3.0 2176 434.9 0.26 1.1E-03 6.0 0.0042 Day 1-6 40.6 37.0 3.6 4.0 2475 652.4 0.35 1.5E-03 5.9 0.0042 Day 1-7 37.0 34.7 2.3 6.0 1046 416.8 0.53 2.2E-03 5.9 0.0042 Day 1-8 34.6 31.2 3.4 8.0 1192 616.1 0.70 2.9E-03 5.8 0.0041 Day 2-1 49.9 49.4 0.5 1.0 4810 90.6 0.09 1.0E-04 1.7 0.0012 Day 2-2 49.4 48.4 1.0 1.5 2097 181.2 0.13 4.8E-04 5.1 0.0036 Day 2-3 48.3 46.1 2.2 2.0 3388 398.7 0.18 6.5E-04 5.3 0.0037 Day 2-4 46.0 42.5 3.5 3.0 3479 634.3 0.26 1.0E-03 5.4 0.0038 Day 2-5 42.5 37.9 4.6 4.0 3437 833.6 0.35 1.3E-03 5.4 0.0038 Day 2-6 37.7 33.5 4.2 6.0 1980 761.1 0.53 2.1E-03 5.7 0.0040 Day 2-7 31.5 21.5 10.0 8.0 3682 1812.2 0.70 2.7E-03 5.5 0.0039Day 3-1 51.8 48.8 3.0 1.5 6430 543.7 0.13 4.7E-04 5.0 0.0036Day 3-2 48.7 46.2 2.5 2.0 3763 453.0 0.18 6.6E-04 5.4 0.0038Day 3-3 46.3 42.5 3.8 3.0 4002 688.6 0.26 9.5E-04 5.1 0.0036Day 3-4 42.4 38.3 4.1 4.0 3209 743.0 0.35 1.3E-03 5.2 0.0036Day 3-5 38.2 33.0 5.2 6.0 2659 942.3 0.53 2.0E-03 5.3 0.0037Day 3-6 32.9 28.6 4.3 8.0 1604 779.2 0.70 2.7E-03 5.4 0.0038Day 4-1 42.8 38.1 4.7 4.0 3712 851.7 0.35 1.3E-03 5.1 0.0036Day 4-2 38.0 30.4 7.6 6.0 4045 1377.3 0.53 1.9E-03 5.1 0.0036Day 4-3 30.3 14.8 15.5 8.0 6227 2808.9 0.70 2.5E-03 5.0 0.0036Day 4-4 53.8 48.0 5.8 16.0 1012 1051.1 1.40 5.7E-03 5.8 0.0041Day 4-5 47.8 43.2 4.6 32.0 386 833.6 2.80 1.2E-02 6.0 0.0043Day 4-6 53.1 46.6 6.5 48.0 370 1177.9 4.20 1.8E-02 5.9 0.0042
Average k 5.5 0.0039
h1 : Initial reservoir water levelh2 : Final reservoir water levelh : Change in reservoir water level during testH : Head difference across the speciment : Elapsed time for changing water level
Q : Volume of water dischargedI : Hydraulic gradient (Head/Height)
a : Cross-section area of the specimena : pk : Hydraulic conductivity of the specimen

City of Seattle Biosoils Permeability Rate Testing WorkshopBioretention Soil21-1-63100-004
8/9/2011
1.0
10.0
0.0 0.5 1.0 1.5 2.0 2.5 3.0 3.5 4.0 4.5
Hyd
raul
ic C
ondu
ctiv
ity (i
n/hr
)
Gradient
Hydraulic Conductivity vs. Gradient
Day 1 Day 2 Day 3 Day 4
Darcy Velocity vs. Gradient
0.0E+00
2.0E-03
4.0E-03
6.0E-03
8.0E-03
1.0E-02
1.2E-02
1.4E-02
1.6E-02
1.8E-02
2.0E-02
0.0 0.5 1.0 1.5 2.0 2.5 3.0 3.5 4.0 4.5
Dar
cy V
eloc
ity (c
m/s
ec)
Gradient
Darcy Velocity vs. Gradient
Day 1 Day 2 Day 3 Day 4
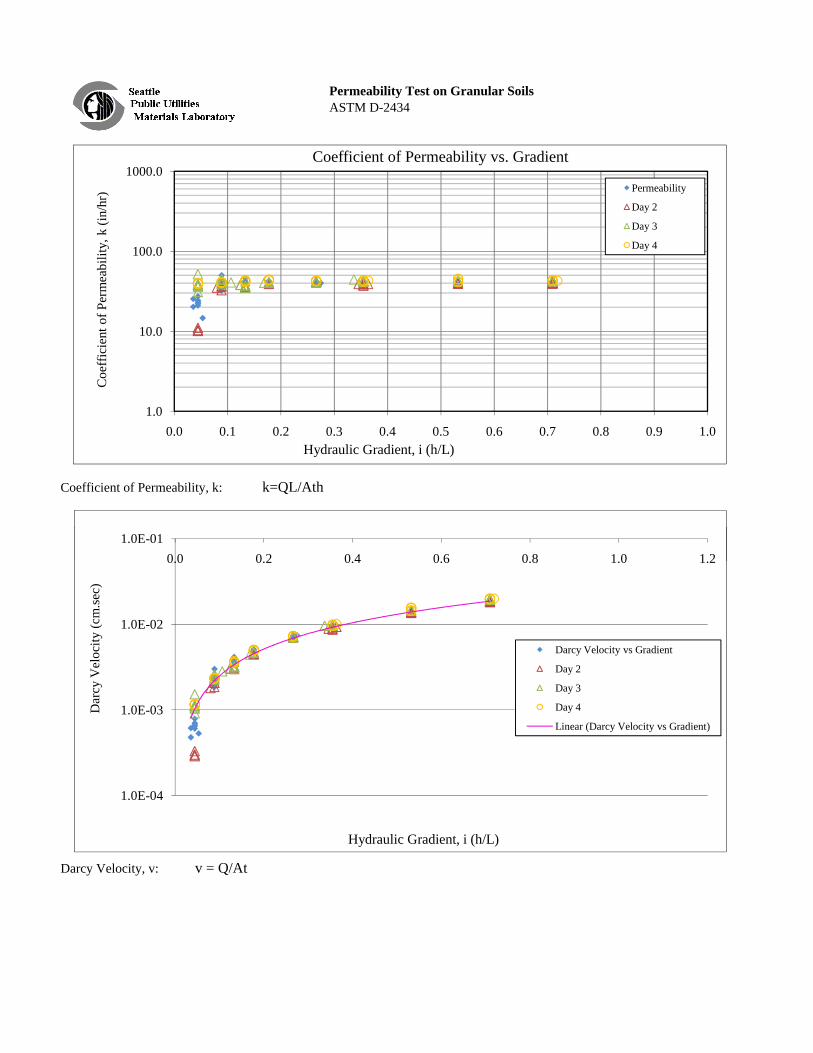
Permeability Test on Granular SoilsASTM D-2434
Coefficient of Permeability, k: k=QL/Ath
1.0
10.0
100.0
1000.0
0.0 0.1 0.2 0.3 0.4 0.5 0.6 0.7 0.8 0.9 1.0
Coe
ffici
ent o
f Per
mea
bilit
y, k
(in/
hr)
Hydraulic Gradient, i (h/L)
Coefficient of Permeability vs. Gradient
Permeability
Day 2
Day 3
Day 4
1.0E-010 0 0 2 0 4 0 6 0 8 1 0 1 2
Darcy Velocity, v: v = Q/At
1.0E-04
1.0E-03
1.0E-02
1.0E-010.0 0.2 0.4 0.6 0.8 1.0 1.2
Dar
cy V
eloc
ity (c
m.se
c)
Hydraulic Gradient, i (h/L)
Darcy Velocity vs Gradient
Day 2
Day 3
Day 4
Linear (Darcy Velocity vs Gradient)

Permeability Test on Granular SoilsASTM D-2434
Project Name : Tested By : CAN Date : 6/6/2011Project No. : Checked By : Date :Location : Test # Que: 104 Depth (ft) :Description : Poorly graded sand (SP), 4.7% organic materialComments:
DAY 1 DAY 336.02 40.77 in/hr
Area of permeameter cm2 (constant) (A): 102.56Volume of Sample Pre-Test cm3 (V1): 1695.42Volume of Sample Post-Consolidation cm3 (V2): 1686.73Volume of Sample Post-Test cm3 (V3): 1684.59
Air Dried WET Wt. + Tare (g) : Wt. retained on 3/4-in. sieve (g)Tare No. ______ (g) : Wt. remaining (g) :Air Dried DRY Wt. + Tare (g) : Wt. remaining Oven Dried (g) :
0 Percent oversize:Total Sample Air Dried Wt. (g) : 0Moisture Content Air Dried (g) : #DIV/0!
Air Dried Wt. + Tare (g) : Wt. remaining in pan + Tare (g):Oven Dried Wt. + Tare (g): Wt. remaining in pan (W2) (g): 0T N ( ) T t l S l (W ( ) 0
Total Sample (W1)
Pg 1 of 2
ASTM 2434 Workshop
Cedar Grove Compost
Supposed to run at 85% MDD, calculated pre-test: 86.3%Average k
(in/hr) = 38.66
N400102 U07 MG4
Wt. H2O (g):
DAY 2 DAY 435.72 42.13
Hygroscopic Moisture Content
Sieved Test Sample (Minus 3/4-in.)
Permeameter Test Sample (Minus 3/4-in.)
S:\City of Seattle\SPU On-Call Environmental Contract\Biosoils Testing Workshop WA 4\Lab Results\SPU\SPU Permeameter_Test_Aspect_Wkshp
Tare No. ______ (g) : Total Sample (W1) (g) 00.00 Test Sample Net Wt. (W1-W2) (g): 00.00
Hygroscopic Moisture (%) : #DIV/0!
Height of sample Pre-Test, H1-H2 (cm): 16.53 dist. between top of top plate and top of bottom porous stone
Volume of sample, V2 (cm3): 1695.42 (area*H2)
Dry Unit Weight, W (lb/ft3) : (Bulk Density) 95.76 (net wt/volume) converted from g/cm3
Relative Density, RD (as placed): 86.3%16.45
Dry Unit Weight, W (lb/ft3) : (Bulk Density) 95.93 (net wt/volume) converted from g/cm3
86.4%Height of sample Post-Test, H1-H2-(H2-H4) (cm): 16.43
Permeameter Test Specimen (after compaction & consolidation)
Wt. H2O (g):
Height of sample Post-Consolidation, H1-H2-(H2-H3)(cm):
Permeameter Test Specimen (after test)
Relative Density, RD (as placed):
Wt. Dried Soil (g):
S:\City of Seattle\SPU On-Call Environmental Contract\Biosoils Testing Workshop WA 4\Lab Results\SPU\SPU Permeameter_Test_Aspect_Wkshp
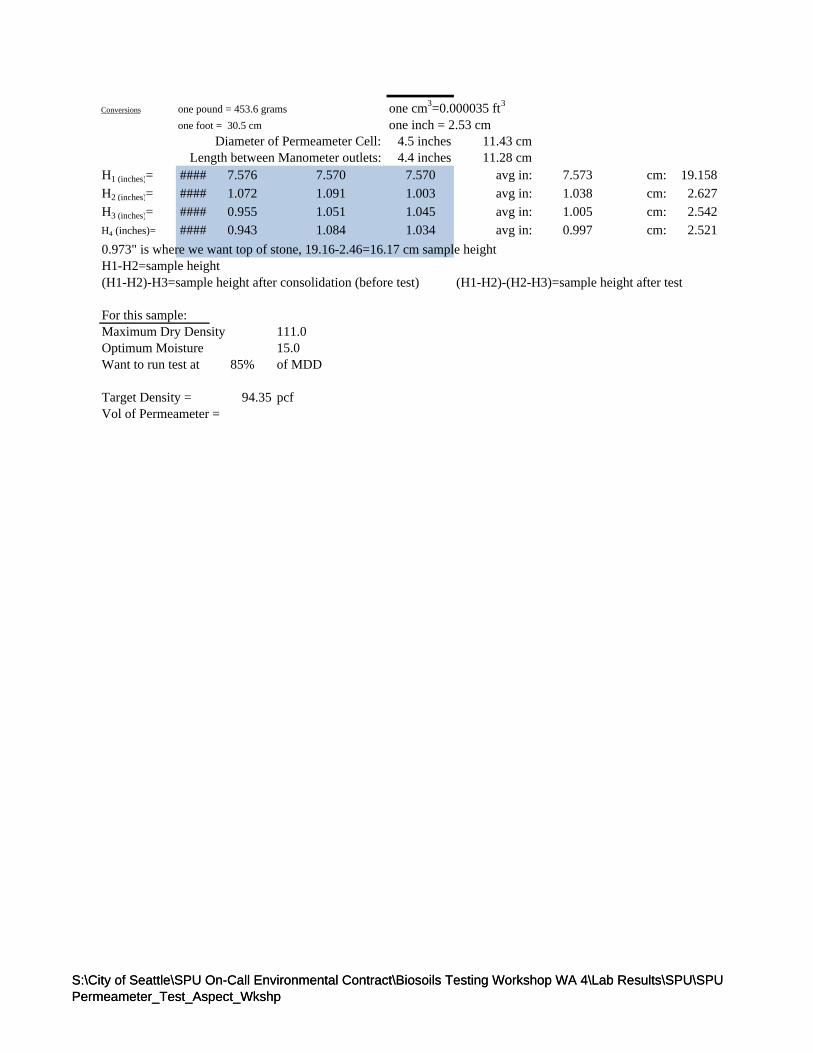
Conversions one pound = 453.6 grams one cm3=0.000035 ft3
one foot = 30.5 cm one inch = 2.53 cm4.5 inches 11.43 cm4.4 inches 11.28 cm
H1 (inches)= #### 7.576 7.570 7.570 avg in: 7.573 cm: 19.158H2 (inches)= #### 1.072 1.091 1.003 avg in: 1.038 cm: 2.627H3 (inches)= #### 0.955 1.051 1.045 avg in: 1.005 cm: 2.542H4 (inches)= #### 0.943 1.084 1.034 avg in: 0.997 cm: 2.5210.973" is where we want top of stone, 19.16-2.46=16.17 cm sample heightH1-H2=sample height(H1-H2)-H3=sample height after consolidation (before test) (H1-H2)-(H2-H3)=sample height after test
For this sample:Maximum Dry Density 111.0Optimum Moisture 15.0Want to run test at 85% of MDD
Target Density = 94.35 pcfVol of Permeameter =
Diameter of Permeameter Cell: Length between Manometer outlets:
S:\City of Seattle\SPU On-Call Environmental Contract\Biosoils Testing Workshop WA 4\Lab Results\SPU\SPU Permeameter_Test_Aspect_WkshpS:\City of Seattle\SPU On-Call Environmental Contract\Biosoils Testing Workshop WA 4\Lab Results\SPU\SPU Permeameter_Test_Aspect_Wkshp

APPENDIX E
Recommended Modifications for Permeability Testing of Bioretention Soils

Recommended Modifications for Permeability Testing of Bioretention Soils Aspect Consulting, LLC
August 22, 2011
Proctor method ASTM D1557 Method C (6-inch mold) shall be used to determine maximum dry density values for compaction of bioretention soil sample. Sample preparation for the Proctor test shall be amended in the following ways:
1) Maximum grainsize within the sample shall be no more than ½ inches in size. 2) Snip larger organic particles (if present) into ½ inch long pieces. 3) When adding water to the sample during the Proctor test, allow the sample to pre-soak for at
least 48 hours to allow the organics to fully saturate before compacting the sample. This pre-soak ensures the organics have been fully saturated at the time of the test.
ASTM D2434 shall be used and amended in the following ways:
1) Apparatus: a. 6-inch mold size shall be used for the test. b. If using porous stone disks for the testing, the permeability of the stone disk shall be
measured before and after the soil tests to ensure clogging or decreased permeability has not occurred during testing.
c. Use the confined testing method, with 5- to 10-pound force spring d. Use de-aired water.
2) Sample: a. Maximum grainsize within the sample shall not be more than ½ inches in size. b. Snip larger organic particles (if present) into ½-inch long pieces. c. Pre-soak the sample for at least 48 hours prior to loading it into the mold. During the
pre-soak, the moisture content shall be higher than optimum moisture but less than full saturation (i.e., there shall be no free water). This pre-soak ensures the organics have been fully saturated at the time of the test.
3) Preparation of Sample: a. Place soil in cylinder via a scoop. b. Place soil in 1-inch lifts and compact using a 2-inch-diameter round tamper. Pre-weigh
how much soil is necessary to fill 1-inch lift at 85% of maximum dry density, then tamp to 1-inch thickness. Once mold is full, verify that density is at 85% of maximum dry density (+ or – 0.5%). Apply vacuum (20 inches Hg) for 15 minutes before inundation.
c. Inundate sample slowly under a vacuum of 20 inches Hg over a period of 60 to 75 minutes.
d. Slowly remove vacuum (> 15 seconds). e. Sample shall be soaked in the mold for 24 to 72 hours before starting test.
4) Procedure: a. The permeability test shall be conducted over a range of hydraulic gradients between
0.1 and 2. b. Steady state flow rates shall be documented for four consecutive measurements before
increasing the head. c. The permeability test shall be completed within one day (one-day test duration).