earthquake shakes twitter users
DESCRIPTION
Earthquake shakes twitter usersTRANSCRIPT
Earthquake Shakes Twitter Users:Analyzing Tweets For Real-Time Event Detection Presented By: Eshan Mudwel 1SI10CS031
What is Twitter?
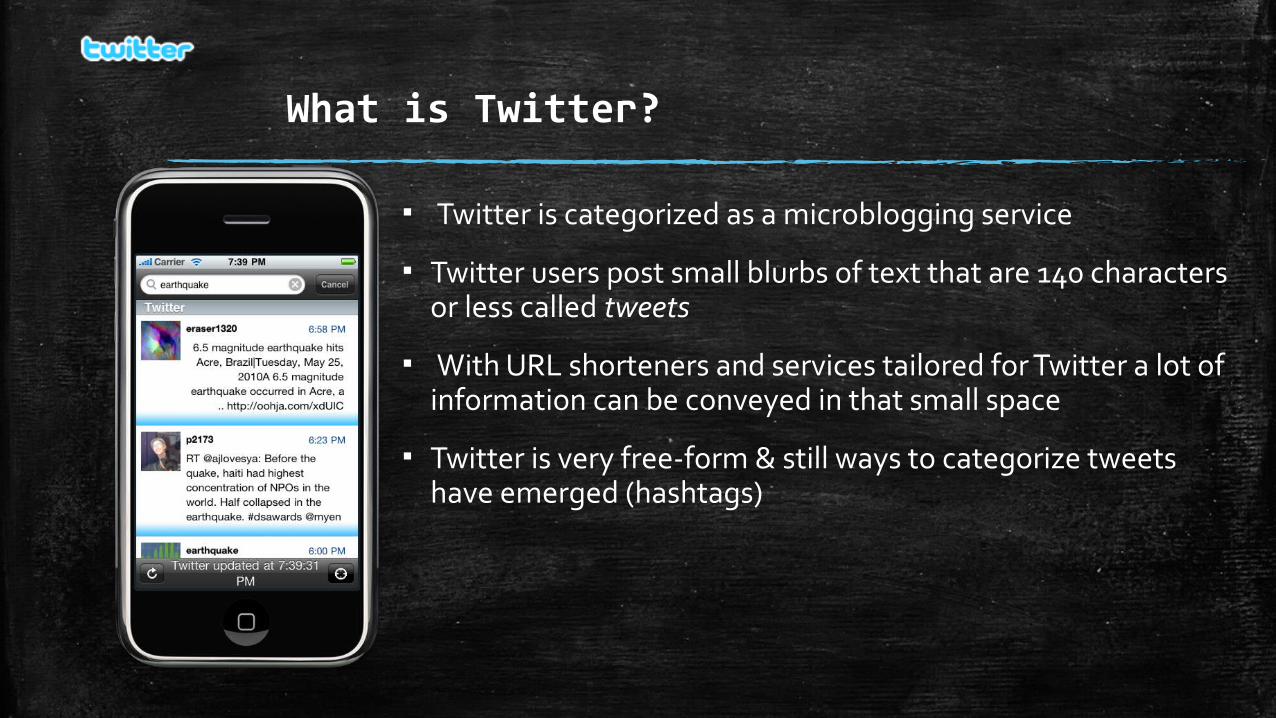
▪ Twitter is categorized as a microblogging service
▪ Twitter users post small blurbs of text that are 140 characters or less called tweets
▪ With URL shorteners and services tailored for Twitter a lot of information can be conveyed in that small space
▪ Twitter is very free-form & still ways to categorize tweets have emerged (hashtags)
How is Twitter useful as a sensor?
▪ Twitter users will often report their status, however relevant or irrelevant, to the interest of others
▪ This means that the public timeline is full of noise
▪ The timeline is updated in real-time, faster than a blog, faster than a “static” document
▪ Tweets are faster than traditional news & users select from a buffet of other users to customize their news
▪ However, if the tweets are carefully selected there can be a great deal of useful information found
▪ Tweets contain a great deal of metadata
Real-time Nature of Microblogging
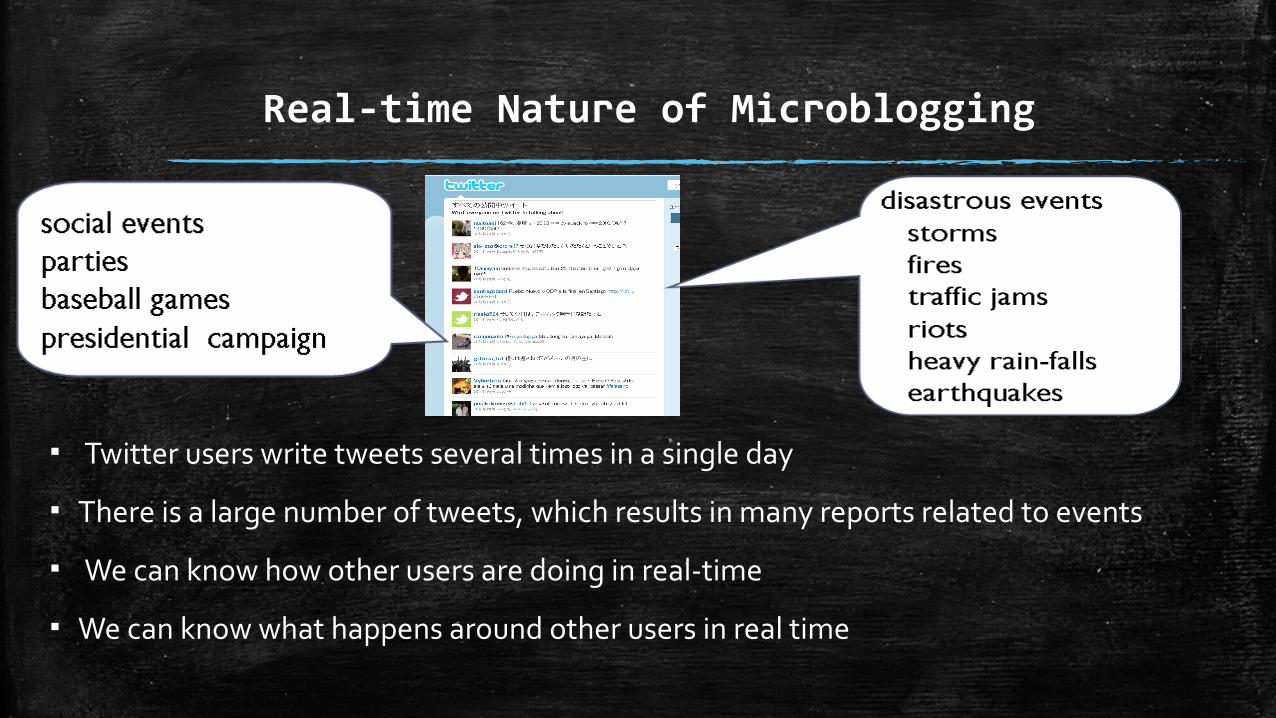
▪ Twitter users write tweets several times in a single day
▪ There is a large number of tweets, which results in many reports related to events
▪ We can know how other users are doing in real-time
▪ We can know what happens around other users in real time
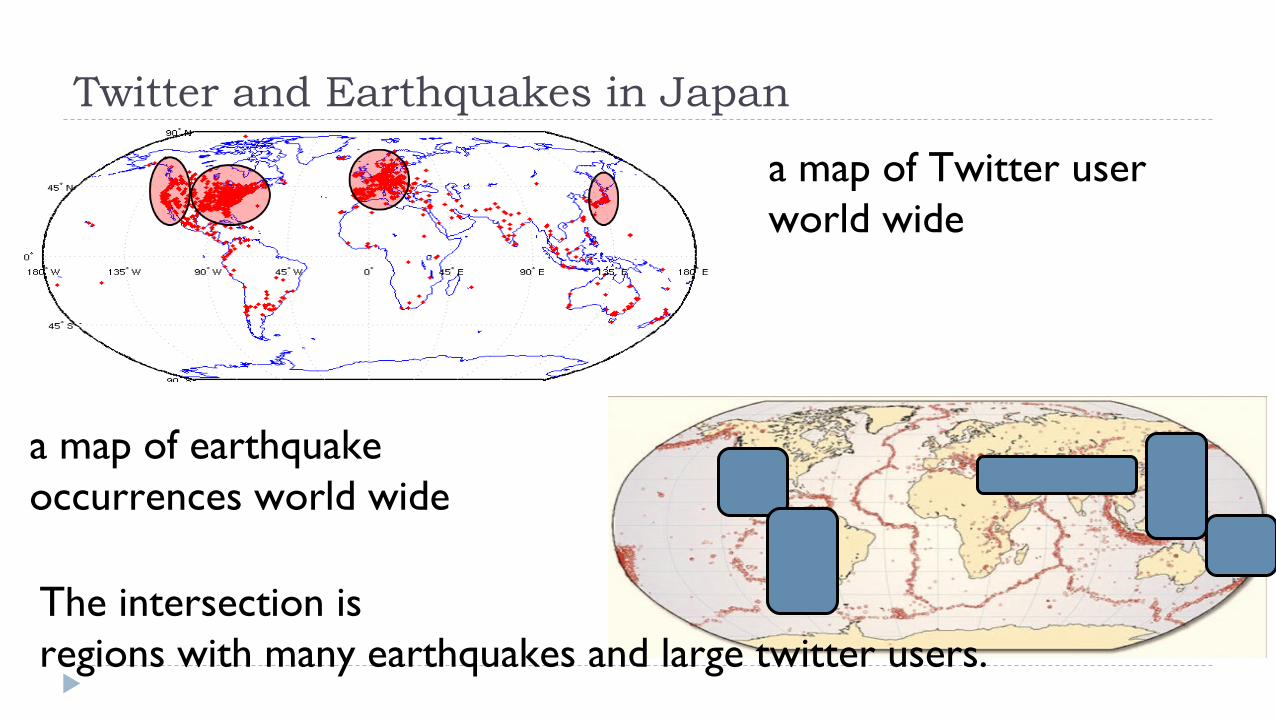
Twitter and Earthquakes in Japan
a map of earthquake occurrences world wide
a map of Twitter user world wide
The intersection is regions with many earthquakes and large twitter users.
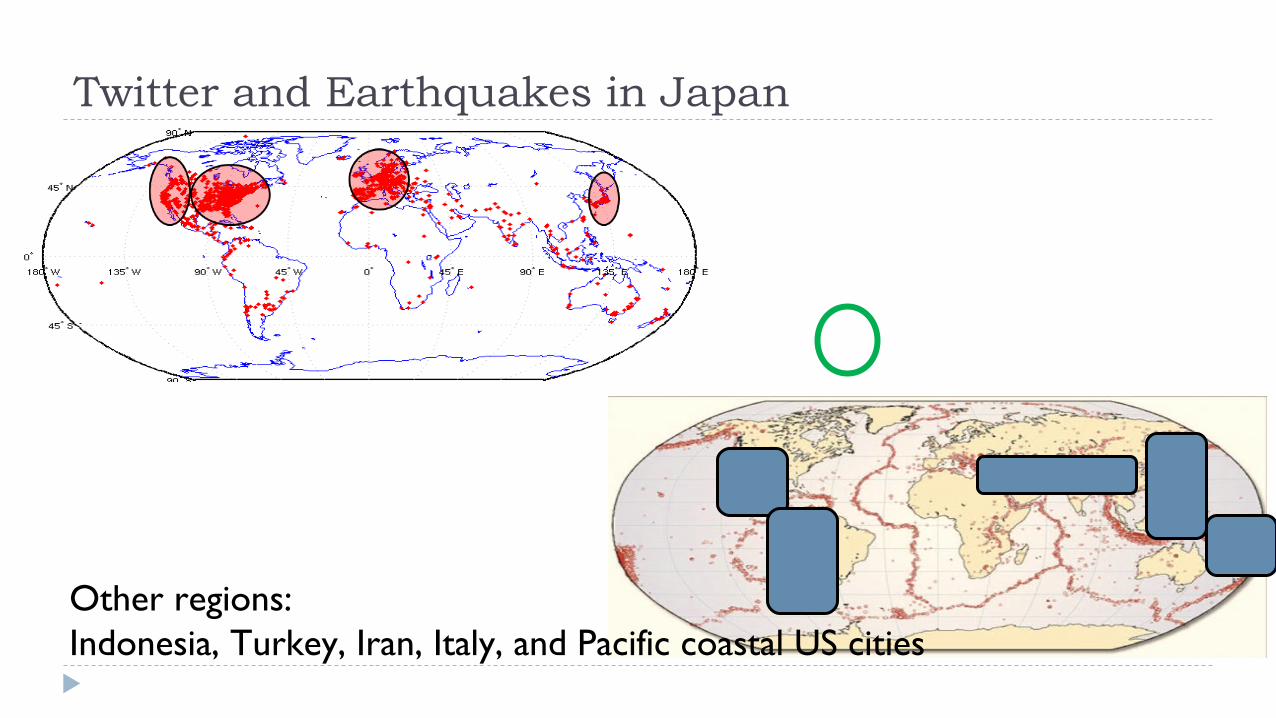
Twitter and Earthquakes in Japan
Other regions: Indonesia, Turkey, Iran, Italy, and Pacific coastal US cities
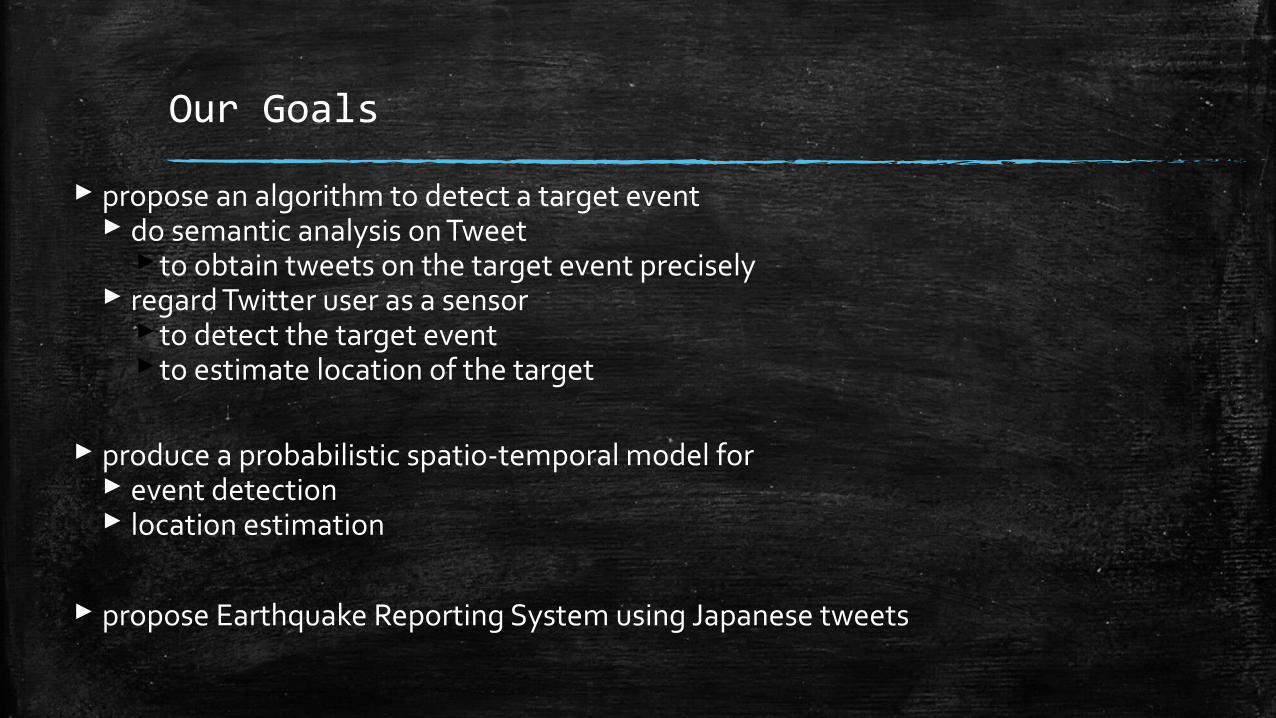
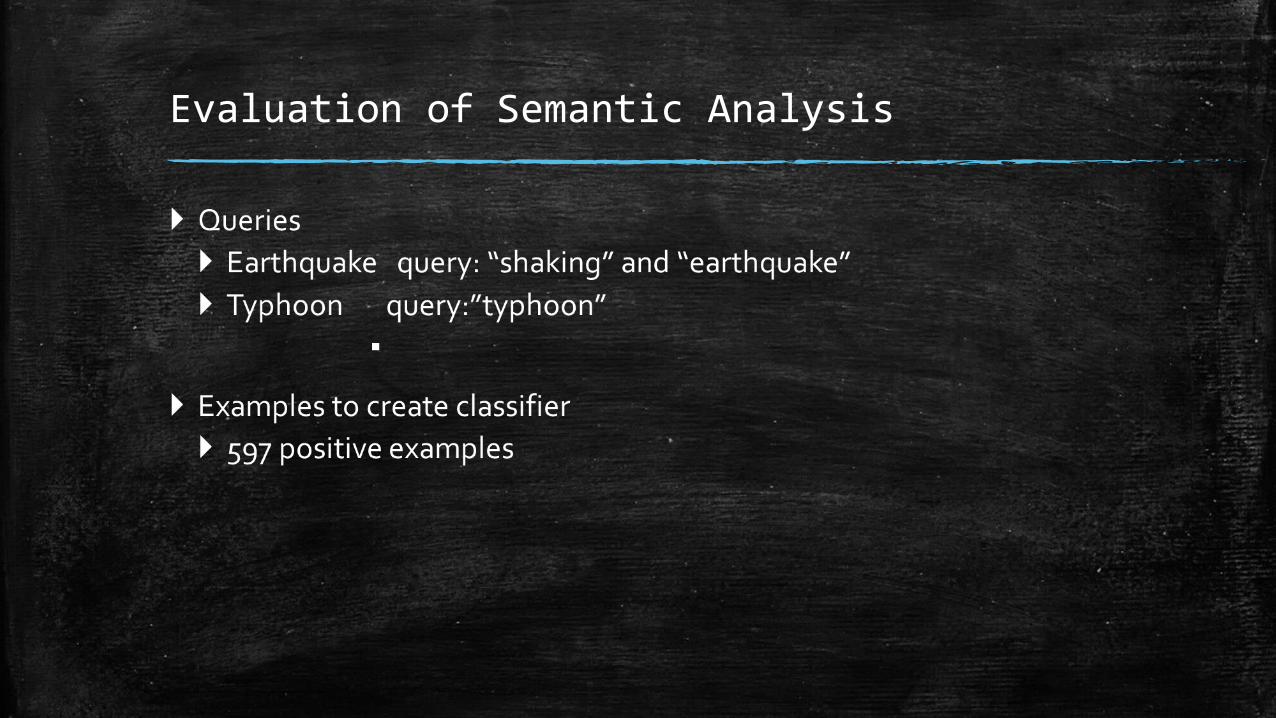
Our Goals
propose an algorithm to detect a target event do semantic analysis on Tweet
to obtain tweets on the target event precisely regard Twitter user as a sensor
to detect the target eventto estimate location of the target
produce a probabilistic spatio-temporal model for event detection location estimation
propose Earthquake Reporting System using Japanese tweets
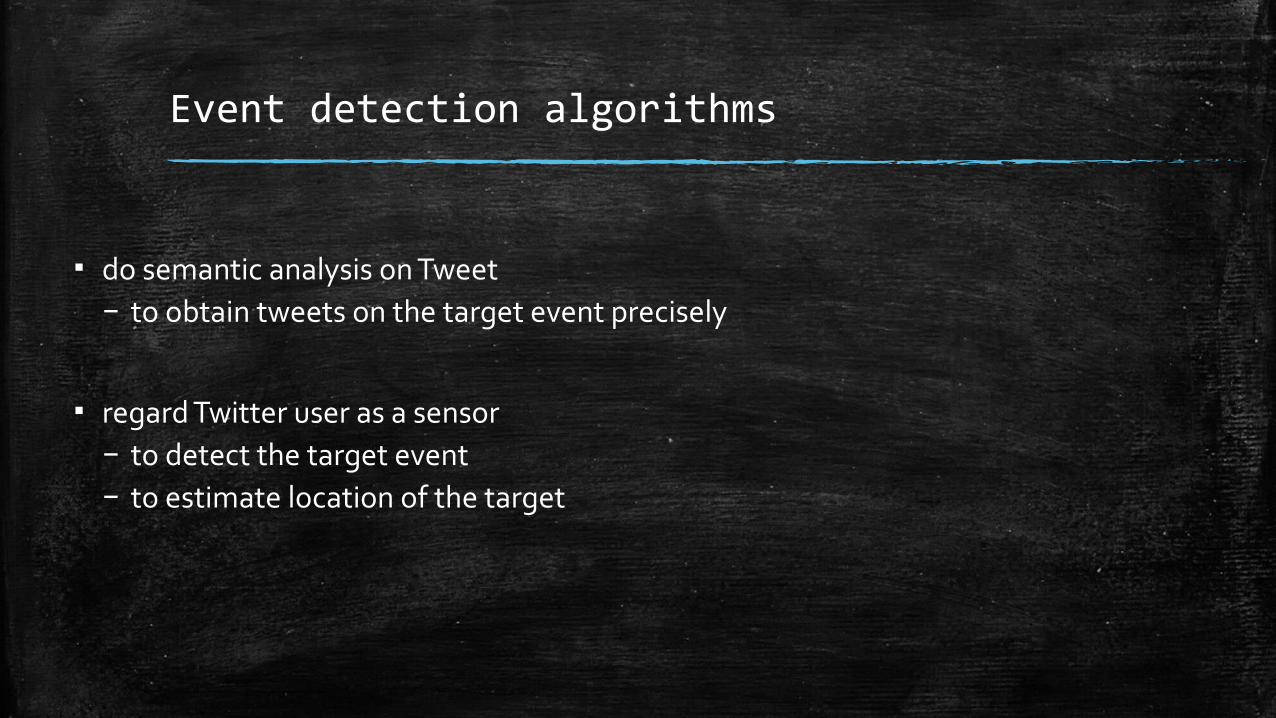
Event detection algorithms
▪ do semantic analysis on Tweet – to obtain tweets on the target event precisely
▪ regard Twitter user as a sensor– to detect the target event– to estimate location of the target
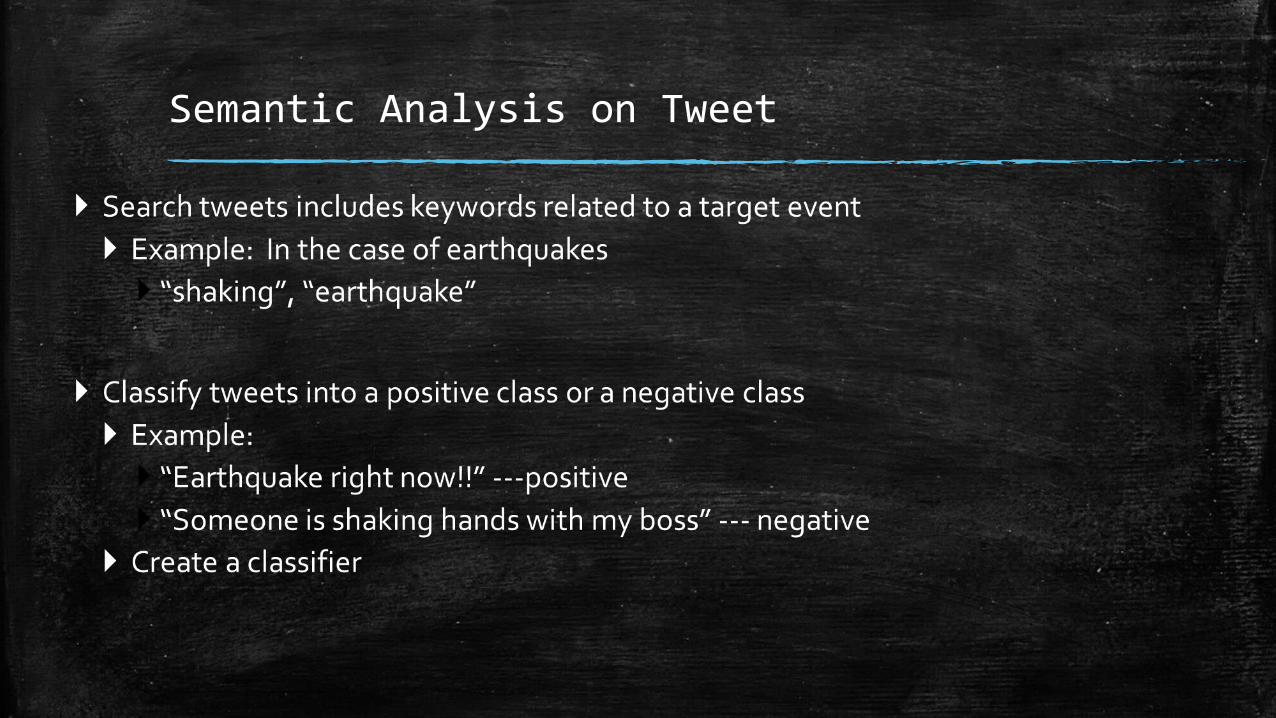
Semantic Analysis on Tweet
Semantic Analysis on Tweet
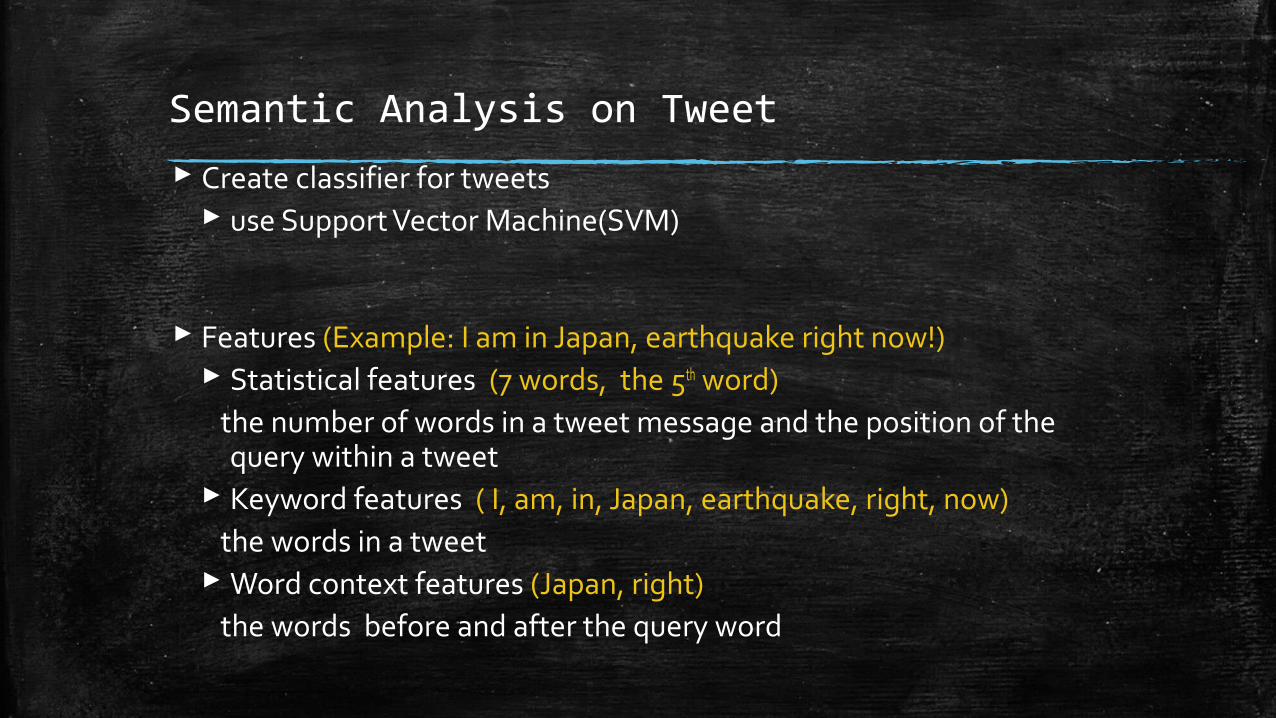
Create classifier for tweets use Support Vector Machine(SVM)
Features (Example: I am in Japan, earthquake right now!) Statistical features (7 words, the 5th word) the number of words in a tweet message and the position of the
query within a tweet Keyword features ( I, am, in, Japan, earthquake, right, now) the words in a tweet Word context features (Japan, right) the words before and after the query word
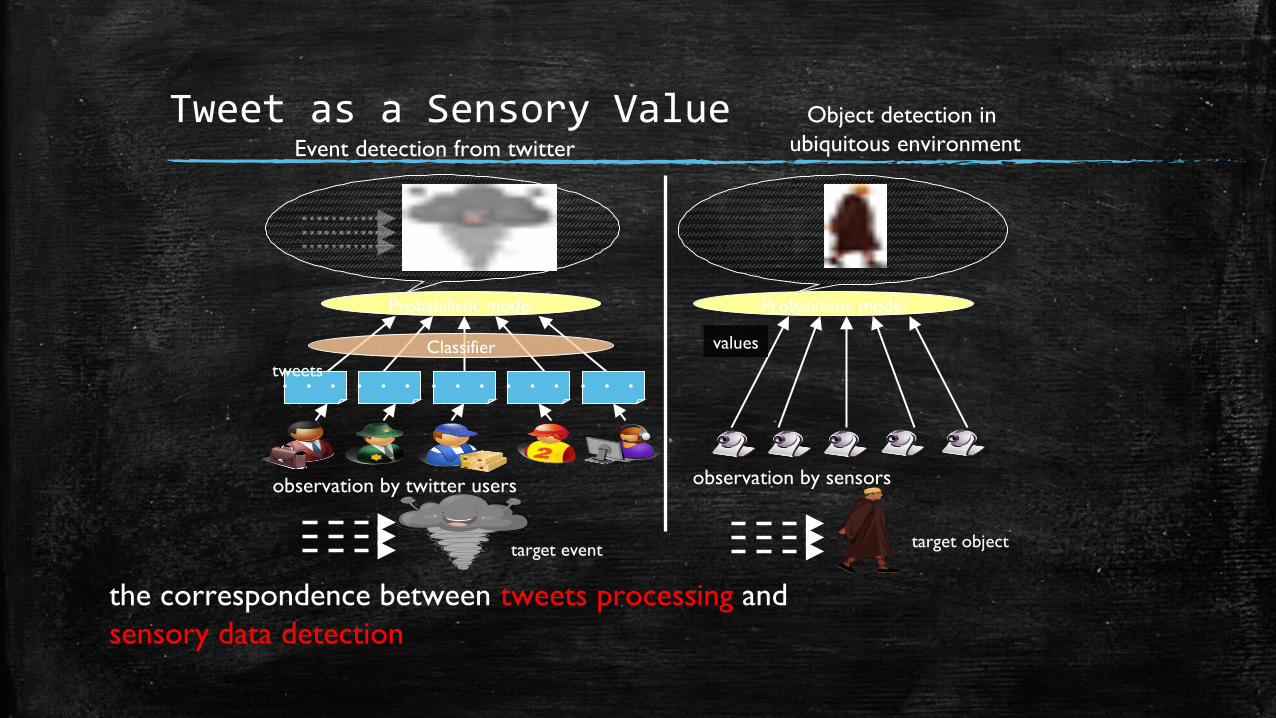
Tweet as a Sensory Value
・・・ ・・・ ・・・tweets
・・・・・・
Probabilistic model
Classifier
observation by sensorsobservation by twitter users
target event target object
Probabilistic model
values
Event detection from twitterObject detection in
ubiquitous environment
the correspondence between tweets processing andsensory data detection
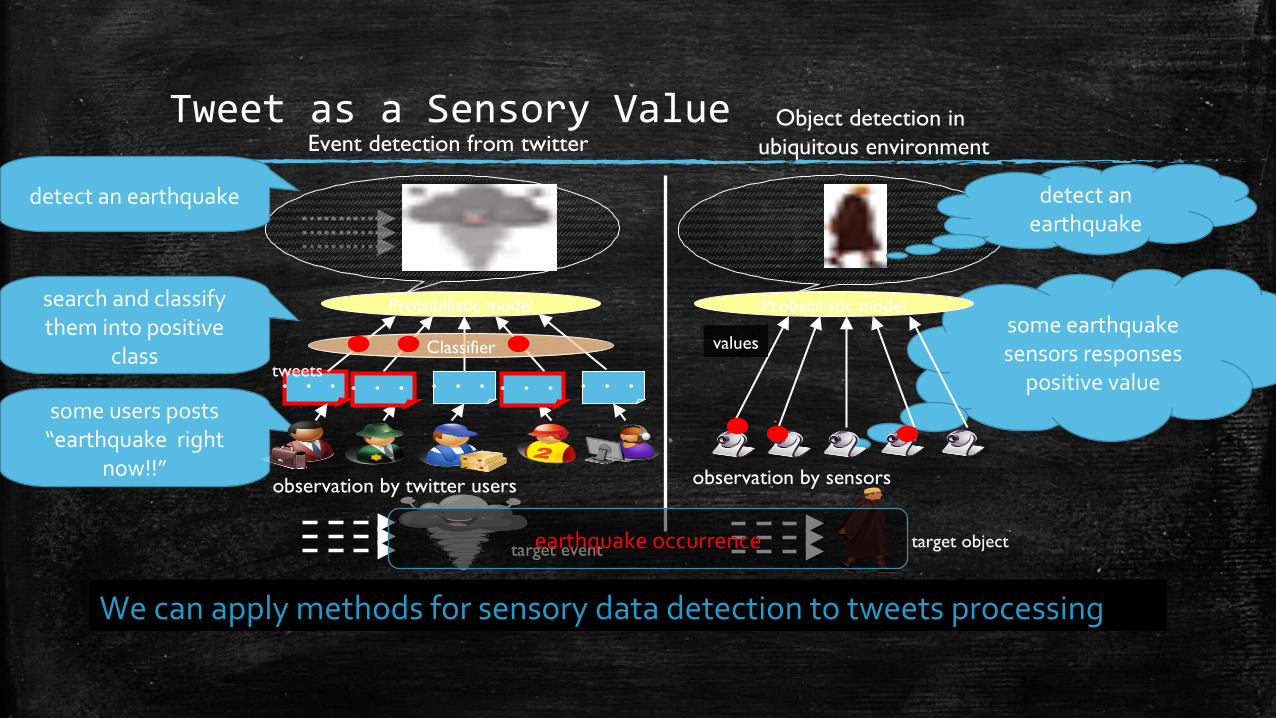
Tweet as a Sensory Value
some users posts“earthquake right
now!!”
some earthquake sensors responses
positive value
We can apply methods for sensory data detection to tweets processing
・・・ ・・・ ・・・tweets
Probabilistic model
Classifier
observation by sensorsobservation by twitter users
target event target object
Probabilistic model
values
Event detection from twitterObject detection in
ubiquitous environment
・・・・・・
search and classify them into positive
class
detect an earthquake detect an earthquake
earthquake occurrence
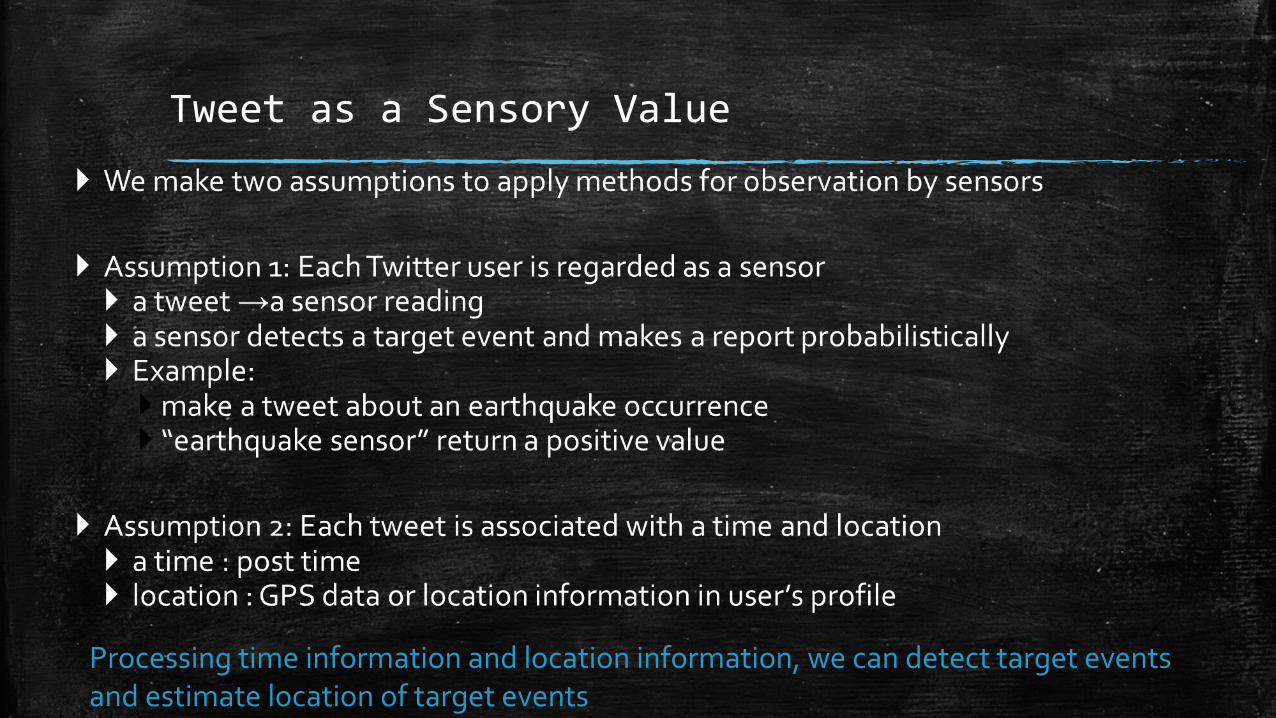
Tweet as a Sensory Value
Processing time information and location information, we can detect target events and estimate location of target events
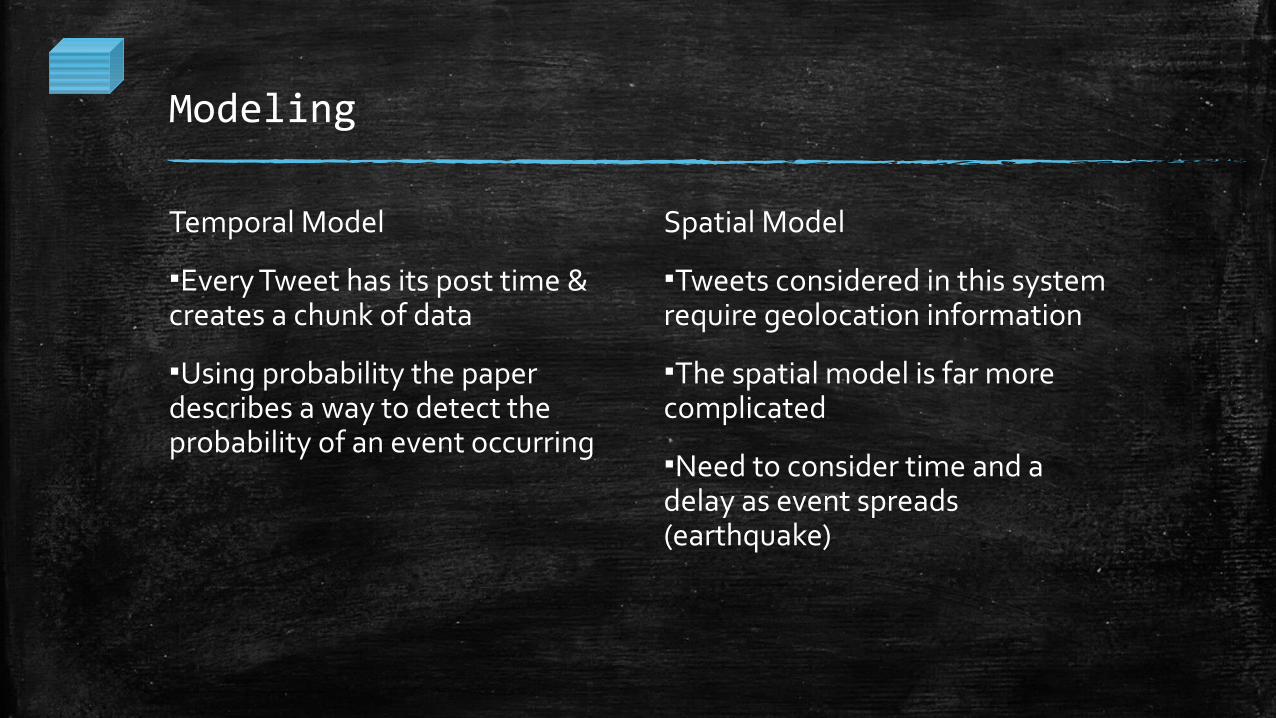
Modeling
Temporal Model
▪Every Tweet has its post time & creates a chunk of data
▪Using probability the paper describes a way to detect the probability of an event occurring
Spatial Model
▪Tweets considered in this system require geolocation information
▪The spatial model is far more complicated
▪Need to consider time and a delay as event spreads (earthquake)
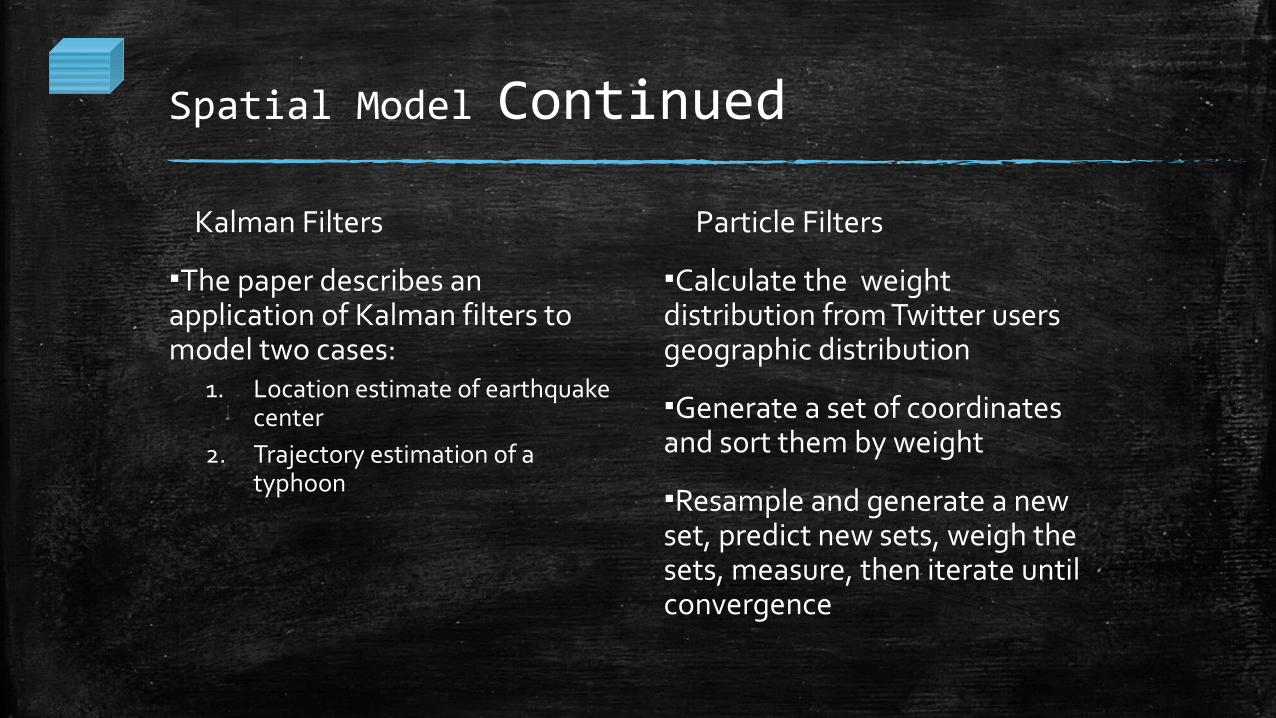
Spatial Model Continued
Kalman Filters
▪The paper describes an application of Kalman filters to model two cases:
1. Location estimate of earthquake center
2. Trajectory estimation of a typhoon
Particle Filters
▪Calculate the weight distribution from Twitter users geographic distribution
▪Generate a set of coordinates and sort them by weight
▪Resample and generate a new set, predict new sets, weigh the sets, measure, then iterate until convergence
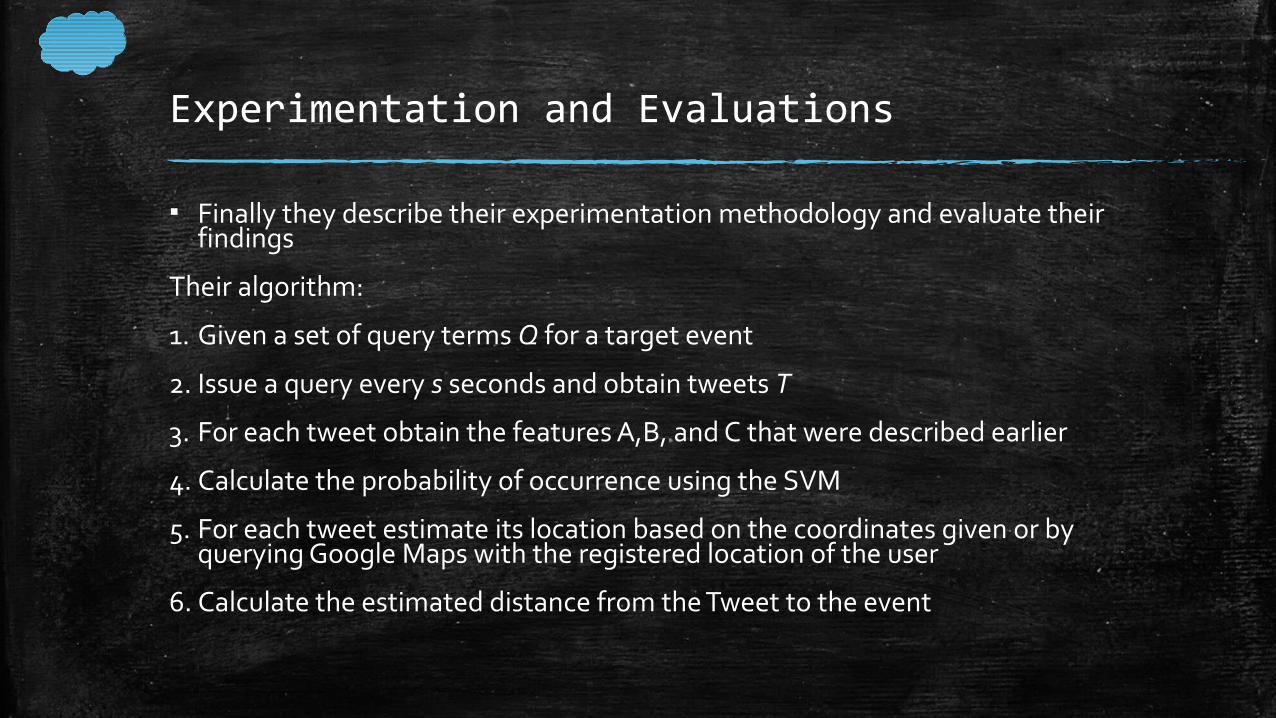
Experimentation and Evaluations
▪ Finally they describe their experimentation methodology and evaluate their findings
Their algorithm:
1. Given a set of query terms Q for a target event
2. Issue a query every s seconds and obtain tweets T
3. For each tweet obtain the features A,B, and C that were described earlier
4. Calculate the probability of occurrence using the SVM
5. For each tweet estimate its location based on the coordinates given or by querying Google Maps with the registered location of the user
6. Calculate the estimated distance from the Tweet to the event
Evaluation of Semantic Analysis
Evaluation of Semantic Analysis
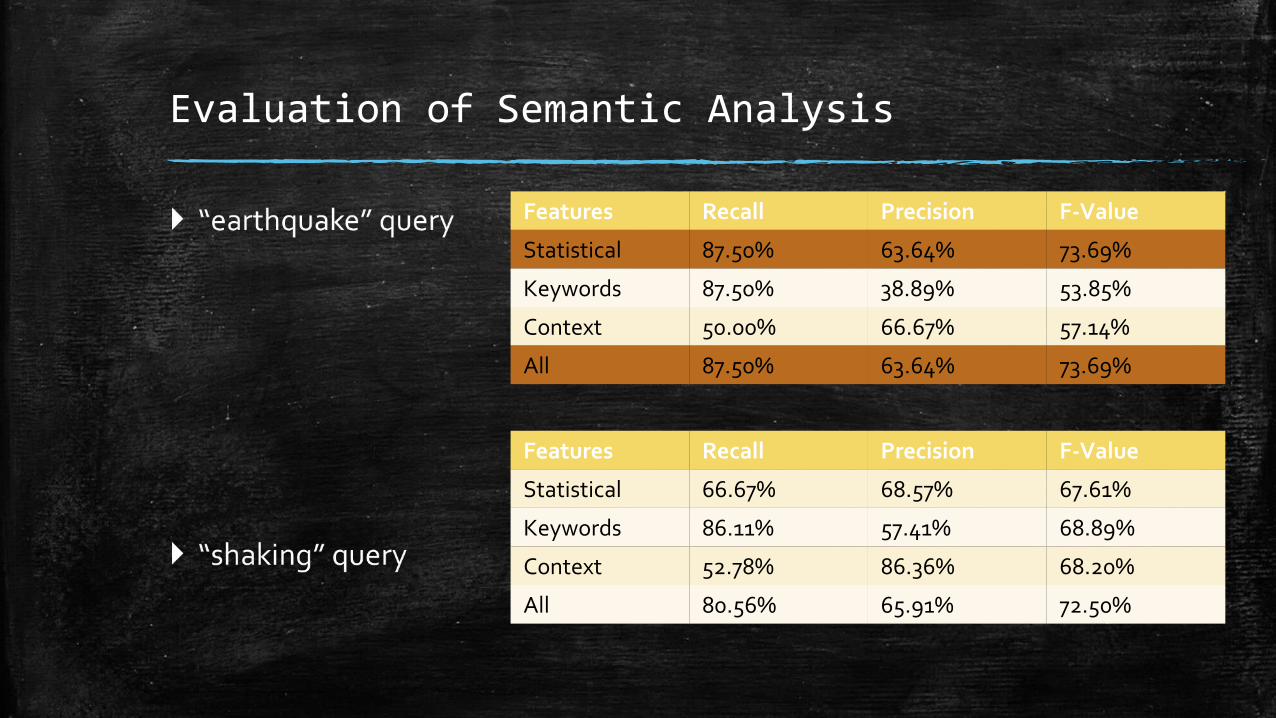
Features Recall Precision F-Value
Statistical 87.50% 63.64% 73.69%
Keywords 87.50% 38.89% 53.85%
Context 50.00% 66.67% 57.14%
All 87.50% 63.64% 73.69%
Features Recall Precision F-Value
Statistical 66.67% 68.57% 67.61%
Keywords 86.11% 57.41% 68.89%
Context 52.78% 86.36% 68.20%
All 80.56% 65.91% 72.50%
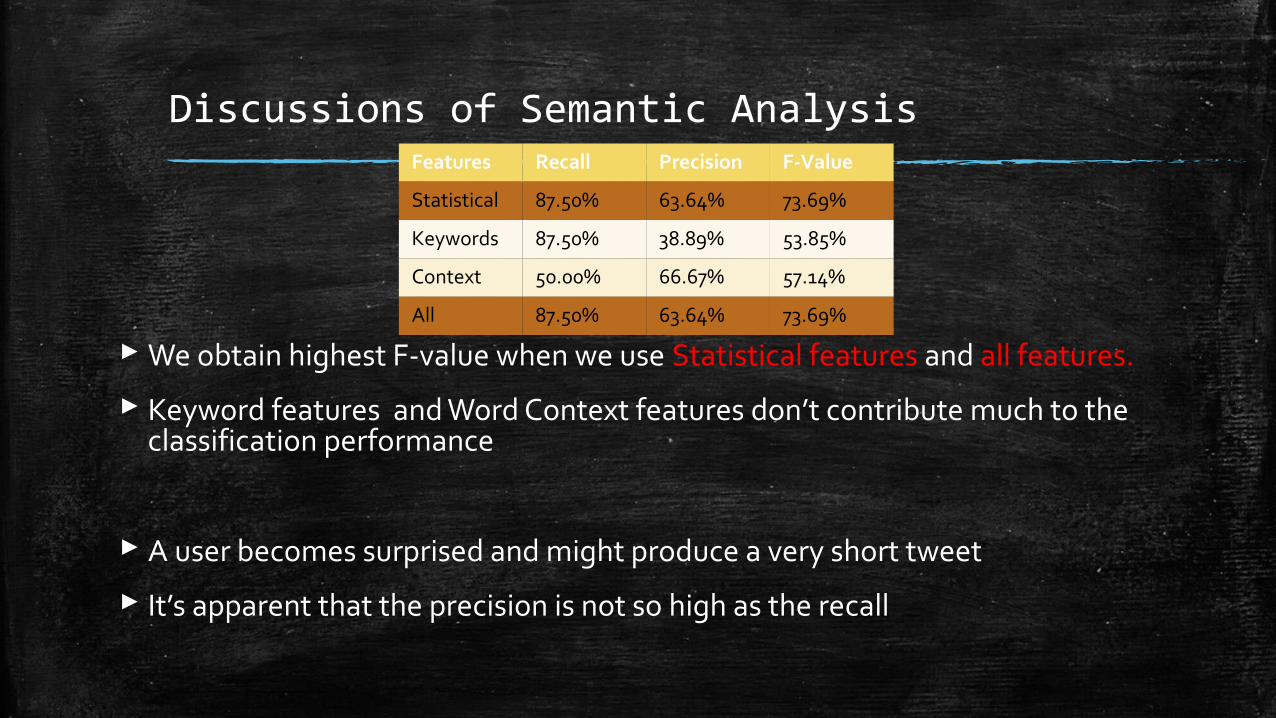
Discussions of Semantic Analysis
We obtain highest F-value when we use Statistical features and all features.
Keyword features and Word Context features don’t contribute much to the classification performance
A user becomes surprised and might produce a very short tweet
It’s apparent that the precision is not so high as the recall
Features Recall Precision F-Value
Statistical 87.50% 63.64% 73.69%
Keywords 87.50% 38.89% 53.85%
Context 50.00% 66.67% 57.14%
All 87.50% 63.64% 73.69%
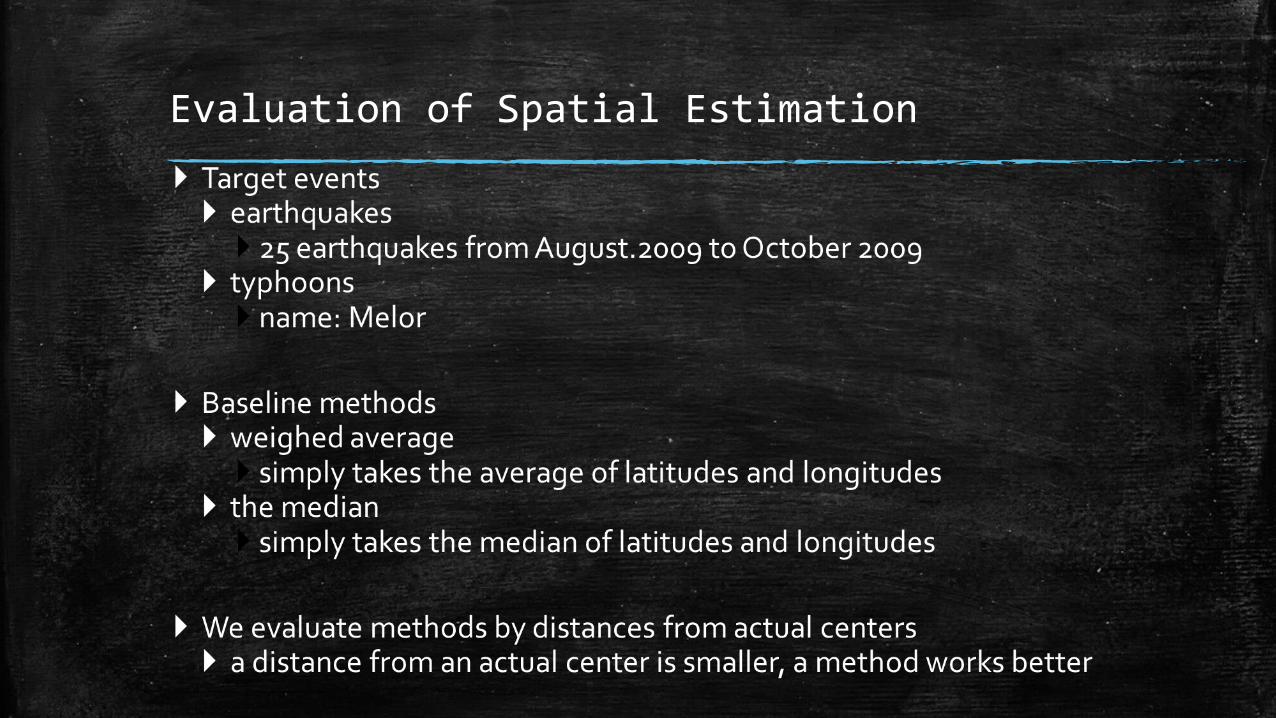
Evaluation of Spatial Estimation
Earthquake Reporting System
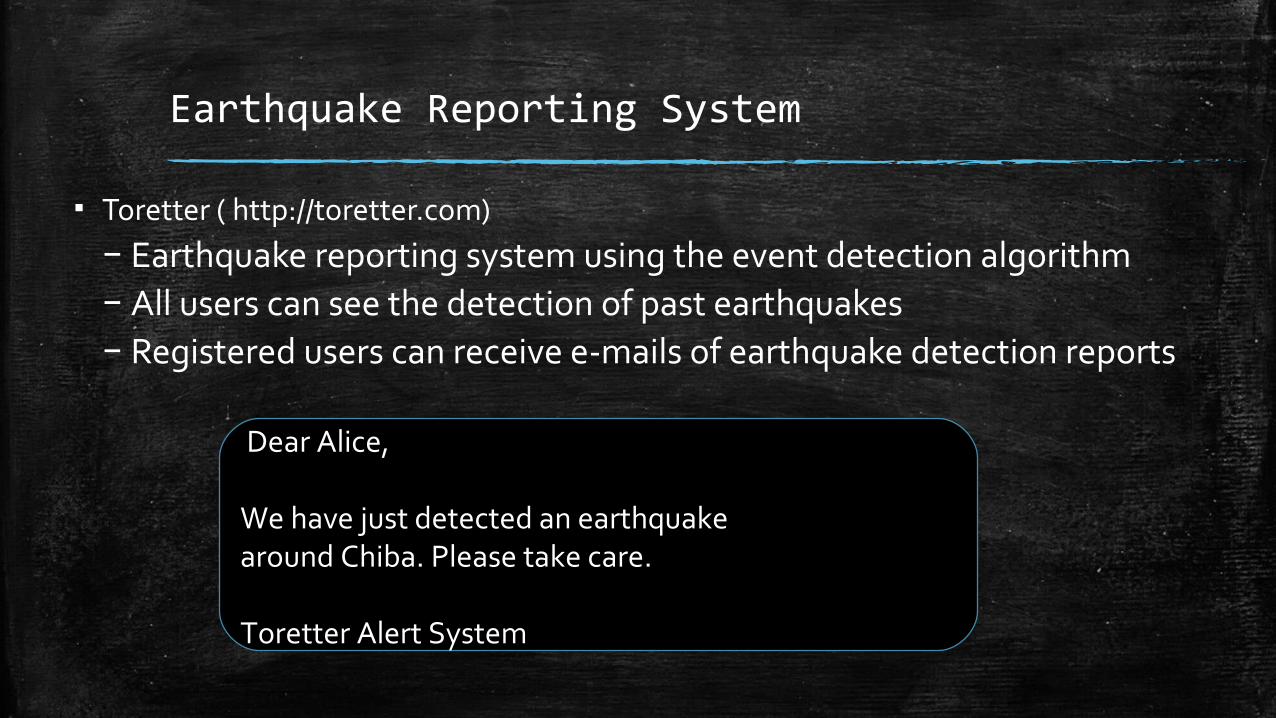
▪ Toretter ( http://toretter.com)– Earthquake reporting system using the event detection algorithm– All users can see the detection of past earthquakes– Registered users can receive e-mails of earthquake detection reports
Dear Alice,
We have just detected an earthquakearound Chiba. Please take care.
Toretter Alert System
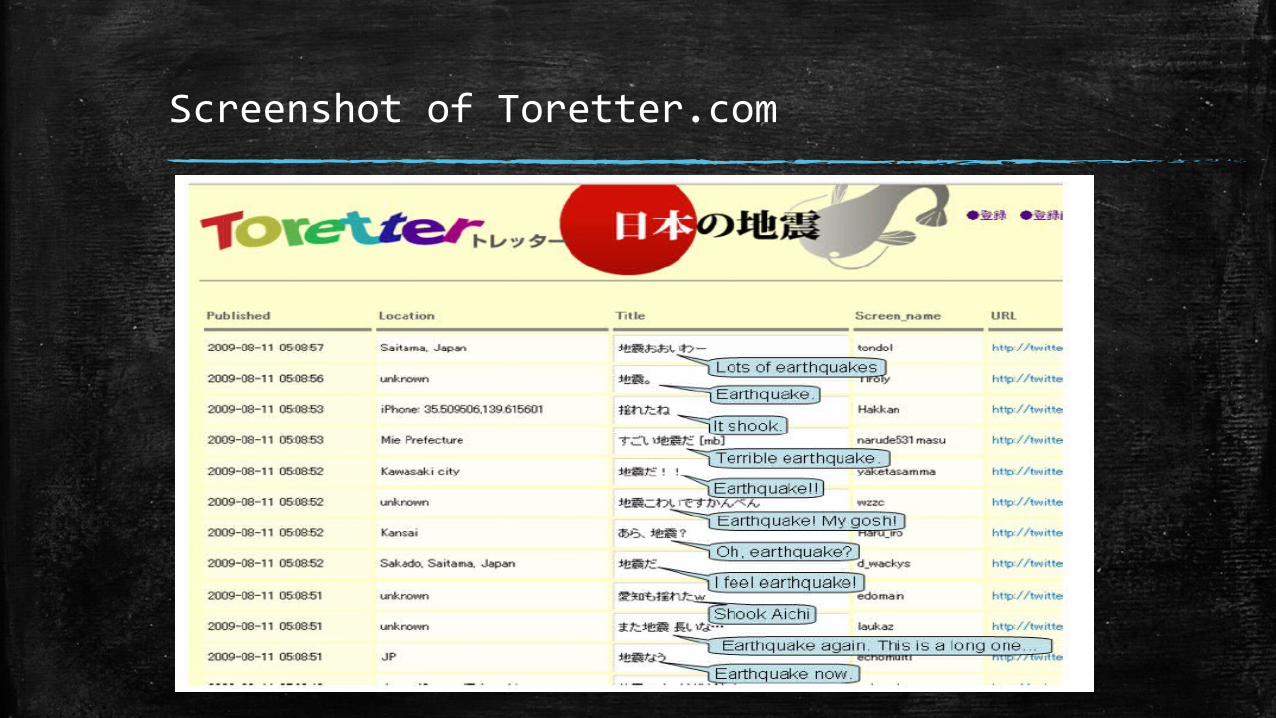
Screenshot of Toretter.com
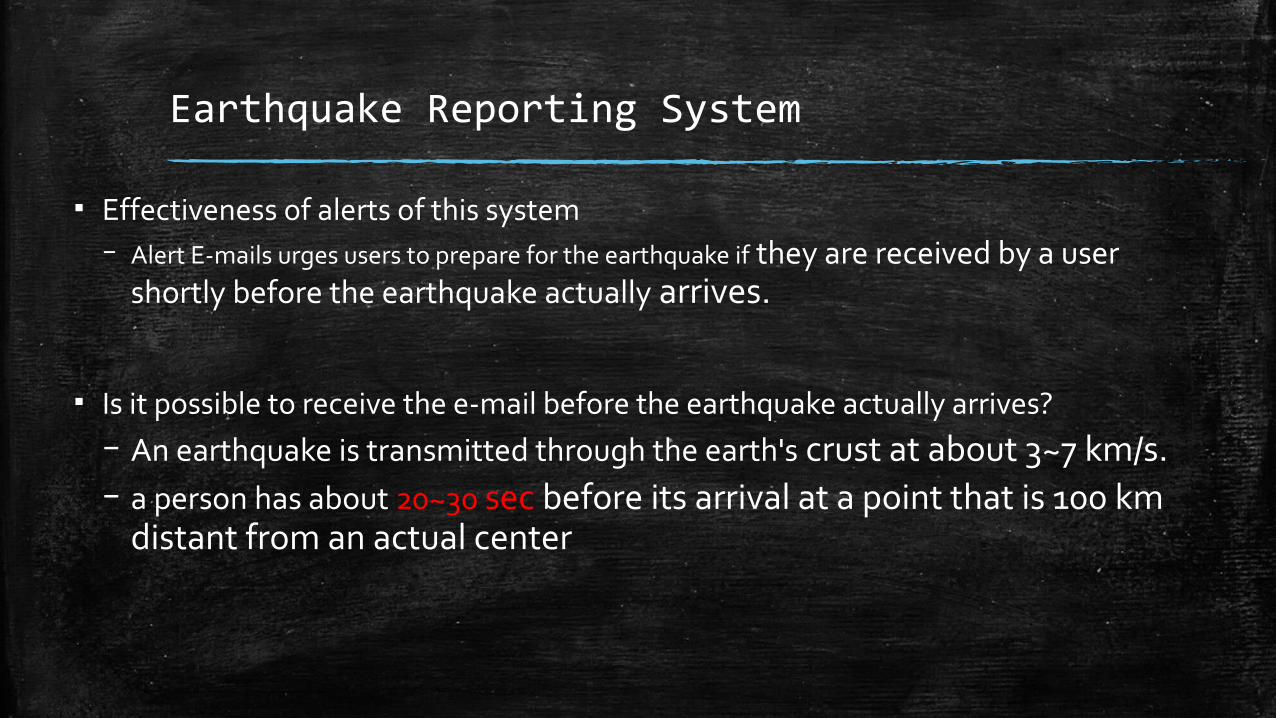
Earthquake Reporting System
▪ Effectiveness of alerts of this system– Alert E-mails urges users to prepare for the earthquake if they are received by a user
shortly before the earthquake actually arrives.
▪ Is it possible to receive the e-mail before the earthquake actually arrives?– An earthquake is transmitted through the earth's crust at about 3~7 km/s.– a person has about 20~30 sec before its arrival at a point that is 100 km
distant from an actual center
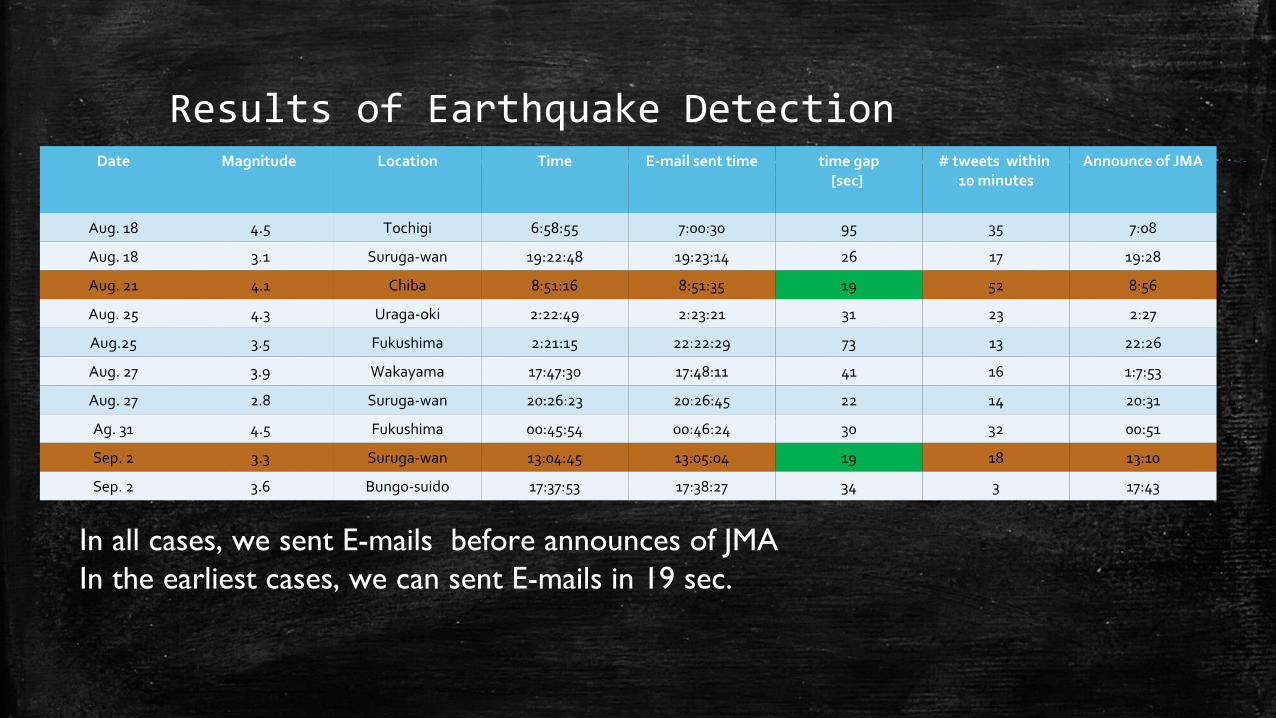
Results of Earthquake Detection
In all cases, we sent E-mails before announces of JMAIn the earliest cases, we can sent E-mails in 19 sec.
Date Magnitude Location Time E-mail sent time time gap[sec]
# tweets within 10 minutes
Announce of JMA
Aug. 18 4.5 Tochigi 6:58:55 7:00:30 95 35 7:08
Aug. 18 3.1 Suruga-wan 19:22:48 19:23:14 26 17 19:28
Aug. 21 4.1 Chiba 8:51:16 8:51:35 19 52 8:56
Aug. 25 4.3 Uraga-oki 2:22:49 2:23:21 31 23 2:27
Aug.25 3.5 Fukushima 2:21:15 22:22:29 73 13 22:26
Aug. 27 3.9 Wakayama 17:47:30 17:48:11 41 16 1:7:53
Aug. 27 2.8 Suruga-wan 20:26:23 20:26:45 22 14 20:31
Ag. 31 4.5 Fukushima 00:45:54 00:46:24 30 32 00:51
Sep. 2 3.3 Suruga-wan 13:04:45 13:05:04 19 18 13:10
Sep. 2 3.6 Bungo-suido 17:37:53 17:38:27 34 3 17:43
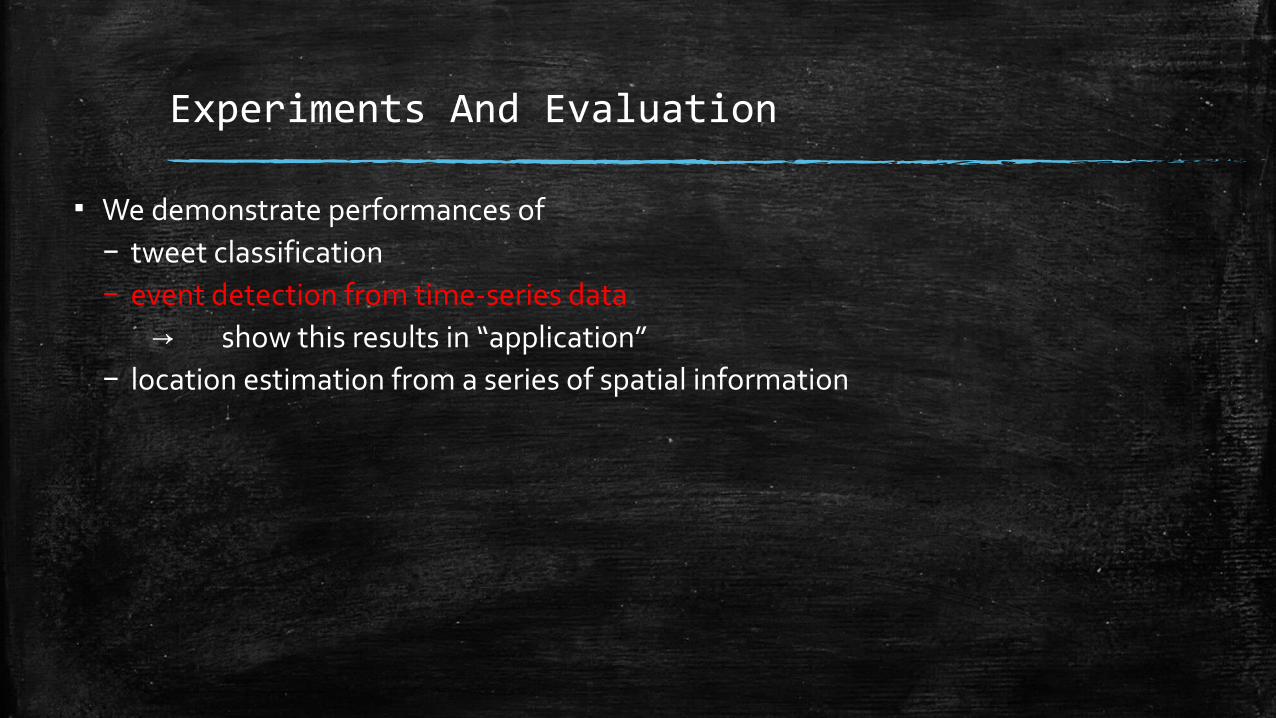
Experiments And Evaluation
▪ We demonstrate performances of– tweet classification– event detection from time-series data → show this results in “application”– location estimation from a series of spatial information
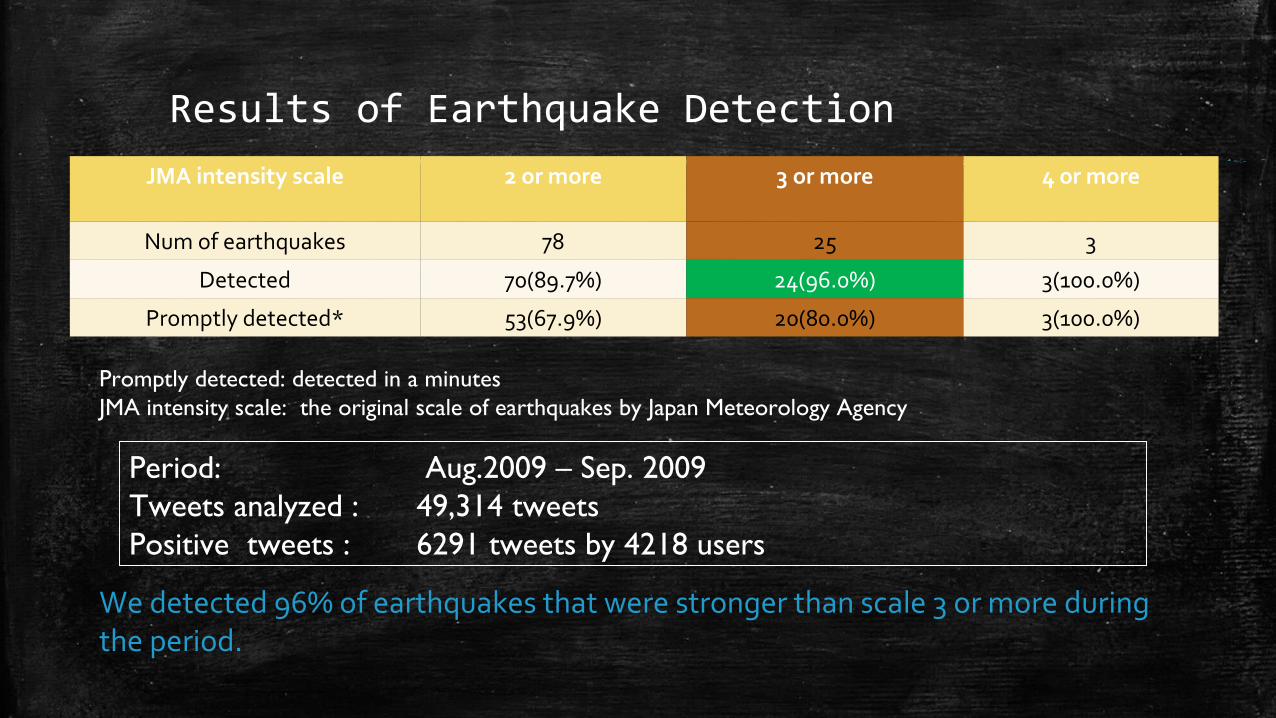
Results of Earthquake DetectionJMA intensity scale 2 or more 3 or more 4 or more
Num of earthquakes 78 25 3
Detected 70(89.7%) 24(96.0%) 3(100.0%)
Promptly detected* 53(67.9%) 20(80.0%) 3(100.0%)
Promptly detected: detected in a minutesJMA intensity scale: the original scale of earthquakes by Japan Meteorology Agency
Period: Aug.2009 – Sep. 2009Tweets analyzed : 49,314 tweetsPositive tweets : 6291 tweets by 4218 users
We detected 96% of earthquakes that were stronger than scale 3 or more during the period.
Conclusions