east african breweries limited: swot analysis & …...east african breweries limited - swot...
TRANSCRIPT

East African Breweries Limited
_________________________________________________________________________________
___________________________________________________________________________________________
East African Breweries Limited - SWOT Profile Page 1
East African Breweries Limited: SWOT
Analysis & Company Profile
Reference code: BRCP186CP10-Q4
Published: Oct 2010
Business Review
John Carpenter House
7 Carmelite Street
London EC4Y 0BS
United Kingdom
Tel: +44 (0) 20 7936 6400
Fax: +44 (0) 20 7336 6813

East African Breweries Limited
__________________________________________________________________________________________
___________________________________________________________________________________________
East African Breweries Limited - SWOT Profile Page 2
East African Breweries Limited - Company Overview
East African Breweries Limited (EABL) is one of East Africa’s leading branded alcohol manufacturing companies. It is a holding company engaged in the brewing/ manufacturing, marketing and selling of drinks, glass containers, malt and barley through its subsidiaries. The product portfolio of the company includes beer, spirits and non-alcoholic beverages. EABL offers beer under Tusker, Guinness, Tusker Malt, Pilsner, White Cap, Allsopps, and Bell brand names; spirits under Johnnie Walker, Smirnoff, Richot, Bond 7, and Waragi brands; and non-alcoholic drinks under Malta Guinness and Alvaro brands. The company exports its products to Burundi, Rwanda, Tanzania, Southern Sudan, Uganda, Eastern DRC Congo, Eritrea, Djibouti, Ethiopia, Mauritius, Malawi and Seychelles. It also exports its products to outside Africa, which include the US, Japan, Australia, Canada and the UK. EABL is a subsidiary of Diageo plc. The company is headquartered in Nairobi, Kenya.
Financial Performance
The company reported revenues of KES 37,965.33 million during the fiscal year ended June 2010. Its revenues grew at a compound annual growth rate (CAGR) of 3.97%, during the period, 2008-2010, and year-on-year (Y-o-Y) growth of 10.34% over the fiscal year 2009. During the fiscal year 2009, its operating margin was 33.10% as against an operating margin of 33.44% during the fiscal year 2008. Moreover, during the fiscal year 2009, the company’s net profit margin was 18.91% as against a net profit margin of 20.01% during the fiscal year 2008.
East African Breweries Limited - Key Facts
East African Breweries Limited, Key Facts
Corporate Address:
Coporate Centre, Nairobi, , ,
Kenya
Ticker Symbol, Stock Exchange
EABL (Nairobi Stock Exchange)
Telephone + 254 8644000 No. of Employees N/A
Fax + 254 8563054 Financial Year End June
URL www.eabl.com Revenue (in KES Million) 37,965.33
Industry Consumer Packaged Goods Revenue (in USD Million) 474.86
Locations Australia, Japan, United Kingdom, Kenya, Canada, United States
Source: Annual Report, Company Website, Primary and Secondary Research

East African Breweries Limited
__________________________________________________________________________________________
___________________________________________________________________________________________
East African Breweries Limited - SWOT Profile Page 3
East African Breweries Limited - Business Description
East African Breweries Limited (EABL) operates as a subsidiary of Diageo plc. Diageo Kenya Limited holds 42.82% stake in the company while Diageo Holdings Netherlands B.V. holds another 4.60% stake. The company, along with its subsidiaries, is engaged in brewing, manufacturing, and marketing of branded alcoholic and non-alcoholic beverages. It employs 1,188 people. The company is one of the leading alcoholic beverage companies in Eastern Africa. Along with its breweries and distilleries, the company manufactures beers and spirits. The spirits category includes vodka, whisky, brandy and triple refined spirits. The company also manufactures non-alcoholic drinks. EABL markets its products under various brands, which include Tusker, Pilsner, White Cap, Allsopps, Senator Keg, Bell Lager and Guiness in the beer category. Under the Tusker brand, the company offers Tusker Lager and Tusker Malt Lager. Tusker Lager is one of the biggest brands in Kenya. The other markets in which Tusker is promoted include Tanzania, Canada, Japan, the UK and the US. Tusker Malt Lager brand is promoted as premium malt in Kenya while Pilsner brand of beer is positioned with emotional elements that show masculinity and authority. This brand is promoted in Kenya, Tanzania, Congo, Uganda, Sudan and Rwanda. The White Cap brand is targeted for the people in the age group of 28 to 45 years and positioned for dominant males and high ranking professionals in Kenya. Senator branded barley beer is targeted at accessible pricing markets and is promoted in Kenya. The Bell Lager brand is brewed at Uganda Breweries Ltd. It is positioned for urban males and marketed in Uganda, Rwanda, Congo, Sudan and the UK. The spirits category brands of the company include Johnnie Walker, Smirnoff, Richot, Bond 7 and Waragi. Johnnie Walker is a whiskey brand while Smirnoff is a premium vodka brand and Richot is a blended brandy. Waragi is a leading spirit brand in Uganda and is positioned for occasions with friends. The brand is promoted in Uganda, Rwanda, Congo, Sudan and the UK. In the non alcoholic category, the company manufactures malt based drinks. It promotes two brands in this category, namely, Malta Guinness and Alvaro. Malta Guinness drink is positioned for busy and active customer group. This brand is promoted in Cameroon, Nigeria, Ghana, Kenya and Tanzania. Alvaro is positioned for sophisticated broad minded adults. This brand is promoted in Kenyan markets. EABL distributes its products across Kenya through local distributors. It also exports these products to Tanzania, Djibouti, Uganda, Rwanda, Burundi, Southern Sudan, Ethiopia, Eastern DRC Congo, Eritrea, Malawi, Mauritius and Seychelles. In addition, it exports its products to outside Africa, which include Australia, Canada, Japan, the UK and the US. The operations are carried out through its subsidiaries such as Kenya Breweries, Uganda Breweries, International Distillers Uganda, East African Maltings, Central Glass Industries, EABLI, EABL Tanzania Limited and UDV Kenya. Geographically, the company operates in three segments, namely, Kenya, Uganda and Tanzania. During the fiscal year ended June 2010, the company generated 80.32% of its total net sales from Kenya, 17.78% from Uganda and 1.9% from Tanzania. Recently, the Tanzanian Fair Competition Commission approved the acquisition of a majority interest in Serengeti Breweries Limited (SBL) by EABL. SBL is Tanzania's second largest brewer and the producer of the Premium Serengeti Lager. In addition, EABL through its subsidiary, East African Maltings Ltd (EAML) started purchasing sorghum grown in various semi-arid areas across the country with a major focus in Eastern Province as part of its ongoing strategy to manufacture alcoholic beverages by using locally grown raw materials and developing technologies. Further, the company also opened a new Brew House and Bottling Line at Tusker Brewery, Nairobi.

East African Breweries Limited
__________________________________________________________________________________________
___________________________________________________________________________________________
East African Breweries Limited - SWOT Profile Page 4
East African Breweries Limited - Major Products and Services
East African Breweries Limited is one of the leading manufacturers of branded alcohol beverages in East Africa withan outstanding collection of beer and spirit brands. Its products include the following:
East African Breweries Limited, Major Products and Services
Products:
Alcoholic Products:
Beer
Spirits
Non-Alcoholic Products:
Malt Based Drinks
Brands:
Beer Brands:
Tusker
Tusker Malt
Pilsner
White Cap
Bell
Allsopps
Guinness
Non-Alcoholic Drink Brands:
Malt Guinness
ALVARO
Spirit Brands:
Johnnie Walker
Smirnoff
Richot
Bond 7
Waragi
V & A
Source: Annual Report, Company Website, Primary and Secondary Research

East African Breweries Limited
__________________________________________________________________________________________
___________________________________________________________________________________________
East African Breweries Limited - SWOT Profile Page 5
East African Breweries Limited - History
East African Breweries Limited, History
Year Event type Description
2009
New Products/Services
The company launched a new bottle for its premium beer brand, Tusker Malt Lager.
2009
Contracts/Agreements
The company and Diageo entered into a partnership with Serengeti Breweries Limited (SBL). Under which SBL took over the distributorship of all EABL/Diageo spirits brands in Tanzania.
2008
Contracts/Agreements
The company signed Vehicle Lease Agreement with leading local motor sales firm Toyota East Africa Ltd.
2005
Corporate Changes/Expansions
The company launched EABL Foundation with a goal to enrich the lives of poor and excluded people in East Africa.
2004
Corporate Awards
The company was voted as 'East Africa's Most Respected Company' consecutively for the fifth time.
2003
New Products/Services
KBL introduced a new lager brand by the name Senator.
2002
Contracts/Agreements
The company signed an agreement with South African Breweries International and agreed for share exchanges in Kenya Breweries Limited and Tanzania Breweries Ltd.
2000
Corporate Changes/Expansions
Kenya Maltings Limited was incorporated as a separate company in the Group EABL.
1997
Corporate Changes/Expansions
Kenya Breweries installed an ultra modern state of the art bottling line at Tusker Brewery.
1992
New Products/Services
Kenya Breweries launched its high quality gravity beer, Kenbrew.
1988
Corporate Changes/Expansions
The company was renamed as Kenya Breweries Ltd.
1986
Contracts/Agreements
Kenya breweries, a subsidiary company made an agreement with the US beer distributor to sell its products in the US.
1985
Corporate Changes/Expansions
The company started the construction of Central Glass Industries.
1972
Corporate Changes/Expansions
The company's Uganda Breweries was nationalized by Idi Amin and established technical services division.
1964
Acquisitions/Mergers/Takeovers
The company acquired Kilimanjaro Brewery in Tanzania.
1962
Corporate Changes/Expansions
The company became a holding company and Kenya Breweries was re-established as the major trading company.
1962
Acquisitions/Mergers/Takeovers
The company completed its merging with Allsopp (East Africa) Ltd.
1959
New Products/Services
The company introduced Employee profit sharing scheme.
1959
Acquisitions/Mergers/Takeovers
The company acquired financial holding in Uganda Breweries.
1954
Stock Listings/IPO
The company started trading on the Nairobi Stock Exchange.
East African Breweries Limited
__________________________________________________________________________________________
___________________________________________________________________________________________
East African Breweries Limited - SWOT Profile Page 6
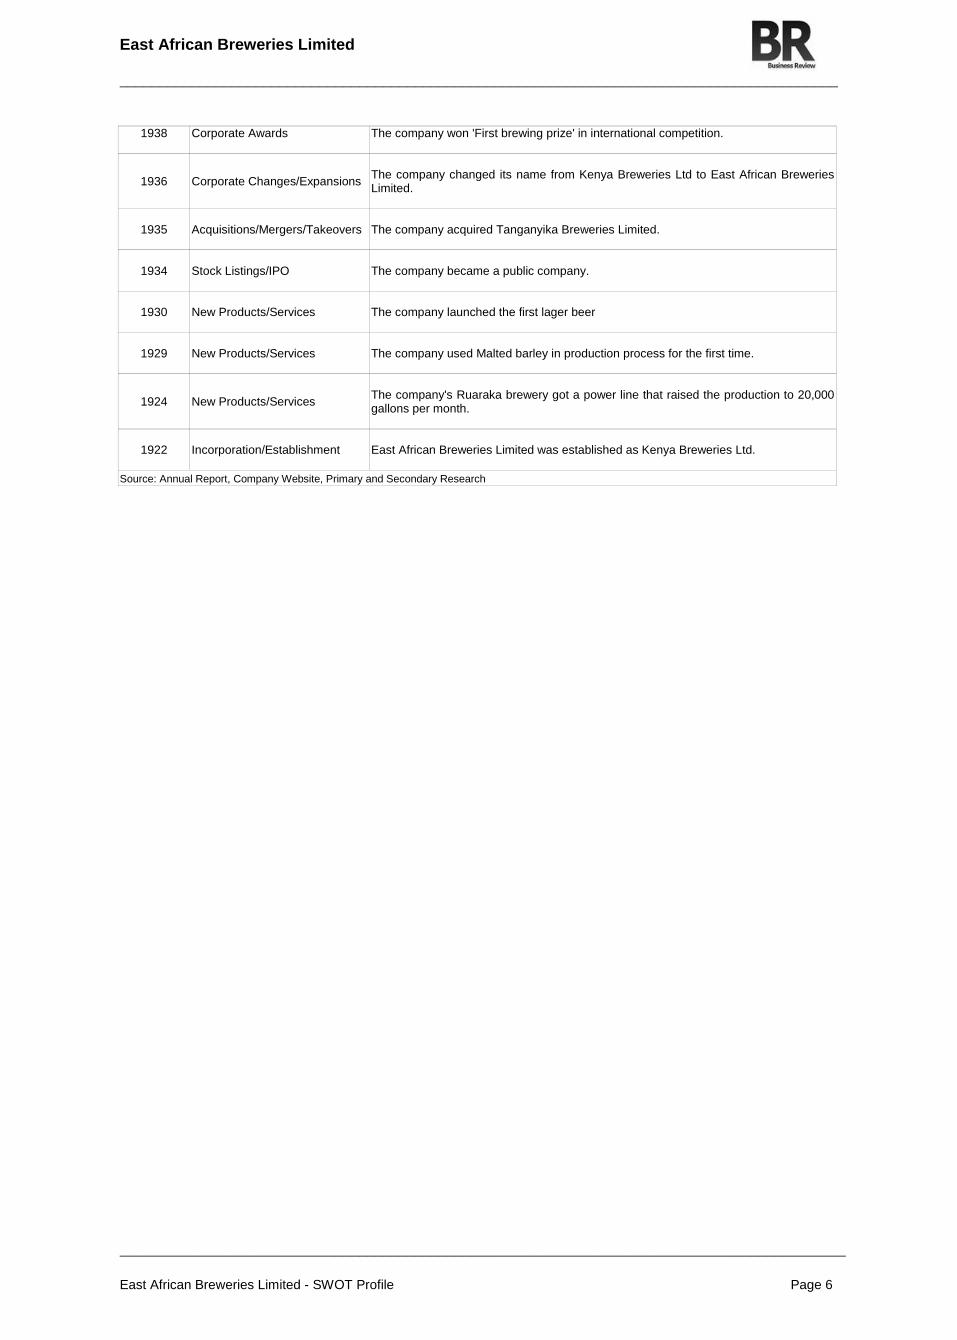
1938
Corporate Awards
The company won 'First brewing prize' in international competition.
1936
Corporate Changes/Expansions
The company changed its name from Kenya Breweries Ltd to East African Breweries Limited.
1935
Acquisitions/Mergers/Takeovers
The company acquired Tanganyika Breweries Limited.
1934
Stock Listings/IPO
The company became a public company.
1930
New Products/Services
The company launched the first lager beer
1929
New Products/Services
The company used Malted barley in production process for the first time.
1924
New Products/Services
The company's Ruaraka brewery got a power line that raised the production to 20,000 gallons per month.
1922
Incorporation/Establishment
East African Breweries Limited was established as Kenya Breweries Ltd.
Source: Annual Report, Company Website, Primary and Secondary Research
East African Breweries Limited
__________________________________________________________________________________________
___________________________________________________________________________________________
East African Breweries Limited - SWOT Profile Page 7
East African Breweries Limited - SWOT Analysis
SWOT Analysis - Overview
East African Breweries Limited (EABL) is one of the leading branded alcohol manufacturing companies in East Africa. The company’s strong brand equity and strong revenue growth are its key strengths, even as its geographical concentration remains a concern area. However, changing customer spending patterns and new alcohol law in Kenya could affect its growth. Going forward, new product launches and strategic growth initiatives could offer ample growth opportunities for the company.
East African Breweries Limited - Strengths
Strong Brand Equity East African Breweries Limited enjoys a strong brand equity, which provides it with an edge over its competitors while attracting and retaining a loyal customer base. The company offers a broad range of beer brands which include Tusker, Tusker Malt, Pilsner, White Cap, Bell, Allsopps and Guinness. The spirit brands offered by the company include Johnnie Walker, Smirnoff, Richot, Waragi, V & A and Bond 7. Malt Guinness and ALVARO are its non alcoholic beverage brands. Tusker Lager is one of the biggest brands in Kenya while Waragi is a leading spirit brand in Uganda. Through these strong brand offerings, EABL enjoys an estimated 95% market share in the formal alcohol industry in Kenya. Such strong market position and brand equity supports the launch of new products as well as the company's foray into new markets. Association with the Diageo Family East African Breweries Limited is a subsidiary of Diageo plc, which is one of leading companies in the branded beverage alcohol industry. Diageo is a strategic shareholder of EABL with 47.5% shareholding in the company. Diageo has offices in 80 countries, and also has manufacturing sites throughout the globe including Canada, Spain, Great Britain, the US, Ireland, Italy, Latin America, Africa, Australia, India and the Caribbean. Diageo sells its products in more than 180 markets on five continents. In the global premium spirits market, Diageo holds the largest market share of 29%, followed by Pernod Ricard with 17%, Bacardi with 9%, Fortune Brands with 4%, Brown-Forman with 6% and others with 35%. During the fiscal year 2010, the company sold over 143.4 million equivalent units of spirits, wine and beer. Thus by being a part of Diageo, EABL leverages the strong position enjoyed by Diageo in the alcoholic beverage markets. It also gains from its Diageo’s strong management expertise, governance practices, innovations and corporate management. Strong Revenue Growth The company exhibited a steady revenue growth during the current fiscal year, which helps the company to pursue its growth plans. During the fiscal year ended June 2010, the company reported revenues of KES 37,965.33 million, an increase of 10.34% over the fiscal year 2009. The increase in sales was principally due to price, mix and the success of its premium and mainstream brands. Tusker and Guinness reported net sales value growth of 25% and 23%, respectively. In addition, EABL’s compounded annual growth rate (CAGR) for revenue was 16.08% during 2006-2010. This was above the revenue CAGR of its peer, Zambian Breweries Plc, which registered a 10.36% CAGR for the period, 2005-2009. The company's revenue CAGR was also above the Beverages - Brewers sector average of 11.02%. Further, during the fiscal year 2010, the operating profit of the company was KES 12,568.09 million, an increase of 9.22% over 2009; and the net profit of the company was KES 7,179.03 million, an increase of 4.28% from 2009. Steady revenue growth allows the company to pursue its growth plans and maintain its strong market position.
East African Breweries Limited - Weaknesses
Geographical Concentration Though the company has strong presence in the Kenya, it lacks presence in other high potential regions of the world. With its competitors already having diversified operations, the company is at a major disadvantage as the sales from other regions add new avenues of income for the competitors. With over 80% of its revenues being derived from Kenyan market, the company is at a risk as any political, economic or climatic change might have an adverse impact on the company’s business. It also restricts its market share and growth options.
East African Breweries Limited - Opportunities
New Product Launches The company could benefit from the new product launches made during the fiscal year ended June 2010. EABL launched Blossom Hill Wine in Red and White in Kenya; Alvaro Passion Fruit in Kenya and Uganda; and Premium Serengeti Lager

East African Breweries Limited
__________________________________________________________________________________________
___________________________________________________________________________________________
East African Breweries Limited - SWOT Profile Page 8
in Uganda. Further in 2009, it launched Guinness in a new design resembling the 300 ml Gucci bottle. These new product launches have helped increase the sales of high value added products. Thus innovation and new product launches will drive top-line growth and keep the company’s categories vital. Strategic Growth Initiatives Strategic acquisitions and expansion of facilities offer strong growth opportunities for the company, especially while foraying into new markets or launching new products or services. In February 2010, the company opened its new ultra modern brew house and bottling line at the Tusker Brewery in Nairobi, with a production capacity of 80,000 bottles per hour. In addition, the company installed a new 480 barrels per hour keg line in Kenya, which is instrumental to its growth and delivery strategy. Further, the company is planned to start a new packaging line in October 2010 with a capacity of 50,000 bottles per hour at the Uganda Breweries Limited (UBL) Plant in Kampala, Uganda. In July 2009, the company entered into a conditional agreement to acquire substantial interest in Tanzanian company, Serengeti Breweries Limited (SBL) from existing shareholders. SBL is Tanzania's second largest brewer and the manufacturer of the Premium Serengeti Lager. In July 2010, the Tanzanian Fair Competition Commission approved the acquisition of a majority interest in SBL by the company. However, there are still certain major steps to be made before the acquisition is complete. This partnership with SBL will strengthen the company’s footprint in Tanzania. Strategic acquisitions and expansion of fac ilities offer strong growth opportunities for the company. Strategic acquisitions and expansion of facilities such as these provide a steady revenue source, apart from geographical expansion for the company. Rising Demand for Non Alcoholic Beverages The Non Alcoholic Beverage Market has been growing rapidly from the past few years. The non-alcoholic beverages sector covers all the soft drinks including still drinks, fruit drinks, carbonates, energy drinks and sports drinks. The major driver for this rising non-alcoholic market is health and wellness, owing to the volume of low calorie products which has increased by 50% in the past five years. Further, this non-alcoholic beverage market is considered to be USD 82 billion market. This market was driven by consumers’ inclination to decrease calories in their beverage intake. As a result, the major driver for the growth came from non-carbonated beverage segments such as bottled water, ready-to-drink tea and coffee, and sports and energy drinks. As the company is also engaged in offering various flavored tea, juices, energy drinks and water products, it can leverage the rising demand for non alcoholic beverages.
East African Breweries Limited - Threats
Changing Customer Spending Patterns The company’s performance may be impacted by the changing consumer spending pattern. With the changing economic conditions, the customer spending patterns have also been changing. The global economy is being affected by the increased interest rates, consumer debt levels, tax rates, consumer credit availability, unemployment trends and inflation rates. The changing economic conditions are affecting customers’ living standards and thereby could affect the company’s business. With the company’s core business being premium branded alcohol products, the changing customer spending patterns could pose a major challenge to the company. New Alcohol Law in Kenya EABL’s performance may be affected by the new Kenyan alcohol law. As per the law, brewers of previously banned traditional drinks, which include chang'aa, a clear liquor made from grain, will be permitted to operate freely. As EABL dominates the alcohol market in Kenya, the new Kenyan alcohol law may open up the market to competition, with domestic brewers springing up to capitalize on the legalization of traditional liquor. Further, the Alcoholic Drinks Control Bill also launched curtails on advertising and where the alcoholic drinks can be sold. Further, according to law the brewers are supported to publish health warnings on the risks of alcohol, comprising minimum 30% of the total surface area of a bottle's label.

East African Breweries Limited
__________________________________________________________________________________________
___________________________________________________________________________________________
East African Breweries Limited - SWOT Profile Page 9
East African Breweries Limited - Key Competitors
The following companies are the major competitors of East African Breweries Limited: Nigerian Breweries Plc Accra Brewery Limited Zambian Breweries Plc Tanzania Breweries Limited Sechaba Brewery Holdings Limited

East African Breweries Limited
__________________________________________________________________________________________
___________________________________________________________________________________________
East African Breweries Limited - SWOT Profile Page 10
East African Breweries Limited - Key Employees
East African Breweries Limited, Key Employees
Name Job Title Board Level Since Age
Jeremiah G. Kiereini Chairman Executive Board 1988 81
Nick Blazquez Group Deputy Chairman Executive Board 2005 49
Evanson Mwaniki Director Non Executive Board 2000 72
Andrew S. Ndegwa Director Non Executive Board 2004 42
Wilfred Kiboro Director Non Executive Board 66
Richard Kemoli Director Non Executive Board 1996 75
Dr. Alan Shonubi Director Non Executive Board 2009 51
Constance Gakonyo Director Non Executive Board 2009 45
Peter Ndegwa Director - Finance Executive Board 2008 41
Seni Adetu Managing Director Executive Board 47
Agnes Murgor Secretary Senior Management 47
Gerald Githinji Director - Supply Chain Senior Management 2010
Ivo Buratovich Managing Director - Uganda Senior Management 2009
James Wambu Head of Sales UBL Senior Management 2008
Adam Kalume Head of Group Security Senior Management 2009
Jerry Wakhu Head-Market Development Senior Management 2010
Gabriel Olunga Head-Customer Services Kenya Senior Management
James Mugo Group Business Development Manager Senior Management
Baker Magunda Managing Director - Kenya Senior Management
Josephat Ngile General Manager - EABL Glass Senior Management 2010
James Karegi Director - Supply Senior Management 2010
East African Breweries Limited
__________________________________________________________________________________________
___________________________________________________________________________________________
East African Breweries Limited - SWOT Profile Page 11
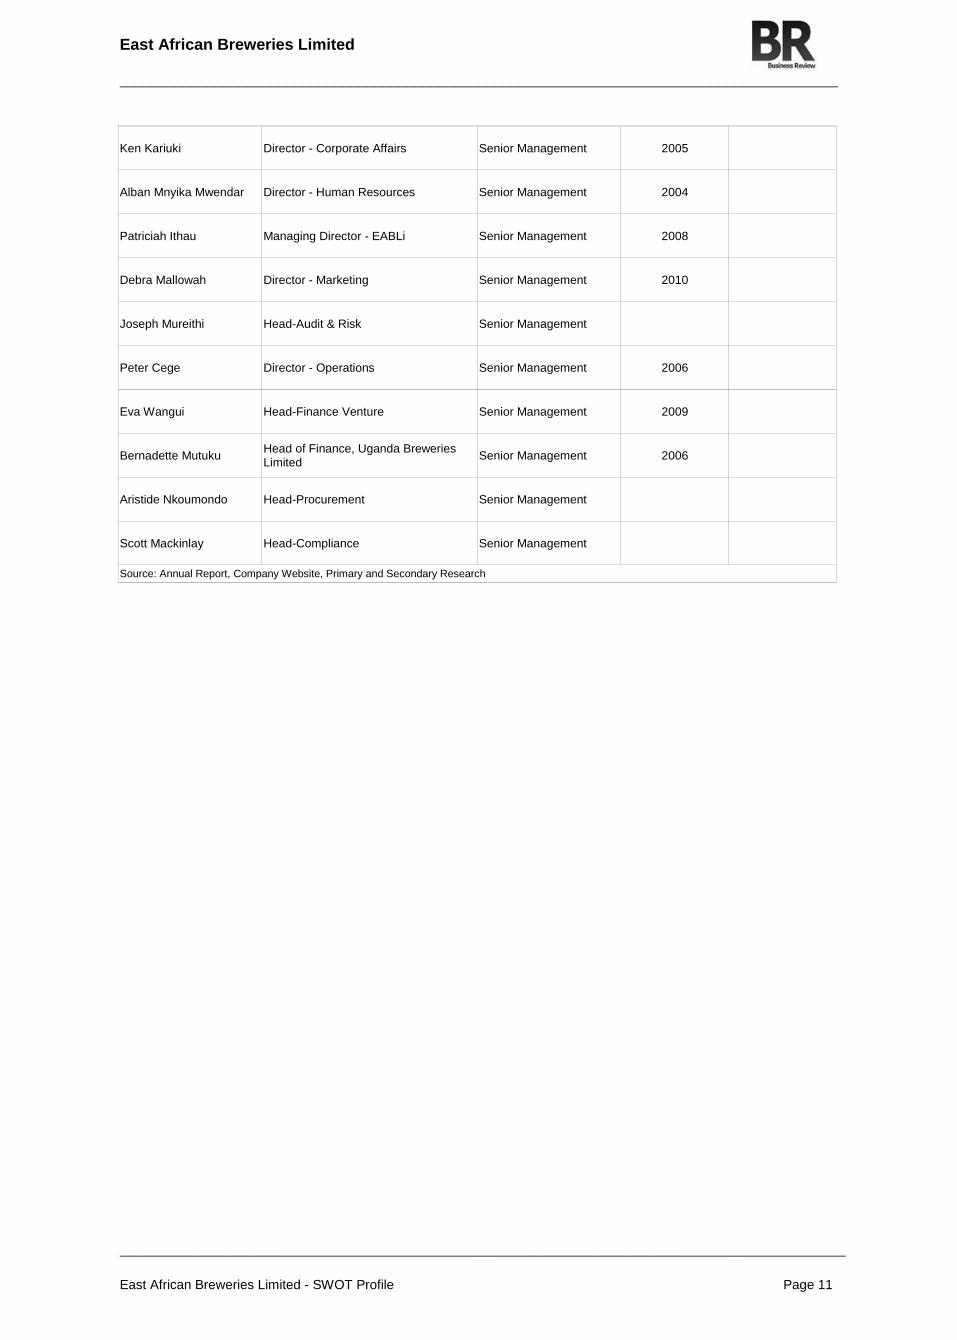
Ken Kariuki Director - Corporate Affairs Senior Management 2005
Alban Mnyika Mwendar Director - Human Resources Senior Management 2004
Patriciah Ithau Managing Director - EABLi Senior Management 2008
Debra Mallowah Director - Marketing Senior Management 2010
Joseph Mureithi Head-Audit & Risk Senior Management
Peter Cege Director - Operations Senior Management 2006
Eva Wangui Head-Finance Venture Senior Management 2009
Bernadette Mutuku Head of Finance, Uganda Breweries Limited
Senior Management 2006
Aristide Nkoumondo Head-Procurement Senior Management
Scott Mackinlay Head-Compliance Senior Management
Source: Annual Report, Company Website, Primary and Secondary Research

East African Breweries Limited
__________________________________________________________________________________________
___________________________________________________________________________________________
East African Breweries Limited - SWOT Profile Page 12
East African Breweries Limited - Key Employee Biographies
East African Breweries Limited, Key Employee Biographies
Jeremiah G. Kiereini Job Title : Chairman Board Level : Executive Board Since : 1988 Age : 81
Mr. Kiereini has been the Chairman of the company since 1988. Prior to this, he held various responsible positions in Kenya Civil Service for 30 years by culminating his appointment as the Chief Secretary, Head of Civil Service and the Secretary to the cabinet. Currently, he is a member of many boards which include Unga Group Limited, CMC Holdings group of companies, CFC/Stanbic Bank Limited, Heritage Insurance Company and CFC Life Insurance Company.
Source: Annual Report, Company Website, Primary and Secondary Research
East African Breweries Limited
__________________________________________________________________________________________
___________________________________________________________________________________________
East African Breweries Limited - SWOT Profile Page 13
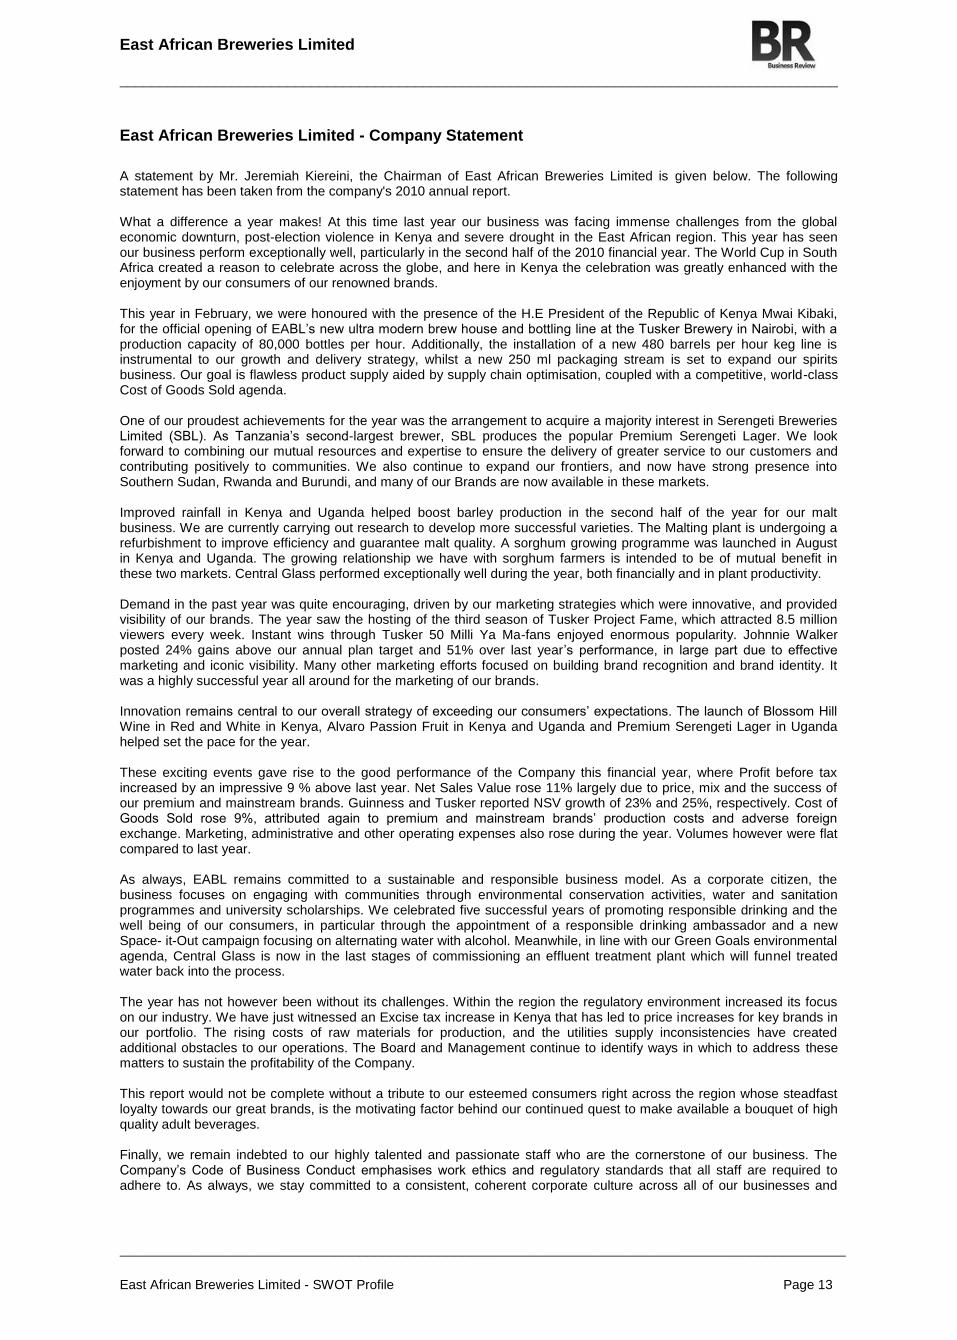
East African Breweries Limited - Company Statement
A statement by Mr. Jeremiah Kiereini, the Chairman of East African Breweries Limited is given below. The following statement has been taken from the company's 2010 annual report. What a difference a year makes! At this time last year our business was facing immense challenges from the global economic downturn, post-election violence in Kenya and severe drought in the East African region. This year has seen our business perform exceptionally well, particularly in the second half of the 2010 financial year. The World Cup in South Africa created a reason to celebrate across the globe, and here in Kenya the celebration was greatly enhanced with the enjoyment by our consumers of our renowned brands. This year in February, we were honoured with the presence of the H.E President of the Republic of Kenya Mwai Kibaki, for the official opening of EABL’s new ultra modern brew house and bottling line at the Tusker Brewery in Nairobi, with a production capacity of 80,000 bottles per hour. Additionally, the installation of a new 480 barrels per hour keg line is instrumental to our growth and delivery strategy, whilst a new 250 ml packaging stream is set to expand our spirits business. Our goal is flawless product supply aided by supply chain optimisation, coupled with a competitive, world-class Cost of Goods Sold agenda. One of our proudest achievements for the year was the arrangement to acquire a majority interest in Serengeti Breweries Limited (SBL). As Tanzania’s second-largest brewer, SBL produces the popular Premium Serengeti Lager. We look forward to combining our mutual resources and expertise to ensure the delivery of greater service to our customers and contributing positively to communities. We also continue to expand our frontiers, and now have strong presence into Southern Sudan, Rwanda and Burundi, and many of our Brands are now available in these markets. Improved rainfall in Kenya and Uganda helped boost barley production in the second half of the year for our malt business. We are currently carrying out research to develop more successful varieties. The Malting plant is undergoing a refurbishment to improve efficiency and guarantee malt quality. A sorghum growing programme was launched in August in Kenya and Uganda. The growing relationship we have with sorghum farmers is intended to be of mutual benefit in these two markets. Central Glass performed exceptionally well during the year, both financially and in plant productivity. Demand in the past year was quite encouraging, driven by our marketing strategies which were innovative, and provided visibility of our brands. The year saw the hosting of the third season of Tusker Project Fame, which attracted 8.5 million viewers every week. Instant wins through Tusker 50 Milli Ya Ma-fans enjoyed enormous popularity. Johnnie Walker posted 24% gains above our annual plan target and 51% over last year’s performance, in large part due to effective marketing and iconic visibility. Many other marketing efforts focused on building brand recognition and brand identity. It was a highly successful year all around for the marketing of our brands. Innovation remains central to our overall strategy of exceeding our consumers’ expectations. The launch of Blossom Hill Wine in Red and White in Kenya, Alvaro Passion Fruit in Kenya and Uganda and Premium Serengeti Lager in Uganda helped set the pace for the year. These exciting events gave rise to the good performance of the Company this financial year, where Profit before tax increased by an impressive 9 % above last year. Net Sales Value rose 11% largely due to price, mix and the success of our premium and mainstream brands. Guinness and Tusker reported NSV growth of 23% and 25%, respectively. Cost of Goods Sold rose 9%, attributed again to premium and mainstream brands’ production costs and adverse foreign exchange. Marketing, administrative and other operating expenses also rose during the year. Volumes however were flat compared to last year. As always, EABL remains committed to a sustainable and responsible business model. As a corporate citizen, the business focuses on engaging with communities through environmental conservation activities, water and sanitation programmes and university scholarships. We celebrated five successful years of promoting responsible drinking and the well being of our consumers, in particular through the appointment of a responsible drinking ambassador and a new Space- it-Out campaign focusing on alternating water with alcohol. Meanwhile, in line with our Green Goals environmental agenda, Central Glass is now in the last stages of commissioning an effluent treatment plant which will funnel treated water back into the process. The year has not however been without its challenges. Within the region the regulatory environment increased its focus on our industry. We have just witnessed an Excise tax increase in Kenya that has led to price increases for key brands in our portfolio. The rising costs of raw materials for production, and the utilities supply inconsistencies have created additional obstacles to our operations. The Board and Management continue to identify ways in which to address these matters to sustain the profitability of the Company. This report would not be complete without a tribute to our esteemed consumers right across the region whose steadfast loyalty towards our great brands, is the motivating factor behind our continued quest to make available a bouquet of high quality adult beverages. Finally, we remain indebted to our highly talented and passionate staff who are the cornerstone of our business. The Company’s Code of Business Conduct emphasises work ethics and regulatory standards that all staff are required to adhere to. As always, we stay committed to a consistent, coherent corporate culture across all of our businesses and
East African Breweries Limited
__________________________________________________________________________________________
___________________________________________________________________________________________
East African Breweries Limited - SWOT Profile Page 14
markets. We strive to build a zero-harm culture, provide ongoing training and support active engagement with all stakeholders to ensure success every day, in everything that we do.
East African Breweries Limited
__________________________________________________________________________________________
___________________________________________________________________________________________
East African Breweries Limited - SWOT Profile Page 15
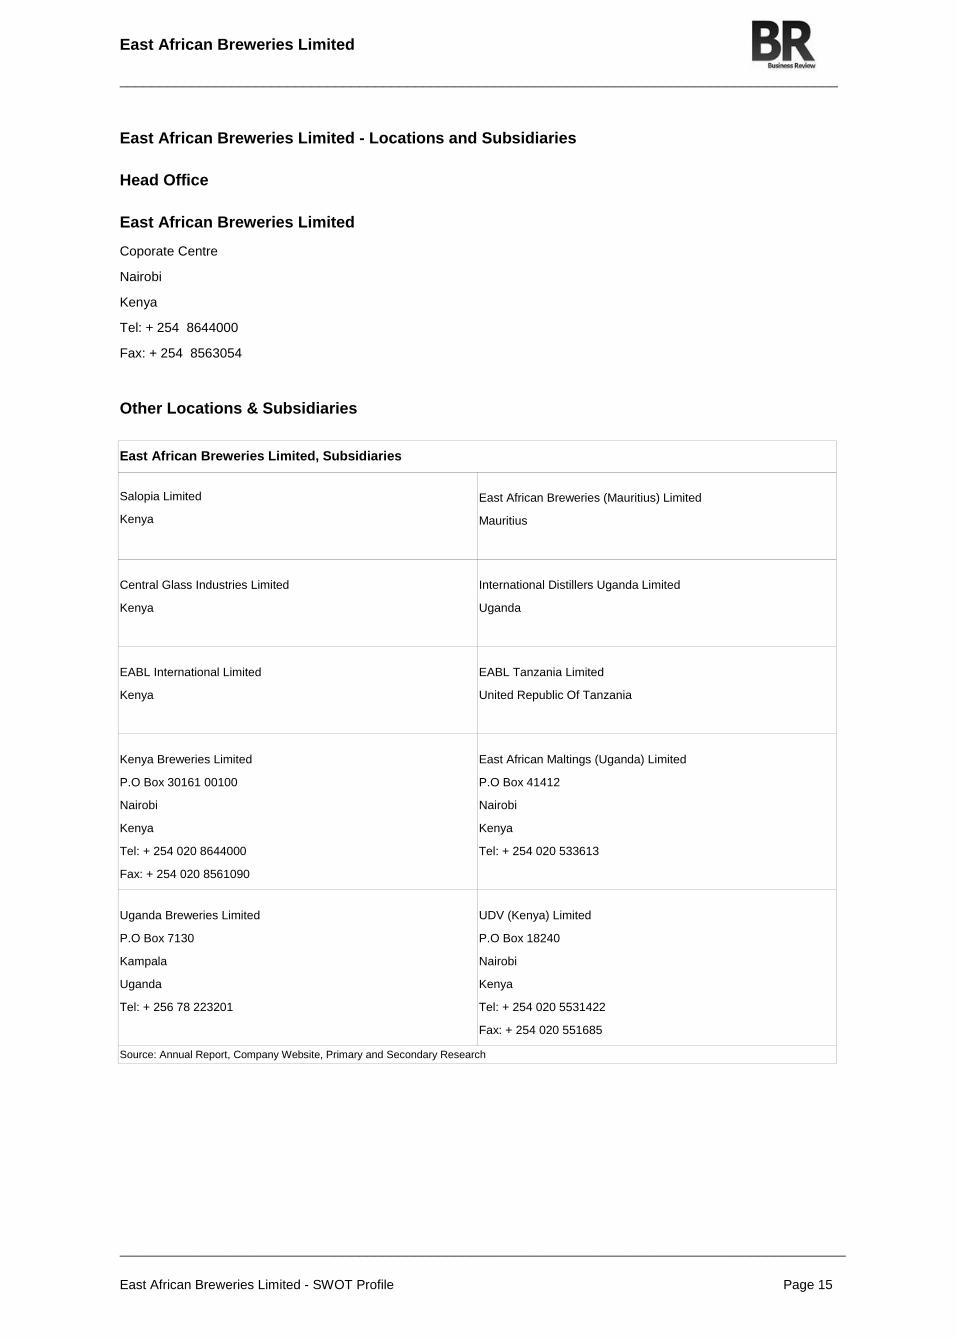
East African Breweries Limited - Locations and Subsidiaries
Head Office
East African Breweries Limited
Coporate Centre
Nairobi
Kenya
Tel: + 254 8644000
Fax: + 254 8563054
Other Locations & Subsidiaries
East African Breweries Limited, Subsidiaries
Salopia Limited
Kenya
East African Breweries (Mauritius) Limited
Mauritius
Central Glass Industries Limited
Kenya
International Distillers Uganda Limited
Uganda
EABL International Limited
Kenya
EABL Tanzania Limited
United Republic Of Tanzania
Kenya Breweries Limited
P.O Box 30161 00100
Nairobi
Kenya
Tel: + 254 020 8644000
Fax: + 254 020 8561090
East African Maltings (Uganda) Limited
P.O Box 41412
Nairobi
Kenya
Tel: + 254 020 533613
Uganda Breweries Limited
P.O Box 7130
Kampala
Uganda
Tel: + 256 78 223201
UDV (Kenya) Limited
P.O Box 18240
Nairobi
Kenya
Tel: + 254 020 5531422
Fax: + 254 020 551685
Source: Annual Report, Company Website, Primary and Secondary Research

East African Breweries Limited
__________________________________________________________________________________________
___________________________________________________________________________________________
East African Breweries Limited - SWOT Profile Page 16
East African Breweries Limited - Financial Ratios
Financial Ratios - Annual Ratios
East African Breweries Limited, Annual Ratios
Key Ratios Unit/Currency 2010 2009 2008 2007 2006
Equity Ratios
EPS (Earnings per Share) KES 9.09 9.55 7.76 8.18
Dividend per Share KES 8.05 8.05 7.34 5.9
Dividend Cover Absolute 1.13 1.19 1.06 1.39
Book Value per Share KES 26.08 25.27 28.53 25.63
Profitability Ratios
Gross Margin % 50.36 53.81 55.12 62.23
Operating Margin % 30.46 33.5 36.62 37.94
Net Profit Margin % 20.89 23.25 23.71 25.79
Profit Markup % 101.46 116.49 122.82 164.78
PBT Margin (Profit Before Tax) % 34.84 37.91 41.11 41.02
Return on Equity % 34.86 37.81 32.62 31.92
Return on Capital Employed % 39.7 44.63 41.37 38.71
Return on Assets % 20.06 22.72 19.72 21.76
Return on Fixed Assets % 62.05 69.24 72.86 72.72
Return on Working Capital % 110.22 125.58 95.71 82.78
Growth Ratios
Sales Growth % 5.91 25.58 23.74 8.97
Operating Income Growth % -3.7 14.88 19.43 5.82
EBITDA Growth % -2.66 15.8 15.55 1.85
Net Income Growth % -4.84 23.16 13.74 13.05
EPS Growth % -0.1 29.46 0.01 10.3
Working Capital Growth % 9.72 -12.45 3.31 10.66
Cost Ratios
Operating Costs (% of Sales) % 69.54 66.5 63.38 62.06
Administration Costs (% of Sales) % 17.3 18.46 17.54 23.16
Liquidity Ratios
Current Ratio Absolute 2.01 1.98 2.21 3.23
Quick Ratio Absolute 1.27 1.31 1.54 2.29
Cash Ratio Absolute 0.7 0.81 0.98 1.61
Leverage Ratios
Net Debt to Equity % 5.93 3.33 5.76 4.76
Efficiency Ratios
Asset Turnover Absolute 0.96 0.98 0.83 0.84
Fixed Asset Turnover Absolute 2.51 2.6 2.51 2.29
Inventory Turnover Absolute 2.46 2.53 2.13 1.95
Current Asset Turnover Absolute 1.82 1.85 1.43 1.51
Capital Employed Turnover Absolute 1.67 1.63 1.38 1.24
Working Capital Turnover Absolute 3.62 3.75 2.61 2.18
Revenue per Employee KES 28,962,723

East African Breweries Limited
__________________________________________________________________________________________
___________________________________________________________________________________________
East African Breweries Limited - SWOT Profile Page 17
Net Income per Employee KES 6,050,948
Capex to Sales % 7.43 9.38 11.21 10.07
R&D to Sales % 0.28 0.29
Source: Annual Report, Company Website, Primary and Secondary Research

East African Breweries Limited
__________________________________________________________________________________________
___________________________________________________________________________________________
East African Breweries Limited - SWOT Profile Page 18
East African Breweries Limited - Financial Ratios
Financial Ratios - Interim Ratios
East African Breweries Limited, Interim Ratios
Key Ratios Unit/Currency Jun-2010 Dec-2009 Jun-2009 Dec-2008
Equity Ratios
Interim EPS (Earnings per Share) KES 4.41 4.67 3.96 5.13
Book Value per Share KES 26.32 25.69 25.04 29.69
Profitability Ratios
Gross Margin % 50.05 50.81 50.15 50.55
Operating Margin % 29.34 29.97 27.95 32.73
Net Profit Margin % 18.02 19.83 19.22 22.4
Profit Markup % 100.19 103.29 100.61 102.24
PBT Margin (Profit Before Tax) % 32.84 33.38 32.03 37.38
Cost Ratios
Operating Costs (% of Sales) % 70.66 70.03 72.05 67.27
Administration Costs (% of Sales) % 20.37 18.64 17.04 17.53
Liquidity Ratios
Current Ratio Absolute 1.49 1.67 1.69 1.76
Quick Ratio Absolute 1.2 1.05 1.27 1.17
Leverage Ratios
Net Debt to Equity % 6.37 6.98 6.18 6.01
Source: Annual Report, Company Website, Primary and Secondary Research
East African Breweries Limited
__________________________________________________________________________________________
___________________________________________________________________________________________
East African Breweries Limited - SWOT Profile Page 19
Financial Ratios - Ratio Charts
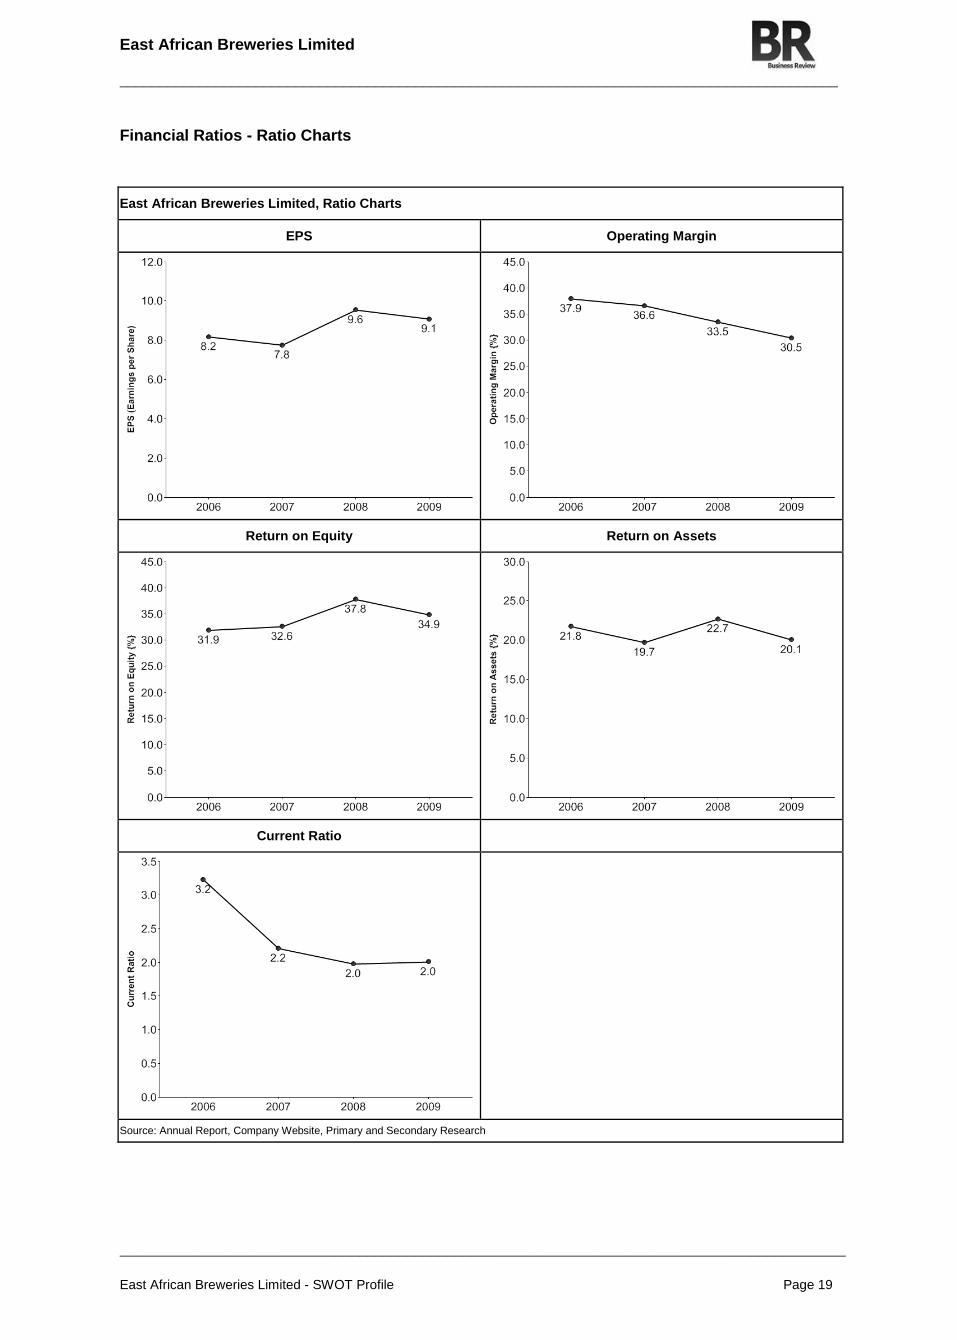
East African Breweries Limited, Ratio Charts
EPS Operating Margin
Return on Equity Return on Assets
Current Ratio
Source: Annual Report, Company Website, Primary and Secondary Research

East African Breweries Limited
__________________________________________________________________________________________
___________________________________________________________________________________________
East African Breweries Limited - SWOT Profile Page 20
Appendix
Methodology
Progressive Digital Media company reports are based on a core set of research techniques which ensure the best
possible level of quality and accuracy of data. The key sources used include:
Company Websites
Company Annual Reports
SEC Filings
Press Releases
Proprietary Databases
Notes
Financial information of the company is taken from the most recently published annual reports or SEC filings
The financial and operational data reported for the company is as per the industry defined standards
Revenue converted to USD at average annual conversion rate as of fiscal year end
Ratio Definitions
Capital Market Ratios
Capital Market Ratios measure investor response to owning a company's stock and also the cost of issuing stock.
Price/Earnings Ratio (P/E)
Price/Earnings (P/E) ratio is a measure of the price paid for a share relative to the annual income earned per share. It is a financial ratio used for valuation: a higher P/E ratio means that investors are paying more for each unit of income, so the stock is more expensive compared to one with lower P/E ratio. A high P/E suggests that investors are expecting higher earnings growth in the future compared to companies with a lower P/E. Price per share is as of previous business close, and EPS is from latest annual report. Formula: Price per Share / Earnings per Share
Enterprise Value/Earnings before Interest, Tax, Depreciation & Amortization (EV/EBITDA)
Enterprise Value/EBITDA (EV/EBITDA) is a valuation multiple that is often used in parallel with, or as an alternative to, the P/E ratio. The main advantage of EV/EBITDA over the PE ratio is that it is unaffected by a company's capital structure. It compares the value of a business, free of debt, to earnings before interest. Price per share is as of previous business close, and shares outstanding last reported. Other items are from latest annual report. Formula: (Market Cap + Debt + Preferred Stock - Cash & Cash Equivalents) / (Net Income + Interest + Tax + Depreciation + Amortization)
Enterprise Value/Sales
Enterprise Value/Sales (EV/Sales) is a ratio that provides an idea of how much it costs to buy the company's sales. EV/Sales is seen as more accurate than Price/Sales because market capitalization does not take into account the amount of debt a company has, which needs to be paid back at some point. Price per share is as of previous business close, and shares outstanding last reported. Other items are from latest annual report. Formula: (Market Cap + Debt + Preferred Stock - Cash & Cash Equivalents) / Sales
Enterprise Value/Operating Profit
Enterprise Value/Operating Profit measures the company's enterprise value to the operating profit. Price per share is as of previous business close, and shares outstanding last reported. Other items are from latest annual report. Formula: (Market Cap + Debt + Preferred Stock - Cash & Cash Equivalents) / Operating Income
Enterprise Value/Total Assets
Enterprise Value/Total Assets measures the company's enterprise value to the total assets. Price per share is as of previous business close, and shares outstanding last
East African Breweries Limited
__________________________________________________________________________________________
___________________________________________________________________________________________
East African Breweries Limited - SWOT Profile Page 21
reported. Other items are from latest annual report. Formula: (Market Cap + Debt + Preferred Stock - Cash & Cash Equivalents) / Total Assets
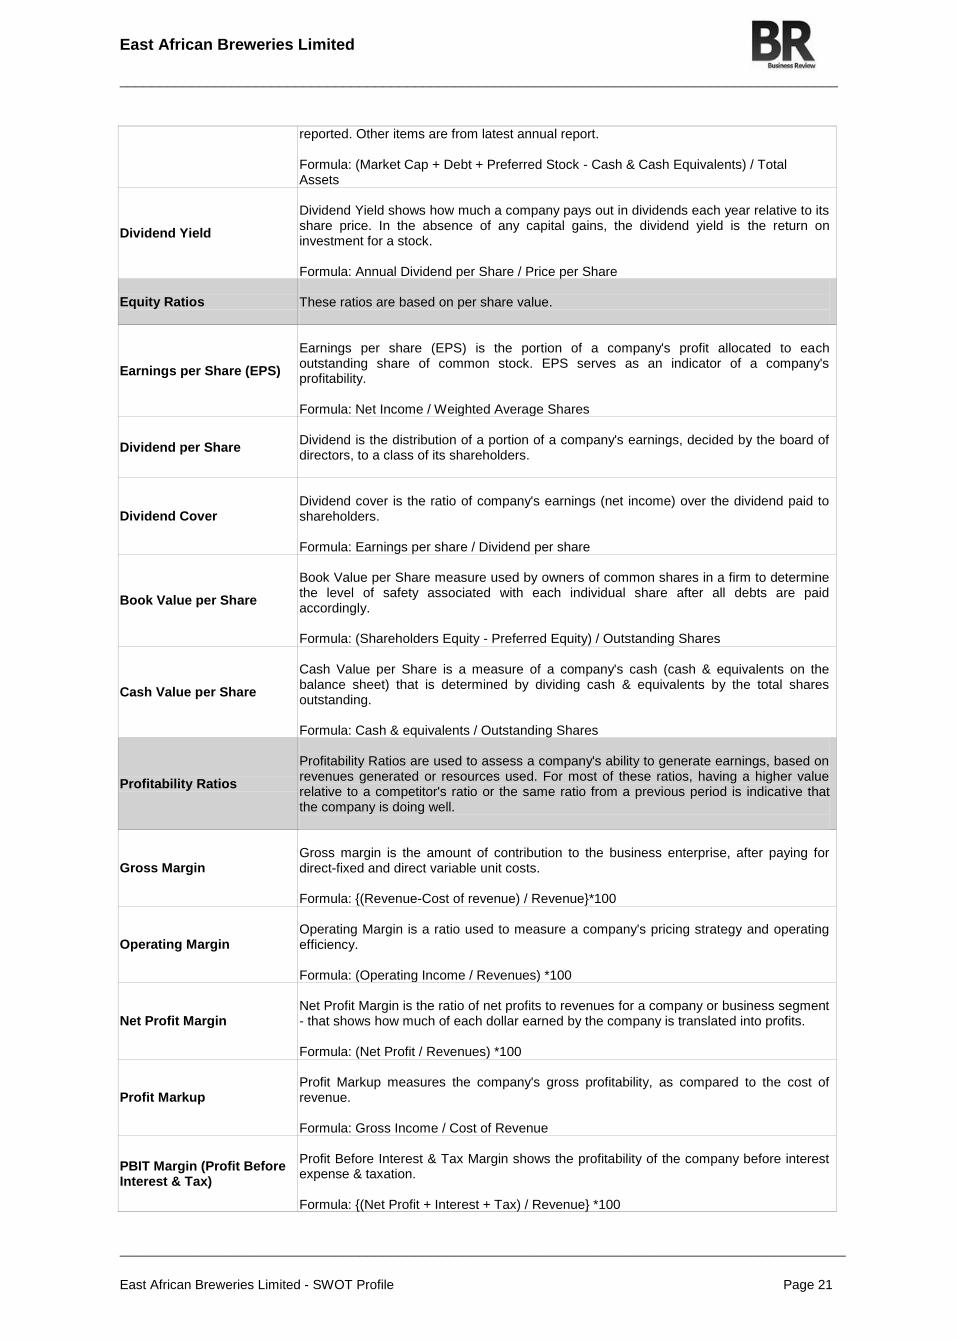
Dividend Yield
Dividend Yield shows how much a company pays out in dividends each year relative to its share price. In the absence of any capital gains, the dividend yield is the return on investment for a stock. Formula: Annual Dividend per Share / Price per Share
Equity Ratios These ratios are based on per share value.
Earnings per Share (EPS)
Earnings per share (EPS) is the portion of a company's profit allocated to each outstanding share of common stock. EPS serves as an indicator of a company's profitability. Formula: Net Income / Weighted Average Shares
Dividend per Share
Dividend is the distribution of a portion of a company's earnings, decided by the board of directors, to a class of its shareholders.
Dividend Cover
Dividend cover is the ratio of company's earnings (net income) over the dividend paid to shareholders. Formula: Earnings per share / Dividend per share
Book Value per Share
Book Value per Share measure used by owners of common shares in a firm to determine the level of safety associated with each individual share after all debts are paid accordingly. Formula: (Shareholders Equity - Preferred Equity) / Outstanding Shares
Cash Value per Share
Cash Value per Share is a measure of a company's cash (cash & equivalents on the balance sheet) that is determined by dividing cash & equivalents by the total shares outstanding. Formula: Cash & equivalents / Outstanding Shares
Profitability Ratios
Profitability Ratios are used to assess a company's ability to generate earnings, based on revenues generated or resources used. For most of these ratios, having a higher value relative to a competitor's ratio or the same ratio from a previous period is indicative that the company is doing well.
Gross Margin
Gross margin is the amount of contribution to the business enterprise, after paying for direct-fixed and direct variable unit costs. Formula: {(Revenue-Cost of revenue) / Revenue}*100
Operating Margin
Operating Margin is a ratio used to measure a company's pricing strategy and operating efficiency. Formula: (Operating Income / Revenues) *100
Net Profit Margin
Net Profit Margin is the ratio of net profits to revenues for a company or business segment - that shows how much of each dollar earned by the company is translated into profits. Formula: (Net Profit / Revenues) *100
Profit Markup
Profit Markup measures the company's gross profitability, as compared to the cost of revenue. Formula: Gross Income / Cost of Revenue
PBIT Margin (Profit Before Interest & Tax)
Profit Before Interest & Tax Margin shows the profitability of the company before interest expense & taxation. Formula: {(Net Profit + Interest + Tax) / Revenue} *100

East African Breweries Limited
__________________________________________________________________________________________
___________________________________________________________________________________________
East African Breweries Limited - SWOT Profile Page 22
PBT Margin (Profit Before Tax)
Profit Before Tax Margin measures the pre-tax income over revenues. Formula: {Income Before Tax / Revenues} *100
Return on Equity
Return on Equity measures the rate of return on the ownership interest (shareholders' equity) of the common stock owners. Formula: (Net Income / Shareholders Equity)*100
Return on Capital Employed
Return on Capital Employed is a ratio that indicates the efficiency and profitability of a company's capital investments. ROCE should always be higher than the rate at which the company borrows; otherwise any increase in borrowing will reduce shareholders' earnings. Formula: EBIT / (Total Assets – Current Liabilities)*100
Return on Assets
Return on Assets is an indicator of how profitable a company is relative to its total assets, the ratio measures how efficient management is at using its assets to generate earnings. Formula: (Net Income / Total Assets)*100
Return on Fixed Assets
Return on Fixed Assets measures the company's profitability to its fixed assets (property, plant & equipment). Formula: (Net Income / Fixed Assets) *100
Return on Working Capital
Return on Working Capital measures the company's profitability to its working capital. Formula: (Net Income / Working Capital) *100
Cost Ratios
Cost ratios help to understand the costs the company is incurring as a percentage of sales.
Operating costs (% of Sales)
Operating costs as percentage of total revenues measures the operating costs that a company incurs compared to the revenues. Formula: (Operating Expenses / Revenues) *100
Administration costs (% of Sales)
Administration costs as percentage of total revenue measures the selling, general and administrative expenses that a company incurs compared to the revenues. Formula: (Administrative Expenses / Revenues) *100
Interest costs (% of Sales)
Interest costs as percentage of total revenues measures the interest expense that a company incurs compared to the revenues. Formula: (Interest Expenses / Revenues) *100
Leverage Ratios
Leverage ratios are used to calculate the financial leverage of a company to get an idea of the company's methods of financing or to measure its ability to meet financial obligations. There are several different ratios, but the main factors looked at include debt, equity, assets and interest expenses.
Debt to Equity Ratio
Debt to Equity Ratio is a measure of a company's financial leverage. The debt/equity ratio also depends on the industry in which the company operates. For example, capital-intensive industries tend to have a higher debt equity ratio. Formula: Total Liabilities / Shareholders Equity
Debt to Capital Ratio
Debt to capital ratio gives an idea of a company's financial structure, or how it is financing its operations, along with some insight into its financial strength. The higher the debt-to-capital ratio, the more debt the company has compared to its equity. This indicates to investors whether a company is more prone to using debt financing or equity financing. A company with high debt-to-capital ratios, compared to a general or industry average, may show weak financial strength because the cost of these debts may weigh on the company and increase its default risk. Formula: {Total Debt / (Total assets - Current Liabilities)}
East African Breweries Limited
__________________________________________________________________________________________
___________________________________________________________________________________________
East African Breweries Limited - SWOT Profile Page 23
Interest Coverage Ratio
Interest Coverage Ratio is used to determine how easily a company can pay interest on outstanding debt, calculated as earnings before interest & tax by interest expense. Formula: EBIT / Interest Expense
Liquidity Ratios
Liquidity ratios are used to determine a company's ability to pay off its short-terms debts obligations. Generally, the higher the value of the ratio, the larger the margin of safety that the company possesses to cover short-term debts. A company's ability to turn short-term assets into cash to cover debts is of the utmost importance when creditors are seeking payment. Bankruptcy analysts and mortgage originators frequently use the liquidity ratios to determine whether a company will be able to continue as a going concern.
Current Ratio
Current Ratio measures a company's ability to pay its short-term obligations. The ratio gives an idea of the company's ability to pay back its short-term liabilities (debt and payables) with its short-term assets (cash, inventory, receivables). The higher the current ratio, the more capable the company is of paying its obligations. A ratio under 1 suggests that the company would be unable to pay off its obligations if they came due at that point. Formula: Current Assets / Current Liabilities
Quick Ratio
Quick ratio measures a company's ability to meet its short-term obligations with its most liquid assets. Formula: (Current Assets - Inventories) / Current Liabilities
Cash Ratio
Cash ratio is the most stringent and conservative of the three short-term liquidity ratio. It only looks at the most liquid short-term assets of the company, which are those that can be most easily used to pay off current obligations. It also ignores inventory and receivables, as there are no assurances that these two accounts can be converted to cash in a timely matter to meet current liabilities. Formula: {(Cash & Bank Balance + Marketable Securities) / Current Liabilities)}
Efficiency Ratios
Efficiency ratios measure a company's effectiveness in various areas of its operations, essentially looking at maximizing its use of resources.
Fixed Asset Turnover
Fixed Asset Turnover ratio indicates how well the business is using its fixed assets to generate sales. A higher ratio indicates the business has less money tied up in fixed assets for each currency unit of sales revenue. A declining ratio may indicate that the business is over-invested in plant, equipment, or other fixed assets. Formula: Net Sales / Fixed Assets
Asset Turnover
Asset turnover ratio measures the efficiency of a company's use of its assets in generating sales revenue to the company. A higher asset turnover ratio shows that the company has been more effective in using its assets to generate revenues. Formula: Net Sales / Total Assets
Current Asset Turnover
Current Asset Turnover indicates how efficiently the business uses its current assets to generate sales. Formula: Net Sales / Current Assets
Inventory Turnover
Inventory Turnover ratio shows how many times a company's inventory is sold and replaced over a period. A low turnover implies poor sales and, therefore, excess inventory. A high ratio implies either strong sales or ineffective buying. Formula: Cost of Goods Sold / Inventory
Working Capital Turnover
Working Capital Turnover is a measurement to compare the depletion of working capital to the generation of sales. This provides some useful information as to how effectively a company is using its working capital to generate sales. Formula: Net Sales / Working Capital
Capital Employed Turnover
Capital employed turnover ratio measures the efficiency of a company's use of its equity in generating sales revenue to the company.

East African Breweries Limited
__________________________________________________________________________________________
___________________________________________________________________________________________
East African Breweries Limited - SWOT Profile Page 24
Formula: Net Sales / Shareholders Equity
Capex to sales
Capex to Sales ratio measures the company's expenditure (investments) on fixed and related assets' effectiveness when compared to the sales generated. Formula: (Capital Expenditure / Sales) *100
Net income per Employee
Net income per Employee looks at a company's net income in relation to the number of employees they have. Ideally, a company wants a higher profit per employee possible, as it denotes higher productivity. Formula: Net Income / No. of Employees
Revenue per Employee
Revenue per Employee measures the average revenue generated per employee of a company. This ratio is most useful when compared against other companies in the same industry. Generally, a company seeks the highest revenue per employee. Formula: Revenue / No. of Employees
Efficiency Ratio
Efficiency Ratio is used to calculate a bank's efficiency. An increase means the company is losing a larger percentage of its income to expenses. If the efficiency ratio is getting lower, it is good for the bank and its shareholders. Formula: Non-interest expense / Total Interest Income
Business Review
Disclaimer
All Rights Reserved
No part of this publication may be reproduced, stored in a retrieval system or transmitted in any form by any means,
electronic, mechanical, photocopying, recording or otherwise, without the prior permission of the publisher, Progressive
Digital Media.
The data and analysis within this report is driven by Progressive Digital Media from its own primary and secondary
research of public and proprietary sources and does not necessarily represent the views of the company profiled.
The facts of this report are believed to be correct at the time of publication but cannot be guaranteed. Please note that the
findings, conclusions and recommendations that Progressive Digital Media delivers will be based on information gathered
in good faith from both primary and secondary sources, whose accuracy we are not always in a position to guarantee. As
such Progressive Digital Media can accept no liability whatever for actions taken based on any information that may
subsequently prove to be incorrect.