east asia pacific economic update, april 2016: growing challenges
TRANSCRIPT

GrowingChallenges
WORLD BANK EAST ASIA AND PACIFIC ECONOMIC UPDATE APRIL 2016


WORLD BANK EAST ASIA AND PACIFIC ECONOMIC UPDATE APRIL 2016
Growing Challenges

© 2016 International Bank for Reconstruction and Development / The World Bank1818 H Street NW, Washington DC 20433Telephone: 202-473-1000; Internet: www.worldbank.org
Some rights reserved
1 2 3 4 18 17 16
This work is a product of the staff of The World Bank with external contributions. The findings, interpretations, and conclusions expressed in this work do not necessarily reflect the views of The World Bank, its Board of Executive Directors, or the governments they represent. The World Bank does not guarantee the accuracy of the data included in this work. The boundaries, colors, denominations, and other information shown on any map in this work do not imply any judgment on the part of The World Bank concerning the legal status of any territory or the endorsement or acceptance of such boundaries.
Nothing herein shall constitute or be considered to be a limitation upon or waiver of the privileges and immunities of The World Bank, all of which are specifically reserved.
Rights and Permissions
This work is available under the Creative Commons Attribution 3.0 IGO license (CC BY 3.0 IGO) http://creativecommons.org/licenses/by/3.0/igo. Under the Creative Commons Attribution license, you are free to copy, distribute, transmit, and adapt this work, including for commercial purposes, under the following conditions:
Attribution—Please cite the work as follows: World Bank. 2016. “Growing Challenges” East Asia and Pacific Economic Update (April), World Bank, Washington, DC. Doi: 10.1596/978-1-4648-0906-4. License: Creative Commons Attribution CC BY 3.0 IGO
Translations—If you create a translation of this work, please add the following disclaimer along with the attribution: This translation was not created by The World Bank and should not be considered an official World Bank translation. The World Bank shall not be liable for any content or error in this translation.
Adaptations—If you create an adaptation of this work, please add the following disclaimer along with the attribution: This is an adaptation of an original work by The World Bank. Responsibility for the views and opinions expressed in the adaptation rests solely with the author or authors of the adaptation and are not endorsed by The World Bank.
Third-party content—The World Bank does not necessarily own each component of the content contained within the work. The World Bank therefore does not warrant that the use of any third-party-owned individual component or part contained in the work will not infringe on the rights of those third parties. The risk of claims resulting from such infringement rests solely with you. If you wish to re-use a component of the work, it is your responsibility to determine whether permission is needed for that re-use and to obtain permission from the copyright owner. Examples of components can include, but are not limited to, tables, figures, or images.
All queries on rights and licenses should be addressed to the Publishing and Knowledge Division, The World Bank, 1818 H Street NW, Washington, DC 20433, USA; fax: 202-522-2625; e-mail: [email protected].
ISBN (electronic): 978-1-4648-0906-4DOI: 10.1596/978-1-4648-0906-4
Cover photo: Coming or Going? Phu My Port, Vietnam. © Eric Holcomb.

Contents
List of Abbreviations xv
Preface and Acknowledgments xviii
Executive Summary xx
Part I. Recent Developments and Outlook 1
I.A. Recent Developments 2Growth eased in China during the second half of 2015, in line with expectations, and remained relatively resilient in the larger Association of Southeast Asian Nations (ASEAN) economies 7
Poverty has continued to decline 13
External financing conditions tightened across EAP in 2015 and early 2016, as evidenced by volatility in portfolio flows, falls in equity markets, and increases in the cost of US dollar financing 16
Despite substantial depreciations against the US dollar, most major EAP exchange rates have been stable or appreciated in real effective terms since the start of 2015 21
Foreign exchange reserves declined in China and in the commodity exporters 22
Inflation remains low, due to declining fuel and commodity prices, slowing domestic demand, and excess capacity in some sectors and economies 23
Exports from EAP countries remain weak, particularly in values terms, but current account balances have generally improved as a result of import compression 25
Fiscal space has become more limited in most EAP economies, with lower commodity prices posing a major budgetary challenge for commodity producers 28
Monetary policy remains accommodative overall in the region, with growth the main focus for the majority of central banks 36
Credit growth accelerated in China but slowed in most other countries in 2015 37
Recent developments in the Pacific Island Countries 38
References 39
I.B. Outlook and Risks 40Regional growth will moderate as China continues to rebalance, and the recovery in high-income economies remains fragile 40
Compared with recent years, poverty is projected to decline at a slightly slower pace in China, but at a similar pace in the rest of developing EAP 50
The level of uncertainty around growth and poverty projections is high, with the risk that outcomes may be worse than expected 51
A weaker-than-expected recovery in high-income economies, or a faster-than-expected slowdown in China, would lower growth in the rest of developing EAP 52
Further downward pressure on commodity prices would hit budget balances and real activity in commodity exporters, but should boost growth in EAP overall 55
A resurgence of financial market volatility and rapid tightening of financial conditions could have negative effects on real activity 56
GROWING CHALLENGES
LISTS oF CoNTENTS III

outlook and risks for the Pacific Island Countries 57
References 59
I.C. Policy Considerations 60China faces a difficult short-term balancing act—lowering leverage and reducing overcapacity while facilitating a gradual slowdown 61
Across much of the rest of the region, the room for policy maneuver has shrunk 62
Especially in commodity exporters, there is less scope for governments to support domestic demand through increased expenditure, and more urgency in boosting domestic revenue to preserve fiscal space 62
Exchange rate flexibility will generally help buffer shocks, but balance sheet risks need to be contained, while maintaining incentives to reduce external leverage 67
Monetary policy should remain accommodative, but scope for further easing is increasingly constrained by the need to reduce leverage and maintain financial stability 68
Structural reforms to boost potential output are even more critical, given the risks to the growth outlook and the limited room for expansionary macroeconomic policies 69
The Pacific Island Countries must take advantage of available growth opportunities and ensure longer-term fiscal sustainability 75
Governments should continue to focus on promoting inclusive growth, including by investing in people and insuring them against the risk of falling back into poverty 79
References 82
Part II. Medium-Term Development Agenda 83
II.A. GovernanceforSustainedGrowthinEastAsiaandPacific:PrioritiesandIndicators 84Looking Back: The East Asian Paradox 84
Looking forward: measuring governance for growth at the middle-income level 93
Conclusion 105
References 107
II.B. TheTrans-PacificPartnershipanditsPotentialEconomicImplicationsforDevelopingEastAsiaandPacific 112What Is the TPP and Why Is It Important? 112
What Makes the TPP a “New Generation” Trade Agreement 115
The Potential Impact on Market Access in East Asia 120
Quantitative Assessment of the Economic Implications of the TPP 132
Potential impact on TPP member countries 133
Potential impact on nonmember countries 134
overall sector-specific impacts 136
The TPP and the Way Forward for Deeper Trade and Investment Integration in Developing East Asia 138
Annex 140
References 141
Contents continued
EAST ASIA AND PACIFIC ECONOMIC UPDATE APRIL 2016
Iv LISTS oF CoNTENTS

II.C. ReapingDigitalDividendsinEastAsiaandPacific 144Rapid digital transformation 144
Persistent digital divides 147
Digital technologies: growth accelerator and net job creators in EAP? 148
Digital technologies and growth 150
Digital technologies and jobs 156
References 168
Part III. Country Pages and Key Indicators 171Cambodia 172
China 175
Fiji 179
Indonesia 182
Lao PDR 186
Malaysia 189
Mongolia 192
Myanmar 195
Papua New Guinea 198
Philippines 201
Small Pacific Island Countries 204
Solomon Islands 209
Thailand 212
Timor-Leste 215
Vietnam 218
Contents continued
GROWING CHALLENGES
LISTS oF CoNTENTS v

List of Figures
Part I. Recent Developments and Outlook
I.A. Recent DevelopmentsFigure I.A.1. In 2015, growth eased in China, but was similar to the pace in 2014 in the rest of
the region 5
Figure I.A.2. Growth was relatively resilient in most developing EAP economies in 2015; downward revisions were smaller than in many other large emerging markets 5
Figure I.A.3. US dollar (Emerging Market Bond Index) bond spreads in developing EAP countries rose in late 2015 and early 2016 and then declined, while generally remaining well below emerging market benchmarks. 6
Figure I.A.4. Developing EAP equity markets declined in late 2015 and then in most cases subsequently recovered, although the swings in other large emerging markets were typically larger 6
Figure I.A.5. The rebalancing of Chinese production toward services continued in 2015, though finance and insurance accounted for a large share of the growth in services 11
Figure I.A.6. Growth eased in Indonesia, Malaysia, and the Philippines in 2015, but showed signs of a pickup in the second half of the year 11
Figure I.A.7. Consumption continues to underpin growth in the large developing ASEAN economies, while fixed asset investment and exports are generally making a smaller growth contribution than in the past 12
Figure I.A.8. Manufacturing PMIs remain in contractionary territory in China, Indonesia, and Malaysia 13
Figure I.A.9. Poverty has declined substantially in developing EAP over the past decade 14
Figure I.A.10. Portfolio inflows softened over 2015, but showed signs of recovery in the fourth quarter in some countries 16
Figure I.A.11. Nonresident holdings of domestic debt securities have been stable in Indonesia and Malaysia, but declined in Thailand 16
Figure I.A.12. Most equity markets in the region declined in late 2015 and early 2016, but have recovered or at least stabilized more recently 20
Figure I.A.13. Local currency government bond yields have declined recently in Indonesia, Malaysia, and Thailand 20
Figure I.A.14. Outbound FDI from China increased markedly in 2015 21
Figure I.A.15. Net FDI flows declined in Indonesia and Thailand during 2015 21
Figure I.A.16. After weakening sharply against the US dollar in mid-2015, most exchange rates have since recovered at least partially 21
Figure I.A.17. Major EAP currencies have fallen sharply against the US dollar over the past year, but adjusted more moderately in trade-weighted terms 22
Figure I.A.18. In real trade-weighted terms, exchange rates are generally around their early 2015 levels, with the exceptions of Malaysia and Thailand 22
Figure I.A.19. China’s foreign currency reserves have declined since their peak in June 2014 23
Figure I.A.20. International reserves also fell in 2015 in Malaysia and Indonesia 23
Figure I.A.21. Global commodity prices continued to decline 24
EAST ASIA AND PACIFIC ECONOMIC UPDATE APRIL 2016
vI LISTS oF CoNTENTS
Figure I.A.22. Lower oil prices contributed to lower inflation in EAP over 2015 24
Figure I.A.23. Producer prices, have continued to decline, particularly in China 24
Figure I.A.24. In most of the larger EAP economies, inflation has remained low and relatively stable over the past year 25
Figure I.A.25. In Mongolia, policy tightening helped to rein in inflation, while Myanmar saw rapid inflation due to the effects of flooding and exchange rate depreciation 25
Figure I.A.26. EAP export volume growth slowed further in H2 2015, from an already modest pace 26
Figure I.A.27. Export volumes have been little changed across the larger EAP economies over the past year 26
Figure I.A.28. In developing Asia, export values have declined much more than volumes 26
Figure I.A.29. This has mainly reflected large falls in export values, but not volumes, in commodity exporters 26
Figure I.A.30. Current account balances rose or remained steady in the major EAP economies, except in Malaysia 27
Figure I.A.31. Mongolia’s current account deficit narrowed rapidly, as imports fell 27
Figure I.A.32. Fiscal deficits have narrowed significantly in Malaysia and the Philippines 28
Figure I.A.33. Government debt remains moderate in Indonesia and Thailand, but is rising rapidly in Vietnam and relatively high in Malaysia 28
Figure I.A.34. Nominal policy rates were flat or trended lower in 2015, led by China 36
Figure I.A.35. Real policy rates have fallen since their recent (2014) highs, but remain generally close to or above long-term averages 36
Figure I.A.36. Credit conditions in real terms eased or remained slow relative to recent averages, with the exceptions of China and Vietnam 37
I.B. Outlook and RisksFigure I.B.1. Domestic consumption is projected to continue underpinning GDP growth, while
exports will make a relatively small contribution to growth in the near term 44
Figure I.B.2. Commodity price forecasts have been revised downward over the past two years, and are projected to remain close to recent levels through 2018 49
Figure I.B.3. China is the most important trade partner for some of the smaller countries in EAP, but for the ASEAN-5 the major high-income countries (as a group) are a significantly larger source of external demand 52
Figure I.B.4. Domestic value added embodied in foreign final domestic demand 53
Figure I.B.5. Nonfinancial private sector credit is higher and has risen more quickly in China than in other countries, driven by increasing corporate debt 54
Figure I.B.6. Spillovers from China to other countries in EAP 55
Figure I.B.7. Household debt is elevated in Malaysia and Thailand, and almost all nonfinancial private sector credit is obtained from banks 57
Figure I.B.8. Reserves of the major developing Asian economies remain broadly adequate, with key ratios generally in line with longer-term averages 57
List of Figures continued
GROWING CHALLENGES
LISTS oF CoNTENTS vII

Part II. Medium-Term Development Agenda
II.A. GovernanceforSustainedGrowthinEastAsiaandPacific:PrioritiesandIndicatorsFigure II.A.1. Average growth rates, 1981–2011, and measures of political liberties, voice, and
accountability 85
Figure II.A.2. Average growth rates and corruption scores 86
Figure II.A.3. Average GDP per capita growth rates, 1981–2011, and the age of the governing party, 2010 88
Figure II.A.4. Minimum, median, and maximum PCI scores in Vietnam, 2006–14 (rated on a scale of 0 to 100) 90
Figure II.A.5. A middle-income trap for EAP’s emerging economies? 93
Figure II.A.6. Economic Complexity Index and GDP per capita, 2013 97
Figure II.A.7. Transparency, consultation, and impact assessment practices in the rulemaking processes in selected EAP countries 98
Figure II.A.8. Vietnam Provincial Competitiveness Index: The trends of various economic governance indicators 104
II.B. TheTrans-PacificPartnershipanditsPotentialEconomicImplicationsforDevelopingEastAsiaandPacificFigure II.B.1. The TPP comes amidst a slowdown in GDP growth and trade in emerging markets 112
Figure II.B.2. The TPP could potentially increase intra-TPP trade 114
Figure II.B.3. The TPP market matters for East Asia 114
Figure II.B.4. The TPP as a subset of ongoing discussions of mega-regional FTAs in East Asia and the Pacific 114
Figure II.B.5. Existing MFN tariff rates and proportion of zero tariffs under full TPP implementation 121
Figure II.B.6. Non-TPP members in East Asia may face erosion in tariff preference in TPP markets 121
Figure II.B.7. There are exceptions for rules on changes of tariff headings that could make rules of origin in TPP more stringent 123
Figure II.B.8. Sourcing of selected intermediate inputs and components by TPP members and nonmembers in East Asia 124
Figure II.B.9. Foreign value added in exports, 1995 and 2011 125
Figure II.B.10. Average intra-TPP nontariff measures by ad-valorem equivalent size 125
Figure II.B.11. Harmonization and mutual recognition of conformity assessment procedures may cut the costs of complying with NTMs 126
Figure II.B.12. Median score on Services Trade Restrictiveness Index 127
Figure II.B.13. The TPP offers only limited liberalization of services trade 127
Figure II.B.14. Results from known claims for arbitration under investor-state dispute settlement (ISDS) mechanisms. 129
Figure II.B.15. Number and average value of cross-border mergers and acquisitions by purchaser 129
Figure II.B.16. Country-specific impact of the TPP: GDP, exports, and terms of trade by 2030 135
Figure II.B.17. Country-specific impact of the TPP: decomposition of income results by 2030 136
Figure II.B.18. Sector-specific impact of the TPP: output and exports by 2030 137
List of Figures continued
EAST ASIA AND PACIFIC ECONOMIC UPDATE APRIL 2016
vIII LISTS oF CoNTENTS

Figure II.B.19. Country-specific impact of the TPP, FTAAP, and RCEP: GDP and exports by 2030 138
II.C. ReapingDigitalDividendsinEastAsiaandPacificFigure II.C.1. While the internet has spread rapidly, there is considerable variation within the
EAP region 145
Figure II.C.2. As in the rest of the world, digital technologies have spread rapidly in the EAP region 146
Figure II.C.3. The EAP region has six of the top 20 countries with the highest offline population in the world 147
Figure II.C.4. Many EAP countries have a digital access gap across gender 148
Figure II.C.5. How digital technologies can promote development 149
Figure II.C.6. Among the high-income countries, the ICT sector accounts for a larger part of GDP in EAP countries than elsewhere 151
Figure II.C.7. Contribution to GDP growth, 1995–2014 151
Figure II.C.8. China’s export destinations differ for firms using online platforms; change between 2006 and 2014 153
Figure II.C.9. EAP countries enjoy higher labor productivity growth than the rest of the world; some of this is due to higher productivity among firms using the internet, as is the case in Vietnam 154
Figure II.C.10. Employment in ICT occupations is fairly modest 157
Figure II.C.11. Online labor markets expand opportunities, especially for women 158
Figure II.C.12. Estimated share of employment that is susceptible to automation from a technological standpoint 160
Figure II.C.13. The labor market is becoming more polarized in many countries 162
Figure II.C.14. The effect of history on internet prices, Pacific Islands 163
Figure II.C.15. A race between the quality of complements and technology; EAP compared to rest of the world 164
Figure II.C.16. Business expenditure in research and development, 2013 166
Part III. Country Pages and Key IndicatorsCambodia
Figure 1. Contributions to real GDP growth 174
Figure 2. GDP per capita growth and poverty rate headcount 174
China
Figure 1. Contributions to real GDP growth 177
Figure 2. Poverty Rates Estimates and Projections 177
Fiji
Figure 1. Real GDP growth 181
Figure 2. Incidence of poverty 181
Indonesia
Figure 1. Higher public spending supported investment and growth in the second half of 2015 184
List of Figures continued
GROWING CHALLENGES
LISTS oF CoNTENTS Ix
Figure 2. Poverty has been declining, but at a slowing rate 184
Lao PDR
Figure 1. Contributions to annual GDP growth 188
Figure 2. Growth incidence curve, 2002/03–2012/13 188
Malaysia
Figure 1. Contributions to annual GDP growth 190
Figure 2. Labor market indicators 190
Mongolia
Figure 1. Contributions to annual GDP growth 194
Figure 2. Growth incidence curve: 2010–14 194
Myanmar
Figure 1. Contributions to annual GDP growth 197
Figure 2. Contributions to yearly inflation 197
Papua New Guinea
Figure 1. Contributions to annual GDP growth 200
Figure 2. Key fiscal indicators 200
Philippines
Figure 1. Contributions to annual GDP growth 203
Figure 2. Poverty reduction is expected to continue as per capita income increases 203
Small Pacific Island Countries
Figure 1. Primary balances 208
Figure 2. Public and publicly guaranteed external debt 208
Solomon Islands
Figure 1. Trade balance 211
Figure 2. GDP per capita 211
Thailand
Figure 1. Contributions to annual GDP growth 214
Figure 2. Poverty rate and GDP per capita 214
Timor-Leste
Figure 1. Projected fiscal revenue and expenditure 217
Figure 2. Projected Petroleum Fund balance 217
Vietnam
Figure 1. Contributions to annual GDP growth 220
Figure 2. Ethnic minority children face higher inequality of opportunity 220
List of Figures continued
EAST ASIA AND PACIFIC ECONOMIC UPDATE APRIL 2016
x LISTS oF CoNTENTS

List of Tables
Part I. Recent Developments and Outlook
I.B. Outlook and RisksTable I.B.1. East Asia and Pacific: GDP growth projections 43
Table I.B.2. Compared with recent years, poverty will decline at a slightly slower pace in China and in developing EAP overall, but at a similar pace in developing EAP excluding China 50
Part II. Medium-Term Development Agenda
II.B. TheTrans-PacificPartnershipanditsPotentialEconomicImplicationsforDevelopingEastAsiaandPacificTable II.B.1. Treatment of SPS and TBT issues in WTO and TPP agreements 117
Table II.B.2. Some key features of SPS and TBT provisions in ASEAN agreements and TPP 118
Table II.B.3. Treatment of several key trade-related issues in WTO and TPP agreements 119
Table II.B.4. Key features of ISDS in bilateral investment treaties (BITs), the ASEAN Comprehensive Investment Agreement (ACIA), and the TPP Agreement 130
Part III. Country Pages and Key IndicatorsCambodia Selected Indicators 174
China Selected Indicators 178
Fiji Selected Indicators 181
Indonesia Selected Indicators 185
Lao PDR Selected Indicators 188
Malaysia Selected Indicators 191
Mongolia Selected Indicators 194
Myanmar Selected Indicators 197
Papua New Guinea Selected Indicators 200
Philippines Selected Indicators 203
Solomon Islands Selected Indicators 211
Thailand Selected Indicators 214
Timor-Leste Selected Indicators 217
Vietnam Selected Indicators 220
GROWING CHALLENGES
LISTS oF CoNTENTS xI

List of Boxes
Part I. Recent Developments and Outlook
I.A. Recent DevelopmentsBox I.A.1. Recent Global Developments 2
Figure BI.A.1.1. Manufacturing PMI, Emerging and Developing Economies 3
Figure BI.A.1.2. International commodity prices 3
Figure BI.A.1.3. Global equity indexes 4
Figure BI.A.1.4. Emerging market (EM) sovereign bond yields 4
Box I.A.2. How Deep is the Deceleration in the Chinese Labor Market? 7
Figure BI.A.2.1. China and oECD countries: employment rate 8
Figure BI.A.2.2. China and oECD countries: unemployment rate 8
Figure BI.A.2.3. Registered unemployment rate, labor disputes, and GDP growth 9
Figure BI.A.2.4. Purchasing Managers’ Index on Employment 9
Figure BI.A.2.5. Wage growth by population group 9
Figure BI.A.2.6. Net urban job creation by sector and province, 2012–14 9
Box I.A.3. Rising Inequality in Indonesia 14
Box I.A.4. Capital Flows to East Asia and Pacific 17
Figure BI.A.4.1. Net capital flows to emerging market funds 17
Figure BI.A.4.2. China: balance of payments 17
Figure BI.A.4.3. Developing EAP excl. China: balance of payments 17
Figure BI.A.4.4. Net capital flows to emerging market funds 18
Figure BI.A.4.5. China: Composition of net capital flows 18
Figure BI.A.4.6. Net capital flows 19
Box I.A.5. Confronting the Challenges Facing Commodity Exporters in East Asia and Pacific 29
Figure BI.A.5.1. Change in price of leading export commodity 30
Figure BI.A.5.2. Change in commodity terms of trade, 2014–15 30
Table BI.A.5.1. External account indicators 30
Figure BI.A.5.3. Change in US dollar exchange rate and in commodity terms of trade, between 2014 and 2015 31
Figure BI.A.5.4. Mineral and petroleum tax revenue 31
Table BI.A.5.2. Fiscal outcomes in 2015: planned compared to revised 31
Figure BI.A.5.5. CPIA Average, 2014 33
Figure BI.A.5.6. World Governance Indicators, 2013 33
Figure BI.A.5.7. Government effectiveness score, 2013 33
Figure BI.A.5.8. Human Development Index score, 2014 33
Figure BI.A.5.9. Aggregate Logistics Performance Index (2014) 34
Figure BI.A.5.10. Components of Logistics Performance Index (2014) 34
I.B. Outlook and RisksBox I.B.1. Global Outlook and Risks 41
EAST ASIA AND PACIFIC ECONOMIC UPDATE APRIL 2016
xII LISTS oF CoNTENTS

Figure BI.B.1.1. Global GDP growth forecast 41
Figure BI.B.1.2. Global inflation and oil prices 41
Box I.B.2. China’s Integration into Global Value Chains and the Impact on Its Trade Partners 44
Figure I.B.2.1. Export market share, value-added ranking, in manufacturing, in 2000 and 2011 45
Figure I.B.2.2. Increase in import penetration of Chinese intermediate goods, by country income level, 2000–10 46
Figure I.B.2.3. Increase in import penetration of Chinese intermediate goods, manufacturing sectors, by country, 2005–10 47
Table BI.B.2.1. Effect of import penetration on domestic production 47
Table BI.B.2.2. Productivity spillovers, by income level and geographical dimension 48
I.C. Policy ConsiderationsBox I.C.1. Domestic Revenue Mobilization in East Asia and Pacific 63
Figure BI.C.1.1. Tax revenue and social expenditure 63
Figure BI.C.1.2. Government revenue and GDP per capita by region 63
Figure BI.C.1.3. Tax revenue by region 63
Figure BI.C.1.4. Direct and indirect taxes by region 64
Figure BI.C.1.5. Tax revenue for selected EAP countries 64
Figure BI.C.1.6. Tax Revenue and GDP per capita in developing countries 64
Figure BI.C.1.7. Direct and indirect taxes for selected EAP countries 64
Figure BI.C.1.8. Resource revenue and nonresource revenue 65
Table BI.C.1.1. Tax Rates 66
Box I.C.2. Rice Prices in Indonesia and the Philippines 70
Figure BI.C.2.1. Rice is increasingly more expensive in Indonesia than abroad… 71
Figure BI.C.2.2. …with higher prices starting at the farm gate 71
Figure BI.C.2.3. Filipinos pay more than twice as much as their Asian neighbors for rice 72
Figure BI.C.2.4. Rice prices vary significantly across the country, and are higher in some rice-producing provinces than in Manila 72
Figure BI.C.2.5. Marketing costs for rice are almost twice as high in the Philippines as in Thailand 73
Figure BI.C.2.6. Retail prices for rice in the Philippines are twice as high as farm-gate prices, and the gap has increased over time 73
Box I.C.3. Boosting Growth and Shared Prosperity in the Small Pacific Island Countries 75
Figure BI.C.3.1. Size and remoteness of the small PICs 75
Figure BI.C.3.2. GDP growth in the decade to 2014 75
Figure BI.C.3.3. Incidence of extreme poverty and poverty in the small PICs 76
Figure BI.C.3.4. Goods exports in the small PICs 76
Figure BI.C.3.5. Fisheries license fees 78
Figure BI.C.3.6. Visitor arrivals per capita in tourism-dependent island states 78
List of Boxes continued
GROWING CHALLENGES
LISTS oF CoNTENTS xIII

List of Boxes continued
Box I.C.4. Addressing Inequality in Indonesia 80
Figure BI.C.4.1. Indonesians are demanding action to address inequality 81
Part II. Medium-Term Development Agenda
II.B. TheTrans-PacificPartnershipanditsPotentialEconomicImplicationsforDevelopingEastAsiaandPacificBox II.B.1. What is the TPP agreement, why does it matter, and when will it enter into force? 113
Box II.B.2. A negative list approach to services trade and investment regulation can strengthen certainty 128
Box II.B.3. TPP government procurement chapter: examples of exceptions by Malaysia, Singapore, and Vietnam 131
Box II.B.4. Assumptions used in the model 132
II.C. ReapingDigitalDividendsinEastAsiaandPacificBox II.C.1. Measuring the spread of digital technologies among EAP countries 146
Figure II.C.1.1. Digital Adoption Index, 2014 146
Box II.C.2. A digital marketplace with Chinese characteristics: the Taobao villages in China 149
Box II.C.3. EAP’s diverging performance in trade in ICT goods compared to ICT services 152
Figure II.C.3.1: Top-10 exporters of ICT goods, 2013 152
Figure II.C.3.2: Top-10 exporters of ICT services, 2013 152
Box II.C.4. Business process outsourcing and jobs in the Philippines: Opportunities and challenges from technological change 158
Box II.C.5. The rise of the app economy: 6 of the top 20 countries by app developers are in EAP 159
Figure II.C.5.1. Top 20 countries by number of app developers 159
Box II.C.6. The rise of robots 161
Box II.C.7. How public-private partnership helped build the internet backbone in the Republic of Korea 163
Table II.C.7.1. Broadband investment program, Republic of Korea 163
Box II.C.8. Building new economy skills in Vietnam and Singapore 167
EAST ASIA AND PACIFIC ECONOMIC UPDATE APRIL 2016
xIv LISTS oF CoNTENTS

AEC ASEAN Economic CommunityAFTA ASEAN Free Trade AreaAPEC Asia-Pacific Economic CooperationASEAN Association of Southeast Asian NationsATIGA ASEAN Trade in Goods AgreementCCP Chinese Communist PartyCER Citizen Engagement in RulemakingCNPC China National Petroleum CorporationCPI Consumer Price IndexCPIA Country Policy and Institutional AssessmentCTC changes in tariff classificationDAI Digital Adoption IndexDCF Countrywide Development FundDPWH Philippine Department of Public Works and
HighwaysEAP East Asia and PacificECI Economic Complexity IndexEMBI Emerging Market Bond IndexEMDEs emerging market and developing
economieseop end of periodFDI foreign direct investmentFTAAP Free Trade Area of the Americas and the
PacificFTAs free trade agreementsGATS General Agreement on Trade in ServicesGDP gross domestic productGPA Government Procurement AgreementGVC Global Value ChainH1 first halfH2 second halfHS harmonized systemICRG International Country Risk GuideICT information and communications
technologyILO International Labour OrganizationIPRs intellectual property rightsiREG Indicators of Regulatory Policy and
GovernanceISDS investor-state dispute settlementISPMS Indicators of the Strength of Public
Management SystemsIT information technologyITRI Industrial Technology Research Institute
KDI Korean Development Institutekg kilogramLAC Latin America and the CaribbeanLDP Liberal-Democratic PartyMFIL Myanmar Foreign Investment LawMICs middle-income countriesMPs members of parliamentNAFTA North American Free Trade AgreementNASA National Aeronautics and Space
AdministrationNFA National Food Authority (Philippines)NIEs Newly Industrialized EconomiesNTMs nontariff measuresoECD organisation for Economic Co-operation
and DevelopmentOT Oyu TolgoiPCI Provincial Competitiveness IndexPDAF Priority Development Assistance FundPEFA Public Expenditure and Financial
AccountabilityPERQ Program for Enhancing Regulatory QualityPF Petroleum FundPIM public investment managementPIMS public investment management systemPMI Purchasing Managers’ Index PNA Parties to the Nauru AgreementPPP purchasing power parityPRPD Performance Rating and Public DisclosurePWT Penn World TableQ4 first quarterRCEP Regional Comprehensive Economic
PartnershipRERF Revenue Equalization Reserve FundRTA regional trade agreementRUR registered unemployment rateSAAR seasonally adjusted annual rateSAR special administrative regionSDR Special Drawing RightsSNGs subnational governmentsSoEs state-owned enterprisesSPS sanitary and phytosanitaryTADAT Tax Administration Diagnostic Assessment
ToolTBT technical barriers to trade
List of Abbreviations
GROWING CHALLENGES
LISTS oF CoNTENTS xv

TC Tropical CycloneTOT terms of tradeTPP Trans-Pacific PartnershipTRIM Trade-Related Investment MeasuresTRIPS Trade-Related Aspects of Intellectual
Property RightsTVEs township and village enterprisesUN Comtrade United Nations Commodity Trade Statistics
DatabaseUN TRAINS United Nations Trade Analysis Information
SystemVAMC Vietnam Asset Management CompanyVAT value-added taxVCCI Vietnam Chamber of Commerce and
IndustryVFR visiting friends and relativesWB World BankWGI Worldwide Governance IndicatorsWTO World Trade OrganizationWTO FTA World Trade Organization Trade Facilitation
Agreement WTO GPA World Trade Organization Government
Procurement Agreementyoy year-on-year
Regions, World Bank Classification and Country GroupsASEAN-4 Indonesia, Malaysia, Philippines, and
ThailandASEAN-5 Indonesia, Malaysia, the Philippines,
Thailand, and VietnamEAP East Asia and PacificEAP nei Cambodia, Lao PDR, and the rest of
Southeast Asia; Hong Kong SAR, China; Taiwan, China
G7 Canada, France, Germany, Italy, Japan, the United States, and the United Kingdom
ECA Europe and Central AsiaLAC Latin America and the CaribbeanMNA Middle East and North AfricaP4 Agreement Pacific 4 free trade agreement among
Brunei Darussalam, Chile, Singapore, and New Zealand
PIC-8 Kiribati, the Marshall Islands, the Federated States of Micronesia, Palau, Samoa, Tonga, Tuvalu, and Vanuatu
PICs Pacific Island CountriesSAR South AsiaSSA Sub-Saharan AfricaTPP signatories
Australia, Canada, Chile, Brunei, Japan, Malaysia, Mexico, New Zealand, Peru, Singapore, the United States, and Vietnam
Country AbbreviationsAGO AngolaALB AlbaniaARG ArgentinaAUS AustraliaAUT AustriaBGD BangladeshBGR BulgariaBOL BoliviaBWA BotswanaCAN CanadaCHE SwitzerlandCHL ChileCHN ChinaCRI Costa RicaCZE Czech RepublicDEU GermanyDNK DenmarkDOM Dominican RepublicECU EcuadorEGY EgyptESP SpainETH EthiopiaFIN FinlandFRA FranceFSM Federated States of MicronesiaGBR United KingdomGEo GeorgiaGMB Gambia, TheGRC GreeceGTM GuatemalaGUF Guiana, FrenchHND HondurasHUN HungaryIND IndiaIRL IrelandISL Iceland
List of Abbreviations continued
EAST ASIA AND PACIFIC ECONOMIC UPDATE APRIL 2016
xvI LISTS oF CoNTENTS
ISR IsraelITA ItalyJOR JordanKGZ Kyrgyz RepublicKHM CambodiaKIR KiribatiKOR Korea, Rep.LAO LaosLKA Sri LankaLUX LuxembourgMEX MexicoMHL Marshall IslandsMKD Macedonia, FYRMNG MongoliaMUS MauritiusMYS MalaysiaNGA NigeriaNIC NicaraguaNLD NetherlandsNOR NorwayNPL NepalNZL New ZealandPAK PakistanPAN PanamaPHL PhilippinesPLW PalauPOL PolandPRT PortugalPRY ParaguayPSE Palestinian TerritoryROU RomaniaRUS RussiaSRB Serbia and MontenegroSLV El SalvadorSWE SwedenTHA ThailandTJK TajikistanTMP East TimorTON TongaTUR TurkeyTUV TuvaluTZA TanzaniaUKR UkraineUSA United States
UZB UzbekistanVNM VietnamVUT VanuatuWSM SamoaZAF South Africa
Currency UnitsB Thai bhatCR Cambodian rielD Vietnamese dongF$ Fiji dollarK Myanmar kyatK Papua New Guinea kinaKip Lao PDRP Philippine pesoRM Malaysian ringgitRMB Chinese renminbiRp Indonesian rupiahSI$ Solomon Islands dollarTog MongoliaUS$ Timor-LesteUS$ United States
List of Abbreviations continued
GROWING CHALLENGES
LISTS oF CoNTENTS xvII

Preface and Acknowledgments
The East Asia and Pacific Economic Update is a joint product of the office of the Chief Economist, East Asia and Pacific Region, and the Macro and Fiscal Management Global Practice, prepared in collaboration with the Poverty Global Practice and the Development Prospects Group. The report was supervised by Nikola Spatafora, under the guidance of Sudhir Shetty (Chief Economist, East Asia and Pacific Region).
Part I was prepared by Kim Edwards (lead), Ekaterine Vashakmadze, Serhat Solmaz, and Yan Sun. Contributions were received from the Part III team (listed below), Carolina Diaz-Bonilla, Yumeka Hirano, Jaime De Jesus Filho, Eung Ju Kim, Samuel Freije-Rodriguez, and Daria Taglioni.
Part II was prepared by Jurgen Blum and Robert Taliercio (Part II.A), Sjamsu Rahardja and Maryla Maliszewska (Part II.B), and Deepak Mishra (Part II.C).
Part III was prepared by staff from the Macro and Fiscal Management Global Practice and Poverty Global Practice: Kiatipong Ariyapruchya, Reena Badiani-Magnusson, Davaadalai Batsuuri, Hans Beck, Noel del Castillo, Shaohua Chen, Karl Chua, Kevin Cruz, Somneuk Davading, Gabriel Demombynes, Reno Dewina, Carolina Diaz-Bonilla, Viet Tuan Dinh, Ndiame Diop, Sebastian Eckardt, Fitria Fitrani, Samuel Freije-Rodriguez, Min Ye Paing Hein, Linh Hoang Vu, Mizuho Kida, Jae Kyun Kim, David Knight, Nandini Krishnan, Chandana Kularatne, Taehyun Lee, Joseph Louie Limkin, John Litwack, Sodeth Ly, Sandeep Mahajan, Miguel Martin, Carolina Mejia-Mantilla, Elitza Mileva, Shabih Ali Mohib, Rafael Munoz, Evgenij Najdov, Lucy Pan, Keomanivone Phimmahasay, obert Pimhidzai, Ririn Purnamasari, Habib Rab, Carlos Romero, Shakira Sharifuddin, Manohar Sharma, Altantsetseg Shiilegmaa, Adisorn Sitdhipol, Karlis Smits, May Thet Zin, Robert Utz, Rogier Van Den Brink, Matthew Wai-Poi, Maria Monica Wihardja, and Luan Zhao. The work was managed by Shubham Chaudhuri and Mathew Verghis for the Macro and Fiscal Management Global Practice, and by Salman Zaidi for the Poverty Global Practice.
Assistance with communications and outreach was provided by Carl Hanlon, Dini Djalal, Anissa Tria, and Jane Zhang (External Communications, East Asia and Pacific Region). The report was edited by Diane Stamm, and designed and typeset by Budy Wirasmo. Administrative support was provided by Cecile Wodon.
Throughout the report, geographic groupings are defined as follows:
EastAsiaandPacific comprises Developing East Asia and Pacific, and the Newly Industrialized Economies.
Developing EastAsia andPacific comprises Cambodia, China, Indonesia, Lao People’s Democratic Republic (PDR), Malaysia, Mongolia, Myanmar, Papua New Guinea, the Philippines, Thailand, Timor-Leste, Vietnam, and the Pacific Island Countries.
The Pacific IslandCountries comprise Fiji, Kiribati, the Marshall Islands, the Federated States of Micronesia, Palau, Samoa, the Solomon Islands, Tonga, Tuvalu, and Vanuatu.
EAST ASIA AND PACIFIC ECONOMIC UPDATE APRIL 2016
xvIII PREFACE AND ACKNoWLEDGMENTS
The Newly Industrialized Economies comprise Hong Kong SAR, China; the Republic of Korea; Singapore; and Taiwan, China.
The ASEAN member countries comprise Brunei Darussalam, Cambodia, Indonesia, Lao PDR, Malaysia, Myanmar, the Philippines, Singapore, Thailand, and Vietnam.
The ASEAN-4 comprise Indonesia, Malaysia, the Philippines, and Thailand.
The ASEAN-5 comprise Indonesia, Malaysia, the Philippines, Thailand, and Vietnam.
This report is based on data available through March 31, 2016, inclusive.
GROWING CHALLENGES
PREFACE AND ACKNoWLEDGMENTS xIx

Executive Summary
In the six months since the previous East Asia and Pacific Economic Update, developing East Asia and Pacific(EAP)hasfacedachallengingexternalenvironment.Growth eased in the United States and Japan. The widespread slowdown in developing economies intensified, particularly in major commodity producers such as Brazil and Russia. Global trade continued to grow slowly, and commodity prices fell further. Global financial markets experienced renewed volatility. And, within developing EAP, the slowdown and rebalancing of activity in China continued.
Nevertheless, growth in developing EAP has generally remained resilient. It eased only modestly in 2015, in line with expectations, reflecting mainly the ongoing moderation in China. Growth in the region excluding China remained robust and broadly in line with the recent past, in sharp contrast to the experience in most other developing regions. The region’s resilience reflected prudent macroeconomic settings in most countries, including continued efforts to consolidate fiscal positions in some commodity exporters, as well as its relatively limited exposure to declining commodity prices.
Financial market conditions in the region, however, have been volatile over much of the past 6 months, as in the rest of the world. External financing conditions tightened across developing EAP over the course of 2015, particularly for commodity exporters and countries with significant financing needs. Capital outflows accelerated, most notably from China, and corporate and sovereign risk spreads on U.S. dollar-denominated bonds rose across the region, though by less than in other emerging markets. In early 2016, uncertainties surrounding the outlook and policy responses in major economies (including China) prompted a resurgence of volatility in regional capital flows, exchange rates, and equity markets. More recently, financial market conditions have stabilized, driven in part by signs that monetary policy in advanced economies will remain more accommodative than previously thought.
Over the next two to three years, growth in developing EAP is expected to ease modestly. This slowdown, in line with what was projected last october, reflects mainly the ongoing growth moderation in China. In the rest of the region, growth is projected to pick up slightly, driven by the large ASEAN economies, and consistent with a gradual recovery in advanced economies, accommodative domestic monetary policy, and the beneficial impact of low energy prices on fuel importers. However, the outlook for individual countries varies, partly depending on their trade and financial relationships with high-income economies and with China, as well as on the extent of their reliance on commodity exports, whose prices are projected to remain low.
China is expected to continue its gradual shift to a slower and more sustainable growth path. Growth is projected to ease from 6.9 percent in 2015 to 6.7 percent in 2016, and 6.5 percent in 2017 and 2018. Continued implementation of reforms should support the rebalancing of domestic demand. In particular, growth in investment and industrial output will moderate, reflecting measures to contain local government debt, reduce excess industrial capacity, and reorient fiscal stimulus toward social sectors. on the other hand, the labor market and growth in household incomes will remain robust, supporting private consumption. The shift toward services will continue, facilitated by policies to ease business regulations in the services sector. Low oil prices will continue to support demand, and targeted policy measures are expected to be applied as needed to ensure that the overall slowdown is only gradual.
EAST ASIA AND PACIFIC ECONOMIC UPDATE APRIL 2016
xx EXECUTIVE SUMMARY
Among the large developing ASEAN economies, the Philippines and Vietnam enjoy the strongest growth prospects. The Philippines will benefit from accelerated implementation of the existing pipeline of public-private partnership projects, relatively diversified export markets, and lower global commodity prices. However, the medium-term outlook hinges on whether private investment reemerges as a driver of growth. Vietnam will see continued strong growth in domestic demand and manufacturing exports, although there are risks associated with fiscal pressures and relatively slow progress on structural reforms. Growth in Indonesia is expected to accelerate, but is contingent on the implementation of an ambitious public investment program, and the success of reforms to reduce red tape and uncertainty. In Malaysia, weaker demand from China and low commodity prices will constrain growth and public spending. In Thailand, weaker external demand and policy uncertainty continue to weigh on private investment.
In some small economies, growth will be affected by low commodity prices and weaker external demand. Mongolia continues to adjust to the end of a mining boom, with economic activity held back by weakening mineral exports and efforts to control public debt. In Cambodia, growth will be affected by weaker prices for agricultural commodities, constrained garment exports amid competition from garment producers in other countries, moderating growth in tourism after a period of strong gains, and possibly continued real appreciation. In Myanmar, growth is expected to accelerate, driven by domestic demand, including major investments in the power sector, and progress on structural reforms. In Papua New Guinea, growth is expected to fall sharply in 2016, since production of liquefied natural gas (LNG) is reaching a peak, and low LNG prices are generating continued headwinds. In Timor-Leste, growth in the non-oil economy is expected to rebound to between 5 and 6 percent in the medium term, with public sector construction projects a major driver.
InthePacificIslandCountries(PICs),growthislikelytoremainmoderate.Most PICs are heavily dependent on imported food and fuel, and will therefore continue to benefit from low global commodity prices, including through subdued inflationary pressures. In Fiji, the outlook is heavily dependent on the speed of recovery from Tropical Cyclone Winston. In the Solomon Islands, Tuvalu, and Vanuatu, infrastructure projects will be an important driver of near-term growth.
Poverty in developing EAP has declined rapidly in recent years, and is projected to fall further with continued growth; however, in several countries the pace of poverty reduction has been restricted by limited labor market opportunities, particularly for disadvantaged groups. In Lao PDR, natural resource–driven growth is creating insufficient jobs. In Thailand, structural transformation away from agriculture has ceased. In Vietnam, ethnic minorities and geographically remote groups suffer from limited access to jobs and public services. In Indonesia, the labor market is characterized by growing duality, with unskilled workers trapped in low-wage informal jobs, and limited employment generation.
The positive outlook for growth and poverty reduction in the region in this base case is subject to elevated risks. A weaker-than-expected recovery in high-income economies, or a faster-than-expected slowdown in China, would have considerable effects on external demand and growth prospects in the rest of developing EAP. A resurgence of volatility in financial markets, as observed recently, could prompt a tightening in monetary conditions, with adverse effects on the real economy. In particular, vulnerabilities created by the interplay between high levels of indebtedness, price deflation, and slowing growth in China bear close monitoring, as do corporate and financial sector vulnerabilities across much of the region. A further decline in commodity prices, while positive
GROWING CHALLENGES
EXECUTIVE SUMMARY xxI

for the region overall, would act as a negative shock to real activity in commodity exporters, reducing the space for public expenditure and investment to support growth. Unfavorable weather conditions related to El Niño have already had a significant effect on agricultural production, including in Indonesia, Papua New Guinea, the Philippines, and Vietnam, and there is considerable uncertainty about the impact of a potential La Niña. Natural disasters continue to pose a substantial risk for all PICs.
Across much of the region, the room for policy manoeuver has shrunk. In particular, the scope for higher public spending to boost short-term growth has narrowed, especially in commodity exporters, where revenues have already declined substantially. Monetary easing is limited by the already-low policy rates in many countries and, increasingly, by the risk that further cuts will exacerbate capital outflows and/or unwanted leverage. Exchange rate flexibility has helped buffer shocks, but further depreciations may also generate significant balance-sheet risks. At the same time, the relative resilience of growth in most economies during the past year means they do not need to emphasize counter-cyclical stabilization efforts.
Countries should instead prioritizemonetary and fiscal policies that reduce their exposure to globalandregionalrisksandstrengthencredibilityandmarketconfidence.In particular, the need to build fiscal buffers to help insure against future external shocks has increased. Such policies are particularly important for those economies where growth has been sustained through increased public or private sector borrowing, or where external demand has been supported by the commodities boom.
In China, there continues to be a need to reduce leverage—particularly in those industrial sectors where overcapacity ismostevident—includingbystrengtheningmarketdiscipline in thefinancial sector.To assist the rebalancing toward domestic consumption, it is important also to shift fiscal emphasis from public infrastructure investment toward areas such as education, health, social assistance, and the environment. Such measures are consistent with a moderate slowdown over the next few years, while reducing the risks of a much sharper slowdown in the future.
A decisive approach to structural reform is even more important than usual, given the uncertain global environment and the constraints on macroeconomic policy. Structural reforms will boost long term growth; in the short term, they will also enhance market confidence, reducing financing constraints and vulnerability, and enhancing the effectiveness of any policy response to shocks. This edition of the East Asia and Pacific Economic Update highlights the need for action across the region in three areas.
First, several countries are hampered by weaknesses in governance; action is required to enhance transparency,strengthenaccountability,andmoregenerallyredefinetheroleofthestate.As countries in the region continue to develop, and in particular as they transition into the upper reaches of middle-income status, the need for changes in the governance model is growing. East Asian countries perform relatively well in terms of state capacity, which is particularly important in generating economic take-offs and sustaining the early stages of development. However, to sustain the rise of the region’s increasingly complex economies to high-income status, the transparency, accountability, and responsiveness of their governments to the demands of both the private sector and civil society will become increasingly critical. These aspects of governance are particularly important in fostering the development of a private sector focused on long-term innovation, and of modern, complex activities including higher value-added services, which can provide the basis for sustained growth.
EAST ASIA AND PACIFIC ECONOMIC UPDATE APRIL 2016
xxII EXECUTIVE SUMMARY

Second, efforts to reduce barriers to trade in the region should be redoubled, with a particular focus on non-tariff measures and regulatory barriers, including to trade in services. A renewed focus on trade liberalization, and in particular on a deeper integration than characterized previous trade agreements, could boost economic activity and stimulate job creation. A key recent development was the conclusion of negotiations for the Trans-Pacific Partnership (TPP), whose signatories include Malaysia and Vietnam. The TPP seeks to further lower tariffs, address issues with non-tariff measures, improve regulatory certainty, and open up trade in services. The TPP could also provide renewed impetus for the completion of broader Regional Trade Agreements, potentially incorporating even more ambitious provisions.
Third,theregionmustincreaseitsreadinesstobenefitfromthedigitalrevolution,andtodealwiththechallenges it poses, particularly through a focus on developing the essential “analog complements” to digital technologies. Developing EAP as a whole is already doing better than other regions in reaping dividends from its investments in digital technologies. However, maximizing the benefits from the digital revolution, and ensuring that it promotes inclusive growth rather than long-term disruption, requires measures to strengthen some key complementary factors. First, developing a pro-competition regulatory regime where firms can leverage the internet to compete and innovate for the benefit of consumers. Second, adapting workers’ skills to the demands of the new economy. Third, and as already emphasized, ensuring that institutions are accountable, so that governments have an incentive to use digital technologies effectively to empower citizens and deliver services.
In China, a range of structural reforms will be required to support sustainable growth over the longer term. The aim is to facilitate a reallocation of factors of production, including capital, toward sectors and firms that are more productive and have greater growth potential. Allowing a more market-based allocation of credit would assist in this regard. Sectors dominated by state-owned enterprises would need to be gradually opened up to competition. Continued reform of the household-registration system (“hukou”) will facilitate permanent migration to the cities, boost structural transformation, and help reduce rural-urban inequality.
In commodity exporters and other countries highly exposed to China’s economy, reforms should promote economicflexibility,particularlybyremovingbarrierstothedevelopmentofnewsectorsandtheentryof newfirms. This requires supporting private sector development, including through increased competition, prudent regulation, and improved infrastructure, and boosting the capacity to effectively deliver public services that enhance education and health outcomes. In addition, the operation of institutions designed to manage commodity price volatility, such as sovereign wealth funds, needs to be strengthened.
The outlook for the Pacific Island Countries (PICs) is heavily dependent on their ability to overcomegeographic constraints and take advantage of the relatively narrow set of opportunities available to them. In particular, PICs can make better use of their natural endowments, in particular through fishing and tourism, which can generate high returns even when the costs of production and trade are relatively high. Greater labor mobility can help to increase the productivity of the domestic labor force, by providing it with access to opportunities in overseas markets. Boosting fiscal sustainability and resilience to external shocks are also priorities. Tropical Cyclone Winston, which devastated much of Fiji in February, provided a stark reminder of the need to reduce PICs’ vulnerability to natural disasters.
GROWING CHALLENGES
EXECUTIVE SUMMARY xxIII

Sustaining the pace of poverty reduction will require measures to enhance the business environment, improve education and health outcomes, and strengthen social safety nets. Labor is the most important asset of the poor. Governments should therefore avoid distortionary interventions that impede the creation of jobs in cities and within global value chains, and instead tackle barriers to labor mobility and to economic diversification. Where a large share of the poor are employed in agriculture, it is important to improve farmers’ access to information, better seeds, water, electricity, and markets, and to secure property rights. In several countries, improved infrastructure and delivery of social services is a key priority, and needs to be supported by tax reforms that generate increased revenues efficiently. Measures to protect the welfare of the poorest and vulnerable in the face of shocks, including by building systems to protect against disasters and the outbreak and spread of communicable diseases, remain critical.
EAST ASIA AND PACIFIC ECONOMIC UPDATE APRIL 2016
xxIv EXECUTIVE SUMMARY

Part I. Recent Developments and Outlook
GROWING CHALLENGES
1
I.A. Recent Developments
In the six months since the previous East Asia and Pacific Economic Update, developing East Asia and Pacific has faced a challenging external environment, characterized by disappointing growth outcomes in the major high-income and emerging economies, renewed volatility in financial markets and capital flows, and continued weakness in international trade and commodity prices. Nevertheless, growth in the region has generally remained resilient. It eased only modestly in 2015, in line with expectations, reflecting mainly the ongoing moderation and rebalancing of activity in China. Growth in the region excluding China remained robust and broadly in line with the recent past, in sharp contrast to the experience in most other developing regions. The region’s resilience reflected prudent macroeconomic settings in most countries, including continued efforts to consolidate fiscal positions in some commodity exporters, as well as its relatively limited exposure to declining commodity prices. However, in early 2016 uncertainties surrounding the outlook and policy responses in major economies (including China) prompted a resurgence of volatility in regional capital flows, exchange rates, and equity markets, although increases in regional sovereign risk spreads were generally contained. More recently, financial market conditions have stabilized, driven in part by signs that monetary policy in advanced economies will remain more accommodative than previously thought.
The global economy has slowed further since the October 2015 East Asia and Pacific Economic Update. Growth eased in the United States, while activity in Japan contracted in the fourth quarter (Box I.A.1). The widespread slowdown in developing economies intensified, particularly in major commodity producers such as Brazil and Russia. Global trade continued to grow slowly during the second half of 2015, driven by lower import demand from major emerging markets, and especially commodity producers. Commodity prices have fallen further since October 2015, although oil prices have recovered somewhat after declining steeply in late 2015 and early January. Muted economic activity and declining commodity prices have been reflected in weak inflation pressures, both globally and across much of developing East Asia and Pacific (EAP).
Box I.A.1. Recent Global Developments
Global growth remained weak in 2015. Global growth is estimated to have slowed in the fourth quarter of 2015, decelerating to under 2 percent (quarter-on-quarter annualized), its lowest level since the Euro Area crisis in 2012. This soft patch was associated with disappointing growth in the United States, a contraction in Japan, a continued slowdown in China, and enduring recessions in Brazil and Russia. Growth also eased in India following a particularly strong third quarter. In contrast, fourth quarter growth remained flat in the Euro Area, firmed slightly in the United Kingdom, and accelerated in parts of East Asia and western parts of Europe and Central Asia helped by weak commodity prices. Global manufacturing activity grew in 2015 at only about half the pace observed during the previous five years, reflecting the slowdown in global trade.
Global activity showed little sign of improvement in 2016. Surveys indicate that global manufacturing activity has remained weak since the start of 2016, with the manufacturing Purchasing Managers’ Index
(continued)
EAST ASIA AND PACIFIC ECONOMIC UPDATE APRIL 2016
2 PART I. RECENT DEVELoPMENTS AND oUTLooK

(PMI) indicating contractions across major emerging markets in January (Figure BI.A.1.1). Services activity has been somewhat more resilient, partly supported by robust consumer spending, but the services PMIs for February showed signs of further moderation in both emerging and advanced economies. Global merchandise trade remained subdued throughout 2015, largely reflecting weakening import demand from commodity exporters combined with slowing activity in major emerging economies.
Figure BI.A.1.1. Manufacturing PMI, Emerging and Developing Economies
Figure BI.A.1.2. International commodity prices
Index +50 = expansion US$ nominal, 2010=100
54
53
52
51
50
49
48
May-11 May-12 May-13 May-14 May-15
150
130
110
90
70
50
30
Jan-11 Jan-12 Jan-13 Jan-14 Jan-15 Jan-16
▬ Line 1 ▬ Line 2 ▬ Agriculture ▬ Energy ▬ Metals
Sources: World Bank; Haver Analytics.Note: dotted line denotes trendline.
Source: Bloomberg.
A moderate recovery is ongoing in advanced economies, but prospects have deteriorated, prompting major central banks to lean toward further policy accommodation. In the United States, real GDP growth slowed to 1 percent (seasonally adjusted annual rate) in the fourth quarter of 2015, mainly driven by a deceleration in manufacturing activity and exports. Following the increase in policy interest rates in December, weaker growth, combined with evidence of persistently low inflation expectations amid lower oil prices, has led to prospects of a shallower and more protracted normalization of policy interest rates ahead. Despite some softening in the fourth quarter, in the Euro Area growth picked up to 1.6 percent in 2015 (from 0.9 percent in 2014), helped by firming domestic demand. Given low inflation expectations and persistent downside risks to growth, the European Central Bank decided on further policy easing. In Japan, growth remained subdued in 2015, averaging 0.5 percent for the year as a whole, following a contraction of 1.1 percent (seasonally adjusted annual rate) in the fourth quarter. Given continued growth disappointments and persistently low inflation, the Bank of Japan eased policy further, introducing negative rates on some excess reserves and opening up the possibility of further action if needed.
Growth continues to slow in major emerging and developing countries, amid a weak external environment combined with domestic headwinds. The weakness faced by emerging market and developing economies in 2015 has extended into 2016. Besides the gradual slowdown in China, some of the largest emerging markets are experiencing slowing or contracting activity in 2016, while policy buffers are rapidly eroding. Brazil and Russia are both in deep recession (about a 3.8 percent contraction in each in 2015), and activity may continue declining in 2016, though at a slower pace. Growth in South Africa remains sluggish. While the expansion in India remains robust, it has eased somewhat, reflecting capacity
(continued)
(Box I.A.1 continued)
GROWING CHALLENGES
I.A. RECENT DEVELoPMENTS 3
constraints. oil exporters have come under significant pressure since late 2014, with the sharp decline in oil prices weakening current accounts, exchange rates, reserves, and fiscal accounts.
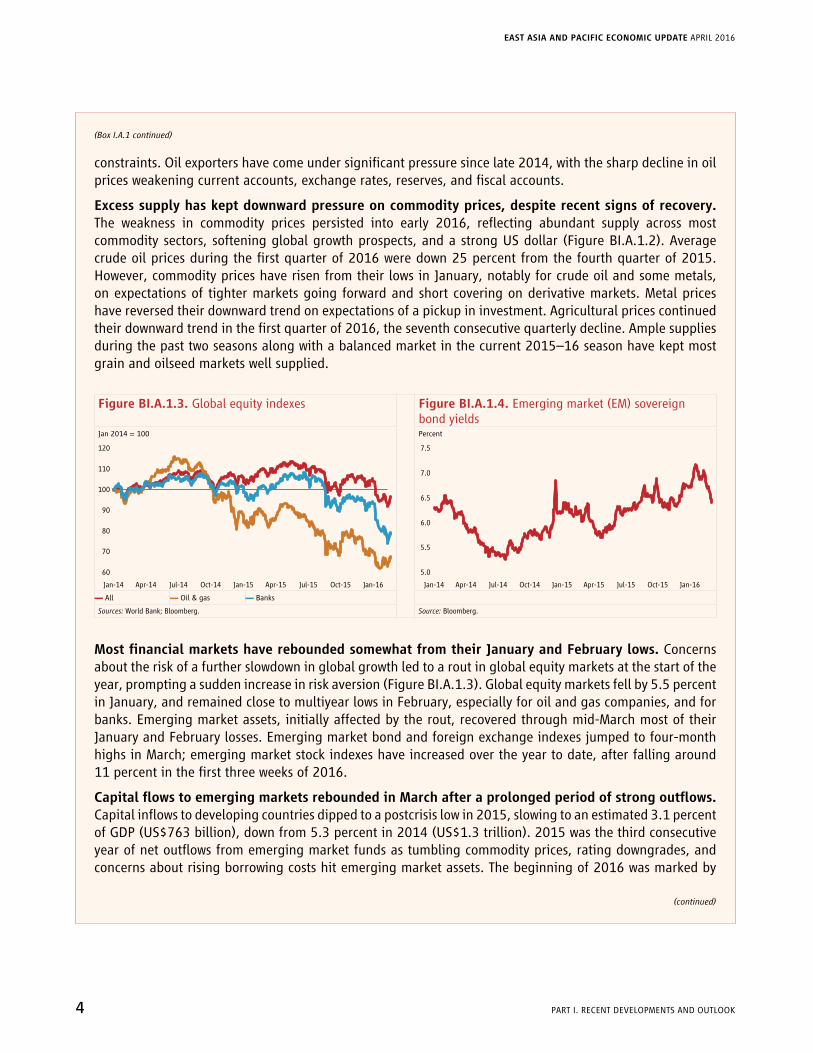
Excess supply has kept downward pressure on commodity prices, despite recent signs of recovery. The weakness in commodity prices persisted into early 2016, reflecting abundant supply across most commodity sectors, softening global growth prospects, and a strong US dollar (Figure BI.A.1.2). Average crude oil prices during the first quarter of 2016 were down 25 percent from the fourth quarter of 2015. However, commodity prices have risen from their lows in January, notably for crude oil and some metals, on expectations of tighter markets going forward and short covering on derivative markets. Metal prices have reversed their downward trend on expectations of a pickup in investment. Agricultural prices continued their downward trend in the first quarter of 2016, the seventh consecutive quarterly decline. Ample supplies during the past two seasons along with a balanced market in the current 2015–16 season have kept most grain and oilseed markets well supplied.
Figure BI.A.1.3. Global equity indexes Figure BI.A.1.4. Emerging market (EM) sovereign bond yields
Jan 2014 = 100 Percent
120
110
100
90
80
70
60
Jan-14 Apr-14 Jul-14 Oct-14 Jan-15 Apr-15 Jul-15 Oct-15 Jan-16
7.5
7.0
6.5
6.0
5.5
5.0
Jan-14 Apr-14 Jul-14 Oct-14 Jan-15 Apr-15 Jul-15 Oct-15 Jan-16
▬ All ▬ Oil & gas ▬ Banks
Sources: World Bank; Bloomberg. Source: Bloomberg.
MostfinancialmarketshavereboundedsomewhatfromtheirJanuaryandFebruarylows.Concerns about the risk of a further slowdown in global growth led to a rout in global equity markets at the start of the year, prompting a sudden increase in risk aversion (Figure BI.A.1.3). Global equity markets fell by 5.5 percent in January, and remained close to multiyear lows in February, especially for oil and gas companies, and for banks. Emerging market assets, initially affected by the rout, recovered through mid-March most of their January and February losses. Emerging market bond and foreign exchange indexes jumped to four-month highs in March; emerging market stock indexes have increased over the year to date, after falling around 11 percent in the first three weeks of 2016.
CapitalflowstoemergingmarketsreboundedinMarchafteraprolongedperiodofstrongoutflows.Capital inflows to developing countries dipped to a postcrisis low in 2015, slowing to an estimated 3.1 percent of GDP (US$763 billion), down from 5.3 percent in 2014 (US$1.3 trillion). 2015 was the third consecutive year of net outflows from emerging market funds as tumbling commodity prices, rating downgrades, and concerns about rising borrowing costs hit emerging market assets. The beginning of 2016 was marked by
(continued)
(Box I.A.1 continued)
EAST ASIA AND PACIFIC ECONOMIC UPDATE APRIL 2016
4 PART I. RECENT DEVELoPMENTS AND oUTLooK
continued outflows from emerging market bond and equity funds, with the pace slightly faster for fixed income than stocks. Sovereign and corporate borrowers from developing countries sold about US$15 billion of international bonds in January, the lowest January level of issuance since 2009, and are paying higher spreads as rising risk aversion contributed to higher borrowing costs (Figure BI.A.1.4). However, March marked a rebound in capital inflows. Bond issuance also picked up, as the persistently low yield environment in advanced economies and stabilization in commodity prices pushed borrowing costs significantly lower.
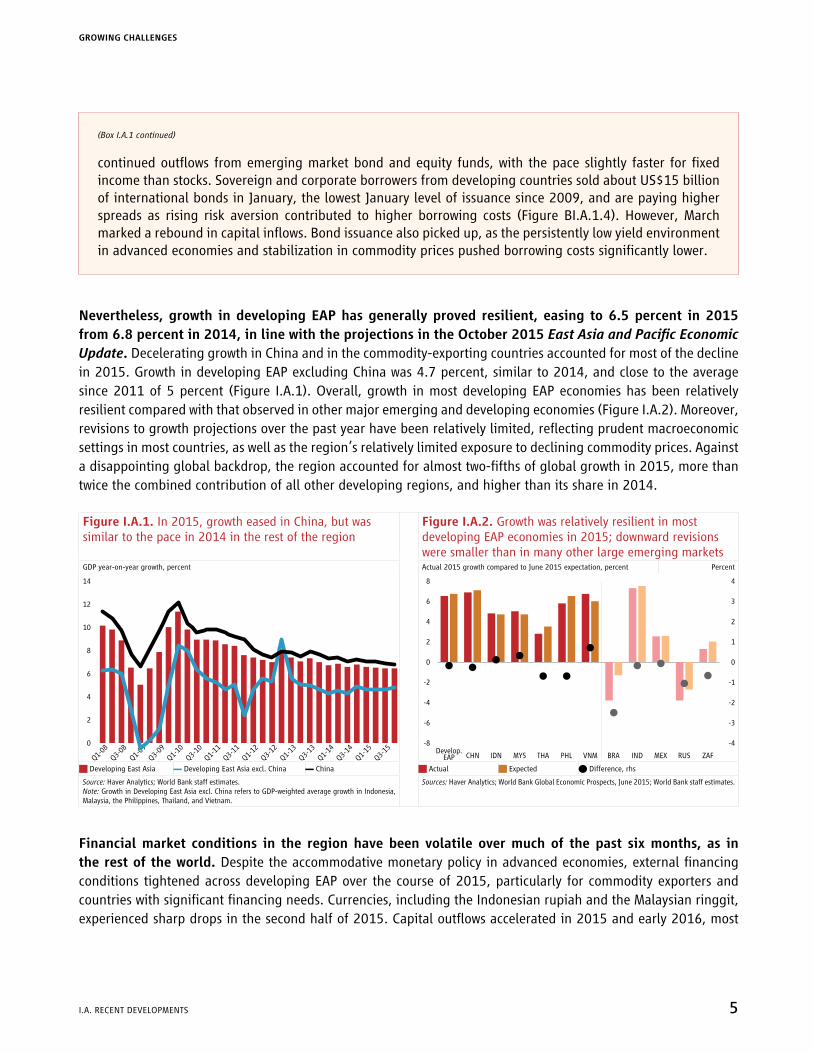
Nevertheless, growth in developing EAP has generally proved resilient, easing to 6.5 percent in 2015 from 6.8 percent in 2014, in line with the projections in the October 2015 East Asia and Pacific Economic Update. Decelerating growth in China and in the commodity-exporting countries accounted for most of the decline in 2015. Growth in developing EAP excluding China was 4.7 percent, similar to 2014, and close to the average since 2011 of 5 percent (Figure I.A.1). overall, growth in most developing EAP economies has been relatively resilient compared with that observed in other major emerging and developing economies (Figure I.A.2). Moreover, revisions to growth projections over the past year have been relatively limited, reflecting prudent macroeconomic settings in most countries, as well as the region’s relatively limited exposure to declining commodity prices. Against a disappointing global backdrop, the region accounted for almost two-fifths of global growth in 2015, more than twice the combined contribution of all other developing regions, and higher than its share in 2014.
Figure I.A.1. In 2015, growth eased in China, but was similar to the pace in 2014 in the rest of the region
Figure I.A.2. Growth was relatively resilient in most developing EAP economies in 2015; downward revisions were smaller than in many other large emerging markets
GDP year-on-year growth, percent Actual 2015 growth compared to June 2015 expectation, percent Percent
14
12
10
8
6
4
2
0
Q1-
08
Q3-
08
Q1-
09
Q1-
10
Q1-
11
Q1-
12
Q1-
13
Q1-
14
Q1-
15
Q3-
09
Q3-
10
Q3-
11
Q3-
12
Q3-
13
Q3-
14
Q3-
15
8 4
6 3
4 2
2 1
0 0
-2 -1
-4 -2
-6 -3
-8 -4Develop.
EAP CHN IDN MYS THA PHL VNM BRA IND MEX RUS ZAF
J Developing East Asia ▬ Developing East Asia excl. China ▬ China J Actual J Expected Q Difference, rhs
Source: Haver Analytics; World Bank staff estimates.Note: Growth in Developing East Asia excl. China refers to GDP-weighted average growth in Indonesia, Malaysia, the Philippines, Thailand, and Vietnam.
Sources: Haver Analytics; World Bank Global Economic Prospects, June 2015; World Bank staff estimates.
Financial market conditions in the region have been volatile over much of the past six months, as in the rest of the world. Despite the accommodative monetary policy in advanced economies, external financing conditions tightened across developing EAP over the course of 2015, particularly for commodity exporters and countries with significant financing needs. Currencies, including the Indonesian rupiah and the Malaysian ringgit, experienced sharp drops in the second half of 2015. Capital outflows accelerated in 2015 and early 2016, most
(Box I.A.1 continued)
GROWING CHALLENGES
I.A. RECENT DEVELoPMENTS 5

notably from China, and risk spreads on US-dollar-denominated bonds rose across the region. Nevertheless, the increase in sovereign spreads was typically smaller than in other major emerging economies, and the level of US dollar spreads in developing EAP countries remained below emerging market benchmarks (Figure I.A.3). Share prices on regional markets fell sharply at the beginning of 2016, alongside substantial declines in the US and European markets. However, with the exception of China, the swings in equity markets, while large, were generally less pronounced that those observed in other large emerging economies (Figure I.A.4).
Figure I.A.3. US dollar (Emerging Market Bond Index) bond spreads in developing EAP countries rose in late 2015 and early 2016 and then declined, while generally remaining well below emerging market benchmarks.
Figure I.A.4. Developing EAP equity markets declined in late 2015 and then in most cases subsequently recovered, although the swings in other large emerging markets were typically larger
EMBI spreads at end-March, basis points Equity market changes from end-November 2015 to end-March 2016, percent
100
50
0
-50
-100
500
400
300
100
0
200
CHN IDN MYS PHL BRA INDRUS ZAFEMBI
Global
30
25
20
15
10
5
0
-10
-5
-15
-20
-25
CHN IDN MYS PHL THA BRA INDRUS ZAF
Changes in EMBI spreads from end-November 2015 to end-March 2016, basis points J End-Nov to end-Jan J End-Jan to end-Mar Q End-Nov to end-Mar
J End-Nov to end-Jan J End-Jan to end-Mar Q End-Nov to end-Mar Q End-Mar level (rhs)
Sources: Haver Analytics; World Bank staff estimates. Sources: Haver Analytics; World Bank staff estimates.
Thefinancialvolatilityobservedinearly2016reflectedthreemainfactors.First, the outlook for global and regional growth and, relatedly, global commodity prices, was seen as deteriorating. Second, there were concerns about whether China’s economy could rebalance smoothly in the face of elevated debt levels, and uncertainty over how to interpret policy changes (including the shift toward greater exchange rate flexibility, and changes to rules around the operation of the equity market). Third, although the move toward normalization in US monetary policy in December was well anticipated, investors remained uncertain about the potential for greater divergences in monetary policy across high-income economies.
Morerecently,financialmarketconditionshavestabilized.Emerging market currencies, both in the region and elsewhere, have appreciated against the US dollar since February, reflecting renewed capital inflows and moderating outflows. Equity and bond markets have generally recovered over the same period (Figure I.A.3 and Figure I.A.4). There are tentative signs that commodity prices are recovering from earlier lows, with oil prices currently at or around their end-2015 levels. In part, this stabilization reflects the announcement of a larger-than-expected monetary stimulus by the European Central Bank, and expectations of a more gradual policy tightening in the United States. Within the region, investors have also been reassured by renewed indications that China is prepared to provide policy support to maintain growth in the short to medium term.
EAST ASIA AND PACIFIC ECONOMIC UPDATE APRIL 2016
6 PART I. RECENT DEVELoPMENTS AND oUTLooK

Box I.A.2. How Deep is the Deceleration in the Chinese Labor Market?1
Forseveralmonths,therehavebeennewsreportsaboutsignsofslackintheChineselabormarket: “the labor ministry estimates 1.8 million workers could lose jobs,” and “some 1.3 million jobs will be lost in the coal sector and 500,000 in the steel industry.”2 Announcements of job cuts have been accompanied by reports of wage arrears and growing labor discontent: “On March 12 … a protest by thousands of coal miners … in Heilongjian province … demanded wages they said they had not received for at least two months,” and “In Sainty Marine’s shipyards on the lower reaches of the Yangzi river … workers took a … measure to demand their missing wages: they marched out and blockaded a nearby highway.”3
However,officialstatisticsdonotindicateaseriousdownturninjobsandearnings.The registered unemployment rate has remained at 4.1 percent of the urban labor force between 2010 and 2015. Job growth in urban areas in 2015 (13.1 million jobs) was the second highest in the past 10 years, only slightly lower than in 2014 (13.2 million jobs), and significantly above the government target (10 million jobs).
Ingeneral,China’semploymentrateissignificantlyhigher,anditsunemploymentratelesssensitiveto the economic cycle, than in many Organisation for Economic Co-operation and Development (OECD)countries.The employment rate4 in China has exceeded 67 percent since 2000, despite recent declines, whereas in Germany, Japan, and the United States it has always been below 65 percent and is currently below 60 percent (Figure BI.A.2.1). Since 2002, unemployment rates have fluctuated in a range of 6.6 percentage points in Germany, 5.0 percentage points in the United States, and 2.0 percentage points in Japan, whereas in China the registered unemployment rate (RUR) has moved within a range of only 0.3 percentage points (Figure BI.A.2.2).
1 Prepared by Samuel Freije-Rodriguez.
2 Financial Times, March 3, 2016, and CNN Money, February 29, 2016.
3 The Economist, March 19, 2016, and The Economist, January 16, 2016.
4 Defined as the ratio of workers to people aged 15 and older.
(continued)
Growth eased in China during the second half of 2015, in line with expectations, and remained relatively resilient in the larger Association of Southeast Asian Nations (ASEAN)economies
Growth in China eased to 6.9 percent in 2015, in line with expectations and with the government’s indicative target of approximately 7 percent. The slowdown was especially pronounced in the real estate and manufacturing sectors during the first half of the year, with a large stock of unsold housing and excess capacity across a range of industrial sectors constraining further investment. In the second half of the year, policy measures, including a loosening of financial conditions, increased public spending on infrastructure, and support to homebuyers (including through a reduction in down-payment requirements), provided some support to activity in these sectors. There has been a slight softening in the labor market, with the number of domestic migrant workers leveling off (Box I.A.2).
GROWING CHALLENGES
I.A. RECENT DEVELoPMENTS 7
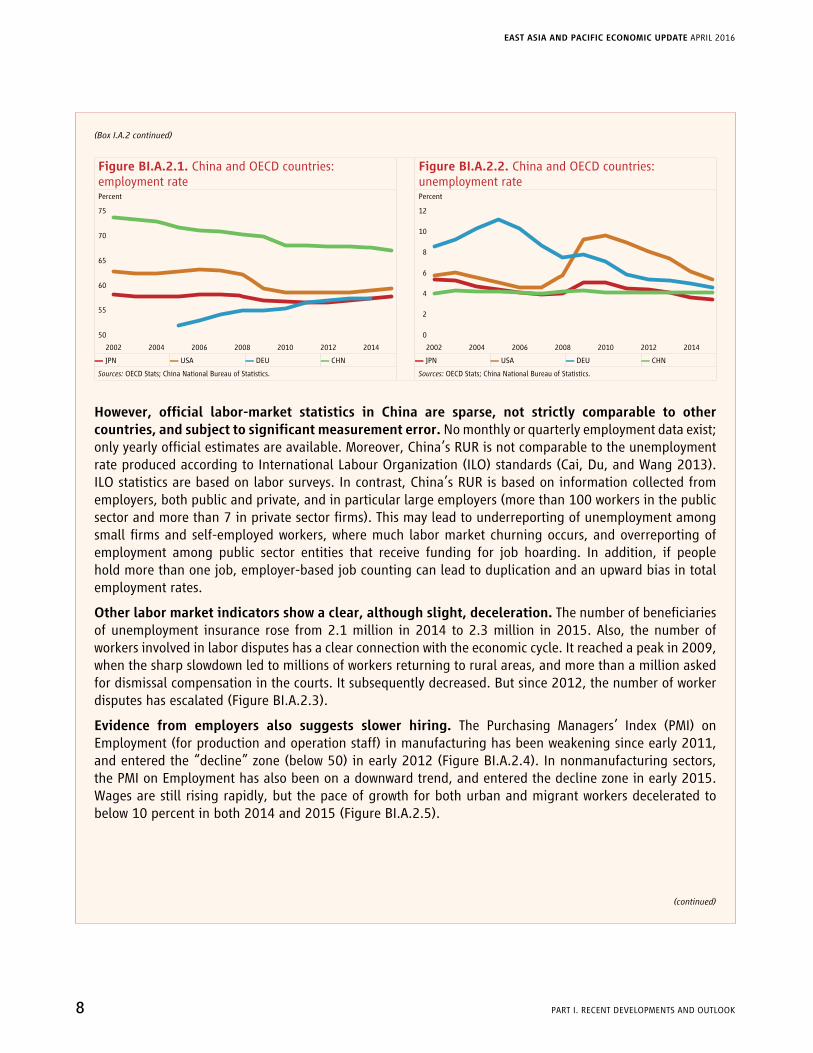
Figure BI.A.2.1. China and oECD countries: employment rate
Figure BI.A.2.2. China and oECD countries: unemployment rate
Percent Percent
75
70
65
60
55
50
2002 2004 2006 2008 2010 2012 2014
12
10
8
6
4
0
2
2002 2004 2006 2008 2010 2012 2014
▬ JPN ▬ USA ▬ DEU ▬ CHN ▬ JPN ▬ USA ▬ DEU ▬ CHN
Sources: oECD Stats; China National Bureau of Statistics. Sources: oECD Stats; China National Bureau of Statistics.
However, official labor-market statistics in China are sparse, not strictly comparable to othercountries,andsubjecttosignificantmeasurementerror.No monthly or quarterly employment data exist; only yearly official estimates are available. Moreover, China’s RUR is not comparable to the unemployment rate produced according to International Labour Organization (ILO) standards (Cai, Du, and Wang 2013). ILO statistics are based on labor surveys. In contrast, China’s RUR is based on information collected from employers, both public and private, and in particular large employers (more than 100 workers in the public sector and more than 7 in private sector firms). This may lead to underreporting of unemployment among small firms and self-employed workers, where much labor market churning occurs, and overreporting of employment among public sector entities that receive funding for job hoarding. In addition, if people hold more than one job, employer-based job counting can lead to duplication and an upward bias in total employment rates.
Other labor market indicators show a clear, although slight, deceleration. The number of beneficiaries of unemployment insurance rose from 2.1 million in 2014 to 2.3 million in 2015. Also, the number of workers involved in labor disputes has a clear connection with the economic cycle. It reached a peak in 2009, when the sharp slowdown led to millions of workers returning to rural areas, and more than a million asked for dismissal compensation in the courts. It subsequently decreased. But since 2012, the number of worker disputes has escalated (Figure BI.A.2.3).
Evidence from employers also suggests slower hiring. The Purchasing Managers’ Index (PMI) on Employment (for production and operation staff) in manufacturing has been weakening since early 2011, and entered the “decline” zone (below 50) in early 2012 (Figure BI.A.2.4). In nonmanufacturing sectors, the PMI on Employment has also been on a downward trend, and entered the decline zone in early 2015. Wages are still rising rapidly, but the pace of growth for both urban and migrant workers decelerated to below 10 percent in both 2014 and 2015 (Figure BI.A.2.5).
(Box I.A.2 continued)
(continued)
EAST ASIA AND PACIFIC ECONOMIC UPDATE APRIL 2016
8 PART I. RECENT DEVELoPMENTS AND oUTLooK

Figure BI.A.2.3. Registered unemployment rate, labor disputes, and GDP growth
Figure BI.A.2.4. Purchasing Managers’ Index on Employment
Percent Disputes per 10,000 workers Seasonally adjusted, 50+ = expansion
15 18
16
14
12
12
10
8
9
6
4
6
3
2
0 0
2000 2002 2004 2006 2008 2010 2012 2014
56
54
52
50
48
46
44
42
Jan-06 Jan-08 Jan-10 Jan-12 Jan-14 Jan-16
J Real GDP growth ▬ Registered unemployment rate ▬ Manufacturing ▬ Nonmanufacturing
▬ Laborers involved in labor disputes, rhs
Sources: China National Bureau of Statistics; World Bank staff estimates.Note: Dotted line denotes data as of September 2015.
Source: China National Bureau of Statistics.Note: Dotted lines denote 12-month moving averages.
Figure BI.A.2.5. Wage growth by population group Figure BI.A.2.6. Net urban job creation by sector and province, 2012–14
Growth rate, percent Million workers
16
14
12
10
8
6
4
2
0
2010 2011 2012 2013 2014 2015
8
7
6
5
4
3
2
1
-1
0
Jiang
su
Guang
dong
Henan
Sich
uan
Shan
dong
Hubei
Shaa
nxi
Shan
ghai
Anhu
i
Jiang
xi
Liaon
ing
Chon
gqing
Gansu Jil
in
Guang
xi
Beijing
Hebei
Guizh
ou
Zhejiang
Inne
r Mon
golia
Hunan
Xinjiang
Yunn
an
Fujia
n
Shan
xi
Haina
nTib
et
Tianjin
Ningx
ia
Qingh
ai
Heilong
jiang
J Average wage of employed persons in urban units J Primary J Secondary J Tertiary
J Average monthly wage of migrant workers
Source: China National Bureau of Statistics.Note: For 2015, migrant worker’s wage refers to the average monthly wage in the third quarter.
Sources: China National Bureau of Statistics; World Bank staff estimates.Note: Data on employment in urban units do not include private enterprises.
China’s labor market adjusts to a deceleration of economic activity largely through a reduction in the number of migrant workers, who are reabsorbed by the agricultural sector, and through labor hoarding by state-owned enterprises. China’s GDP growth is strongly correlated with changes in the flows of migrants, which reflect fluctuations in labor market conditions better than official unemployment rates. After the 2009 crisis, many of the off-farm workers who lost their jobs in rural areas were reabsorbed in the agricultural sector and returned to the family farm in their home village (Huang et al. 2011). Recent data confirm that, as the economy has decelerated, the number of migrants has leveled off.5 Changes in migrant
5 The total stock of migrant workers who had left their hometowns grew by only 0.4 percent in 2015, to reach 168.7 million, compared to growth rates of 1.5 percent in 2014 and 2013, and over 3 percent at the beginning of the decade (National Bureau of Statistics of China 2016).
(Box I.A.2 continued)
(continued)
GROWING CHALLENGES
I.A. RECENT DEVELoPMENTS 9

flows and signs of labor hoarding in some sectors help to explain the apparent resilience of the Chinese labor market (IMF 2015).
However,thesetraditionallabormarketadjustmentmechanismsimposesignificantcosts.Increased employment in low-productivity agriculture and state-owned enterprises undermines the economy’s growth prospects. Instead, new mechanisms of labor market adjustment could lead to better allocation of workers into the growing services sector. Services are already expanding rapidly.6 But such structural employment shifts continue to display significant regional variations. In the four municipalities (Beijing, Shanghai, Tianjin, and Chongqing), and also in some coastal provinces such as Shandong, Zhejiang, and Fujian, employment in services has grown relatively fast. In contrast, in large provinces such as Jiangsu, Guandong, and Henan, employment creation is still skewed toward industry (Figure BI.A.2.6).
Theexpansionofemploymentinserviceswillcontinue,butsignificantpolicyreformswillbeneededto avoid protracted unemployment in some areas and prevent labor unrest, while supporting the pace of productivity growth. Workers laid off from the shrinking heavy industry and construction sectors need support through unemployment insurance and retraining, to facilitate a smooth transition into service jobs. For relatively senior workers, small business support or early retirement should also be considered. Growth in services will involve significant geographic migration, away from areas with a high concentration of declining industries. This calls for policies to facilitate migration and formal settlement in urban areas.
(Box I.A.2 continued)
The process of rebalancing has continued in China. While growth in investment and exports slowed, growth in consumption picked up slightly in 2015, as the economy slowly reorients toward higher household incomes and spending. Household real disposable income per capita grew by 7.4 percent in 2015, outpacing GDP growth. The services sector has continued expanding rapidly, growing substantially faster than industry in 2015 and now accounting for half of China’s total output (Figure I.A.5). Services has also been a major driver of employment growth in China. Conversely, labor productivity in the services sector has been declining relative to other sectors (but still remains above the economy-wide average). Financial and other services were particularly dynamic in 2015, although much of the value added in financial services may have been associated with policy stimulus and the runup and subsequent decline in Chinese equity markets over 2015. The economic activity of small and medium-sized enterprises has also picked up, reflecting policy support, including measures to reduce taxes and fees and ease access to credit.7
AmongthelargerdevelopingASEANeconomies,growthslowedinthecommodityexporters(IndonesiaandMalaysia)in2015,althoughtherewasapickupduringthesecondhalfoftheyear(Figure I.A.6). In both countries, the contribution to growth from exports declined substantially in 2015, reflecting exposure to the slowing, and increasingly less resource- and import-intensive, Chinese economy, as well as ongoing weakness in global trade and commodity prices more generally. Despite these trends, growth in Indonesia and Malaysia slightly exceeded expectations, at 4.8 percent and 5 percent, respectively. An acceleration in public infrastructure
6 At the start of the decade, employment in services surpassed employment in agriculture for the first time at the national level. Between 2012 and 2014 (the latest period with comparable official data), employment in services expanded by 3.6 million, compared to a reduction of 0.1 million in manufacturing and 3 million in agriculture. The figures for services are a lower bound estimate, owing to the weaknesses of official data on employment in small firms.
7 For instance, reserve requirements were reduced for select banks with high credit portfolios for small and medium-sized enterprises. One impact of such measures has been a rapid increase in firm entry: in 2015, the number of newly registered enterprises exceeded 10,000 per day.
EAST ASIA AND PACIFIC ECONOMIC UPDATE APRIL 2016
10 PART I. RECENT DEVELoPMENTS AND oUTLooK
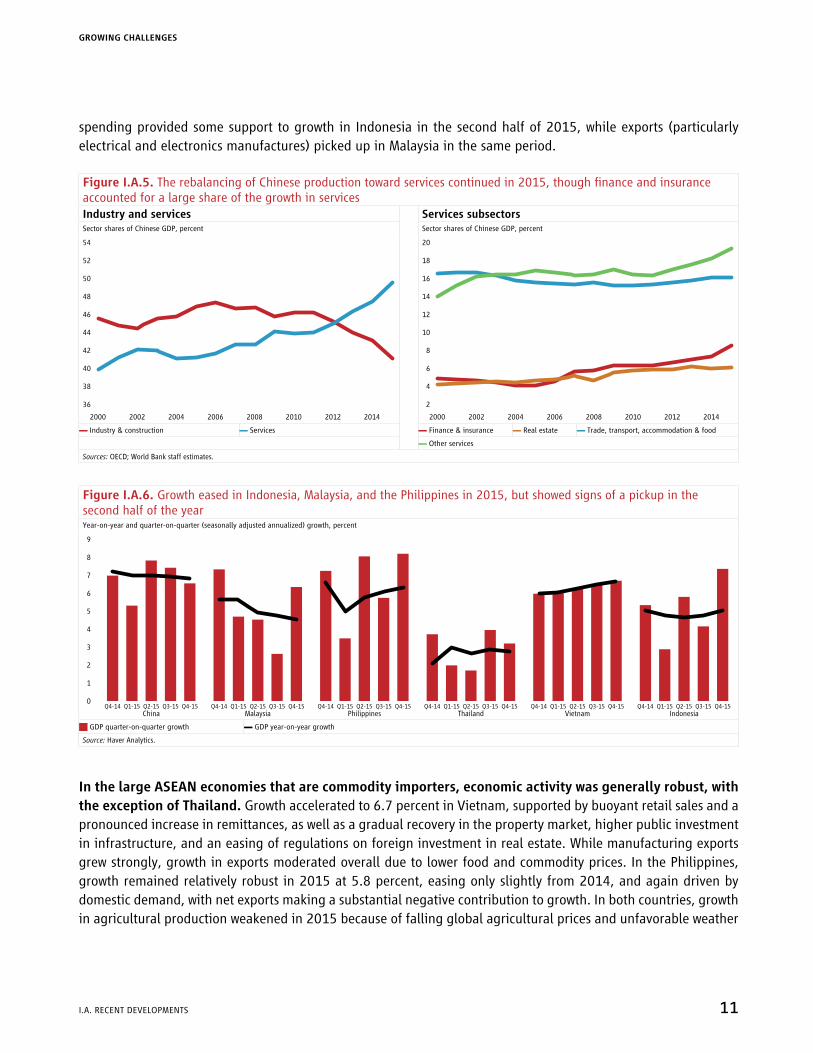
spending provided some support to growth in Indonesia in the second half of 2015, while exports (particularly electrical and electronics manufactures) picked up in Malaysia in the same period.
Figure I.A.5. The rebalancing of Chinese production toward services continued in 2015, though finance and insurance accounted for a large share of the growth in servicesIndustry and services Services subsectorsSector shares of Chinese GDP, percent Sector shares of Chinese GDP, percent
54
52
50
48
46
44
42
40
36
38
2006 2008 2010 2012 2014200420022000 2006 2008 2010 2012 2014200420022000
20
18
16
14
12
10
8
6
4
2
▬ Industry & construction ▬ Services ▬ Finance & insurance ▬ Real estate ▬ Trade, transport, accommodation & food
▬ Other services
Sources: oECD; World Bank staff estimates.
Figure I.A.6. Growth eased in Indonesia, Malaysia, and the Philippines in 2015, but showed signs of a pickup in the second half of the yearYear-on-year and quarter-on-quarter (seasonally adjusted annualized) growth, percent
9
8
7
6
5
4
3
2
1
0
ChinaQ4-14 Q1-15 Q2-15 Q3-15 Q4-15
Malaysia Philippines Thailand Vietnam IndonesiaQ4-14 Q4-14 Q4-14 Q4-14 Q4-14Q1-15 Q1-15 Q1-15 Q1-15 Q1-15Q2-15 Q2-15 Q2-15 Q2-15 Q2-15Q3-15 Q3-15 Q3-15 Q3-15 Q3-15Q4-15 Q4-15 Q4-15 Q4-15 Q4-15
J GDP quarter-on-quarter growth ▬ GDP year-on-year growth
Source: Haver Analytics.
In the large ASEAN economies that are commodity importers, economic activity was generally robust, with the exception of Thailand. Growth accelerated to 6.7 percent in Vietnam, supported by buoyant retail sales and a pronounced increase in remittances, as well as a gradual recovery in the property market, higher public investment in infrastructure, and an easing of regulations on foreign investment in real estate. While manufacturing exports grew strongly, growth in exports moderated overall due to lower food and commodity prices. In the Philippines, growth remained relatively robust in 2015 at 5.8 percent, easing only slightly from 2014, and again driven by domestic demand, with net exports making a substantial negative contribution to growth. In both countries, growth in agricultural production weakened in 2015 because of falling global agricultural prices and unfavorable weather
GROWING CHALLENGES
I.A. RECENT DEVELoPMENTS 11

conditions related to El Niño. In Thailand, growth picked up from 0.8 percent in 2014 to 2.8 percent in 2015, but remained far below regional norms: weak exports and subdued investment continued to dampen activity, and uncertainty about policy and future incomes continued to weigh on consumption growth.
Taking a longer-term perspective, consumption continues to underpin growth in the large developing ASEANeconomies,whilefixedassetinvestmentandexportsareinmostcasesmakingasmallergrowthcontribution than in the past (Figure I.A.7). With the exception of the Philippines and Vietnam, significant import compression has helped stabilize the contribution from net exports. On the production side, industrial output has been weak across many ASEAN economies: manufacturing Purchasing Managers’ Indexes (PMIs) in China, Indonesia, and Malaysia are indicating contraction, and lie below emerging market averages (Figure I.A.8).
Figure I.A.7. Consumption continues to underpin growth in the large developing ASEAN economies, while fixed asset investment and exports are generally making a smaller growth contribution than in the pastContribution of expenditure components to change in GDP, percentage points
12
10
8
6
4
2
0
-2
-4
China2013 2014 2015
Malaysia Philippines Thailand VietnamIndonesia2013 2013 2013 2013 20132014 2014 2014 2014 20142015 2015 2015 2015 2015
2009–2012
2005–2008
2009–2012
2009–2012
2009–2012
2009–2012
2009–2012
2005–2008
2005–2008
2005–2008
2005–2008
2005–2008
J Consumption J Investment J Net exports Q GDP growth
8 20
6 15
410
2
5
0
0
-2
-5-4
-10-6
-8 -15
China2013 2014 2015
Malaysia Philippines Thailand Vietnam, rhsIndonesia2013 2013 2013 2013 20132014 2014 2014 2014 20142015 2015 2015 2015 2015
2009–2012
2005–2008
2009–2012
2009–2012
2009–2012
2009–2012
2009–2012
2005–2008
2005–2008
2005–2008
2005–2008
2005–2008
J Exports J Imports Q Net exports
Sources: Haver Analytics; World Bank staff estimates.Note: Excludes contributions from change in inventories and statistical discrepancy.
In the rest of developing East Asia, growth was generally robust. Cambodia, Lao People’s Democratic Republic, and Myanmar recorded growth rates of around 7 percent in 2015, although in each case this represented a moderation from the year before. In Myanmar, the moderation was due to the effect of floods, inflationary pressures, and a slowdown in new investments. Garment exports and construction output supported growth in Cambodia, but tourism eased and rice production declined. In contrast, Mongolia’s economy slowed significantly in 2015, growing by 2.3 percent compared to 7.9 percent in 2014, due to a sharp weakening in investment, exports,
EAST ASIA AND PACIFIC ECONOMIC UPDATE APRIL 2016
12 PART I. RECENT DEVELoPMENTS AND oUTLooK

and government spending. Papua New Guinea’s economy is facing strong headwinds from lower global commodity prices coupled with unfavorable weather conditions brought on by El Niño effects, with growth of 8.6 percent in 2015 attributable almost entirely to oil and gas exports associated with liquefied natural gas production reaching full capacity.
Figure I.A.8. Manufacturing PMIs remain in contractionary territory in China, Indonesia, and MalaysiaManufacturing PMIs; seasonally adjusted, 50+ = expansion
56
54
52
50
48
46
44
Jan-14 Mar-14 May-14 Jul-14 Sep-14 Nov-14 Jan-15 Mar-15 May-15 Jul-15 Sep-15 Nov-15 Jan-16
▬ Emerging markets ▬ China ▬ Indonesia ▬ Malaysia ▬ Vietnam
Sources: Markit Economics Limited; Haver Analytics.
Poverty has continued to decline
Poverty in developing EAP has continued to decline. Both extreme poverty and broader poverty8 have decreased sharply in the region, even excluding China (Figure I.A.9). Indeed, over the past five years, poverty reduction was most rapid in developing EAP among all developing regions. Nevertheless, in 2015, an estimated 336 million people still lived in poverty in the region, and were vulnerable to falling back into extreme poverty.
In several countries, poverty reduction has been slowed by limited labor market opportunities, particularly for disadvantaged groups of the population. In Lao PDR, poverty remains relatively inelastic with respect to growth, since natural-resource-driven growth is creating insufficient jobs. In Thailand, structural transformation away from agriculture and into manufacturing and services has stalled. In Vietnam, ethnic minorities and geographically remote groups suffer from limited access to jobs and public services, and therefore benefit relatively little from the rapid growth.
Inequality is a rising concern in Indonesia. The country suffers from significant inequality of opportunity, with poorer children enjoying limited access to health and education (Box I.A.3). Its labor market is characterized by a growing duality, with unskilled workers trapped in low-wage, informal jobs. There are few mechanisms to help poorer households cope with adverse shocks. At the same time, wealth is becoming concentrated at the very top of the income distribution.
8 Extreme poverty is defined as living on less than US$1.90 PPP a day, broader poverty as living on less than US$3.10 PPP a day, in both cases based on 2011 PPP prices.
GROWING CHALLENGES
I.A. RECENT DEVELoPMENTS 13

Figure I.A.9. Poverty has declined substantially in developing EAP over the past decadePoverty rates and number of poor, in millions, for US$1.90-a-day PPP and US$3.10-a-day PPP poverty lines
0
70
60
50
40
30
20
10
2001 2002 2003 2004 2005 2006 2007 2008 2009 2010 2011 2012 2013 20152014
1039
968 905
833
799
732
699
643
578
500451
419
336
377
317
307301
289 295
270
262
241
214
201194
186
162
176
546
477
421
357
350
311293
256223
171146
12689105
137129
125
112
124
10699
84
7464
5852
4347
Q EAP: $1.90-a-day PPP Q EAP excl. China: $1.90-a-day PPP Q EAP: $3.10-a-day PPP Q EAP excl. China: $3.10-a-day PPP
Source: World Bank East Asia and Pacific Poverty Portal.Note: Estimates are derived directly from household survey data, interpolated among existing surveys, or extrapolated based on per capita GDP growth and historical estimates of the growth elasticity of poverty. PPP = purchasing power parity.
Box I.A.3. Rising Inequality in Indonesia9
Rising inequality is creating an Indonesia that is more divided than ever before. Fifteen years of sustained economic growth in the country have helped to reduce poverty and create a growing middle class. However, growth over the past decade has primarily benefited the richest 20 percent and left the remaining 80 percent of the population—about 205 million people—behind. With rising disparities in living conditions and an increased concentration of wealth in the hands of the few, Indonesia’s level of inequality is now higher and climbing faster than most of its East Asian neighbors.10
Four main drivers of inequality in Indonesia affect both current and future generations. A research project conducted by the World Bank in partnership with the Government of Indonesia and supported by the Australian Department of Foreign Affairs and Trade has revealed the importance of the following factors:
• Inequality of opportunity. Poorer children often suffer from a disadvantaged start in life, which undermines their ability to succeed later. A lack of access to high-quality public services, such as health, education, and family planning, means that children from poor households are less able to become healthy, productive adults. For instance, 37 percent of Indonesian children are stunted, largely due
9 The information presented in this box is based on the World Bank report Indonesia’s Rising Divide: why inequality is rising, why it matters and what can be done (2015). The executive summary and background papers are available at www.worldbank.org/en/news/feature/2015/12/08/indonesia-rising-divide.
10 The Gini coefficient increased from 0.30 in 2000 to 0.405 in 2014.
(continued)
EAST ASIA AND PACIFIC ECONOMIC UPDATE APRIL 2016
14 PART I. RECENT DEVELoPMENTS AND oUTLooK

to improper nutrition and lack of proper water and sanitation facilities. Stunting impairs cognitive development, and this, combined with unequal quality of education, means many Indonesians enter the workforce with poor skills.
• Inequality in the labor market. Increasing demand for, and short supply of, skilled workers has created two separate labor markets: one for high-skilled workers who receive increasingly higher wages in formal jobs, and one for the majority of unskilled workers that are trapped in low-productivity, informal, and low-wage jobs. This segmentation is reinforced because there are few opportunities for Indonesian workers to develop these in-demand skills. In addition to the quality gap in the education system, only 5 percent of firms provide skills training for their workers, so that adults from poor households may never have a chance to learn the right skills. Unequal access to skills, in combination with a rising skilled wage premium, has led to increasing wage inequality.
• High wealth concentration. only a minority of Indonesians are benefiting from the possession of financial and physical assets that often generate higher income than labor. Indonesia has one of the highest wealth concentrations in the world, with the richest 10 percent of Indonesians owning an estimated 77 percent of all the country’s wealth, and the richest 1 percent owning half. Moreover, this concentration has been increasing in the 2000s faster than in most other countries. Income from these assets is sometimes taxed at a lower rate than labor income, and has a much lower rate of tax compliance. This means that the rich are able to save a larger percentage of their income, increasing inequality in the future.
• Unequal resilience to shocks. A variety of shocks (including financial crises, crop failures, and sudden illnesses) can hurt the incomes of poor and rich households alike. However, rich households have access to formal mechanisms to cope with shocks, such as insurance, whereas poor households must rely on loans from friends and family or selling productive assets. This erodes their ability to earn incomes and invest in the health and education needed to climb up the economic ladder. Furthermore, the impact of these shocks is increasing. For example, climate change means more frequent and severe natural disasters, and poor diets and sedentary lifestyles mean noncommunicable diseases such as diabetes and heart disease are becoming far more common.
(Box I.A.3 continued)
Thereremainsignificantwelfaredisparitiesbetweenruralandurbanareas.In Vietnam, rural incomes are approximately one-half of urban incomes. In Cambodia, Indonesia, and Lao PDR, rural incomes are around two-thirds of urban incomes, and in Lao PDR the gap has been widening over time. In both Cambodia and Lao PDR, there are also significant rural-urban disparities in access to basic services, including electricity and sanitation.11
The consumption of poor households in the region is significantly affected by swings in agriculturalprices, which may also have different effects on rural and urban areas. Decreases in the price of food staples generally benefit the urban poor, while the impact on the rural poor will depend on whether they are net consumers or producers of food. For instance, in Papua New Guinea, microsimulation analysis suggests that a 10 percent decline in food prices would reduce urban poverty by almost 2 percent, but rural poverty by less than 1 percent.12
11 In Cambodia, only 30 percent of rural households, but 92 percent of urban households, enjoy access to electricity; and only 35 percent of rural households, but 89 percent of urban households, enjoy access to sanitation. In Lao PDR, 73 percent of rural households, but 99 percent of urban households, enjoy access to electricity; and 64 percent of rural households, but 96 percent of urban households, enjoy access to sanitation.
12 The microsimulation model, based on Kshirsagar et al., 2009, does not capture the potential impact of changes in food prices on consumption patterns, or on employment and factor incomes; the direction of the resulting bias is unclear.
GROWING CHALLENGES
I.A. RECENT DEVELoPMENTS 15

ExternalfinancingconditionstightenedacrossEAPin2015andearly2016,asevidencedbyvolatilityinportfolioflows,fallsinequitymarkets,andincreasesinthecostofUSdollarfinancing
Chinahasrecordedsubstantialandbroad-basednetcapitaloutflowsinrecentmonths(Box I.A.4). They are estimated to have accelerated in late 2015 and January 2016, but moderated in February, and have been broad-based, involving both residents and nonresidents, and both portfolio and foreign direct investment flows. Gross capital outflows amounted to approximately US$1 trillion over the past 18 months. As the renminbi has depreciated in nominal terms vis-à-vis the US dollar, Chinese corporations have been seeking to reduce their net foreign currency exposure, including by replacing foreign short-term debt with domestic debt, and residents have been looking to diversify their asset holdings. At the same time, some of the outflows at the start of 2016 were related to changes in sentiment by nonresidents, partly due to concerns about the economic outlook, and partly because of heightened uncertainty over the intentions of Chinese policy makers with respect to exchange rate management and capital controls. However, clearer communication by the authorities in February helped address some of these uncertainties.
Inothercountries,portfolioinvestmentflowshaveprovedvolatile.Portfolio investment slowed during 2015 in most major economies, albeit in the case of Indonesia from historically high levels in 2014 (Figure I.A.10). Nonresident investors have been sellers of Thai portfolio assets on a sustained basis since mid-2013. Portfolio outflows in Malaysia in 2015 were associated with uncertainty over US monetary policy, declines in commodity exports, and governance concerns, although these outflows reversed in the fourth quarter, driven by nonresident investors’ higher demand for debt securities, and government securities in particular. In Indonesia, also, there were inflows into local-currency-denominated government bonds in the fourth quarter of 2015, as well as a sizable global bond issuance. This was in contrast to the August financial market volatility, which saw net foreign selling of domestic government debt securities in Indonesia, Malaysia, and Thailand (countries for which data on high-frequency holdings are available). Nonresident investors remain key players in the local currency bond markets of Indonesia and Malaysia, holding 39 and 37 percent of domestic government bonds outstanding, respectively (Figure I.A.11).
Figure I.A.10. Portfolio inflows softened over 2015, but showed signs of recovery in the fourth quarter in some countries
Figure I.A.11. Nonresident holdings of domestic debt securities have been stable in Indonesia and Malaysia, but declined in Thailand
Inbound portfolio investment, 4-quarter moving average, percent of GDP Foreign holdings of domestic debt securities, percent of total outstanding
12
10
8
6
4
2
0
-2
-4
-6
Jan-13 Apr-13 Jul-13 Oct-13 Jan-14 Jan-15Apr-14 Apr-15Jul-14 Jul-15Oct-14 Oct-15
45
40
35
30
25
20
15
10
5
0
Aug-11 Aug-12 Aug-13 Aug-14 Aug-15Feb-12 Feb-13 Feb-14 Feb-15 Feb-16
▬ CHN ▬ IDN ▬ MYS ▬ PHL ▬ THA ▬ VNM ▬ IDN ▬ MYS ▬ THA
Sources: Haver Analytics; World Bank staff estimates. Sources: CEIC; World Bank staff estimates.
EAST ASIA AND PACIFIC ECONOMIC UPDATE APRIL 2016
16 PART I. RECENT DEVELoPMENTS AND oUTLooK

Box I.A.4. Capital Flows to East Asia and Pacific13
Capitalflowstoemergingmarketsanddevelopingcountries,includingdevelopingEastAsiaandPacific(EAP),declinedsharplyin2015.Capital inflows to emerging markets slowed to a postcrisis low of 3.1 percent of GDP (US$763 billion), down from 5.3 percent in 2014 (US$1.3 trillion). Net outflows from emerging market bond and equity funds continued for a third consecutive year in 2015 (Figure BI.A.4.1); indeed, net outflows exceeded those during the global financial crisis in 2008. In emerging and developing EAP, 2015 was the second consecutive year of net capital outflows (Figure BI.A.4.2 and Figure BI.A.4.3).
Figure BI.A.4.1. Net capital flows to emerging market fundsUS$, billions
200
150
100
50
0
-100
-50
2008 2009 2010 2011 2012 2013 2014 2015
J Equity funds J Bond funds
Sources: World Bank; Haver Analytics; Bloomberg.
13 Prepared by Karlis Smits and Ekaterine Vashakmadze, with inputs from Kiatipong Ariyapruchya, Noel del Castillo, Karl Kendrick Tiu Chua, Eung Ju Kim, Miguel Eduardo Sanchez Martin, Elitza Mileva, Rafael Munoz Moreno, Shakira Binti Teh Sharifuddin, and Luan Zhao.
(continued)
Capital outflows from emerging marketscontinued at the start of 2016; however, market conditions stabilized in March. January and February 2016 saw outflows from both fixed income and equity funds. Bond issuance dipped to five-year lows, as borrowing costs reached multiyear highs. Measures of volatility surpassed their August 2015 highs. In March, however, net inflows resumed to emerging market funds (Figure BI.A.4.4), bond issuance recovered, and volatility displayed signs of normalization. Estimated FDI inflows also picked up in the first quarter of 2016.
Figure BI.A.4.2. China: balance of payments Figure BI.A.4.3. Developing EAP excl. China: balance of payments
US$, billions US$, billions
500
400
300
200
100
0
-100
-200
-300
-400
-500
2011 2012 2013 2014 Q1–Q3 2015
60
50
40
30
20
10
0
-10
-20
2011 2012 2013 2014 Q1–Q3 2015
J Net capital flows J Current account Q Change in reserves J Net capital flows J Current account Q Change in reserves
Sources: World Bank; Haver Analytics; International Financial Statistics. Sources: World Bank; Haver Analytics; International Financial Statistics.
Financialvolatilityandweakcapitalflowsreflectedconcernsabouttheoutlookfortheglobalandregional economy, and rising risk aversion. Markets have been increasingly concerned about prospects for global growth, including the outlook in China, rising borrowing costs in highly leveraged economies, the impact of low commodity prices on major commodity exporters, and credit rating downgrades. The
GROWING CHALLENGES
I.A. RECENT DEVELoPMENTS 17

turbulence in early 2016 unfolded against the backdrop of exchange rate and capital account liberalization reforms in China. The uncertainty about the nature of China’s current and future exchange rate policy, amid unclear initial policy communication, heightened financial volatility.
Figure BI.A.4.4. Net capital flows to emerging market funds
Figure BI.A.4.5. China: Composition of net capital flows
US$, billions US$, billions
5
4
3
2
1
0
-4
-6
-7
-1
-2
-3
-5
Jan-15 Mar-15 May-15 Jul-15 Sep-15 Nov-15 Jan-16
400
300
200
100
0
-100
-200
-300
-400
-600
-500
2011 2012 2013 2014 Q1–Q3 20152010
▬ EM equity fund ▬ EM bond fund J Net errors & omissions J Net direct investment
J Net portfolio investment J Net other investment
Sources: World Bank; Haver Analytics; Bloomberg. Sources: World Bank; International Financial Statistics.
ThebulkofcapitaloutflowsfromEAPstemmedfromChina.Gross capital outflows from China, excluding foreign direct investment (FDI), are estimated at US$760 billion in 2015. These capital outflows intensified, and the exchange rate came under considerable pressure, after August 2015. They were partly fueled by a change in the method of determining the renminbi’s reference exchange rate, which the markets interpreted as a policy move to weaken the currency. In recent months, clearer communication from the authorities, and greater scrutiny of foreign exchange transactions, have been associated with weaker estimated outflows.
CapitaloutflowsfromChinahavebeenbroad-based,butrepaymentsofcorporateforeignliabilitiesaccounted for a large share. In the first three quarters of 2015, such repayments (which account for a large share of official “net other investment”) are estimated at over half of total net capital outflows (Figure BI.A.4.5). Consistent with this, Chinese external debt (particularly short term debt) declined by US$150 billion over the same period. The remaining capital outflows reflected efforts by residents to diversify their asset portfolios, and to a lesser extent a pullback by nonresidents. Some of these outflows may be shorter-term in nature, in sharp contrast to previous large capital inflows driven by expectations of one-way renminbi appreciation.
Foreign exchange reserves in China have declined by almost US$800 billion, or approximately 20 percent, since mid-2014. Significant amounts of reserves were used to mitigate pressures on the exchange rate in the face of large capital outflows, especially after August 2015 (Figure I.A.19). As a result, the renminbi has remained broadly stable in trade-weighted terms since August 2015, although it has depreciated by 7 percent against the dollar. Since February, and consistent with smaller capital outflows, the loss of reserves has slowed,14 and differences between onshore and offshore exchange rates have narrowed.
14 Reserves declined by only US$31 billion in February 2016, compared to about US$100 billion in January.
(Box I.A.4 continued)
(continued)
EAST ASIA AND PACIFIC ECONOMIC UPDATE APRIL 2016
18 PART I. RECENT DEVELoPMENTS AND oUTLooK

China’scapitaloutflowsareoccurringata timewhenChina’scapitalaccount remainsrelativelyclosed. In recent years efforts have been made to gradually open China’s capital account, relaxing rules related to cross-border flows. Despite the increase in capital outflows, the authorities have not reversed measures to open the capital account. However, regulators have increased scrutiny of cross-border transactions.
The other large regional economies also experienced weakening inflows or net capitaloutflows in2015, but on a smaller scale thanChina. Indonesia continued to experience net capital inflows, partly reflecting strong government bond issuance in the last quarter. However, the magnitude of inflows declined sharply relative to 2014 or the first half of 2015 (Figure BI.A.4.6). Malaysia, the Philippines, and Thailand posted net capital outflows over the past two years. That said, the magnitude of these outflows has been generally smaller than in China, even relative to GDP, implying limited contagion from China to other Asian countries. And, in Malaysia, the outflows moderated in the second half of 2015. The exception is Thailand, where political uncertainty and weak growth prospects have led to large short-term portfolio outflows and a deceleration in inward FDI. In general, whereas in China short-term debt accounted for a large part of capital outflows, in the ASEAN-4, capital outflows have been largely driven by portfolio equity or FDI flows.
Figure BI.A.4.6. Net capital flowsPercent of GDP
8
4
0
-4
-8
CHN IDN MYS PHL THA
J 2011 J 2012 J 2013 J 2014 J Q1–Q3 2015
Sources: World Bank; International Financial Statistics.
(Box I.A.4 continued)
VolatilityincapitalflowswasreflectedinstockpricesinanumberofEAPcountries,whichfell inthelast quarter of 2015 and early 2016, following on from the sharp reversal seen in mid-2015. Overall, Chinese stock markets fell by more than 20 percent over the period from December to February, and are almost 50 percent lower than at their peak in June 2015 (Figure I.A.12). The stock market decline was driven partly by the aforementioned uncertainty about the economic outlook and exchange rate management, partly by weaker-than-expected data, and partly by changes in the rules governing market operation and the ability of major shareholders to sell shares.15 Chinese share prices are now below the trough seen in early August 2015, but they remain higher than in mid-2014, with recent declines reversing only a portion of the cumulative gains during the postcrisis recovery period.
The turbulence in Chinese stock markets spilled over into other equity markets in the region and globally. Correlations between Chinese equities and other large developing EAP share markets picked up in late 2015 and early January, with share prices falling in the Philippines, Thailand, and Vietnam. In general, the declines were less pronounced than in China or the high-income economies, and equity markets in these countries have since recovered to their end-November levels. In contrast, equity prices in Indonesia and Malaysia have been broadly steady or increased since the beginning of the year. In general, recent volatility in external financing to the ASEAN
15 These changes included the scheduled end of a ban on selling shares, which had been imposed on major shareholders, and then the subsequent introduction of circuit breakers, both of which had the effect of putting further downward pressure on Chinese equity prices. The authorities subsequently imposed new restrictions on share sales and abolished the circuit breakers.
GROWING CHALLENGES
I.A. RECENT DEVELoPMENTS 19

countries—which in large part was responsible for these equity price movements—has been mainly confined to portfolio equity flows.
Figure I.A.12. Most equity markets in the region declined in late 2015 and early 2016, but have recovered or at least stabilized more recentlyStock price indexes, local currency terms, June 30, 2014 = 100
125
120
115
110
105
100
95
90
85
80
Jun-14 Aug-14 Oct-14 Dec-14 Feb-15 Apr-15 Jun-15 Aug-15 Oct-15 Dec-15 Feb-16
260
240
220
200
180
160
140
120
100
80
Jun-14 Aug-14 Oct-14 Dec-14 Feb-15 Apr-15 Jun-15 Aug-15 Oct-15 Dec-15 Feb-16
▬ IDN ▬ MYS ▬ PHL ▬ THA ▬ VNM ▬ CHN
Source: CEIC.Note: Benchmark stock indexes (China: Shanghai Composite). Data through March 30, 2016.
Thetighteninginfinancialconditionsalsoaffecteddebtmarkets,causingUSdollarfinancingcostsforboth governments and corporates to rise. External financing conditions tightened markedly in late 2015 and early 2016, as measured by spreads over US Treasury yields for the US dollar bonds of the major EAP issuers (Figure I.A.3). However, spreads increased by less in developing EAP than in emerging markets as a whole, and have since declined, more than unwinding the earlier increase in some cases. With the exception of the Philippines, local currency funding costs for those governments that issue domestic currency bonds have generally declined over recent months, with demand for local currency bonds remaining relatively robust, including from foreign investors in Malaysia and Indonesia (Figure I.A.13).
Net foreign direct investment (FDI) flows havealso declined in a number of large developing EAP countries, reflecting both a decline in incominginvestment and a rise in outbound FDI. China became the world’s largest single recipient of FDI in 2014, with inflows at US$126 billion, or 10.5 percent of total global inflows. However, net inflows declined significantly in 2015, driven mainly by a substantial increase in outbound FDI, but also a sharp decrease in incoming FDI in Q3 2015 (Figure I.A.14). Net inward FDI to Thailand in the second and third quarters of 2015 was almost 60 percent lower than in the corresponding period of 2014 (Figure I.A.15). In Indonesia, 2015 saw the highest gross FDI inflows since 1990, both in dollar terms and relative
Figure I.A.13. Local currency government bond yields have declined recently in Indonesia, Malaysia, and ThailandChange in 10-year benchmark yield of local-currency government bonds from end-November 2015 to end-March 2016, basis points
80
60
40
20
0
-20
-40
-60
-100
-80
MYS PHLTHA VNMIDN USA
Sources: Haver Analytics; CEIC; JP Morgan.
EAST ASIA AND PACIFIC ECONOMIC UPDATE APRIL 2016
20 PART I. RECENT DEVELoPMENTS AND oUTLooK

to GDP (3 percent); however, net FDI dropped off in the last two quarters. In the Philippines, FDI has lagged, partly owing to regulatory restrictions. In contrast, FDI inflows to Vietnam have remained buoyant, and have been mostly directed at labor-intensive manufacturing (UNCTAD 2015).
Figure I.A.14. Outbound FDI from China increased markedly in 2015
Figure I.A.15. Net FDI flows declined in Indonesia and Thailand during 2015
China foreign direct investment, US$ billion Net foreign direct investment, 4-quarter sum, US$ billion
400
300
200
100
0
-100
-200
2007 2008 2009 2010 2011 2011 2013 2014 2015 2015h1 2015h2
20
15
10
5
0
-5
-10
-15
Jun-07 Jun-08 Jun-09 Jun-10 Jun-11 Jun-12 Jun-13 Jun-14 Jun-15
J FDI inflows J FDI outflows ▬ Net FDI ▬ IDN ▬ MYS ▬ PHL ▬ THA ▬ VNM
Source: Haver Analytics. Source: Haver Analytics.
Despite substantial depreciations against the US dollar, most major EAP exchange rates have been stable or appreciated in real effective terms since the start of 2015
In China, the renminbi has depreciated by 7 percent against the US dollar since August 2015, but has remained broadly stable in trade-weighted terms. China has continued its process of exchange rate liberalization in recent months,16 leading to a gradual depreciation of the renminbi against the US dollar. The central bank has set the daily renminbi exchange rate against the US dollar at a level more reflective of market movements, and has increased its emphasis on stabilizing the currency against a trade-weighted basket rather than against the US dollar alone.17
Most other Asian and emerging market currencies have appreciated against the US dollar since their late September lows. After steep declines through the end of September 2015, the Indonesian rupiah rebounded sharply against the US dollar and has more
16 As a result, the International Monetary Fund decided in November to add the renminbi to the basket of currencies that comprise its Special Drawing Right, on the basis of its assessment that the renminbi was “freely usable.”
17 The China Foreign Exchange Trade System (CFETS) announced in December that it would regularly publish trade-weighted indexes of the renminbi exchange rate.
Figure I.A.16. After weakening sharply against the US dollar in mid-2015, most exchange rates have since recovered at least partiallyUS$ exchange rate, June 30, 2014 = 100
105
100
95
90
85
80
75
70
Jun-14 Jun-15Sep-14 Sep-15Dec-14 Dec-15Mar-15 Mar-16
▬ CHN ▬ IDN ▬ MYS ▬ PHL ▬ THA ▬ VNM
Source: CEIC.Note: Data through March 30, 2016.
GROWING CHALLENGES
I.A. RECENT DEVELoPMENTS 21

recently appreciated to around its mid-2015 level (Figure I.A.16). In contrast, Malaysian ringgit has recovered less from its earlier depreciation. Taking a longer two-year perspective, the currencies of both commodity exporters have come under the most pressure, reflecting the decline in major commodity prices over this period. Commodity-importing Thailand and the Philippines experienced less pressure on their currencies, with exchange rates depreciating by 5 to 10 percent against the US dollar.
However, given the broad-based appreciation of the US dollar since the start of 2015, the exchange rate movements in the region have been quite different in real effective terms. Among the major economies, only Malaysia and Thailand have seen a decline in their real effective exchange rates (REERs), while REERs have stayed broadly steady in Indonesia, and appreciated in China and the Philippines18 (Figure I.A.17 and Figure I.A.18). This is because the US dollar has experienced a strong and broad-based appreciation since June 2014, leaving it 22 percent higher on a trade-weighted basis. This reflected in large part the pricing-in of divergent monetary policy, with expectations of a steady rise in the US federal funds rate contrasting with continued aggressive quantitative easing in the Euro Area and Japan. As a result, across the region, depreciation against the US dollar has been much more pronounced than against the euro and yen. Ultimately, this implies that US dollar exchange rates currently do not necessarily provide a representative picture of trade competitiveness or inflationary pressures among developing EAP economies.
Figure I.A.17. Major EAP currencies have fallen sharply against the US dollar over the past year, but adjusted more moderately in trade-weighted terms
Figure I.A.18. In real trade-weighted terms, exchange rates are generally around their early 2015 levels, with the exceptions of Malaysia and Thailand
Change from December 2014 to January 2016, percent Real effective exchange rate, 2010 = 100
10
5
0
-5
-10
-15
-20
-25
-30Changevs USD
Changevs EUR
Changevs JPY
Changein NEER
Changein REER
140
130
120
100
110
90
80
Jan-10 Jan-11 Jan-12 Jan-13 Jan-14 Jan-15 Jan-16
J China CNY J Philippines PHP J Thailand THB J Indonesia IDR J Malaysia MYR ▬ CHN ▬ IDN ▬ MYS ▬ PHL ▬ THA
Sources: Bank for International Settlements; CEIC; World Bank staff estimates.Note: Increase indicates appreciation. NREER = nominal effective exchange rate.
Sources: Bank for International Settlements; World Bank staff estimates.
Foreign exchange reserves declined in China and in the commodity exporters
International reserves in dollar terms also decreased across the region during 2015, in China and in commodity exporters. In absolute terms, the largest drop in reserves was in China, where foreign currency reserves have declined by almost US$800 billion, or approximately 20 percent, since their peak in mid-2014 (Figure I.A.19). Commodity exporters Indonesia and Malaysia tapped reserves when their currencies came under
18 Based on Bank for International Settlements estimates.
EAST ASIA AND PACIFIC ECONOMIC UPDATE APRIL 2016
22 PART I. RECENT DEVELoPMENTS AND oUTLooK

strong pressure in the second half of the year (Figure I.A.20). In contrast, reserves were broadly stable in Thailand and the Philippines. The decline in gross reserves in developing Asia’s larger economies was attributable mainly to active intervention by central banks to lean against currency depreciation or to smooth day-to-day volatility, but also reflected negative valuation effects, as non-US dollar holdings depreciated in US dollar terms. Despite these declines, ratios of reserves to imports and reserves to short-term debt financing requirements remain adequate. While the fall in reserves has been particularly marked in China, potential vulnerabilities are reduced by its ability to impose capital account restrictions and by state ownership of much of the domestic banking system.
Figure I.A.19. China’s foreign currency reserves have declined since their peak in June 2014
Figure I.A.20. International reserves also fell in 2015 in Malaysia and Indonesia
US$ billion Change in gross reserves, US$ billion
4,500
4,000
3,500
3,000
2,500
2,000
1,500
1,000
500
0
Jan-10 Jan-11 Jan-12 Jan-13 Jan-14 Jan-15 Jan-16
40
30
20
10
0
-10
-20
-30
Indonesia Malaysia Philippines Thailand Vietnam
J 2010 J 2011 J 2012 J 2013 J 2014 J 2015
Source: Haver Analytics. Source: Haver Analytics.Note: 2015 denotes year to end-November for Vietnam.
In the smaller commodity exporters, central banks intervened to support the currency in response to balance-of-payment pressures. Central banks in Mongolia and Papua New Guinea supplied foreign exchange to the market to support the exchange rate. Despite substantial declines in the terms of trade, only marginal depreciations against the US dollar were recorded, while nominal and real effective exchange rates have appreciated in these economies over the last year.
Inflationremainslow,duetodecliningfuelandcommodityprices,slowingdomestic demand, and excess capacity in some sectors and economies
Downward pressure on commodity prices was evident through early 2016, although there have been recent signs of a recovery in oil prices (Figure I.A.21). Global oil prices in US dollar terms fell by approximately 15 percent over the year to February, following a 40 percent decline over the previous year. Much of this can be attributed to supply-side developments, including resilient shale oil production in the United States and increased exports from the Middle East; slower-than-expected growth in global demand also had an effect (World Bank Commodity Markets Outlook, January 2016). That said, oil prices recovered in March to their December 2015 levels. Aggregate nonenergy commodity prices in February were almost 13 percent below their level a year earlier. Price declines have been less marked in local currency terms, reflecting the appreciation of the US dollar over the period.
GROWING CHALLENGES
I.A. RECENT DEVELoPMENTS 23

Figure I.A.21. Global commodity prices continued to declineCommodity price index, year-on-year change, percent
100
80
60
40
20
-20
0
-40
-60
-80
Jan-10 Jan-11 Jan-12 Jan-13 Jan-14 Jan-15 Jan-16Jan-09Jan-08Jan-07Jan-06Jan-05
▬ Energy ▬ Nonenergy
Source: World Bank.
Lowerfuelpricescontinuetoprovideasignificantdisinflationary impulse across the region (Figure I.A.22). Lower global commodity prices feed into wholesale prices, which continued to decline in China, Malaysia, and Thailand in the second half of 2015. While broadly consistent with drops in commodity input prices, the disinflationary trend has been widespread across sectors, with a shortfall of demand relative to supply exacerbating downward pressures on producer prices across a range of goods. In particular, the impact of excess industrial capacity—particularly in heavy industries such as steel and cement—has been an important contributor to persistent deflation in producer prices in China (Figure I.A.23).
Figure I.A.22. Lower oil prices contributed to lower inflation in EAP over 2015
Figure I.A.23. Producer prices, have continued to decline, particularly in China
Year-on-year change, percent Percent Producer Price Index, year-on-year change, percent
100 10
80 8
60 6
40 4
20 2
-20 -2
0 0
-40 -4
-60 -6
-80 -8
Aug-10 Aug-12 Aug-14Apr-11 Apr-13 Apr-15Dec-11 Dec-13 Dec-15
15
10
5
0
-5
-10
Aug-10 Aug-12 Aug-14Apr-11 Apr-13 Apr-15Dec-11 Dec-13 Dec-15
▬ Brent ▬ Average CPI, rhs ▬ CHN ▬ MYS ▬ PHL ▬ THA
Source: Haver Analytics.Note: Simple average CPI for developing East Asian economies (excluding Myanmar). CPI = Consumer Price Index; rhs = right-hand side.
Source: Haver Analytics.
Consumerpriceinflationremainedcontainedacrosstheregionoverthesecondhalfoftheyear,benefitingfrom the reduction in global fuel prices since 2014. Despite substantial exchange rate depreciations against the US dollar, in most cases currency movements in trade-weighted terms have been much more muted, and hence have had little inflationary impact. In China, both core and headline consumer price inflation have been broadly stable, and well below the central bank’s 3 percent target (Figure I.A.24). In Malaysia, retail prices picked up in the second half of 2015, with the sharp depreciation having some effect on import prices, but inflation remained contained overall due to low fuel prices and slower wage growth. Thailand saw deflation in consumer prices in 2015, and in Vietnam inflation fell to below 1 percent, its lowest rate since 2001. Inflation in Indonesia remained faster than elsewhere in the region—even though the effect of the policy-induced increase in fuel prices in late 2014 proved only temporary—and food price inflation remains stubbornly high.
EAST ASIA AND PACIFIC ECONOMIC UPDATE APRIL 2016
24 PART I. RECENT DEVELoPMENTS AND oUTLooK

Figure I.A.24. In most of the larger EAP economies, inflation has remained low and relatively stable over the past year
Figure I.A.25. In Mongolia, policy tightening helped to rein in inflation, while Myanmar saw rapid inflation due to the effects of flooding and exchange rate depreciation
Headline inflation, year-on-year, percent Headline inflation, year-on-year, percent
10
8
6
2
4
0
-2
Jan-13 Jul-13 Jan-14 Jul-14 Jan-15 Jul-15 Jan-16
20
15
10
5
0
-5
Jan-13 Jul-13 Jan-14 Jul-14 Jan-15 Jul-15 Jan-16
▬ CHN ▬ IDN ▬ MYS ▬ PHL ▬ THA ▬ KHM ▬ LAO ▬ MMR ▬ MNG ▬ VNM
Source: Haver Analytics. Source: Haver Analytics.
Among the smaller economies, policy tightening and slowing domestic demand amid weak FDI in Mongolia curtailedinflationmomentum(Figure I.A.25). Inflation pressures remain contained in Lao PDR and Vietnam. In Myanmar, a combination of a supply shock caused by flooding and currency depreciation led to a rapid rise in inflation in 2015, peaking at 16 percent year-on-year in october 2015, with food prices the major driver. However, prices have since declined.
Exports from EAP countries remain weak, particularly in values terms, but current account balances have generally improved as a result of import compression
Developing EAP, which accounts for more than a quarter of world trade, was the major driver of the global trade downturn in the second half of 2015 (Figure I.A.26). over 2015, export volumes for developing EAP countries were flat to declining, with only modest pickups in Indonesia and Malaysia (Figure I.A.27).
Therecentslowingintrade—bothindevelopingEAPandglobally—reflectsbothcyclicalandstructuralfactors. While part of the slowing reflects the slowdown in regional and global growth (and weaker demand from major commodity exporters in particular), there are also signs that growth has become less trade-intensive. In particular, ongoing structural changes in China have magnified the effect of its slowdown on its demand for imports. On the production side, the slowdown in GDP has been concentrated in the industrial sector, which depends to a larger extent on imported inputs than other sectors of the economy. Moreover, the import intensity of China’s investment, which is beginning to decline as a share of GDP, is more than 50 percent higher than the import intensity of consumption (World Bank 2016c).
The contraction of the US dollar value of exports from EAP economies has been even more marked, given the weakening of regional currencies against the US dollar, and downward pressure on commodity prices (Figure I.A.28). That said, a large fraction of developing EAP’s exports are manufactured products, which generally
GROWING CHALLENGES
I.A. RECENT DEVELoPMENTS 25
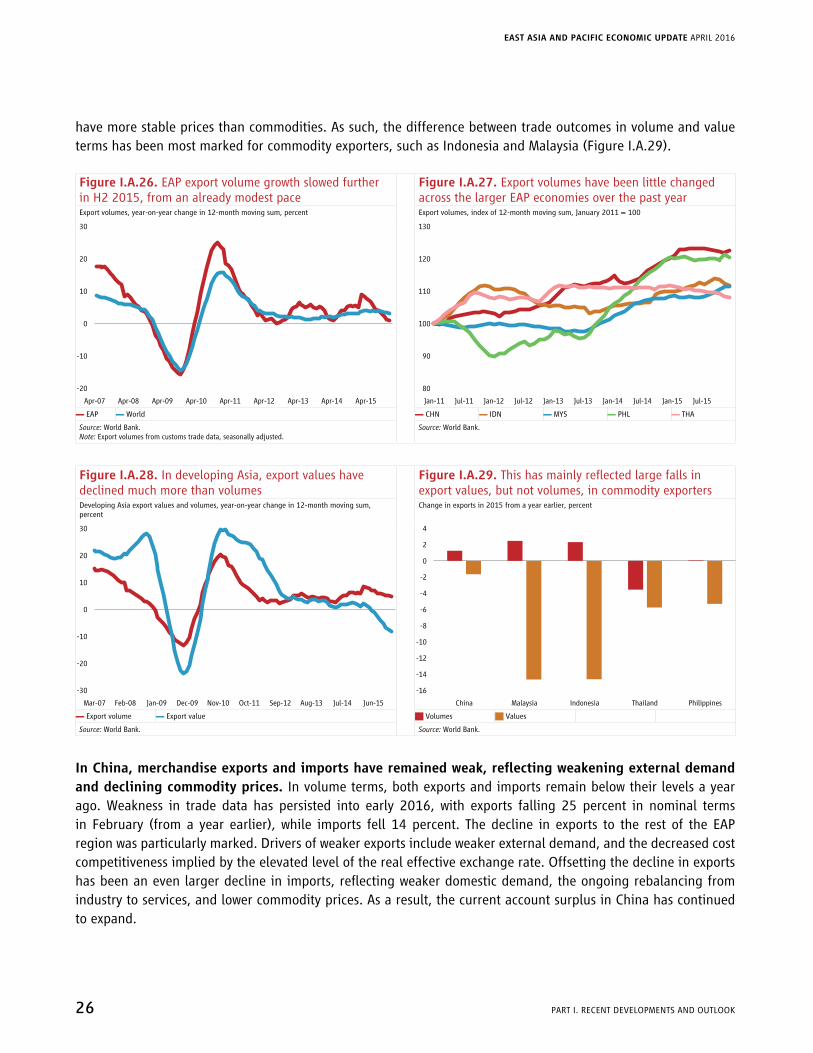
have more stable prices than commodities. As such, the difference between trade outcomes in volume and value terms has been most marked for commodity exporters, such as Indonesia and Malaysia (Figure I.A.29).
Figure I.A.26. EAP export volume growth slowed further in H2 2015, from an already modest pace
Figure I.A.27. Export volumes have been little changed across the larger EAP economies over the past year
Export volumes, year-on-year change in 12-month moving sum, percent Export volumes, index of 12-month moving sum, January 2011 = 100
30
20
10
-10
0
-20
Apr-07 Apr-09 Apr-10 Apr-11 Apr-12 Apr-13 Apr-14Apr-08 Apr-15 Jan-11 Jul-11 Jan-12 Jul-12 Jan-13 Jul-13 Jan-14 Jan-15Jul-14 Jul-15
130
120
110
90
100
80
▬ EAP ▬ World ▬ CHN ▬ IDN ▬ MYS ▬ PHL ▬ THA
Source: World Bank.Note: Export volumes from customs trade data, seasonally adjusted.
Source: World Bank.
Figure I.A.28. In developing Asia, export values have declined much more than volumes
Figure I.A.29. This has mainly reflected large falls in export values, but not volumes, in commodity exporters
Developing Asia export values and volumes, year-on-year change in 12-month moving sum, percent
Change in exports in 2015 from a year earlier, percent
30
20
10
-10
0
-30
-20
Mar-07 Feb-08 Jan-09 Dec-09 Nov-10 Oct-11 Sep-12 Aug-13 Jul-14 Jun-15
4
2
0
-2
-4
-6
-8
-10
-12
-14
-16
China Malaysia Indonesia Thailand Philippines
▬ Export volume ▬ Export value J Volumes J Values
Source: World Bank. Source: World Bank.
InChina,merchandiseexportsandimportshaveremainedweak,reflectingweakeningexternaldemandand declining commodity prices. In volume terms, both exports and imports remain below their levels a year ago. Weakness in trade data has persisted into early 2016, with exports falling 25 percent in nominal terms in February (from a year earlier), while imports fell 14 percent. The decline in exports to the rest of the EAP region was particularly marked. Drivers of weaker exports include weaker external demand, and the decreased cost competitiveness implied by the elevated level of the real effective exchange rate. Offsetting the decline in exports has been an even larger decline in imports, reflecting weaker domestic demand, the ongoing rebalancing from industry to services, and lower commodity prices. As a result, the current account surplus in China has continued to expand.
EAST ASIA AND PACIFIC ECONOMIC UPDATE APRIL 2016
26 PART I. RECENT DEVELoPMENTS AND oUTLooK

Export earnings have fallen particularly sharply for EAP commodity exporters. In Indonesia, the sharp fall in the prices of key commodity exports—coal, palm oil, petroleum, natural gas, rubber, and copper—since 2011 has led to a contraction in export earnings in each of the last four years, including a decline of almost 15 percent in 2015. The value of commodity-related exports from Malaysia fell from 29 percent of GDP in 2014 to 18 percent of GDP in 2015, although this decline was partially offset by increases in manufacturing exports such as electrical and electronic products, with the sharp ringgit depreciation helping to cushion the effect of the commodity price decline. Exports from Mongolia declined by 20 percent in 2015 (compared with a 35 percent increase in 2014) due to weak prices for coal and copper and slowing demand from its main trading partner, China.
However,significantimportcompressionhasmoderatedtheeffectontradeandcurrentaccountbalancesin these countries, with effects varying across countries depending on their oil and gas trade balance. Despite the fall in export earnings, the current account deficit in Indonesia narrowed in 2015 owing to a significant contraction in imports driven by moderating domestic demand and a lower oil import bill (Figure I.A.30). The current account deficit in Mongolia also declined for similar reasons (Figure I.A.31). In Malaysia, a large net exporter of oil and gas, the current account surplus declined from 4.9 percent of GDP in 2014 to 2.9 percent of GDP in 2015. In Lao PDR, the current account deficit increased slightly to 11.6 percent of GDP in 2015, since lower oil prices were insufficient to compensate for the impact of lower copper prices and lower demand for timber from China and Vietnam. With exports of liquefied natural gas reaching full capacity in Papua New Guinea, the current account recorded a surplus of 4.1 percent in 2015 after a deficit of the same magnitude the previous year. In Myanmar and Timor-Leste, import demand has accelerated due to strong demand for investment-related capital imports.
Figure I.A.30. Current account balances rose or remained steady in the major EAP economies, except in Malaysia
Figure I.A.31. Mongolia’s current account deficit narrowed rapidly, as imports fell
Current account balance, 4-quarter moving average, percent of GDP Current account balances, 4-quarter moving sum, US$ million
Jan-13 Apr-13 Jul-13 Oct-13 Jan-14 Jan-15Apr-14 Apr-15Jul-14 Jul-15Oct-14 Oct-15
10
8
6
4
2
0
-2
-4
-6
0
-4,000
-3,500
-3,000
-2,500
-2,000
-1,500
-1,000
-500
Mar-13 Jun-13 Sep-13 Dec-13 Mar-14 Mar-15Jun-14 Jun-15Sep-14 Sep-15Dec-14 Dec-15
▬ CHN ▬ IDN ▬ MYS ▬ PHL ▬ THA ▬ MNG ▬ KHM ▬ LAO
Sources: Haver Analytics; World Bank. Sources: CEIC; World Bank.
Decliningcommoditypriceshavehelpedimprovecurrentaccountbalances(andboostedrealincomes)incommodity-importing countries. In Thailand, the current account surplus expanded further in the second half of the year despite a decline in exports, due to a sharp drop in imports caused by persistent low energy prices and weak domestic demand for raw materials and intermediate goods. The Philippines’ current account has remained robustly in surplus in recent years, providing some measure of resilience against the risk of a spike in capital outflows.
GROWING CHALLENGES
I.A. RECENT DEVELoPMENTS 27

Fiscal space has become more limited in most EAP economies, with lower commodity prices posing a major budgetary challenge for commodity producers
InChina, thegovernmenthas implementeda rangeoffiscalmeasures to stimulateeconomicgrowth,whichledtoawideningofthefiscaldeficit.These measures include financial support for infrastructure projects and tax cuts for small businesses. The fiscal deficit in 2015 hit a six-year high of around 2.5 percent of GDP. Government debt is estimated to have risen to 43.5 percent of GDP in 2015 from a low of around 32 percent in 2008, although the vast majority of this is held by local investors. The government also faces significant contingent liabilities associated with state-owned enterprises and local government debt.
ThelargerEAPcommodityexporterswereabletocontainorevenreducetheirfiscaldeficits in2015,despite revenue losses from lower commodity prices. In Malaysia, a number of measures reduced the impact of the decline in commodity prices on government finances, including the removal of fuel subsidies and the introduction of a Goods and Services Tax (GST) in April, which helped diversify the government’s revenue base. Without these measures, as well as additional actions to reduce operating expenditures, estimates suggest that the fiscal deficit would have widened to 4.2 percent of GDP in 2015, compared with the 3.2 percent target that was actually met (Figure I.A.32). These actions followed a strong track record of fiscal consolidation in recent years, with government debt stabilizing as a share of GDP, although at a relatively high level (Figure I.A.33). In Indonesia, however, where public debt remains moderate, the government has chosen to increase the fiscal deficit modestly, so as to preserve public investment amid lower-than-expected revenues. Nevertheless, the government also introduced a series of measures to control expenditures—including postponing certain transfers to subnational governments, and cutting fuel subsidies from 2.3 percent of GDP in 2014 to 0.5 percent of GDP in 2015—as well as to improve tax administration and revenue collection.
Figure I.A.32. Fiscal deficits have narrowed significantly in Malaysia and the Philippines
Figure I.A.33. Government debt remains moderate in Indonesia and Thailand, but is rising rapidly in Vietnam and relatively high in Malaysia
Fiscal balance, percent of GDP Government debt, percent of GDP
1
0
-1
-2
-3
-4
-5
-6
-7
-8
CHN IDN PHL THA MYS VNM
60
50
40
20
30
0
10
CHN IDN MYS THA PHL VNM
J 2012 J 2013 J 2014 J 2015 J 2012 J 2013 J 2014 J 2015
Source: World Bank staff estimates.Note: General government fiscal balance except for Indonesia, for which the central government fiscal balance is shown.
Source: Bank for International Settlements (BIS), World Bank staff estimates.Note: BIS estimates of general government debt for China, Indonesia, Malaysia, and Thailand.
Inthesmallercommodityexporters,resource-relatedrevenuesdroppedsharplyin2015,butsignificantfiscaladjustmentshave inmost casesmitigated thebudget impacts. In Papua New Guinea, tax revenue
EAST ASIA AND PACIFIC ECONOMIC UPDATE APRIL 2016
28 PART I. RECENT DEVELoPMENTS AND oUTLooK

from minerals and petroleum in 2015 was approximately one-sixth of the budget assumption. In Lao PDR, lower commodity prices adversely affected royalties and taxes on mining, and excises and the value-added tax on oil. In Timor-Leste, mineral and petroleum taxes fell by 45 percent between 2014 and 2015. In response, several countries took measures on both the revenue and expenditure side (Box I.A.5). Nevertheless, the 2015 budget deficit was higher than originally planned in Mongolia, Papua New Guinea, and especially Timor-Leste, where it exceeded the ceiling consistent with a sustainable fiscal path by 20 percent.
Box I.A.5. Confronting the Challenges Facing Commodity Exporters in East Asia and Pacific19
ThisboxfocusesonfourcommodityexportersindevelopingEAP:LaoPDR,Mongolia,PapuaNewGuinea, and Timor-Leste. The rapid decline in commodity prices which began in mid-2014 has affected their short-to-medium-term growth prospects (Table I.B.1), as well as their fiscal and external positions, although the magnitude of the impact differs across countries. These economies face significant challenges in adjusting to price signals and reallocating resources across sectors. Measures to develop their institutions and their physical and human capital will enable them to respond better to changes in the external environment in general, and future commodity price downturns in particular.
The impact of the commodity price downturn
The fall in commodity prices between 2014 and 2015 adversely affected the terms of trade of commodity exporters (Figure BI.A.5.1 and Figure BI.A.5.2). Timor-Leste and Papua New Guinea experienced a particularly adverse shock, Mongolia and Lao PDR a somewhat smaller one. In general, the decline in the commodity terms of trade was most pronounced in countries that are net exporters of energy commodities (crude oil, natural gas, and coal), for two reasons. First, energy commodities experienced a greater price decline (45 percent) than metals and minerals (15 percent) or agricultural commodities (13 percent). Second, exporters of nonenergy commodities reaped benefits from lower world prices for energy, which tends to account for a significant portion of their import basket. In contrast, energy exporters gained relatively little from lower world prices for nonenergy commodities, since these typically account for a relatively small share of their import basket.
The decline in commodity prices was associated with a sharp fall in export values, but in several cases only a limited deterioration, or an outright increase, in current account balances (Table BI.A.5.1). The current account was positively affected by lower oil import bills, some broader import compression, and country-specific supply-side factors.20
19 Prepared by Chandana Kularatne, with inputs from Davaadalai Batsuuri, Somneuk Davading, David Knight, Taehyun Lee, Evgenij Najdov, Keomanivone Phimmahasay, and Altantsetseg Shiilegmaa.
20 In 2015, in Lao PDR, copper and gold prices, and demand for timber from China and Vietnam, fell sharply. The decline in oil import values could not fully compensate for this, and the current account deficit increased slightly. In Mongolia, exports declined by 19 percent. However, the trade and current account deficits fell sharply, reflecting a 40 percent decrease in the oil import bill, and a steep decline in investment-related imports. In Papua New Guinea, production of liquefied natural gas is reaching full capacity, offsetting any price effects and pushing the current account from a deficit to an expected surplus. See also Part III, “Country Pages.”
(continued)
GROWING CHALLENGES
I.A. RECENT DEVELoPMENTS 29

Figure BI.A.5.1. Change in price of leading export commodity
Figure BI.A.5.2. Change in commodity terms of trade, 2014–15
Percent change Percent change
0
-10
-20
-30
-40
-50
-60
-70
20 30 40 50 60 70 80 90 100
Lao PDR (copper)
Papua New Guinea (gas)
Mongolia (copper concentrates)
Timor-Leste (oil)
10
0
-10
-20
-30
-40
-50
VEN
AZE
AGO
TKM
KAZ
COD
RUS
TMP
NGANO
RBO
LPN
GMNG
PRY
GHAZM
BID
NMYS CH
LLA
OEA
P
Share of exports J Energy J Food & beverages J Agricultural raw materials
J Metals & minerals Q Terms of trade
Source: World Bank staff estimates. Source: World Bank staff estimates.Note: Commodity terms of trade calculated using the methodology of World Bank (2015). Energy commodities comprise crude oil, natural gas, and coal. Metals and minerals (including precious metals) comprise aluminum, copper, gold, iron ore, lead, nickel, silver, tin, and zinc. Agricultural commodities (food, beverages, and raw materials) comprise bananas, beef, cocoa, coffee, cotton, groundnuts, groundnut oil, logs, maize, oranges, palm oil, plywood, rice, rubber, sawn wood, sorghum, soybeans, soybean meal, soybean oil, sugar, tea, tobacco, wheat, and wood pulp.
Table BI.A.5.1. External account indicators Current account balance / GDP
(percent)Foreign exchange reserves
(months of import cover, end of period)2014 2015 2014 2015
Lao PDR -11.2 -11.6 1.7 2.2Mongolia -11.5 -4.8 4 3.5Papua New Guinea -4.3 4.2 3.6 2.9Timor-Leste 24.5 13.6 3.1 3.6Sources: IMF; World Bank staff estimates.
Exchangeratemovementsweresignificantlysmallerthanobservedinothercommodityexporters (Figure BI.A.5.3). In Mongolia and Papua New Guinea, depreciation against the US dollar was limited by central bank interventions in the foreign exchange market (Table BI.A.5.1). In Lao PDR, robust capital inflows, related to continuing construction projects in the power and real estate sectors and significant public external borrowing, eased pressure on the exchange rate and foreign reserves. In Timor-Leste, a dollarized economy, the nominal and real effective exchange rate appreciated in line with the broad-based strength of the US dollar.
Thedownturnincommoditypricesledasignificantreductioninresource-relatedrevenues(Figure BI.A.5.4). In Papua New Guinea, tax revenue from minerals and petroleum in 2015 was approximately one-sixth of the budget assumptions. In Lao PDR, royalties and taxes on mining exports, and excises and value-added taxes on oil imports, were adversely affected. In Timor-Leste, mineral and petroleum taxes fell
(continued)
(Box I.A.5 continued)
EAST ASIA AND PACIFIC ECONOMIC UPDATE APRIL 2016
30 PART I. RECENT DEVELoPMENTS AND oUTLooK

by 45 percent between 2014 and 2015.21 In Mongolia, however, mineral taxes were buoyed by increased copper and gold exports from the new Oyu Tolgoi mine, and petroleum taxation was raised sharply.22
Figure BI.A.5.3. Change in US dollar exchange rate and in commodity terms of trade, between 2014 and 2015
Figure BI.A.5.4. Mineral and petroleum tax revenue
Percent change, USD exchange rate 2014–15 Percent of total revenues, excluding grants
0
-10
-20
-30
-40
-50
-45 -40 -35 -30 -25 -20 -15 -10 -5 0
RUS
AZE
AGO
NOR
NGAKAZ
TKM
COD TMP BOL
MNG
PNGPRY
GHA
ZMB
MYS
IDN
LAO
VNZ
CHL
100
90
80
70
60
50
40
30
20
10
0
Lao PDR
10.2 8.6
Mongolia
18.823.3
Papua New Guinea
7.22.7
Timor-Leste
73.1
87.1
∆ Commodity terms of trade J 2014 J 2015
Sources: IMF; World Bank staff estimates. Source: World Bank staff estimates.
Table BI.A.5.2. Fiscal outcomes in 2015: planned compared to revisedPercent of GDP
Revenue Expenditure Budget balance1
Planned Revised Planned Revised Planned Revised
Lao PDR 24.1 23 28.8 26.7 -4.7 -3.7Mongolia2 27.8 25.8 32.7 30.9 -5 -5.1Papua New Guinea 27.6 24.8 32.4 29.7 -4.7 -4.9Timor-Leste 57.8 43.8 41 51.8 16.8 -8.0Source: World Bank staff estimates.Note: “Planned” refers to original budget estimates, “revised” to current projections. 1) Differs marginally from the published budget balance owing to rounding errors. 2) Mongolia’s official budget excludes the off-budget expenditures of the Development Bank of Mongolia.
Fiscal policy was adjusted in response to the revenue shortfall, mitigating the budget impacts. On the revenue side, Lao PDR introduced a new methodology for calculating import tariffs and excises (moving from reference to actual prices), and increased excises on luxury goods and the road fund fee (levied on fuels). The enforcement of regulations for nonresource taxes was strengthened, and payment of taxes was facilitated. Mongolia increased excises and customs duties on petroleum products. On the expenditure side, Lao PDR cut total spending by more than 2 percent of GDP, including by freezing wages and limiting new hires to less than half the level in previous years. In Mongolia, a supplementary budget reduced spending by 8.7 percent relative to the original plans. In particular, capital expenditures (including off-budget development spending) were cut sharply, and wage increases were postponed. Papua New Guinea
21 However, their ratio to total revenue increased, since the latter fell by an even sharper 54 percent.
22 Petroleum tax revenues also increased sharply, owing to a higher petroleum tax.
(Box I.A.5 continued)
(continued)
GROWING CHALLENGES
I.A. RECENT DEVELoPMENTS 31

also passed a supplementary budget, reducing spending by 8.3 percent relative to the original budget. Even taking into account these responses, the 2015 budget deficit was higher than originally planned in Mongolia, Papua New Guinea, and Timor-Leste, although it actually fell in Lao PDR (Table BI.A.5.2).
How can commodity-exporting countries become more resilient?
A key policy challenge for commodity exporters is how to increase their resilience to changes in commodity prices. This involves two separate but related issues: ensuring that overall economic activity, fiscal revenue, and external positions are less affected by short-term commodity price volatility; and boosting their overall prospects in the face of projections of persistently low commodity prices.
Policyshouldfocusonalleviatingsupply-sidebottlenecks,ratherthantargetexportdiversificationper se. Limited export diversification need not be detrimental to productivity growth and job creation, or lead to excessive economic volatility (Gill et al. 2014). Conversely, export diversification is not sufficient to ensure resilience to shocks. Rather, commodity exporters should in general focus on strengthening their institutions, including their capacity to further develop their human and physical capital base. This will improve the economy’s ability to respond to changes in the external environment in general, and future commodity price downturns in particular.
Measurestoimproveinstitutionalqualityshouldfocusonstrengthening(a)macroeconomic policy coordination and the management of natural resource volatility; (b) the capacity of the publicadministration to effectively deliver public services, such as health, education, and infrastructure; and(c)competition policy and the regulation of private enterprise. The first set of measures would directly mitigate macroeconomic volatility resulting from commodity price shocks. Improving public service delivery would increase the economy’s stock of human and physical capital, enhance its ability to adjust in response to external shocks, including changes in key commodity prices, and hence boost potential output. Similarly, fostering a more competitive and business-friendly environment would provide a solid foundation for the development of the private sector, and ensure that the most efficient and adaptable firms (in both the resource and nonresource sectors) can succeed.
Lao PDR, Mongolia, Papua New Guinea, and Timor-Leste are currently characterized by limited institutional strength. For instance, in Mongolia, Papua New Guinea, and Timor-Leste, the Country Policy and Institutional Assessment (CPIA) score, a measure of broad institutional quality, falls below the average for International Development Assistance countries, although it exceeds the average for Sub-Saharan oil exporters (Figure BI.A.5.5).23 Again, the aggregate World Governance Indicators show that all four countries perform worse than the developing EAP average, with Lao PDR and Timor-Leste performing especially poorly (Figure BI.A.5.6). Similarly, in the Global Competitiveness Index’s institutional score, Lao PDR, Mongolia, and Timor-Leste ranked 71st, 95th, and 136th, respectively, across 144 countries (Schwab and Sala-i-Martin 2015).24
23 Indeed, Timor-Leste is categorized as a fragile state based on its Country Policy and Institutional Assessment score.
24 For Lao PDR and Mongolia, data refer to 2015, when 140 countries were ranked. For Timor-Leste, data refer to 2014, when 144 countries were ranked. There are doubts about whether the data for Lao PDR correctly reflect its de facto institutional weaknesses.
(Box I.A.5 continued)
(continued)
EAST ASIA AND PACIFIC ECONOMIC UPDATE APRIL 2016
32 PART I. RECENT DEVELoPMENTS AND oUTLooK

Figure BI.A.5.5. CPIA Average, 2014 Figure BI.A.5.6. World Governance Indicators, 2013axis label Average estimate
3.5
3.4
3.3
3.2
3.1
3.0
2.9
2.8
Lao PDR Mongolia Papua New Guinea Timor-Leste
3.36
3.25
3.17
3.06
IDA
EAP (developing)
-1.0 -0.8 -0.6 -0.4 -0.2 0 0.2
EAP
MNG
PNG
TMP
LAO
-0.2
0.1
-0.6
-0.8
-0.8
Source: World Bank.Note: CPIA = Country Policy and Institutional Assessment; IDA = International Development Assistance.
Source: World Bank.
As a result, all four countries face significant challenges in delivering public services. All four countries, and Timor-Leste in particular, score poorly in terms of the World Governance Indicators’ measure of government effectiveness (Figure BI.A.5.7). This has adversely affected education, health, and infrastructure outcomes.25 For instance, Lao PDR, Papua New Guinea, and Timor-Leste perform relatively poorly within developing EAP on the Human Development Index; Papua New Guinea, in particular, ranks 158th out of 188 countries (Figure BI.A.5.8). In 2014, Mongolia was ranked 135th out of 160 countries in the World Bank’s Logistics Performance Index (Figure BI.A.5.9). Out of the various dimensions of logistics, the four countries perform especially poorly in the provision of infrastructure (Figure BI.A.5.10). The quality and quantity of infrastructure in both network industries, including the communication, energy, and transportation sectors, and the water and sanitation sector, is extremely limited.
Figure BI.A.5.7. Government effectiveness score, 2013
Figure BI.A.5.8. Human Development Index score, 2014
-1.4 -1.2 -1.0 -0.8 -0.6 -0.4 -0.2 0
EAP
MNG
PNG
LAO
TMP
-0.5
0.0
-0.7
-0.8
-1.3
LAO
0.51
0.59
0 0.2 0.4 0.6 0.8
MNG
PNG
TMP
0.73
EAPaverage
0.58
Source: World Bank. Source: UNDP.
25 The measure of government effectiveness captures perceptions about the quality of the civil service, as well as of public services (in turn, largely driven by the perceived quality of public education, health, and infrastructure).
(Box I.A.5 continued)
(continued)
GROWING CHALLENGES
I.A. RECENT DEVELoPMENTS 33
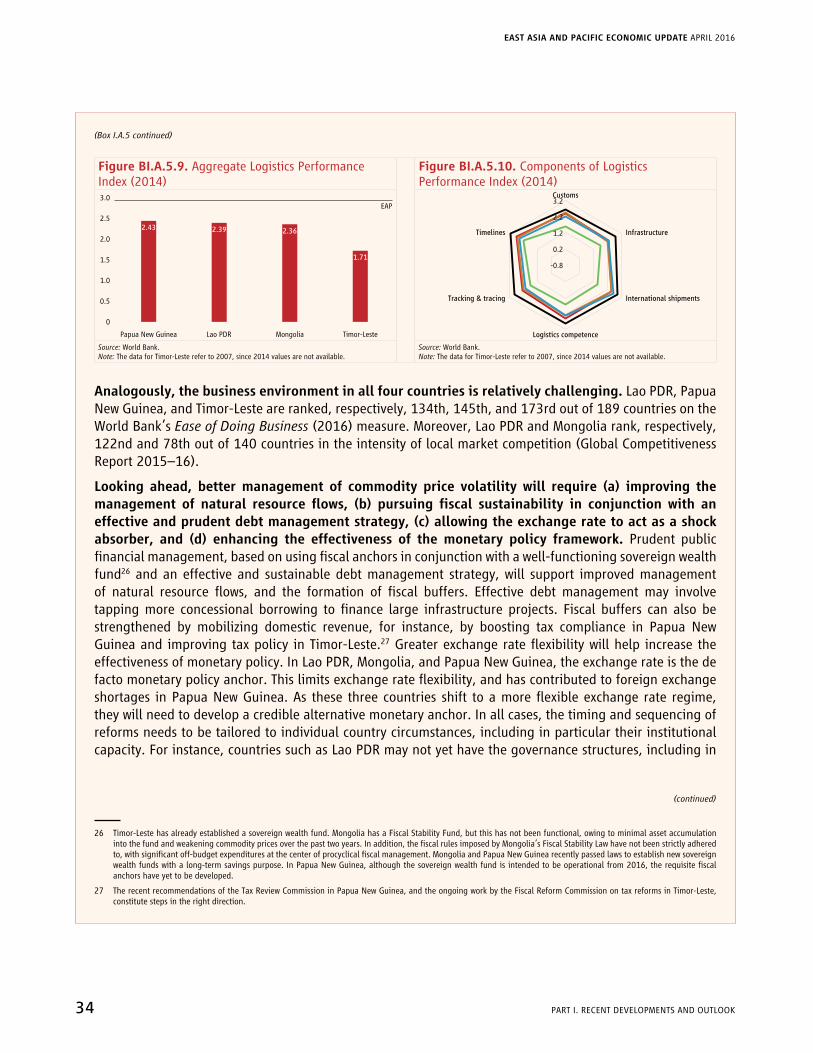
Figure BI.A.5.9. Aggregate Logistics Performance Index (2014)
Figure BI.A.5.10. Components of Logistics Performance Index (2014)
3.0
2.5
2.0
1.5
1.0
0
0.5
Lao PDR MongoliaPapua New Guinea Timor-Leste
2.43 2.39 2.36
1.71
EAP
Customs
Logistics competence
3.2
2.2
1.2
0.2
-0.8
Infrastructure
International shipments
Timelines
Tracking & tracing
Source: World Bank.Note: The data for Timor-Leste refer to 2007, since 2014 values are not available.
Source: World Bank.Note: The data for Timor-Leste refer to 2007, since 2014 values are not available.
Analogously, the business environment in all four countries is relatively challenging. Lao PDR, Papua New Guinea, and Timor-Leste are ranked, respectively, 134th, 145th, and 173rd out of 189 countries on the World Bank’s Ease of Doing Business (2016) measure. Moreover, Lao PDR and Mongolia rank, respectively, 122nd and 78th out of 140 countries in the intensity of local market competition (Global Competitiveness Report 2015–16).
Lookingahead,bettermanagementof commodityprice volatilitywill require (a) improving themanagement of natural resourceflows, (b) pursuingfiscal sustainability in conjunctionwith aneffectiveandprudentdebtmanagementstrategy,(c)allowingtheexchangeratetoactasashockabsorber, and (d) enhancing the effectiveness of themonetary policy framework.Prudent public financial management, based on using fiscal anchors in conjunction with a well-functioning sovereign wealth fund26 and an effective and sustainable debt management strategy, will support improved management of natural resource flows, and the formation of fiscal buffers. Effective debt management may involve tapping more concessional borrowing to finance large infrastructure projects. Fiscal buffers can also be strengthened by mobilizing domestic revenue, for instance, by boosting tax compliance in Papua New Guinea and improving tax policy in Timor-Leste.27 Greater exchange rate flexibility will help increase the effectiveness of monetary policy. In Lao PDR, Mongolia, and Papua New Guinea, the exchange rate is the de facto monetary policy anchor. This limits exchange rate flexibility, and has contributed to foreign exchange shortages in Papua New Guinea. As these three countries shift to a more flexible exchange rate regime, they will need to develop a credible alternative monetary anchor. In all cases, the timing and sequencing of reforms needs to be tailored to individual country circumstances, including in particular their institutional capacity. For instance, countries such as Lao PDR may not yet have the governance structures, including in
26 Timor-Leste has already established a sovereign wealth fund. Mongolia has a Fiscal Stability Fund, but this has not been functional, owing to minimal asset accumulation into the fund and weakening commodity prices over the past two years. In addition, the fiscal rules imposed by Mongolia’s Fiscal Stability Law have not been strictly adhered to, with significant off-budget expenditures at the center of procyclical fiscal management. Mongolia and Papua New Guinea recently passed laws to establish new sovereign wealth funds with a long-term savings purpose. In Papua New Guinea, although the sovereign wealth fund is intended to be operational from 2016, the requisite fiscal anchors have yet to be developed.
27 The recent recommendations of the Tax Review Commission in Papua New Guinea, and the ongoing work by the Fiscal Reform Commission on tax reforms in Timor-Leste, constitute steps in the right direction.
(Box I.A.5 continued)
(continued)
EAST ASIA AND PACIFIC ECONOMIC UPDATE APRIL 2016
34 PART I. RECENT DEVELoPMENTS AND oUTLooK

terms of transparency and accountability, required to establish a sovereign wealth fund. Similarly, in Timor-Leste, the adoption of a national currency may not currently constitute a credible policy option.
Improving the effectiveness and efficiency of public service delivery involves (a) enhancing thequality of expenditure and strengtheningpublicfinancialmanagement, and (b) buildingpublicinstitutions to deliver public services. The four countries analyzed currently face limitations in the budget mechanisms for allocating and tracking expenditures to provide public services, implementation bottlenecks in the provision of public services, weak monitoring systems, and a scarcity of qualified technicians and managers. Proper project planning and transparent procurement processes will be vital to switch their fiscal paradigms from “spending more” to “spending well.” In Papua New Guinea and Timor-Leste, prioritizing public investment through a meticulous appraisal process, and taking into account bottlenecks and absorptive capacity constraints, will improve the quality of spending. All four countries need to enhance the ability of public or public-private institutions to improve human capital through the provision of vocational training, and to ensure the adequate provision and maintenance of physical capital. Key actions to support infrastructure maintenance, based on cross-country evidence, include (a) linking maintenance with infrastructure design contracts in the tender process; (b) implementing user charges where feasible; and (c) creating statutory bodies that function as corporate entities to maintain and broaden the provision of economic infrastructure. The ability to provide public services is also limited by broader factors that need to be tackled, including political volatility, crime and violence, and institutional constraints such as customary land ownership (as in Papua New Guinea).
Increasing competition and establishing a more favorable business environment will require a focus on removing cumbersome, anticompetitive regulations, and minimizing uncertainty for private business by ensuring the stability of policies. Rules and regulations need to be streamlined to reduce the time needed to start a business in all four countries. In Timor-Leste, the relatively high minimum capital requirements to open a business (exceeding average annual income) are limiting competition. Timor-Leste also needs to reform the land law to support collateralized credit, to make it easier for firms to access finance. Uncertainty regarding policy stability has also adversely affected business growth. For instance, in Papua New Guinea, over half of the firms surveyed report a “very high” or “high” concern about stability of rules, regulations, and policies (Asian Development Bank 2014). Similarly, in Lao PDR, policy uncertainty and limited transparency hamper the investment climate (World Bank 2014).
(Box I.A.5 continued)
RecentfiscaltrendsintheotherEAPcountrieshavebeenmixed.Fiscal deficits have narrowed significantly in the Philippines, from 3.5 percent of GDP in 2010 to just under 1 percent in 2015, helped by strong revenue collection (in the context of faster growth) and improved tax administration. As a result, the government debt burden has fallen steadily to 45 percent of GDP over the same period. While budget execution has been an issue in recent years, in the second half of 2015 government spending accelerated as bottlenecks were addressed and priority projects expedited. In Thailand, fiscal deficits were below 2 percent of GDP in both 2014 and 2015, and public debt levels remain moderate, at just over 30 percent of GDP. In Vietnam, fiscal pressures have grown, with the deficit estimated at 6.5 percent of GDP in 2015, reflecting weak revenue outcomes and increased current and capital spending. Public and publicly guaranteed debt is now only just shy of the legally mandated debt ceiling of 65 percent. In Myanmar, improved revenue collection contained the deficit in 2014–15 (year ended March 31) to
GROWING CHALLENGES
I.A. RECENT DEVELoPMENTS 35

1.8 percent of GDP, although a deficit of over 3 percent of GDP in 2015–16 is likely, driven in part by increases in health and education spending. In Cambodia, fiscal consolidation led to a deficit of under 1 percent of GDP in 2015.
Monetary policy remains accommodative overall in the region, with growth the main focus for the majority of central banks
While a number of emerging market central banks have recently raised policy rates in response to currency depreciationandinflationarypressures,EAPcentralbanksgenerallyheldpolicyratesconstantinlate2015 and early 2016 (Figure I.A.34). Indonesia was one exception, lowering its policy rate by 25 basis points in January and again in February, in response to stabilization in the rupiah and a decline in inflation to within the target range. While interbank market rates fell in response to the policy changes, the easing has not yet been transmitted to domestic lending rates.
Inresponsetoeasinggrowthandlowinflation,China’scentralbankhasprogressivelyloweredbenchmarkinterestratesandcutthereserverequirementratio(RRR)overthelastyear.After a series of five cuts in the benchmark one-year lending rate and four cuts to the RRR in 2015, the RRR was lowered most recently in late February by another 0.5 percentage points, in an effort to ensure sufficient liquidity for bank lending and sterilize recent foreign exchange interventions. Recent policy announcements also indicate that the central bank, in coordination with seven other top ministries and regulators, will guide financial institutions to boost lending to support industrial upgrading and promote structural adjustment.
Other major central banks in the region have held their policy rates unchanged over the last year. Among the smaller EAP economies, the central bank of Mongolia lowered its policy rate by 100 basis points to 12 percent in January 2016, amid tight credit conditions and slowing inflation.
Figure I.A.34. Nominal policy rates were flat or trended lower in 2015, led by China
Figure I.A.35. Real policy rates have fallen since their recent (2014) highs, but remain generally close to or above long-term averages
Policy rates, percent Real policy rate, ex ante, percent
10
9
8
7
6
5
4
3
2
1
0
Jan-13 Jul-13 Jan-14 Jul-14 Jan-15 Jul-15 Jan-16
7
6
5
4
3
2
1
0
-1
-2
CHN IDN MYS THAPHL VNM
Jan-14
Dec-14
Feb-14Sep-14
May-14
Feb-14
▬ CHN ▬ IDN ▬ MYS ▬ PHL ▬ THA ▬ VNM J Top of current cycle J Real policy rate as of Jan-16 Q 10-year average
Source: Haver Analytics. Sources: Haver Analytics; CEIC; World Bank staff estimates.Note: Estimates are based on staff CPI projections; the 10-year average is for realized ex-ante rates; the top of current cycle refers to the most recent high, as dated.
EAST ASIA AND PACIFIC ECONOMIC UPDATE APRIL 2016
36 PART I. RECENT DEVELoPMENTS AND oUTLooK
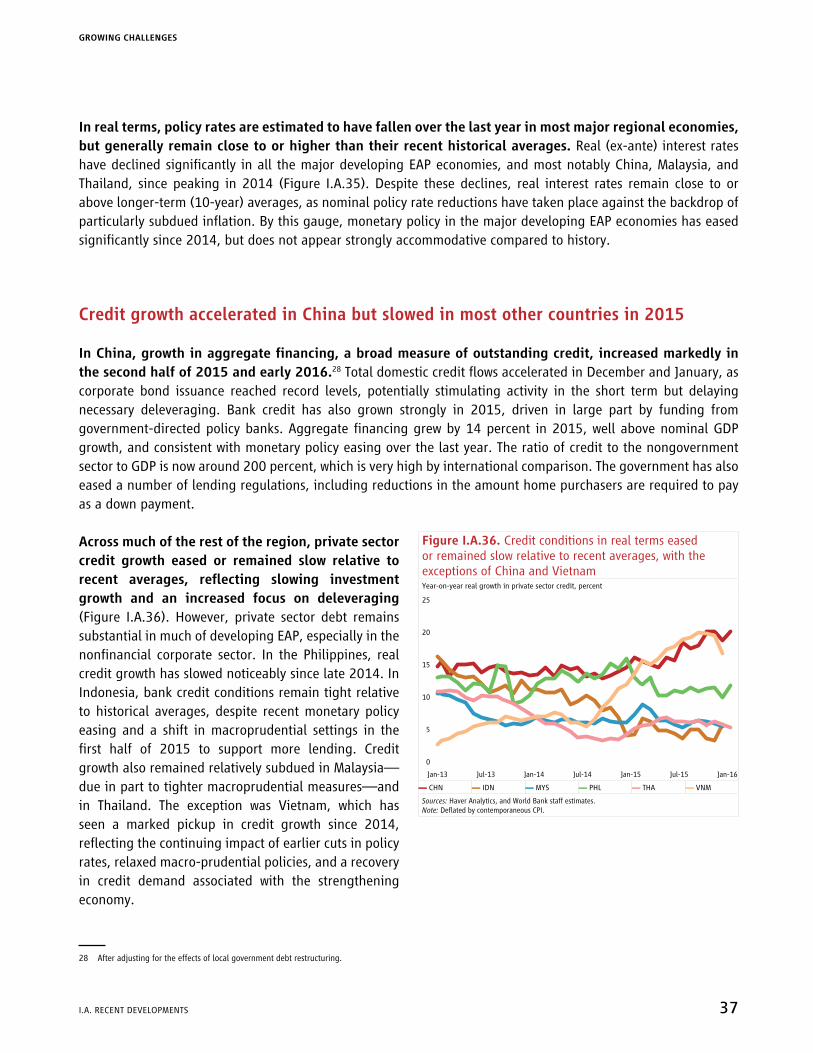
In real terms, policy rates are estimated to have fallen over the last year in most major regional economies, but generally remain close to or higher than their recent historical averages. Real (ex-ante) interest rates have declined significantly in all the major developing EAP economies, and most notably China, Malaysia, and Thailand, since peaking in 2014 (Figure I.A.35). Despite these declines, real interest rates remain close to or above longer-term (10-year) averages, as nominal policy rate reductions have taken place against the backdrop of particularly subdued inflation. By this gauge, monetary policy in the major developing EAP economies has eased significantly since 2014, but does not appear strongly accommodative compared to history.
Credit growth accelerated in China but slowed in most other countries in 2015
InChina,growthinaggregatefinancing,abroadmeasureofoutstandingcredit,increasedmarkedlyinthe second half of 2015 and early 2016.28 Total domestic credit flows accelerated in December and January, as corporate bond issuance reached record levels, potentially stimulating activity in the short term but delaying necessary deleveraging. Bank credit has also grown strongly in 2015, driven in large part by funding from government-directed policy banks. Aggregate financing grew by 14 percent in 2015, well above nominal GDP growth, and consistent with monetary policy easing over the last year. The ratio of credit to the nongovernment sector to GDP is now around 200 percent, which is very high by international comparison. The government has also eased a number of lending regulations, including reductions in the amount home purchasers are required to pay as a down payment.
Across much of the rest of the region, private sector credit growth eased or remained slow relative to recent averages, reflecting slowing investmentgrowth and an increased focus on deleveraging (Figure I.A.36). However, private sector debt remains substantial in much of developing EAP, especially in the nonfinancial corporate sector. In the Philippines, real credit growth has slowed noticeably since late 2014. In Indonesia, bank credit conditions remain tight relative to historical averages, despite recent monetary policy easing and a shift in macroprudential settings in the first half of 2015 to support more lending. Credit growth also remained relatively subdued in Malaysia—due in part to tighter macroprudential measures—and in Thailand. The exception was Vietnam, which has seen a marked pickup in credit growth since 2014, reflecting the continuing impact of earlier cuts in policy rates, relaxed macro-prudential policies, and a recovery in credit demand associated with the strengthening economy.
28 After adjusting for the effects of local government debt restructuring.
Figure I.A.36. Credit conditions in real terms eased or remained slow relative to recent averages, with the exceptions of China and VietnamYear-on-year real growth in private sector credit, percent
25
20
15
10
0
5
Jan-13 Jul-13 Jan-14 Jul-14 Jan-15 Jul-15 Jan-16
▬ CHN ▬ IDN ▬ MYS ▬ PHL ▬ THA ▬ VNM
Sources: Haver Analytics, and World Bank staff estimates.Note: Deflated by contemporaneous CPI.
GROWING CHALLENGES
I.A. RECENT DEVELoPMENTS 37

Bank lending conditions were mixed in the smaller economies. In Lao PDR, credit growth has been constrained due to tightening balance sheet constraints among some banks, with state-owned banks in particular facing rising nonperforming loans and low capital buffers. However, credit growth accelerated slightly in the second half of the year, with the central bank introducing inflation-linked caps on bank interest rates. Bank credit growth has also remained subdued in Mongolia, in part due to subdued loan demand. In Cambodia, in contrast, domestic credit has accelerated further, with growth in 2015 reaching 27 percent, spurred in part by the construction boom. In Myanmar, credit to the private sector also continues to grow rapidly, albeit from a relatively low base.
RecentdevelopmentsinthePacificIslandCountries
GrowthinmostPacificIslandCountries(PICs)29 remained relatively robust over the last year compared to historical averages. Donor-funded public investments and reconstruction activities following major natural disasters remain important drivers of overall activity in most PICs, including in the Federated States of Micronesia and the Republic of the Marshall Islands, where the resumption of US-Compact-related infrastructure projects in 2015 helped to reverse the economic contractions observed in the previous year. At the same time, tourism picked up in 2015 in a number of the PICs, including Fiji, Palau, Samoa, and Tonga, while remittances continued to provide support for domestic consumption.
In February 2016, Tropical Cyclone Winston—the strongest ever recorded in the Southern Hemisphere—devastated many parts of Fiji, claiming at least 44 lives and leaving thousands more homeless. Following the cyclones that hit Vanuatu and Tuvalu in March 2015 and the Hapai’i group of islands in Tonga in 2014, this last cyclone provided yet another reminder of the PICs’ exposure and vulnerability to severe natural disasters. Preliminary estimates suggest that the cyclone was responsible for damage of around 10 percent of Fiji’s GDP, with major impacts on the sugar industry, a key export, and on other agriculture and roads.
Fiscal positions improved in 2015 in a number of PICs, with increases in fishing-related revenuescontributingtosubstantialfiscalsurplusesintheNorthPacific.Favorable weather conditions (driven in part by El Niño) and the implementation of the Vessel Day Scheme caused (US dollar) fishing license fees to increase substantially in the Federated States of Micronesia and the Republic of the Marshall Islands, with the depreciation of the Australian dollar against the US dollar providing an added fiscal boost in Kiribati and Tuvalu (both of which use the Australian dollar as legal tender). Fiscal balances were also supported by the winding down of reconstruction-related expenditures in Samoa, and sustained efforts to implement revenue policy and administration reforms in Tonga.
Lowerglobalpricesforfoodandfuelhavegenerallyreducedinflationarypressuresandsupportedtheexternal positions of PIC economies. Current account positions have also been supported by strong fishing-related flows (exports and licensing fees), remittances, tourism inflows, and official development assistance.
29 Comprising the Federated States of Micronesia, Fiji, Kiribati, Palau, the Republic of the Marshall Islands, Samoa, the Solomon Islands, Tonga, Tuvalu, and Vanuatu.
EAST ASIA AND PACIFIC ECONOMIC UPDATE APRIL 2016
38 PART I. RECENT DEVELoPMENTS AND oUTLooK

References
Asian Development Bank. 2014. The challenges of doing business in Papua New Guinea: an analytical summary of the 2012 Business Environment Survey by the Institute of National Affairs. Manila: Asian Development Bank.
Gill, Indermit, Ivailo Izvorski, Willem van Eeghen, and Donato De Rosa. 2014. Diversified Development: Making the Most of Natural Resources in Eurasia. Europe and Central Asia Regional Flagship Report. Washington, DC: World Bank.
Kshirsagar, V., K. Simler, and H. Zaman. 2009. “A Simulation Model for Estimating the Poverty Impact of Changes in Food and Fuel Prices.” World Bank mimeo. Washington, DC: World Bank.
National Bureau of Statistics of China. 2016. “Statistical Communiqué of the People’s Republic of China on the 2015 National Economic and Social Development.” National Bureau of Statistics of China, Beijing, February 29.
Schwab, Klaus, and Xavier Sala-i-Martin. 2015. The Global Competitiveness Report 2015–16. Geneva: World Economic Forum.
UNCTAD (United Nations Conference on Trade and Development). 2015. Foreign Direct Investment Statistics. http://unctad.org/en/Pages/DIAE/FDI%20Statistics/FDI-Statistics.aspx.
World Bank. 2014. Lao PDR Investment Climate Assessment: Policy Uncertainty in the Midst of a Natural Resources Boom. Washington, DC: World Bank. 2015. Africa Pulse – An Analysis of Africa’s Economic Future. Vol. 11. Washington, DC: World Bank, April.
———. 2015b. Global Economic Prospects. Washington, DC: World Bank, June.
———. 2015c. East Asia and Pacific Economic Update: Staying the Course. Washington DC: World Bank, October.
———. 2016. Commodity Markets Outlook. Washington, DC: World Bank, January.
———. 2016b. Global Economic Prospects. Washington, DC: World Bank, January.
———. 2016c. Global Trade Watch: Trade Developments in 2015. Washington, DC: World Bank, March.
GROWING CHALLENGES
I.A. RECENT DEVELoPMENTS 39

I.B. Outlook and Risks
Growth in global output and trade is expected to rise modestly, although any pickup in high-income economies is likely to prove gradual, and slower than previously anticipated. Growth in developing East Asia and Pacific is expected to ease modestly over the next two to three years, in line with what was projected last October, and primarily reflecting China’s continuing gradual shift to a slower and more sustainable growth path. In the rest of the region, growth is projected to pick up slightly, driven by the large ASEAN economies, and consistent with a gradual recovery in advanced economies, accommodative domestic monetary policy, and the beneficial impact of low energy prices on fuel importers. However, the outlook for individual countries varies, partly depending on their trade and financial relationships with high-income economies and with China, and on the extent of their reliance on commodity exports, whose prices are projected to remain low.
The positive base case for growth and poverty reduction in the region is subject to elevated risks. A weaker-than-expected recovery in high-income economies, or a faster-than-expected slowdown in China, would have considerable effects on external demand and growth prospects in the rest of developing East Asia and Pacific. A resurgence of volatility in financial markets, as observed recently, could prompt a tightening in monetary conditions, with adverse effects on the real economy. In particular, vulnerabilities created by the interplay between high levels of indebtedness, price deflation, and slowing growth in China bear close monitoring, as do corporate and financial sector vulnerabilities across much of the region. A further decline in commodity prices, while positive for the region overall, would act as a negative shock to real activity in commodity exporters, reducing the space for public expenditure and investment to support growth.
Regional growth will moderate as China continues to rebalance, and the recovery in high-income economies remains fragile
Growth in global output and trade is expected to rise modestly, although any pickup in high-income economies is likely to prove gradual, and slower than previously anticipated (Box I.B.1). Growth in the high-income countries is projected to increase slowly over the next two to three years, with accommodative monetary policies and low oil prices providing some support. Global trade will rise, but at a pace significantly below the average prior to the global financial crisis. This reflects both the fragility of global growth and weak demand for commodity inputs, as well as more structural factors, such as the slowing of vertical specialization. Global financial conditions are expected to tighten, albeit only gradually, as US monetary policy slowly normalizes. These tighter conditions, combined with persistently low commodity prices, are expected to weigh on capital flows to the region, particularly portfolio flows and foreign direct investment (FDI) into commodity sectors. Tighter financing conditions and slowing growth in major emerging markets may also be associated with further bouts of financial market volatility.
EAST ASIA AND PACIFIC ECONOMIC UPDATE APRIL 2016
40 PART I. RECENT DEVELoPMENTS AND oUTLooK

Box I.B.1. Global Outlook and Risks
Global growth in 2016 is likely to change little from the modest pace observed in 2015 (Figure BI.B.1.1). This reflects intensifying headwinds, including additional declines in commodity prices, weak global trade, increasingly frequent periods of financial market turbulence, greater uncertainty, and heightened risk aversion. Persistently low commodity prices and subdued activity will result in continued low global inflation.
Figure BI.B.1.1. Global GDP growth forecast Figure BI.B.1.2. Global inflation and oil pricesYear-on-year, percent Year-on-year, percent Year-on-year, percent Year-on-year, percent
7 2.70
62.65
52.60
4
2.55
3
2.50
0 2.25
2
2.45
1
2.40
2.35
2.30
2012 2013 2014 2015 2016
4
3
1
2
100
80
60
40
20
-80
0
-20
-40
-60
2012 2013 2014 2015 20162011 2017
J Advanced J Emerging & developing J Low income Q World, rhs ▬ Global inflation ▬ Projection ▬ Oil price changes, rhs
Sources: World Bank; Bloomberg; Haver Analytics. Sources: World Bank; Bloomberg; Haver Analytics.
Commodity prices are projected to remain low for a protracted period. For 2016 as a whole, oil prices are expected to average US$37 per barrel, down from US$51 per barrel in 2015 (Figure BI.B.1.2). Weak prices reflect both supply and demand factors, including prospects of a resumption of exports from Iran, resilience in US production, weak growth prospects in major emerging markets, and a mild winter in the northern hemisphere. A gradual recovery in oil prices to US$48 per barrel is expected in 2017. Metal price indexes are projected to decline by 7.8 percent in 2016 and recover slightly by 3.9 percent in 2017. Agricultural prices will experience a marginal (3.7 percent) decline, reflecting lagged impact of low energy prices. Only a modest price recovery (1.8 percent) is expected in 2017.
Global trade growth reached a postcrisis low in 2015 and is expected to remain weak in 2016. Following a pattern of repeated downward revisions, global trade forecasts for 2016–17 have been downgraded further, suggesting a more persistent deterioration in the relationship between global trade and income growth. Over the short term, weakening demand from China’s slowing industrial sector and terms of trade and currency adjustments among commodity exporters will continue to exert downward pressures on global trade. This will only be partially offset by import growth from advanced economies, which is likely to moderate somewhat. Over the medium term, maturing supply chains, declining overcapacity in some manufacturing sectors, and persistently lower commodity prices could have lasting repercussions on global trade patterns.
Globalfinancialconditionsareexpectedtotighten,albeitgradually,asUSmonetarypolicyslowlynormalizes. Financial markets have become increasingly concerned about the risk of a further slowdown in global growth, which led to a rout in global equity markets and a tightening in financial conditions at the start of the year. Volatility gauges surpassed August 2015 highs in early February, and they remain elevated.
(continued)
GROWING CHALLENGES
I.B. OUTLOOK AND RISKS 41

Capital flows to emerging and developing economies remain under pressure. Continued capital outflows are expected in 2016, albeit at a somewhat more modest pace.
Prospects for major advanced economies have deteriorated against the backdrop of weak global manufacturing trade and activity. Projections now show a leveling off rather than a further strengthening of growth this year in the United States, the Euro Area, and Japan, despite ongoing support from sharply lower oil prices and still-improving labor market conditions.
In emerging market and developing economies (EMDEs), and especially among commodity exporters, there has been a clear deterioration in the growth outlook. The baseline forecast points to growth remaining subdued in 2016, and the outlook is subject to significant downside risks. The expectation of a protracted period of low oil prices will dent growth in oil-exporting EMDEs. For most oil-importing countries, substantial improvements in the pace of growth will continue to be elusive, even in a low energy price environment, given the backdrop of weak trade and tight financing conditions.
Growth projections for the BRICS—Brazil, Russia, India, China, and South Africa—are mixed. Baseline forecasts indicate that recessions in Brazil and Russia will deepen in 2016, expanding the potential for negative spillovers to some smaller EMDEs. However, output in Brazil and Russia is expected to start recovering in 2017. The growth forecast for China in 2016 remains unchanged, at 6.7 percent in 2016 and 6.5 percent in 2017. Growth in India will remain strong over the short to medium term, but headwinds from the global economy and domestic conditions will contribute to marginal growth moderation.
The balance of risks remains tilted to the downside. Downside risks dominate the fragile global economic environment and have become increasingly centered on EMDEs. In particular, the slowdown in EMDEs observed in recent years could become more protracted and be accompanied by greater financial market turbulence. Although it is a low-probability scenario, a faster-than-expected slowdown in China combined with a further deceleration in other large emerging markets could have substantial spillovers to the rest of the developing world, and even hold back the recovery in advanced economies. A sudden increase in borrowing costs and additional currency pressures represent another risk for emerging and developing countries, especially commodity exporters. Bouts of financial market volatility could combine with domestic fragilities and policy uncertainties in some developing countries to generate financial stress or damaging sudden stops in capital flows. A further appreciation of the US dollar would also contribute to rising costs of debt refinancing, and expose vulnerabilities in domestic corporate and banking sectors. Commodity prices could continue falling in 2016, posing challenges for exporters, while many of the expected benefits to activity in commodity importers are muted or delayed. Finally, an escalation of geopolitical risks could have significant regional and global repercussions.
(Box I.B.1 continued)
Growth indevelopingEastAsiaandPacific isexpectedtoeasemodestly from6.5percent in2015to6.3 percent in 2016, and an average of 6.2 percent during 2017–18 (Table I.B.1). This slowdown, in line with what was projected last october, reflects mainly the ongoing growth moderation in China. In the rest of the region, growth is projected to pick up slightly, driven by the large ASEAN economies, consistent with a gradual recovery in advanced economies, accommodative domestic monetary policy, and the beneficial impact of low energy prices on fuel importers. However, the outlook for individual countries varies, partly depending on their trade and financial relationships with high-income economies and with China, and on the extent of their reliance on commodity exports.
EAST ASIA AND PACIFIC ECONOMIC UPDATE APRIL 2016
42 PART I. RECENT DEVELoPMENTS AND oUTLooK

Table I.B.1. East Asia and Pacific: GDP growth projectionsPercent change from a year earlier, unless otherwise noted
Forecast Forecast Forecast Changes from Oct-15 (in percentage points)1
2014 2015 2016 2017 2018 2015 2016 2017
East Asia and Pacific2 6.1 5.7 5.7 5.7 5.8 0.0 -0.1 -0.1Developing East Asia and Pacific 6.8 6.5 6.3 6.2 6.2 0.0 -0.1 -0.1
China 7.4 6.9 6.7 6.5 6.5 0.0 0.0 0.0Indonesia 5.0 4.8 5.1 5.3 5.5 0.1 -0.2 -0.2Malaysia 6.0 5.0 4.4 4.5 4.7 0.3 -0.3 -0.5Philippines 6.1 5.8 6.4 6.2 6.2 0.0 0.0 0.0Thailand 0.8 2.8 2.5 2.6 3.0 0.3 0.5 0.2Vietnam 6.0 6.7 6.2 6.3 6.3 0.5 -0.1 0.0Cambodia 7.1 7.0 6.9 6.8 6.8 0.1 0.0 0.0Lao PDR 7.5 7.0 7.0 7.0 6.8 0.6 0.0 0.1Myanmar 8.5 7.0 7.8 8.4 8.3 0.5 0.0 -0.1Mongolia 7.9 2.3 0.7 2.7 6.2 -1.0 -3.4 -1.3Fiji 5.3 4.0 2.4 3.8 3.5 0.6 -0.7 0.8Papua New Guinea 8.5 8.6 3.0 4.1 2.9 -0.1 -0.3 0.1Solomon Islands 2.0 3.3 3.0 3.3 3.0 0.0 0.0 -0.2Timor-Leste3 6.0 4.3 5.0 5.5 5.5 -2.5 -1.9 -1.5
Memo: Developing East Asia exc. China 4.6 4.7 4.8 4.9 5.1 0.1 -0.1 -0.2Memo: ASEAN 4.4 4.4 4.6 4.8 4.9 0.1 -0.1 -0.1
Assumptionsabouttheexternalenvironment:4
World 2.6 2.4 2.5 2.9 3.0 0.0 -0.4 -0.2Advanced economies5 1.7 1.8 1.9 2.0 2.0 … … …Emerging and developing economies5
4.2 3.4 3.5 4.4 4.7 … … …
Energy commodities (2010 = 100) 118 67 66 70 74 -1.6 -4.1 -3.4Crude oil (average, spot, US$/bbl) 96 52 51 55 58 -2.7 -4.9 -2.9
Nonenergy commodities (2010 = 100) 97 83 84 85 87 -1.3 -1.8 -2.0Food (2010 = 100) 107 91 92 94 95 -1.8 -2.1 -1.3
Source: World Bank data and staff estimates.Note: 1. World Bank, East Asia and Pacific Economic Update, October 2015.2. Developing East Asia + Newly Industrialized Economies.3. Nonoil GDP.4. Global growth forecasts are preliminary working assumptions. Commodity price assumptions are based on the January 2016 Commodity Market Outlook.5. Country classifications are not comparable to those used in previous issues of the East Asia and Pacific Economic Update. bbl = barrel.
China is expected to continue its gradual shift to a slower and more sustainable growth path. Growth is projected to ease from 6.9 percent in 2015 to 6.7 percent in 2016, and 6.5 percent in 2017 and 2018. Continued implementation of reforms should support the continued rebalancing of domestic demand. In particular, growth in investment and industrial output will moderate, reflecting measures to contain local government debt, reduce excess industrial capacity, and reorient fiscal stimulus toward social sectors (Figure I.B.1). The labor market and growth in household incomes, however, will remain robust, supporting private consumption. The shift toward services will continue, facilitated by policies to ease business regulations in this sector; enhancing the services economy will also promote further industrial upgrading (Box I.B.2). Low oil prices will continue to support demand, while targeted policy measures are expected to be applied as needed to ensure that the overall slowdown is only gradual.
GROWING CHALLENGES
I.B. OUTLOOK AND RISKS 43

Figure I.B.1. Domestic consumption is projected to continue underpinning GDP growth, while exports will make a relatively small contribution to growth in the near termContribution of expenditure components to GDP growth, percentage points
10
8
6
4
2
0
-2
-6
-4
China Malaysia PhilippinesThailand VietnamIndonesia2014 2015 2016 2017 2018 2014 2015 2016 2017 2018 2014 2015 2016 2017 2018 2014 2015 2016 2017 2018 2014 2015 2016 2017 2018 2014 2015 2016 2017 2018
J Consumption J Investment J Net exports Q GDP
Contribution of expenditure components to GDP growth, percentage points
6
4
2
0
-2
-6
-4
China Malaysia PhilippinesThailand Vietnam, rhsIndonesia2014 2015 2016 2017 2018 2014 2015 2016 2017 2018 2014 2015 2016 2017 2018 2014 2015 2016 2017 2018 2014 2015 2016 2017 2018 2014 2015 2016 2017 2018
20
15
10
5
0
-5
-10
-20
-15
J Exports J Imports Q Net exports
Source: Staff estimates.Note: Excludes statistical discrepancies and changes in inventories.
Box I.B.2. China’s Integration into Global Value Chains and the Impact on Its Trade Partners1
China’s integration into Global Value Chains
China has been extremely successful over the past two decades in integrating into Global Value Chains(GVCs).It has risen to be the largest manufacturing country in terms of share of global value added. In 1995, it occupied a relatively peripheral place in the global trade network; by 2011, it had become one of the three main world trading hubs along with Germany and the United States (Santoni and Taglioni 2015).
1 Prepared by Daria Taglioni, with inputs from Mauro Boffa and Gianluca Santoni.
(continued)
EAST ASIA AND PACIFIC ECONOMIC UPDATE APRIL 2016
44 PART I. RECENT DEVELoPMENTS AND oUTLooK
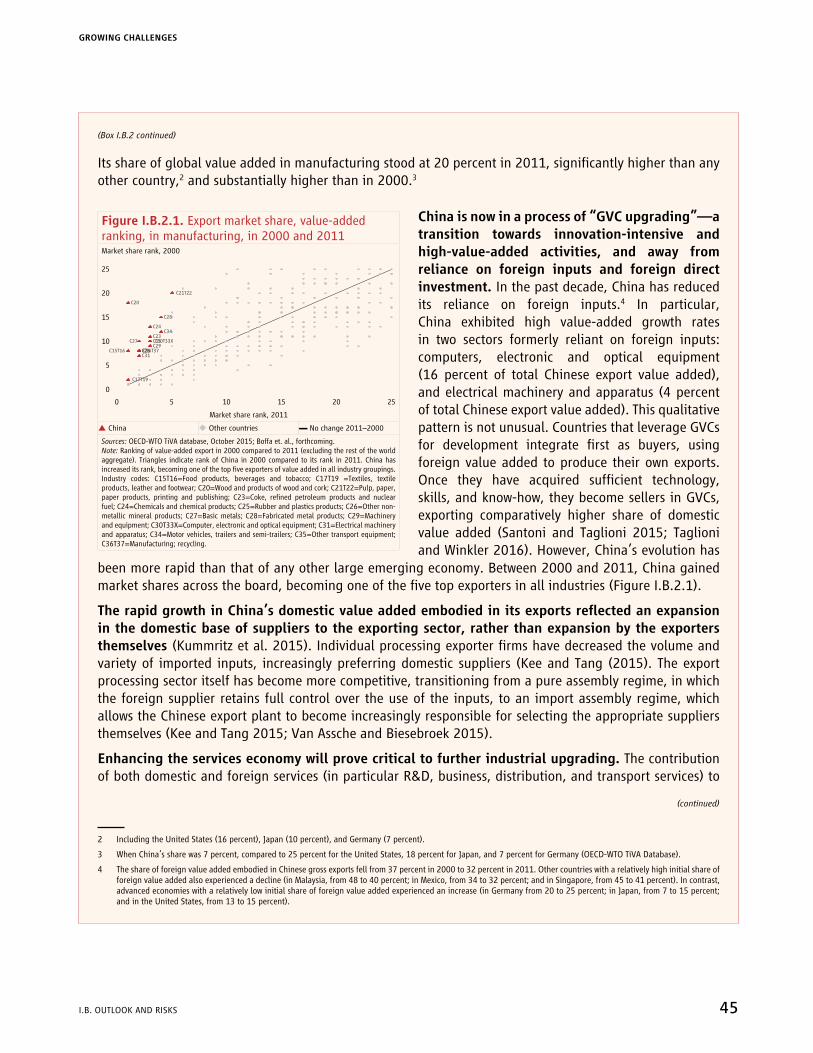
Its share of global value added in manufacturing stood at 20 percent in 2011, significantly higher than any other country,2 and substantially higher than in 2000.3
Figure I.B.2.1. Export market share, value-added ranking, in manufacturing, in 2000 and 2011Market share rank, 2000
25
20
15
10
5
0
0 5 10 15 20 25
C15T16
C17T19
C20
C21T22
C23
C24
C25C26
C27
C28
C29
C30T33X
C31
C34
C35
C36T37
Market share rank, 2011
S China � Other countries ▬ No change 2011–2000
Sources: oECD-WTo TiVA database, october 2015; Boffa et. al., forthcoming.Note: Ranking of value-added export in 2000 compared to 2011 (excluding the rest of the world aggregate). Triangles indicate rank of China in 2000 compared to its rank in 2011. China has increased its rank, becoming one of the top five exporters of value added in all industry groupings. Industry codes: C15T16=Food products, beverages and tobacco; C17T19 =Textiles, textile products, leather and footwear; C20=Wood and products of wood and cork; C21T22=Pulp, paper, paper products, printing and publishing; C23=Coke, refined petroleum products and nuclear fuel; C24=Chemicals and chemical products; C25=Rubber and plastics products; C26=Other non-metallic mineral products; C27=Basic metals; C28=Fabricated metal products; C29=Machinery and equipment; C30T33X=Computer, electronic and optical equipment; C31=Electrical machinery and apparatus; C34=Motor vehicles, trailers and semi-trailers; C35=Other transport equipment; C36T37=Manufacturing; recycling.
2 Including the United States (16 percent), Japan (10 percent), and Germany (7 percent).
3 When China’s share was 7 percent, compared to 25 percent for the United States, 18 percent for Japan, and 7 percent for Germany (oECD-WTo TiVA Database).
4 The share of foreign value added embodied in Chinese gross exports fell from 37 percent in 2000 to 32 percent in 2011. Other countries with a relatively high initial share of foreign value added also experienced a decline (in Malaysia, from 48 to 40 percent; in Mexico, from 34 to 32 percent; and in Singapore, from 45 to 41 percent). In contrast, advanced economies with a relatively low initial share of foreign value added experienced an increase (in Germany from 20 to 25 percent; in Japan, from 7 to 15 percent; and in the United States, from 13 to 15 percent).
(Box I.B.2 continued)
China is now in a process of “GVC upgrading”—a transition towards innovation-intensive and high-value-added activities, and away from reliance on foreign inputs and foreign direct investment. In the past decade, China has reduced its reliance on foreign inputs.4 In particular, China exhibited high value-added growth rates in two sectors formerly reliant on foreign inputs: computers, electronic and optical equipment (16 percent of total Chinese export value added), and electrical machinery and apparatus (4 percent of total Chinese export value added). This qualitative pattern is not unusual. Countries that leverage GVCs for development integrate first as buyers, using foreign value added to produce their own exports. once they have acquired sufficient technology, skills, and know-how, they become sellers in GVCs, exporting comparatively higher share of domestic value added (Santoni and Taglioni 2015; Taglioni and Winkler 2016). However, China’s evolution has
been more rapid than that of any other large emerging economy. Between 2000 and 2011, China gained market shares across the board, becoming one of the five top exporters in all industries (Figure I.B.2.1).
TherapidgrowthinChina’sdomesticvalueaddedembodiedinitsexportsreflectedanexpansionin the domestic base of suppliers to the exporting sector, rather than expansion by the exporters themselves (Kummritz et al. 2015). Individual processing exporter firms have decreased the volume and variety of imported inputs, increasingly preferring domestic suppliers (Kee and Tang (2015). The export processing sector itself has become more competitive, transitioning from a pure assembly regime, in which the foreign supplier retains full control over the use of the inputs, to an import assembly regime, which allows the Chinese export plant to become increasingly responsible for selecting the appropriate suppliers themselves (Kee and Tang 2015; Van Assche and Biesebroek 2015).
Enhancing the services economy will prove critical to further industrial upgrading. The contribution of both domestic and foreign services (in particular R&D, business, distribution, and transport services) to
(continued)
GROWING CHALLENGES
I.B. OUTLOOK AND RISKS 45

China’s manufacturing exports is currently relatively low. Several reforms could promote the “servicification” of manufacturing (that is, assist the manufacturing sector in buying, producing, selling, and exporting services), and promote domestic value-added growth in those sectors that are already significantly servicified (Van der Marel and Saez 2016). Examples include lowering regulatory entry barriers for services, lowering regulatory foreign direct investment barriers related to foreign key personnel, and promoting greater internet connectivity. However, China has significantly lagged as a supplier of business services for manufacturing industries (except for textiles), compared to the leading global players.
Continued growth will also rely on further technological and connectivity improvements. Both technological innovation (through the creation, adoption, and absorption of technology) and market-driven allocation of resources to the most competitive firms are fundamental. Moreover, to translate factory-gate competitiveness into competitiveness at destination markets, connectivity is key. This requires both hard and soft infrastructure, in China and in the trade partner countries. China is in a position to implement reforms domestically to reduce trade costs. In the past decade, trade costs with the rest of the world have already contracted by 19 percent.5 Improving domestic connectivity, and fostering improvements in connectivity by trade partners, are both needed to produce further significant reductions in trade costs within Asian GVCs. Value chains work with suppliers across countries. The need to be able to move goods quickly and at a reasonable cost between the various production and processing platforms requires reforms at both the sending and receiving end of each link of the network (Rastogi and Shepherd 2015).
The impact on China’s trade partners
Figure I.B.2.2. Increase in import penetration of Chinese intermediate goods, by country income level, 2000–10Services sectors Manufacturing sectorsImport penetration, annualized growth rate Import penetration, annualized growth rate
100
80
60
-40
40
20
2000 2005High income
2010 2000 20002005 2005Upper-middle income Lower-middle income
2010 2010
0
-20
100
80
60
-40
40
20
2000 2005High income
2010 2000 20002005 2005Upper-middle income Lower-middle income
2010 2010
0
-20
Source: Boffa et. al., forthcoming.Note: “Import Penetration 2010” refers to the annualized growth rate during 2005–10.
China’s GVC upgrading has implied an increase in Chinese value added embodied in trade partners’ production. The import penetration of value added from China embodied in intermediate goods increased in all of China’s trade partners during 2000–11 (Figure I.B.2.2 and Figure I.B.2.3). Product-level export data
5 Source: http://data.worldbank.org/data-catalog/trade-costs-dataset.
(Box I.B.2 continued)
(continued)
EAST ASIA AND PACIFIC ECONOMIC UPDATE APRIL 2016
46 PART I. RECENT DEVELoPMENTS AND oUTLooK

indicate that Indonesia, Japan, Korea, Malaysia, the Philippines, Thailand, and Vietnam are among those most exposed to competition from Chinese intermediate and final goods (Bastos 2015).
Figure I.B.2.3. Increase in import penetration of Chinese intermediate goods, manufacturing sectors, by country, 2005–10Import penetration, annualized growth rate
100
80
60
40
20
-60
0
-20
-40
BRN
MLT IS
LDNK IR
LUSA JP
NTW
NBG
RLT
UCA
NGRC
HKGMYS ES
PRO
MSV
NBE
LITA
NZLFR
APH
LAU
THUN
ESTKO
RZA
FGBR
DEUNORNLD
KHM
HRV SVKMEX
SWE
CYP
TUR
IDN
TUN
AUS
SGP
THA
FIN
SAU
CZECH
ELV
AVN
M ISR
PRTAR
GCR
ICO
LLU
XCH
LPO
LRU
SBR
AIN
D
Source: Boffa et. al., forthcoming.
Table BI.B.2.1. Effect of import penetration on domestic production(1) (2) (3) (4)
Chinese inputs, all 1.057 ***(0.269)
Chinese inputs, inter-industry sourcing 0.852 *** 0.956 *** 0.816 ***(0.176) (0.231) (0.177)
Chinese inputs, intra-industry sourcing 0.028 0.023 0.021 (0.020) (0.021) (0.016)
Upstreamness index 0.685 ** 0.411 ***(0.274) (0.149)
Number of production stages -1.459 ** -1.154 **(0.678) (0.491)
Number of observations 5,937 4,565 4,565 4,565First stage F-test 14.236 10.368 7.208 7.638Source: Boffa et. al., forthcoming.Note: *, **, and *** denote significance at the 10 percent, 5 percent, and 1 percent level, respectively. Standard errors are in parentheses, and are clustered by country. All variables are expressed in growth rates over five-year intervals (1995–2000, 2000–05, and 2005–10). All regressions are estimated by two-stage least squares, and contain country-sector fixed effects and year fixed effects, except that column (4) replaces year fixed effects with country-year fixed effects. Agricultural products (NACE 01 to 05) and Minerals (NACE 10 to 14, NACE 23) have been excluded from the estimation sample.
China’s trade partners benefit from China’s GVC upgrading through the enhanced availabilityof higher-quality Chinese intermediate inputs, particularly when Chinese intermediate goods complement rather than substitute for domestic production. Cross-country, cross-sector analysis indicates that on average a 1 percent increase in the value added from China embodied in its exports of intermediate goods leads to a 1 percent increase in output in the foreign recipient sector (Table BI.B.2.1, column 1). Since China’s exports of upstream intermediate inputs to developing East Asia and Pacific increased by 460 percent during 1995–2010, this suggests a significant impact on the destination industrial sectors. The impact reflects mainly the increased availability of intermediate goods sourced from other sectors, that is, inter-industry sourcing. The effects are smaller and statistically less significant for inputs sourced from
(continued)
(Box I.B.2 continued)
GROWING CHALLENGES
I.B. OUTLOOK AND RISKS 47

the same sector, that is, intra-industry sourcing (Table BI.B.2.1, columns 2–4). Intuitively, intra-industry sourcing displays relatively more substitution and less complementarity with domestic production.
AnexpansioninthesupplyofChineseintermediategoodsbroadlybenefitscountriesatallincomelevels, and both neighboring and non-neighboring countries.6 Lower-middle income, upper-middle income, and high-income neighbors all benefit from GVC upgrading in China, as measured by an increase in (the value added embodied in) China’s exports of intermediate goods (Table BI.B.2.2). Again, the impact is larger and statistically more significant in the case of intermediate goods sourced from a sector that differs from the recipient sector. It is also statistically insignificant for non-neighboring upper-middle-income countries.
Table BI.B.2.2. Productivity spillovers, by income level and geographical dimensionNot Neighbor Neighbor
Inter-industry sourcing Intra-industry sourcing Inter-industry sourcing Intra-industry sourcing
LM 0.182 *** 0.058 *** 0.116 *** 0.051 ***(0.052) (0.017) (0.038) (0.014)
UM 0.017 0.045 0.141 ** 0.025(0.028) (0.042) (0.060) (0.021)
H 0.050 *** 0.035 *** 0.108 *** 0.042 ***(0.016) (0.009) (0.037) (0.013)
Source: Boffa et. al., forthcoming.Note: H = high-income trade partners; LM = lower-middle income trade partners; UM = upper-middle income trade partners. Sample based on the Inter Country Input-Output (ICIO) tables developed by the oECD-WTo partnership. These tables are available for 61 countries (plus the Rest of the World) with a breakdown into 34 industries (based on ISIC Rev. 3). All variables are expressed in growth rates over five-year intervals (1995–2000, 2000–05, and 2005–10). The estimation allows for country-year fixed effects.
Among the large developing ASEAN economies, the Philippines and Vietnam enjoy the strongest growth prospects; growth in Indonesia is expected to accelerate, contingent on the implementation of government reforms and investment plans. In the Philippines, growth is projected to firm to 6.4 percent in 2016, reflecting accelerated implementation of the existing pipeline of public-private partnership projects, and spending related to the May 2016 presidential election. The country also benefits from relatively diversified export markets and lower global commodity prices. In Vietnam, output is expected to expand at an average of 6.3 percent during 2016–18, supported by continued strong growth in domestic demand and manufacturing exports, although there are risks associated with fiscal pressures and relatively slow progress on structural reforms. Growth in Indonesia is expected to accelerate to 5.1 percent in 2016 and 5.3 percent in 2017, despite persistently low commodity prices and other headwinds to external demand (Figure I.B.2). However, this outlook is contingent on the implementation of an ambitious public investment program, and the success of recent reforms to reduce red tape and uncertainty for private investors. More generally, while public investment has made a substantial contribution to growth in both Indonesia and the Philippines in recent years, the extent to which private investment emerges as a driver of growth will be a key determinant of the medium-term outlook.
6 The regional neighbors of China are defined as Brunei Darussalam; Cambodia; Taiwan, China; Hong Kong SAR, China; India; Indonesia; Japan; Korea; Malaysia; Philippines; Russia; Singapore; Thailand; and Vietnam. Income categories are identified according to the World Bank income classification.
(Box I.B.2 continued)
EAST ASIA AND PACIFIC ECONOMIC UPDATE APRIL 2016
48 PART I. RECENT DEVELoPMENTS AND oUTLooK

Figure I.B.2. Commodity price forecasts have been revised downward over the past two years, and are projected to remain close to recent levels through 2018Index, 2010 = 100
Energy commodities Nonenergy commodities130
120
110
100
90
80
70
60
2013 2014 2015 2016 2017 2018
105
100
95
90
85
80
2013 2014 2015 2016 2017 2018
▬ Apr-16 ▬ Oct-15 ▬ Apr-15 ▬ Oct-14 ▬ Apr-14 ▬ Apr-16 ▬ Oct-15 ▬ Apr-15 ▬ Oct-14 ▬ Apr-14
Source: World Bank staff estimates.
In Malaysia, weaker demand from China and low commodity prices will constrain growth and public spending; in Thailand, weaker external demand and policy uncertainty will continue to weigh on private investment. In Malaysia, growth will slow to around 4.4 percent in 2016 and 2017, as consumption growth remains subdued, while the commodity downturn and its impact on government revenues limits the scope for public sector spending. In Thailand, growth will remain relatively weak, at 2.7 percent on average during 2016–18. Private consumption will underpin growth, driven by improving consumer confidence, but export growth will likely remain soft given weaker demand from China, and political uncertainty is likely to continue to weigh on private investment.
In several of the small economies in the region, growth will be affected by low commodity prices and weaker external demand. Mongolia continues to adjust to the end of a mining boom, with economic activity held back by weakening mineral exports and efforts by the government to control its debt. In Cambodia, growth will remain slightly below 7 percent during 2016–18, reflecting weaker prices for agricultural commodities, constrained garment exports amid competition from market entrants in other countries, and moderating growth in tourism after a period of strong gains. Since Cambodia is largely dollarized, its trade competitiveness will continue to be adversely affected to the extent the US dollar remains elevated or appreciates further against EAP currencies. However, Cambodia should benefit from rebalancing in China to the extent that it competes with Chinese manufacturers in third markets. In Lao PDR, growth is expected to remain around 7 percent over the next three years, driven by electricity generation and exports. In Myanmar, growth will accelerate above 8 percent during 2017–18, driven by domestic demand, progress on structural reforms, and major investments in the power sector. In Papua New Guinea, growth is expected to fall sharply in 2016, since production of liquefied natural gas (LNG) is reaching a peak, and low LNG prices are generating continued headwinds. In Timor-Leste, growth in the non-oil economy is expected to rebound to between 5 and 6 percent in the medium term, with investment, and especially public sector construction projects, the major driver.
Underlyinginflationarypressuresremainweakinthemajorregionaleconomies.Weak growth or outright declines in producer prices suggest few incipient inflationary pressures. While commodity prices have recently
GROWING CHALLENGES
I.B. OUTLOOK AND RISKS 49
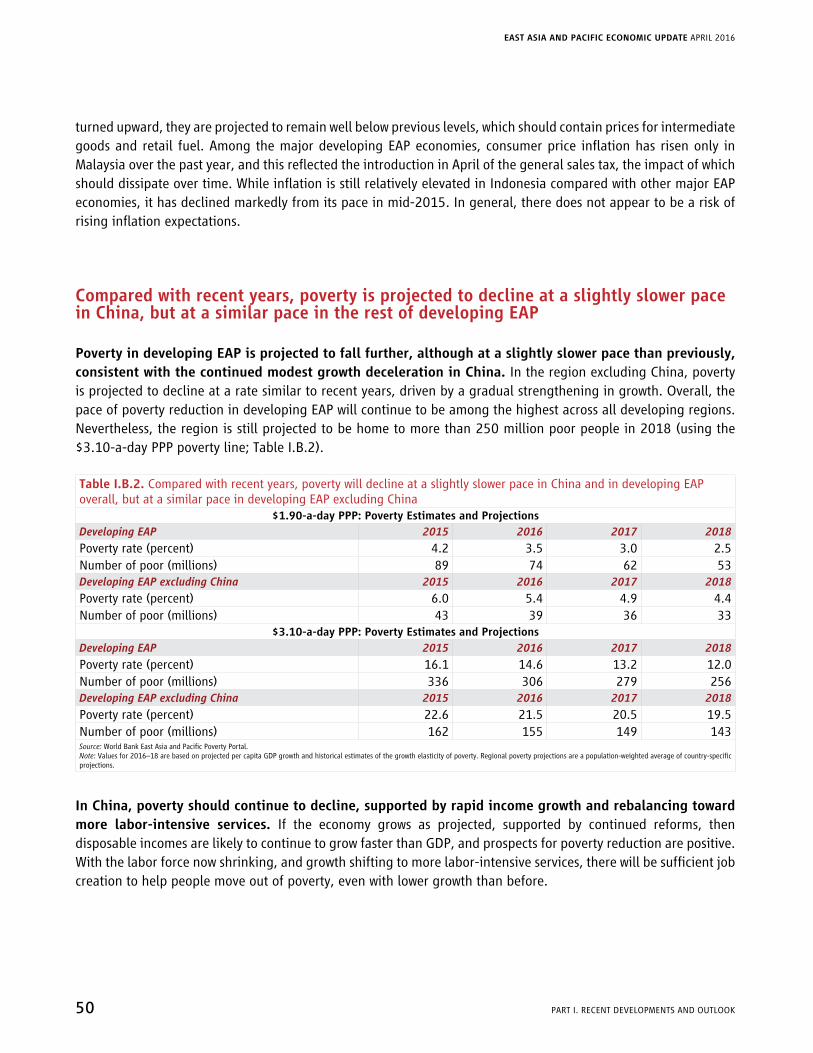
turned upward, they are projected to remain well below previous levels, which should contain prices for intermediate goods and retail fuel. Among the major developing EAP economies, consumer price inflation has risen only in Malaysia over the past year, and this reflected the introduction in April of the general sales tax, the impact of which should dissipate over time. While inflation is still relatively elevated in Indonesia compared with other major EAP economies, it has declined markedly from its pace in mid-2015. In general, there does not appear to be a risk of rising inflation expectations.
Compared with recent years, poverty is projected to decline at a slightly slower pace in China, but at a similar pace in the rest of developing EAP
Poverty in developing EAP is projected to fall further, although at a slightly slower pace than previously, consistent with the continued modest growth deceleration in China. In the region excluding China, poverty is projected to decline at a rate similar to recent years, driven by a gradual strengthening in growth. Overall, the pace of poverty reduction in developing EAP will continue to be among the highest across all developing regions. Nevertheless, the region is still projected to be home to more than 250 million poor people in 2018 (using the $3.10-a-day PPP poverty line; Table I.B.2).
Table I.B.2. Compared with recent years, poverty will decline at a slightly slower pace in China and in developing EAP overall, but at a similar pace in developing EAP excluding China
$1.90-a-dayPPP:PovertyEstimatesandProjectionsDeveloping EAP 2015 2016 2017 2018
Poverty rate (percent) 4.2 3.5 3.0 2.5Number of poor (millions) 89 74 62 53Developing EAP excluding China 2015 2016 2017 2018
Poverty rate (percent) 6.0 5.4 4.9 4.4Number of poor (millions) 43 39 36 33
$3.10-a-dayPPP:PovertyEstimatesandProjectionsDeveloping EAP 2015 2016 2017 2018
Poverty rate (percent) 16.1 14.6 13.2 12.0Number of poor (millions) 336 306 279 256Developing EAP excluding China 2015 2016 2017 2018
Poverty rate (percent) 22.6 21.5 20.5 19.5Number of poor (millions) 162 155 149 143Source: World Bank East Asia and Pacific Poverty Portal.Note: Values for 2016–18 are based on projected per capita GDP growth and historical estimates of the growth elasticity of poverty. Regional poverty projections are a population-weighted average of country-specific projections.
In China, poverty should continue to decline, supported by rapid income growth and rebalancing toward more labor-intensive services. If the economy grows as projected, supported by continued reforms, then disposable incomes are likely to continue to grow faster than GDP, and prospects for poverty reduction are positive. With the labor force now shrinking, and growth shifting to more labor-intensive services, there will be sufficient job creation to help people move out of poverty, even with lower growth than before.
EAST ASIA AND PACIFIC ECONOMIC UPDATE APRIL 2016
50 PART I. RECENT DEVELoPMENTS AND oUTLooK

In Vietnam, the Philippines, and Indonesia, the strong growth outlook bodes well for future poverty reduction, but ensuring the inclusiveness of labor markets will also be important. In Vietnam and the Philippines, prospects for poverty reduction depend on the positive employment trends observed in recent years being sustained, and on growth becoming more inclusive across all population subgroups, particularly ethnic minorities (Vietnam) and households reliant on agriculture (the Philippines). In Indonesia, with growth expected to pick up to above 5 percent, extreme poverty is projected to continue declining. However, half of all workers are informally employed, which contributes to high vulnerability and rising inequality; much will depend on whether reforms are successful in accelerating the reallocation of workers to more productive activities, and providing greater protection against negative shocks.
The level of uncertainty around growth and poverty projections is high, with the risk that outcomes may be worse than expected
The positive scenario for growth and poverty reduction in the region in this base case is subject to a high degreeofuncertainty,withsignificantrisks.The bouts of market volatility observed since mid-2015 suggest that market participants have become increasingly sensitive to these risks. In particular, increasing uncertainty surrounds the speed of recovery in high-income economies and the smoothness of China’s economic rebalancing, both of which will have important spillover effects on the developing EAP region. Relatedly, financial volatility could increase again, with implications for the evolution of financial flows from the rest of the world to developing EAP. And the outlook for growth globally and in China will affect commodity prices, with important implications for commodity exporters. The outlook for poverty reduction is even more uncertain, depending not only on the forecasts for growth, but also on the success of efforts to promote its inclusiveness.
The risk of prolonged or further economic weakness in high-income economies and the outlook for growth in China are key sources of uncertainty. In China, the ongoing rebalancing process is consistent with a modest slowdown in growth. However, there are risks associated with the interplay between high levels of indebtedness, price deflation, and slowing growth, and with the possibility of a reversal or inconsistent implementation of reforms. A faster-than-expected slowdown in China, or a prolonged period of stagnation in the United States, Europe, or Japan, would have considerable effects on growth prospects in the rest of developing EAP, through both trade and financial market linkages.
The realization of these risks to growth would put further downward pressure on commodity prices. The future path of commodity prices will depend on demand from China and from industrialized countries, and the extent to which the decline in prices already observed translates into lower supply from commodity producers. The baseline scenario assumes that key commodity prices increase only modestly over the next few years from their very low current levels (Figure I.B.2). Although lower-for-longer commodity prices could benefit much of the region, a further decline would negatively affect fiscal balances and real activity in commodity exporters.
The region could also face a sharp tightening in financing conditions and an increase in marketvolatility, triggered by weaker-than-expected economic outcomes, or by an unexpected move away from accommodative monetary policy in high-income economies. A sharp slowdown in China could prompt increased
GROWING CHALLENGES
I.B. OUTLOOK AND RISKS 51
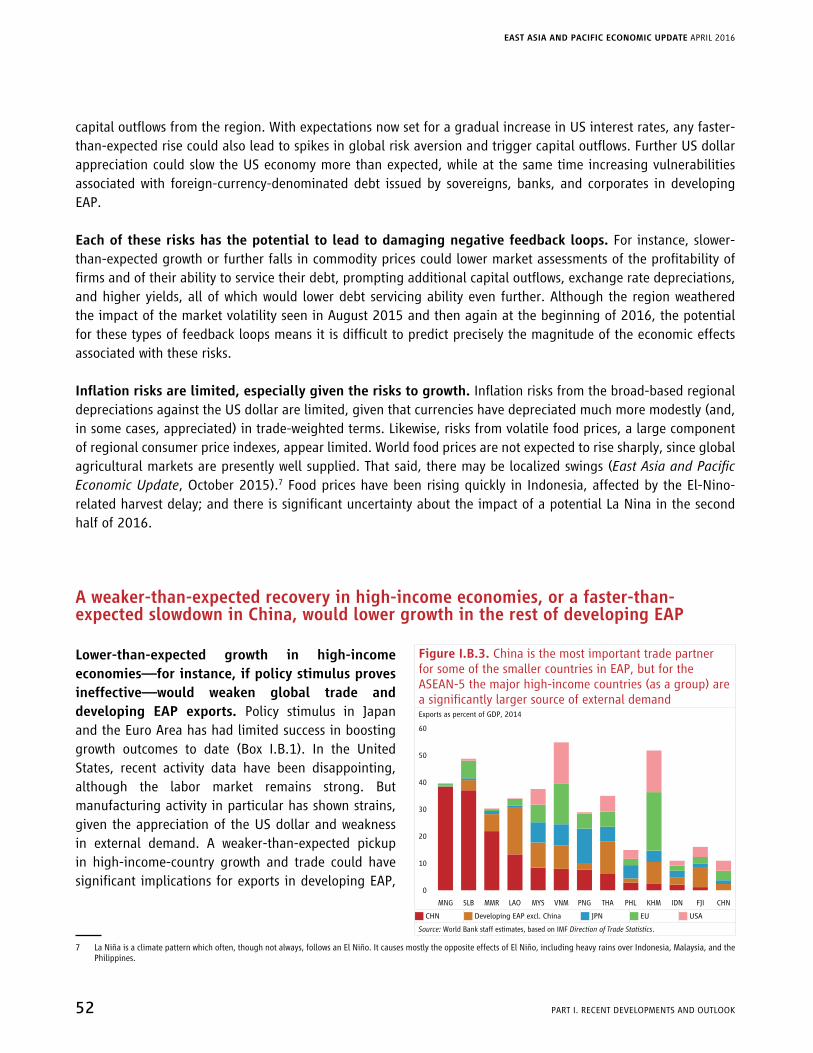
capital outflows from the region. With expectations now set for a gradual increase in US interest rates, any faster-than-expected rise could also lead to spikes in global risk aversion and trigger capital outflows. Further US dollar appreciation could slow the US economy more than expected, while at the same time increasing vulnerabilities associated with foreign-currency-denominated debt issued by sovereigns, banks, and corporates in developing EAP.
Each of these risks has the potential to lead to damaging negative feedback loops. For instance, slower-than-expected growth or further falls in commodity prices could lower market assessments of the profitability of firms and of their ability to service their debt, prompting additional capital outflows, exchange rate depreciations, and higher yields, all of which would lower debt servicing ability even further. Although the region weathered the impact of the market volatility seen in August 2015 and then again at the beginning of 2016, the potential for these types of feedback loops means it is difficult to predict precisely the magnitude of the economic effects associated with these risks.
Inflationrisksarelimited,especiallygiventheriskstogrowth.Inflation risks from the broad-based regional depreciations against the US dollar are limited, given that currencies have depreciated much more modestly (and, in some cases, appreciated) in trade-weighted terms. Likewise, risks from volatile food prices, a large component of regional consumer price indexes, appear limited. World food prices are not expected to rise sharply, since global agricultural markets are presently well supplied. That said, there may be localized swings (East Asia and Pacific Economic Update, October 2015).7 Food prices have been rising quickly in Indonesia, affected by the El-Nino-related harvest delay; and there is significant uncertainty about the impact of a potential La Nina in the second half of 2016.
A weaker-than-expected recovery in high-income economies, or a faster-than-expected slowdown in China, would lower growth in the rest of developing EAP
Lower-than-expected growth in high-income economies—for instance, if policy stimulus proves ineffective—would weaken global trade and developing EAP exports. Policy stimulus in Japan and the Euro Area has had limited success in boosting growth outcomes to date (Box I.B.1). In the United States, recent activity data have been disappointing, although the labor market remains strong. But manufacturing activity in particular has shown strains, given the appreciation of the US dollar and weakness in external demand. A weaker-than-expected pickup in high-income-country growth and trade could have significant implications for exports in developing EAP,
7 La Niña is a climate pattern which often, though not always, follows an El Niño. It causes mostly the opposite effects of El Niño, including heavy rains over Indonesia, Malaysia, and the Philippines.
Figure I.B.3. China is the most important trade partner for some of the smaller countries in EAP, but for the ASEAN-5 the major high-income countries (as a group) are a significantly larger source of external demandExports as percent of GDP, 2014
60
50
40
20
30
0
10
MNG SLB MMR LAO MYS VNM PNG THA PHL KHM IDN FJI CHN
J CHN J Developing EAP excl. China J JPN J EU J USA
Source: World Bank staff estimates, based on IMF Direction of Trade Statistics.
EAST ASIA AND PACIFIC ECONOMIC UPDATE APRIL 2016
52 PART I. RECENT DEVELoPMENTS AND oUTLooK
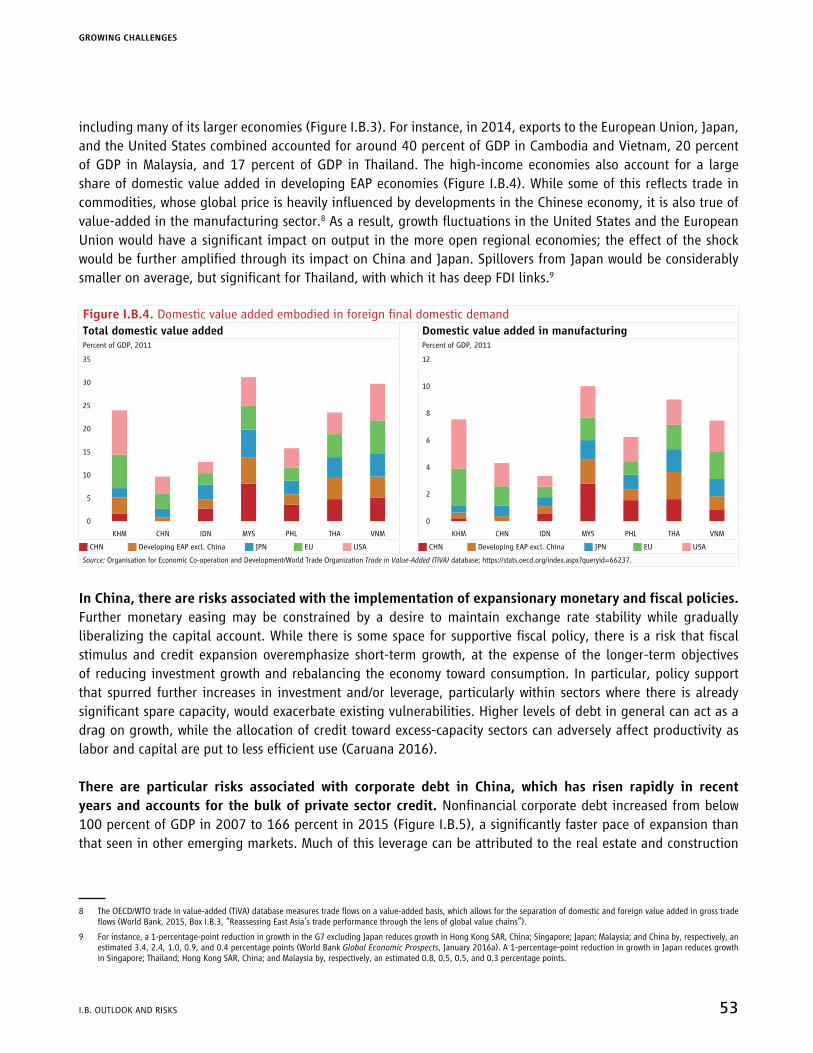
including many of its larger economies (Figure I.B.3). For instance, in 2014, exports to the European Union, Japan, and the United States combined accounted for around 40 percent of GDP in Cambodia and Vietnam, 20 percent of GDP in Malaysia, and 17 percent of GDP in Thailand. The high-income economies also account for a large share of domestic value added in developing EAP economies (Figure I.B.4). While some of this reflects trade in commodities, whose global price is heavily influenced by developments in the Chinese economy, it is also true of value-added in the manufacturing sector.8 As a result, growth fluctuations in the United States and the European Union would have a significant impact on output in the more open regional economies; the effect of the shock would be further amplified through its impact on China and Japan. Spillovers from Japan would be considerably smaller on average, but significant for Thailand, with which it has deep FDI links.9
Figure I.B.4. Domestic value added embodied in foreign final domestic demandTotal domestic value added Domestic value added in manufacturingPercent of GDP, 2011 Percent of GDP, 2011
35
30
25
20
15
10
5
0
KHM CHN IDN MYS PHL THA VNM
12
10
8
6
4
2
0
KHM CHN IDN MYS PHL THA VNM
J CHN J Developing EAP excl. China J JPN J EU J USA J CHN J Developing EAP excl. China J JPN J EU J USA
Source: organisation for Economic Co-operation and Development/World Trade organization Trade in Value-Added (TiVA) database; https://stats.oecd.org/index.aspx?queryid=66237.
InChina,therearerisksassociatedwiththeimplementationofexpansionarymonetaryandfiscalpolicies.Further monetary easing may be constrained by a desire to maintain exchange rate stability while gradually liberalizing the capital account. While there is some space for supportive fiscal policy, there is a risk that fiscal stimulus and credit expansion overemphasize short-term growth, at the expense of the longer-term objectives of reducing investment growth and rebalancing the economy toward consumption. In particular, policy support that spurred further increases in investment and/or leverage, particularly within sectors where there is already significant spare capacity, would exacerbate existing vulnerabilities. Higher levels of debt in general can act as a drag on growth, while the allocation of credit toward excess-capacity sectors can adversely affect productivity as labor and capital are put to less efficient use (Caruana 2016).
There are particular risks associated with corporate debt in China, which has risen rapidly in recent years and accounts for the bulk of private sector credit. Nonfinancial corporate debt increased from below 100 percent of GDP in 2007 to 166 percent in 2015 (Figure I.B.5), a significantly faster pace of expansion than that seen in other emerging markets. Much of this leverage can be attributed to the real estate and construction
8 The oECD/WTo trade in value-added (TiVA) database measures trade flows on a value-added basis, which allows for the separation of domestic and foreign value added in gross trade flows (World Bank, 2015, Box I.B.3, “Reassessing East Asia’s trade performance through the lens of global value chains”).
9 For instance, a 1-percentage-point reduction in growth in the G7 excluding Japan reduces growth in Hong Kong SAR, China; Singapore; Japan; Malaysia; and China by, respectively, an estimated 3.4, 2.4, 1.0, 0.9, and 0.4 percentage points (World Bank Global Economic Prospects, January 2016a). A 1-percentage-point reduction in growth in Japan reduces growth in Singapore; Thailand; Hong Kong SAR, China; and Malaysia by, respectively, an estimated 0.8, 0.5, 0.5, and 0.3 percentage points.
GROWING CHALLENGES
I.B. OUTLOOK AND RISKS 53
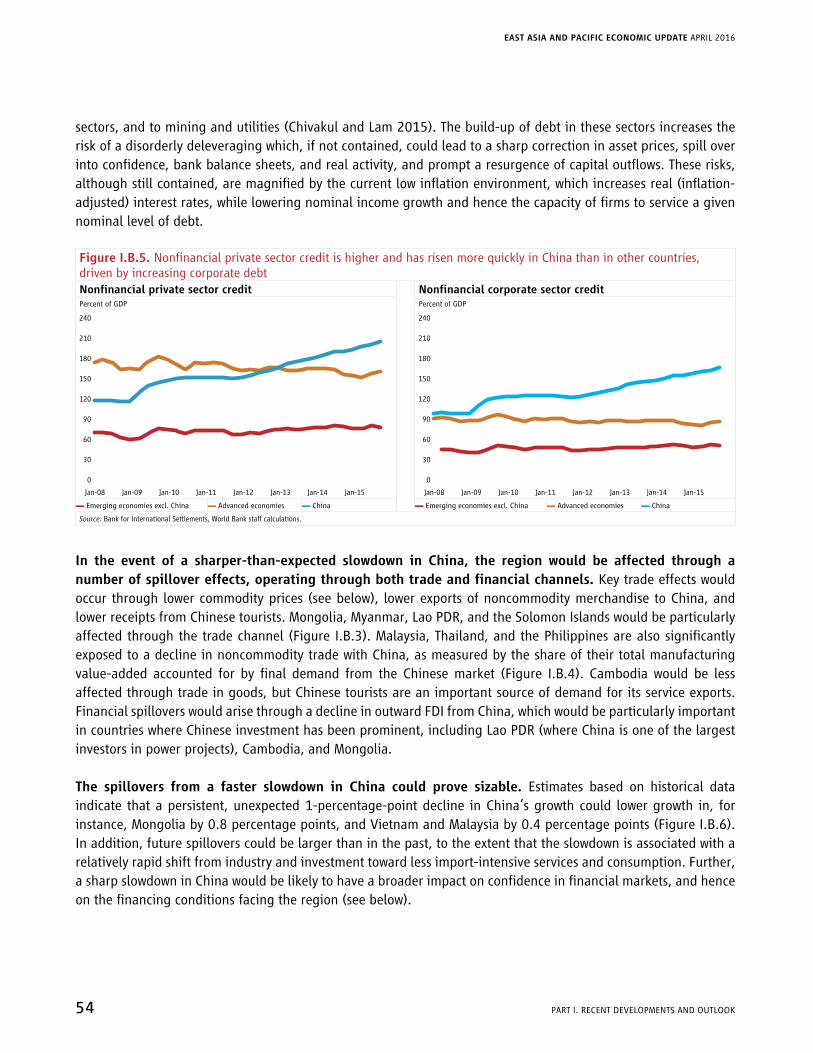
sectors, and to mining and utilities (Chivakul and Lam 2015). The build-up of debt in these sectors increases the risk of a disorderly deleveraging which, if not contained, could lead to a sharp correction in asset prices, spill over into confidence, bank balance sheets, and real activity, and prompt a resurgence of capital outflows. These risks, although still contained, are magnified by the current low inflation environment, which increases real (inflation-adjusted) interest rates, while lowering nominal income growth and hence the capacity of firms to service a given nominal level of debt.
Figure I.B.5. Nonfinancial private sector credit is higher and has risen more quickly in China than in other countries, driven by increasing corporate debtNonfinancialprivatesectorcredit NonfinancialcorporatesectorcreditPercent of GDP Percent of GDP
240
210
180
150
120
90
60
30
0
Jan-08 Jan-09 Jan-10 Jan-11 Jan-12 Jan-13 Jan-14 Jan-15
240
210
180
150
120
90
60
30
0
Jan-08 Jan-09 Jan-10 Jan-11 Jan-12 Jan-13 Jan-14 Jan-15
▬ Emerging economies excl. China ▬ Advanced economies ▬ China ▬ Emerging economies excl. China ▬ Advanced economies ▬ China
Source: Bank for International Settlements, World Bank staff calculations.
In the event of a sharper-than-expected slowdown in China, the region would be affected through a numberofspillovereffects,operatingthroughbothtradeandfinancialchannels.Key trade effects would occur through lower commodity prices (see below), lower exports of noncommodity merchandise to China, and lower receipts from Chinese tourists. Mongolia, Myanmar, Lao PDR, and the Solomon Islands would be particularly affected through the trade channel (Figure I.B.3). Malaysia, Thailand, and the Philippines are also significantly exposed to a decline in noncommodity trade with China, as measured by the share of their total manufacturing value-added accounted for by final demand from the Chinese market (Figure I.B.4). Cambodia would be less affected through trade in goods, but Chinese tourists are an important source of demand for its service exports. Financial spillovers would arise through a decline in outward FDI from China, which would be particularly important in countries where Chinese investment has been prominent, including Lao PDR (where China is one of the largest investors in power projects), Cambodia, and Mongolia.
The spillovers from a faster slowdown in China could prove sizable. Estimates based on historical data indicate that a persistent, unexpected 1-percentage-point decline in China’s growth could lower growth in, for instance, Mongolia by 0.8 percentage points, and Vietnam and Malaysia by 0.4 percentage points (Figure I.B.6). In addition, future spillovers could be larger than in the past, to the extent that the slowdown is associated with a relatively rapid shift from industry and investment toward less import-intensive services and consumption. Further, a sharp slowdown in China would be likely to have a broader impact on confidence in financial markets, and hence on the financing conditions facing the region (see below).
Figure I.B.6. Spillovers from China to other countries in EAPAnnualized growth response to an unanticipated 1-percentage-point decline in growth in China, percentage points
0
-0.1
-0.2
-0.3
-0.4
-0.5
-0.6
-0.7
-0.9
-0.8
MNG SGP HKG VNM MYS IDN THA PHL KOR JPN
Source: World Bank staff estimates.Note: Estimates based on a Bayesian SVAR, estimated using quarterly data for Q2 1998: Q4 2015. The model includes the following variables: (1) G7 real GDP growth (excluding Japan); (2) Emerging Market Bond Index (EMBI) (which proxies for global financial conditions); (3) Japan real GDP growth; (4) China real GDP growth; (5) Korea real GDP growth; (6) commodity price growth; (7) domestic real GDP growth; and (8) real effective exchange rate growth. Commodity prices are weighted by each commodity’s average export share in the commodity export basket of the spillover destination country in question. A lag length of four quarters is adopted. Identification is based on a recursive structure, with variables ordered as listed above, and earlier variables assumed to be contemporaneously unaffected by later variables. Inferences are based on 2,000 Monte Carlo draws. Spillovers are inferred by tracing out the cumulative responses to an exogenous shock that reduces China’s growth by 1 percentage point on impact. The illustrated point estimate is the median of the posterior distribution.
EAST ASIA AND PACIFIC ECONOMIC UPDATE APRIL 2016
54 PART I. RECENT DEVELoPMENTS AND oUTLooK
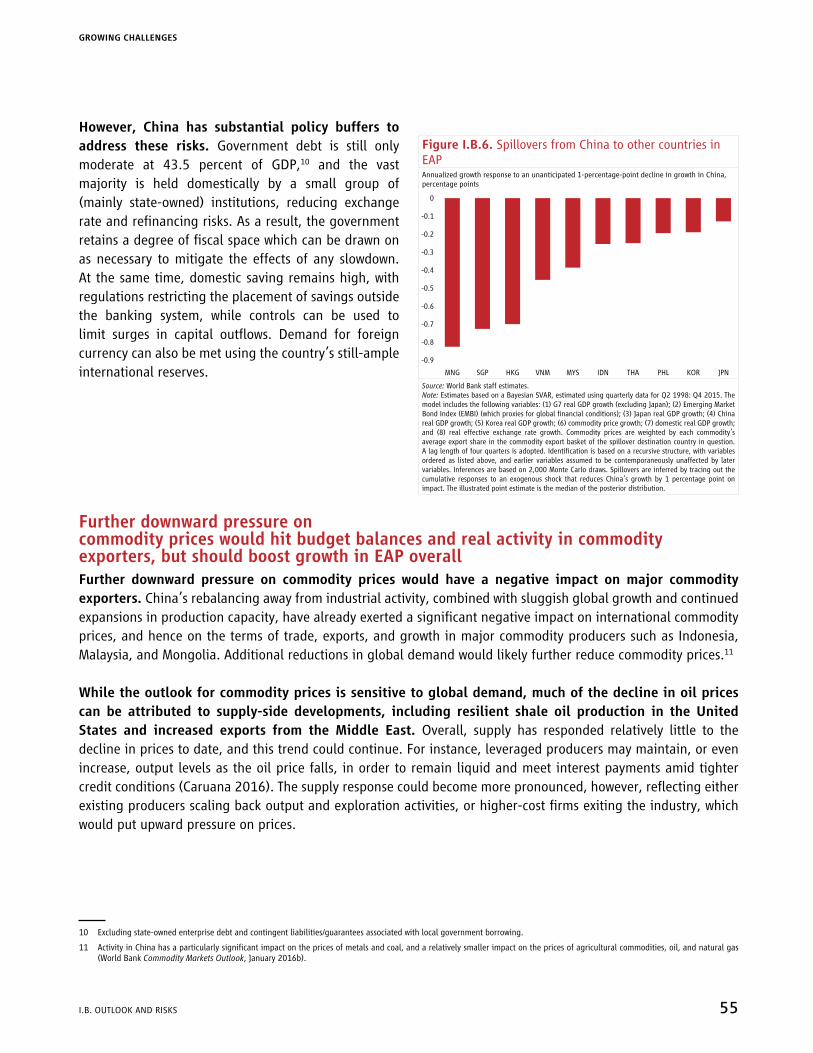
However, China has substantial policy buffers to address these risks. Government debt is still only moderate at 43.5 percent of GDP,10 and the vast majority is held domestically by a small group of (mainly state-owned) institutions, reducing exchange rate and refinancing risks. As a result, the government retains a degree of fiscal space which can be drawn on as necessary to mitigate the effects of any slowdown. At the same time, domestic saving remains high, with regulations restricting the placement of savings outside the banking system, while controls can be used to limit surges in capital outflows. Demand for foreign currency can also be met using the country’s still-ample international reserves.
Further downward pressure on commodity prices would hit budget balances and real activity in commodity exporters, but should boost growth in EAP overallFurther downward pressure on commodity prices would have a negative impact on major commodity exporters. China’s rebalancing away from industrial activity, combined with sluggish global growth and continued expansions in production capacity, have already exerted a significant negative impact on international commodity prices, and hence on the terms of trade, exports, and growth in major commodity producers such as Indonesia, Malaysia, and Mongolia. Additional reductions in global demand would likely further reduce commodity prices.11
While the outlook for commodity prices is sensitive to global demand, much of the decline in oil prices can be attributed to supply-side developments, including resilient shale oil production in the United States and increased exports from the Middle East. Overall, supply has responded relatively little to the decline in prices to date, and this trend could continue. For instance, leveraged producers may maintain, or even increase, output levels as the oil price falls, in order to remain liquid and meet interest payments amid tighter credit conditions (Caruana 2016). The supply response could become more pronounced, however, reflecting either existing producers scaling back output and exploration activities, or higher-cost firms exiting the industry, which would put upward pressure on prices.
10 Excluding state-owned enterprise debt and contingent liabilities/guarantees associated with local government borrowing.
11 Activity in China has a particularly significant impact on the prices of metals and coal, and a relatively smaller impact on the prices of agricultural commodities, oil, and natural gas (World Bank Commodity Markets Outlook, January 2016b).
sectors, and to mining and utilities (Chivakul and Lam 2015). The build-up of debt in these sectors increases the risk of a disorderly deleveraging which, if not contained, could lead to a sharp correction in asset prices, spill over into confidence, bank balance sheets, and real activity, and prompt a resurgence of capital outflows. These risks, although still contained, are magnified by the current low inflation environment, which increases real (inflation-adjusted) interest rates, while lowering nominal income growth and hence the capacity of firms to service a given nominal level of debt.
Figure I.B.5. Nonfinancial private sector credit is higher and has risen more quickly in China than in other countries, driven by increasing corporate debtNonfinancialprivatesectorcredit NonfinancialcorporatesectorcreditPercent of GDP Percent of GDP
▬ Emerging economies excl. China ▬ Advanced economies ▬ China ▬ Emerging economies excl. China ▬ Advanced economies ▬ China
Source: Bank for International Settlements, World Bank staff calculations.
In the event of a sharper-than-expected slowdown in China, the region would be affected through a numberofspillovereffects,operatingthroughbothtradeandfinancialchannels.Key trade effects would occur through lower commodity prices (see below), lower exports of noncommodity merchandise to China, and lower receipts from Chinese tourists. Mongolia, Myanmar, Lao PDR, and the Solomon Islands would be particularly affected through the trade channel (Figure I.B.3). Malaysia, Thailand, and the Philippines are also significantly exposed to a decline in noncommodity trade with China, as measured by the share of their total manufacturing value-added accounted for by final demand from the Chinese market (Figure I.B.4). Cambodia would be less affected through trade in goods, but Chinese tourists are an important source of demand for its service exports. Financial spillovers would arise through a decline in outward FDI from China, which would be particularly important in countries where Chinese investment has been prominent, including Lao PDR (where China is one of the largest investors in power projects), Cambodia, and Mongolia.
The spillovers from a faster slowdown in China could prove sizable. Estimates based on historical data indicate that a persistent, unexpected 1-percentage-point decline in China’s growth could lower growth in, for instance, Mongolia by 0.8 percentage points, and Vietnam and Malaysia by 0.4 percentage points (Figure I.B.6). In addition, future spillovers could be larger than in the past, to the extent that the slowdown is associated with a relatively rapid shift from industry and investment toward less import-intensive services and consumption. Further, a sharp slowdown in China would be likely to have a broader impact on confidence in financial markets, and hence on the financing conditions facing the region (see below).
Figure I.B.6. Spillovers from China to other countries in EAPAnnualized growth response to an unanticipated 1-percentage-point decline in growth in China, percentage points
0
-0.1
-0.2
-0.3
-0.4
-0.5
-0.6
-0.7
-0.9
-0.8
MNG SGP HKG VNM MYS IDN THA PHL KOR JPN
Source: World Bank staff estimates.Note: Estimates based on a Bayesian SVAR, estimated using quarterly data for Q2 1998: Q4 2015. The model includes the following variables: (1) G7 real GDP growth (excluding Japan); (2) Emerging Market Bond Index (EMBI) (which proxies for global financial conditions); (3) Japan real GDP growth; (4) China real GDP growth; (5) Korea real GDP growth; (6) commodity price growth; (7) domestic real GDP growth; and (8) real effective exchange rate growth. Commodity prices are weighted by each commodity’s average export share in the commodity export basket of the spillover destination country in question. A lag length of four quarters is adopted. Identification is based on a recursive structure, with variables ordered as listed above, and earlier variables assumed to be contemporaneously unaffected by later variables. Inferences are based on 2,000 Monte Carlo draws. Spillovers are inferred by tracing out the cumulative responses to an exogenous shock that reduces China’s growth by 1 percentage point on impact. The illustrated point estimate is the median of the posterior distribution.
GROWING CHALLENGES
I.B. OUTLOOK AND RISKS 55

Depending on the composition of their export and import baskets, declines in various commodity prices would have differential effects across the region. Lower prices for crude oil would dampen activity in Malaysia and Timor-Leste; for natural gas, in Indonesia, Malaysia, Myanmar, and Papua New Guinea; for coal, in Indonesia and Mongolia; for rubber, in Indonesia and Malaysia; for copper, in Lao PDR and Mongolia; and for gold, in Lao PDR. In countries where growth is heavily dependent on public spending and investment, such as Timor-Leste, the tighter fiscal constraints imposed by lower commodity prices may have a particularly marked impact. Lower oil prices could also reduce investment in the broader oil and gas sector, which accounts for around 12 percent of corporate investment in Asia (IMF 2015), and may also exacerbate financial vulnerabilities in oil-producing firms.
Thatsaid,fallingcommoditypriceswouldbenefitnetcommodityimporters,suchasthePhilippinesandThailand. However, the decline in oil prices since mid-2014 has so far provided limited impetus to growth in the region. Windfalls are estimated to have been mostly saved, by either the public sector (through reformed subsidy regimes in some countries) or the private sector (for precautionary purposes). If the declines prove to be persistent, consumers may start saving less and businesses investing more, providing a boost to aggregate demand, especially in commodity-importing economies, and a larger upside impetus to growth than currently envisaged.
Aresurgenceoffinancialmarketvolatilityandrapidtighteningoffinancialconditions could have negative effects on real activity
Aspikeinfinancialmarketvolatility—whethertriggeredbyagrowthslowdowninChina,orasharper-than-expected rise in US interest rates—presents an important external risk to several developing EAP countries. Under an adverse scenario, corporate and bank balance sheets and cash flows would be stressed. This presents a particular risk for several of the larger EAP economies, where corporate and household debt levels are already elevated, and a relatively high proportion of this lending comes from the banking sector (Figure I.B.7). Together with the ensuing domestic policy adjustments, the realization of such an adverse scenario could push growth down significantly.
In China, an unexpectedly sharp downturn in growth would likely result in a more generalized investor pullbackfromtheregion,andsignificantfinancialvolatility.In particular, there could be increased capital outflows, and downward pressure on the renminbi, which would have spillover effects on other regional currencies.
A sharper-than-expected rise in long-term US rates during the policy tightening cycle, although less likelyinlightofrecentdevelopments,couldtriggersharpcapitaloutflowsfromtheregion.This would raise domestic borrowing costs, posing balance sheet risks for highly leveraged corporations, and potentially compromising financial stability as asset quality deteriorates (World Bank 2016a). At the same time, any sharp depreciation of regional currencies against the US dollar would raise the cost of servicing US-dollar-denominated debt, amounts of which have grown in the period since the US Fed funds rate reached its historical lows in 2009.
Irrespective of the trigger, a sharp tightening in external financing conditions would have differentimpacts across the region, depending on countries’ particular vulnerabilities. The countries most at risk are those that rely on portfolio flows and short-term borrowing to finance current account deficits or debt rollovers,
EAST ASIA AND PACIFIC ECONOMIC UPDATE APRIL 2016
56 PART I. RECENT DEVELoPMENTS AND oUTLooK
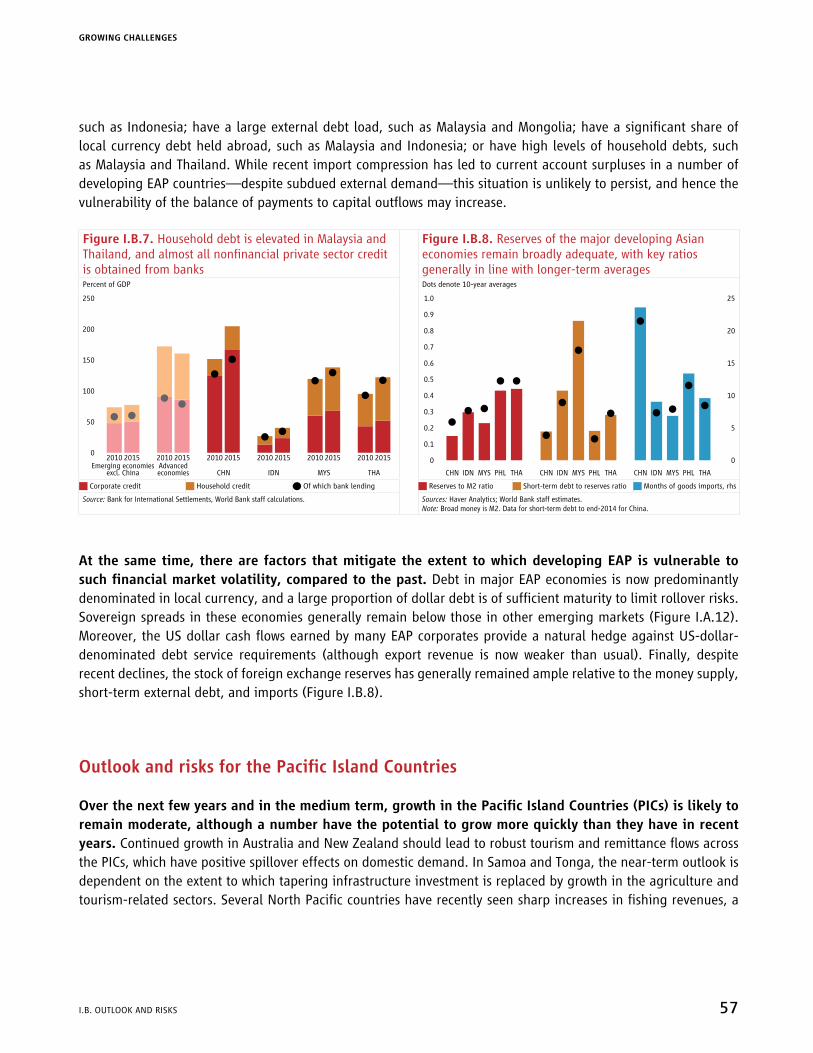
such as Indonesia; have a large external debt load, such as Malaysia and Mongolia; have a significant share of local currency debt held abroad, such as Malaysia and Indonesia; or have high levels of household debts, such as Malaysia and Thailand. While recent import compression has led to current account surpluses in a number of developing EAP countries—despite subdued external demand—this situation is unlikely to persist, and hence the vulnerability of the balance of payments to capital outflows may increase.
Figure I.B.7. Household debt is elevated in Malaysia and Thailand, and almost all nonfinancial private sector credit is obtained from banks
Figure I.B.8. Reserves of the major developing Asian economies remain broadly adequate, with key ratios generally in line with longer-term averages
Percent of GDP Dots denote 10-year averages
250
200
150
100
50
0
Emerging economiesexcl. China
Advancedeconomies CHN IDN MYS THA
2010 2015 2010 2010 2010 2010 20102015 2015 2015 2015 2015
1.0
0.9
0.8
0.7
0.6
0.5
0.4
0.3
0.2
0.1
0
25
20
15
10
0
5
CHN IDN MYS PHL THA CHN CHNIDN IDNMYS MYSPHL PHLTHA THA
J Corporate credit J Household credit Q Of which bank lending J Reserves to M2 ratio J Short-term debt to reserves ratio J Months of goods imports, rhs
Source: Bank for International Settlements, World Bank staff calculations. Sources: Haver Analytics; World Bank staff estimates.Note: Broad money is M2. Data for short-term debt to end-2014 for China.
At the same time, there are factors that mitigate the extent to which developing EAP is vulnerable to suchfinancialmarketvolatility,comparedtothepast.Debt in major EAP economies is now predominantly denominated in local currency, and a large proportion of dollar debt is of sufficient maturity to limit rollover risks. Sovereign spreads in these economies generally remain below those in other emerging markets (Figure I.A.12). Moreover, the US dollar cash flows earned by many EAP corporates provide a natural hedge against US-dollar-denominated debt service requirements (although export revenue is now weaker than usual). Finally, despite recent declines, the stock of foreign exchange reserves has generally remained ample relative to the money supply, short-term external debt, and imports (Figure I.B.8).
OutlookandrisksforthePacificIslandCountries
Overthenextfewyearsandinthemediumterm,growthinthePacificIslandCountries(PICs)islikelytoremain moderate, although a number have the potential to grow more quickly than they have in recent years. Continued growth in Australia and New Zealand should lead to robust tourism and remittance flows across the PICs, which have positive spillover effects on domestic demand. In Samoa and Tonga, the near-term outlook is dependent on the extent to which tapering infrastructure investment is replaced by growth in the agriculture and tourism-related sectors. Several North Pacific countries have recently seen sharp increases in fishing revenues, a
GROWING CHALLENGES
I.B. OUTLOOK AND RISKS 57

trend whose continuation would support growth; however, there are downside risks associated with the recent US withdrawal from the South Pacific Tuna Treaty, and declining tuna prices.
In Fiji, the outlook is heavily dependent on the speed of recovery from Tropical Cyclone Winston; in the Solomon Islands, Tuvalu, and Vanuatu, infrastructure projects will be an important driver of near-term growth. Reconstruction and recovery activities in Fiji will have a direct impact on activity, while also providing a platform for key sectors—such as tourism, sugar, and agriculture—to rebound. In Vanuatu, the recovery in tourism since Tropical Cyclone Pam looks set to continue, and progress on cyclone-related reconstruction may accelerate with a new government in place, though the El-Niño-induced drought has worsened the outlook for agriculture. In the Solomon Islands, large investments in infrastructure and telecommunications are expected to support growth over the coming years. As always, the potential for further natural disasters poses a substantial risk to all the economies in the region.
InflationarypressuresinthePICsarelikelytoremainsubdued.Most PICs are heavily dependent on imported food and fuel, and will therefore continue to benefit from low global commodity prices. A number either use the US dollar as legal tender (that is, the Federated States of Micronesia, the Republic of the Marshall Islands, and Palau) or peg their exchange rate to a basket of currencies including the US dollar, which in many cases has resulted in appreciations in trade-weighted exchange rates.
Should growth slow further in China, the direct impact on the PICs will be limited, since China accounts for only a relatively small share of exports. The major exceptions are Palau, where tourist arrivals from China have recently accounted for a large proportion of overall tourist growth, and the Solomon Islands, for which China is an important export market for timber. However, there is the risk that a sharper-than-expected slowdown in China would adversely affect goods and tourism demand in Australia and New Zealand, which are relatively more important export markets.
Ingeneral, thePICsarealso likely to remain relativelywell insulated from furtherboutsoffinancialmarket volatility. Most of the PICs, with the exception of Fiji and Papua New Guinea, rely very little on private capital inflows, and hence are not directly exposed to a potential reversal of these flows. To finance their structural trade deficits the smaller PICs tend to rely on grants and soft loans from development partners, remittances, and in some cases fishing license fees, with all these sources of foreign exchange less likely to be affected by a tightening of global financing conditions.
EAST ASIA AND PACIFIC ECONOMIC UPDATE APRIL 2016
58 PART I. RECENT DEVELoPMENTS AND oUTLooK
References
Bastos, Paulo. 2015. “Dynamics of China’s trade patterns and implications for neighbor countries.” World Bank Internal Note, World Bank, Washington, DC, December 10.
Boffa, Mauro, Gianluca Santoni, and Daria Taglioni. Forthcoming. “From China with Love.” World Bank, Washington, DC.
Boffa, Mauro, Victor Kummritz, Gianluca Santoni, Daria Taglioni and Deborah Winkler. 2016. “No middle-income trap: the role of global value chain integration for climbing up the income ladder.” World Bank Background Paper prepared for Conference Making Global Value Chains Work for Economic Development and Shared Prosperity, Beijing, March 17–18.
Caruana, J. 2016. “Credit, commodities and currencies.” Lecture at the London School of Economics and Political Science, London, February 5.
Chivakul, M., and W. R. Lam. 2015. “Assessing China’s Corporate Sector Vulnerabilities,” Working Paper WP/15/72, International Monetary Fund, Washington, DC.
IMF (International Monetary Fund). 2015. Regional Economic Outlook: Asia and Pacific. Washington, DC: International Monetary Fund.
Kee, Hiau Looi, and Heiwai Tang. 2015. “Domestic value added in exports: theory and firm evidence from China,” World Bank Policy Research Working Paper 7491, World Bank, Washington, DC, November.
Kummritz, Victor, Gianluca Santoni, Daria Taglioni, Erik van der Marel, and Deborah Winkler. 2015. “China’s integration in GVCs.” World Bank Internal Note, World Bank, Washington, DC.
Rastogi, Cordula, and Benjamin Shepherd. 2015. “China: Trade Costs, Connectivity and Logistics.” World Bank mimeo, World Bank, Washington, DC, December 10.
Santoni, Gianluca, and Daria Taglioni. 2015. “Networks and structural integration in global value chains.” In The Age of Global Value Chains: Maps and Policy Issues, edited by João Amador and Filippo di Mauro. Centre for Economic Policy Research, London, pp. 68–84.
Taglioni, Daria, and Deborah Winkler. 2016. Making GVCs work for development. World Bank, Washington, DC.
Van Assche, Ari, and Johannes Van Biesebroeck. 2015. World Bank Internal Note, World Bank, Washington, DC.
Van der Marel, Erik, and Sebastian Saez. 2016. “Servicification, Regulation and Economic Performance in GVCs.” World Bank Background Paper prepared for Conference Making Global Value Chains Work for Economic Development and Shared Prosperity, Beijing, March 17–18.
World Bank. 2015. East Asia and Pacific Economic Update. Washington, DC: World Bank, October.
______. 2016a. Global Economic Prospects. Washington, DC: World Bank, January.
______. 2016b. Commodity Markets Outlook. Washington, DC: World Bank, January.
GROWING CHALLENGES
I.B. OUTLOOK AND RISKS 59
I.C. Policy Considerations
Across much of the East Asia and Pacific region, the room for policy maneuver has shrunk. In particular, the scope for higher public spending to boost short-term growth has narrowed, especially in commodity exporters, where revenues have already declined substantially. Monetary easing is limited by the already low policy rates in many countries and, increasingly, by the risk that further cuts will exacerbate capital outflows and/or unwanted leverage. Exchange rate flexibility has helped buffer shocks, but further depreciations may also generate significant balance sheet risks. At the same time, the relative resilience of growth in most economies during the past year means they do not need to emphasize countercyclical stabilization efforts.
Countries should instead prioritize monetary and fiscal policies that reduce their exposure to global and regional risks and strengthen credibility and market confidence. In particular, the need to build fiscal buffers to help insure against future external shocks has increased. Such policies are particularly important for those economies where growth has been sustained through increased public or private sector borrowing, or where external demand has been supported by the commodities boom. In China, there continues to be a need to reduce leverage—particularly in those industrial sectors where overcapacity is most evident—including by strengthening market discipline in the financial sector. To assist the rebalancing toward domestic consumption, it is important also to shift fiscal emphasis from public infrastructure investment toward areas such as education, health, social assistance, and the environment. Such measures are consistent with a moderate slowdown over the next few years, while reducing the risks of a much sharper slowdown in the future.
A decisive approach to structural reform is even more important than usual, given the uncertain global environment and the constraints on macroeconomic policy. Structural reforms will boost long-term growth; in the short term, they will also enhance market confidence, reducing financing constraints and vulnerabilities, and enhancing the effectiveness of any policy response to shocks. This edition of the East Asia and Pacific Economic Update highlights the need for action across the region in three areas: (i) enhancing transparency, strengthening accountability, and more generally redefining the role of the state, to sustain the rise of the region’s increasingly complex economies to high-income status; (ii) reducing barriers to trade, with a particular focus on nontariff measures and regulatory barriers, including to trade in services; and (iii) maximizing the benefits from the digital revolution by developing the essential “analog complements” to digital technologies.
In China, a range of structural reforms will be required to support sustainable growth over the longer term. The aim is to facilitate a reallocation of factors of production, including capital, toward sectors and firms that are more productive and have greater growth potential, and away from sectors with excess capacity. Allowing a more market-based allocation of credit, and gradually opening up sectors dominated by state-owned enterprises to competition, would assist in this regard. Continued reform of the household registration system (“hukou”) will facilitate permanent migration to the cities, boost structural transformation, and help reduce rural-urban inequality. In commodity exporters and other countries highly exposed to China’s economy, reforms should promote economic flexibility, by removing barriers to the development of new sectors and the entry of new firms. This requires support for private
EAST ASIA AND PACIFIC ECONOMIC UPDATE APRIL 2016
60 PART I. RECENT DEVELoPMENTS AND oUTLooK

sector development, including through increased competition, prudent regulation, and improved infrastructure, and boosting the capacity to effectively deliver public services that enhance education and health outcomes.
Sustaining the pace of poverty reduction will require measures to upgrade the business environment, improve education and health outcomes, and strengthen social safety nets. Labor is the most important asset of the poor. Governments should therefore avoid distortionary interventions that impede the creation of jobs in cities and within global value chains, and instead tackle barriers to labor mobility and to economic diversification. Where a large share of the poor are employed in agriculture, it is important to improve farmers’ access to information, better seeds, water, electricity, and markets, and to secure property rights. In several countries, improved infrastructure and delivery of social services are key priorities, and need to be supported by tax reforms that generate increased revenues efficiently. Measures to protect the welfare of the poorest and most vulnerable in the face of shocks, including by building systems to protect against disasters and the outbreak and spread of communicable diseases, remain critical.
Chinafacesadifficultshort-termbalancingact—loweringleverageand reducing overcapacity while facilitating a gradual slowdown
InChina,thekeyshort-termchallengeistoreducefinancialvulnerabilitiesintheeconomy,whilepreventingasharpdropinoveralldemandandgrowth,andavoidingabroad-baseddeflationthatexacerbatesdebtburdens. There continues to be a need to decrease leverage at a gradual pace, with a focus on those sectors—including heavy industry and housing—where overcapacity is most obvious. There is also a need to slow the increase of local government debt, including through better alignment of local revenue with expenditure. At the same time, the authorities have stated their commitment to use fiscal policy to stabilize growth, while promoting reforms to rebalance the economy. A strategy of explicit government borrowing, to the extent that it substitutes for quasi-fiscal expansionary measures and further build-ups in corporate and commercial debt, is potentially consistent with reducing macroeconomic risks.
Nevertheless, to assist the rebalancing toward domestic consumption, it will be important to shift the emphasisoffiscalpolicyawayfrompublicinfrastructureinvestmentandtowardareassuchaseducation,health, social assistance, and the environment. Adjustment costs can be minimized through active labor market policies, including the planned industrial restructuring fund to help workers retrain and relocate after losing jobs in overcapacity sectors such as steel and coal. Together, this set of policies will be consistent with a moderate growth slowdown over the next few years, and will reduce the risks of a much sharper slowdown in the future.
GROWING CHALLENGES
I.C. PoLICY CoNSIDERATIoNS 61

Across much of the rest of the region, the room for policy maneuver has shrunk
AcrossmuchoftherestofdevelopingEastAsiaandPacific(EAP),andparticularlyincommodityexporters,the room for policy maneuver has shrunk. At the same time, the relative resilience of growth in most economies during the past year means they do not need to emphasize countercyclical stabilization efforts. Countries should therefore prioritize monetary and fiscal policies that reduce vulnerabilities and strengthen credibility.
In particular, the scope for further public spending to boost short-term growth has narrowed in most countries,whiletheneedtobuildfiscalbufferstohelpensureagainstfutureexternalshockshasincreased.For instance, in Indonesia, the fiscal deficit is nearing the legal limit of 3 percent of GDP, despite efforts to reduce expenditure in response to weaker-than-expected revenues. Malaysia has also been forced to reduce development and current expenditures as commodity prices have fallen.
The scope for further monetary policy easing is limited by the already low policy rates in many EAP countries, and by existing downward pressure on many currencies relative to the US dollar. A further loosening of policy rates could prove counterproductive if it prompted further capital outflows—a significant risk given the current global financial volatility.
Dealingwithcapitaloutflowsandlowercommoditypriceswillrequirecarefulcalibrationofmonetaryandexchangeratepolicies,andattentiontomacrofinancialpolicymoregenerally.Exchange rate flexibility will help buffer shocks, but depreciations may also generate balance-sheet risks (for both sovereigns and corporates) and exacerbate financial pressures created by high degrees of leverage. Meanwhile, in the absence of more substantial reforms to boost the flexibility of the economy, the potential export response to any depreciation may be dampened by supply constraints.
Especially in commodity exporters, there is less scope for governments to support domestic demand through increased expenditure, and more urgency in boosting domesticrevenuetopreservefiscalspace
The current risks highlight the importance of building fiscal buffers. The scope for discretionary fiscal expansion is limited (East Asia and Pacific Economic Update, October 2015). The recent deceleration in nominal GDP in some countries further limits the room for maneuver, to the extent that government expenditures are less responsive to overall price changes than government revenues. Budgets should rest on conservative assumptions regarding the outlook for growth, to preserve fiscal space in the event of a sharp external shock. In several countries (Mongolia, Papua New Guinea, Vietnam), fiscal reforms are needed to stabilize government debt.
In the medium term, there is a need to broaden tax bases, reduce reliance on commodity-related revenues, raise energy taxes, and strengthen public revenue administration. Currently, tax revenues remain significantly below relevant benchmarks (Box I.C.1). Taking steps to strengthen public revenues on a sustainable basis remains the major underlying fiscal challenge across much of the region.
EAST ASIA AND PACIFIC ECONOMIC UPDATE APRIL 2016
62 PART I. RECENT DEVELoPMENTS AND oUTLooK
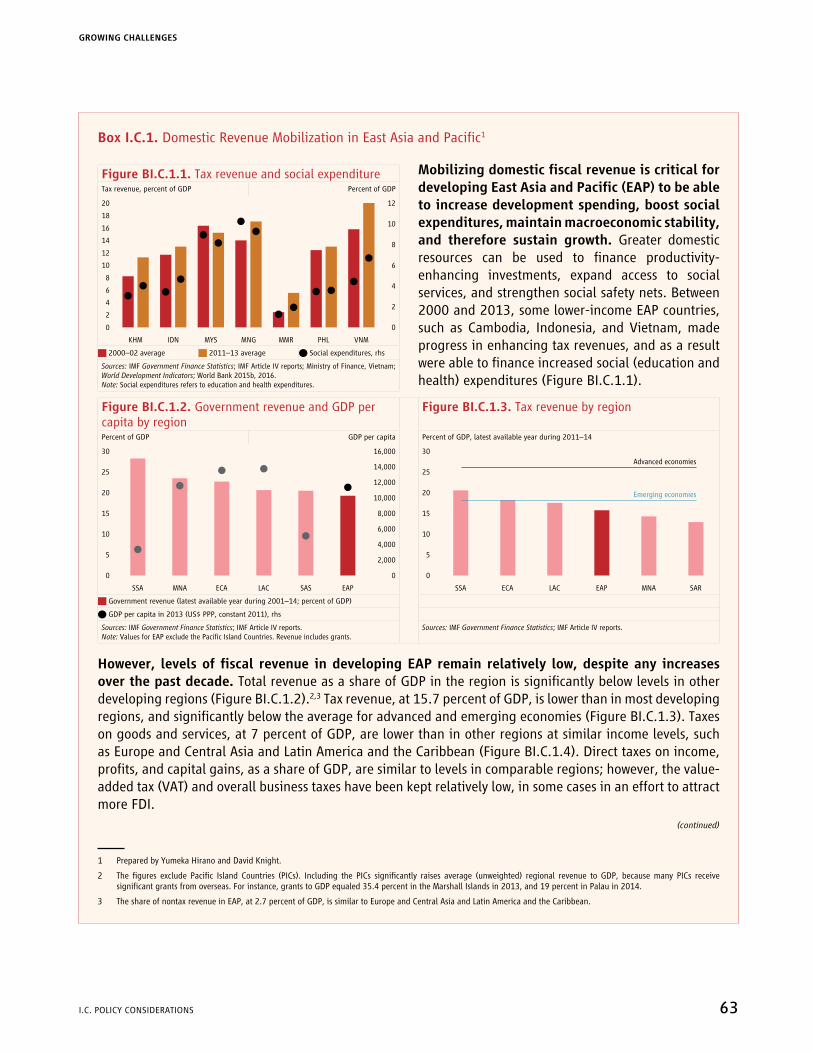
Box I.C.1. Domestic Revenue Mobilization in East Asia and Pacific1
Figure BI.C.1.1. Tax revenue and social expenditureTax revenue, percent of GDP Percent of GDP
20
18
16
14
12
10
8
6
4
2
0
12
10
8
6
4
0
2
KHM IDN MYS PHL VNMMMRMNG
J 2000–02 average J 2011–13 average Q Social expenditures, rhs
Sources: IMF Government Finance Statistics; IMF Article IV reports; Ministry of Finance, Vietnam; World Development Indicators; World Bank 2015b, 2016.Note: Social expenditures refers to education and health expenditures.
1 Prepared by Yumeka Hirano and David Knight.
2 The figures exclude Pacific Island Countries (PICs). Including the PICs significantly raises average (unweighted) regional revenue to GDP, because many PICs receive significant grants from overseas. For instance, grants to GDP equaled 35.4 percent in the Marshall Islands in 2013, and 19 percent in Palau in 2014.
3 The share of nontax revenue in EAP, at 2.7 percent of GDP, is similar to Europe and Central Asia and Latin America and the Caribbean.
(continued)
MobilizingdomesticfiscalrevenueiscriticalfordevelopingEastAsiaandPacific(EAP)tobeableto increase development spending, boost social expenditures, maintain macroeconomic stability, and therefore sustain growth. Greater domestic resources can be used to finance productivity-enhancing investments, expand access to social services, and strengthen social safety nets. Between 2000 and 2013, some lower-income EAP countries, such as Cambodia, Indonesia, and Vietnam, made progress in enhancing tax revenues, and as a result were able to finance increased social (education and health) expenditures (Figure BI.C.1.1).
Figure BI.C.1.2. Government revenue and GDP per capita by region
Figure BI.C.1.3. Tax revenue by region
Percent of GDP GDP per capita Percent of GDP, latest available year during 2011–14
30
25
20
15
10
0
5
16,000
14,000
12,000
10,000
8,000
6,000
4,000
2,000
0
SSA MNA ECA LAC SAS EAP
30
25
20
15
10
0
5
SSA MNAECA LAC SAREAP
Advanced economies
Emerging economies
J Government revenue (latest available year during 2001–14; percent of GDP)
Q GDP per capita in 2013 (US$ PPP, constant 2011), rhs
Sources: IMF Government Finance Statistics; IMF Article IV reports.Note: Values for EAP exclude the Pacific Island Countries. Revenue includes grants.
Sources: IMF Government Finance Statistics; IMF Article IV reports.
However, levelsoffiscalrevenueindevelopingEAPremainrelatively low,despiteanyincreasesover the past decade. Total revenue as a share of GDP in the region is significantly below levels in other developing regions (Figure BI.C.1.2).2,3 Tax revenue, at 15.7 percent of GDP, is lower than in most developing regions, and significantly below the average for advanced and emerging economies (Figure BI.C.1.3). Taxes on goods and services, at 7 percent of GDP, are lower than in other regions at similar income levels, such as Europe and Central Asia and Latin America and the Caribbean (Figure BI.C.1.4). Direct taxes on income, profits, and capital gains, as a share of GDP, are similar to levels in comparable regions; however, the value-added tax (VAT) and overall business taxes have been kept relatively low, in some cases in an effort to attract more FDI.
GROWING CHALLENGES
I.C. PoLICY CoNSIDERATIoNS 63
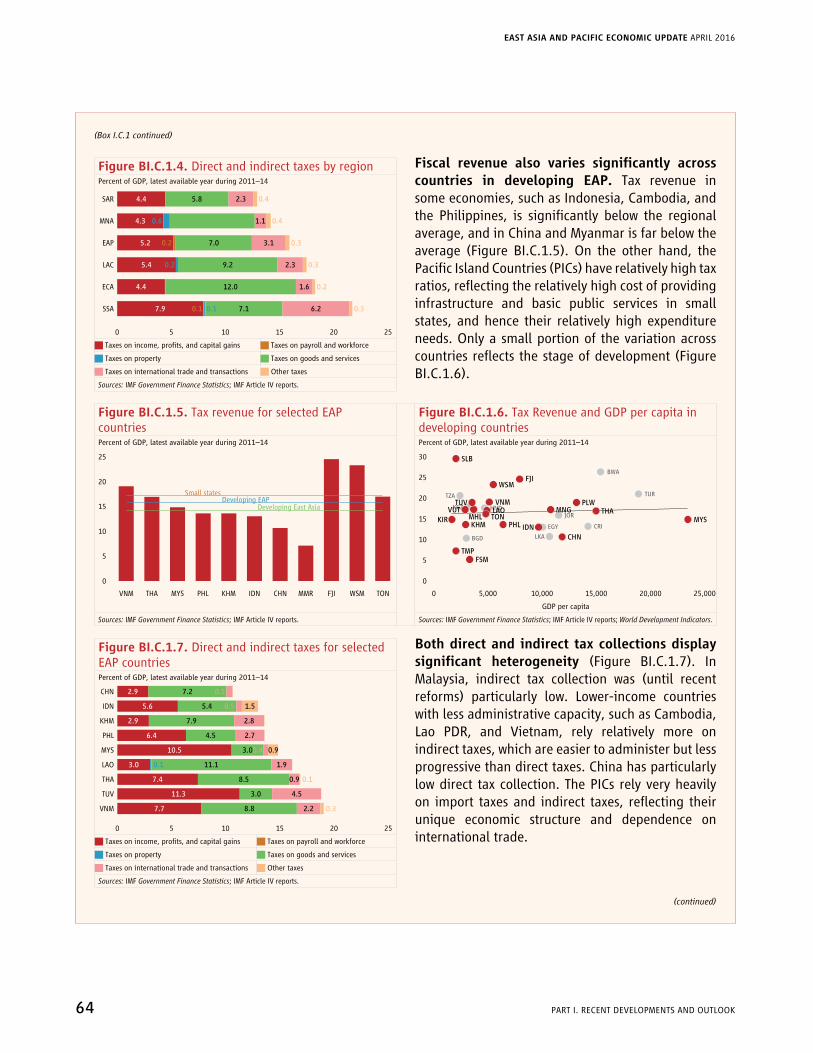
Figure BI.C.1.4. Direct and indirect taxes by regionPercent of GDP, latest available year during 2011–14
LAC
0 105 15 20 25
SAR
SSA
MNA
4.4
ECA
EAP
4.3
5.2
5.4
4.4
7.9
0.4
0.4
0.3
0.3
0.2
0.3
5.8
0.6
7.0
9.2
12.0
7.1
2.3
1.1
3.1
2.3
1.6
6.20.10.1
0.2
0.2
J Taxes on income, profits, and capital gains J Taxes on payroll and workforce
J Taxes on property J Taxes on goods and services
J Taxes on international trade and transactions J Other taxes
Sources: IMF Government Finance Statistics; IMF Article IV reports.
(Box I.C.1 continued)
(continued)
Figure BI.C.1.7. Direct and indirect taxes for selected EAP countriesPercent of GDP, latest available year during 2011–14
0 105 15 20 25
CHN 2.9
IDN
KHM
PHL
MYS
LAO
THA
TUV
VNM
5.6
2.9
6.4
10.5
3.0
7.4
11.3
7.7
7.2
5.4
7.9
4.5
3.0
11.10.1
8.5
3.0
8.8
0.5
0.5
2.8
2.7
0.4
1.9
0.9
4.5
2.2
1.5
0.9
0.1
0.3
J Taxes on income, profits, and capital gains J Taxes on payroll and workforce
J Taxes on property J Taxes on goods and services
J Taxes on international trade and transactions J Other taxes
Sources: IMF Government Finance Statistics; IMF Article IV reports.
Fiscal revenue also varies significantly acrosscountries in developing EAP. Tax revenue in some economies, such as Indonesia, Cambodia, and the Philippines, is significantly below the regional average, and in China and Myanmar is far below the average (Figure BI.C.1.5). On the other hand, the Pacific Island Countries (PICs) have relatively high tax ratios, reflecting the relatively high cost of providing infrastructure and basic public services in small states, and hence their relatively high expenditure needs. Only a small portion of the variation across countries reflects the stage of development (Figure BI.C.1.6).
Figure BI.C.1.5. Tax revenue for selected EAP countries
Figure BI.C.1.6. Tax Revenue and GDP per capita in developing countries
Percent of GDP, latest available year during 2011–14 Percent of GDP, latest available year during 2011–14
25
20
15
10
5
0
VNM THA MYS PHL KHM CHNIDN FJIMMR TONWSM
Small statesDeveloping EAP
Developing East Asia KGZ
TZA
BGD
HND
30
25
20
15
10
0
5
0 10,0005,000 15,000 20,000 25,000
SLB
FSM
PHL
MNG
PLW
THA
MYS
CHN
IDN
TON
VNM
TMP
WSMFJI
KHMKIR
VUT
TUV
LAOMHL
BWA
TUR
CRI
JOR
EGY
LKA
GDP per capita
Sources: IMF Government Finance Statistics; IMF Article IV reports. Sources: IMF Government Finance Statistics; IMF Article IV reports; World Development Indicators.
Both direct and indirect tax collections display significant heterogeneity (Figure BI.C.1.7). In Malaysia, indirect tax collection was (until recent reforms) particularly low. Lower-income countries with less administrative capacity, such as Cambodia, Lao PDR, and Vietnam, rely relatively more on indirect taxes, which are easier to administer but less progressive than direct taxes. China has particularly low direct tax collection. The PICs rely very heavily on import taxes and indirect taxes, reflecting their unique economic structure and dependence on international trade.
EAST ASIA AND PACIFIC ECONOMIC UPDATE APRIL 2016
64 PART I. RECENT DEVELoPMENTS AND oUTLooK

In commodity exporters, weak prospects for commodity prices and hence for commodity-related revenues reinforce the importance of boosting nonresource revenues. In Malaysia and Mongolia, during the 2000–08 commodity boom, rising resource-related revenues, including nontax revenues, supported an increase in total revenues (Figure BI.C.1.8), even though nonresource revenues declined. However, after the global financial crisis and the commodity price peak in 2011, resource-related revenues have been on a downward trend. In Indonesia and Malaysia, commodity price declines have sharply reduced actual and planned revenues.4
Figure BI.C.1.8. Resource revenue and nonresource revenuePercent of GDP
Indonesia Lao PDR Mongolia20
15
10
5
0
1995 1997 1999 20132001 2003 2005 2007 20112009
20
15
10
5
0
1995 1997 1999 20132001 2003 2005 2007 20112009
35
30
25
20
15
10
5
0
2002 2004 2006 2008 2010 2012
Malaysia Vietnam Timor-Leste25
20
15
10
5
0
1995 1997 1999 20132001 2003 2005 2007 20112009
30
25
20
15
10
5
0
1998 2000 2002 20122004 2006 2008 2010
80
60
40
20
0
2001 2003 2005 2007 2009 2011
J Nonresource revenue J Resource revenue
Sources: IMF Article IV reports; International Centre for Tax and Development Government Revenue Dataset.Note: Revenue excludes grants, and includes social contributions.
Boosting and stabilizing revenues will require policy efforts to enhance nonresource revenue, broaden the tax base, and make tax regimes more equitable and harmonized. Some efforts are being made to reduce reliance on resource-related revenues, which tend to be more volatile. For instance, Malaysia introduced a goods and services tax in April 2015, which has enabled the country to expand nonresource
4 In Indonesia, during 2008–13, total revenue declined from 18.1 to 15 percent of GDP, as resource revenues fell from 5.3 to 3.1 percent of GDP. Malaysia in 2016 expects a revenue shortfall of US$9.6 billion, or 18 percent of the previous target, owing to the sharp drop in hydrocarbon-related revenue. Vietnam, a gross oil exporter, has also seen a fall in revenues.
(Box I.C.1 continued)
(continued)
GROWING CHALLENGES
I.C. PoLICY CoNSIDERATIoNS 65

revenue and maintain total revenue at around 21 percent of GDP. In Lao PDR, growth in the VAT and excises has offset weaker mining revenues. Several countries have raised fuel taxes.5
Domestic revenue could be further enhanced by making tax systems more equitable, and harmonizing incentives for investment across the region. In many cases the personal income tax could be adjusted to increase revenues and make the system more progressive. Within developing EAP, top marginal personal income tax rates range from 20 percent in Cambodia and Myanmar to 42 percent in Papua New Guinea and 45 percent in China (Table BI.C.1.1). Eliminating privileged corporate income tax regimes could also yield benefits. Tax incentives for investment promotion, such as tax holidays and reduced tax rates, have been widely used in developing EAP. This has encouraged harmful cross-country competition, leading to significant costs in forgone tax revenue (James and Stern 2015).6 Efforts to harmonize tax regimes and incentives for investment across the region could therefore be beneficial.
Table BI.C.1.1. Tax RatesTop Marginal
Personal Income Tax Rates
Corporate Income Tax Rates
Indirect Tax Rates Employer Social Security Tax Rates
Employee Social Security Tax Rates
Cambodia 20* 20 10 0.8China 45 25 3–17** 35 10.5Indonesia 30 25 10 5.74 2Lao PDR 24 24 10 6 5.5Malaysia 25 25 6 12 11Myanmar 20 25/35*** (no standard rate) 2.5 1.5Philippines 32 30 12 7.37 3.63Singapore 20 17 7 17 20Thailand 35 20 7 5 4Vietnam 35 22 10 18 8Papua New Guinea 42 30 10 (no social security
tax****)
Fiji 29 20 15 8 8Sources: National authorities; KPMG; PWC.Note: *There is no personal income tax. However, tax is levied on salaries, through a payroll deduction, with a top marginal tax rate of 20 percent. **The general VAT rate for transportation and postal services is 11 percent, for leasing 17 percent, and for other “modern” services, such as information technology and research and development, 6 percent. Small-scale VAT taxpayers are subject to a 3 percent VAT levy rate. ***Enterprises established under the Myanmar Companies Act, entities established under the Myanmar Foreign Investment Law (MFIL), and registered Myanmar branches of a foreign entity that enjoy incentives under the MFIL are subject to a 25 percent income tax. Registered Myanmar branches of foreign entities that do not enjoy incentives under the MFIL, and other nonresident entities, are subject to a 35 percent income tax. ****There is no social security tax in Papua New Guinea. However, all employers with 15 or more employees (either citizens or expatriates) are required to register with an Authorized Superannuation Fund in Papua New Guinea. Contributions equal 6 percent of the gross base salary for the employee and 8.4 percent for the employer.
5 China increased consumption taxes on oil products, Mongolia increased customs duties on petrol and diesel imports, and Vietnam increased environmental taxes on fuel in May 2015.
6 For instance, the Philippine Bureau of Internal Revenue estimated that the forgone revenue reached US$3.4 billion in 2012, equivalent to 1.5 percent of GDP and 10.2 percent of total revenue.
(Box I.C.1 continued)
EAST ASIA AND PACIFIC ECONOMIC UPDATE APRIL 2016
66 PART I. RECENT DEVELoPMENTS AND oUTLooK

Expenditurereformsshould improvetheefficiencyandtransparencyofpublicspending,andfocusonimproving labor productivity, basic service delivery, and poverty reduction programs. Investments in infrastructure and human capital provide long-term dividends in the form of capital deepening and improved productivity. In Vietnam, state-owned enterprise reforms, including measures to enhance transparency and governance, could reduce drains on fiscal resources. In Thailand, improving the public investment management system to implement large infrastructure projects in a competitive and transparent manner could crowd in private investment. Cambodia and Lao PDR would be well advised to limit growth in public consumption, and strengthen local government finances.
Countries need to maintain momentum on reforming energy pricing policies, by further cutting untargeted fuel price subsidies and increasing energy taxes. At the end of 2014, Indonesia and Malaysia announced their decisions to eliminate gasoline subsidies, and reduce (Indonesia) or eliminate (Malaysia) diesel subsidies. Owing to these reforms, fuel subsidy costs in Indonesia fell from 2.3 percent of GDP in 2014 to 0.5 percent of GDP in 2015. Several countries have recently increased fuel taxes, including China, Mongolia, Tonga, and Vietnam, and others could benefit from taking similar steps, which have positive implications for both revenue and the environment, and create space for increased development spending and well-targeted social assistance.
In EAP commodity exporters, weak revenue performance has emerged as a major policy challenge, given the likelihood of “lower for longer” commodity prices. Countries where public revenues depend significantly on natural resources should recognize that commodity prices, while uncertain, may remain low for a protracted period. Moreover, there is a risk that prices may fall even lower, for instance, if global demand falls further, if world supply proves less responsive than anticipated to the price decline seen to date, or if any one of a number of potential sources of new capacity comes online. This reinforces the need to expand tax and nontax revenues, and improve the efficiency of public spending. In Indonesia, given weak projections of revenue growth, there is limited room to expand expenditure while keeping the general government deficit within the fiscal rule of 3 percent of GDP. As such, the government should focus on implementing planned reforms to increase tax collection by expanding the income tax and value-added-tax base, and by simplifying the tax system to reduce distortions and costs of compliance. Malaysia has made some progress in diversifying its revenue mix, but still needs to improve the efficiency of public spending on social expenditures (for instance, by controlling emoluments). Mongolia and Papua New Guinea, which are adjusting to a far less favorable external environment, need to further strengthen public financial management to improve the efficiency of spending and service delivery, and to secure public finances over the medium term.
Exchangerateflexibilitywillgenerallyhelpbuffershocks,butbalancesheetrisksneed to be contained, while maintaining incentives to reduce external leverage
For commodity exporters, such as Indonesia and Malaysia, lower real trade-weighted exchange rates can play an important part in adjusting to weaker terms of trade. The depreciations of the Indonesian rupiah and Malaysian ringgit against the US dollar have reduced the drop in exporter revenues, corporate profits, and household incomes in local currency terms. This shock-absorbing effect is enhanced by the fact that a relatively high proportion of these countries’ exports are commodities that have a global US-dollar-denominated price. In
GROWING CHALLENGES
I.C. PoLICY CoNSIDERATIoNS 67

Malaysia, ringgit depreciation (in trade-weighted and US dollar terms) has also helped spur offsetting increases in manufacturing exports such as electrical and electronic products. Papua New Guinea, however, continues to experience foreign currency shortages and would likely benefit from greater downward flexibility in its exchange rate, coupled with a credible alternative monetary anchor.
In countries where the exchange rate is used as a nominal anchor, authorities should in general aim to stabilize exchange rates in real effective terms, rather than focusing on the nominal bilateral US dollar exchange rate. Given broad-based US dollar strength, this would reduce the risk of real effective exchange rate overvaluation and a decline in trade competitiveness. In Lao PDR, tight management of the exchange rate against the US dollar has led to appreciation against most regional currencies, while reserve coverage remains low by most metrics. In Mongolia, the currency has only gradually depreciated against the US dollar since early January, after being broadly unchanged over the last four months of 2015. In Myanmar, the central bank adjusted the exchange rate against the US dollar down by around 20 percent between May and November 2015, which has been supportive of external competitiveness but has also led to significant inflationary pressures.
However, elevated and/or rising debt levels and the associated rollover requirements exacerbate the risks associated with currency depreciations. In countries where a relatively high proportion of government debt is denominated in foreign currency (Indonesia, Malaysia) or where total external debt levels are high (Mongolia, Lao PDR, Malaysia), such risks need to be carefully monitored, and in some cases may merit intervention to smooth large fluctuations, assuming that reserve buffers can be maintained at adequate levels. More generally, authorities should ensure that there are clear incentives to hedge and reduce excessive external leverage, and avoid the damage to balance sheets that can be caused by large exchange rate movements.
Monetary policy should remain accommodative, but scope for further easing is increasingly constrained by the need to reduce leverage and maintain financialstability
The current accommodative stance of monetary policy in most major EAP economies remains appropriate. Inflation pressures remain contained and the balance of inflation risks is tilted to the downside, given sluggish domestic demand, falling commodity prices, and producer price deflation in many countries. Also, the persistence of low inflation and low inflationary expectations suggests that real policy rates are only moderately expansionary at current levels.
However, scope for further monetary easing is in many cases constrained by the need to safeguard financialandexchangeratestability.In several EAP economies, as discussed, corporate and household debt levels are already elevated relative to historical averages, and the priority should be to minimize vulnerability to any unexpected tightening of global financing conditions. This may require central banks to give greater weight to financial stability considerations when considering monetary stimulus, even if inflation expectations are well anchored.
EAST ASIA AND PACIFIC ECONOMIC UPDATE APRIL 2016
68 PART I. RECENT DEVELoPMENTS AND oUTLooK

Interest rates may need to increase to reduce currency depreciation pressures, should the risks to external financingmaterialize.Such risks, stemming from the normalization of US interest rates or increased uncertainty around global divergences in monetary conditions, are a particular concern in countries where there is significant foreign portfolio investment in domestic interest-bearing assets, such as Indonesia and Malaysia.
Structural reforms to boost potential output are even more critical, given the risks to the growth outlook and the limited room for expansionary macroeconomic policies
The current global and regional economic uncertainties, combined with the constraints on macroeconomic policy, highlight the importance of deepening structural reforms. The recent disappointing performance of developing countries in other regions highlights the potential consequences of failing to take appropriate policy action. Reforms aimed at boosting long-term productivity can also help in the short term, by enhancing investor confidence and therefore reducing financing constraints and vulnerability, and increasing the effectiveness of any policy response to shocks.
Much of the region has been broadly successful in its overall economic management, and action has already been taken on some key reforms. Prudent economic management has played a significant role in the resilience of the region’s economies despite the difficult global context. In most countries, fiscal deficits and debt levels appear sustainable, inflationary pressures are weak, and current account deficits are contained. Also, measures have been taken to reduce the costs and distortions associated with energy subsidies, especially in Indonesia and Malaysia.
Nevertheless, the uncertainties in the global environment call for more ambition if the pace of growth and poverty reduction is to be maintained. In particular, there is significant scope for concerted action on structural factors that are inhibiting necessary rebalancing and factor reallocation, and constraining growth in productivity and participation. This edition of the East Asia and Pacific Economic Update highlights three general areas of reform that are relevant to all countries in the region.
First, several countries are hampered by weaknesses in governance; action is required to enhance transparency,strengthenaccountability,andmoregenerallyredefinetheroleofthestate.As countries in the region continue to develop, and in particular as they transition into the upper reaches of middle-income status, the need for changes in the governance model is growing (part II.A, “Governance for Sustained Growth in East Asia and Pacific: Priorities and Indicators”). East Asian countries perform relatively well in terms of state capacity, which is particularly important in generating economic take-offs and sustaining the early stages of development. However, to sustain the rise of the region’s increasingly complex economies to high-income status, the transparency, accountability, and responsiveness of their governments to the demands of both the private sector and civil society will become increasingly critical. These aspects of governance are particularly important in fostering the development of a private sector focused on long-term innovation, and of modern, complex activities including higher-value-added services, which can provide the basis for sustained growth.
GROWING CHALLENGES
I.C. PoLICY CoNSIDERATIoNS 69

Second, efforts to reduce barriers to trade in the region should be redoubled, with a particular focus on nontariff measures and regulatory barriers, including to trade in services. A renewed focus on trade liberalization, and in particular on a deeper integration than characterized previous trade agreements, could boost economic activity and stimulate job creation. A key recent development was the conclusion of negotiations for the Trans-Pacific Partnership (TPP), whose signatories include Malaysia and Vietnam from developing EAP (part II.B, “Potential Economic Implications of the Trans-Pacific Partnership for the East Asian Economy”). The TPP seeks to further lower tariffs, address issues with nontariff measures, improve regulatory certainty, and open up trade in services. The TPP could also provide renewed impetus for the completion of broader Regional Trade Agreements, potentially incorporating even more ambitious provisions. At a narrower level, in both Indonesia and the Philippines, import restrictions have caused domestic rice prices to rise significantly above international prices (Box I.C.2). These policies have been justified as an attempt to stabilize prices and promote self-sufficiency. However, they imply higher prices, imposing a significant burden on poorer, rice-consuming households.
Box I.C.2. Rice Prices in Indonesia and the Philippines7
In both Indonesia and the Philippines, domestic prices for rice are significantly higher thaninternational prices, and the gap has widened over time. This has significant negative implications for welfare, particularly of poorer households.8 The roots of the problem lie in structural rigidities in agriculture, including limited mechanization, low milling efficiency, and high logistics costs. But these have been exacerbated by policies that restrict trade in a counterproductive attempt to stabilize prices and promote self-sufficiency.
Indonesia
In Indonesia, in recent years, the retail prices of domestic rice have risen, even though world prices have declined. From the 1970s through the 1990s, the government succeeded in stabilizing domestic rice prices, which tracked the long-term global trend and were less volatile (Figure BI.C.2.1). But more recently both farm prices and wholesale prices have been higher in Indonesia than in neighbors such as Thailand (Figure BI.C.2.2). High domestic rice prices hurt the 53 million households that are net rice consumers—even though they benefit wholesale traders and the 8.4 million households that are net rice producers.9
Thegrowingdivergencebetweendomesticandworldricepricesreflectsconstraintsondomesticsupply, combined with import restrictions. Domestic rice demand continues to outpace supply. Total rice consumption is growing rapidly, reflecting the increase in population and in the consumption of derived rice products, even though direct rice consumption per capita has been declining. At the same time, since 1990,
7 Prepared by Hans Anand Beck, Elitza Mileva, and Maria Monica Wihardja (Indonesia), and Karl Kendrick Tiu Chua and Louie Limkin (the Philippines), with inputs from Frauke Jungbluth, Rogier J. E. Van Den Brink, and Sergiy Zorya.
8 Including because high rice prices crowd out purchases by the poor of fruit, vegetables, and other high-nutrient foods, resulting in micronutrient deficiencies.
9 Calculations based on the 2013 National Social Economic Survey. This does not collect data on rice production (except in 2004); rice production is therefore proxied by adding rice consumed from own production and rice sold as the main income of households.
(continued)
EAST ASIA AND PACIFIC ECONOMIC UPDATE APRIL 2016
70 PART I. RECENT DEVELoPMENTS AND oUTLooK
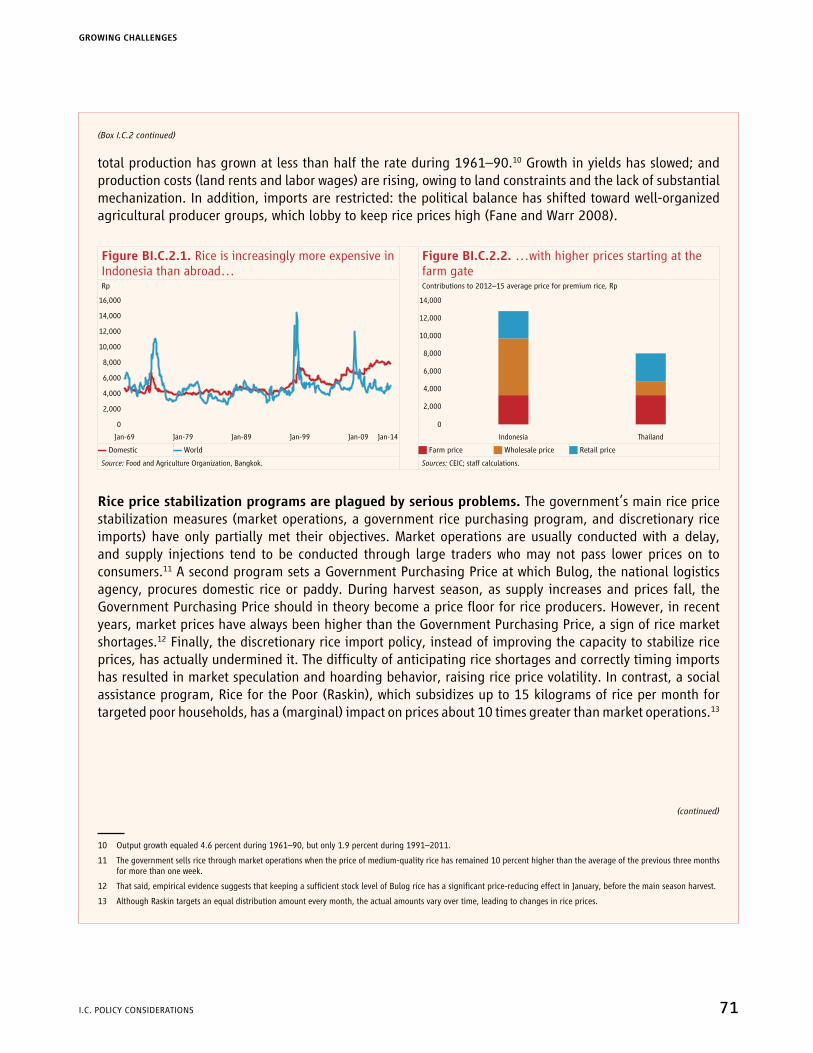
total production has grown at less than half the rate during 1961–90.10 Growth in yields has slowed; and production costs (land rents and labor wages) are rising, owing to land constraints and the lack of substantial mechanization. In addition, imports are restricted: the political balance has shifted toward well-organized agricultural producer groups, which lobby to keep rice prices high (Fane and Warr 2008).
Figure BI.C.2.1. Rice is increasingly more expensive in Indonesia than abroad…
Figure BI.C.2.2. …with higher prices starting at the farm gate
Rp Contributions to 2012–15 average price for premium rice, Rp
Jan-69
16,000
14,000
12,000
10,000
8,000
6,000
4,000
2,000
0
Jan-79 Jan-89 Jan-99 Jan-09 Jan-14
14,000
12,000
10,000
8,000
6,000
4,000
2,000
0
Indonesia Thailand
▬ Domestic ▬ World J Farm price J Wholesale price J Retail price
Source: Food and Agriculture Organization, Bangkok. Sources: CEIC; staff calculations.
Rice price stabilization programs are plagued by serious problems. The government’s main rice price stabilization measures (market operations, a government rice purchasing program, and discretionary rice imports) have only partially met their objectives. Market operations are usually conducted with a delay, and supply injections tend to be conducted through large traders who may not pass lower prices on to consumers.11 A second program sets a Government Purchasing Price at which Bulog, the national logistics agency, procures domestic rice or paddy. During harvest season, as supply increases and prices fall, the Government Purchasing Price should in theory become a price floor for rice producers. However, in recent years, market prices have always been higher than the Government Purchasing Price, a sign of rice market shortages.12 Finally, the discretionary rice import policy, instead of improving the capacity to stabilize rice prices, has actually undermined it. The difficulty of anticipating rice shortages and correctly timing imports has resulted in market speculation and hoarding behavior, raising rice price volatility. In contrast, a social assistance program, Rice for the Poor (Raskin), which subsidizes up to 15 kilograms of rice per month for targeted poor households, has a (marginal) impact on prices about 10 times greater than market operations.13
10 Output growth equaled 4.6 percent during 1961–90, but only 1.9 percent during 1991–2011.
11 The government sells rice through market operations when the price of medium-quality rice has remained 10 percent higher than the average of the previous three months for more than one week.
12 That said, empirical evidence suggests that keeping a sufficient stock level of Bulog rice has a significant price-reducing effect in January, before the main season harvest.
13 Although Raskin targets an equal distribution amount every month, the actual amounts vary over time, leading to changes in rice prices.
(Box I.C.2 continued)
(continued)
GROWING CHALLENGES
I.C. PoLICY CoNSIDERATIoNS 71

The Philippines
Rice prices for consumers in the Philippines are high, putting pressure on real wages. Filipino consumers pay more than twice as much as their Asian neighbors for comparable types of rice (Figure BI.C.2.3), but Filipino farmers do not receive markedly higher prices for their rice than their peers in other countries. Within the country, rice prices vary significantly (by more than 20 percent) (Figure BI.C.2.4). Even rice-producing provinces have higher consumer prices than Manila. This contributes to a number of negative outcomes: real incomes are depressed, poverty is stubbornly high,14 poverty among farmers is even higher, and malnutrition is prevalent.15 This also contributes to minimum wages that are among the highest in the region, putting manufacturing at a competitive disadvantage.
Figure BI.C.2.3. Filipinos pay more than twice as much as their Asian neighbors for rice
Figure BI.C.2.4. Rice prices vary significantly across the country, and are higher in some rice-producing provinces than in Manila
Wholesale regular milled rice prices in the Philippines, Thailand, and Vietnam, Philippine pesos/kilogram
Rice price, Philippine pesos/kilogram
40
35
30
25
20
15
10
5
0
Jan-02
Feb-03
Mar-04
Apr-05
May-06
Jun-07Jul-0
8
Aug-09Sep-10
Oct-11
Nov-12
Dec-13
Jan-15
60
55
50
45
40
30
35
Jun-15 Jul-15 Aug-15 Sep-15 Oct-15 Nov-15 Dec-15 Jan-16 Feb-16
▬ PHL ▬ VNM ▬ THA ▬ Manila ▬ Benguet ▬ Negros Occidental ▬ Davao del Sur
▬ Bulacan ▬ Pampanga ▬ Cavite ▬ Laguna
▬ Quezon ▬ Misamis Oriental ▬ Cebu
Source: Food and Agriculture Organization. Source: PREMISE data.Note: Rice prices are for a midrange variety locally called “Sinandomeng.”
Underlying these high rice prices, the agricultural policy framework has for decades had a strong focuson rice self-sufficiency.Since the 1960s, agricultural budget allocations were tilted toward rice production. Historically, about 65 percent of the total budget of the Department of Agriculture and related government-owned and/or controlled corporations was earmarked for rice production. Expenditures included lowland irrigation, subsidies to inputs such as seeds and fertilizers, and other support such as farm machinery and postharvest equipment. Often, investments were provided at low quality and with few support mechanisms. However, decades of substantial budget outlays, even when supported by quantitative restrictions on rice imports (with high in-quota tariffs) and government control over rice trade by the National Food Authority (NFA), did not advance the goal of rice self-sufficiency. Instead, rice supply has been
14 The poor spend around 60 percent of their total expenditure on food, of which around a third is spent on rice.
15 one-third of all children under age five are stunted (2015 National Nutrition Survey). For more than a decade, even as incomes have risen, the prevalence of stunting has not declined.
(Box I.C.2 continued)
(continued)
EAST ASIA AND PACIFIC ECONOMIC UPDATE APRIL 2016
72 PART I. RECENT DEVELoPMENTS AND oUTLooK

inadequate and kept domestic rice prices artificially high relative to world prices. Moreover, the mistiming of government-controlled imports, given inelastic demand, caused several price hikes.16 Finally, the NFA’s policy of protecting farmers by buying paddy rice at higher prices remains poorly targeted and does not benefit most farmers, not least because NFA’s paddy rice procurement amounts to less than 1 percent of 2014 production.
High and increasing logistics and marketing costs further contribute to higher rice prices. The supply chain for agriculture is characterized by high milling, drying, storage, and transportation costs (Figure BI.C.2.5). These costs reflect insufficient investments in roads and postharvest facilities (even though these have increased in recent years), policy distortions, and lack of competition. Specifically, uncertainty over the timing and levels of imports and domestic sales by the NFA, high energy costs, and the high cost of capital17 result in underinvestment in milling, drying, and storage.18 Key drivers of high transportation costs include the low quality and limited availability of roads, especially farm-to-market roads connecting smallholder farms to urban markets, and lack of competition in the local shipping and trucking industries. All this taken together results in a price markup (the difference between farm gate and retail prices) that is very high, and has in fact increased from 88 percent in 1990 to an average of 104 percent from 1991 to 2015 (Figure BI.C.2.6).
Figure BI.C.2.5. Marketing costs for rice are almost twice as high in the Philippines as in Thailand
Figure BI.C.2.6. Retail prices for rice in the Philippines are twice as high as farm-gate prices, and the gap has increased over time
Philippine pesos/kilogram of dry palay Phillipine pesos/kilogram
Philippines Thailand
1.8
1.6
1.4
1.2
1.0
0.8
0.6
0.4
0.2
0
45
40
35
30
25
20
15
10
5
0
Jan-02Jul-0
3Jan-05
Jul-06
Jan-08Jul-0
9Jan-11
Jul-12
Jan-14Jul-1
5
J Milling J Storage J Drying J Transport ▬ Farmgate price ▬ Retail price
Source: International Rice Research Institute 2004. Sources: FAO; Philippine Statistics Authority.
16 For instance, in 2014, domestic rice prices increased owing to importation lags, even as world rice prices fell.
17 A high cost of capital raises the effective cost of trucks, buildings, sacks, and milling equipment.
18 Underinvestment in rice milling resulted in an estimated 15 percent reduction in domestic supply (Keefer and Zoratto 2012). Only 5 percent of rice millers use large and efficient milling machines, which process 10 tons per hour and break only 32 percent of the grains. Storage costs in the Philippines are high because of inefficiencies in the management of public storage facilities.
(Box I.C.2 continued)
GROWING CHALLENGES
I.C. PoLICY CoNSIDERATIoNS 73

Third,theregionmustincreaseitsreadinesstobenefitfromthedigitalrevolution,andtodealwiththechallenges it poses, particularly through a focus on developing the essential “analog complements” to digital technologies. Developing EAP as a whole is already doing better than other regions in reaping dividends from its investments in digital technologies—the internet, smartphones, and all the other tools which collect, store, analyze, and share information digitally (part II.C, “Reaping Digital Dividends in the East Asia Pacific Region”). However, maximizing the benefits from the digital revolution, and ensuring that it promotes inclusive growth rather than long-term disruption, requires measures to strengthen key complementary factors. First, developing a procompetition regulatory regime where firms can leverage the internet to compete and innovate for the benefit of consumers. Second, adapting workers’ skills to the demands of the new economy. Third, and as already emphasized, ensuring that institutions are accountable, so that governments have an incentive to use digital technologies effectively to empower citizens and deliver services.
In China, a range of structural reforms will be required to support sustainable growth in income and employment over the longer term. Activity has recently been supported by falling oil prices and monetary and fiscal stimulus, which cannot be expected to persist in the long run. The overarching aim of policy should be to facilitate a reallocation of factors of production, including capital, away from sectors with excess capacity and toward sectors and firms that are more productive and have greater growth potential. Allowing a more market-based allocation of credit, would assist in this regard.
Reformof China’s state-owned enterprises (SOEs) and of its household registration system constituteimportant priorities. Sectors dominated by SoEs will need to be gradually opened up to competition, with privileges traditionally accorded to such firms eliminated to ensure a level playing field, and inefficient SoEs allowed to exit. Continued reform of the household registration system (“hukou”) will facilitate permanent migration from the countryside to the cities, helping to provide better job opportunities, boost structural transformation, and reduce rural-urban inequality (World Bank, and Development Research Center of the State Council, the People’s Republic of China, 2014). As the rebalancing from industry toward services progresses, it is important to manage the trade-off between enhancing market discipline and avoiding disruptions to the labor market (Box I.A.2). Efforts to increase environmental sustainability, for instance through more efficient pricing of environmental goods, will yield health benefits for current and future generations.
Incommodityexporters,measurestopromoteeconomicflexibility,byremovingbarrierstothedevelopmentofnewsectorsand theentryofnewfirms,will increase robustness to commoditypricedownturns. In Indonesia, the government has announced ten economic policy packages in recent months, covering regulatory simplification, tax incentives, the easing of some restrictions on foreign ownership, and other structural reforms. The effective implementation of these reforms will be critical to improving the business environment. In the smaller and less diversified commodity exporters, the priority is to remove barriers to the development of new sectors and the entry of new firms. This can be achieved through increased competition, prudent regulation, improved public infrastructure, and boosting the state’s capacity to enhance education and health outcomes (Box I.A.5). In addition, the operation of institutions designed to manage commodity price volatility, such as sovereign wealth funds, needs to be strengthened.
EAST ASIA AND PACIFIC ECONOMIC UPDATE APRIL 2016
74 PART I. RECENT DEVELoPMENTS AND oUTLooK

ThePacificIslandCountriesmusttakeadvantageofavailablegrowthopportunitiesandensurelonger-termfiscalsustainability
Thelonger-termoutlookforthePacificIslandCountries(PICs)isheavilydependentontheextenttowhichthe PICs can overcome geographic constraints and take advantage of the more narrow set of opportunities that is available to them (Box I.C.3). A strategy of manufacturing-based, export-led growth is not well suited to the PICs, as it has been for other countries in developing EAP. However, the PICs do have the potential to make better use of their natural endowments, in particular through fishing and tourism, which can generate high returns even when the costs of production and trade are relatively high. Greater labor mobility can help increase the productivity of PIC nationals by providing them with access to opportunities in overseas markets.
Box I.C.3. Boosting Growth and Shared Prosperity in the Small Pacific Island Countries19
ThesmallPacificIslandCountries(PICs)faceanumberofuniqueconstraintsposedbytheirsizeandgeography that differentiate them from other small states. Smallness, remoteness, and the dispersion of populations across large numbers of islands make it difficult to achieve economies of scale, and raise the costs of trade (Figure BI.C.3.1). Natural disasters also act as a significant constraint to capital accumulation in the Pacific. These factors, which lower the return to market activities and narrow the feasible set of economic opportunities, have been reflected in relatively low growth rates. over the past 10 years per capita income levels in the PICs have grown only marginally (Figure BI.C.3.2).
Figure BI.C.3.1. Size and remoteness of the small PICs Figure BI.C.3.2. GDP growth in the decade to 2014Average distance from market, km Annual average growth rates, constant prices in local currencies, percent
16,000
14,000
12,000
10,000
8,000
6,000
4,000
60,000 440,000 3.3m 24m 180m 1.3bn
TUV
MHLPLW
TONVUT
WSM
KIRFSM
10
8
6
4
2
-2
0
DevelopingEAP
Middle-income
countries
Smallstates VUT WSM TUVTON KIRMHL FSMPLW
Population
Q Indian Ocean Q Caribbean Q Other PICs Q Small PICs � All other countries J Real GDP growth J Real GDP per capita growth
Source: World Bank staff estimates.Note: m = millions; bn = billions.
Sources: World Development Indicators; World Bank staff estimates.
Nevertheless, incomes per capita at middle-income levels, reasonably widespread access to land for subsistence agriculture, and informal community-based social safety nets have all helped limit the incidence of extreme poverty in the small PICs. According to internationally-comparable estimates
19 Prepared by Kim Edwards. The small Pacific Island Countries comprise the Federated States of Micronesia, Kiribati, the Republic of Marshall Islands, Palau, Samoa, Tonga, Tuvalu, and Vanuatu.
(continued)
GROWING CHALLENGES
I.C. PoLICY CoNSIDERATIoNS 75
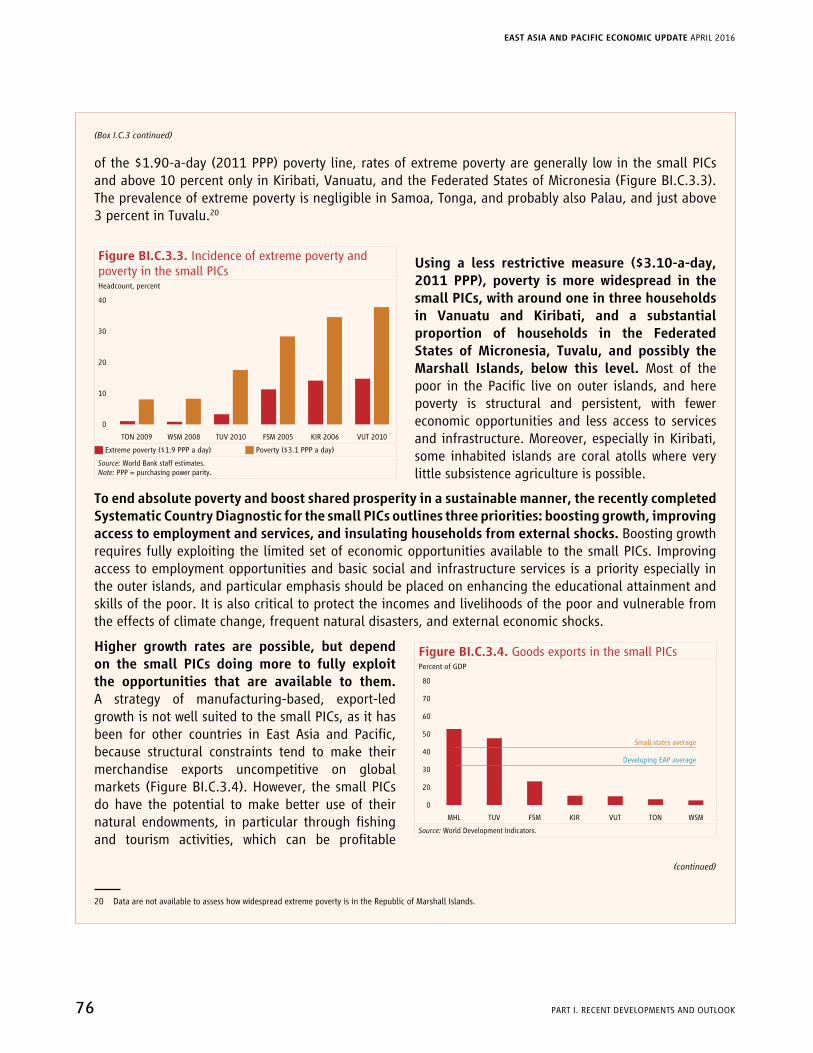
of the $1.90-a-day (2011 PPP) poverty line, rates of extreme poverty are generally low in the small PICs and above 10 percent only in Kiribati, Vanuatu, and the Federated States of Micronesia (Figure BI.C.3.3). The prevalence of extreme poverty is negligible in Samoa, Tonga, and probably also Palau, and just above 3 percent in Tuvalu.20
Figure BI.C.3.3. Incidence of extreme poverty and poverty in the small PICsHeadcount, percent
40
30
20
10
0
TON 2009 WSM 2008 TUV 2010 FSM 2005 KIR 2006 VUT 2010
J Extreme poverty ($1.9 PPP a day) J Poverty ($3.1 PPP a day)
Source: World Bank staff estimates.Note: PPP = purchasing power parity.
20 Data are not available to assess how widespread extreme poverty is in the Republic of Marshall Islands.
To end absolute poverty and boost shared prosperity in a sustainable manner, the recently completed SystematicCountryDiagnosticforthesmallPICsoutlinesthreepriorities:boostinggrowth,improvingaccess to employment and services, and insulating households from external shocks. Boosting growth requires fully exploiting the limited set of economic opportunities available to the small PICs. Improving access to employment opportunities and basic social and infrastructure services is a priority especially in the outer islands, and particular emphasis should be placed on enhancing the educational attainment and skills of the poor. It is also critical to protect the incomes and livelihoods of the poor and vulnerable from the effects of climate change, frequent natural disasters, and external economic shocks.
Higher growth rates are possible, but depend on the small PICs doing more to fully exploit the opportunities that are available to them. A strategy of manufacturing-based, export-led growth is not well suited to the small PICs, as it has been for other countries in East Asia and Pacific, because structural constraints tend to make their merchandise exports uncompetitive on global markets (Figure BI.C.3.4). However, the small PICs do have the potential to make better use of their natural endowments, in particular through fishing and tourism activities, which can be profitable
(Box I.C.3 continued)
Using a less restrictive measure ($3.10-a-day,2011PPP), poverty ismorewidespread in thesmall PICs, with around one in three households in Vanuatu and Kiribati, and a substantial proportion of households in the Federated States of Micronesia, Tuvalu, and possibly the Marshall Islands, below this level. Most of the poor in the Pacific live on outer islands, and here poverty is structural and persistent, with fewer economic opportunities and less access to services and infrastructure. Moreover, especially in Kiribati, some inhabited islands are coral atolls where very little subsistence agriculture is possible.
Figure BI.C.3.4. Goods exports in the small PICsPercent of GDP
Small states average
Developing EAP average
80
70
60
0
50
40
30
20
MHL TUV FSM KIR VUT WSMTON
Source: World Development Indicators.
(continued)
EAST ASIA AND PACIFIC ECONOMIC UPDATE APRIL 2016
76 PART I. RECENT DEVELoPMENTS AND oUTLooK

despite relatively high costs of production and trade. Policy actions to promote labor mobility, in both source and receiving countries, can also help increase the productivity of PIC nationals, by providing access to opportunities in overseas markets.
The World Bank has launched a program of research and dialogue on long-term economic opportunities and challenges, titledPacificPossible.Pacific Possible will highlight transformational activities that PICs could pursue to raise incomes and employment over the next 25 years.21 It will cover a range of themes, selected to be compatible with the more limited set of opportunities available to the PICs. Some of these themes—a selection of which are discussed in more detail below—are:
• Harnessing the riches of the Pacific: opportunities from oceanic fisheries and seabed mining.
• Host to the world: opportunities to expand tourism and other types of visitor arrivals (for example, conference attendees, or retirees for longer-term stays).
• Labor mobility: opportunities from expanding seasonal labor market schemes and liberalizing market access.
• Islands in a sea of knowledge: opportunities from the development of a knowledge economy.
• Managing increasing stress on Pacific livelihoods: opportunities to reduce costs by strengthening PICs’ resilience to threats from natural disasters, climate change, and noncommunicable diseases.
OceanicfisherieshavethepotentialtoprovidegreatereconomicreturnstothePICs, ifregionalarrangements are strengthened and expanded to maximize the value of the catch. The total value of the tuna caught in PIC waters was estimated at over US$3 billion in 2013 (some 35 percent of the world’s total), of which PICs received roughly 7 percent in access fees paid by largely foreign fleets (estimates suggest this figure may have risen to over 13 percent in 2015). These revenues constitute the largest source of public revenue for a number of PICs, including Kiribati, Tuvalu, and the Federated States of Micronesia (Figure BI.C.3.5). If the current purse-seine vessel day scheme were further strengthened, PICs could realize still higher returns on a more sustainable basis.22 Clear catch limits need to be established to ensure sustainability, alongside economic incentives for maintaining these limits and mechanisms to enforce compliance (since some countries have previously exceeded the number of days allotted to them at the expense of the health of the resource). Additionally, cooperation between PNA members (and Tokelau) and Indonesia and the Philippines could place some 90 percent of the Western Pacific fishery under the same regulations and access rules, limiting the scope for overfishing and substitution of vessel days. There is also scope to enhance the flexibility, transparency, and efficiency of allocations, for example by increasing the duration and transferability of access rights, pooling access rights across multiple countries, or selling rights via auction.
21 The countries included in the study are the Federated States of Micronesia, Fiji, Kiribati, the Republic of Marshall Islands, Palau, Papua New Guinea, Samoa, Solomon Islands, Tonga, Tuvalu, and Vanuatu.
22 The current purse-seine vessel day scheme implemented in 2009 by the Parties to the Nauru Agreement (PNA) works similarly to a “cap-and-trade” scheme for fishing. Each year the PNA countries set the total catch limit needed to maintain a healthy fish stock, and translate that catch limit into individual vessel fishing days, which are allocated to and sold by individual countries.
(Box I.C.3 continued)
(continued)
GROWING CHALLENGES
I.C. PoLICY CoNSIDERATIoNS 77

Figure BI.C.3.5. Fisheries license fees Figure BI.C.3.6. Visitor arrivals per capita in tourism-dependent island states
US$, millions Annual visitors per capita
200
160
120
80
40
0
2007 2008 2009 2010 2011 2012 2013 2014
Ando
rra
Turk
s & C
aico
s
Bahr
ain
Arub
a
Palau
Guam
N. Mar
iana
s
Caym
an Is
land
s
Virg
in Is
land
s
Baha
mas
Berm
uda
Maldi
ves
Barb
ados
Seyc
helle
s
Mau
ritiu
s
Sam
oa Fiji
Tong
a
Vanu
atu
Micro
nesia
, Fed
. Sts.
Tuva
lu
Mar
shall I
sland
s
Kirib
ati
25
20
15
10
5
0
J FSM J MHL J TUV J KIR
Source: World Bank staff estimates. Source: World Bank staff estimates.
On the other hand, the potential for deep sea mining in the PICs is still unclear; little is known aboutthecostsoffindingandexploitingdeepseabeddeposits,andthereisuncertaintyaroundthepossible environmental impacts. Quantitative estimates of the potential resource value remain restricted to just two to three prospects that have advanced to the feasibility stage. However, factors which are driving interest in deep sea mining include the substantially higher grade of ore compared to equivalent land deposits, the capacity to relocate (and therefore reuse) associated mining infrastructure, and the ability to ship mined materials directly to markets. Although Papua New Guinea is the only country to have granted a license to mine so far, Fiji, Papua New Guinea, the Solomon Islands, Tonga, and Vanuatu have granted deep sea mining exploration permits.
Tourism is the mainstay of private sector economic activity and employment in a number of PICs, including Fiji, Palau, Samoa, Tonga, and Vanuatu. It has been an important source of growth in the region over the last decade, including via the stimulus it provides to the domestic production of fresh produce, local artwork, and handicrafts. However, tourism intensity in the small PICs is generally well below that of other tourism-dependent island states (Figure BI.C.3.6). Three-quarters of tourists to the PIC8 (with the exception of Palau) originate from Australia and New Zealand, which together constitute an arrivals market of less than 30 million people.
WhilethereisasubstantialopportunitytogrowtouristnumbersinthePacific,thiswilldependinpart on the ability of the PICs to attract tourism from new and more distant markets. In particular, research from Fiji, the Cook Islands, and Vanuatu shows that tourists arriving from long-haul markets stay longer, spend more, and are more likely to visit outer islands (spreading the benefits of the tourist dollar outside urban centers). To attract more arrivals, product development (including the establishment of high-quality internationally branded hotels, as has recently been seen in Samoa and Tonga) and market differentiation (to encourage lower-impact, higher-return tourism) will be important. There is also scope for improvements in connectivity: through more convenient flight connections from key markets, better coordinated and less changeable intra-Pacific travel schedules, and more accessible cruise options.
(Box I.C.3 continued)
(continued)
EAST ASIA AND PACIFIC ECONOMIC UPDATE APRIL 2016
78 PART I. RECENT DEVELoPMENTS AND oUTLooK

Internationallabormobility(totheUnitedStatesforthe“Compactcountries”oftheNorthPacific,and to Australia and New Zealand for other small PICs) has already delivered significant andgenerallypro-poorbenefitstothePICs,includinggreaterincome,remittances,andhumancapitaldevelopment. Many of the PIC8 countries are witnessing rapidly growing populations and a youth bulge, but domestic labor markets are not growing fast enough to absorb new entrants, especially the unskilled who are most likely to be poor or in the bottom 40 percent of the population. Going forward, pursuing agreements to scale up existing seasonal migration schemes and expanded quotas for permanent migration, exploring opportunities for gaining access to new regional labor markets, better targeting opportunities toward the poor (including by offering financing instruments to cover the upfront costs of migration, or by means-testing eligibility), and creating new opportunities for higher-skilled workers, such as nurses, are priorities and require joint action by labor-sending and labor-receiving countries.
Boostingfiscal sustainabilityand resilience toexternal shocksarealsopriorities.Given their structural constraints, fiscal sustainability is an issue for a number of the PICs, given modest growth outlooks, relatively high levels of debt, declining trust fund balances, and for the Federated States of Micronesia, the Republic of the Marshall Islands, and Palau, the pending expiration of US Compact grants early next decade. Most PICs have the scope to adopt further measures to boost revenue or reduce expenditures, which would help ensure longer-term sustainability and boost the ability of governments to respond quickly and effectively to natural disasters. In particular, those countries currently experiencing significant fishing revenue windfalls should carefully balance short-term expenditure priorities with longer-term saving and development needs. Accelerating reforms of SoEs, especially those responsible for delivering essential public services, would also reduce the drain on public finances while potentially improving service delivery.
Governments should continue to focus on promoting inclusive growth, including by investing in people and insuring them against the risk of falling back into poverty
East Asia’s remarkable experience of rapid poverty reduction highlights the importance of stimulating faster growth and expanding economic opportunities for all through a focus on macroeconomic stability and an enabling business environment. Labor is the most important asset of the poor, and the ability to move to those areas and sectors where one is most productive is one of the most important pathways out of poverty. The private sector’s potential to provide more and better jobs, and thereby accelerate the movement of workers from traditional to higher-value-added activities, can be unlocked by strengthening the business climate. In particular, governments should avoid distortionary interventions that impede the creation of jobs in cities and within global value chains; this will enable countries to reap the high payoffs associated with increased agglomeration and global integration. China and Vietnam are in the process of implementing major reforms of their restrictive household registration systems, which can go a long way toward improving mobility and enabling a more efficient allocation of labor across sectors. In countries with significant natural resource wealth, such as Mongolia and Lao PDR, governments can encourage employment creation and pro-poor growth by removing barriers to economic diversification. In other countries where a large share of the poor are employed in agriculture, such as Myanmar,
(Box I.C.3 continued)
GROWING CHALLENGES
I.C. PoLICY CoNSIDERATIoNS 79

Box I.C.4. Addressing Inequality in Indonesia23
Urgent action is needed to tackle Indonesia’s rising inequality. Some inequality may have positive effects, by rewarding those who work hard, innovate, and take risks. But inequality is unfair when not everyone has the same initial opportunities in life. And such inequality of opportunity, or high inequality more generally, may lead to slower economic growth and poverty reduction, and an increased risk of conflict and instability.
The Government of Indonesia has made a strong public commitment to addressing rising inequality. The country’s medium-term national development plan for 2014–19 includes a target for reducing inequality, as measured by the Gini coefficient, by 10 percent. Although no explicit strategy has been developed to address inequality, some positive initiatives have been introduced. One such measure is a fuel subsidy reform in early 2015, which eliminated costly and regressive energy subsidies to redirect the spending to investments in infrastructure, health, and social assistance. The main cash transfer program targeted at the poor has doubled in size to 6 million beneficiary families in 2016, and a raft of economic stimulus packages have been recently launched aiming to increase investments and lead to the creation of more productive and higher paying jobs. These policies are likely to find strong support from the public, with a recent survey finding that nearly 90 percent of Indonesians think it is “quite urgent” or “very urgent” to address inequality, and that there is broad support for better social protection and more jobs to do so (figure BI.C.4.1).
23 This box is based on the World Bank report Indonesia’s Rising Divide: why inequality is rising, why it matters and what can be done (2015). The executive summary and background papers are available at www.worldbank.org/en/news/feature/2015/12/08/indonesia-rising-divide.
Figure BI.C.4.1. Indonesians are demanding action to address inequalityHow urgent is it for the government to address inequality?Percent
47
41
10
3
J Very urgent J Not quite urgent J Not very urgent J Not urgent at all
Source: Lingkaran Survei Indonesia 2014.
the Philippines, and Thailand, boosting farmer productivity may require improving their access to information, better seeds, water, electricity, and markets. In the Philippines, economic opportunity and job creation would be significantly enhanced by measures to secure property rights through more systematic adjudication of land rights, to strengthen competition in sectors such as shipping and telecommunications that provide key intermediate inputs, and to simplify costly business regulations.
Countries seeking to foster more inclusive growth face diverse opportunities and challenges, but investing in people, and especially in their education and health, should be a key pillar of their strategy. Local circumstances are clearly important. In Indonesia, recent World Bank analytic work highlights the important role that public policies can play in boosting the welfare of the poorest and helping to break the intergenerational cycle of inequality (Box I.C.4). Improving local service delivery is a priority, and needs to be supported by a tax system that provides a more balanced mix of taxes on labor and capital income, and that boosts available revenues through increased tax compliance. In China, investments in human capital are the best way to ensure that the labor market can respond smoothly to the ongoing structural shifts, and that adjustment costs (for instance, in terms of structural unemployment) are kept low. In Thailand, achieving inclusiveness will require narrowing the significant learning gap between the best- and poorest-performing schools. In the Philippines, significant public investments in social services and infrastructure are required, including in Mindanao, which has suffered from conflict and neglect. Lao PDR and Vietnam, despite a tight fiscal situation, should maintain the fiscal space required to improve public service delivery, including by improving social infrastructure.
(continued)
EAST ASIA AND PACIFIC ECONOMIC UPDATE APRIL 2016
80 PART I. RECENT DEVELoPMENTS AND oUTLooK
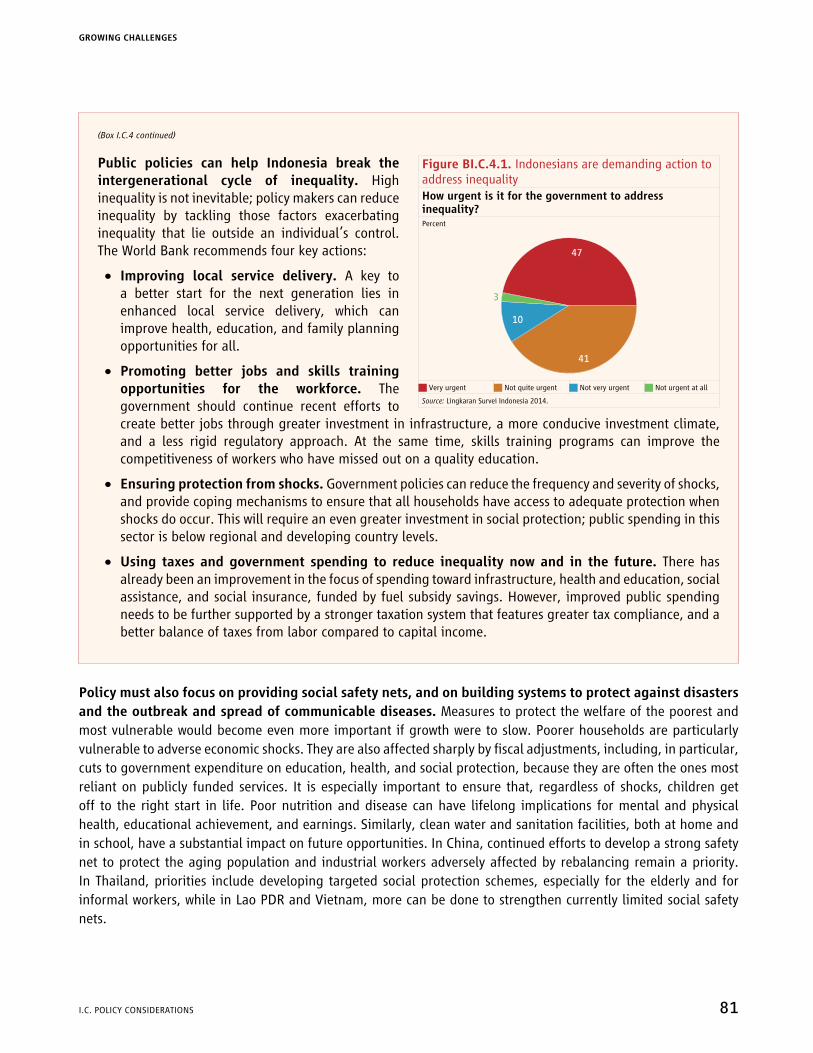
Public policies can help Indonesia break the intergenerational cycle of inequality. High inequality is not inevitable; policy makers can reduce inequality by tackling those factors exacerbating inequality that lie outside an individual’s control. The World Bank recommends four key actions:
• Improving local service delivery. A key to a better start for the next generation lies in enhanced local service delivery, which can improve health, education, and family planning opportunities for all.
• Promoting better jobs and skills training opportunities for the workforce. The government should continue recent efforts to create better jobs through greater investment in infrastructure, a more conducive investment climate, and a less rigid regulatory approach. At the same time, skills training programs can improve the competitiveness of workers who have missed out on a quality education.
• Ensuring protection from shocks. Government policies can reduce the frequency and severity of shocks, and provide coping mechanisms to ensure that all households have access to adequate protection when shocks do occur. This will require an even greater investment in social protection; public spending in this sector is below regional and developing country levels.
• Using taxes and government spending to reduce inequality now and in the future. There has already been an improvement in the focus of spending toward infrastructure, health and education, social assistance, and social insurance, funded by fuel subsidy savings. However, improved public spending needs to be further supported by a stronger taxation system that features greater tax compliance, and a better balance of taxes from labor compared to capital income.
Policy must also focus on providing social safety nets, and on building systems to protect against disasters and the outbreak and spread of communicable diseases. Measures to protect the welfare of the poorest and most vulnerable would become even more important if growth were to slow. Poorer households are particularly vulnerable to adverse economic shocks. They are also affected sharply by fiscal adjustments, including, in particular, cuts to government expenditure on education, health, and social protection, because they are often the ones most reliant on publicly funded services. It is especially important to ensure that, regardless of shocks, children get off to the right start in life. Poor nutrition and disease can have lifelong implications for mental and physical health, educational achievement, and earnings. Similarly, clean water and sanitation facilities, both at home and in school, have a substantial impact on future opportunities. In China, continued efforts to develop a strong safety net to protect the aging population and industrial workers adversely affected by rebalancing remain a priority. In Thailand, priorities include developing targeted social protection schemes, especially for the elderly and for informal workers, while in Lao PDR and Vietnam, more can be done to strengthen currently limited social safety nets.
Box I.C.4. Addressing Inequality in Indonesia23
Urgent action is needed to tackle Indonesia’s rising inequality. Some inequality may have positive effects, by rewarding those who work hard, innovate, and take risks. But inequality is unfair when not everyone has the same initial opportunities in life. And such inequality of opportunity, or high inequality more generally, may lead to slower economic growth and poverty reduction, and an increased risk of conflict and instability.
The Government of Indonesia has made a strong public commitment to addressing rising inequality. The country’s medium-term national development plan for 2014–19 includes a target for reducing inequality, as measured by the Gini coefficient, by 10 percent. Although no explicit strategy has been developed to address inequality, some positive initiatives have been introduced. One such measure is a fuel subsidy reform in early 2015, which eliminated costly and regressive energy subsidies to redirect the spending to investments in infrastructure, health, and social assistance. The main cash transfer program targeted at the poor has doubled in size to 6 million beneficiary families in 2016, and a raft of economic stimulus packages have been recently launched aiming to increase investments and lead to the creation of more productive and higher paying jobs. These policies are likely to find strong support from the public, with a recent survey finding that nearly 90 percent of Indonesians think it is “quite urgent” or “very urgent” to address inequality, and that there is broad support for better social protection and more jobs to do so (figure BI.C.4.1).
23 This box is based on the World Bank report Indonesia’s Rising Divide: why inequality is rising, why it matters and what can be done (2015). The executive summary and background papers are available at www.worldbank.org/en/news/feature/2015/12/08/indonesia-rising-divide.
Figure BI.C.4.1. Indonesians are demanding action to address inequalityHow urgent is it for the government to address inequality?Percent
47
41
10
3
J Very urgent J Not quite urgent J Not very urgent J Not urgent at all
Source: Lingkaran Survei Indonesia 2014.
(Box I.C.4 continued)
GROWING CHALLENGES
I.C. PoLICY CoNSIDERATIoNS 81

References
Fane, Charles, and Peter Warr. 2008, “Agricultural Protection in Indonesia.” Bulletin of Indonesian Economic Studies 44 (1): 133–150.
ICTD (International Center for Tax and Development). 2015. ICTD Government Revenue Dataset. International Center for Tax and Development, United Kingdom.
IMF (International Monitory Fund). 2015. Fiscal Monitor October 2015 – Now is The Time: Fiscal Policies for Sustainable Growth. Washington, DC: International Monitory Fund.
IMF (International Monetary Fund). 2015b. Fiscal Monitor October 2015 – The Commodities Roller Coaster: A Fiscal Framework for Uncertain Times. Washington, DC: International Monetary Fund.
IRRI (International Rice Research Institute). 2004. Why does the Philippines Import Rice? Manila: International Rice Research Institute.
James, Sebastian, and Richard Stern. 2015. “Rethinking the Use of Tax Incentives in East Asia and Pacific.” In World Bank. East Asia and Pacific Economic Update, October 2015: Staying the Course. Washington, DC: World Bank.
Keefer, Phil, and Laura Zoratto. 2012. “The political economy of rice policies in the Philippines.” World Bank Internal Note, World Bank, Washington, DC.
Klemm, A., and V. P. Stefan. 2009. “Empirical Evidence on the Effects of Tax Incentives.” IMF Working Paper WP/09/136, International Monitory Fund, Washington, DC.
World Bank, and Development Research Center of the State Council, the People’s Republic of China. 2014. Urban China: Toward Efficient, Inclusive, and Sustainable Urbanization. Washington, DC: World Bank.
World Bank. 2015. East Asia and Pacific Economic Update. Washington, DC, October.
———. 2015b. Myanmar Public Expenditure Review 2015. Yangon: World Bank.
———. 2015c. Indonesia’s Rising Divide: why inequality is rising, why it matters and what can be done. Washington, DC: World Bank.
———. 2015d. Malaysia Economic Monitor December 2015: Immigrant Labor. Kuala Lumpur: World Bank.
———. 2015e. Indonesia Economic Quarterly December 2015: Reforming Amid Uncertainty. Jakarta: World Bank.
———. 2016. Increasing Investment to Improve Basic Education Outcomes in the Philippines (Knowledge Brief). Manila: World Bank.
World Development Indicators. 2015. Washington, DC: World Bank.
World Development Indicators. 2016. Washington, DC: World Bank.
EAST ASIA AND PACIFIC ECONOMIC UPDATE APRIL 2016
82 PART I. RECENT DEVELoPMENTS AND oUTLooK

Part II. Medium-Term Development Agenda
GROWING CHALLENGES
83

II.A. Governance for Sustained Growth in East Asia and Pacific: Priorities and Indicators1
TThe “East Asian paradox” of extended growth episodes, despite the absence of multiparty democracies in a number of countries and high levels of perceived corruption, has challenged the conventional wisdom that inclusive governance institutions matter for growth. In part, this paradox may be explained by East Asian countries performing relatively well in terms of state capacity, particularly when focusing on outcomes, rather than institutional form as captured by traditional governance indicators. State capacity may be particularly important in generating economic take-offs and sustaining the early stages of development. However, to sustain the rise of the region’s increasingly complex economies to high-income status, the transparency, accountability, and responsiveness of their governments to the demands of both the private sector and civil society will become increasingly critical. These aspects of governance are particularly important in fostering the development of a private sector focused on long-term innovation, and of modern, complex activities including higher-value-added services, which can provide the basis for sustained growth. Governments in the region are increasingly recognizing their challenges along these dimensions, and the need for governance reforms to address them. New types of governance indicators, which are already being piloted in the region, may help to measure and enhance government responsiveness.
LookingBack:TheEastAsianParadox
Ì The paradox
In the last 60 years, the Republic of Korea has become a high-income country, after sustained rapid growth as one of East Asia’s “miracle economies.” The Democratic People’s Republic of Korea, by contrast, has stagnated economically over the last decades, and remains a lower-middle-income country. In a night satellite image, the Republic of Korea shines brightly, whereas the Democratic People’s Republic of Korea is dark. But in 1945, before the country’s division, both parts of the peninsula were similar. Acemoglu and Robinson (2012) use the divergent fates of the two Koreas to illustrate their central message: inclusive economic institutions—that is, institutions that distribute economic opportunity broadly, beyond the elites—matter for the wealth of nations. So do inclusive political institutions, and there is strong synergy between both sets of institutions. In the Republic of Korea, after rapid growth under a closed developmental state regime, transition to a multiparty democracy is one of the factors that has helped sustain its economic success. More generally, the long-term association between high levels of income and inclusive political institutions is an established historical pattern (Rodrik 2008, 19).
Yet,atfirstglance,thetrajectoriesofseveralgroupsofcountriesinEastAsiaandPacific(EAP)appeartocontradictthisfinding—afactoftenreferredtoasthe“EastAsianparadox.”A first group is the “Asian tigers”
1 Prepared by Jurgen R. Blum and Robert R. Taliercio. The findings, interpretations, and conclusions expressed in this note are entirely those of the authors. They do not necessarily represent the views of the World Bank and its affiliated organizations, or those of the Executive Directors of the World Bank or the governments they represent. The authors wish to thank Elin Bergman, Robert P. Beschel, Alexandre Borges de oliveira, David Bulman, Soren Davidsen, Tobias Hague, Bert Hofman, Melissa Johns, Hisham A. Abdo Kahin, Kai Kaiser, Philipp Keefer, Jay-Hyung Kim, Peter Farup Ladegaard, Petter Lundkvist, Nick Manning, Shabih Ali Mohib, Sheila Braka Musiime, Evgenij Najdov, Siddharth Sharma, Sudhir Shetty, Nikola L. Spatafora, Hoon Sahib Soh, Theo David Thomas, Joel A. Turkowitz, Charles Underland, Rogier J. E. Van Den Brink, Mathew A. Verghis, Min Zhao for their helpful comments. Any errors and omissions are the authors’ alone.
EAST ASIA AND PACIFIC ECONOMIC UPDATE APRIL 2016
84 PART II. MEDIUM-TERM DEVELoPMENT AGENDA
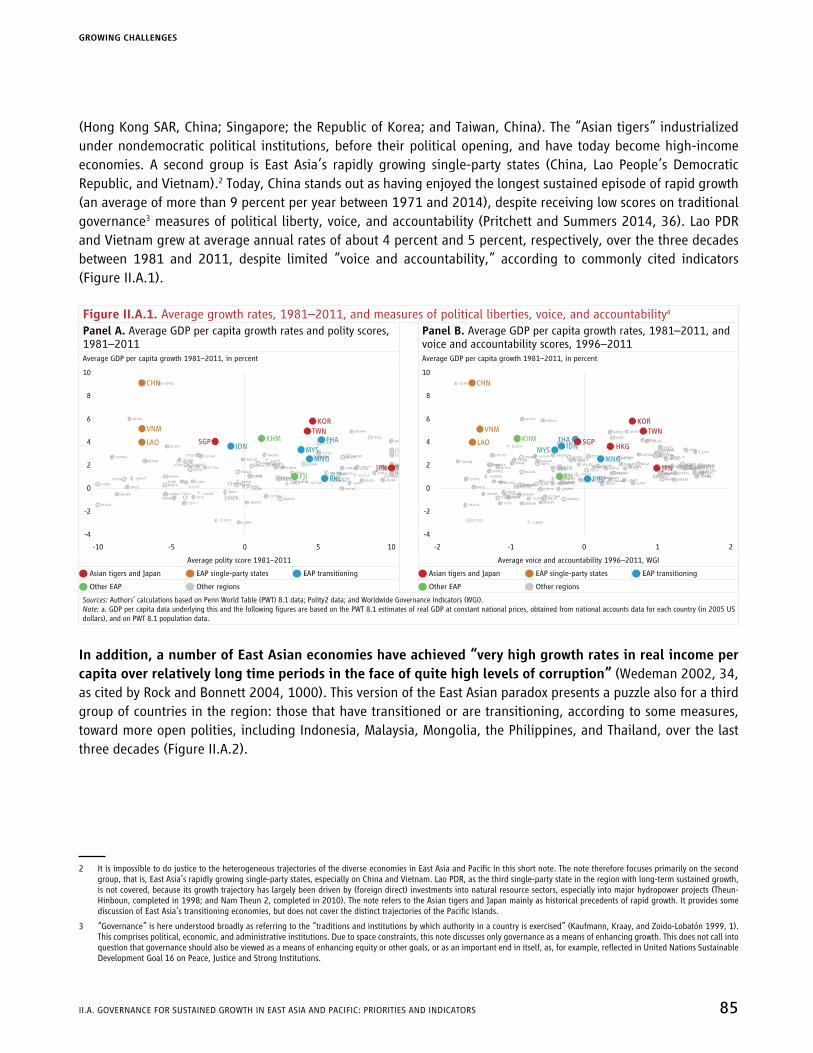
(Hong Kong SAR, China; Singapore; the Republic of Korea; and Taiwan, China). The “Asian tigers” industrialized under nondemocratic political institutions, before their political opening, and have today become high-income economies. A second group is East Asia’s rapidly growing single-party states (China, Lao People’s Democratic Republic, and Vietnam).2 Today, China stands out as having enjoyed the longest sustained episode of rapid growth (an average of more than 9 percent per year between 1971 and 2014), despite receiving low scores on traditional governance3 measures of political liberty, voice, and accountability (Pritchett and Summers 2014, 36). Lao PDR and Vietnam grew at average annual rates of about 4 percent and 5 percent, respectively, over the three decades between 1981 and 2011, despite limited “voice and accountability,” according to commonly cited indicators (Figure II.A.1).
Figure II.A.1. Average growth rates, 1981–2011, and measures of political liberties, voice, and accountabilitya
Panel A. Average GDP per capita growth rates and polity scores, 1981–2011
Panel B. Average GDP per capita growth rates, 1981–2011, and voice and accountability scores, 1996–2011
Average GDP per capita growth 1981–2011, in percent Average GDP per capita growth 1981–2011, in percent
AGO ALB
ARG AUSAUS
BDI
BEL
BEN
BFA
BGD
BGR
BHR
BOL
BRA
BTN
BWA
CAF
CAN
CHECHE
CHL
CIV
CMR
COD
COG
COL
COM
CPV
CRI
CYP
DEU
DJI
DNK
DOM
ECU
EGY
ESPETH
FIN
FRA
GAB
GBRGHA
GIN
GMBGNB
GNQ
GRC
GTM
HND
HUN
IND
IRL
IRN
IRQ
ISR
ITA
JAMJOR
KEN
KWT
LBN
LBR
LKA
LSO
LUX
MAR
MDG
MEX
MLI
MOZ
MRT
MUS
MWI NAM
NER
NGA
NLDNOR
NPL
NZL
OMN
PAK
PAN
PER
POL
PRT
PRYQAT
ROU
RWA
SAU
SDN
SEN
SLE
SUR
SWE
SYR
TCD
TGO
TTO
TUN
TUR
TZA
UGA
URYUSA
VEN
ZAF
ZMB
ZWE
10
8
6
4
2
0
-2
-4
-10 -5 0 5 10
SGP
KOR
TWN
JPN
CHN
VNM
LAOIDN
THA
MYS
MNG
PHL
KHM
FJI
10
8
6
4
2
0
-2
-4
-2 -1 0 1 2
AGO ALB
ARG
ATG
AUSAUSAUT
BDI
BEL
BEN
BFA
BGD
BGR
BHR
BHS
BLZ
BMU
BOL
BRA
BRB
BRN
BTN
BWA
CAF
CAN
CHECHE
CHL
CIV
CMR
COD
COG
COL
COM
CPV
CRI
CYP
DEU
DJI
DMA
DNK
DOM
ECU
EGY
ESPETH
FIN
FRA
GAB
GBRGHA
GIN
GMBGNB
GNQ
GRC
GRD
GTM
HND
HUN
IND
IRL
IRN
IRQ
ISL
ISR
ITA
JAMJOR
KEN
KNA
KWT
LBN
LBR
LCA
LKA
LSO
LUX
MAC
MAR
MDG
MDV
MEX
MLI
MLTMOZ
MRT
MUS
MWI NAM
NER
NGA
NLDNOR
NPL
NZL
OMN
PAK
PAN
PER
POL
PRT
PRYQAT
ROU
RWA
SAU
SDN
SEN
SLE
SLV
STP
SUR
SWE
SWZ
SYR
TCD
TGO
TTO
TUN
TUR
TZA
UGA
URYUSA
VCT
VEN
ZAF
ZMB
ZWE
KOR
TWN
JPN
CHN
VNM
LAOIDN
THA
MYS
MNG
PHL
KHM
FJI
HKGSGP
Average polity score 1981–2011 Average voice and accountability 1996–2011, WGI
Q Asian tigers and Japan Q EAP single-party states Q EAP transitioning Q Asian tigers and Japan Q EAP single-party states Q EAP transitioning
Q other EAP Q Other regions Q other EAP Q Other regions
Sources: Authors’ calculations based on Penn World Table (PWT) 8.1 data; Polity2 data; and Worldwide Governance Indicators (WGI).Note: a. GDP per capita data underlying this and the following figures are based on the PWT 8.1 estimates of real GDP at constant national prices, obtained from national accounts data for each country (in 2005 US dollars), and on PWT 8.1 population data.
In addition, a number of East Asian economies have achieved “very high growth rates in real income per capita over relatively long time periods in the face of quite high levels of corruption” (Wedeman 2002, 34, as cited by Rock and Bonnett 2004, 1000). This version of the East Asian paradox presents a puzzle also for a third group of countries in the region: those that have transitioned or are transitioning, according to some measures, toward more open polities, including Indonesia, Malaysia, Mongolia, the Philippines, and Thailand, over the last three decades (Figure II.A.2).
2 It is impossible to do justice to the heterogeneous trajectories of the diverse economies in East Asia and Pacific in this short note. The note therefore focuses primarily on the second group, that is, East Asia’s rapidly growing single-party states, especially on China and Vietnam. Lao PDR, as the third single-party state in the region with long-term sustained growth, is not covered, because its growth trajectory has largely been driven by (foreign direct) investments into natural resource sectors, especially into major hydropower projects (Theun-Hinboun, completed in 1998; and Nam Theun 2, completed in 2010). The note refers to the Asian tigers and Japan mainly as historical precedents of rapid growth. It provides some discussion of East Asia’s transitioning economies, but does not cover the distinct trajectories of the Pacific Islands.
3 “Governance” is here understood broadly as referring to the “traditions and institutions by which authority in a country is exercised” (Kaufmann, Kraay, and Zoido-Lobatón 1999, 1). This comprises political, economic, and administrative institutions. Due to space constraints, this note discusses only governance as a means of enhancing growth. This does not call into question that governance should also be viewed as a means of enhancing equity or other goals, or as an important end in itself, as, for example, reflected in United Nations Sustainable Development Goal 16 on Peace, Justice and Strong Institutions.
GROWING CHALLENGES
II.A. GoVERNANCE FoR SUSTAINED GRoWTH IN EAST ASIA AND PACIFIC: PRIoRITIES AND INDICAToRS 85

Figure II.A.2. Average growth rates and corruption scoresPanel A. Average GDP per capita growth rates and International Country Risk Guide (ICRG) corruption scores, 1981–2011
Panel B. Average GDP per capita growth rates, 1981–2011; and control of corruption estimates, 1996–2011
Average GDP per capita growth 1981–2011 Average GDP per capita growth 1981–2011
10
8
6
4
2
0
-2
-4
0 2 4 6
AGO ALB
ARG AUSAUSAUTBELBFA
BGD
BGR
BHR
BHSBOL
BRA
BRN
BWA
CAN
CHECHE
CHL
CIV
CMR
COD
COG
COLCRI
CYP
DEUDNK
DOM
ECU
EGY
ESPETH
FIN
FRA
GAB
GBRGHA
GIN
GMBGNB
GRC
GTM
HND
HUN
IND
IRL
IRN
IRQ
ISL
ISR
ITA
JAMJOR
KEN
KWT
LBN
LBR
LKA
LUX
MAR
MDG
MEX
MLI
MLTMOZ
MWINAM
NER
NGA
NLDNOR
NZL
OMN
PAK
PAN
PER
POL
PRT
PRY QAT
ROU
SAU
SDN
SEN
SLE
SLV
SUR
SWE
SYR
TGO
TTO
TUN
TUR
TZA
UGA
URYUSA
VEN
ZAF
ZMB
ZWE
KOR
TWN
JPN
CHN
VNM
IDNTHA
MYS
MNG
PHL
HKGSGP
10
8
6
4
2
0
-2
-4
-2 -1 0 1 32
AGO ALB
ARG
ATG
AUSAUSAUT
BDI
BEL
BEN
BFA
BGD
BGR
BHR
BHS
BLZ
BMU
BOL
BRA
BRB
BRN
BTN
BWA
CAF
CAN
CHECHE
CHL
CIV
CMR
COD
COG
COL
COM
CPV
CRI
CYP
DEU
DJI
DMA
DNK
DOM
ECU
EGY
ESPETH
FIN
FRA
GAB
GBRGHA
GIN
GMBGNB
GNQ
GRC
GRD
GTM
HND
HUN
IND
IRL
IRN
IRQ
ISL
ISR
ITA
JAMJOR
KEN
KNA
KWT
LBN
LBR
LCA
LKA
LSO
LUX
MAC
MAR
MDG
MDV
MEX
MLI
MLTMOZ
MRT
MUS
MWI NAM
NER
NGA
NLDNOR
NPL
NZL
OMN
PAK
PAN
PER
POL
PRT
PRY QAT
ROU
RWA
SAU
SDN
SEN
SLE
SLV
STP
SUR
SWE
SWZ
SYR
TCD
TGO
TTO
TUN
TUR
TZA
UGA
URYUSA
VCT
VEN
ZAF
ZMB
ZWE
KHM
KOR
TWN
JPN
CHN
VNM
LAOIDN
THA
MYS
MNG
PHL
HKGSGP
FJI
Average corruption 1981–2011, ICRG Average corruption 1996–2011, WGI
Q Asian tigers and Japan Q EAP single-party states Q EAP transitioning Q Asian tigers and Japan Q EAP single-party states Q EAP transitioning
Q Other regions Q other EAP Q Other regions Q other EAP
Sources: Authors’ calculations based on PWT8.1 data, ICRG, and WGI data.
Ì Explainingtheparadox:measuringwhatmatters
What factors explain the East Asian paradox? The relationship between governance and growth remains contested. Beyond the well-established long-term association between democratic institutions and levels of income, there are no clear answers to several key questions: How much does governance matter for growth? What types of governance reforms have the greatest impact? How should policy makers best go about designing reform strategies?4 Meanwhile, explanations of the East Asian paradox also differ—and even if there were a consensus, no single explanation could cover the varied contexts within the region (in some sense, of course, the “region” is a conceptual construct worth examining in greater depth). A few strands of this debate merit highlighting.
A number of researchers raise conceptual and measurement questions in explaining East Asian exceptionalism. For instance, Pritchett and Werker (2012) highlight that the distinctive feature of countries without multiparty democracies is that their growth is more volatile than in democracies, marked by boom and bust periods. When developing countries grow, they grow considerably faster than developed countries, by about 1.5 percentage points per year on average (Pritchett and Werker 2012, 23). Accordingly, the growth dynamics, for example, of East Asia’s single-party states are exceptional because of the length of uninterrupted growth episodes (the absence of “busts”), not because of high growth rates at any given time. Others call into question whether broad measures of governance are at all suited to explaining economic performance: “broad governance reform is neither necessary nor sufficient for growth” since growth depends on relaxing constraints in specific sectors (Rodrik 2008, 20). Perhaps most radically, the East Asian paradox may simply be a statistical illusion. If high-growth countries with poor governance were sprinkled across the world’s regions at random, chances would be that one region might end up with more than others (Stephenson 2015).
4 For reviews of the vast conceptual and empirical literature on this question, see Bluhm and Szirmai (2011); Evans and Ferguson (2013); and Zhuang, de Dios, and Lagman-Martin (2010).
EAST ASIA AND PACIFIC ECONOMIC UPDATE APRIL 2016
86 PART II. MEDIUM-TERM DEVELoPMENT AGENDA
Substantive explanations of the paradox also differ. Some analysts attribute it to exceptionally high levels of social capital and trust in some East Asian countries, which may enable informal institutions to partially compensate for weak formal ones (Li and Wu 2010). Similarly, community solidarity groups in China play an important role in motivating local officials to provide public goods through informal rules and norms, even as formal accountability is weak (Tsai 2007). Others point to an Asian “form of corruption,” marked by predictable and stable state-business relationships that are less harmful to investment than predatory forms of corruption.5 Malesky and Samphantharak (2008), for example, show that after provincial governors changed between 2004 and 2006 in Cambodia, firms invested less and corruption declined. This finding is consistent with the argument that the predictability of corruption (under the same leadership) influenced the investment decisions of Cambodian firms, not only the amount of corruption.
This note considers two particularly persuasive explanations for East Asia’s long growth episodes in formally nondemocratic contexts. First, intra-elite mechanisms of accountability can enable leaders to credibly commit to not expropriate investors. In other words, credible intra-elite bargains can fuel investment and growth, even if mechanisms of accountability (for example, elections) to an excluded majority are weak. In a number of East Asian countries, large and well-institutionalized political parties seem to have facilitated such (formal and informal) intra-elite accountability. Second, a legacy of high state capacity6 in East Asia has enabled governments in the region to credibly enforce rules (such as industrial policies) and effectively provide public goods (such as infrastructure). Both of these dimensions of East Asian exceptionalism are poorly reflected in existing governance measures.
Ì Intra-eliteaccountability:theroleofinstitutionalized7 political parties
Asignificantbodyofworkemphasizestheroleofintra-eliteaccountabilitymechanismsformotivatingleaders to provide public goods and refrain from expropriation. The core argument is that leaders are restrained in their exercise of authority when they depend on sustaining elite support to stay in power (Beasley and Kudamatsu 2007; North, Wallis, and Weingast 2009). The larger such elite groups are and the more they can act collectively, the more likely leaders are to adopt policies that are in the broader public interest (De Mesquita et al. 2003).
Such intra-elite accountability has played a particularly important role in enabling investment and growth in East Asian countries with large and well-institutionalized political parties, such as the communist parties of China and Vietnam (Gehlbach and Keefer 2011). The party organization has enabled party members to act collectively and to hold leaders to account for their decisions, according to this line of argument. Moreover,
5 For instance, “corruption is widespread but orderly in EAP” (World Bank 2008, 328). Similarly, “perhaps the large East Asian newly industrialized countries’ (i.e. China, Indonesia, South Korea, Thailand and Japan) high-corruption, high-investment, and growth outcomes reflect monopoly control of corruption networks by strong overcentralized states” (Rock and Bonnett 2004, 1003).
6 State capacity is here defined as the “degree of control that state agents exercise over persons, activities, and resources within their government’s territorial jurisdiction,” following McAdam, Tarrow, and Tilly (2001, 78).
7 Following (Keefer 2011, 95), parties are here understood as “institutionalized” if they can “maintain the party’s reputation for favoring a particular policy program, facilitating the election of party candidates; or if they oblige leaders and members to systematically pursue the collective economic interests of party members.”
GROWING CHALLENGES
II.A. GoVERNANCE FoR SUSTAINED GRoWTH IN EAST ASIA AND PACIFIC: PRIoRITIES AND INDICAToRS 87

in China, since 2000, the theory of the “Three Represents”8 included private entrepreneurs in the party (they were previously excluded).
Forinstance,inpost-MaoChina,institutionalreformswithintheChineseCommunistParty(CCP)coincidedwith growth-accelerating economic reforms. In the early 1980s, Deng Xiaoping reformed the CCP in ways that improved the ability of cadres to act collectively, and increased the transparency of leader-cadre interactions. In particular, he introduced personnel reforms in which the promotion and evaluation of cadres were “governed by rules, clear lines of authority, and collective decision-making institutions” (Shirk 1993, 9, as cited by Gehlbach and Keefer 2011, 5).
These changes in the CCP’s organization improved the ability of cadres to hold party leaders to account for expropriation. Initially, they “encouraged cadres [themselves] to invest, for example, in township and village enterprises (TVEs) under their control without fear that the resulting profits would be taxed away or otherwise expropriated” (Gehlbach and Keefer 2011, 134).9 But arguably they also fueled non-TVE private investment, which rapidly outgrew TVE investment. Well-institutionalized ruling parties can also generate more private investment than weak ones, because outside firms (often) still depend on relationships with party insiders to invest. Since the number of insiders who can offer such protection is higher in institutionalized parties, more firms can benefit from it (Gehlbach and Keefer 2011, 136). If this theoretical argument holds true in China and Vietnam, their institutionalized parties may have enabled a larger “circle of access” than that found in countries with weak party organizations.
Beyond China, available indicators suggest that party institutionalization indeed constitutes an insufficiently measured facet of “East Asianexceptionalism” (Keefer 2011, 95). The extent of intra-party accountability is inherently difficult to measure, but Gehlbach and Keefer (2012 argue that the age of the governing party (minus the years the leader has been in office) can be a plausible proxy.10 Based on this proxy measure, the ruling parties of East Asia’s single-party states exhibit a greater degree of institutionalization, than do those in other countries without multiparty democracies (Figure II.A.3). In fact, the age of the governing parties of China and Vietnam in 2010 was equaled only by the age of parties in established multiparty democracies, such as Germany, New Zealand, and the United Kingdom.
8 The theory of the “Three Represents” was put forward by former President of China Jiang Zemin in February 2000. It highlights that the Chinese Communist Party (CCP) represents (i) the development trends of advanced productive forces; (ii) the orientations of an advanced culture; and (iii) the fundamental interests of the overwhelming majority of the people of China.
9 That said, “these broad institutional changes were naturally insufficient to allow local cadres to act collectively to restrain leaders in Beijing. Local cadres at the village level, no matter how transparent the party management of their careers and no matter how low the barriers they confronted to coordinating with each other, stood little chance of acting collectively against the top leadership. However, at every level of the party, leaders in the post-Mao era confronted greater constraints imposed by at least the hundreds of cadres just below them” (Gehlbach and Keefer 2012, 623).
10 Keefer (2011, 109) argues that “the ability of the ruling party to survive leadership transitions indicates that party members can undertake collective action independent of the party leader.”
Figure II.A.3. Average GDP per capita growth rates, 1981–2011, and the age of the governing party, 2010Average GDP per capita growth 1981–2011, in percent
10
8
6
4
2
0
-2
-4
0 50 100 150
AGOALB
ARG AUSAUSAUT
BDI
BEL
BEN
BFA
BGD
BGR
BHR
BHS
BLZ
BOL
BRA
BRB
BTN
BWA
CAF
CAN
CHECHE
CHL
CIV
CMR
COG
COL
COM
CPV
CRI
CYP
DEU
DJI
DNK
DOM
ECU
EGY
ESPETH
FIN
FRA
GAB
GBRGHA
GMBGNB
GNQ
GRC
GRD
GTM
HND
HUN
IND
IRL
IRQ
ISL
ISR
ITA
JAM
KEN
LBN
LBR
LCA
LKA
LSO
LUX
MAR
MDG
MDV
MEX
MLI
MLTMOZ
MRT
MUS
MWI NAM
NER
NGA
NLDNOR
NPL
NZL
PAK
PAN
PER
POL
PRT
PRY
RWA
SEN
SLE
SLV
SUR
SWE
SYR
TCD
TGO
TTO
TUN
TUR
TZA
UGA
URYUSA
VEN
ZAF
ZMB
ZWE
MYS
KOR
TWN
JPN
CHN
VNM
LAOIDN
THA
MYS
MNG
PHL
SGPKHM
Age of governing party when leader in 2010 took power, in years
Q Asian tigers and Japan Q EAP single-party states Q EAP transitioning
Q Other regions Q other EAP
Sources: Authors’ calculation using PWT8.1 data and Database of Political Institutions.
EAST ASIA AND PACIFIC ECONOMIC UPDATE APRIL 2016
88 PART II. MEDIUM-TERM DEVELoPMENT AGENDA
This exceptionalism is, however, mostly limited to East Asia’s single-party states, some of the Asian tigers, andJapan.11 In many of the region’s emerging democracies, such as Indonesia and the Philippines, parties are not highly institutionalized. In the Philippines, for example, members of Parliament (MPs) frequently change their party affiliation. Without party discipline, MPs have incentives to mobilize votes and campaign finance by spreading private goods (for example, contracts) across the country’s 42,029 barangays, rather than to create larger-scale public goods (Noda 2011).
Ì Statecapacity:centralstrengthandlocalexperimentation
LegaciesofexceptionallyhighstatecapacitygofarinexplainingEastAsia’sgrowth:“thecorestatesofEastAsia—Chinaand Taiwan,China; Japan; andKorea—developed relativelyhigh-quality centralizedbureaucratic states early in their histories,” preceding the rule of law12 or electoral accountability (Fukuyama 2012, 15). This sequence may explain why “almost all of the recent examples of successful authoritarian modernization cluster in East Asia” (Fukuyama 2012, 16). More generally, “sufficiently centralized and powerful states” that are able to enforce rules and preserve a monopoly of violence in society are a necessary component of inclusive political institutions (Acemoglu and Robinson 2012, 80).
ForthecaseofVietnam,Dell,Lane,andQuerubin(2015)compellinglydemonstratethelong-runeffectsof historical state capacity. They argue that northern Vietnam (Dai Viet) was ruled by a centralized “bureaucratic state”13 inherited from China, whereas southern Vietnam was a peripheral tributary of the Khmer (Cambodian) Empire, a “patron-client state.” By comparing Vietnamese villages just north and south of the precolonial Dai Viet-Khmer boundary, the authors show that until today, those areas historically under the bureaucratic state have on average stronger local governments, civil societies, and higher living standards than those that had a patron-client state.
Arguably, two aspects of state capacity have been key to unlocking China’s and Vietnam’s growth. In China, an outstandingly strong central administration holds bureaucrats to account for their performance in delivering public goods. In China and Vietnam, the central state benefits from scaling up institutional innovations piloted at the subnational level.
China’s much-discussed cadre management system, has enabled party leaders to credibly promise promotion and rewards to bureaucrats in return for their attainment of growth and job creation targets,
11 In Taiwan, China, for example, the Nationalist Party, also called Kuomintang (originally founded in 1912), constituted the only real political force in Taiwan until the 1990s and has held power over most of the post-1945 period. Singapore’s People’s Action Party has been ruling the country since 1959. In Japan, the Liberal Democratic Party (LDP) has held power almost continuously since its formation in 1955 and is the country’s largest political party.
12 “Rule of law” is here understood broadly as “the restriction of the arbitrary exercise of power by subordinating it to well-defined and established laws” (oxford Dictionaries). Due to space constraints, this note does not explore the relationship between distinct measures of the rule of law and growth in East Asia. one reason is that the two concepts of democratic governance and corruption overlap or correlate with some dimensions of the “rule of law.” Democratic institutions are widely considered as solutions to rulers’ commitment problem not to expropriate (see Gelbach and Keefer [2011] for a review of the relevant literature). Reducing corruption is seen as a channel through which the rule of law can affect growth (for example, by reducing monopoly rents and restricting entry). In addition, for the period of interest in this study (about 1981 to today) there is no commonly agreed comparative measure for the rule of law. As Haggard and Tiede (2011) show in a review of the theoretical and empirical literature, most available measures of different dimensions of the concept (including security of person, property rights, institutional check on government, corruption) appear surprisingly weakly correlated among themselves and with composite measures, such as the WGI “rule of law” measure. The latter measure, in turn, is closely correlated with corruption. For a more detailed conceptualization of “rule of law” and its measurement, refer to the World Justice Project’s new rule of law index at http://worldjusticeproject.org/.
13 The authors characterize the Dai Viet state as “bureaucratic,” because it was “governed through a centralized, competitively selected bureaucracy, and the village was the fundamental administrative unit.” By contrast, they characterized the Khemer Empire as marked by “weaker, more personalized power relations and no village intermediation” (Dell, Lane, and Querubin 2015, i).
GROWING CHALLENGES
II.A. GoVERNANCE FoR SUSTAINED GRoWTH IN EAST ASIA AND PACIFIC: PRIoRITIES AND INDICAToRS 89

amonglocalofficials.In this sense, China’s “cadre organization” may be behind its growth paradox (Rothstein 2014). China deviates from the “the liberal rule-of-law-based Weberian model” in that it lacks a predictable, rule-based, apolitical and impersonal type of administration. Nonetheless, it effectively builds state capacity and citizen trust by integrating features of party loyalty with performance management and a professionalization of the civil service.14
Existingmeasuresofgovernancealsoinsufficientlycapture the critical role that local governments have played in enabling growth in EAP. In many East Asian countries, local governments control an increasingly large share of expenditures and policy decisions. Accordingly, local governments, besides central decision makers, play a major role in shaping the environment of citizens and firms.15 Meanwhile, the quality of local governance can vary greatly. Two neighboring Chinese counties pursued “developmental” versus “predatory” economic policies when their leaders responded to different cadre management incentives (Bulman 2015). For Vietnam, firm survey data from the so-called Provincial Competitiveness Index (PCI) suggests large but gradually declining variation in the business environment across provinces (Figure II.A.4).
Local policy experiments have played a central role in “discovering growth strategies” both in China and Vietnam. In the case of China, Coase and Wang argue that the “secret ingredient” of the country’s development has been a willingness to “seek truth from fact” (Coase and Wang 2012, 2) through experiments and competition between local governments (Hofman and Wu 2009). This was done “using regional pilots and motivating regional competition to identify successful policies, that were then implemented at broad scale” (Malesky and London 2014, 408).
Vietnam’s early “fence-breaking” attempts highlight how local innovations interacted with internal consensus-building processes in paving the way for the Doi Moi process. This involved a slow process of gradually convincing senior party members (Rama 2008).16 For example, dividing land among individual households was initially piloted by a commune (Doan Xa) in Haiphong Province in the late 1970s. The commune’s success in multiplying harvests spurred the province’s party secretary to convince members of the Party Central Committee, one at a time, resulting in a 1981 consensus to officially endorse the “contracting approach” for the entire country.
Importantly, these processes of local experimentation and scale-up through consensus have often resulted in policies that deviate from Western models. China’s TVEs of the 1980s have become a landmark example
14 As Hofman and Wu (2009) highlight, a related growth-critical element of China’s state capacity has been anticorruption policies that largely prevented abuse of office.
15 Jean Oi’s (1999, 99) “local state corporatism,” for example, highlights that local governments in China act like developmental states, using a “combination of inducements and administrative constraints characteristic of a state corporatist system” to both encourage and control the private sector.
16 More generally, the process of economic reform in China and Vietnam (after Doi Moi) is often referred to as “gradualism,” described, for example, by Qian (2003, 330) as the adoption of “feasible, imperfect” transition institutions in small steps.
Figure II.A.4. Minimum, median, and maximum PCI scores in Vietnam, 2006–14 (rated on a scale of 0 to 100)Provincial competitiveness index score
90
80
70
60
50
40
30
20
10
0
2006 2007 2008 2009 2010 2011 2012 2013 2014
52.455.6 53.5
58.3 58.0 59.556.5 57.8
58.6
Source: Malesky 2015, 7.
EAST ASIA AND PACIFIC ECONOMIC UPDATE APRIL 2016
90 PART II. MEDIUM-TERM DEVELoPMENT AGENDA

of this. By providing assurance against expropriation, they encouraged investment and facilitated growth, in the absence of secure property rights. Indicators designed to assess first-best solutions, such as the “rule of law,” are thus at risk of capturing an incomplete and overly pessimistic picture of actual economic governance in countries like China.
Finally, many EAP countries continue to struggle with balancing local government autonomy with accountability. Decentralization processes have come later to EAP than to many other parts of the world (World Bank 2008, 33). In China, the challenges of ensuring central control over local agents are long-standing and proverbial: “heaven is high and the emperor is far away”; or “the center has measures, and those below have counter-measures” (Wang 2013, 416). Yet, accelerated economic, social, and environmental change over the last decades has also generated pressures for gradual adjustments to central-local accountability relationships. By contrast, Indonesia’s big bang decentralization in 2001 was part of its democratic transition and involved dramatic changes in the organization of government. This may have increased corruption in the short and medium term (McIntyre 2001), since local accountability and capacity remained weak and the risk of local state capture high.
Ì Implications for measuring governance
In light of these explanations, this note argues that the Asian paradox may largely be a matter of inappropriate measurements. Broadly used governance indicators poorly capture governance institutions that distinguish East Asia from other regions: that is, the effectiveness of intraparty accountability mechanisms and high levels of state capacity. Rather, such measures have focused on governance institutions that work or worked poorly in East Asia’s rapidly growing single-party states. For example, measures like the Worldwide Governance Indicators (WGI) or Polity have focused on mechanisms of electoral accountability or the rule of law. The notion of an East Asian paradox may thus largely be driven by inappropriate governance measures, rather than by a reality that defies explanation.
These explanations do not necessarily imply, however, that state capacity and intraparty accountability cansufficeforsustaininggrowthbeyondmiddle-incomestatusinEastAsia.The trajectories of the Republic of Korea and Taiwan, China and the precedents of most high-income countries suggest that sustaining growth beyond middle-income levels is strongly associated with a democratic opening of political institutions. “Even though extractive institutions can generate some growth, they will usually not generate sustained economic growth and certainly not the type of growth that is accompanied by creative destruction” (Acemoglu and Robinson 2012, 94). Focusing on administrative institutions, the remainder of this note argues that strengthening government responsiveness to firm and citizen needs—as an aspect of state capacity—will be a critical element of sustaining growth in the region.
Meanwhile, recognizing the role of the lack of established governance indicators that could shed light on the East Asian paradox provides a useful guidepost for designing governance indicators that might help governments in the region navigate middle-income status. First, it highlights the risks of missing the point by measuring institutional form rather than function.17 As argued, by focusing on the rule of law and electoral accountability—that is, Western-inspired checks on state authority—existing governance indicators have
17 “Functional” measures capture the de facto performance of public institutions and not specific legal, organizational, or institutional forms.
GROWING CHALLENGES
II.A. GoVERNANCE FoR SUSTAINED GRoWTH IN EAST ASIA AND PACIFIC: PRIoRITIES AND INDICAToRS 91
insufficiently captured other, more informal mechanisms that have enabled credible commitments by leaders and a public goods orientation and that have helped protect property rights. Focusing on measures of institutional functioning rather than specific forms is therefore an important guiding principle.
Second, the paradox highlights the importance of better measures for state capacity. There is a growing consensus that such measures ought to focus on the de facto functioning (and not the de jure institutional forms) of the state, and it is widely agreed that they ought to be clear and replicable.18 It however remains a contested question19 whether measures of state capacity ought to focus on ends, that is, on what the state produces (outputs and outcomes), or on the means for exercising authority, that is, on how governments function (in terms of inputs, and the de facto functioning of procedures and systems).20
This note takes the view that both “means” and “ends” measures are complementary tools in the hands of policy makers for strengthening state capacity. On the one hand, measures of “means” provide governments with actionable pointers for strengthening specific public management systems,21 including how they manage human resources, plan investments, manage public money, or draft regulations. The Public Expenditure and Financial Accountability (PEFA) framework and the Tax Administration Diagnostic Assessment Tool (TADAT) are well-known examples of assessment tools that provide such metrics, whereas comparative measures of administrative capacity are lacking. The strength of China’s bureaucracy, for example, can hardly be understood without capturing the respect for meritocracy and performance that its cadre management system instills in bureaucrats.
On the other hand, measuring state capacity in terms of ends focuses attention on what ultimately matters. Measures such as Vietnam’s Provincial Competitiveness Index can serve EAP governments as action-worthy “performance thermometers,” providing feedback on their success in improving the business environment. The role of local experimentation in China and Vietnam suggests that such performance indicators are particularly useful if they are regionally disaggregated within each country, to capture variations in subnational governance and to measure the success of local experiments. Not least, such measures avoid the above-mentioned risk of looking for institutional forms that may not fit a country’s particular context (Andrews 2010).22
For these reasons, Fukuyama argues that “existing qualitative measures are woefully inadequate” for “evaluating the quality of governance in large, complex countries like China or the United States” (Fukuyama 2013, 363). Widely used country-level measures of state capacity like the Worldwide Governance Indicators’ government effectiveness score or the International Country Risk Guide (ICRG) fail to meet the above standards on several accounts, in part because they were primarily designed for use by investors and development
18 Indicators are “replicable” if the methodology used yields consistent results across different assessors, and if it is transferable across cases and contexts. Indicators are “clear” or “transparent” if the object of measurement is well defined.
19 See, for example, Andrews 2010; Fukuyama 2013; Holt and Manning 2014; and Rothstein 2014.
20 Importantly, both “ends” and “means” measures can capture institutional functioning, rather than form. Ends measures are inherently functional, since they focus on outcomes or outputs. Under-five mortality rates are an example. Functional “means” measures are, for example, the variance in expenditure composition by program, administrative, or functional classification (PEFA 2016, PI-2.1.), or the frequency of in-year adjustments to budget allocations for line ministries, departments, or agencies (PEFA 2016, PI-21.4), reflecting whether budgeting systems provide line agencies with predictable resource flows.
21 With several partners, the World Bank has recently undertaken an effort to build consensus around a set of existing Indicators of the Strength of Public Management Systems (ISPMS). These include “means” indicators that meet agreed-upon quality standards (for example, reflect de facto behaviors and are actionable, action-worthy, and replicable). ISPMS capture five main functions of central government agencies: public financial management, tax administration, public administration, the civil service, and public information. For further information, refer to the ISPMS website (http://go.worldbank.org/99F3LCSFR0).
22 Such measures risk missing the point—and in the worst case might make more aid-dependent countries in the region mimic such institutions and attempt to “look like Denmark,” for the sake of legitimacy in donors’ eyes (Andrews 2010).
EAST ASIA AND PACIFIC ECONOMIC UPDATE APRIL 2016
92 PART II. MEDIUM-TERM DEVELoPMENT AGENDA

partners, not for policy makers.23 Based on aggregation of survey measures or expert assessments, it is not clear what aspects of state capacity they measure.24 They do not point to actionable entry points for reform, nor is improving a country’s ranking on these indicators an unambiguously action-worthy objective. Not least, the measures of bureaucratic quality do not reflect variation across sectors and regions.
Seeking to explain the Asian paradox helps direct attention to undermeasured aspects of governance, in particular, state capacity. But even more important than explaining rapid growth to middle-income status, governance indicators should be suited to help EAP governments navigate a central challenge that many economies in the region face today: How to sustain growth beyond the middle-income level? Which governance institutions matter particularly to this end, and how to measure them? In order to spur debate on how to better measure governance in EAP, the following section will point to specific institutional aspects that merit better measurement—and to promising examples of emerging governance indicators that may help countries design governance institutions beyond the middle-income level.
Lookingforward:measuringgovernanceforgrowthatthemiddle-incomelevel
Ì Governance for growth policies in middle-income countries
As a result of their past growth performance, almost all economies in the Association of Southeast Asian Nations (ASEAN) have reached middle-incomestatus.25 Between 1971 and 2011, most ASEAN countries outperformed countries with similar income levels (Figure II.A.5). But looking forward, “the jury is still out as to whether middle-income ASEAN countries like Indonesia, Malaysia, the Philippines, Thailand, or Vietnam can expect to replicate the growth experience of the Asian Tigers, or whether they will follow the trajectories of Latin America” (Gill and Kharas 2015, p. 4). Growth has slowed markedly for many middle-income countries (MICs) the world over (Spence 2008, 83).
23 For a systematic critique of these indicators, see Arndt and Oman (2006).
24 Even when disaggregating these indicators, clarity of what is measured remains poor. The ICRG expert assessment of “bureaucracy quality,” for example, (which also underlies the WGI “Government Effectiveness” indicator), is defined as follows: “high points are given to countries where the bureaucracy has the strength and expertise to govern without drastic changes in policy or interruptions in government services. In these low-risk countries, the bureaucracy tends to be somewhat autonomous from political pressure and to have an established mechanism for recruitment and training” (Political Risk Services Group 2011).
25 By 2013, China, Malaysia, and Thailand had reached upper-middle-income status, and Cambodia, Indonesia, Lao PDR, Mongolia, the Philippines, and Vietnam had reached lower-middle-income status.
Figure II.A.5. A middle-income trap for EAP’s emerging economies?Relative GDP per capita to US, 2011 [in LN (in percent)]
6
5
4
3
2
1
0
0 721 3 4 5 6
AGO
ALB
ARG
ATG
AUSAUSAUT
BDI
BEL
BEN
BFA
BGD
BGR
BHR
BHS
BLZ
BMU
BOL
BRA
BRB
BRN
BTN
BWA
CAF
CAN
CHECHE
CHL
CIV
CMR
COD
COG
COL
COM
CPV
CRI
CYP
DEU
DJI
DMA
DNK
DOM
ECUEGY
ESP
ETH
FINFRA
GAB
GBR
GHA
GIN
GMB
GNB
GNQ
GRC
GRD
GTM
HND
HUN
IND
IRL
IRN
IRQ
ISLISRITA
JAM
JOR
KEN
KNA
KWT
LBN
LBR
LCA
LKA
LSO
LUX
MAC
MAR
MDG
MDV
MEX
MLI
MLT
MOZ
MRT
MUS
MWI
NAM
NER
NGA
NLD
NOR
NPL
NZL
OMN
PAK
PAN
PER
POL
PRT
PRY
QAT
ROU
RWA
SAU
SDN
SEN
SLE
SLV
STP
SUR
SWE
SWZSYR
TCD
TGO
TTO
TUN
TUR
TZAUGA
URY
USA
VCT
VENZAF
ZMB
ZWE
KHM
KORTWN
JPN
CHN
VNMLAO
IDN
THA
MYS
MNGPHL
SGP HKG
FJI
Relative GDP per capita to US, 1971 [in LN (in percent)]
Q Asian tigers and Japan Q EAP single-party states Q EAP transitioning
Q Other regions Q other EAP
Sources: Authors’ compilation based on PWT 8.1 data and Gill and Kharas (2015).Note: For presentational purposes, the axes in this figure report the natural logarithm (LN) of the respective country’s GDP per capita as a percent of the U.S. GDP per capita in the same year. For example, a country with a value of “2” on the horizontal axis in 1971 had a GDP per capita equal to e2=7.39 percent of the U.S. GDP per capita in 1971. This figure defines a “middle income country” as a country with a per capita GDP that ranges between 5 and 40 percent of the U.S. per capita GDP in the same year (based on PWT 8.1. measures of expenditure-side real GDP). This relative definition differs from the standard World Bank country classification. Some countries may therefore not be shown in their standard World Bank income class.
GROWING CHALLENGES
II.A. GoVERNANCE FoR SUSTAINED GRoWTH IN EAST ASIA AND PACIFIC: PRIoRITIES AND INDICAToRS 93
TheobservationmadeamongothersbySpence(2011)26 that “many countries remain in a narrow [middle-income]bandoverlongperiodsoftime”(highlightedinredinFigureII.A.5)hasledsomeobservers27 to speak of a “middle-income trap.” The 2012 World Development Report on Jobs, for example, notes that out “of 101 middle-income economies in 1960, only 13 had graduated to high income (HI) by 2008” (World Bank 2012, 12). Whether growth slowdowns are more likely for MICs than for high- or low-income countries remains contested.28
Initsmostwidelyacceptabledefinition,themiddle-incometrapcanbedefinedasa“trapofignoranceabout the nature of economic growth” in MICs (Gill and Kharas 2015, 4, 10). Growth at the middle-income level is “less understood, and certainly less studied” (Spence 2008, 83) than at the low-income level.29 This lack of well-established theory for guiding growth strategies at the middle-income level makes an attempt to identify relevant governance indicators necessarily somewhat speculative. But there are useful guideposts for identifying relevant policy domains and the underlying governance arrangements. One is to look at the emerging consensus in the literature on the policy transitions that are considered essential for sustaining growth at the middle-income level. A second is to look at the precedents of Japan and the Asian tigers.
Overall, there is consensus that sustaining growth at the middle-income level requires a shift in strategy. Countries cannot simply continue to follow the recipes that helped them attain middle-income status. The removal of barriers to entrepreneurial efforts and the reallocation of labor from low- to high-productivity activities has been a major driver of growth and industrialization in many ASEAN countries. However, at the middle-income level, policies are called for that facilitate more capital- and skill-intensive growth (“moving up the value chain”), and the innovation and differentiation of the product space.
TheexampleoftheAsiantigersisfirstandforemostassociatedwiththeroleindustrialpoliciesplayinthe pursuit of export-led growth. The Asian tigers’ precedent suggests that “growth will be faster the greater the degree to which the subsidy allocation process is disciplined and tied to performance standards” (Amsden 1991, 285). More generally, “there is some support for the notion that industrial policy becomes more important in middle-income countries in managing the transition to greater technological sophistication” (Gill and Kharas 2015, 12). How well are today’s MICs in East Asia doing in exercising such “discipline of capital” in their industrial policies (Amsden 1991, 284), and how do we measure that?
Second, the Asian tigers’ growth trajectories point to the importance of major investments in human and infrastructure capital for enabling total-factor-productivity-led growth. A case in point is the role of Taiwan, China’s Industrial Technology Research Institute (ITRI), the government’s premier research center devoted to the high-tech industry, which by 2000 had produced more than 15,000 professionals, most of whom worked in the industry. Similarly, investments in infrastructure have been central. This raises the question of how well today’s MICs in East Asia are managing to target their public investments to growth-critical areas.
26 Cited after Gill and Kharas (2015, 8).
27 For a recent survey of the literature on the middle-income trap, see Gill and Kharas, 2015.
28 Whereas, for example, Eichengreen et al. (2013) and Aiyar et al. (2013) find evidence in support of a higher likelihood of growth slowdowns at the middle-income level, Im and Rosenblatt (2013) and Bulman, Eden, and Nguyen (2014) find little support for this claim.
29 Other recent surveys of the debate on the middle-income trap come to similar conclusions. Aiyar et al. (2013, 13) for example conclude that “there is virtually no theory about why and how middle-income economies may be different.”
EAST ASIA AND PACIFIC ECONOMIC UPDATE APRIL 2016
94 PART II. MEDIUM-TERM DEVELoPMENT AGENDA
KharasandKohli(2011)pointtodecentralizedeconomicmanagementasathirdtransition.Recognizing that decentralization involves major challenges and is not necessarily the right choice for all contexts, their central argument is that speedy decision making and the processing of large amounts of information to inform policy making is easier to achieve in decentralized than in centralized systems (Kharas and Kohli 2011, 287). This argument is less associated with the Asian tigers, which are mostly relatively small island states, but clearly is a major challenge for East Asia’s large MICs, such as China, Vietnam, Indonesia, or the Philippines. How do you measure the effectiveness of decentralized economic management in East Asia’s MICs?
This section explores relevant metrics of state capacity for these three selected policy domains, capturing both the functioningoftherelevant(administrative)institutions(“means”)andtheoutputsandoutcomestheyproduce (“ends”).How to improve government responsiveness to firm and citizen demands is a central challenge to these policy domains. “When a country is far behind the leading economies, it is very clear what you have to do, so you can run things like an army” (Philippe Aghion, as cited by Spence 2008, 83). But as an economy catches up, it becomes “less obvious what it should make and where its prosperity lies. More must be left to the bets of private investors and the collective judgment of the market” (Spence 2008, 83). As economies and societies become more complex, governments need to listen to the demands of an increasing number of stakeholders and nimbly respond to them to fuel discovery and innovation. But responsiveness can also easily be misdirected and undermine growth, if it responds to elite interests or is driven by clientelistic politics.
The focus on administrative institutions begs the question of politics. Whether administrative institutions change or survive in turn depends on societal forces and political institutions. Why, for example, did Korea and Taiwan, China establish developmental states, whereas the Philippines had extractive institutions, until the end of the Marcos regime? Yu (2013, 323), for example, argues that “successful land reform and a state monopoly of violence in the early period of independence”30 were key factors that influenced these different paths. More generally, Doner and Schneider (2015) argue that the middle-income trap is political. Based on a comparison of nine MICs, mostly in Latin America, they argue that the conditions that facilitated ascension to middle-income status—including foreign investment, inequality, and informality—“over time generated cleavages that impede upgrading policies and building the institutions necessary to implement them” (Doner and Schneider 2015, 5). But does this argument extend to East Asia’s MICs, which are, on average, much more equitable31 than MICs in Latin America, to point out only one difference?
Afirstorderquestion is certainlywhich featuresof thepoliticsofMICsbestpredict their chancesofadopting and sustaining the institutions required for ascending to high-income status—and how to measure those features. One such feature may be the existence of institutionalized political parties, as argued in the preceding section. While recognizing the relevance of governance metrics that capture political institutions and underlying societal forces, this note pursues a different and more modest objective. It explores two types of indicators of state capacity that focus on the functioning of the public management systems (“means”) of EAP countries and on the results they deliver (“ends”).
30 Yu (2013, 323) argues that in Korea and Taiwan, China, successful land reform “reduced the influence of the landed class and laid the foundation for an open access economy.” By contrast, in the Philippines, failed land reform helped the “landed oligarchy to maintain and expand its wealth and power, and the economic machinery was routinely hijacked by the powerful landed and business elites.” High inequity entailed the continuation of insurgencies based on peasant grievances.
31 It is commonly argued that clientelism—that is, “exchanges of particularistic goods (patronage) between wealthy and poor, powerful and powerless”—thrives under conditions of poverty and inequality (Doner and Schneider 2015, 21).
GROWING CHALLENGES
II.A. GoVERNANCE FoR SUSTAINED GRoWTH IN EAST ASIA AND PACIFIC: PRIoRITIES AND INDICAToRS 95

Measuresof“systemresponsiveness”(asasubsetof“means”measures)capturethesuitabilityofpublicmanagement systems for responding effectively to firm and citizen needs. Such measures are typically actionable, that is, MIC governments can improve them directly by investing in these institutions. “Performance thermometers” (or “ends” measures) capture the results produced by these institutions, that is, they measure how well EAP governments are doing in responding to firm and citizen needs. These measures are typically unambiguously action worthy, but not necessarily actionable.
Ì Transition I. Industrial policy for self-discovery
Governance of industrial policy
The Asian tigers’ ascent into the ranks of industrialized countries is largely due to export promotion policies(forexample,forthechaebols32 in the Republic of Korea and the garment industry in Taiwan, China).The tigers have set the precedent, prompting some economists to argue that sound industrial policy is essential to a process of “self-discovery” (Rodrik 2008, 101).33 One major rationale is that markets can fail to reward entrepreneurs fully for the social value of their innovations.34 Innovations may not be profitable, because competitors can quickly imitate them and drive down prices. Since most innovations in MICs consist of “tinker[ing] with technologies from established producers abroad and adopt[ing] them to local conditions” (Rodrik 2008, 105), entrepreneurs lack the protection of patent laws. Temporary “productive rents” are therefore needed to encourage (such) innovation.
However, getting the targeting of these productive rents right raises a fundamental governance dilemma for how bureaucrats relate to businesses. Bureaucrats need to be close to businesses to elicit first-hand, up-to-date information and to ensure that industrial policies respond to the constraints and opportunities that firms face. But such closeness bears the risk of collusion and rent-seeking, and may serve to protect the vested interests of well-connected but unproductive firms, rather than fuel innovation in competitive industries (Rodrik 2008). Finding the right balance between being responsive to firms and maintaining an arms-length relationship (a balance called “embedded autonomy” in Evans [1995]) is thus the central governance challenge in formulating industrial policies that help emerging economies discover their economic capabilities and diversify their products.
The Asian tigers show how delicate and ambiguous this balance can be. The leaders of both Korea and Taiwan, China depended on rent payments from privileged industries to hold together their fragile political coalitions. But at the same time they safeguarded sufficient distance and got the mix of “carrots” and “sticks” right (Wedeman 2012). In Korea, for example, the state exercised tight discipline in penalizing nonperforming chaebols in the 1970s and 1980s. The textile industry grew rapidly in Taiwan, China, long-term in the 1950s, thanks to government subsidies, but the government also tried to prune nonproductive firms (Evans 1995, 57; Wade 1990, 79).
FormanyEAPemergingMICs,findingthisbalanceanddesigningappropriateindustrialpolicy-makingprocessesremainsanongoingstruggleandpotentialobstacletosustainedgrowth,despitesignificant
32 Chaebols are a form of large, export-oriented business conglomerates that have played a central role in the industrialization of the Republic of Korea.
33 However, the evidence in favor of such policies remains ambiguous and the subject of debate (Spence 2008, 48).
34 Another rationale is “co-ordination failures” among connected industries (Rodrik 2008).
EAST ASIA AND PACIFIC ECONOMIC UPDATE APRIL 2016
96 PART II. MEDIUM-TERM DEVELoPMENT AGENDA

government efforts. For example, China’s state-led urban boom in the 1990s has been described as “rooted in a technocratic industrial policy blueprint,” and associated with a slowdown in total factor productivity growth, in contrast to the successful rural experiments in the 1980s (Huang 2008, xv).
Vietnam’s attempt to imitate the models of Korea’s Samsung or Sony by supporting large heavy industry conglomeratesmay be flawed, because it relies on public rather than private ownership and importsubstitution rather than the creation of competitive export industries (Perkins and Anh Vu 2009). Vietnam’s industrial policy process lacked “creativity and responsiveness in policy making” (Ohno 2009, 34) being closed within government with little involvement from the business community and lacking interministerial coordination. As a result, “Vietnam has reached the point where further progress towards higher income is increasingly difficult without a radical reform in policy formulation procedure and organization” (Ohno 2009, 15). Such warnings suggest that opening the inherited bureaucratic policy formulation processes to more flexible interaction with firms (while protecting them against abuse) needs to be central to the growth strategies of EAP’s single-party states. Responding to this challenge, since 2009, Vietnam has developed and gradually implemented a regulatory management system aimed at systematically consulting with affected stakeholders and estimating impacts of proposed regulation.35
Implications for governance indicators
A number of promising indicator sets are emerging that may help EAP governments improve the governance of their industry policies.
The Economic Complexity Index (ECI) is acontroversial example of a “governance” indicator. Since 2011, it has provided EAP governments with a performance thermometer of how diverse and ubiquitous their economies’ products are, which reflects the “amount of knowledge that is embedded in the productive structure” of their economies (Hausmann and Hidalgo 2014, 27). There can be little doubt that increasing economic complexity is an “action-worthy” goal. Not only does the ECI closely correlate with GDP per capita levels, when accounting for natural resource rents (Figure II.A.6). The ECI’s originators further argue that economic complexity is “not just a symptom” but a “driver” of prosperity: “Countries whose economic complexity is greater than what we would expect, given their level of income, tend to grow faster than those that are ‘too rich’ for their current level of economic complexity”
35 Vietnam launched this reform agenda in 2009, by creating a new quality standard for legal norms through its revised Law on the Promulgation of Legal Normative Documents (Law on Laws). The government has also devoted attention to administrative simplification through the Prime Minister’s Master Plan to Simplify Administrative Procedures in the fields of the State Governance (“Project 30”) and other initiatives. Since 2011, the Program for Enhancing Regulatory Quality (PERQ) has aimed to help decision makers eliminate regulations “that impose unnecessary costs on the community, impede innovation, and stifle competitiveness” (APEC 2011, 194).
Figure II.A.6. Economic Complexity Index and GDP per capita, 2013GDP per capita (in logs, constant 2005 US$)
12
10
8
6
-2 -1 0 1 2
AGO
AZE
BOL
CHL
COG
ECU
ETH
GAB
GHA
GIN
IRN
KAZ
KWT
MRT
NGA
OMN
QAT
RUS
SAU
SDNSDN
SYR
TKM
TTO
UKR
UZB
VEN
YEM
ZMB
ALB
ARG
AUSAUSAUT
BEL
BGD
BGR
BIH
BLR
BRA
BWA
CAN
CHECHE
CIV
CMR
COL
CRI
CZE
DEUDNK
DOM
EGY
ESP
EST
FINFRA
GBR
GEO
GRC
GTM
HND
HRVHUN
IND
IRL
ISR ITA
JAM
JOR
KEN
LBN
LKA
LTU
LVA
MAR
MDA
MDG
MEX
MKD
MOZ
MUS
MWI
NAM
NLD
NOR
NZL
PAK
PAN
PER
POL
PRT
PRY
ROU
SEN
SLV
SRB
SVK
SVNSVN
SWE
TUN
TUR
TZA UGA
URY
USA
ZAF
ZWE
KHM
KORJPN
CHN
VNMLAO
IDN
THA
MYS
MNGPHL
SGPHKG
Economic complexity index (2011)
Q Asian tigers and Japan Q EAP single-party states Q EAP transitioning Q other EAP
Q NRR>=15% of GDP Q NRR<15% of GDP ▬ Fitted values
Source: Authors’ calculation, based on the Economic Compexity Index (http://atlas.cid.harvard.edu/rankings); and World Development Indicators (WDI).
GROWING CHALLENGES
II.A. GoVERNANCE FoR SUSTAINED GRoWTH IN EAST ASIA AND PACIFIC: PRIoRITIES AND INDICAToRS 97

(Hausmann and Hidalgo 2014, 27). In EAP in 2013, in particular, China, the Philippines, Thailand, and Vietnam had achieved “economic complexity” beyond what their income level would predict.
The ECI’s “action worthiness” as an outcome measure comes at the price that it is not directly “actionable.” Economic complexity clearly cannot easily be manipulated through a narrow set of decisions or industrial policy alone. But mapping their product spaces may help EAP governments assess their productive capabilities and identify strategic opportunities for growing them. Several countries in EAP have successfully improved their ECI over the last decade, including China and Vietnam, despite policy shortcomings. By contrast, Mongolia’s natural-resource-driven growth, for example, has been associated with a decline in economic complexity.
Developing more actionable measures of “system responsiveness” that capture the nature of government interactionswithcitizensandbusinessesinpolicymakingischallengingandremainsafieldthatdeservesfurther research. But there are promising steps in this direction. For organisation for Economic Co-operation and Development (oECD) countries, the oECD’s 2015 Indicators of Regulatory Policy and Governance (iREG)36 provide the latest generation of metrics that capture the way governments regulate, drawing on a detailed survey of government officials.37 In June 2015, the World Bank’s Citizen Engagement in Rulemaking (CER) project released the first set of such indicators with global reach, covering 185 countries. Drawing on surveys of experts in both the private and public sector, the CER indicators measure whether governments publish and consult on new regulations, conduct regulatory impact assessments, and rely on technology in the rulemaking process.38
These new measures may help EAP governments compare their rulemaking practices to those of other countries. However, this first generation of CER indicators also highlights the trade-offs involved in designing comparative indicators. For now, they capture whether specific practices in transparency and consultation exist in principle, but they do not reflect the quality of that engagement or of regulatory impact assessments. Consequently, some countries may score higher than others on the CER indicators that have some consultative practices in place (Figure II.A.7), but may not yet apply them effectively to improve the quality of regulation.39
36 www.oecd.org/gov/regulatory-policy/measuring-regulatory-performance.htm.
37 This indicator set provides composite measures of the oversight and quality control; transparency; systematic adoption; and methodology of citizen engagement in the regulatory process, regulatory impact assessments, and systematic ex post-evaluations.
38 The CER score captures whether regulators (a) publish the text of proposed regulations before their enactment, (b) publicly request comments on proposed regulations, (c) report on the results of consultation processes publicly, (d) conduct regulatory impact assessments of proposed regulations, (e) have a specialized government body tasked with reviewing regulatory impact assessments, and (f) distribute the results of regulatory impact assessments publicly. Also considered was how the government completes each action. Two of the six subindicators (conducting regulatory impact assessments of proposed regulations and having a specialized government body tasked with reviewing regulatory impact assessments) have a simple binary scoring of either 1 (the highest score) or 0 (the lowest score). For the other four subindicators, different answers are assigned different scores, depending on their reflection of good practices. The scores of subquestions also range from 1 to 0, with possible interim values of 0.8, 0.6, or 0.2.
39 For instance, Lao PDR received a relatively high CER score in 2015 because it has a fully functional website on which proposed regulations are published and the general public can send comments (http://www.laoofficialgazette.gov.la/). This was developed following 2012 legislation (Law on Law Making 2012) mandating a formal public consultation process.
Figure II.A.7. Transparency, consultation, and impact assessment practices in the rulemaking processes in selected EAP countriesScore, 0–7
7
6
5
4
3
2
1
0
HKG SGP VNM MYS TWN LAO THA IDN CHN MMR PHL KHM
J Transparency and consultation score J Impact assessment score
Source: Citizen Engagement in Rulemaking dataset; http://rulemaking.worldbank.org.
EAST ASIA AND PACIFIC ECONOMIC UPDATE APRIL 2016
98 PART II. MEDIUM-TERM DEVELoPMENT AGENDA

Such benchmarks may serve EAP governments as a starting point for more in-depth diagnostics of their regulatory management systems and for designing reforms. Malaysia, for example, has responded to this challenge by adopting a new regulatory policy. It has established a committee of senior government officials chaired by the Chief Secretary to the Government to act as a gatekeeper for new regulations and to improve the quality and process of regulatory impact assessments. National efforts to develop more in-depth indicators may provide EAP governments with useful precedents. For example, the Australian Productivity Commission developed detailed indicators of the quality of regulatory processes in Australia’s states in 2008,40 drawing on a survey of state government regulatory officials (Commonwealth of Australia, Productivity Commission 2008).
Ì TransitionII.Publicgoods:theexampleofinfrastructure
Governance of infrastructure investments
Investing in broad public goods is critical at the middle-income level, including in infrastructure.41 Transport infrastructure investments can be critical for granting firms access to markets and for mitigating regional growth and income disparities. For example, in Vietnam, poor transport infrastructure has contributed to the concentration of most industry in and around the Hanoi-Haiphong area and Ho Chi Minh City, while large parts of the country have received little industrial investment (Perkins and Anh Vu 2009, 32) or, in some cases, investment was in a project portfolio that did not optimize socioeconomic returns. In Indonesia and the Philippines, “large infrastructure gaps” including roads and ports (World Bank 2015, 8) are broadly recognized as binding growth constraints (ADB 2007, 2009).
AcommonrootcauseoftheinfrastructureshortagesinEAP’semergingdemocraciesispolitical:mobilizingvotesoftenmotivatesmembersofParliamenttospreadinvestmentsthinly,targetspecificconstituencies,andawardcontractstofirmsthathelpthemfinancetheircampaigns.Although responding to the interests of their particular clientele is rational for individual MPs, such “pork barrel politics” are typically suboptimal for the country as a whole. Especially if political parties are weak, they can entail neglect of strategic national-level investments in public goods, ultimately turning public money into private goods transferred to targeted constituencies.
The symptoms of such political incentive problems are palpable across the region. In Mongolia, for example, MPs have “incentives to overspend on smaller projects that bring benefits to specific geographic localities and to underspend on large infrastructure that would bring economic benefits to Mongolia on the whole” (Hasnain 2014, 5), such as developing the southern Gobi mines. In Indonesia, the decentralization of infrastructure investment budgets to provincial and district governments has fragmented planning capacity and made local investments politically driven (World Bank 2011). In the Philippines, after democratization in 1986, the executive’s control over lump-sum allocations (for local infrastructure projects, among other things) allegedly became the “epitome of pork barrel politics” (Noda 2011, 7), serving as a key instrument for the executive to influence parliamentarians’
40 These indicators capture, for example, the percentage of new regulatory proposals “subject to mandatory public consultation,” “subject to RIA [regulatory impact assessment],” and “with quantitative estimates of business compliance cost.” They also capture whether these cost estimates are made public, the existence of a “gatekeeping mechanism” that prevents noncompliant proposals from proceeding, and whether “independent assessments of plain English drafting” are in place.
41 The same holds for investments in education. To meet this growing demand tomorrow, EAP governments are called upon to make long-term investments into education systems today (East Asia and Pacific Economic Update, October 2014).
GROWING CHALLENGES
II.A. GoVERNANCE FoR SUSTAINED GRoWTH IN EAST ASIA AND PACIFIC: PRIoRITIES AND INDICAToRS 99
decisions and rally support for legislative projects. The popular expression “bagi” (“to spread”) describes MPs’ common habit of sprinkling investment funds thinly across barangays.
Under President Benigno Aquino III’s leadership, the Philippine government pushed strongly for boosting thecountry’sroadinfrastructureandforenhancingfiscaltransparencyaspartofitsOpenGovernmentinitiative.42 Several examples from the Philippines highlight how innovative uses of governance data can help monitor and contain the effects of pork barrel politics.
Implications for governance indicators
Governments’ own administrative procurement records often represent a valuable and underutilized source ofdataformeasuringinefficienciesininfrastructurecontracting.The Philippines’ Project Monitoring System (PMS), implemented by the Department of Public Works and Highways (DPWH), provides an excellent example. This electronic database symmetrically tracks the size of district work projects, the firms that are awarded contracts and cost- and time-overruns, among other variables. Such data can yield simple but telling indicators. The data base has enabled the DPWH to track the proliferation of many inefficiently small projects, such as road works, and take remedial action, while planning for sustainable solutions, such as clustering of small projects initially. Mapping out which firms win projects in which districts can show whether markets are localized or whether public works contracts successfully attract out-of-district competitors. More generally, using and integrating different existing and often underutilized administrative data sources43 has significant promise for developing new governance indicators, without costly primary data collection efforts.
Another example of a performance thermometer is the Philippines’ Open Roads project. With Open Roads, the Philippine government is leveraging the power of citizen monitoring and crowd-sourced data for road investments. Open Roads, which aims to be fully operational by 2016, is an interactive, online, open government platform that is seeking to digitally map the entire road network and track associated priority public investment projects. It focuses on major national financing programs for “last mile access”—that is, local road programs that enhance agriculture, tourism development, and basic community access. The first phase has been to encourage implementing agencies, and local governments, to actually track and disclose decentralized road projects at the implementation and—ultimately—planning stages. By bundling fragmented data about road projects in a single location, it makes investment decisions transparent to citizens and enables them to monitor the quality of project execution by uploading geocoded mobile-phone images of road works.
Open Roads is no silver bullet, given the magnitude of infrastructure delivery challenges in the Philippines. Despite transparency, pork barrel politics may well prevail in the targeting of road investments. But Open Roads and similar programs can make a significant contribution toward ensuring that promised investments are actually executed. It remains to be seen to what extent more systematic transparency at the level of road contracts will
42 Following a ruling by the constitutional court, President Aquino only recently abolished one of these pork barrel funds, the so-called Priority Development Assistance Fund (PDAF). The PDAF was meant to fund, among others, local development projects such as schools, health centers, and road construction. The PDAF’s predecessor was the Countrywide Development Fund (CDF). During the Ramos administration, thecontrol over the disbursement of the CDF is said to have been extensively used by the president to sustain his political influence over the legislative body (Noda 2011, 7).
43 Using administrative data can however involve significant challenges, especially regarding cleaning and proper matching of different sources.
EAST ASIA AND PACIFIC ECONOMIC UPDATE APRIL 2016
100 PART II. MEDIUM-TERM DEVELoPMENT AGENDA

counteract local elite capture and fragmentation of road projects, notably by crowding in citizen and private sector feedback.
In the Philippines and other emerging democracies in East Asia and Pacific, institutionalized publicinvestment (and procurement) systemswill ultimately be needed to help elected officials collectivelyinvest in national infrastructure needs, responding to national interests, rather than local clienteles. By helping elected officials to “collectively tie their own hands,” these institutions can create confidence among political competitors that such large-scale projects will not be exploited by a select few political winners (by claiming credit for them, or targeting contracts to connected firms) (Hasnain 2014).
Korea has set an example in the region for designing a politically pragmatic public investment management system (PIMS). The Korean Development Institute (KDI) acts as the system’s central gatekeeper. It ensures that proposed investment projects (above a certain threshold) are subject to cost-benefit analysis. However, its “multicriteria” analysis also comprises an assessment of “balanced regional development,” providing a managed space for political influence (Taliercio 2014), given strong pressures for spreading public investment across the country. Thus, though political views on subnational development are considered, the economic criterion drives the result (with a weight of 50 percent in the final analysis). Korea’s highly centralized system is only one model, and other countries (for example, Chile) have successfully adopted systems that are technically sound while ensuring that political influence is accommodated, but reined in by tight regulations. Whichever examples EAP governments choose to look to, strengthening their PIMS will certainly be key for ensuring that their infrastructure investments respond to economic necessity rather than to the electoral strategies of individual elected officials.
InstrengtheningtheirPIMS,EAPgovernmentsmayfindithelpfultoassessthestrengthsandweaknessesof their systems along the PIM chain with the help of comparative/standardized indicator tools. To assist client governments in this task, the World Bank is currently deepening its analytic and operational engagement based on evidence from PIM work in 60 countries and emerging diagnostic tools. Specifically, the World Bank is developing a new PIM diagnostic framework. This set of indicators will support client countries in conducting detailed diagnostics of the PIM system along the project cycle, yielding actionable indicators similar to the PEFA methodology for the budget cycle.
In sum, navigating the middle-income trap requires prioritizing growth-critical, long-term investments in public goods—whether skills-focused education programs or strategic infrastructure projects. Yet, as the example of road infrastructure investments has shown, political incentives in the region’s emerging democracies risk being geared against these investments, targeting small projects with limited, short-term benefits to their constituents, rather than the common good.
Governance indicators can play an important role in shifting this balance. How and where investments are channeled and how projects are executed can be made transparent through administrative or crowd-sourced data (performance thermometers), in turn strengthening voters’ ability to pressure elected officials to make the right choice. In addition, comparative indicator sets can help countries diagnose their system responsiveness and help identify actionable entry points for strengthening their PIM systems.
GROWING CHALLENGES
II.A. GoVERNANCE FoR SUSTAINED GRoWTH IN EAST ASIA AND PACIFIC: PRIoRITIES AND INDICAToRS 101

Ì Transition III. Decentralized economic management
Governance of local autonomy
JapanandTaiwan,ChinahaveestablishedaprecedentforsuccessfuldecentralizationinEastAsiaandPacific.Many of the East Asian MICs, including China, Indonesia, the Philippines, and Vietnam, have done the same over the last two decades. Past efforts to decentralize, in principle, put EAP MICs in good starting positions to respond to the demands of their increasingly complex economies.
At the same time, decentralization is not an end in itself and raises new challenges as countries are ascending to middle-income status. In countries both with and without local elections, it has brought to the fore the question of how to balance local government autonomy with accountability and capacity (Fukuyama 2013). The following will focus on local governance challenges facing EAP’s single-party states.44 In particular, in China, “performance metrics” for local cadres have often but not always worked to align local incentives with national goals.
Implications for governance indicators
In particular, China’s environmental and subnational debt management has brought to the fore the fact that hierarchical controls through the cadre management system can be slow to adapt to emerging challenges. A one-sided emphasis on growth, job creation, and stability in performance targets has encouraged local cadres to neglect the longer-term environmental and fiscal implications of their decisions and, in effect, live beyond their means. This has been reinforced by the frequent rotation of local cadres (World Bank and China DRC 2013).
Inresponsetotheseenvironmentalconcerns,inits11thFive-YearPlan(2006to2010),China’scentralgovernment included explicit high-priority quantitative “energy saving, emissions reduction” targets.45 The consequences were instructive: while the targets were officially achieved, principle-agent problems resurfaced throughout their implementation (Wang 2013).
Performance metrics were at the core of the problem. By focusing targets on selected pollutants, other environmental problems received scant attention. Since the public was not systematically consulted in the target-setting process, pollutants that posed high health risks and were of public concern were omitted. In some cases, this engendered a public outcry on blogs and in the media (for example, the 2011 fine particulate matter 2.5 [PM2.5] controversy) (Wang 2013). Some officials unofficially reopened closed factories after achieving the targets, or cadres colluded with firms to falsify emission indicators rather than actually reducing emissions.46
44 In the region’s democracies, such as Indonesia and the Philippines, local autonomy has been associated with mismanagement and corruption during a transitional period, since local government accountability and capacity remain weak (see, for example, McIntyre 2001).
45 Energy saving, emissions reduction targets included mandates for a 10 percent reduction in sulfur dioxide and chemical oxygen demand releases, and a 20 percent reduction in energy intensity (Wang 2013, 368).
46 Complementing increased market and stakeholder pressures, the provincial government has tied the performance ratings to access to Bank loans and to the environmental insurance responsibility premium.
EAST ASIA AND PACIFIC ECONOMIC UPDATE APRIL 2016
102 PART II. MEDIUM-TERM DEVELoPMENT AGENDA

These difficulties in using environmentalmetrics for top-down internal control have led the ChinesegovernmenttoexperimentwithEnvironmentalPerformanceRatingandPublicDisclosure(PRPD)programsas a way of leveraging public pressure against polluters. Evidence from an early PRPD pilot in Jinagsu Province, launched in 2001, illustrates the promise of such approaches. In 10 years, the number of firms with publicly disclosed ratings47 increased more than twentyfold, compliance reached high levels (over 90 percent are today rated positively), and research suggests that the PRPD program in Jiangsu has significantly reduced pollution.48
Successesas inJiangsuProvincehighlightonewayinwhichmetricscanenhancelocalaccountability:by disclosing pollution and emissions metrics, governments can leverage public pressure for holding local cadres and companies to account. China’s 2008 open Environmental Information regulation has been an important milestone in this regard, but more can be done to ensure the systematic release of information.49
While public disclosure is promising, it can only complement top-down accountability. Investing in more comprehensive and reliable metrics for monitoring subnational cadres has to be a second part of the solution.50 The Chinese government’s ongoing efforts to bring all forms of subnational borrowing onto the books and into the light are a case in point. Although the 1995 Chinese Budget Law prohibited subnational borrowing except with State Council approval, subnational governments (SNGs) have found creative ways of borrowing off-budget for infrastructure investments, by leasing land or using state assets as loan securities. off-budget financing has supported large-scale urban infrastructure transformation—but it has also accumulated off-budget liabilities that are estimated to exceed one-third of China’s GDP. Borrowing off the books, combined with short-term growth targets, has created perverse incentives for local officials to spend today at the expense of tomorrow’s generations. “Local officials attempt to use state investments and manipulation to generate spikes in growth directly prior to key promotional periods” (Malesky and London 2014, 410; see also Guo 2009 and Wallace 2014).
By amending its budget law in August 2014, the Chinese government has taken a step toward holding SNGstoaccountnotonlyfortheirgrowth,butalsofortheirfiscalanddebtperformance.Better measures of SNG finances are at the core of the solution. The new law requires SNGs to comprehensively report debt and liabilities, enabling both the central government and citizens to benchmark their performance on a more balanced scorecard, including fiscal indicators. While achieving the law’s ultimate objective of transparent accrual-based comprehensive government financial reporting will be a long journey, drawing on international experiences will help the Chinese government formulate a realistic roadmap for gathering such metrics step by step. The World Bank is advising the Chinese government to this end, drawing on experiences from Australia, Brazil, Canada, and the United States (Liu, Pradelli, and Zhao 2015).
At the middle-income level, better metrics are needed not only to hold local governments to account, but they are also essential tools in the hands of local governments seeking to measure and respond to the
47 “The program rates firms’ environmental performance from best to worst in five colors—green for superior performance, blue for full compliance, yellow for meeting major compliance standards but violating some minor requirements, red for violating important standards, and black for more extreme noncompliance. The primary benchmarks for ratings are China’s emission and discharge standards that specify effluent concentration limits” (World Bank and China DCR 2013, 463).
48 Complementing increased market and stakeholder pressures, the provincial government has tied the performance ratings to access to bank loans and to the environmental insurance responsibility premium.
49 Although China’s open Environmental Information regulation, introduced by the Ministry of Environmental Protection as part of China’s open Government Information initiative in 2008, has made some disclosures mandatory, it has the shortcomings of burdening the government, not firms, with disclosure, and contains no right to disclosure. Consequently, the most polluted municipalities have the weakest disclosure practices (World Bank and China DCR 2013).
50 To check against the falsification of environmental pollution data, the government has used continuous emissions monitoring, enhanced “police patrol” supervision, and satellite technology, enabling researchers to make independent assessments of pollution reductions (Wang 2013, 426).
GROWING CHALLENGES
II.A. GoVERNANCE FoR SUSTAINED GRoWTH IN EAST ASIA AND PACIFIC: PRIoRITIES AND INDICAToRS 103

needsoffirmsandcitizens.Specifically, with its Provincial Competitiveness Index (PCI), which marked its 10th anniversary in 2014, Vietnam has shown the value of firm survey data for helping provincial governments improve economic policies. Born out of the collaboration of the Vietnam Chamber of Commerce and Industry (VCCI), the U.S. Agency for International Development, and researchers from Duke University, it has also set an example for fruitful collaboration among governments, development partners, and academics in developing such measures. To track the business environment across the country’s 63 provinces and over time, the VCCI annually conducts a large-scale representative survey of several thousand firms (Malesky 2015, i) covering 10 dimensions of economic governance.
The PCI has certainly inspired competition among provinces in improving the business environment. Lao Cai Province, for example, has rapidly climbed the ranks of the PCI (from 17th in 2013 to 3rd in 2014) through reform and innovation. It has systematically revised relevant regulations, institutionalized business consultations and, not least, created its own district competitiveness index in order to receive feedback from businesses and other economic actors in district and city governance (Malesky 2015, 10).
The PCI also helps policy makers “benchmark the performance of their provincial government [over time] and identify areas to improve” (Tran Ngoc Anh, as cited by Malesky 2015, iv). For example, since 2004, One-Stop Shops have helped significantly cut the time for registering a company (Figure II.A.8, Panel A). But the PCI also shows personal relationships with government officials becoming more important for doing business (obtaining information, negotiating taxes) in 2014 (Figure II.A.8, Panel B), providing a red flag for potential problems.
Figure II.A.8. Vietnam Provincial Competitiveness Index: The trends of various economic governance indicatorsA. Indicators of entry costs (Wait time to be fully legal), 2006–14 B. Indicators of transparency, 2006–14Percent of firms Percent of firms
30
25
20
15
10
5
0
2006 2007 2008 2009 2010 2011 2012 2013 2014
26
27
22
19
24
15
14
17
10
67
6
4
6
33
4
2
2006 2007 2008 2009 2010 2011 2012 2013 2014
63
57
50
61
7975
62
51
73
61
45
37
41 41 4139 39
49
90
80
70
60
50
40
30
20
10
0
▬ Wait for more than 1 month ▬ Wait for more than 3 months ▬ Relationship necessary to obtain documents
▬ Negotiations with Tax Authority are a necessary part of doing business
Source: Malesky 2015, 19, 23.
Further,firmsurveydatalikethePCIcanhelpaddressoneofthemostfundamentalchallengesEAP’ssingle-party states face. Their inherited consensual decision-making mechanisms may not be sufficiently agile to respond to the dynamic demands of middle-income economies. Making government decision making more responsive requires more than just better data. It may call for more far-reaching measures, such as creating competent policy units and regulatory agencies, and well-staffed (and independent) think tanks and universities (Rama 2008). But PCI-like indicators can help by enabling research and delivering the evidence that local experiments work,
EAST ASIA AND PACIFIC ECONOMIC UPDATE APRIL 2016
104 PART II. MEDIUM-TERM DEVELoPMENT AGENDA

facilitating the acceptance and scale-up of such experiments. By fueling interprovincial competition, they may encourage the spread of governance innovations through imitation (by other provinces), complementing (national) processes of consensus formation.
In sum, better performance thermometers can be a central part of the solution for improving decentralized economicgovernance inEastAsiaandPacific’smiddle-incomecountries.They can help the center hold local governments to account on a more balanced scorecard, as new challenges emerge, such as protecting the environment. Formulating performance metrics can leverage citizen pressure to hold local officials and firms to account, mitigating the rigidities of hierarchical control. Not least, performance metrics like Vietnam’s PCI can become the eyes and ears of local governments, helping them respond to firms’ needs by creating an environment conducive to business.
Conclusion
As East Asia’s emerging economies seek to transcend their middle-income status, the challenges they face, at the core, this note argues, are ones of governance. Sustaining growth requires policy changes, but more fundamentally, it requires that governments change how they formulate and implement policy. By increasing how much—and how well—they respond to the demands of the private sector and civil society, governments will promote innovation and expand economic capabilities.
This note has pointed to the importance of improving government responsiveness, as an aspect of state capacity, in three critical policy domains. First, East Asia’s governments face the challenge of designing industrial policy-making processes that enable them to respond to business needs while at the same time guarding sufficient distance to get right the mix of carrots and sticks facing firms. More broadly, countries in East Asia are gradually embarking on ambitious reforms to establish better governance frameworks for private sector development. Emerging lessons from Malaysia, Singapore, and Vietnam point to the significant benefits of a transparent, accessible, and impact-driven approach to private sector regulation.
Second, designing politically pragmatic public investment planning systems such as Korea’s can help governmentsintheregionensurethatinfrastructureinvestmentsyieldthehighestsocioeconomicbenefitspossible. For the region’s emerging democracies, such systems may help discipline elected officials to respond to national interests, rather than particularistic needs of their constituents. As in the Philippines, engaging citizens and stakeholders in monitoring public investment decisions can complement such top-down planning efforts.
Third, making local governments more accountable to citizens can help compensate for the shortcomings of traditional top-down accountability systems. Beyond these three selected policy domains, East Asia’s governments are taking promising steps to strengthen transparency and public consultation, though in this brief note it is not possible to cover them all. One notable recent development is Vietnam’s new Organic Budget Law (June 2015), decompressing the budget calendar to reserve far more time for quality budget scrutiny by the legislature, and requiring the timely disclosure of budget proposals for public consultation.
GROWING CHALLENGES
II.A. GoVERNANCE FoR SUSTAINED GRoWTH IN EAST ASIA AND PACIFIC: PRIoRITIES AND INDICAToRS 105
For all countries in the region, building the political coalitions that can support and sustain such institutions will be a central challenge, although not addressed in this note. For EAP’s single-party states, the legacy of high state capacity and strong institutionalized parties, a key aspect of Asian exceptionalism, can be both an asset and a challenge navigating this transition. Established processes of internal consensus building may go a long way, but may not be sufficiently nimble to respond to the demands of increasingly complex and volatile economies. Regional experimentation and competition, meanwhile, will continue to help “separate truth from fact” and discover growth strategies.
This note has argued that measures of government responsiveness can play a central role in helping EAP governments navigate these transitions. Such measures should focus on how the state functions rather than on its institutional forms, capture heterogeneity across different agencies and jurisdictions, and be clearly defined and replicable. In particular, two types of measures are promising.
First,performancethermometers(or“ends”measures)canhelptrackwhatthestateproducesforcitizensandfirms. The Economic Complexity Index, for example, captures the development of economic capabilities. Making crowd-sourced performance data publicly available, meanwhile, can help hold elected officials and bureaucrats to account for making efficient use of public investments. Firm surveys (for example, Vietnam’s Provincial Competitiveness Index), can provide local leaders with timely and systematic feedback on how they are doing in improving the business environment. They can promote competition and peer learning among local governments. Not least, such measures can fuel emerging research that explores how variation in local governance affects growth.
Second,measuresofsystemresponsiveness(“means”)canassistgovernmentsinenhancingtheabilityof their systems of public management to effectively respond to the needs of middle-income economies. Measures of “Citizen Engagement in Rulemaking,” for example, can help design responsive regulatory processes. Public investment management indicators can help strengthen investment processes that enable policy makers to tie their own hands and protect strategic investments against pork barrel politics.
These examples illustrate the promise of such governance metrics for helping EAP governments enhance theirresponsivenesstothedemandsoffirmsandcitizens.Yet, such indicators are in their infancy; much remains to be done in developing better metrics, sharing good practices, and feeding them into research. As Vietnam’s PCI highlights, collaboration among concerned government agencies, statistical offices, local and international research institutions, and development partners can be fruitful in advancing this agenda. Regional forums, such as ASEAN, can provide countries with platforms for sharing innovative metrics and for spreading good practices. The World Bank looks forward to working with clients and partners in the region in advancing this agenda.
EAST ASIA AND PACIFIC ECONOMIC UPDATE APRIL 2016
106 PART II. MEDIUM-TERM DEVELoPMENT AGENDA
References
Acemoglu, Daron, and James A. Robinson. 2012. Why Nations Fail: The Origins of Power, Prosperity and Poverty. London: Profile.
ADB (Asian Development Bank). 2007. Country Diagnostics Studies. Philippines: Critical Development Constraints. Manila: Asian Development Bank.
———. 2009. Country Diagnostics Studies. Indonesia: Critical Development Constraints. Manila: Asian Development Bank.
Aiyar, Shekhar, Romain A. Duval, Damien Puy, Yiqun Wu, and Longmei Zhang. 2013. “Growth slowdowns and the middle-income trap.” IMF Working Paper No. 13–71, International Monetary Fund, Washington, DC.
Amsden. Alice H. 1991. “Diffusion of Development: The Late-Industrializing Model and Greater East Asia”, The American Economic Review 81 (2): 282–286.
Anderson, James H. 2009. “A Review of Governance and Anticorruption Indicators in East Asia and Pacific.” Working Paper, World Bank, Washington, DC.
Andrews, Matt. 2010. “Good Government Means Different Things in Different Countries.” Governance 23 (1): 7–35.
Arndt, Christiane, and Charles Oman. 2006. Uses and Abuses of Governance Indicators. Development Centre Studies. Paris: oECD Publishing.
APEC (Asian Pacific Economic Cooperation). 2011. “Good Regulatory Practices in APEC Member Economies – Baseline Study.” Asian Pacific Economic Cooperation Secretariat, Singapore.
Beasley, Timothy, and Masayuki Kdamatsu. 2007. “Making Autocracy Work.” In Institutions and Economic Performance, edited by E. Helpman. Cambridge, Massachusetts: Harvard University Press.
Bluhm, Richard, and Adam Szirmai. 2011. “Institutions, Inequality and Growth: A Review of Theory and Evidence on the Institutional Determinants of Growth and Inequality.” UNICEF Innocenti Research Centre Working Paper IWP-2011-02, UNICEF Innocenti Research Centre, Florence.
Bulman, David. 2015. Forthcoming. Incentivized Development: Leaders, Governance and Growth in China’s Counties. Cambridge: Cambridge University Press.
Bulman, David, Maya Eden, and Ha Nguyen. 2014. “Transitioning from low-income growth to high-income growth: is there a middle income trap?” Policy Research Working Paper No. 7104, World Bank, Washington, DC.
Coase, Ronald, and Ning Wang. 2012. How China Became Capitalist. London: Palgrave Macmillan.
Commonwealth of Australia, Productivity Commission. 2008. Performance Benchmarking of Australian Business Regulation: Quantity and Quality. Research Report. Canberra: Commonwealth of Australia.
De Mesquita, Bruce Bueno, Alastair Smith, Randolph M. Siverson and James D. Morrow. 2003, The Logic of Political Survival, Cambridge, MA: MIT Press.
Dell, Melissa, Nathan Lane, and Pablo Querubin. 2015. “State Capacity, Local Governance, and Economic Development in Vietnam.” Harvard University Working Paper.
Doner, Richard and Ben Ross Schneider. 2015. “The Middle-Income Trap: More Politics than Economics”, Harvard University Working Paper.
GROWING CHALLENGES
II.A. GoVERNANCE FoR SUSTAINED GRoWTH IN EAST ASIA AND PACIFIC: PRIoRITIES AND INDICAToRS 107
Eichengreen, Barry, Donghyun Park and Kwanho Shin. 2013. “Growth Slowdowns Redux: New Evidence on the Middle Income Trap.” NBER Working Paper No. 18673, Cambridge, MA: National Bureau of Economic Research.
Evans, Peter B. 1995. Embedded Autonomy: States and Industrial Transformation, Vol. 25. Princeton: Princeton University Press.
Evans, William, and Clare Ferguson. 2013. Governance, Institutions, Growth and Poverty Reduction: A Literature Review. London: UK Department for International Development.
Fukuyama, Francis. 2012. “The patterns of history.” Journal of Democracy 23 (1): 14–26.
———. 2013. “What is Governance?” Governance 26 (3): 347–68.
Gehlbach, Scott, and E. J. Malesky. 2013. “The Grand Experiment that Wasn’t? New Institutional Economics and the Postcommunist Experience.” In Economic Institutions, Rights, Growth, and Sustainability: the Legacy of Douglass North, edited by Sebastian Galiani and Itai Sened. Cambridge: Cambridge University Press.
Gehlbach, Scott, and Philip Keefer. 2011. “Investment without Democracy: Ruling-Party Institutionalization and Credible Commitment in Autocracies.” Journal of Comparative Economics 39 (2): 123–39.
———. 2012. “Private Investment and the Institutionalization of Collective Action in Autocracies: Ruling Parties and Legislatures.” The Journal of Politics 74 (2): 621–635.
Gill, Indermit S., and Homi Kharas. 2015. “The Middle-Income Trap Turns Ten.” Policy Research Working Paper No. 7403, World Bank, Washington, DC.
Gill, Indermit Singh, Homi J. Kharas, and Deepak Bhattasali. 2007. An East Asian Renaissance: Ideas for Economic Growth. Washington, DC: World Bank.
Guo, G. 2009. “China’s Local Political Budget Cycles.” American Journal of Political Science 53: 621–32.
Haggard, Stephan, and Lydia Tiede. 2011. “The Rule of Law and Economic growth: Where are We?” World Development 39 (5): 673–685.
Hasnain, Zahid. 2014. “Mongolia: The Politics of Public Investments.” World Bank, Washington, DC.
Hausmann, Ricardo, and César A. Hidalgo. 2014. The Atlas of Economic Complexity: Mapping Paths to Prosperity. Cambridge, Massachusetts : MIT Press.
Hofman, Bert, and Jinglian Wu. 2009. “Explaining China’s Development and Reforms, Commission on Growth and Development.” Working Paper No. 50, World Bank, Washington, DC.
Holt, Jordan, and Nick Manning. 2014. “Fukuyama is Right about Measuring State Quality: Now What?” Governance 27 (4): 717–728.
Huang, Yasheng. 2008. Capitalism with Chinese Characteristics. Entrepreneurship and the State. Cambridge: Cambridge University Press.
Hulme, David, Antonio Savoia, and Kunal Sen. 2015. “Governance as a Global Development Goal? Setting, Measuring and Monitoring the Post-2015 Development Agenda.” Global Policy 6 (2): 85–96.
Im, Fernando Gabriel, and David Rosenblatt. 2013. “Middle-Income Traps: A Conceptual and Empirical Survey.” Policy Research Working Paper No. 6594, World Bank, Washington, DC.
Kauffman, Daniel, Aart Kraay, and Pablo Zoido-Lobatón. 1999. “Governance Matters.” Policy Working Paper No. 2196, World Bank, Washington, DC.
Keefer Philip. 2011. “Collective Action, Political Parties, and Pro-Development Public Policy.” Asian Development Review 28 (1): 94–118.
Kharas, Homi, and Harinder Kohli. 2011. “What Is the Middle Income Trap, Why do Countries Fall into It, and How Can It Be Avoided?” Global Journal of Emerging Market Economies 3 (3): 281–289.
EAST ASIA AND PACIFIC ECONOMIC UPDATE APRIL 2016
108 PART II. MEDIUM-TERM DEVELoPMENT AGENDA
Li, Shaomin M., and Judy J. Wu. 2010. “Why Some Countries Thrive Despite Corruption: The Role of Trust in the Corruption-Efficiency Relationship.” Review of International Political Economy 17 (1): 129–54.
Liang, Xiaoyan, and Shuang Chen. 2013. Developing Skills for Economic Transformation and Social Harmony in China: A Study of Yunnan Province. Washington, DC: World Bank.
Liu, Lili, Juan Pradelli, and Min Zhao. 2015. “International Experience on Subnational Financial Reporting for Managing Fiscal Risks.” World Bank, Washington DC.
Malesky, Edmund J. 2015. The Vietnam Provincial Competitiveness Index: Measuring Economic Governance for Private Sector Development, 2014 Final Report. Hanoi: Vietnam Chamber of Commerce and Industry and United States Agency for International Development.
Malesky, Edmund, and Jonathan London. 2014. “The Political Economy of Development in China and Vietnam.” Annual Review of Political Sciences 17: 395–419.
Malesky, Edmund J., and Krislert Samphantharak. 2008. “Predictable Corruption and Firm Investment: Evidence from a Natural Experiment and Survey of Cambodian Entrepreneurs.” Quarterly Journal of Political Science 3: 227–67.
McAdam, Doug, Sidney Tarrow, and Charles Tilly. 2001. Dynamics of Contention. Cambridge: Cambridge University Press.
McIntyre, Angus. 2001. “Middle Way Leadership in Indonesia: Sukarno and Abdurrahman Wahid Compared.” Indonesia Today: Challenges of History. Singapore: Institute of Southeast Asian Studies, pp. 85–96.
Noda, Kohei. 2011. “Politicization of Philippine Budget System: Institutional and Economic Analysis on ‘Pork-Barrel.” PRI Discussion Paper Series No.11A-04, Research Department Policy Research Institute, Ministry of Finance of Japan, Tokyo.
North, Douglass C., John J. Wallis, and Barry R. Weingast. 2009. Violence and Social Orders: A Conceptual Framework for Interpreting Recorded Human History. Cambridge: Cambridge University Press.
oECD (organisation for Economic Co-operation and Development). 2015. OECD Regulatory Policy Outlook 2015. Paris: oECD Publishing. http://dx.doi.org/10.1787/9789264238770-en.
Ohno, Kenichi. 2009. “Avoiding the Middle-Income Trap: Renovating Industrial Policy Formulation in Vietnam.” ASEAN Economic Bulletin 26 (1): 25–43.
Oi, Jean. 1999. “Local State Corporatism.” In Rural China Takes Off: Institutional Foundations of Economic Reform. Berkeley: University of California Press, pp. 95–138.
Public Expenditure and Financial Accountability (PEFA) Secretariat. 2016. Framework for Assessing Public Financial Management, Washington DC: The World Bank.
Perkins, Dwight H., and Thanh Tu Anh Vu. 2009. “Vietnam’s Industrial Policy. Designing Policies for Sustainable Development.” Policy Dialogue Paper 1, prepared under the UNDP–Harvard Policy Dialogue Papers “Series on Vietnam’s WTO Accession and International Competitiveness Research.” Harvard University, Cambridge, Massachusetts.
Political Risk Services Group. 2011. International Country Risk Guide Methodology. https://www.prsgroup.com/about-us/our-two-methodologies/icrg.
Pritchett, Lant, and Eric Werker. 2012. “Developing the Guts of a GUT (Grand Unified Theory): Commitment and Inclusive Growth.” ESID Working Paper Series 16/12, Effective States and Inclusive Development Research Centre, Manchester University, Manchester, England.
Pritchett, Lant, and Lawrence H. Summers. 2014. “Asiaphoria Meets Regression to the Mean.” Working Paper No. w20573, National Bureau of Economic Research, Cambridge, Massachusetts.
GROWING CHALLENGES
II.A. GoVERNANCE FoR SUSTAINED GRoWTH IN EAST ASIA AND PACIFIC: PRIoRITIES AND INDICAToRS 109

Qian, Y. 2003. “How Reform Worked in China.” In In Search of Prosperity: Analytic Narratives on Economic Growth, edited by D. Rodrik. Princeton: Princeton University Press, pp. 297–333.
Rama, Martin. 2008. “Making Difficult Choices: Vietnam in Transition.” Commission on Growth and Development Working Paper No. 40, Commission on Growth and Development, Washington, DC.
Rock, Michael T., and Heidi Bonnett. 2004. “The Comparative Politics of Corruption: Accounting for the East Asian Paradox in Empirical Studies of Corruption, Growth and Investment.” World Development 32 (6): 999–1017.
Rodrik, Dani. 2008. One Economics Many Recipes. Globalization, Institutions and Economic Growth. Princeton: Princeton University Press.
Rotberg, Robert I. 2014. “Good Governance Means Performance and Results.” Governance 27 (3): 511–518.
Rothstein, Bo. 2014. “The Chinese Paradox of High Growth and Low Quality of Government: The Cadre Organization Meets Max Weber.” Governance. doi:10.1111/gove.12128.
Shirk, Susan L. 1993. Logic of Economic Reform in China. Berkeley: University of California Press.
Spence, Michael. 2008. The Growth Report: Strategies for Sustained Growth and Inclusive Development. Commission on Growth and Development Final Report, Washington, DC.
———. 2011. The Next Convergence. The Future of Economic Growth in a Multispeed World. New York: Farrar, Straus and Giroux.
Stephenson, Matthew. 2015. “There Is No ‘East Asian Paradox’ of Corruption and Development.” http://globalanticorruptionblog.com/2015/03/10/there-is-no-east-asian-paradox-of-corruption-and-development/.
Taliercio, Robert. 2014. “Appraisal of Public Investment in Practice: Methodological Approaches and Decision Rules in Advanced Systems.” World Bank, Washington, DC.
Tran, Thi Bich, R. Quentin Grafton, and Tom Kompas. 2009. “Institutions Matter: The Case of Vietnam.” The Journal of Socio-Economics 38 (1): 1–12.
Tsai, Lily L. 2007. Accountability Without Democracy: Solidary Groups and Public Goods Provision in Rural China. Cambridge: Cambridge University Press.
Wade, Robert. 1990. Governing the Market: Economic Theory and Taiwan’s Industrial Policies. Princeton: Princeton University Press.
Wallace, Jeremy L. 2014. “Juking the Stats? Authoritarian Information Problems in China.” British Journal of Political Science. doi:10.1017/S0007123414000106.
Wang, Alex. 2013. “The Search for Sustainable Legitimacy: Environmental Law and Bureaucracy in China.” Harvard Environmental Law Review 37 (2): 365–440.
Wang, Zhengxu. 2010. “Citizens’ Satisfaction with Government Performance in Six Asian-Pacific Giants.” Japanese Journal of Political Science 11: 51–75.
Wedeman, A. 2002. “Development and Corruption: The East Asian Paradox.” In Political Business in East Asia, edited by E. T. Gomez. London: Routledge, pp. 34–61.
———. 2012. Double Paradox: Rapid Growth and Rising Corruption in China. Ithaca and London: Cornell University Press.
World Bank. 2008. An East Asian Renaissance. Washington, DC: World Bank.
———. 2012. 2012 World Development Report on Jobs. Washington, DC: World Bank.
———. 2011. “Indonesia Infrastructure Public Expenditure Review. The Roads Public Expenditure Policy Note.” World Bank, Washington, DC.
EAST ASIA AND PACIFIC ECONOMIC UPDATE APRIL 2016
110 PART II. MEDIUM-TERM DEVELoPMENT AGENDA

———. 2014. East Asia and Pacific Economic Update October 2014. Enhancing Competitiveness in an Uncertain World. Washington, DC: World Bank.
———. 2015. “Indonesia. Systematic Country Diagnostic: Connecting the Bottom 40 Percent to the Prosperity Generation.” World Bank, Washington D.C.
World Bank and China DCR (World Bank and the Development Research Center of the State Council, the People’s Republic of China). 2013. China 2030. Building a Modern, Harmonious, and Creative Society. Washington, DC: World Bank.
Yu, Jong-Sung. 2013. “Transitioning from a Limited Access Order to an Open Access Order: The Case of South Korea.” In The Shadow of Violence, edited by D. C. North, J. J. Wallis, S. B. Webb, and B. R. Weingast. Cambridge: Cambridge University Press.
Zhao, Min, and Lili Liu 2015. “Moving Toward a New Debt Management Framework Managing Transitional Risks.” World Bank, Washington, DC.
Zhuang, Juzhong, Emmanuel de Dios, and Anneli Lagman-Martin. 2010. “Governance and Institutional Quality and the Links with Economic Growth and Income Inequality: With Special Reference to Developing Asia.” Asian Development Bank Working Paper 193, Asian Development Bank, Manila.
GROWING CHALLENGES
II.A. GoVERNANCE FoR SUSTAINED GRoWTH IN EAST ASIA AND PACIFIC: PRIoRITIES AND INDICAToRS 111
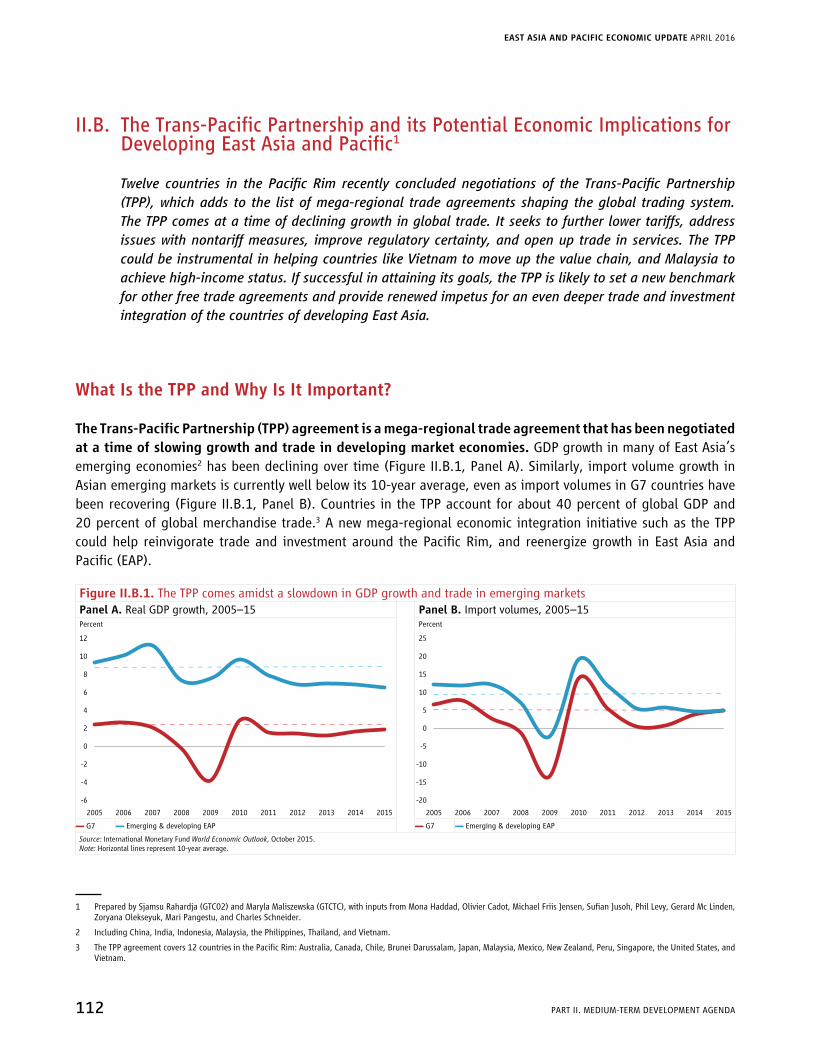
II.B. The Trans-Pacific Partnership and its Potential Economic Implications for Developing East Asia and Pacific1
Twelve countries in the Pacific Rim recently concluded negotiations of the Trans-Pacific Partnership (TPP), which adds to the list of mega-regional trade agreements shaping the global trading system. The TPP comes at a time of declining growth in global trade. It seeks to further lower tariffs, address issues with nontariff measures, improve regulatory certainty, and open up trade in services. The TPP could be instrumental in helping countries like Vietnam to move up the value chain, and Malaysia to achieve high-income status. If successful in attaining its goals, the TPP is likely to set a new benchmark for other free trade agreements and provide renewed impetus for an even deeper trade and investment integration of the countries of developing East Asia.
What Is the TPP and Why Is It Important?
TheTrans-PacificPartnership(TPP)agreementisamega-regionaltradeagreementthathasbeennegotiatedat a time of slowing growth and trade in developing market economies. GDP growth in many of East Asia’s emerging economies2 has been declining over time (Figure II.B.1, Panel A). Similarly, import volume growth in Asian emerging markets is currently well below its 10-year average, even as import volumes in G7 countries have been recovering (Figure II.B.1, Panel B). Countries in the TPP account for about 40 percent of global GDP and 20 percent of global merchandise trade.3 A new mega-regional economic integration initiative such as the TPP could help reinvigorate trade and investment around the Pacific Rim, and reenergize growth in East Asia and Pacific (EAP).
Figure II.B.1. The TPP comes amidst a slowdown in GDP growth and trade in emerging marketsPanel A. Real GDP growth, 2005–15 Panel B. Import volumes, 2005–15Percent Percent
12
10
8
6
4
2
0
-2
-4
-6
2005 2006 2007 2008 2009 2010 2011 2012 2013 20152014
25
20
15
10
5
0
-5
-10
-15
-20
2005 2006 2007 2008 2009 2010 2011 2012 2013 20152014
▬ G7 ▬ Emerging & developing EAP ▬ G7 ▬ Emerging & developing EAP
Source: International Monetary Fund World Economic Outlook, October 2015.Note: Horizontal lines represent 10-year average.
1 Prepared by Sjamsu Rahardja (GTC02) and Maryla Maliszewska (GTCTC), with inputs from Mona Haddad, olivier Cadot, Michael Friis Jensen, Sufian Jusoh, Phil Levy, Gerard Mc Linden, Zoryana Olekseyuk, Mari Pangestu, and Charles Schneider.
2 Including China, India, Indonesia, Malaysia, the Philippines, Thailand, and Vietnam.
3 The TPP agreement covers 12 countries in the Pacific Rim: Australia, Canada, Chile, Brunei Darussalam, Japan, Malaysia, Mexico, New Zealand, Peru, Singapore, the United States, and Vietnam.
EAST ASIA AND PACIFIC ECONOMIC UPDATE APRIL 2016
112 PART II. MEDIUM-TERM DEVELoPMENT AGENDA

The TPP agreement contains several important features (Box II.B.1). It is a relatively large regional trade agreement (RTA) involving 12 countries around the Pacific Rim with varying levels of economic development. The coverage of commitments in the TPP agreement is far-reaching, from relatively traditional features such as tariff reductions to features and approaches that will be new for developing countries in EAP, such as the inclusion of government procurement, state-owned enterprises, and the use of negative lists for investment and services (see next section), all of which could require significant reforms. Given the level of ambition of the TPP agreement, this RTA could have significant economic impacts on non-EAP members across the region.
Box II.B.1. What is the TPP agreement, why does it matter, and when will it enter into force?
TheTPPisoneofthebiggesttradedealsinhistory,involving12PacificRimcountriesthattogetheraccount for about 40 percent of global economic output and 20 percent of world trade. It aims to dismantle both tariff and nontariff barriers to trade and investment, and foresees the streamlining of regulations and the implementation of common standards for the protection of foreign investment and intellectual property, among others.
TheTPPisimportantforseveralreasons:
• Its size makes it important to all countries in Asia and the Pacific Rim.
• Its rules and standards are expected to serve as a model for future trade pacts.
• It will require significant restructuring and reforms in some member countries.
• It will have a varying impact on nonmember countries across the region, which for some could prove significant.
Entry into force is not yet a given. The agreement will enter into force under either of two separate scenarios (TPP Agreement, Article 30.5):
• All signatories could provide written notification, within two years of the date of signing, that they have taken the legal measures required to adopt the agreement. The agreement will then enter into force 60 days after the final notification.
• one or more signatories could fail to provide such notification within two years of the date of signing. The agreement will then enter into force 60 days after the date on which at least six original signatories adopt the agreement, so long as those signatories pass a significance threshold. That threshold requires that the combined GDP of the agreeing countries account for at least 85 percent of the original twelve signatories’ total GDP, using IMF data in current dollars for 2013. In practice, this means that only the United States or Japan could single-handedly prevent the TPP from coming into force through failure to pass it.
The TPP was signed on February 4, 2016. If all 12 original members deposit their ratification by February 4, 2018, then the TPP enters into force 60 days after the last member has deposited their ratification—that is, the TPP will enter into force by April 5, 2018, and earlier if all members act promptly. If some member has not deposited its ratification by February 4, 2018, then the rule involving six signatories with 85 percent of GDP kicks in. If the rule is met by February 4, 2018, then the TPP will come into force on April 5, 2018. Otherwise, the TPP will come into force 60 days after the rule is met.
GROWING CHALLENGES
II.B. THE TRANS-PACIFIC PARTNERSHIP AND ITS PoTENTIAL ECoNoMIC IMPLICATIoNS FoR DEVELoPING EAP 113

Accession to new members is possible and will increase the impact of the TPP. Although the TPP is open to the accession of new members, the possibility of acceding is only automatic for APEC members. For other countries, it will require an explicit decision by TPP members. In both cases, a negotiating process would be required. This provision will make it more difficult for countries like Colombia or Costa Rica, natural partners of the TPP but not APEC members, to accede to TPP. At least 12 countries have expressed interest in joining TPP, including Colombia, Indonesia, Korea, the Philippines, and Thailand.
Figure II.B.2. The TPP could potentially increase intra-TPP trade
Figure II.B.3. The TPP market matters for East Asia
Share in total merchandise trade (percent) Average MFN rates
50
40
30
20
10
1996 1999 2002 2005 2008 2011 2014
30
25
20
15
10
5
0
10 5550452015 25 30 35 40
Grains
Tobacco
Oilseeds, fatsElectric machinery
Petroleum
Fish & fishproducts
FootwearTextile & garment
Transport equipment
Share of merchandise trade (percent) Share in EA exports
▬ Intra-TPP ▬ East Asia with TPP markets ▬ TPP in East Asia with TPP in Americas
Source: UN Comtrade. Source: UN Comtrade and UN TRAINS 2013.Note: WTO Multilateral Trade Negotiations product categories.
Countries in the TPP remain important trading partners for countries in East Asia. About one-third of East Asia’s trade is with TPP member markets (dotted line in Figure II.B.2), particularly with Japan and the United States, with their combined share of GDP and population in the TPP at about 80 percent and 56 percent, respectively. There is also potential for greater trade between TPP members in East Asia and those in the Americas, which has declined compared to the early 1990s but which recently picked up (gray line in Figure II.B.2). For certain products, the TPP is an important export market for East Asia. For instance, it represents a 33 percent share of exports of electric and nonelectric machinery, and a 39 percent share of exports of textiles and garments, footwear and leather products, and transport equipment (Figure II.B.3).
The TPP adds to the list of initiatives aimed at integrating economies within East Asia and integrating the region with countries across the Pacific. East Asia now has around 60 bilateral free trade agreements (FTAs), including five “ASEAN + 1” FTAs (with China, India, Japan, the Republic of Korea, and Australia and New Zealand) (Okabe 2015). The Regional Comprehensive Economic Partnership (RCEP),
Figure II.B.4. The TPP as a subset of ongoing discussions of mega-regional FTAs in East Asia and the Pacific
AustraliaJapan
New Zealand
CanadaChile
MexicoPeru
United States
Papua New GuineaHong Kong SAR, China
RussiaTaiwan, China
ChinaKorea, Rep.India
CambodiaLao PDRMyanmar
IndonesiaPhilippinesThailand
Brunei DarussalamMalaysia
SingaporeVietnam
FTAAP
TPP
RCEP
ASEAN
Source:???Note: FTAAP = Free Trade Area of the Americas and the Pacific; RCEP = Regional Comprehensive Economic Partnership; TPP = Trans-Pacific Partnership.
EAST ASIA AND PACIFIC ECONOMIC UPDATE APRIL 2016
114 PART II. MEDIUM-TERM DEVELoPMENT AGENDA
currently being negotiated, is expected to collapse the five “ASEAN + 1” FTAs into one mega-RTA with greater commitments for liberalizing trade in goods, services, and investments. It will cover 16 Asian economies, including seven TPP members, and constitute 36 percent of global GDP. The TPP could serve to strengthen the link between the RCEP and economies across the Pacific, and potentially lead to the formation of a Free Trade Area of the Americas and the Pacific (FTAAP) (Figure II.B.4).
What Makes the TPP a “New Generation” Trade Agreement
Similar to other RTAs, the TPP seeks to promote greater market access for merchandise trade by lowering tariff barriers. The TPP aims to reduce import tariffs to zero for between 95 and 100 percent of tariff lines of its signatories and reduce tariffs for several products that are considered sensitive, such as agriculture products for Japan and the United States, dairy for Canada, and automotive for the United States. However, average tariffs among TPP countries are already relatively low. Also, as discussed in the next section, several member countries have exclusions or long phase-out times for tariffs.
What differentiates the TPP from most other RTAs is the wide coverage of commitments and its potential implications in triggering domestic reforms, particularly in developing member countries. TPP members must commit to:
• Lower nontariff barriers to trade in goods. • Introduce greater certainty in the rules and regulations covering both trade in services and investment. • Remove barriers to investment, albeit with exceptions. • Impose strict discipline on the conduct of state-owned enterprises, to provide space for private sector
activities. • Open up certain government procurement of goods and services to competition from providers in other
TPP members. • Impose environmental and labor standards. • Addresses the enforcement of intellectual property rights.
Implementation of these agreements is expected to be monitored by a Council, and some agreements will be subject to investor-state or state-state dispute mechanisms. As a result, developing country members in particular will inevitably have to lay out a significant plan of domestic reforms. More specifically, TPP members will have to ensure that their policies comply with the following commitments in key areas:
• Addressing issues on nontariff measures by emphasizing risk management at border controls and increasing regulatory coherence.4 Nontariff measures can have legitimate objectives, such as protecting consumer health and the environment, but they can also hinder trade if their implementation is burdensome. Nontariff measures are also often abused for rent-seeking activities and protectionist lobbying.5 The main
4 In the TPP Agreement, Chapter 7 on sanitary and phytosanitary (SPS) measures and Chapter 8 on technical barriers to trade (TBTs) restate the multilateral disciplines contained in the WTO’s SPS and TBT agreements and introduce new disciplines. Chapter 25 on “regulatory coherence” encourages members to put in place good-regulation principles, although on a “best-endeavor” basis only.
5 See, for example, empirical work on U.S. nontariff barriers by Gawande and Bandyopadhay (2000).
GROWING CHALLENGES
II.B. THE TRANS-PACIFIC PARTNERSHIP AND ITS PoTENTIAL ECoNoMIC IMPLICATIoNS FoR DEVELoPING EAP 115

new disciplines in the sanitary and phytosanitary measures (SPS) and technical barriers to trade (TBT) in the TPP are (a) a renewed emphasis on risk management approaches to border controls, and (b) improved conformity assessment procedures. Risk-based border management can facilitate and shorten clearance procedures, while at the same time improve the rate at which offenders can be apprehended by relying on well-established profiling techniques. Table II.B.1 summarizes the treatment of SPS and TBT in WTo and TPP agreements.
• Promotingmore efficient and transparent trade facilitation. Provisions in the TPP are consistent with those in the WTo Trade Facilitation Agreement (WTo TFA), the ASEAN Trade in Goods Agreement commitments, and Asia-Pacific Economic Cooperation requirements. The only major exceptions, where the TPP includes more demanding requirements, relate to target time frames for the release of express shipments (within six hours of submission of customs documents), which is important to facilitate express delivery services, and a best-endeavor requirement to release goods within 48 hours for nonexpress shipments.
• Locking in commitments on trade in services. Unlike in the General Agreement on Trade in Services (GATS), the TPP adopts a “negative list” approach to schedules for restrictions (nonconforming measures) on trade in services and foreign direct investment (FDI) from TPP members. This approach is used in the North American Free Trade Agreement (NAFTA) and is also common in U.S. FTAs. The negative list approach implies that unless signatories specify nonconforming measures and restrictions in the services sector, other sectors will be open to services providers from TPP members. Besides the nonconforming measures listed in the TPP’s Annex, signatories also commit not to introduce new restrictions on market access for trade in services. In this respect, agreements on trade in services in the TPP could facilitate greater cross-border trade and investment of “new services”, such as medical analysis, start-ups in creative industries, and design and technology.
ThetreatmentofSPSandTBTissuesintheTPPandintheASEANTradeinGoodsAgreement(ATIGA)isgenerally similar. Both the TPP and ATIGA reconfirm the WTo agreements on SPS and TBT that have become benchmarks for RTAs. In SPS-related activities, ATIGA signatories will adopt international norms and standards, and are encouraged to explore opportunities for intra-ASEAN cooperation. Regarding TBT, ATIGA calls on signatories to follow the WTO TBT Agreement’s “Code of Good Practice”, use international standards where possible, and ensure that technical regulations are adopted in ways that do not disrupt trade. Signatories are also required to apply technical regulations in ways that facilitate the implementation of any ASEAN sectoral Mutual Recognition Agreements, and to align their conformity assessment procedures in ways that are consistent with international standards and practices. But the ATIGA has a unique approach to monitor compliance in implementation, by calling for the establishment of a “Post Market Surveillance” system, supported by “Alert Systems”. Provisions on SPS and TBT in both the TPP and the ATIGA are binding and subject to dispute settlement.6
6 Using the ASEAN Enhanced Dispute Settlement Mechanism, www.asean.org/?static_post=asean-protocol-on-enhanced-dispute-settlement-mechanism.
EAST ASIA AND PACIFIC ECONOMIC UPDATE APRIL 2016
116 PART II. MEDIUM-TERM DEVELoPMENT AGENDA

Table II.B.1. Treatment of SPS and TBT issues in WTO and TPP agreementsWTO disciplines Trans-Pacific Partnership (TPP) agreement
SPS agreementHarmonization and equivalence
The TPP reconfirms the WTo SPS agreement.
Transparency The TPP strengthens transparency. Authorities must publish summaries of written comments submitted through the commenting period for new SPS measures. They must, on request, publish materials about the risk assessment process. They must publish notices of SPS measures. Authorities are also obliged to notify importing parties about changes in SPS risks in the territory of the exporter.
Risk analysis The TPP includes a more rigorous process, with stronger demands on documentation and an opportunity for interested parties to comment.
Control, inspection, and approval procedures
The TPP stipulates that importing parties auditing the competent authorities and inspection systems of exporting parties, must accord the exporting parties the opportunity to comment and make data available.The TPP stipulates that import testing must be undertaken by laboratories operating in accordance with international best practice. The TPP stipulates that import controls must be risk-based. The TPP directs parties to promote the implementation of electronic certification and other technologies to facilitate trade.
TBT agreementHarmonization and mutual recognition
The TPP reconfirms the WTo TBT agreement.
Equivalence The TPP is slightly stronger than the WTO, since the TPP TBT chapter stipulates that a party is obliged to explain why it does not accept a technical regulation as equivalent.
Transparency The TPP contains more elaborate publication and notification requirements, including obligations to allow foreigners to participate in consultations and obligations to publish drafts and background material.The TPP obliges parties to publish the objectives of regulations and to justify them, the alternative means considered, and the responses to comments received.
Conformity assessment procedures
The TPP encourages parties to permit the participation of conformity assessment bodies located in the territories of other parties in their conformity assessment procedures. The TPP stipulates that foreign accreditation bodies should be allowed to accredit domestic conformity assessment bodies.
Contains no product-specific disciplines
The TPP introduces disciplines for particular products. The TPP TBT chapter includes product annexes for (a) wine and spirits, (b) information and communications technology products, (c) pharmaceuticals, (d) cosmetics, (e) medical devices, (f) proprietary formulas for prepackaged foods and food additives, and (g) organic products.
Sources: WTO SPS agreement; WTO TBT agreement; TPP Chapter 7 on SPS; and TPP chapter 8 on TBT.
However, implementation arrangements and dispute settlement for SPS and TBT in the TPP could be more demanding than in the ATIGA. The TPP has more detailed modalities under which members can or should implement agreements on SPS and TBT. For instance, TPP will make it possible for members to comments on other members’ proposed SPS and TBT measures, and to question why technical regulations are not accepted by other members as equivalent. Regarding SPS, TPP requires that import checks be risk-based (instead of full inspections), while ASEAN agreements reconfirm WTo agreements on using risk analysis to determine the appropriate level of SPS requirement.7 The dispute settlement process in the TPP also has differences compared to ATIGA. Both agreements facilitate consultations between parties to resolve disputes, but also provide options for the complaining party to request the establishment of a panel to settle the dispute, should the parties fail to resolve the matter within a
7 Full inspections on SPS-related issues are still prevalent among members (ASEAN and World Bank 2013).
GROWING CHALLENGES
II.B. THE TRANS-PACIFIC PARTNERSHIP AND ITS PoTENTIAL ECoNoMIC IMPLICATIoNS FoR DEVELoPING EAP 117
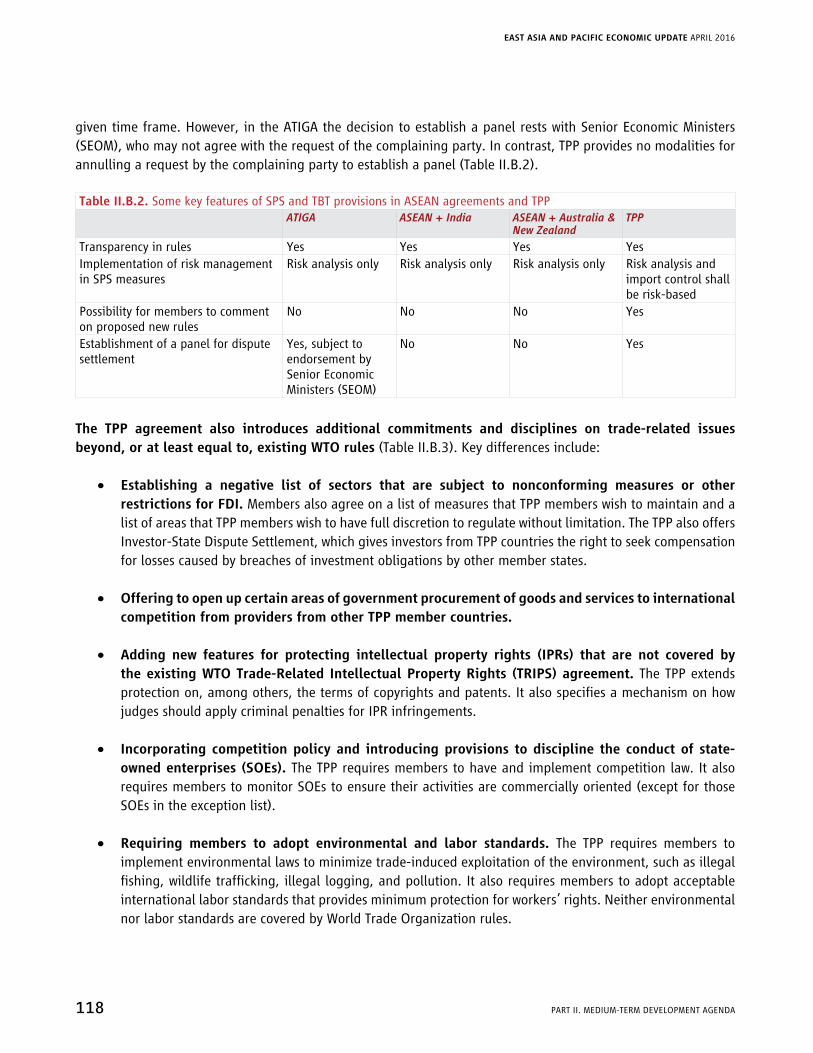
given time frame. However, in the ATIGA the decision to establish a panel rests with Senior Economic Ministers (SEoM), who may not agree with the request of the complaining party. In contrast, TPP provides no modalities for annulling a request by the complaining party to establish a panel (Table II.B.2).
Table II.B.2. Some key features of SPS and TBT provisions in ASEAN agreements and TPPATIGA ASEAN + India ASEAN + Australia &
New ZealandTPP
Transparency in rules Yes Yes Yes YesImplementation of risk management in SPS measures
Risk analysis only Risk analysis only Risk analysis only Risk analysis and import control shall be risk-based
Possibility for members to comment on proposed new rules
No No No Yes
Establishment of a panel for dispute settlement
Yes, subject to endorsement by Senior Economic Ministers (SEoM)
No No Yes
The TPP agreement also introduces additional commitments and disciplines on trade-related issues beyond, or at least equal to, existing WTO rules (Table II.B.3). Key differences include:
• Establishing a negative list of sectors that are subject to nonconforming measures or other restrictions for FDI. Members also agree on a list of measures that TPP members wish to maintain and a list of areas that TPP members wish to have full discretion to regulate without limitation. The TPP also offers Investor-State Dispute Settlement, which gives investors from TPP countries the right to seek compensation for losses caused by breaches of investment obligations by other member states.
• Offering to open up certain areas of government procurement of goods and services to international competition from providers from other TPP member countries.
• Adding new features for protecting intellectual property rights (IPRs) that are not covered bytheexistingWTOTrade-Related IntellectualPropertyRights (TRIPS)agreement.The TPP extends protection on, among others, the terms of copyrights and patents. It also specifies a mechanism on how judges should apply criminal penalties for IPR infringements.
• Incorporating competition policy and introducing provisions to discipline the conduct of state-ownedenterprises(SOEs).The TPP requires members to have and implement competition law. It also requires members to monitor SoEs to ensure their activities are commercially oriented (except for those SoEs in the exception list).
• Requiring members to adopt environmental and labor standards. The TPP requires members to implement environmental laws to minimize trade-induced exploitation of the environment, such as illegal fishing, wildlife trafficking, illegal logging, and pollution. It also requires members to adopt acceptable international labor standards that provides minimum protection for workers’ rights. Neither environmental nor labor standards are covered by World Trade Organization rules.
EAST ASIA AND PACIFIC ECONOMIC UPDATE APRIL 2016
118 PART II. MEDIUM-TERM DEVELoPMENT AGENDA

• Incorporating provisions on e-commerce. The TPP is the first trade agreement to incorporate important provisions to assure the uninhibited flow of digital trade and internet-based commerce. It calls for dropping barriers to e-commerce such as “data protectionism”, and reduces customs duties on the flow of music, video, software, and games.
Table II.B.3. Treatment of several key trade-related issues in WTO and TPP agreementsWTO disciplines Trans-Pacific Partnership (TPP) agreement
InvestmentPerformance requirement: Under the Trade-Related Investment Measures (TRIM) Agreement, performance requirements (for instance, obligation to use local suppliers, or limitation on import value based on export) have to be notified and should be eliminated.---WTo facilitates consultations and settlement for state-to-state dispute.
The TPP relies on a negative list, which implies that sectors will be open to investment from TPP members, except those expressly exempted. TPP members agree to list (a) existing nonconforming measures that they intend to keep (standstill), and (b) reservations where members will have full discretion to maintain nonconforming measures without any limitation.---The TPP offers investor-state dispute settlement (ISDS). Investors from TPP countries can claim damages for losses caused by the host State’s breach of the investment obligations. But the TPP imposes time limits for investors to start an arbitration case and includes other requirements such as waivers and cooling off periods. It also requires a high level of transparency, including public access to documents and proceedings and the possibility for civil society to submit “friend of the court” briefs to the arbitration tribunal. TPP investors cannot pursue arbitration over tobacco controls aimed at protecting public health.
Government procurementNot all WTO members are part of the plurilateral Government Procurement Agreement (GPA). In East Asia, only Hong Kong; Japan; the Republic of Korea; Singapore; and Taiwan, China are members of GPA. Coverage of commitments in GPA is based on a positive list (including services and thresholds on value and types of procurement).
The negative lists of some TPP countries lock in commitments for the types of contract open to foreign providers from other TPP countries. TPP members have lists of exceptions on excluded goods and services, national security (e.g., national defense/security, NASA for the United States), thresholds in the value of contracts, and preference price margins (e.g., for Malaysia’s Bumiputera [ethnic Malay] suppliers).
Intellectualpropertyrights(IPRs)WTO establishes minimum levels of protection on IPRs that all members must provide covering copyrights, trademarks, geographic indicators, industrial designs, and patents. Encourages the transfer of technology by developed countries to developing countries. Patents on pharmaceuticals are exempted for less-developed countries until 2016.
Overall, TPP provisions on IPRs go beyond the scope of the WTO’s Trade-Related Aspects of Intellectual Property Rights (TRIPS) agreement. The TPP contains “new features” on, among others, (a) a detailed mechanism for judges to order criminal penalties for theft of trade secrets, counterfeiting, copyright infringement, including infringement in the digital environment (not just physical products); (b) compensation for any unreasonable delay in adjusting patent terms; (c) longer terms for copyright; (d) protection for undisclosed test or other data for a minimum of 10 years; and (e) and provisions for biological and pharmaceutical IP, with a minimum of 8 years of data protection.
GROWING CHALLENGES
II.B. THE TRANS-PACIFIC PARTNERSHIP AND ITS PoTENTIAL ECoNoMIC IMPLICATIoNS FoR DEVELoPING EAP 119

Table II.B.3. Treatment of several key trade-related issues in WTO and TPP agreementsWTO disciplines Trans-Pacific Partnership (TPP) agreement
Competitionpolicyandstate-ownedenterprises(SOEs)Competition policy remains outside the current WTO negotiating agenda.---WTO covers only state trading enterprises, whereby members must notify the WTO of their operation and prevent them from carrying out quantitative restrictions on trade.
TPP members must adopt and implement a competition law. But competition issues are not subject to TPP dispute settlement.---TPP members commit to ensure sales or purchases by SoEs are based on commercial considerations, noncommercial activities by SoEs do not cause injury to businesses of other members, they will not discriminate in favor of SoEs, and they will establish a state-to-state dispute mechanism. But the TPP allows members to list exceptions for several SoEs and their activities.
Environmental and labor standardsEnvironmental and labor standards are not yet subject to WTO rules.
TPP members are required to adopt and implement environmental laws to minimize trade-induced exploitation of the environment, such as illegal fishing, wildlife trafficking, illegal logging, and pollution.---Environmental issues are subject to dispute settlement.---TPP members will adopt and implement laws that allow fundamental labor rights, collective bargaining, the elimination of forced and child labor, and the elimination of employment discrimination.
E-CommerceNot yet subject to WTO rules, but WTO has established a work plan to identify issues that undermine the growth of e-commerce.
TPP members are required to allow the free movement of electronic data (subject to safeguards on privacy or security), not require companies to build data servers locally (except for the financial sector), and not impose customs duty on digital products.
Sources: WTO TFA; WTO GPA; WTO GATS; WTO TRIPS; TPP agreement.
The TPP also covers areas that have either recently emerged, or that have expanded dramatically in recent years, and are not yet covered by WTO rules. These issues include investment protection, burdensome and inconsistent regulations, additional protection in intellectual property rights, differing labor and environmental standards, issues specifically regarding small and medium-size enterprises, and new challenges arising from rapidly growing digital technologies. Coverage and provisions in the TPP agreement on intellectual property rights and e-commerce go beyond existing WTO rules and seek to promote digital trade, since they have largely not been covered in other FTAs. Moreover, the TPP is designed as a “living agreement” to allow for membership expansion and for broadening of coverage.
The Potential Impact on Market Access in East Asia
Ì Gains from lower tariff barriers
Although tariffs among TPP countries are already relatively low, tariff reduction schedules in the TPP agreement can further open up market access for certain products. The average effective tariff for intra-TPP trade is low, at about 2.4 percent, but high tariff peaks are prevalent to protect sensitive products. The TPP seeks to
EAST ASIA AND PACIFIC ECONOMIC UPDATE APRIL 2016
120 PART II. MEDIUM-TERM DEVELoPMENT AGENDA

set import tariffs at zero for 100 percent of tariff lines for Chile, Peru, Brunei Darussalam, Malaysia, and Australia and New Zealand, and for 95 percent of tariff lines for imports from other TPP members (Figure II.B.5), while allowing certain countries to maintain low import tariffs on specific sensitive products. In developing economies, the TPP will reduce the number of high-level tariff lines (that is, those over 10 percent) that currently prevail in Malaysia and Vietnam. On sensitive products, the TPP includes provisions for greater market access for trade in agricultural products. For instance, Japan has agreed to lower barriers to its highly protected rice market (although it can still impose quotas) for U.S. and Australian rice, and reduce 74 percent of the import tariff lines on beef and beef products. The TPP has also secured commitments to reduce import tariffs on apparel and cars in large markets (Japan, Mexico, and the United States).8
Figure II.B.5. Existing MFN tariff rates and proportion of zero tariffs under full TPP implementationPercent
100
90
80
70
60
50
40
30
20
10
0
BRN MYS JPN SGP VNM AUS NZL CAN CHL MEX PER USA
J Tariff lines already zero at MFN rates J Zero under TPP implementation
Source: Peterson Institute for International Economics 2016.Note: MFN = most-favored nation.
8 But under the TPP, certain countries can have long phase-out periods, or impose low tariff rates to protect their most sensitive products. Japan and the United States will have long phase-outs on import tariffs for beef, dairy products, and cars. Both countries will also keep positive tariffs on 1 percent and 5 percent of their tariff lines, respectively.
For nonmembers, the tariff reduction schedules in the TPP could have potentially negative impacts, particularly in Japanese and U.S. markets. These two markets account for about 80 percent of total GDP and 56 percent of the total population of TPP countries. Currently, TPP countries already grant zero tariffs on about 66 percent of tariff lines for products from East Asia TPP members, compared with 58 percent of tariff lines for products from nonmembers in East Asia (Figure II.B.6). About 33 percent of tariff lines of products from nonmembers in East Asia are subject to import tariffs of up to 10 percent, compared with 26 percent of tariff lines for products coming from TPP members in East Asia.
Figure II.B.6. Non-TPP members in East Asia may face erosion in tariff preference in TPP marketsImport from non-TPP members in East Asia Import from TPP members in East AsiaMFN import tariffs in TPP markets for imports from East Asia, percent MFN import tariffs in TPP markets for imports from East Asia, percent
70
60
50
40
30
20
0
10
0
>0–5
>5–10
>10–2
0
>20–3
0
>30–4
0
>40–5
0
>50–6
0
>60–7
0
>70–1
00
>100
70
60
50
40
30
20
0
10
0
>0–5
>5–10
>10–2
0
>20–3
0
>30–4
0
>40–5
0
>50–6
0
>60–7
0
>70–1
00
>100
Tariff brackets, percent Tariff brackets, percent
J Red bar ▬ Black line J Red bar ▬ Black line
Source: UN-Trains.Note: Data excludes specific tariff rates.
GROWING CHALLENGES
II.B. THE TRANS-PACIFIC PARTNERSHIP AND ITS PoTENTIAL ECoNoMIC IMPLICATIoNS FoR DEVELoPING EAP 121

The margin of preferences in the TPP could have a negative impact on certain products from nonmembers in East Asia with large exposure to TPP markets, particularly of garments, footwear, electronics and electricalparts,machinery(includingpartsandcomponents),andwoodproducts(furniture,pulp)(Figure II.B.3). Once the TPP comes into force, Japan and the United States will immediately eliminate 77 percent and 85 percent of their positive most-favored nation (MFN) import tariff lines, respectively, for other TPP members. Meanwhile, Chile, Mexico, and Peru will immediately eliminate 95 percent, 48 percent, and 59 percent of their positive MFN import tariff lines, respectively. Although many countries in EAP have bilateral FTAs with Japan, rules of origin and investment provisions in the TPP could potentially discriminate against EAP nonmembers. Likewise, EAP nonmembers could find it tougher to compete with TPP members in markets in Canada, Mexico, Peru, and the United States, because these countries do not yet have bilateral FTAs in place with developing countries in East Asia.
The TPP negotiations achieved modest progress in reducing trade barriers in agriculture as the sector remains highly contentious. The TPP secured modest commitments to reduce barriers in agriculture trade: Japan committed to reduce import barriers for frozen and processed meats for all TPP members; Mexico agreed to gradually eliminate import tariff on beef and on goat and sheep meats; Canada made small commitments to allow more import quota on dairy; the United States agreed to open up import for Japanese Wagyu beef. Tariff rate quota (TRQ), which is the tariff that becomes effective once import volume passes certain level, would be relaxed for many products such as rice, dairy, and sugar. However, TRQ expansion for some products is not applied equally to all members but rather on a country-by-country case. For instance, Japan agreed to increase TRQ for U.S. rice by 50,000 metric ton but gave Australia additional 6,000 metric ton. The United States will raise TRQ for sugar import from Australia but keep it lower than the level enjoyed by Mexico.
For East Asia, the direct impact of the TPP in increasing agriculture exports may be limited. For Malaysia and Vietnam, bilateral FTAs and ASEAN+1 FTAs already provide preferential tariff rates for key exports such as seafood, shrimps, processed seafood, and wood products. Meanwhile palm oil, which represents around 8 percent of Malaysian export, goes mainly to non-TPP markets such as China and India. Increasing palm oil exports to Canada and United States is an option but may face stiff competition from other edible oils (olive oil, soybean oil, and sunflower oil), constraints in expanding palm oil plantation, and the negative stigma associated with the perceived impact of palm oil plantation in degrading tropical forest environments. Vietnam could potentially see more opportunity in exporting jasmine rice to Canada, United States, and other TPP members.
Rulesoforigin(RoO)intheTPPcouldpotentiallycausetradeandinvestmentdiversionsfromnonmembersin East Asia. These rules establish the conditions under which products assembled from imported components are eligible for preferential treatment when exported to other member countries in an RTA. The rules are also intended to reduce the transshipment of products from nonmember countries through a member country with the aim of claiming preferential market access. While the objective is clear, overly restrictive RoO can distort sourcing decisions by firms in TPP countries toward less efficient intra-TPP suppliers. Especially for East Asia, restrictive Roo could stifle trade, creating captive markets for input suppliers in the bloc, and hampering the optimal allocation of production activities through “trade in task”—a key current feature of the region’s manufacturing production networks (that is, “Factory Asia”).
Figure II.B.7. There are exceptions for rules on changes of tariff headings that could make rules of origin in TPP more stringentLevel of change in tariff classification (from restrictive to less restrictive)
1,200
800
400
0
Chapter Heading Sub-head
Choice with RVC
With excepttion
None
Source: Team calculations using TPP Annex 3D, https://ustr.gov/sites/default/files/TPP-Final-Text-Annex-3-A-Product-Specific-Rules.pdf, https://ustr.gov/sites/default/files/TPP-Final-Text-Annex-3-A-Appendix-1-Automotive.pdf.Note: The green columns in the background count the number of products with a CTC (at either the chapter level, heading level, or subheading level) as the sole criterion; the orange columns in the middle ground count the number of products where a CTC comes with an exception; the blue columns in the foreground count the number of products where the importer can choose between a CTC and a regional value content (RVC), typically between 40 percent and 50 percent.
EAST ASIA AND PACIFIC ECONOMIC UPDATE APRIL 2016
122 PART II. MEDIUM-TERM DEVELoPMENT AGENDA

The margin of preferences in the TPP could have a negative impact on certain products from nonmembers in East Asia with large exposure to TPP markets, particularly of garments, footwear, electronics and electricalparts,machinery(includingpartsandcomponents),andwoodproducts(furniture,pulp)(Figure II.B.3). Once the TPP comes into force, Japan and the United States will immediately eliminate 77 percent and 85 percent of their positive most-favored nation (MFN) import tariff lines, respectively, for other TPP members. Meanwhile, Chile, Mexico, and Peru will immediately eliminate 95 percent, 48 percent, and 59 percent of their positive MFN import tariff lines, respectively. Although many countries in EAP have bilateral FTAs with Japan, rules of origin and investment provisions in the TPP could potentially discriminate against EAP nonmembers. Likewise, EAP nonmembers could find it tougher to compete with TPP members in markets in Canada, Mexico, Peru, and the United States, because these countries do not yet have bilateral FTAs in place with developing countries in East Asia.
The TPP negotiations achieved modest progress in reducing trade barriers in agriculture as the sector remains highly contentious. The TPP secured modest commitments to reduce barriers in agriculture trade: Japan committed to reduce import barriers for frozen and processed meats for all TPP members; Mexico agreed to gradually eliminate import tariff on beef and on goat and sheep meats; Canada made small commitments to allow more import quota on dairy; the United States agreed to open up import for Japanese Wagyu beef. Tariff rate quota (TRQ), which is the tariff that becomes effective once import volume passes certain level, would be relaxed for many products such as rice, dairy, and sugar. However, TRQ expansion for some products is not applied equally to all members but rather on a country-by-country case. For instance, Japan agreed to increase TRQ for U.S. rice by 50,000 metric ton but gave Australia additional 6,000 metric ton. The United States will raise TRQ for sugar import from Australia but keep it lower than the level enjoyed by Mexico.
For East Asia, the direct impact of the TPP in increasing agriculture exports may be limited. For Malaysia and Vietnam, bilateral FTAs and ASEAN+1 FTAs already provide preferential tariff rates for key exports such as seafood, shrimps, processed seafood, and wood products. Meanwhile palm oil, which represents around 8 percent of Malaysian export, goes mainly to non-TPP markets such as China and India. Increasing palm oil exports to Canada and United States is an option but may face stiff competition from other edible oils (olive oil, soybean oil, and sunflower oil), constraints in expanding palm oil plantation, and the negative stigma associated with the perceived impact of palm oil plantation in degrading tropical forest environments. Vietnam could potentially see more opportunity in exporting jasmine rice to Canada, United States, and other TPP members.
Rulesoforigin(RoO)intheTPPcouldpotentiallycausetradeandinvestmentdiversionsfromnonmembersin East Asia. These rules establish the conditions under which products assembled from imported components are eligible for preferential treatment when exported to other member countries in an RTA. The rules are also intended to reduce the transshipment of products from nonmember countries through a member country with the aim of claiming preferential market access. While the objective is clear, overly restrictive RoO can distort sourcing decisions by firms in TPP countries toward less efficient intra-TPP suppliers. Especially for East Asia, restrictive Roo could stifle trade, creating captive markets for input suppliers in the bloc, and hampering the optimal allocation of production activities through “trade in task”—a key current feature of the region’s manufacturing production networks (that is, “Factory Asia”).
Figure II.B.7. There are exceptions for rules on changes of tariff headings that could make rules of origin in TPP more stringentLevel of change in tariff classification (from restrictive to less restrictive)
1,200
800
400
0
Chapter Heading Sub-head
Choice with RVC
With excepttion
None
Source: Team calculations using TPP Annex 3D, https://ustr.gov/sites/default/files/TPP-Final-Text-Annex-3-A-Product-Specific-Rules.pdf, https://ustr.gov/sites/default/files/TPP-Final-Text-Annex-3-A-Appendix-1-Automotive.pdf.Note: The green columns in the background count the number of products with a CTC (at either the chapter level, heading level, or subheading level) as the sole criterion; the orange columns in the middle ground count the number of products where a CTC comes with an exception; the blue columns in the foreground count the number of products where the importer can choose between a CTC and a regional value content (RVC), typically between 40 percent and 50 percent.
The TPP applies relatively stringent rules of origin. The Roo rely primarily on changes of tariff classification rules (CTCs),9,10 either alone or combined with other rules. CTCs are simple to deal with for companies and do not involve complicated calculations, heavy documentation, or the disclosure of sensitive information. However, they can be constraining in terms of sourcing. The TPP RoO apply CTCs relatively stringently.11 Further, the RoO impose further exceptions on a large share of products, reinforcing their stringency (first column and second row in Figure II.B.7).12 Unlike the ASEAN Trade in Goods Agreement (ATIGA), the TPP does not rely principally on rules on regional value content. In one-fifth of the cases, the RoO gives importers the choice between CTCs and regional value content rules. Unlike NAFTA, the TPP does not involve technical requirements, the most opaque and restrictive type of RoO. Research on NAFTA and other FTAs has shown that technical requirements were often manipulated by special interests; thus, their elimination from the TPP represents a marked progress from existing FTAs.
This is particularly true in the textile and apparel sector, where exceptions to the CTC add up to a “yarn-forward” rule. This means that, for apparel products to be eligible for preferential treatment, not only must they be made of fabric weaved in TPP countries, but the fabric itself must be made of yarn spun in TPP countries. This could penalize Vietnam, which currently imports most of its fabric from China and for which apparel products account for one-third (US$9 billion in 2014) of its total exports to the United States (Elliott 2016). However, while TPP rules of origin could constrain the competitiveness of Vietnam’s apparel producers by forcing them to switch to more expensive intra-TPP sourcing, they could also trigger the relocation of some spinning and weaving activities from China to Vietnam.
Automotive rules in the TPP are also potentially restrictive. Cars assembled in TPP countries can claim tariff preferences only with a minimum 45 percent of local content using the U.S. “net-cost” approach (in which postproduction expenses are excluded from local content), or a minimum 55 percent of local content using Japan’s less stringent “build-down” approach.13 TPP’s relatively stringent automotive rules provide a glimpse of the
9 A CTC specifies that in order for a product to meet the terms of the FTA as being produced or obtained in the member region/country (“originating”) to qualify for special import duty treatment, that product needs to undertake substantial transformation, which is demonstrated by a change in tariff classification. For example, fresh oranges are classified under HS 0807. If we suppose that the CTC rule under an FTA grants duty-free status for marmalade, then fresh oranges need to be transformed into a product classified under HS 2007.
10 A preliminary coding of the TPP Roo shows that all but 15 HS6 products are covered by a change of tariff classification, either at the chapter level, at the heading level, or at the subheading level.
11 About 37 percent of products are subject to a change of chapter in the harmonized system (HS) classification, the most stringent form of CTC. For instance, a product classified in HS Chapter 7, say, edible vegetables, would need to be transformed into a product classified in, say, HS Chapter 20 to enjoy special duty treatment.
12 In particular, 621 products are covered by a chapter-level CTC with exception, a constraining combination since a change of chapter already implies a wide “jump” over HS subheadings, while exceptions further constrain the range of eligible intermediates.
13 This reflects a compromise among the members of NAFTA (Canada, Mexico, and the United States) that imposes rules of origin on finished automotive products to satisfy 62.5 percent regional value content.
GROWING CHALLENGES
II.B. THE TRANS-PACIFIC PARTNERSHIP AND ITS PoTENTIAL ECoNoMIC IMPLICATIoNS FoR DEVELoPING EAP 123

emerging political economy lineups, with Canada and Mexico trying to preserve existing arrangements enjoyed under NAFTA. If TPP’s automotive rules had been less stringent, Mexico would have faced competition from new players sourcing their inputs more efficiently, while its own producers would have been stuck with production lines that had been adapted to expensive local sourcing in order to comply with NAFTA’s stringent 65 percent local content rule (Oliver 2016).
Rules of origin in the TPP are stricter than in the ASEAN FTAs. This is particularly true for automotive products and equipment. More generally, ASEAN FTAs are less restrictive because they allow for the accumulation of regional value content. For instance, the ASEAN Free Trade Area (AFTA) has the simplest rules of origin: it only requires that 40 percent of materials used originate from members (regional value content). The ASEAN + Japan FTA also has less restrictive rules of origin than the TPP for automotive products. Recent rules of origin in ASEAN FTAs such as ASEAN + Korea also allow exporters in member countries the choice of using rules relating to either regional value content or the change of tariff heading.
For TPP members in East Asia, rules of origin in the TPP agreement could require adjustments in the sourcing of intermediate goods. The emergence of regional production networks has led to the producers of cars, electronics, and machinery in East Asia sourcing parts and components within the region, particularly from non-TPP countries, mostly China and Korea, but increasingly also from Thailand and Indonesia. More than 50 percent of engines (spark ignition reciprocating engines, HS 8407) used by car manufacturers in Vietnam, and 45 percent used by car manufacturers in Malaysia, come from non-TPP countries in East Asia (Figure II.B.8). In electronics, around 90 percent of Vietnamese imports of parts for cellular phones (HS 851770) also come from non-TPP countries in East Asia (China and the Korea). Production of fabric and textiles in Malaysia and Vietnam also relies mostly on yarns made outside TPP countries.
Ì Impact of other trade-related and investment reforms
ApotentiallysignificantimpactoftheTPPagreementonitsmembersinEastAsiawillcomefromreforms,beyond tariffs reductions, that lead to lower trade costs and a more conducive investment environment. This could reinforce the trend toward growing supply chain integration, as reflected in a rising share of foreign value added in the exports of TPP countries (Figure II.B.9). In 2011, this share ranged from 15 percent in developed countries such as the United States, Australia, and Japan, to 40 percent in Singapore and Malaysia, broadly in line with foreign content shares in Eastern Europe and China.
Figure II.B.8. Sourcing of selected intermediate inputs and components by TPP members and nonmembers in East AsiaPercent of total imports
Synthetic filament yarn(5401)
Spark-ignition reciprocatingcombustion engine (8407)
Parts of telephone sets(851770)
TPP Non-TPP
100
90
80
70
60
50
40
30
20
10
0TPP TPPNon-TPP Non-TPP
J Vietnam J Indonesia J Malaysia J China
Source: UN Comtrade based on HS 2002 classification.
EAST ASIA AND PACIFIC ECONOMIC UPDATE APRIL 2016
124 PART II. MEDIUM-TERM DEVELoPMENT AGENDA

Figure II.B.9. Foreign value added in exports, 1995 and 2011
Figure II.B.10. Average intra-TPP nontariff measures by ad-valorem equivalent size
Percent Percent
50
40
30
20
10
0
SGP MYS VNM MEX CAN CHL NZL USA JPN AUS BRN
14
12
10
8
6
4
2
0
MYS SGP JPN VNM MEX PER NZL USA BRN AUS CHL CAN
J 1995 J 2011
Source: World Bank 2016a. Source: Kee, Nicita, and Olarreaga 2009.
TPPprovisionsonnontariffmeasures(NTMs)couldhelprationalizeandstreamlinetheiruse;theapplicationof clear, more predictable rules, which do not discriminate against TPP nonmembers, could deliver large gains for both members and other trading partners. NTMs are prevalent among TPP members; their estimated average ad-valorem tariff equivalent is high, particularly in Malaysia, Singapore, and Japan (Figure II.B.10). The TPP agreement seeks to address complex and time-consuming procedures and lack of transparency in NTMs. Some reductions in NTM restrictiveness may also benefit nonmember countries. This applies in particular to improving the transparency and predictability of procedures, streamlining regulations, and using risk-based management at border controls.
By requiring members to harmonize their regulatory practices, or mutually recognize other members’ conformity assessment procedures14, the TPP seeks to reduce the compliance costs faced by the private sector if they are to benefit from RTAs. Conformity assessment is practice to ensure that products meet the requirements set by a regulatory authority. Best international regulatory practices emphasizing evidence, transparency, and consultations with stakeholders help to avoid the misuse of NTMs for protectionist motives, and also help to ensure that NTMs effectively address their objectives (that is, protecting consumer safety or preserving the environment), with minimal impact on trade costs. Estimates from other FTAs and RTAs suggest that for sanitary and phytosanitary measures, the greatest cost reductions (from baseline costs) in complying with rules to access markets are associated with their harmonization, whereas for technical barriers to trade measures, the greatest cost reductions are associated with their mutual recognition of conformity assessment procedures (Figure II.B.11) (Cadot and Gourdon 2016).
But harmonizing border practices and standards regulations in developing-country members could be challenging. In most high-income countries, import controls are already risk-based, but this may not be the case in many developing countries, including TPP members. Thus, risk-based border management could prove to be a challenge for TPP developing economies such as Vietnam and Malaysia. Potential problems associated with an instrument of regulatory coherence such as harmonization is that standards may be used strategically to promote
14 Any procedure used, directly or indirectly, to determine that relevant requirements in technical regulations or standards (for instance, testing, inspection, certification, or accreditation) have been fulfilled.
GROWING CHALLENGES
II.B. THE TRANS-PACIFIC PARTNERSHIP AND ITS PoTENTIAL ECoNoMIC IMPLICATIoNS FoR DEVELoPING EAP 125

the regulatory systems of particular exporters, thus easing these exporters’ access to foreign markets.15 Finally, the costs of developing countries building capacity to advance their regulatory systems to the level of high-income countries often promoted in trade agreements could be substantial.
Figure II.B.11. Harmonization and mutual recognition of conformity assessment procedures may cut the costs of complying with NTMsPanel A. Sanitary and phytosanitary (SPS) measures Panel B. Technical barriers to trade (TBT) measuresPercentage change in compliance costs Percentage change in compliance costs
0
-2
-4
-6
-8
-10
-12
-14
-16
SPS regulations Conformity-assessment procedures
0
-5
-15
-20
-25
-30
Harmonization Mutual recognition
J Harmonization J Mutual recognition J TBT regulations J Conformity assessment procedures
Source: Adapted from Cadot and Gourdon (2016).Note: Baseline compliance costs are estimated ad valorem equivalents. Cost reduction effects are estimated coefficients using interaction terms between NTMs and deep-integration clauses.
Implementation of the TPP agreement on customs and trade facilitation is not expected to be demanding forTPPmembers,andfewcountriesareexpectedtohavedifficultymeetingtheagreement’srequirements.The provisions are generally consistent with the WTO TFA and could provide a strong platform for TPP members in Southeast Asia to push for the implementation of the ASEAN Trade in Goods Agreement. TPP members may, however, have to review their automated systems for consistency with the World Customs Organization data model. Nevertheless, improvement in trade facilitation by TPP members in East Asia is likely to have a positive spillover effect to nonmembers.
On trade in services, the TPP offers only limited liberalization, but increases the credibility of East Asian members’ existing commitments. Trade in services, including traditional services such as transportation, is still relatively restricted in East Asia compared to other regions such as Latin America and the Caribbean (Figure II.B.12) or South Asia. Even among ASEAN countries, liberalization has been limited.16 Overall, the TPP offers only limited new liberalization compared to the policies currently applied in member countries (Figure II.B.13).17 However, TPP commitments exceed those made in the WTO Doha Round. Relatedly, the TPP reduces the likelihood that members will backtrack on existing policies. In particular, it boosts the credibility of commitments to allow competition from providers from other TPP countries in business services, e-commerce, transportation, telecommunications, and financial services, including through its use of “negative lists” (see below; however, regulators can still impose measures to control foreign providers’ operations).
15 Some standards may also be inappropriate for developing country contexts as evidenced in a case study of East African dairy standards. In the East African Community, for example, harmonization of dairy standards led to the introduction of standards so stringent that few producers could comply with them (Jensen and Keyser 2012).
16 ASEAN and World Bank (2015).
17 A notable exception is Japan’s commitment to open express delivery services to international competition.
EAST ASIA AND PACIFIC ECONOMIC UPDATE APRIL 2016
126 PART II. MEDIUM-TERM DEVELoPMENT AGENDA
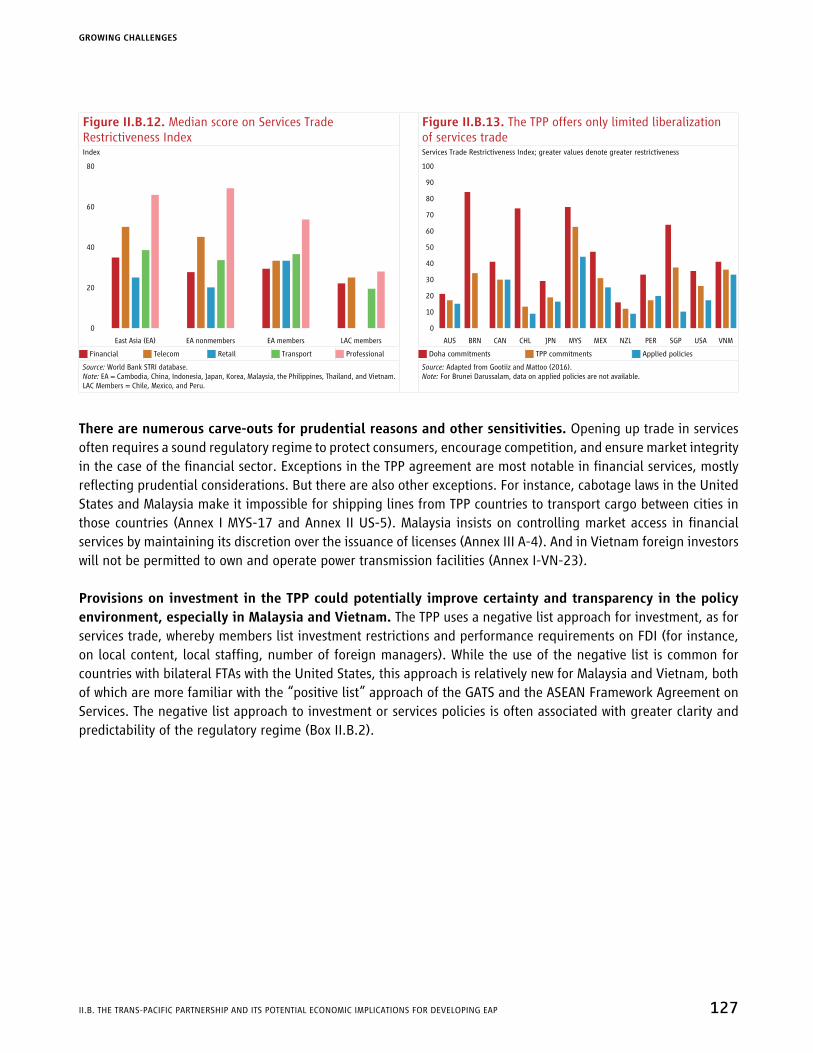
Figure II.B.12. Median score on Services Trade Restrictiveness Index
Figure II.B.13. The TPP offers only limited liberalization of services trade
Index Services Trade Restrictiveness Index; greater values denote greater restrictiveness
80
60
40
20
0
East Asia (EA) EA nonmembers EA members LAC members
100
90
80
70
60
50
40
30
20
10
0
AUS BRN CAN CHL JPN MYS MEX NZL PER SGP USA VNM
J Financial J Telecom J Retail J Transport J Professional J Doha commitments J TPP commitments J Applied policies
Source: World Bank STRI database.Note: EA = Cambodia, China, Indonesia, Japan, Korea, Malaysia, the Philippines, Thailand, and Vietnam. LAC Members = Chile, Mexico, and Peru.
Source: Adapted from Gootiiz and Mattoo (2016).Note: For Brunei Darussalam, data on applied policies are not available.
There are numerous carve-outs for prudential reasons and other sensitivities. Opening up trade in services often requires a sound regulatory regime to protect consumers, encourage competition, and ensure market integrity in the case of the financial sector. Exceptions in the TPP agreement are most notable in financial services, mostly reflecting prudential considerations. But there are also other exceptions. For instance, cabotage laws in the United States and Malaysia make it impossible for shipping lines from TPP countries to transport cargo between cities in those countries (Annex I MYS-17 and Annex II US-5). Malaysia insists on controlling market access in financial services by maintaining its discretion over the issuance of licenses (Annex III A-4). And in Vietnam foreign investors will not be permitted to own and operate power transmission facilities (Annex I-VN-23).
Provisions on investment in the TPP could potentially improve certainty and transparency in the policy environment, especially in Malaysia and Vietnam. The TPP uses a negative list approach for investment, as for services trade, whereby members list investment restrictions and performance requirements on FDI (for instance, on local content, local staffing, number of foreign managers). While the use of the negative list is common for countries with bilateral FTAs with the United States, this approach is relatively new for Malaysia and Vietnam, both of which are more familiar with the “positive list” approach of the GATS and the ASEAN Framework Agreement on Services. The negative list approach to investment or services policies is often associated with greater clarity and predictability of the regulatory regime (Box II.B.2).
GROWING CHALLENGES
II.B. THE TRANS-PACIFIC PARTNERSHIP AND ITS PoTENTIAL ECoNoMIC IMPLICATIoNS FoR DEVELoPING EAP 127

Box II.B.2. A negative list approach to services trade and investment regulation can strengthen certainty
Does an FTA’s approach to scheduling commitments matter? A negative list approach may provide for greater transparency and lend greater credibility to services trade policies and investment regulations. Knowing what is not allowed—rather than what is allowed—may help services providers better understand how they can do business in a foreign country. In addition, nonconforming measures scheduled under a negative list reflect status quo policies. Thus, businesses are better informed about the actual level of openness in an FTA partner and are directly pointed to the laws and regulations affecting their ability to contest the FTA partner’s market. Status quo bindings also maximize the credibility value of trade commitments, since foreign service suppliers are assured that actual policies will not become more restrictive.
The scheduling approach may affect an FTA’s negotiating outcome, too. Under a negative list, governments need to reveal existing nonconforming measures in the course of FTA negotiations and, if they wish to maintain those restrictions, defend their rationale. This process may create greater incentives for eliminating unwarranted restrictions. Another strong feature of negative list agreements is that they cannot apply to future services activities. Such activities may emerge from technological progress or new ways of organizing business, and an automatic commitment to free trade may preempt protectionist pressures.
Source: World Bank 2007.
TheTPPcommitstoprotectinginvestorsthroughinvestor-statedisputesettlement(ISDS)mechanisms,which allow investors to seek arbitration for losses caused by a breach of host countries’ investment obligations. A host country can take advantage of a foreign investor once that investor has sunk funds into the country; this argues for strong investor protections. on the other hand, the regulation of firms within a country is a traditionally domestic concern and countries have a number of well-accepted motives for pursuing such regulation, including public health and safety. Among the core provisions of the TPP investment chapter are: minimum standards of treatment for investments; a prohibition on expropriation without compensation; the requirement that foreign investors be treated no less well than domestic investors (“national treatment”); the requirement that each TPP country’s investors receives treatment no worse than accorded investors from any other country (“most favored nation”); and protections against “performance requirements,” such as rules requiring a certain percentage of local content. In countries with strong judicial systems, these requirements could in principle be enforced through local courts. But in countries with weaker judicial systems, a third party arbitral forum in which an investor can lodge a complaint against a national government is needed. The TPP, like many bilateral investment treaties, therefore relies on ISDS mechanisms through which investors can seek arbitration and compensation for losses caused by a breach of the TPP’s investment obligations.
This inclusion of investor-state dispute settlement mechanisms in the TPP remains a contentious issue, which may require members to strengthen their capacity to manage investors’ grievances. Popular concerns over ISDS have been fueled by several “high-profile” cases, including an investor suing the state over its minimum wage policy, a tobacco company suing the state over tobacco packaging, and a mining investor suing the state over a regional government regulation. However, the TPP investment chapter specifically preserves the right of government to regulate in the public interest.18 In addition, rulings in concluded ISDS claims have tended to favor
18 TPP article 9.16. See also, for instance, Annex 9-B on expropriation.
EAST ASIA AND PACIFIC ECONOMIC UPDATE APRIL 2016
128 PART II. MEDIUM-TERM DEVELoPMENT AGENDA
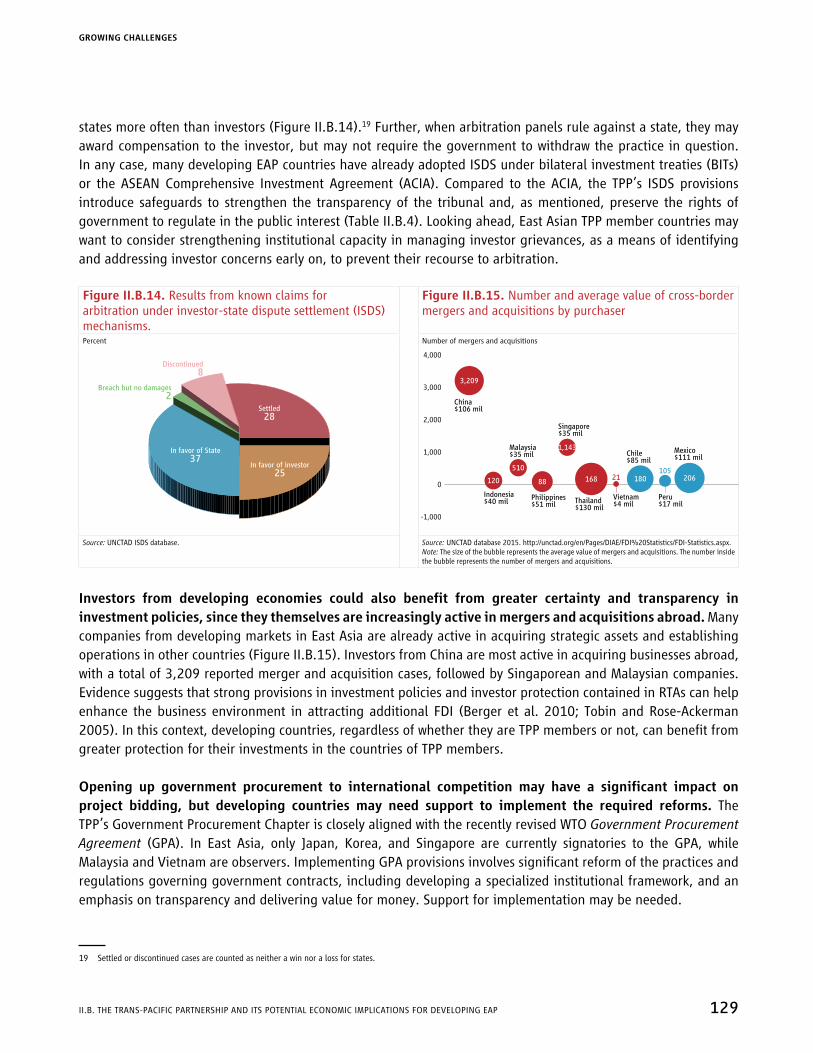
states more often than investors (Figure II.B.14).19 Further, when arbitration panels rule against a state, they may award compensation to the investor, but may not require the government to withdraw the practice in question. In any case, many developing EAP countries have already adopted ISDS under bilateral investment treaties (BITs) or the ASEAN Comprehensive Investment Agreement (ACIA). Compared to the ACIA, the TPP’s ISDS provisions introduce safeguards to strengthen the transparency of the tribunal and, as mentioned, preserve the rights of government to regulate in the public interest (Table II.B.4). Looking ahead, East Asian TPP member countries may want to consider strengthening institutional capacity in managing investor grievances, as a means of identifying and addressing investor concerns early on, to prevent their recourse to arbitration.
Figure II.B.14. Results from known claims for arbitration under investor-state dispute settlement (ISDS) mechanisms.
Figure II.B.15. Number and average value of cross-border mergers and acquisitions by purchaser
Percent Number of mergers and acquisitions
Settled
28
In favor of investor
25
In favor of State
37
Breach but no damages
2
Discontinued
8
4,000
3,000
2,000
1,000
0
-1,000
China$106 mil
Singapore$35 mil
Malaysia$35 mil
Indonesia$40 mil
Philippines$51 mil
Thailand$130 mil
Vietnam$4 mil
Chile$85 mil
Peru$17 mil
Mexico$111 mil
3,209
120
510
1,143
88 168 180 206
10521
Source: UNCTAD ISDS database. Source: UNCTAD database 2015. http://unctad.org/en/Pages/DIAE/FDI%20Statistics/FDI-Statistics.aspx.Note: The size of the bubble represents the average value of mergers and acquisitions. The number inside the bubble represents the number of mergers and acquisitions.
Investors from developing economies could also benefit from greater certainty and transparency ininvestment policies, since they themselves are increasingly active in mergers and acquisitions abroad. Many companies from developing markets in East Asia are already active in acquiring strategic assets and establishing operations in other countries (Figure II.B.15). Investors from China are most active in acquiring businesses abroad, with a total of 3,209 reported merger and acquisition cases, followed by Singaporean and Malaysian companies. Evidence suggests that strong provisions in investment policies and investor protection contained in RTAs can help enhance the business environment in attracting additional FDI (Berger et al. 2010; Tobin and Rose-Ackerman 2005). In this context, developing countries, regardless of whether they are TPP members or not, can benefit from greater protection for their investments in the countries of TPP members.
Opening up government procurement to international competitionmay have a significant impact onproject bidding, but developing countries may need support to implement the required reforms. The TPP’s Government Procurement Chapter is closely aligned with the recently revised WTO Government Procurement Agreement (GPA). In East Asia, only Japan, Korea, and Singapore are currently signatories to the GPA, while Malaysia and Vietnam are observers. Implementing GPA provisions involves significant reform of the practices and regulations governing government contracts, including developing a specialized institutional framework, and an emphasis on transparency and delivering value for money. Support for implementation may be needed.
19 Settled or discontinued cases are counted as neither a win nor a loss for states.
GROWING CHALLENGES
II.B. THE TRANS-PACIFIC PARTNERSHIP AND ITS PoTENTIAL ECoNoMIC IMPLICATIoNS FoR DEVELoPING EAP 129

Table II.B.4. Key features of ISDS in bilateral investment treaties (BITs), the ASEAN Comprehensive Investment Agreement (ACIA), and the TPP AgreementFeature Generic BIT ACIA TPP
Public participation in hearing
Normally no No Yes: “friends of the court” can submit their views about the case. The hearing will also be conducted in public.
Statute of time limitation for filing a case
Normally no limitation 3 years from the date of becoming aware of the breach of obligations
Ability for investors to pick multiple courts
Possible, depending on the terms. Older BITs are more flexible on this issue.
No, apart from an application for interim measures for preserving the investor’s rights and interests. If an investor lose against the state in ISDS, it cannot pursue the same case in a different court.
Specific prudential exceptions Mostly general referring to State’s rights to protect environment, health, and public interest
Excludes ISDS for tobacco control, and financial sector regulation.
Additional application ISDS is applicable for breaches arising from Government Procurement Chapter, and for breaches by State owned Enterprises.
Source: World Bank staff analysis.
TPP members have listed various exceptions that may insulate public procurement from increased competition, including the type of contract covered and explicit set-asides for local companies. Some of the carve-outs, such as defense contracts, are based on national security concerns. But other GPA exceptions reflect the political sensitivity of opening up government procurement to international competition (Box II.B.3).
TheTPPincludescommitmentstodisciplinetheconductofstate-ownedenterprises(SOEs),butthesemayhaveonlyalimitedimpactonlevelingtheplayingfieldforprivatecompanies.The coverage of the TPP is broader than the WTO’s rules, which focus only on the conduct of state trading enterprises. TPP members commit to ensuring that sales or purchases by SoEs are based on commercial considerations, noncommercial activities by SoEs do not cause injury to businesses of other members, and members will not discriminate in favor of SoEs. However, TPP members in East Asia have included exceptions and an adjustment period that may limit the effectiveness of the agreement.20 Countries that have extensive SoEs, such as Malaysia and Vietnam, need to strengthen their capability to track SoE activities to ensure that they comply with the TPP agreement. While exceptions for SoEs and access for small and medium-size enterprises in government procurement may be important in securing domestic support for the TPP agreement, member countries may want to address their constraints in competitiveness and governance to prevent these exceptions from turning into binding constraints in raising economic productivity.
20 For instance, companies owned by Malaysia’s Khazanah Nasional Berhad will not be subject to dispute settlement (Chapter 28) for two years after the TPP comes into force. Provisions on noncommercial assistance will not apply to SoEs controlled or owned by Singapore’s sovereign wealth fund. Brunei Darussalam will not be subject to provisions on transparency (Article 17.10) for five years after the TPP comes into force.
EAST ASIA AND PACIFIC ECONOMIC UPDATE APRIL 2016
130 PART II. MEDIUM-TERM DEVELoPMENT AGENDA

Box II.B.3. TPP government procurement chapter: examples of exceptions by Malaysia, Singapore, and Vietnam
Malaysia
• For central government agencies, procurement thresholds are above SDR 1.5 million for goods and SDR 2.0 million for services in years 1 to 4 after the TPP comes into force.
• Exclusions include: rice (husked or not), dredging services, domestic sea freight, build-operate-transfer contracts, and public works concession contracts.
• Preferences include: 30 percent of public construction services above the threshold level will be for Bumiputera; 10 percent of price preferences for Bumiputera manufacturers of goods for contracts up to RM 10 million.
Singapore
• Procurement thresholds: SDR 0.4 million for goods and services and SDR 5 million for construction.
Vietnam
• For central government agencies, procurement thresholds are SDR 2 million for goods and services and SDR 62.5 million for construction in years 1 to 5 after the TPP comes into force.
• Exclusions include: dredging services, construction in remote areas, build-operate-transfer contracts, and public works concession contracts.
Source: TPP agreement, Annex to Chapter 15.
For developing countries that do not have FTAs with the United States, certain TPP provisions on intellectual property rights could impose enforcement challenges. Strong IPR provisions have been present in all FTAs with the United States, and the TPP agreement is no exception. Weak law enforcement of IPRs by several TPP members and nonmembers has been highlighted as an issue by major developed countries, and one that is only likely to improve with additional capacity and resources.21 Another contentious issue is the potential impact on prices of stronger protection of foreign patent holders, in particular through data protection, patent linkage, and the extension of patent periods for medicines because of unreasonable delays in marketing or patent approval by member countries.22 The evidence on the impact of IPR provisions in U.S. FTAs on the domestic price of medicines is mixed: Peru did not experience price increases after signing the U.S.-Peru FTA, while Jordan experienced an average 20 percent price increase.23 While patents provide limited exclusive rights for inventors, other factors such as the scale of domestic pharmaceutical manufacturers, currency fluctuations, and competition can also affect the domestic price of medicines. In this context, TPP member countries may want to safeguard the potentially adverse impact on medicine prices by ensuring greater competition and transparency in the sourcing of medicines, especially for publicly funded health programs, and ensuring access for affordable medicines for poor households.
21 See European Commission (2015) and USTR (2014).
22 Data protection for medicines means that generic competitors cannot use the same clinical data to demonstrate the safety and effectiveness of their products. Patent linkage refers to the requirement for drug authorities of member countries to notify original patent holders of potential patent infringements stemming from any request to produce generic medicines. Members are also required to give the original patent holders the time to seek remedies should they believe that their patents have been infringed.
23 See also Faunce et al. (2010) for a discussion of the impact of the U.S.-Australia FTA on Australian medicine prices, and Gleeson et al. (2015) for a renewed debate on the subject in the context of the TPP.
GROWING CHALLENGES
II.B. THE TRANS-PACIFIC PARTNERSHIP AND ITS PoTENTIAL ECoNoMIC IMPLICATIoNS FoR DEVELoPING EAP 131

Raising labor standards is not covered by WTO rules and could be challenging for TPP member countries in East Asia. TPP provisions on labor require members to align their labor legislation and practices before the TPP comes into force. Provisions on labor standards in the TPP include the requirement for member countries to establish the fundamental rights of labor (including collective bargaining) and the elimination of forced and child labor. The United States has side letter agreements with Brunei Darussalam, Malaysia, and Vietnam to introduce changes in their labor legislation to comply with Chapter 19 of the TPP agreement. Enforcement of this provision could be challenging, since member countries may need to revisit their existing institutional mechanisms for managing employer-labor relations during labor disputes.
Quantitative Assessment of the Economic Implications of the TPP
Our evaluation of the potential economic implications of the TPP is based on a computable general equilibrium model. Box II.B.4 presents the key assumptions used in the model, and the Annex discusses the model’s methodology.24
24 The results presented in this chapter, which are a subset of those presented in World Bank (2016a), do not incorporate a reduction in investment barriers, in contrast to Petri and Plummer (2016). The impact of the reductions in import tariffs and NTMs in goods and services presented here are consistent with Petri and Plummer (2016).
Box II.B.4. Assumptions used in the model
Three assumptions are of particular importance to the results: the restrictiveness of new rules of origin, reductions in barriers to trade in services, and positive spillovers to nonmembers from regulatory harmonization.
• “Cumulative” rules of originforthe12membersconstituteanimportantefficiencyimprovementover bilateral agreements, particularly in facilitating regional production networks. However, the product-specific approach may still require some producers to replace some of their inputs with higher-cost inputs from TPP members to qualify for low TPP tariffs. The rules of origin affect the share of exports that benefit from tariff cuts; these shares are assumed to rise from 30 to 69 percent over a decade in the case of apparel, but more quickly for other products. The modeling approach also recognizes potential productivity losses, owing to strict rules of origin and the replacement of cheaper imported inputs with higher cost inputs from within the TPP. On average, it assumes a replacement of 40 percent of imported inputs with higher cost inputs from TPP members.
• Barriers to trade in servicesareestimatedindirectlyfrombilateraltradeflows(Fontagne,Guillin,andMitaritonna2011).In the modeling exercise, only half of these estimated barriers are assumed to be actionable through policy changes, and only some of these are assumed to be eliminated by the TPP. Considering the preliminary assessment of the TPP, the provisions are broadly in line with those in the existing agreement between Korea and the United States. Therefore, the fraction of actionable nontariff measure reductions is assumed to be similar to that observed in the agreement between Korea and the United States, with some modifications based on analysis of the TPP text. This fraction is derived for 21 separate issue areas, from government procurement, disputes settlement, and the environment, to tariffs and customs procedures. Calculations are based on a score from 0 to 100, with a higher score indicating larger reductions in the barriers by the TPP than other existing regional trade agreements.
(continued)
EAST ASIA AND PACIFIC ECONOMIC UPDATE APRIL 2016
132 PART II. MEDIUM-TERM DEVELoPMENT AGENDA
Potential impact on TPP member countries
The model results suggest that, by 2030, the TPP could potentially raise members’ GDPs by 0.4 percent to 10 percent, and by an average 1.1 percent for TPP members as a whole (GDP-weighted average) (Figure II.B.16). Imports and exports could increase by, respectively, 10.8 and 11.6 percent (trade-weighted average), owing to trade-liberalization-induced improvements in the terms of trade. These benefits are likely to materialize slowly, but are nonetheless expected to accelerate toward the end of the projection period. The slow start occurs because of the gradual implementation of the agreement and the time lag required for benefits to materialize. Most of the overall benefits of TPP will likely derive from reductions in NTMs, including barriers to trade in services, given that the average intra-TPP import tariff rate is already low (just 2.7 percent in 2014). Decomposing the gains, only 15 percent of the increase in GDP is expected to be due to import tariff cuts, whereas cuts in NTMs affecting goods and services are expected to account for 53 percent and 32 percent of the total GDP increase, respectively.
The largest GDP gains are likely to be seen in the smaller, relatively more protected, TPP member economies,suchasMalaysiaandVietnam(10percentand8percentby2030,respectively).Malaysia and Vietnam will benefit from lower import tariffs and NTMs at home as well as in their large export markets (World Bank 2016a). Currently, they both impose and face relatively high trade barriers.25 In addition, the economic structures of Malaysia and Vietnam are relatively complementary to those of other TPP members, so that their manufacturing activities are expected to gain significantly from TPP implementation. Liberalization under TPP should lead to terms-of-trade improvements across all TPP members (Figure II.B.16), increasing exports by up to 29 percent in the case of Vietnam. In the case of nondiscriminatory trade liberalization (positive spillovers), exports of TPP members could increase by an additional 0.8 percentage points in the case of Vietnam, and up to 3.2 percentage points in the case of Japan.
These GDP gains are mainly driven by reductions in NTMs affecting goods and services, which constitute between 70 percent of the total GDP gains in Vietnam and 96 percent in the United States. Tariff cuts,
25 Simple average MFN import tariff rates for Malaysia and Vietnam are 3.6 percent and 10.6 percent, respectively. In addition, the estimated intra-TPP trade-weighted nontariff measures by ad-valorem equivalent for both countries are high (for goods, 13 percent for Malaysia and 8.5 percent for Vietnam; for services, 15.6 percent in Malaysia, and 13.6 percent in Vietnam). Moreover, these countries face relatively high barriers in the markets of other TPP members. According to TPP commitments, the agreement will reduce import tariffs by up to 15 percentage points for Malaysian textile and apparel products and 26 percentage points for Mexican textile and apparel products. Regarding NTMs, the ad-valorem equivalent for Malaysian textile products in the United States is assumed to decrease by 15 percentage points; the highest decline of NTMs for apparel goods occurs in the case of Mexico, with a decrease of 13 percentage points.
• Nondiscriminatory reductions in nontariff measures. TPP nonmembers could potentially enjoy positive spillovers from greater transparency in NTMs, and improved customs procedures (including valuation and risk management). However, mutual recognition for technical regulations and conformity assessment, risk-based SPS import controls, and expedited clearance for express delivery are likely to be applied only to members. Estimated spillovers, defined as the share of NTM reductions that yield benefits to third countries, range from 20 to 65 percent in the literature (Francois et al. 2013, Kawasaki 2014; based on examining barriers identified by business survey such as Copenhagen Economics 2009). This model assumes 20 percent spillovers to nonmembers, similar to European Commission (2013).
(Box II.B.5 continued)
GROWING CHALLENGES
II.B. THE TRANS-PACIFIC PARTNERSHIP AND ITS PoTENTIAL ECoNoMIC IMPLICATIoNS FoR DEVELoPING EAP 133
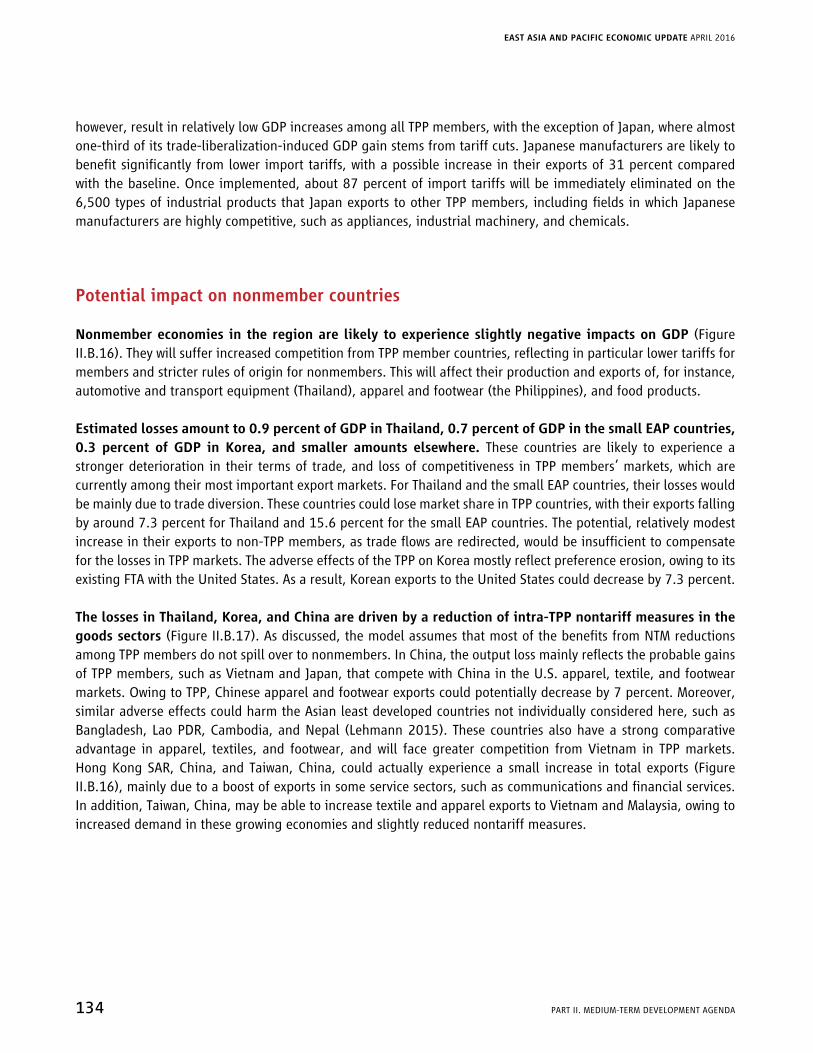
however, result in relatively low GDP increases among all TPP members, with the exception of Japan, where almost one-third of its trade-liberalization-induced GDP gain stems from tariff cuts. Japanese manufacturers are likely to benefit significantly from lower import tariffs, with a possible increase in their exports of 31 percent compared with the baseline. Once implemented, about 87 percent of import tariffs will be immediately eliminated on the 6,500 types of industrial products that Japan exports to other TPP members, including fields in which Japanese manufacturers are highly competitive, such as appliances, industrial machinery, and chemicals.
Potential impact on nonmember countries
Nonmember economies in the region are likely to experience slightly negative impacts on GDP (Figure II.B.16). They will suffer increased competition from TPP member countries, reflecting in particular lower tariffs for members and stricter rules of origin for nonmembers. This will affect their production and exports of, for instance, automotive and transport equipment (Thailand), apparel and footwear (the Philippines), and food products.
Estimated losses amount to 0.9 percent of GDP in Thailand, 0.7 percent of GDP in the small EAP countries, 0.3 percent of GDP in Korea, and smaller amounts elsewhere. These countries are likely to experience a stronger deterioration in their terms of trade, and loss of competitiveness in TPP members’ markets, which are currently among their most important export markets. For Thailand and the small EAP countries, their losses would be mainly due to trade diversion. These countries could lose market share in TPP countries, with their exports falling by around 7.3 percent for Thailand and 15.6 percent for the small EAP countries. The potential, relatively modest increase in their exports to non-TPP members, as trade flows are redirected, would be insufficient to compensate for the losses in TPP markets. The adverse effects of the TPP on Korea mostly reflect preference erosion, owing to its existing FTA with the United States. As a result, Korean exports to the United States could decrease by 7.3 percent.
The losses in Thailand, Korea, and China are driven by a reduction of intra-TPP nontariff measures in the goods sectors (Figure II.B.17). As discussed, the model assumes that most of the benefits from NTM reductions among TPP members do not spill over to nonmembers. In China, the output loss mainly reflects the probable gains of TPP members, such as Vietnam and Japan, that compete with China in the U.S. apparel, textile, and footwear markets. Owing to TPP, Chinese apparel and footwear exports could potentially decrease by 7 percent. Moreover, similar adverse effects could harm the Asian least developed countries not individually considered here, such as Bangladesh, Lao PDR, Cambodia, and Nepal (Lehmann 2015). These countries also have a strong comparative advantage in apparel, textiles, and footwear, and will face greater competition from Vietnam in TPP markets. Hong Kong SAR, China, and Taiwan, China, could actually experience a small increase in total exports (Figure II.B.16), mainly due to a boost of exports in some service sectors, such as communications and financial services. In addition, Taiwan, China, may be able to increase textile and apparel exports to Vietnam and Malaysia, owing to increased demand in these growing economies and slightly reduced nontariff measures.
EAST ASIA AND PACIFIC ECONOMIC UPDATE APRIL 2016
134 PART II. MEDIUM-TERM DEVELoPMENT AGENDA
Figure II.B.16. Country-specific impact of the TPP: GDP, exports, and terms of trade by 2030Vietnam and Malaysia are likely to be among the TPP members benefiting most. As a result of shrinking market access and greater competition in export markets, GDP in Thailand, the Republic of Korea, and other EAP countries could be set back. Hong Kong SAR, China and Taiwan, China benefit from positive spillovers and experience an increase in exports.A. Change in GDP: TPP members B. Change in GDP: nonmembersPercent Percent
11
7
3
-1
AUS BRN CAN CHL JPN MYS MEX NZL PER SGP USA VNM
0.2
-0.2
-0.6
-1.0
CHN EAP nei HKG IDN KOR PHL TWN THA
C. Change in exports: TPP members D. Change in exports: nonmembersPercent Percent
30
20
10
0
AUS BRN CAN CHL JPN MYS MEX NZL PER SGP USA VNM
1
-1
-3
-5
CHN EAP nei HKG IDN KOR PHL TWN THA
J Positive spillovers J No spillovers J Positive spillovers J No Spillovers
E. Change in terms of trade: TPP members F. Change in terms of trade: nonmembersPercentage points Percentage points
5
3
1
-1
AUS BRN CAN CHL JPN MYS MEX NZL PER SGP USA VNM
0
-0.5
-1.0
-1.5
CHN EAP nei HKG IDN KOR PHL TWN THA
Source: Petri and Plummer 2016.Note: “EAP nei” includes Cambodia, Lao PDR, Myanmar, and Timor-Leste.
GROWING CHALLENGES
II.B. THE TRANS-PACIFIC PARTNERSHIP AND ITS PoTENTIAL ECoNoMIC IMPLICATIoNS FoR DEVELoPING EAP 135

Figure II.B.17. Country-specific impact of the TPP: decomposition of income results by 2030Japan and the United States are likely to be among the TPP members benefiting most from the reduction in NTMs in goods and services. In contrast, Thailand, the Republic of Korea, and China are likely to experience income losses mainly driven by reductions in NTMs in the goods sectors.A. Income gains: TPP members B. Changes in income: nonmembersPercent of GDP Percent of GDP
8
7
6
5
4
3
2
1
0
AUS BRN CAN CHL JPN MYS MEX NZL PER SGP USA VNM
0.8
0.6
0.4
0.2
0
-0.2
-0.4
-0.6
-0.8
-1.0
-1.2
CHN EAP nei HKG IDN KOR PHL TWN THA
J Services NTMs J Goods NTMs J Tariffs & TRQs J Services NTMs J Goods NTMs J Tariffs & TRQs
Source: Petri and Plummer 2016.Note: “EAP nei” includes Cambodia, Lao PDR, Myanmar, and Timor-Leste. NTMs = nontrade measures; TRQs = tariff rate quotas.
Overallsector-specificimpacts
The textile and garment sector could see a relatively large increase in output and exports, owing to the high level of reductions in import tariffs and nontariff measures, coupled with the comparative advantage of many TPP members in the sector (Figure II.B.18). For example, Vietnam’s textile and garment exports could expand by as much as 70 percent by 2030, following the reduction in import tariffs of up to 25 percent on some product categories in export markets such as the United States. All other manufacturing sectors could potentially increase their output and exports by 9.7 and 12.9 percent on average, respectively, while the services sector is likely to remain lagging, with a potential increase in output of about 5 percent.
Given this increased competition from TPP members, nonmember countries are likely to suffer from trade diversion and preference erosion, reducing their production and exports of apparel, footwear, transportation equipment, and food products. For instance, in the Philippines, apparel and footwear exports could decline by 19 percent, while in Thailand transport equipment exports could decrease by 6 percent. Thus, the TPP is likely to trigger significant sectoral shifts as resources are shifted away from the manufacturing sectors of nonmember economies toward segments of their services sector, in turn expanding their services output and exports.
For developing EAP, TPP implementation may entail significant adjustment costs, which need to beaddressed. Reforms in member countries, and erosion of market access in nonmember countries, may cause unemployment and wage losses, as workers and capital face obstacles in moving from contracting to expanding sectors, and from less to more productive firms.26 Tackling the constraints to the reallocation of labor and capital,
26 See the discussion of trade adjustment costs in Porto and Hoekman (2010).
EAST ASIA AND PACIFIC ECONOMIC UPDATE APRIL 2016
136 PART II. MEDIUM-TERM DEVELoPMENT AGENDA

and putting in place an effective temporary program to assist displaced workers, will be important in winning support for TPP implementation.
Figure II.B.18. Sector-specific impact of the TPP: output and exports by 2030Among TPP members, textile and garment industries are likely to expand their output and exports the most. As a result, these industries will probably shrink in nonmember countries, while their services sectors are likely to increase their production and exports.A. Change in output and exports: TPP members B. Change in output and exports: nonmembersPercent Percent
0 702010 30 40 50 60
Grains
Other agriculture
Mining
Food, beverages, tobacco
Textiles
Apparel, footwear
Chemicals
Metals
Transport equipment
Electrical equipment
Machinery
Other manufacturing
Utilities
Construction
Trade and transport
Communications
Finance
Business services
Social services
-8 6-4-6 -2 0 2 4
Grains
Other agriculture
Mining
Food, beverages, tobacco
Textiles
Apparel, footwear
Chemicals
Metals
Transport equipment
Electrical equipment
Machinery
Other manufacturing
Utilities
Construction
Trade and transport
Communications
Finance
Business services
Social services
J Output J Exports J Output J Exports
Source: Petri and Plummer 2016.Note: Considered nonmember countries include China; Hong Kong SAR, China; Taiwan, China; Indonesia; Republic of Korea; the Philippines; Thailand; and EAP nei (Cambodia, Lao PDR, Myanmar, and Timor-Leste).
Implementation of the TPP agreement could be used as a stepping stone for greater economic integration amongalloftheeconomiesofthePacificRim.In addition to the TPP, major new regional trade agreements currently under negotiation include the Regional Comprehensive Economic Partnership (RCEP), with 16 Asian economies, and the even larger Free Trade Area of the Americas and the Pacific (FTAAP), with 21 Asia-Pacific Economic Cooperation (APEC) economies. Comparing the potential impacts of the three agreements (Figure II.B.19), the gains from economic integration would be maximized in the case of the FTAAP, which spans the widest regional membership. In particular, enlarging the TPP into the FTAAP would significantly increase total GDP gains, from 0.5 percent to 2.3 percent of total FTAAP GDP. Even TPP members would gain slightly, with a larger increase in GDP and exports in Vietnam, Malaysia, Japan, Peru, Mexico, and Chile. For the nonmember countries, the average losses under TPP would be replaced by gains of 3.1 percent, on a GDP-weighted average. Taiwan, China; Thailand; Korea; and the Philippines benefit most from the FTAAP, which provides improved access to a higher number of markets, with a share of intra-RTA trade of 65 percent. The RCEP and FTAAP scenarios assume around a 90 percent reduction in tariff lines, and 30 and 28 percent nontariff measure cuts, respectively. The usage of access to special duty treatment by exporters (preference utilization) is assumed to be greatest under the FTAAP (at 78 percent), owing to the size of the agreement, smaller under the TPP (at 64 percent), and smallest under the RCEP (at 50 percent).27
27 Conducted simulations recognize that tariff preferences under RTAs are not fully utilized by the trade flows they cover. Empirical evidence suggests that observed utilization rates are typically far below unity (Athukorala and Kohpaiboon 2011; Kawai and Wignaraja 2011). Therefore, preference utilization is modeled as a function of the size of the preference margin and the size of agreements. Large tariff preference margins and large-scale agreements make it more likely that the agreement will be utilized (Petri and Plummer 2016).
GROWING CHALLENGES
II.B. THE TRANS-PACIFIC PARTNERSHIP AND ITS PoTENTIAL ECoNoMIC IMPLICATIoNS FoR DEVELoPING EAP 137

Figure II.B.19. Country-specific impact of the TPP, FTAAP, and RCEP: GDP and exports by 2030FTAAP is expected to be the most beneficial among the three RTAs, resulting in large gains both for TPP members and nonmembersA. Change in GDP: TPP members B. Change in GDP: nonmembersPercent Percent
12
10
8
6
4
2
0
AUS BRN CAN CHL JPN MYS MEX NZL PER SGP USA VNM
20
15
10
5
0
-5
CHN EAP nei HKG IDN KOR PHL TWN THA
J TPP J FTAAP J RCEP J TPP J FTAAP J RCEP
C. Change in exports: TPP members D. Change in exports: nonmembersPercent Percent
70
60
50
40
30
20
0
AUS BRN CAN CHL JPN MYS MEX NZL PER SGP USA VNM
10
90
70
50
30
10
-10
CHN EAP nei HKG IDN KOR PHL TWN THA
J TPP J FTAAP J RCEP J TPP J FTAAP J RCEP
Source: Petri and Plummer 2016.Note: “EAP nei” includes Cambodia, Lao PDR, Myanmar, and Timor-Leste.
The TPP and the Way Forward for Deeper Trade and Investment Integration in Developing East Asia
The TPP is one of the most comprehensive regional trade agreements to date. It seeks to deepen economic integration among its members by securing commitments for trade and investment liberalization, and to widen the coverage of commitments on some issues beyond the current WTO rules. The fact that the TPP addresses issues not addressed in previous RTAs will have wide implications beyond the region, and set a precedent for the ongoing negotiation of other agreements. The strategic importance of the TPP to trade integration in East Asia goes well beyond assessing market access and the relative benefits and costs to member and nonmember countries from developing East Asia. one positive outcome could be that it will prove a catalyst to other negotiations in multilateral fora, especially the WTo, to other regional and bilateral negotiations in East Asia, and to fostering unilateral reforms by both TPP members and nonmembers across developing East Asia.
EAST ASIA AND PACIFIC ECONOMIC UPDATE APRIL 2016
138 PART II. MEDIUM-TERM DEVELoPMENT AGENDA
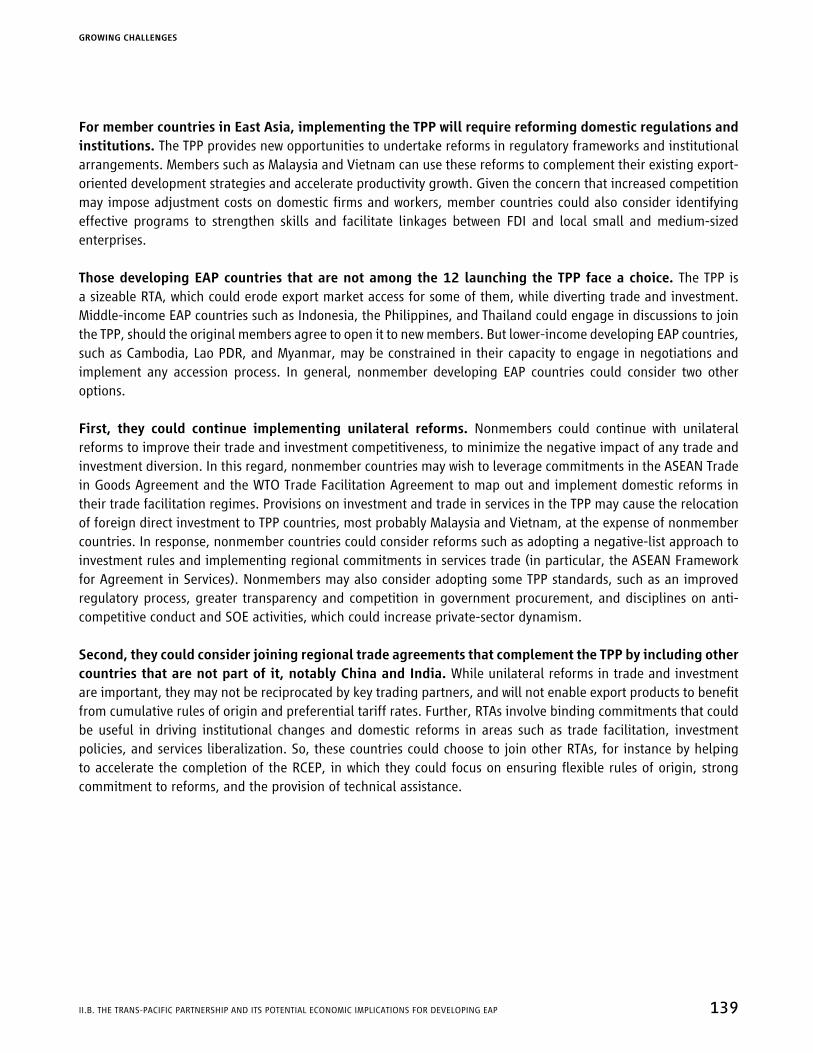
For member countries in East Asia, implementing the TPP will require reforming domestic regulations and institutions. The TPP provides new opportunities to undertake reforms in regulatory frameworks and institutional arrangements. Members such as Malaysia and Vietnam can use these reforms to complement their existing export-oriented development strategies and accelerate productivity growth. Given the concern that increased competition may impose adjustment costs on domestic firms and workers, member countries could also consider identifying effective programs to strengthen skills and facilitate linkages between FDI and local small and medium-sized enterprises.
Those developing EAP countries that are not among the 12 launching the TPP face a choice. The TPP is a sizeable RTA, which could erode export market access for some of them, while diverting trade and investment. Middle-income EAP countries such as Indonesia, the Philippines, and Thailand could engage in discussions to join the TPP, should the original members agree to open it to new members. But lower-income developing EAP countries, such as Cambodia, Lao PDR, and Myanmar, may be constrained in their capacity to engage in negotiations and implement any accession process. In general, nonmember developing EAP countries could consider two other options.
First, they could continue implementing unilateral reforms. Nonmembers could continue with unilateral reforms to improve their trade and investment competitiveness, to minimize the negative impact of any trade and investment diversion. In this regard, nonmember countries may wish to leverage commitments in the ASEAN Trade in Goods Agreement and the WTO Trade Facilitation Agreement to map out and implement domestic reforms in their trade facilitation regimes. Provisions on investment and trade in services in the TPP may cause the relocation of foreign direct investment to TPP countries, most probably Malaysia and Vietnam, at the expense of nonmember countries. In response, nonmember countries could consider reforms such as adopting a negative-list approach to investment rules and implementing regional commitments in services trade (in particular, the ASEAN Framework for Agreement in Services). Nonmembers may also consider adopting some TPP standards, such as an improved regulatory process, greater transparency and competition in government procurement, and disciplines on anti-competitive conduct and SoE activities, which could increase private-sector dynamism.
Second, they could consider joining regional trade agreements that complement the TPP by including other countries that are not part of it, notably China and India. While unilateral reforms in trade and investment are important, they may not be reciprocated by key trading partners, and will not enable export products to benefit from cumulative rules of origin and preferential tariff rates. Further, RTAs involve binding commitments that could be useful in driving institutional changes and domestic reforms in areas such as trade facilitation, investment policies, and services liberalization. So, these countries could choose to join other RTAs, for instance by helping to accelerate the completion of the RCEP, in which they could focus on ensuring flexible rules of origin, strong commitment to reforms, and the provision of technical assistance.
GROWING CHALLENGES
II.B. THE TRANS-PACIFIC PARTNERSHIP AND ITS PoTENTIAL ECoNoMIC IMPLICATIoNS FoR DEVELoPING EAP 139

Annex
Methodology
The evaluation of potential economic implications of the TPP is based on a computable general equilibrium model as originally described in Zhai (2008). See World Bank (2016a), Chapter 4, methodological Annex, for details of the analytical approach.
In general, this multiregional dynamic computable general equilibrium model is particularly well suited to analyzing trade policies and trade links, because it allows for the emergence of trade in products (new varieties) that were not previously traded between pairs of countries. Despite having well-developed dynamic features (through savings and investment), the model lacks positive dynamic feedback loops in member countries, such as the accumulation of knowledge and the absorption of foreign technology through TPP-facilitated foreign direct investment. As a result, the benefits derived here could underestimate the eventual impact on member countries and, therefore, represent the lower bound of potential gains.
Conversely, TPP-driven productivity increases in member countries could undermine the competitiveness of nonmember countries and exacerbate the detrimental effects on nonmember countries. Further, the harmonization of labor and environmental standards within the TPP, not explicitly modeled in this study, could have important implications for participating developing countries. While such harmonization has social and environmental benefits that cannot be overlooked, it may also affect the competitiveness of firms in countries that currently do not meet such standards, undermining the economic gains.
While a detailed assessment will take time, this analysis and its assumptions are based on a preliminary assessment of the agreement published in early November 2015. The results rest on planned tariff cuts in accordance with the provisions of the TPP, and on several key assumptions about the theoretically desirable and politically feasible cuts in nontariff measures, dubbed “actionable,” and the actual cuts likely to follow from the implementation of the TPP. The macroeconomic effects of the TPP are evaluated relative to a baseline scenario that includes preexisting trade agreements among member countries (for example, NAFTA, AFTA, the ASEAN-Japan FTA, the ASEAN-Australia-New Zealand FTA, and the P4 Agreement ).28
28 The P4 Agreement is the Pacific 4 free trade agreement among Brunei Darussalam, Chile, Singapore, and New Zealand.
EAST ASIA AND PACIFIC ECONOMIC UPDATE APRIL 2016
140 PART II. MEDIUM-TERM DEVELoPMENT AGENDA

References
ASEAN (Association of Southeast Asian Nations) and World Bank. 2015. “ASEAN Services Integration Report.” Association of Southeast Asian Nations and World Bank, Washington, DC.
Athukorala, Prema-chandra, and Archanun Kohpaiboon. 2011. “Australia-Thailand Trade: Has the FTA Made a Difference?” Working Papers in Trade and Development No. 2011/12, Canberra: Arndt-Corden Department of Economics, Crawford School of Economics and Government, Australian National University, Canberra.
Berger, Axel, Matthias Busse, Peter Nunnenkamp, and Martin Roy. 2010. “Do Trade and Investment Agreements Lead to More FDI? Accounting for Key Provisions inside the Black Box.” Kiel Working Paper No. 1647, Kiel Institute for the World Economy, Kiel, Germany.
Cadot, Olivier, and Julien Gourdon. 2016. “Non-tariff measures, preferential trade agreements, and prices: new evidence.” Review of World Economics January: 1–23.
Copenhagen Economics. 2009. “Assessment of Barriers to Trade and Investment between the EU and Japan.” Final Report. Copenhagen Economics, Copenhagen. http://trade.ec.europa.eu/doclib/docs/2012/july/tradoc_149809.pdf.
Elliott, Kimberly Ann. 2016. “Rules of origin in Textiles and Apparel.” In Assessing the Trans-Pacific Partnership, Volume 1: Market Access and Sectoral Issues. Washington, DC: Peterson Institute for International Economics, Chapter 5.
European Commission. 2012. Impact Assessment Report on EU-Japan Trade Relations. Brussels: European Commission. http://trade.ec.europa.eu/doclib/docs/2012/july/tradoc_149809.pdf.
———. 2013. “Reducing Transatlantic Barriers to Trade and Investment: an Economic Assessment.” Centre for Economic Policy Research, London. http://trade.ec.europa.eu/doclib/docs/2013/march/tradoc_150737.pdf.
———. 2015. “Report on the protection and enforcement of intellectual property rights in third countries.” European Commission, Brussels.
Faunce, Thomas, Jimmy Bai, and Dun Nguyen. 2010. “Impact of the Australia-U.S. Free Trade Agreement on the Australian Medicines Regulation and Prices.” Journal of Generic Medicines 7 (1): 18–29.
Fontagne, L., A. Guillin, and C. Mitaritonna. 2011. “Estimations of Tariff Equivalents for the Services Sector.” Centre d’Études Prospectives et d’Informations Internationales (CEPII) Working Papers 2011–24, Paris.
Francois, J., M. Manchin, H. Norberg, O. Pindyuk, and P. Tomberger. 2013. “Reducing Transatlantic Barriers to Trade and Investment: an Economic Assessment.” Center for Economic Policy Research, London.
Gawande, Kishore, and Usree Bandyopadhay. 2000. “Is Protection for Sale? Evidence on the Grossman-Helpman Theory of Endogenous Protection.” The Review of Economics and Statistics 82 (1): 139–152.
Gleeson, Deborah, Hazel Moir, and Ruth Lopert. 2015. “Costs to Australian taxpayers of pharmaceutical monopolies and proposals to extend them in the Trans-Pacific Partnership Agreement.” Medical Journal of Australia 202 (6): 306–308. https://www.mja.com.au/system/files/issues/gle01682.pdf.
Gootiiz, Batshur and Aaditya Mattoo. 2016. “Unleashing the Next Engine of Growth: An Agenda for Services Trade beyond Doha and TPP.” http://pubdocs.worldbank.org/pubdocs/publicdoc/2016/3/797541457379459380/Policy-Research-Talk-Aaditya-Mattoo-Final.pdf.
International Monetary Fund. 2015. World Economic Outlook. Washington, DC: International Monetary Fund, Washington, DC, October.
GROWING CHALLENGES
II.B. THE TRANS-PACIFIC PARTNERSHIP AND ITS PoTENTIAL ECoNoMIC IMPLICATIoNS FoR DEVELoPING EAP 141

Jensen, Michael F., and John C. Keyser. 2012. “Standards Harmonisation and Trade: The Case of the East African Dairy Industry.” In Non-Tariff Measures – A Fresh Look at Trade Policy’s New Frontier, edited by Olivier Cadot and Mariem Malouche. Washington, DC: World Bank.
Kawai, Masahiro, and Ganeshan Wignaraja. 2011. Asia’s Free Trade Agreements: How Is Business Responding? Cheltenham, UK: Edward Elgar.
Kawasaki, K. 2014. “The Relative Significance of EPAs in Asia-Pacific.” Discussion Paper Series 14-E-009, Research Institute of Economy, Trade and Industry (RIETI), Tokyo, Japan.
Kee, H. L., A. Nicita, and M. olarreaga. 2008. “Import Demand Elasticities and Trade Distortions.” The Review of Economics and Statistics 90 (4): 666–682.
Lehmann, J. P. 2015. “The TPP, the WTO, the 21st Century Global Trade Mess and the Poverty of Nations,” Forbes, August 3.
oECD and WTo (organisation for Economic Co-operation and Development and World Trade organization). 2015. “Measuring Trade in Value Added: An oECD-WTo joint initiative.” organisation for Economic Co-operation and Development and World Trade Organization, Paris.
okabe, Misa. 2015. “Impact of Free Trade Agreements in East Asia.” ERIA Discussion Paper No. 1, Economic Research Institute for ASEAN and East Asia, Jakarta.
oliver, S. 2015. “How Quickly Are Tariffs Eliminated in the TPP?” Trade and Investment Policy Watch Blog, Peterson Institute for International Economics, Washington, DC, December 2.
———. 2016. “Auto Sector Liberalization.” In Assessing the Trans-Pacific Partnership, Volume 1: Market Access and Sectoral Issues. Washington, DC: Peterson Institute for International Economics, Chapter 4.
Peterson Institute for International Economics. 2016. Assessing the Trans-Pacific Partnership, Volume 1: Market Access Issues. Washington, DC: Peterson Institute for International Economics, Chapter 4.
Petri, P., and M. Plummer. 2016. (forthcoming). “Mega-Regional Trade Agreements and Developing Economies.” World Bank, Washington, DC.
Petri, P., M. Plummer, and F. Zhai. 2012. “The Trans-Pacific Partnership and Asia-Pacific Integration: A Quantitative Assessment.” Peterson Institute for International Economics, Washington, DC.
Porto, Guido and Bernard Hoekman (eds). 2010. “Trade Adjustment Costs in Developing Countries: Impacts, Determinants, and Policy Responses.” Center for Economic Policy Research and World Bank.
Tobin, J., and S. Rose-Ackerman. 2005. “Foreign Direct Investment and the Business Environment in Developing Countries: The Impact of Bilateral Investment Treaties.” Working Paper, Yale Center for Law, Economics, and Public Policy, New Haven.
Trefler, D. 2001. “The long and short of the Canada-U.S. free trade agreement.” National Bureau of Economic Research Working Paper 8293, National Bureau of Economic Research, Cambridge, Massachusetts.
USTR (United States Trade Representative). 2014. “2014 Special 301 Report of USTR.” United States Trade Representative, Washington, DC. https://ustr.gov/sites/default/files/USTR%202014%20Special%20301%20Report%20to%20Congress%20FINAL.pdf.
World Bank. 2007. “Trade Issues in Asia: Liberalization Trade in Services.” World Bank, Washington, DC.
———. 2016a. “Potential Macroeconomic Implications of the Trans-Pacific Partnership.” In Global Economic Prospects 2016: Spillovers amid Weak Growth. Washington DC: World Bank, Chapter 4.
———. 2016b. (forthcoming). Vietnam 2035: A Prosperous Country, Creative People, and Just Society. Washington DC: World Bank.
EAST ASIA AND PACIFIC ECONOMIC UPDATE APRIL 2016
142 PART II. MEDIUM-TERM DEVELoPMENT AGENDA

Zhai, F. 2008. “Armington Meets Melitz: Introducing Firm Heterogeneity in a Global CGE Model of Trade.” Journal of Economic Integration 23 (3): 575–604.
Zhang Yunling, and Mingui Shen. 2011. “The Status of East Asian Free Trade Agreements.” ADBI Working Paper Series No 282, African Development Bank Institute, Tokyo. May.
GROWING CHALLENGES
II.B. THE TRANS-PACIFIC PARTNERSHIP AND ITS PoTENTIAL ECoNoMIC IMPLICATIoNS FoR DEVELoPING EAP 143

II.C. Reaping Digital Dividends in East Asia and Pacific1
The East Asian economic miracle was built on a foundation of industrialization and globalization that predates the digital age. How is the rapid spread of digital technologies—the internet, smartphones, and all the other tools to collect, store, analyze, and share information digitally—affecting the development trajectory of this region? Are digital technologies enabling East Asia and Pacific (EAP) countries to maintain their global preeminence in growth generation and job creation? Or are these economies walking into new risks of winner-take-all businesses and hollowed-out labor markets that will swallow their future development gains? This study, drawing on the work done for World Development Report 2016: Digital Dividends, examines the readiness of EAP countries to benefit from, and to deal with, the challenges posed by, the digital revolution. It finds that while the EAP region is doing better than others in reaping dividends from its digital investments, there are significant intraregional variations. For the Pacific Islands and low-income EAP countries, internet use is still low, and the priority is to build the foundations, mostly by making adoption easier. For the middle-income EAP countries, the urgency is to expand opportunities for all by raising the capabilities of firms and workers to effectively participate in the digital economy. And for the high-income EAP countries, where internet use is already high, there is a need to tackle the challenges the internet creates, including the risk of winner-take-all businesses and hollowed-out labor markets, while fostering an ecosystem that facilitates the creation and diffusion of more advanced technologies. Across all countries, policy should focus on developing the essential “analog complements” to digital technologies. This involves, first, developing a procompetition regulatory regime where firms can leverage the internet to compete and innovate for the benefit of consumers. Second, adapting workers’ skills to the demands of the new economy. Third, ensuring that institutions are accountable, so that governments have an incentive to use digital technologies effectively to empower citizens and deliver services.
Rapid digital transformation
Liketherestoftheworld,theEastAsiaandPacific(EAP)regionhasbecomemoreconnectedthanever.On average, in EAP more than 85 in 100 people own a mobile phone and 40 in 100 use the internet, levels that are similar to the rest of the world.2 The percentage of individuals using the internet in EAP has increased twelvefold since 2000 (Figure II.C.1, Panel A). Japan has the highest percentage of internet users in EAP (91 percent), while Timor-Leste has the lowest (1.1 percent). Many of the Pacific Islands, which were only recently linked by undersea cable, have seen a steady increase in internet access, though they are still among the least connected parts of the world economy, with a 19 percent user rate in 2014.
There is considerable variation in the spread of the internet among developing EAP countries. The level of adoption is strongly correlated with the level of income (Figure II.C.1, Panel B); for example, the percentage of people using the internet in 2014 in Malaysia is twice that of Thailand and four times that of Indonesia. China and
1 Prepared by Deepak Mishra, Co-director, World Development Report 2016, with inputs from the World Development Report 2016 team.
2 Mobile phone ownership data are from the Gallup World Poll, and internet use data are from the International Telecommunication Union (ITU). In 2014, the unweighted average of internet users across EAP countries equaled 40 percent; the population-weighted average equaled 46 percent.
EAST ASIA AND PACIFIC ECONOMIC UPDATE APRIL 2016
144 PART II. MEDIUM-TERM DEVELoPMENT AGENDA

Vietnam have seen large and sustained growth in internet users over the last decade, while the Philippines has experienced an explosion of internet adoption since 2009. Despite rapid diffusion, the gap in internet adoption between countries, say Malaysia and Myanmar, is as large as the gap in access to physical infrastructure such as electricity or clean water. This could change as the pace of internet diffusion picks up in poorer countries and levels off in higher-income economies. For example, Myanmar could become one of the fastest-growing internet markets in the world following the ongoing liberalization of its telecom sector.
Figure II.C.1. While the internet has spread rapidly, there is considerable variation within the EAP regionPercentage of individuals using the internet, 2000–14
Panel A Panel B90
80
70
60
50
40
30
20
10
0
2006 2008 2010 2012 2014200420022000
70
60
50
40
30
20
10
0
2006 2008 2010 2012 2014200420022000
▬ EAP high-income ▬ EAP w/o islands ▬ EAP all ▬ Malaysia ▬ China ▬ Vietnam ▬ Philippines ▬ Thailand
▬ EAP developing ▬ EAP islands ▬ World ▬ Indonesia ▬ Lao PDR ▬ Cambodia ▬ Myanmar
Sources: ITU 2015; World Development Report 2016.Note: The ITU estimates the number of internet users through official household surveys carried out by national statistical offices. In the absence of official household surveys, the ITU estimates the number (internet users as a percentage of total population) using various econometric techniques. For some countries, ITU numbers could be significantly different from those produced by national authorities, though it is one of the few sources that produce data comparable across countries. EAP countries for which internet data are available are grouped as follows: Islands (Papua New Guinea, Samoa, the Solomon Islands, Timor-Leste, Tonga, Tuvalu, and Vanuatu); High-income EAP (Australia; Brunei Darussalam; Hong Kong SAR, China; Japan; Republic of Korea; Macao SAR, China; New Zealand; Singapore; and Taiwan, China); and Developing EAP (Cambodia, China, Indonesia, Lao PDR, Malaysia, Mongolia, Myanmar, the Philippines, Thailand, and Vietnam).
The spreadof digital technologies is not confined topeople, buthasdiffused equally rapidly amongbusinesses and governments. Nearly 6 of 10 EAP businesses had an internet connection, compared to 5 of 10 in the rest of the world during 2010–14. Similarly, by 2014, all EAP countries had national websites: 16 allowed residents to file income taxes electronically, and 15 had online means to search ownership or register property. For the most common core government administrative systems, 30 countries had automated financial management, 25 used such systems for customs processing, 24 for tax management, and 16 had some form of digital identification.3
The level of adoption of digital technologies, however, varies greatlywithin EAP, reflecting thewideinterregional diversity in its level of development. The overall adoption level in EAP as measured by the Digital Adoption Index, which was constructed as part of World Development Report 2016 (Box II.C.1), is positively correlated with the level of per capita income (Figure II.C.2).4 The EAP countries exhibit a similar pattern as the rest of the world except in the adoption of technology in governments, where the high level of heterogeneity within EAP is significantly higher than the rest of the world. The heterogeneity is not just in the level of adoption, but also in the type of technologies and the intensity of use. For example, many firms in the high-income EAP countries use
3 World Bank, Doing Business, 2015; World Bank, ID4D (Identification for Development database), World Bank, Washington, DC, http://data.worldbank.org/data-catalog/id4d-dataset, 2015; World Bank, Global E-Government Systems (database), http://data.worldbank.org/data-catalog/pfm-systems-eservices-dataset, 2015.
4 The Digital Adoption Index (DAI) is a composite index measuring the spread of digital technologies within and across countries. It is based on 16 indicators, which are aggregated into three sectoral clusters covering businesses, people, and governments, with each subindex assigned an equal weight, that is, DAI (Economy) = DAI (Businesses) + DAI (People) + DAI (Governments). The analytical underpinning for DAI is provided in World Development Report 2016. To achieve a more complete dataset, values for some indicators for some countries are imputed based on per capita income, geographic region, and a “predictor” indicator. The methodology and dataset for DAI are available at www.digitaladoptionindex.org.
GROWING CHALLENGES
II.C. REAPING DIGITAL DIVIDENDS IN EAST ASIA AND PACIFIC 145
fairly sophisticated digital technologies, such as radio frequency identification technologies, enterprise resource planning, online commerce, and cloud computing, while firms in developing EAP countries use more basic technologies such as personal computers, smart phones, social media, and electronic mail.
Figure II.C.2. As in the rest of the world, digital technologies have spread rapidly in the EAP regionScatterplots between Digital Adoption Index and per capita income
Business People Government1.0
0.8
0.6
0.4
0.2
0
100 100 1001,000 1,000 1,00010,000 10,000 10,000100,000 100,000 100,000
Q EAP Q Rest of the world ▬ EAP ▬ RoW
Source: World Development Report 2016.Note: The figures show the diffusion of digital technologies across countries as measured by the Digital Adoption Index described in detail in World Development Report 2016. RoW = rest of the world.
Box II.C.1. Measuring the spread of digital technologies among EAP countries
Tobenefitfromthedigitalrevolution,onehastobepartofit.This has meant an implicit race among countries to connect their businesses, people, and governments to digital technologies. Which countries are forging ahead and which are falling behind has become a national obsession in many countries. Yet, there are no broad and reliable indicators to measure the adoption rate of a country. Existing indexes are often incomplete or rely on perception and not actual coverage or usage data. World Development Report 2016 tried to fill this void by constructing the Digital Adoption Index (DAI), which while ad hoc in some respects, provides a more comprehensive picture of digital adoption of a country than existing indexes.
Figure II.C.1.1. Digital Adoption Index, 20141.0
0.9
0.8
0.7
0.6
0.5
0.4
0.3
0.2
0.1
0
KOR SGP JPN AUS NZL MYS BRN CHN MNG THA FJI VNM IDN PHL KHM WSM TON VUT PNG TMP SLB LAO KIR
J Government J People J Business
Source: World Development Report 2016.
(continued)
EAST ASIA AND PACIFIC ECONOMIC UPDATE APRIL 2016
146 PART II. MEDIUM-TERM DEVELoPMENT AGENDA

Persistent digital divides
Despiterapidtechnologyexpansion,asignificantdigitaldividepersistsinEAP.Of 2.3 billion people in the region, 1.7 billion are without broadband, 1.2 billion are without the internet, 400 million are without a mobile phone, and 200 million still live outside any digital signal. In fact, EAP is the home to 30 percent of the world’s offline population, second highest after South Asia and 500 million more than the offline population in Africa. EAP is also the home to 6 of the top 20 countries with the largest number of offline population, with China and Indonesia together accounting for nearly 80 percent of the entire offline population in the region (Figure II.C.3).5
Figure II.C.3. The EAP region has six of the top 20 countries with the highest offline population in the worldNumber of individuals not using the internet in each country, in million
1,000
100
10
1
IND CHN IDN PAK BGD NGA BRA ETH MEX COD PHL RUS IRN MMR VNM THA TZA EGY USA TUR KHM JPN MYS LAOPNGKOR
698
211
6149 47 44
1412
108
6 6
Sources: ITU 2015; World Development Report 2016; Meeker 2015; GSMA, https://gsmaintelligence.com/; UN Population Division 2014.
Within each country, there is a digital access gap across gender, income, age, and geography. Worldwide, nearly 21 percent of households in the bottom 40 percent of their countries’ income distribution do not have access to a mobile phone, and 71 percent do not have access to the internet.6 Adoption gaps between the bottom 40 percent and the top 60 percent, and between rural and urban populations, are falling for mobile phones but
5 Internet non-user data are imputed based on user data from the International Telecommunication Union (ITU) and population statistics from the UN.
6 World Development Report 2016.
TheRepublicofKorea,Singapore,andJapanarenotonlyamongthemostwiredcountriesinEAP,but also in the world (Figure II.C.1.1; the exact value of the DAI is less important than the ordering, and can change depending on the underlying indicators used). At the bottom end are mostly island economies and low-income countries. It is clear that the intercountry variation in the digital adoption rate is highest among businesses, and lowest among governments. But as discussed later, while digital adoption is important, it is not enough to reap digital dividends. Along with greater connectivity, countries also need to invest in “analog complements”—competition, skills, and institutions—to increase the return from their digital investments. So more than the value of DAI, what matters is the gap between the level of adoption and the level of complements.
(Box II.C.1 continued)
GROWING CHALLENGES
II.C. REAPING DIGITAL DIVIDENDS IN EAST ASIA AND PACIFIC 147

increasing for the internet. In EAP, the digital divide across demographic groups remains considerable, as well. For example, for every 100 men using the internet in Indonesia, 78 women use it, 91 women use it in Thailand, and 93 in Cambodia. Even richer countries like Singapore and the Republic of Korea have yet to achieve full gender parity in internet use (Figure II.C.4).
Figure II.C.4. Many EAP countries have a digital access gap across genderGap between the percentage of women and men using the internet
20
0
-20
10
-30
-40
JAM
VEN
KAZ
USA NZL IRLURY LT
UPR
YSW
EDNK
COL
FIN
MAC LV
AGBR BR
AAU
SNO
RRU
SISL
ESTNLD AR
ECA
NCZ
EPO
LHUN
LUX
CRIBE
LHKG BG
RSG
PISR
FRA
ECU
ESP
JPN
DEUKH
MRO
UKO
RMEX
GEO THA
AUTCH
EUKR GRC PR
TBO
LITA
PER
EGYOMN
IDN
HRV IRN
MAR TU
RBG
DGHA
-10
New Zealand, 1
Macao SAR, China, -1
Hong Kong SAR, China, -5
Singapore, -5
Cambodia, -5
Korea, Rep., -7
Thailand, -9
Indonesia, -22
Source: ITU 2015.
While connecting the 1.2 billion without internet access in EAP should be a priority, it is worth emphasizing that the information produced in the digital economy has little bearing on the number of internet users. For example, nearly 85 percent of the user-generated content indexed by Google comes from the United States, Canada, and Europe, even if these countries account for only 10 percent of internet users in the world. Similarly, there are more contributions to Wikipedia from Hong Kong SAR, China, than from all of Africa combined, despite the fact that Africa has 50 times more internet users.7 This could change as more content is generated in local languages, mainly via social media. But even then it is unclear whether social-media-created information can generate the kind of scientific knowledge that economists tend to associate with growth generation and job creation. Therefore, it is not enough for EAP policy makers to aim to bridge the digital access divide; they also need to overcome the divide in digital capabilities, that is, the ability of firms and workers to effectively use digital technologies.
Digitaltechnologies:growthacceleratorandnetjobcreatorsinEAP?
Digital technologies can dramatically expand the information base, lower information costs, and create information goods. This can facilitate searching, matching, and sharing of information and contribute to greater organization and collaboration among economic agents—influencing how firms operate, people seek opportunities, and citizens interact with their governments. By overcoming information barriers, augmenting factors, and transforming products, digital technologies hold the potential to make development more inclusive, efficient, and innovative (Figure II.C.5). For example:
7 See Graham and Foster 2014.
Figure II.C.5. How digital technologies can promote development
INCLUSION EFFICIENCY INNOVATION
DIGITAL TECHNOLOGIES
Trade
Jobopportunities
Capitalutilization
Laborproductivity
Competition
Consumerwelfare
GROWTH
JOBS
Source: World Development Report 2016.
EAST ASIA AND PACIFIC ECONOMIC UPDATE APRIL 2016
148 PART II. MEDIUM-TERM DEVELoPMENT AGENDA
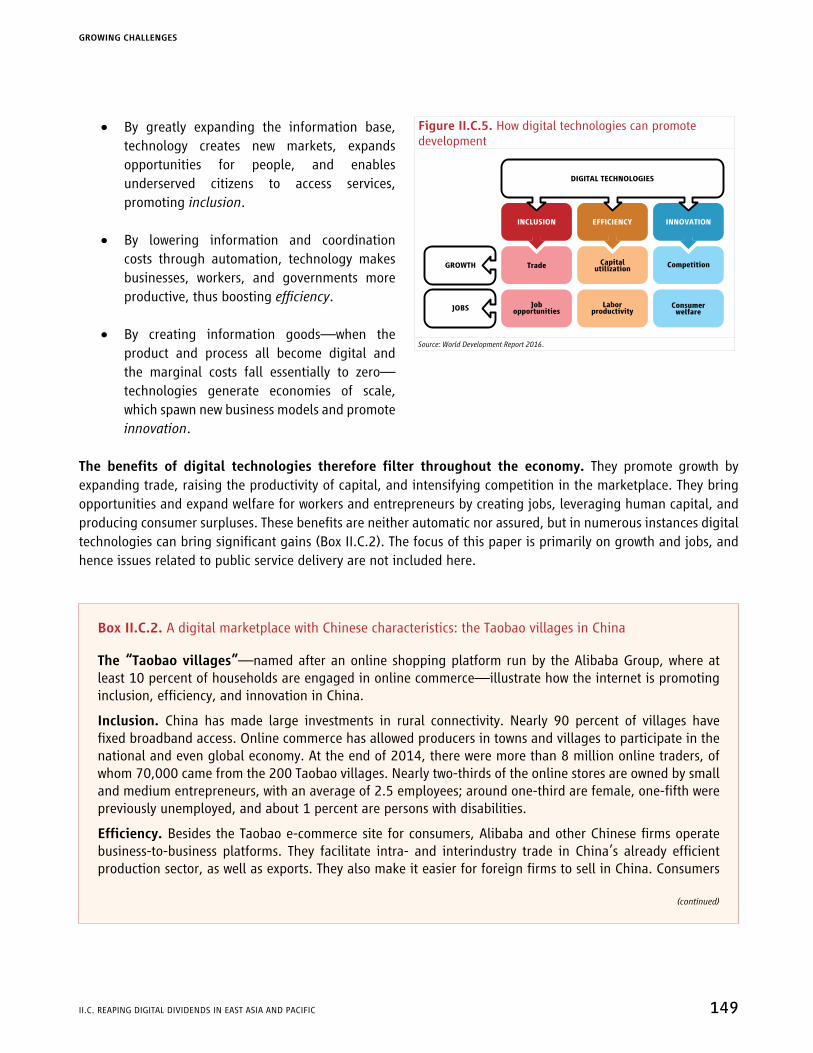
increasing for the internet. In EAP, the digital divide across demographic groups remains considerable, as well. For example, for every 100 men using the internet in Indonesia, 78 women use it, 91 women use it in Thailand, and 93 in Cambodia. Even richer countries like Singapore and the Republic of Korea have yet to achieve full gender parity in internet use (Figure II.C.4).
Figure II.C.4. Many EAP countries have a digital access gap across genderGap between the percentage of women and men using the internet
Source: ITU 2015.
While connecting the 1.2 billion without internet access in EAP should be a priority, it is worth emphasizing that the information produced in the digital economy has little bearing on the number of internet users. For example, nearly 85 percent of the user-generated content indexed by Google comes from the United States, Canada, and Europe, even if these countries account for only 10 percent of internet users in the world. Similarly, there are more contributions to Wikipedia from Hong Kong SAR, China, than from all of Africa combined, despite the fact that Africa has 50 times more internet users.7 This could change as more content is generated in local languages, mainly via social media. But even then it is unclear whether social-media-created information can generate the kind of scientific knowledge that economists tend to associate with growth generation and job creation. Therefore, it is not enough for EAP policy makers to aim to bridge the digital access divide; they also need to overcome the divide in digital capabilities, that is, the ability of firms and workers to effectively use digital technologies.
Digitaltechnologies:growthacceleratorandnetjobcreatorsinEAP?
Digital technologies can dramatically expand the information base, lower information costs, and create information goods. This can facilitate searching, matching, and sharing of information and contribute to greater organization and collaboration among economic agents—influencing how firms operate, people seek opportunities, and citizens interact with their governments. By overcoming information barriers, augmenting factors, and transforming products, digital technologies hold the potential to make development more inclusive, efficient, and innovative (Figure II.C.5). For example:
7 See Graham and Foster 2014.
Figure II.C.5. How digital technologies can promote development
INCLUSION EFFICIENCY INNOVATION
DIGITAL TECHNOLOGIES
Trade
Jobopportunities
Capitalutilization
Laborproductivity
Competition
Consumerwelfare
GROWTH
JOBS
Source: World Development Report 2016.
• By greatly expanding the information base, technology creates new markets, expands opportunities for people, and enables underserved citizens to access services, promoting inclusion.
• By lowering information and coordination costs through automation, technology makes businesses, workers, and governments more productive, thus boosting efficiency.
• By creating information goods—when the product and process all become digital and the marginal costs fall essentially to zero—technologies generate economies of scale, which spawn new business models and promote innovation.
The benefits of digital technologies therefore filter throughout the economy. They promote growth by expanding trade, raising the productivity of capital, and intensifying competition in the marketplace. They bring opportunities and expand welfare for workers and entrepreneurs by creating jobs, leveraging human capital, and producing consumer surpluses. These benefits are neither automatic nor assured, but in numerous instances digital technologies can bring significant gains (Box II.C.2). The focus of this paper is primarily on growth and jobs, and hence issues related to public service delivery are not included here.
Box II.C.2. A digital marketplace with Chinese characteristics: the Taobao villages in China
The “Taobao villages” —named after an online shopping platform run by the Alibaba Group, where at least 10 percent of households are engaged in online commerce—illustrate how the internet is promoting inclusion, efficiency, and innovation in China.
Inclusion. China has made large investments in rural connectivity. Nearly 90 percent of villages have fixed broadband access. online commerce has allowed producers in towns and villages to participate in the national and even global economy. At the end of 2014, there were more than 8 million online traders, of whom 70,000 came from the 200 Taobao villages. Nearly two-thirds of the online stores are owned by small and medium entrepreneurs, with an average of 2.5 employees; around one-third are female, one-fifth were previously unemployed, and about 1 percent are persons with disabilities.
Efficiency.Besides the Taobao e-commerce site for consumers, Alibaba and other Chinese firms operate business-to-business platforms. They facilitate intra- and interindustry trade in China’s already efficient production sector, as well as exports. They also make it easier for foreign firms to sell in China. Consumers
(continued)
GROWING CHALLENGES
II.C. REAPING DIGITAL DIVIDENDS IN EAST ASIA AND PACIFIC 149

benefit from greater selection and convenience on online retail sites. online trade has not only helped raise rural incomes but also made shopping more efficient. And the boom in online trade has spawned numerous logistics companies that provide quick delivery—sometimes by bicycle in towns and villages.
Innovation. Taobao and other e-commerce platforms are examples of innovation generated by the economies of scale that emerge when transaction costs drop drastically. Since these platforms are highly automated, fees can be kept low, and operations are often financed by advertising alone. Some problems cannot easily be solved solely by automation, such as creating trust in the market and preventing fraud. Online ratings, escrow services, and conflict resolution mechanisms help to build trust among the users. one of the most valuable assets Alibaba and other e-commerce operators accumulate is data. Each transaction contributes to better knowledge about the economy and consumer behavior. This information supports new business models, such as extending credit to small firms based on automated evaluations of creditworthiness. This can also advance financial inclusion.
Source: World Development Report 2016 team, based on information from the China State Information Center, China Association for Employment Promotion, and Alibaba company reports.
(Box II.C.2 continued)
Digital technologies and growth
The information and communications technology (ICT) sector tends to be a relativelymodest part ofthe overall economy. Its share in GDP is around 6 percent in organisation for Economic Co-operation and Development (oECD) countries and considerably less in developing countries. In the United States, home to 8 of the world’s 14 largest technology companies by revenue, the contribution of the ICT sector to GDP is around 6 percent in 2013. However, the corresponding numbers for Korea and Japan, two oECD members in EAP, are 11 and 7 percent, respectively, reflecting the significantly larger production and exports of ICT products from those two countries (Figure II.C.6). Comparable data for developing EAP countries are not easily available, but their share of the ICT sector in GDP is likely to also be higher than most other developing countries, especially in China, Malaysia, Thailand, and Vietnam, given their large exports of electronic and digital products. Nevertheless, the larger, and perhaps more inclusive, growth impact is likely to come from greater adoption of digital technologies, not production.
The contribution of ICT capital to GDP growth has been fairly constant over the last two decades in the world, including in EAP countries (Figure II.C.7). The stock and accumulation of ICT capital in developing EAP tends to be higher than in other developing countries, reflecting the larger production of ICT goods in these countries. But even then, the contribution of ICT capital to overall growth ranged from 11 to 18 percent in EAP countries between 1995 and 2014, which is comparable to the rest of the world. Increasingly, ICT goods have become commoditized, with highly automated production processes (hence, limited scope for job creation) and wafer-thin profit margins (hence, limited value added). Therefore, in the future, the larger impact of ICT is expected to come from greater digital adoption by the analog economy, which will expand trade, boost productivity, and unleash competition throughout the economy.
EAST ASIA AND PACIFIC ECONOMIC UPDATE APRIL 2016
150 PART II. MEDIUM-TERM DEVELoPMENT AGENDA
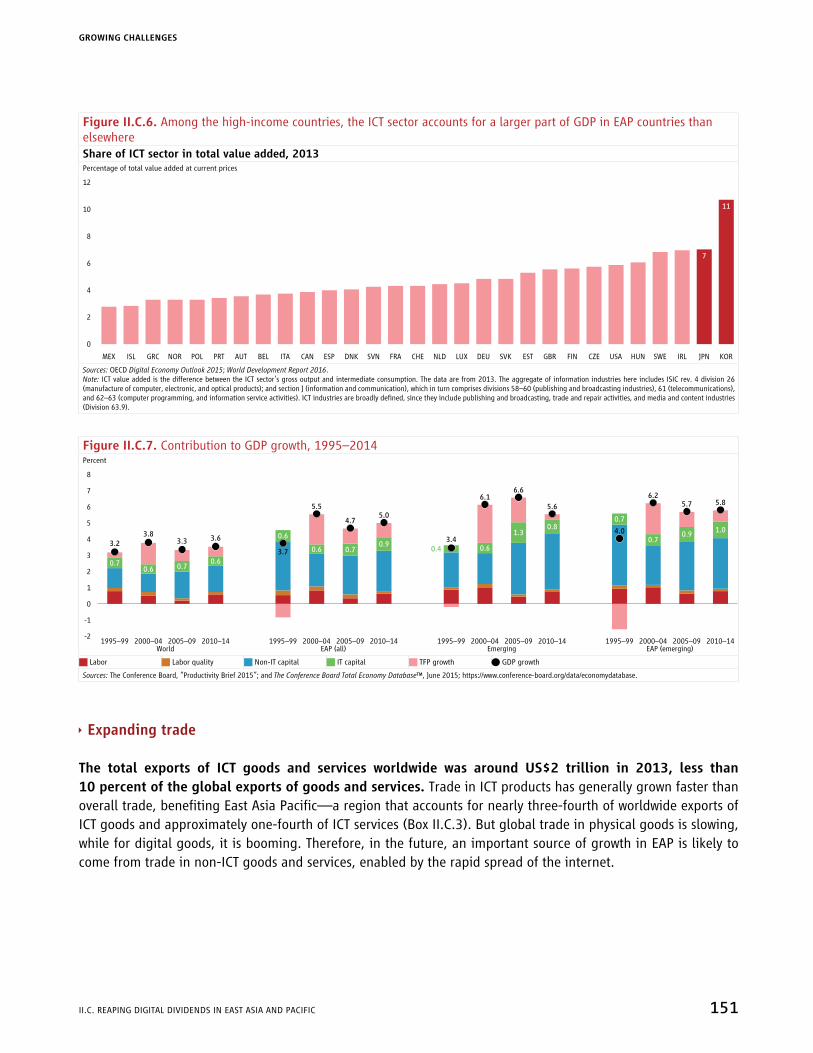
Figure II.C.6. Among the high-income countries, the ICT sector accounts for a larger part of GDP in EAP countries than elsewhereShare of ICT sector in total value added, 2013Percentage of total value added at current prices
MEX ISL GRC NOR POL PRT AUT BEL ITA CAN ESP DNK SVN FRA CHE NLD LUX DEU SVK EST GBR FIN CZE IRLSWEUSA
12
8
4
10
2
0
6
JPNHUN KOR
11
7
Sources: oECD Digital Economy Outlook 2015; World Development Report 2016.Note: ICT value added is the difference between the ICT sector’s gross output and intermediate consumption. The data are from 2013. The aggregate of information industries here includes ISIC rev. 4 division 26 (manufacture of computer, electronic, and optical products); and section J (information and communication), which in turn comprises divisions 58–60 (publishing and broadcasting industries), 61 (telecommunications), and 62–63 (computer programming, and information service activities). ICT industries are broadly defined, since they include publishing and broadcasting, trade and repair activities, and media and content industries (Division 63.9).
Figure II.C.7. Contribution to GDP growth, 1995–2014Percent
8
7
6
5
4
3
2
1
0
-1
-2
World1995–99
EAP (all) Emerging EAP (emerging)2000–04 2005–09 2010–14 1995–99 1995–99 1995–992000–04 2000–04 2000–042005–09 2005–09 2005–092010–14 2010–14 2010–14
3.2
0.7
3.8
0.6
3.3
0.7
3.6
0.6
3.7
0.63.4
0.4
4.0
0.7
5.5
0.6
6.1
0.6
6.2
0.7
4.7
0.7
6.6
1.3
5.7
0.9
5.0
0.9
5.6
0.8
5.8
1.0
J Labor J Labor quality J Non-IT capital J IT capital J TFP growth Q GDP growth
Sources: The Conference Board, “Productivity Brief 2015”; and The Conference Board Total Economy Database™, June 2015; https://www.conference-board.org/data/economydatabase.
Ì Expanding trade
The total exports of ICT goods and services worldwide was around US$2 trillion in 2013, less than 10 percent of the global exports of goods and services. Trade in ICT products has generally grown faster than overall trade, benefiting East Asia Pacific—a region that accounts for nearly three-fourth of worldwide exports of ICT goods and approximately one-fourth of ICT services (Box II.C.3). But global trade in physical goods is slowing, while for digital goods, it is booming. Therefore, in the future, an important source of growth in EAP is likely to come from trade in non-ICT goods and services, enabled by the rapid spread of the internet.
GROWING CHALLENGES
II.C. REAPING DIGITAL DIVIDENDS IN EAST ASIA AND PACIFIC 151
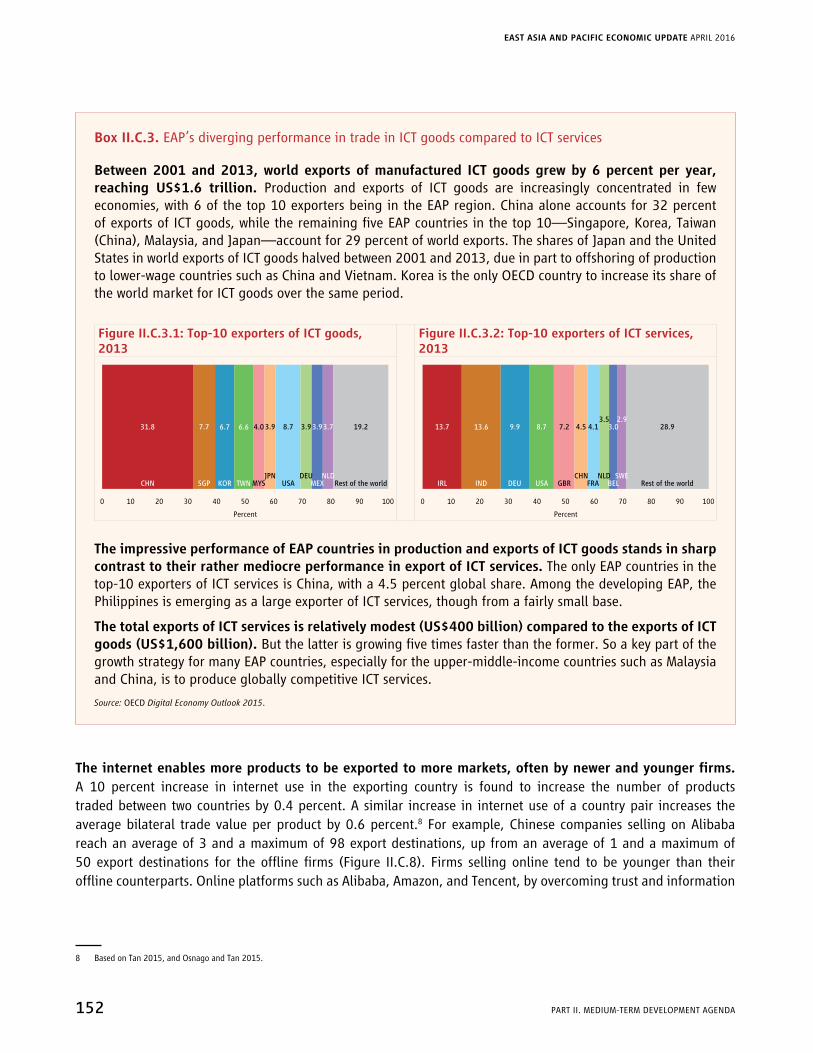
Box II.C.3. EAP’s diverging performance in trade in ICT goods compared to ICT services
Between 2001 and 2013, world exports of manufactured ICT goods grew by 6 percent per year, reaching US$1.6 trillion. Production and exports of ICT goods are increasingly concentrated in few economies, with 6 of the top 10 exporters being in the EAP region. China alone accounts for 32 percent of exports of ICT goods, while the remaining five EAP countries in the top 10—Singapore, Korea, Taiwan (China), Malaysia, and Japan—account for 29 percent of world exports. The shares of Japan and the United States in world exports of ICT goods halved between 2001 and 2013, due in part to offshoring of production to lower-wage countries such as China and Vietnam. Korea is the only oECD country to increase its share of the world market for ICT goods over the same period.
FigureII.C.3.1:Top-10exportersofICTgoods,2013
FigureII.C.3.2:Top-10exportersofICTservices,2013
0 10 20 30 40 50 60 70 80 90 100
31.8
CHN
7.7
SGP
6.7
KOR
6.6
TWN
4.0
MYS
3.9
JPN
8.7
USA
3.9
DEU
3.9
MEX
3.7
NLD
19.2
Rest of the world
0 10 20 30 40 50 60 70 80 90 100
13.7
IRL
13.6
IND
9.9
DEU
8.7
USA
7.2
GBR
4.5
CHN
4.1
FRA
3.5
NLD
3.0
BEL
2.9
SWE
28.9
Rest of the world
Percent Percent
The impressive performance of EAP countries in production and exports of ICT goods stands in sharp contrast to their rather mediocre performance in export of ICT services. The only EAP countries in the top-10 exporters of ICT services is China, with a 4.5 percent global share. Among the developing EAP, the Philippines is emerging as a large exporter of ICT services, though from a fairly small base.
ThetotalexportsofICTservicesisrelativelymodest(US$400billion)comparedtotheexportsofICTgoods(US$1,600billion).But the latter is growing five times faster than the former. So a key part of the growth strategy for many EAP countries, especially for the upper-middle-income countries such as Malaysia and China, is to produce globally competitive ICT services.
Source: oECD Digital Economy Outlook 2015.
Theinternetenablesmoreproductstobeexportedtomoremarkets,oftenbynewerandyoungerfirms.A 10 percent increase in internet use in the exporting country is found to increase the number of products traded between two countries by 0.4 percent. A similar increase in internet use of a country pair increases the average bilateral trade value per product by 0.6 percent.8 For example, Chinese companies selling on Alibaba reach an average of 3 and a maximum of 98 export destinations, up from an average of 1 and a maximum of 50 export destinations for the offline firms (Figure II.C.8). Firms selling online tend to be younger than their offline counterparts. online platforms such as Alibaba, Amazon, and Tencent, by overcoming trust and information
8 Based on Tan 2015, and Osnago and Tan 2015.
EAST ASIA AND PACIFIC ECONOMIC UPDATE APRIL 2016
152 PART II. MEDIUM-TERM DEVELoPMENT AGENDA
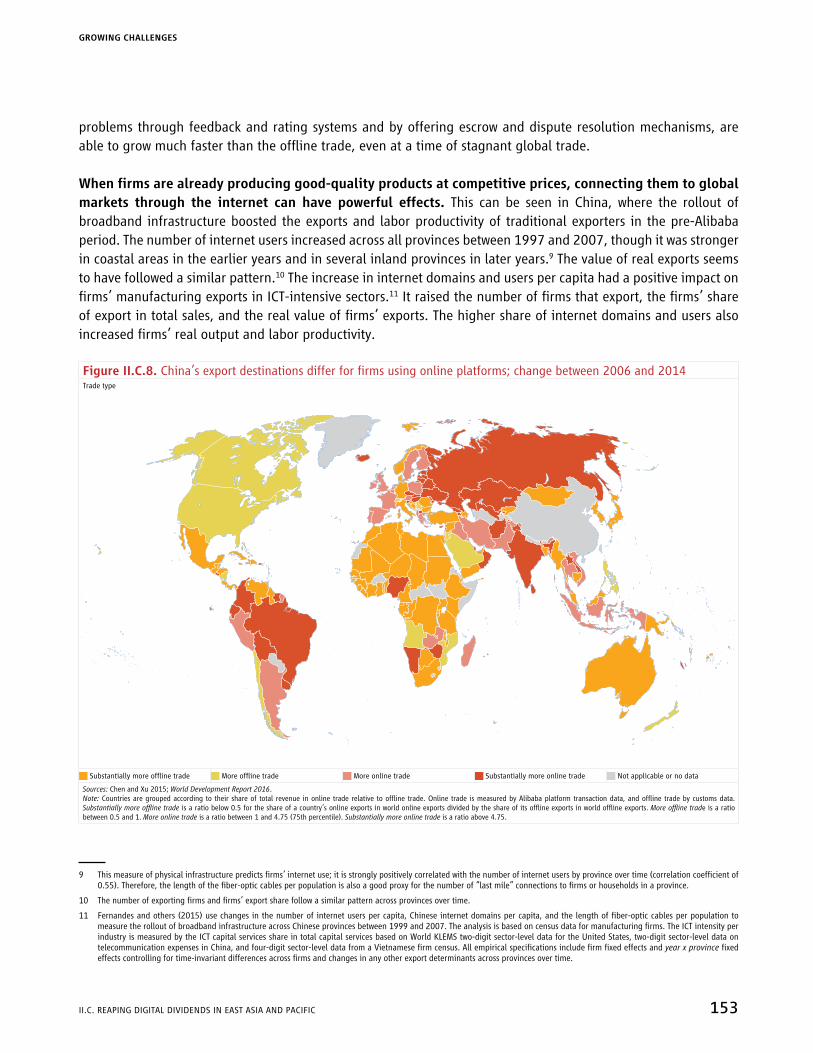
problems through feedback and rating systems and by offering escrow and dispute resolution mechanisms, are able to grow much faster than the offline trade, even at a time of stagnant global trade.
Whenfirmsarealreadyproducinggood-qualityproductsatcompetitiveprices,connectingthemtoglobalmarkets through the internet can have powerful effects. This can be seen in China, where the rollout of broadband infrastructure boosted the exports and labor productivity of traditional exporters in the pre-Alibaba period. The number of internet users increased across all provinces between 1997 and 2007, though it was stronger in coastal areas in the earlier years and in several inland provinces in later years.9 The value of real exports seems to have followed a similar pattern.10 The increase in internet domains and users per capita had a positive impact on firms’ manufacturing exports in ICT-intensive sectors.11 It raised the number of firms that export, the firms’ share of export in total sales, and the real value of firms’ exports. The higher share of internet domains and users also increased firms’ real output and labor productivity.
Figure II.C.8. China’s export destinations differ for firms using online platforms; change between 2006 and 2014Trade type
J Substantially more offline trade J More offline trade J More online trade J Substantially more online trade J Not applicable or no data
Sources: Chen and Xu 2015; World Development Report 2016.Note: Countries are grouped according to their share of total revenue in online trade relative to offline trade. online trade is measured by Alibaba platform transaction data, and offline trade by customs data. Substantially more offline trade is a ratio below 0.5 for the share of a country’s online exports in world online exports divided by the share of its offline exports in world offline exports. More offline trade is a ratio between 0.5 and 1. More online trade is a ratio between 1 and 4.75 (75th percentile). Substantially more online trade is a ratio above 4.75.
9 This measure of physical infrastructure predicts firms’ internet use; it is strongly positively correlated with the number of internet users by province over time (correlation coefficient of 0.55). Therefore, the length of the fiber-optic cables per population is also a good proxy for the number of “last mile” connections to firms or households in a province.
10 The number of exporting firms and firms’ export share follow a similar pattern across provinces over time.
11 Fernandes and others (2015) use changes in the number of internet users per capita, Chinese internet domains per capita, and the length of fiber-optic cables per population to measure the rollout of broadband infrastructure across Chinese provinces between 1999 and 2007. The analysis is based on census data for manufacturing firms. The ICT intensity per industry is measured by the ICT capital services share in total capital services based on World KLEMS two-digit sector-level data for the United States, two-digit sector-level data on telecommunication expenses in China, and four-digit sector-level data from a Vietnamese firm census. All empirical specifications include firm fixed effects and year x province fixed effects controlling for time-invariant differences across firms and changes in any other export determinants across provinces over time.
GROWING CHALLENGES
II.C. REAPING DIGITAL DIVIDENDS IN EAST ASIA AND PACIFIC 153

Ì Improving capital utilization
Perhaps the greatest contribution to growth can come from the internet’s lowering of costs, and thus raising efficiencyand laborproductivity inpractically all economic sectors.Better information helps companies make better use of existing capacity, optimizes inventory and supply chain management, cuts downtime of capital equipment, and reduces risk. So far, the largest efficiency gains from firms using digital technologies have been found in wholesale and retail trade, business services, insurance, finance, and selected manufacturing sectors. In fact, the EAP countries have maintained their 2-percentage-point gap in labor productivity growth with the rest of the world at a time of the rapid spread of digital technologies (Figure II.C.9, Panel A).
A part of the higher productivity growth is due to increased adoption of digital technologies by the rest of the economy. In Vietnam, the rollout of broadband internet infrastructure is positively correlated with firm productivity growth. Using the internet increased total factor productivity growth by 1.9 percentage points; firms also doing e-commerce increased total factor productivity growth by an additional 1.7 percentage points (Figure II.C.9, Panel B). The effect of e-commerce is larger in sectors that use ICT more intensively, consistent with a causal impact on productivity growth.12
Figure II.C.9. EAP countries enjoy higher labor productivity growth than the rest of the world; some of this is due to higher productivity among firms using the internet, as is the case in VietnamPanel A Panel BGrowth of labor productivity, percent Productivity growth in Vietnamese firms, percentage points
8
7
6
5
4
3
2
1
0
2005 2007 2009 2011 2013 20152003200119991997199519931991
4
3
2
1
0
Labor productivity growth effect TFP growth effect
▬ EAP: all (12) ▬ Rest of the world (35) J E-commerce J Internet use
Sources: The Conference Board, “Productivity Brief 2015”; The Conference Board Total Economy Database™, June 2015, https://www.conference-board.org/data/economydatabase; World Development Report 2016; Nguyen and Schiffbauer 2015.Note: Results are based on a regression of total factor productivity (TFP) or labor productivity growth on the one-year lag of a dummy if the firm used the internet, and the one-year lag of a dummy if the firm also conducts e-commerce. The regressions control for year fixed effects, province fixed effects, industry fixed effects, firm age, firm size, foreign ownership, exports status, state ownership, and the share of workforce with a secondary schooling degree. The internet or e-commerce effects are significantly larger in ICT-intensive industries, measured by World KLEMS two-digit sector-level data for Japan or the United States; two-digit sector-level data on telecommunication expenses in China; or four-digit sector-level data from a Vietnamese firm census, 2007–12, with more than 300,000 observations each year.
While rigorous econometric evidence showing that greater digital adoption leads to increased productivity growth is difficult to establish (givenmeasurement andmethodological problems), there is plenty ofanecdotal evidence that makes such a case. For example, Chinese car companies that are more sophisticated users of the internet turn over their inventory stocks five times faster than their less savvy competitors. Anji Logistics, a wholly owned subsidiary of Shanghai Automotive Industry Corporation, connects its IT systems with
12 The analysis is based on an annual panel of firm census data from 2007 to 2012 with more than 300,000 observations each year. TFP is estimated following olley and Pakes (1996). Each regression controls for two-digit sector dummies, year dummies, and firm characteristics (firm size, age, and ownership as well as export status). See Nguyen and Schiffbauer (2015) for details.
EAST ASIA AND PACIFIC ECONOMIC UPDATE APRIL 2016
154 PART II. MEDIUM-TERM DEVELoPMENT AGENDA

dozens of Chinese equipment manufacturers to manage logistics. General Motors China has cut costs and improved customer satisfaction by building internet connectivity into cars, so that dealers can check faults remotely and send maintenance alerts to owners. Carmakers in China are collaborating with an online search engine company, to attend to about 10 million searches each day, reducing marketing and sales costs relative to less digital-savvy manufacturers. Volkswagen, for instance, is selling cars online to Chinese customers through its own website and on the e-commerce site Tmall. Several manufacturers are working with big data to gain deeper insights into customer preferences to incorporate them into product development.
ItisestimatedthateveninChinalessthanaquarterofsmallmanufacturingfirmsusedtheinternetin2013, and even fewer used the internet in the rest of EAP.13 This suggests that there is clearly more scope to improve manufacturing efficiency in EAP through greater adoption of digital technologies by businesses.
Ì Advancing competition
The internet can facilitate market entry. Internet firms can start and scale-up quickly with relatively little staffing or capital investment, as was done by Go-JEK, an on-demand service provider, in Indonesia. Cloud computing—the leasing of computing and data storage services—reduces startup costs and allows firms to add capacity as the need arises, which also reduces risk to investors.
Innovations triggered by competition between online and offline firms generally benefit consumers,especiallywhenofflinemarketsaredistorted.Transport service companies such as Uber, GrabTaxi, Go-JEK, and Didi Dache have disrupted traditional taxi markets, which tend to be overregulated, with restricted entry and high prices. Similarly, web-based money transfer services in the Philippines such as iRemit and Ayannah have cut the price of remittances significantly and disrupted incumbents like Western Union.
Internet-based services also encourage competition. Price comparison websites for hotels, airlines, insurance, and even retail products dramatically reduce the cost of searching and comparing prices of similar products across service providers and encourage more transactions. Evidence does seem to suggest, however, that price dispersion—that is, offering different prices to different consumers based on search history, geographic location, or other information collected about buyers—on the internet persists, in part because companies are getting better at price discrimination. While such practices are generally consistent with economic efficiency, digital technologies also make it easier for unscrupulous firms to engage in price gouging, especially when consumers are less informed.
Ì Potentialrisks:Growingconcentrationanddivergingfortune
Despitetheseopportunities,firms’useofdigitaltechnologiesdifferssubstantiallyacrossEAPcountriesdue to variations in skills and infrastructure, and in barriers to competition and market entry —the so called “analog complements” to reaping the full advantage of digital technologies.14 In the absence of these
13 McKinsey Global Institute 2014.
14 Analog complements in this context refers to three factors: pro-competition regulations, so that firms can leverage the internet to compete and innovate; improved skills, so that people can take full advantage of digital opportunities; and accountable institutions, so that governments respond to citizens’ needs and demands.
GROWING CHALLENGES
II.C. REAPING DIGITAL DIVIDENDS IN EAST ASIA AND PACIFIC 155

complements—especially competition policies—that ensure a level playing field for firms to connect and compete, there will be limited adoption of digital technologies. This could lead to a greater concentration and monopolies, and to a growing divergence between firms and economies that are slow to adopt the internet and those that have quickly come to dominate their markets. Specifically, the regulators need to address the following three issues.
• The adoption of digital technologies by non-ICT businesses can be quite slow in the absence of competitive pressure in a business environment that protects dominant firms and vested interests.
• In sectors where digital and analog businesses compete for the same service, there is uncertainty about how to regulate the sector: Is Uber a taxi company or a software firm? Is mobile money a banking sector product or a telecom service? Should analog companies be regulated less or should internet companies be subject to some minimum level of regulation? These are questions that policy makers everywhere are grappling with.
• The economics of the internet favor natural monopolies, and we see the emergence of dominant firms in many parts of the digital economy that operate on exclusive platforms. So far, this has generally been good for consumers, but economic history has taught us that firms are sooner or later tempted to exploit a dominant market position.
It is too early to tell whether the level of regulation will be able to keep pace with the internet and whether these problems will diminish the overall economic benefits or be mitigated by rapid technological change and a dynamic market. The task of regulators has become more difficult in the presence of digital technologies; they need to ensure that all innovative companies can enter markets and compete on equal terms and none become too big to inhibit future growth.
Digital technologies and jobs
Digital technologies hold the potential to create millions of jobs and eliminate even larger numbers, but their most important effect will be in changing the very nature of jobs. Many EAP countries have traditionally experienced a productivity boost through the better intersectoral allocation of labor; that is, through moving surplus labor from low-productivity agriculture to the more productive, export-driven manufacturing sector. But the manufacturing sector is increasingly creating fewer jobs (due to automation), and some countries are undergoing premature deindustrialization.15 EAP policy makers are therefore hoping that the services sector will be the main source of growth and jobs—the very sector that is most affected by the spread of digital technologies. Will the services sector in the digital age attain these heightened expectations?
15 Premature deindustrialization refers to the fact that the peak level of industrialization for a country (measured by employment or output shares) is being reached at much lower levels of income compared to the experience of early industrializers (Rodrik 2015).
EAST ASIA AND PACIFIC ECONOMIC UPDATE APRIL 2016
156 PART II. MEDIUM-TERM DEVELoPMENT AGENDA
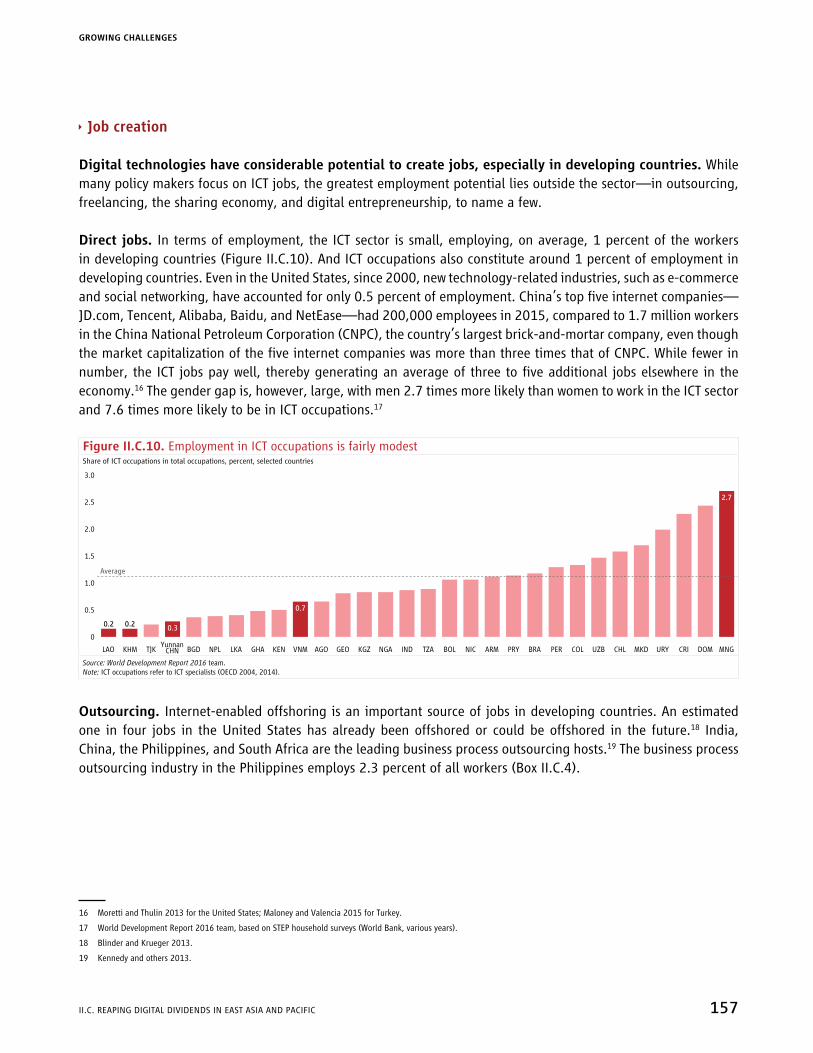
Ì Jobcreation
Digital technologies have considerable potential to create jobs, especially in developing countries. While many policy makers focus on ICT jobs, the greatest employment potential lies outside the sector—in outsourcing, freelancing, the sharing economy, and digital entrepreneurship, to name a few.
Direct jobs. In terms of employment, the ICT sector is small, employing, on average, 1 percent of the workers in developing countries (Figure II.C.10). And ICT occupations also constitute around 1 percent of employment in developing countries. Even in the United States, since 2000, new technology-related industries, such as e-commerce and social networking, have accounted for only 0.5 percent of employment. China’s top five internet companies—JD.com, Tencent, Alibaba, Baidu, and NetEase—had 200,000 employees in 2015, compared to 1.7 million workers in the China National Petroleum Corporation (CNPC), the country’s largest brick-and-mortar company, even though the market capitalization of the five internet companies was more than three times that of CNPC. While fewer in number, the ICT jobs pay well, thereby generating an average of three to five additional jobs elsewhere in the economy.16 The gender gap is, however, large, with men 2.7 times more likely than women to work in the ICT sector and 7.6 times more likely to be in ICT occupations.17
Figure II.C.10. Employment in ICT occupations is fairly modestShare of ICT occupations in total occupations, percent, selected countries
LAO KHM TJKYunnan
CHN BGD NPL LKA GHA KEN VNM AGO GEO KGZ NGA IND TZA BOL NIC ARM PRY BRA PER COL URYMKDUZB
3.0
2.0
1.0
2.5
0.5
0
1.5
CRICHL MNGDOM
0.2 0.20.3
0.7
2.7
Average
Source: World Development Report 2016 team.Note: ICT occupations refer to ICT specialists (oECD 2004, 2014).
Outsourcing. Internet-enabled offshoring is an important source of jobs in developing countries. An estimated one in four jobs in the United States has already been offshored or could be offshored in the future.18 India, China, the Philippines, and South Africa are the leading business process outsourcing hosts.19 The business process outsourcing industry in the Philippines employs 2.3 percent of all workers (Box II.C.4).
16 Moretti and Thulin 2013 for the United States; Maloney and Valencia 2015 for Turkey.
17 World Development Report 2016 team, based on STEP household surveys (World Bank, various years).
18 Blinder and Krueger 2013.
19 Kennedy and others 2013.
GROWING CHALLENGES
II.C. REAPING DIGITAL DIVIDENDS IN EAST ASIA AND PACIFIC 157
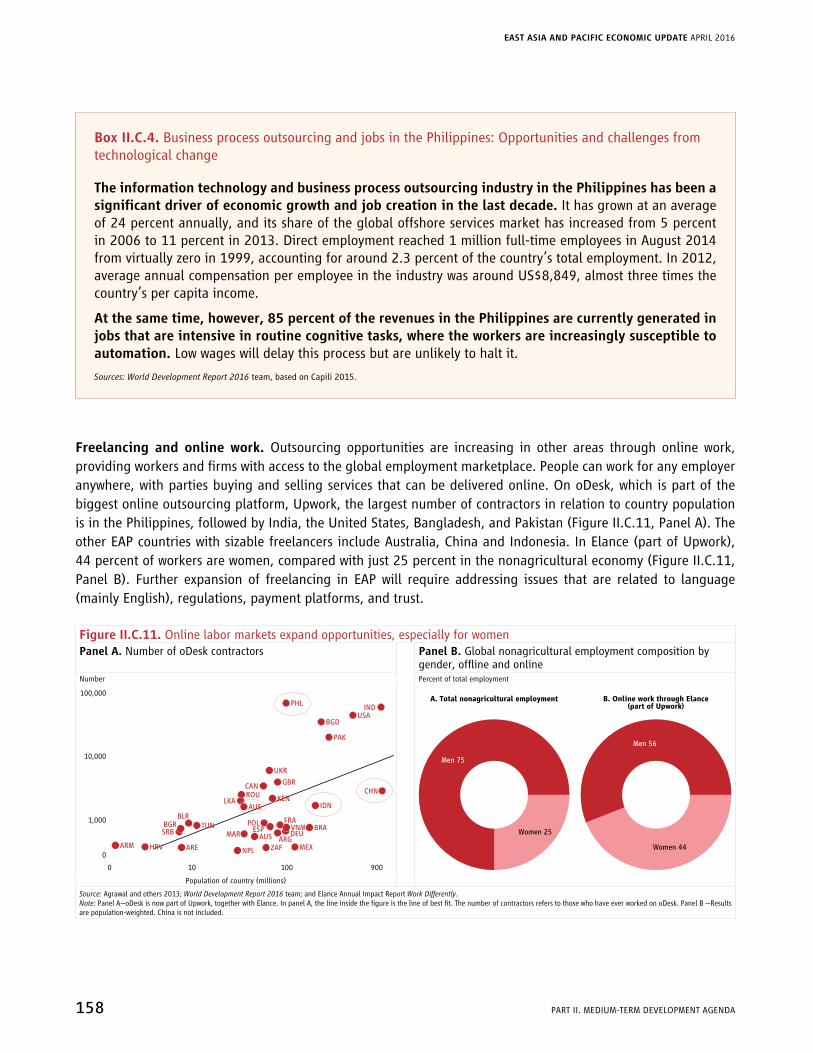
Box II.C.4. Business process outsourcing and jobs in the Philippines: Opportunities and challenges from technological change
The information technology and business process outsourcing industry in the Philippines has been a significantdriverofeconomicgrowthandjobcreationinthelastdecade.It has grown at an average of 24 percent annually, and its share of the global offshore services market has increased from 5 percent in 2006 to 11 percent in 2013. Direct employment reached 1 million full-time employees in August 2014 from virtually zero in 1999, accounting for around 2.3 percent of the country’s total employment. In 2012, average annual compensation per employee in the industry was around US$8,849, almost three times the country’s per capita income.
At the same time, however, 85 percent of the revenues in the Philippines are currently generated in jobs that are intensive in routine cognitive tasks, where the workers are increasingly susceptible to automation. Low wages will delay this process but are unlikely to halt it.
Sources: World Development Report 2016 team, based on Capili 2015.
Freelancing and online work. Outsourcing opportunities are increasing in other areas through online work, providing workers and firms with access to the global employment marketplace. People can work for any employer anywhere, with parties buying and selling services that can be delivered online. On oDesk, which is part of the biggest online outsourcing platform, Upwork, the largest number of contractors in relation to country population is in the Philippines, followed by India, the United States, Bangladesh, and Pakistan (Figure II.C.11, Panel A). The other EAP countries with sizable freelancers include Australia, China and Indonesia. In Elance (part of Upwork), 44 percent of workers are women, compared with just 25 percent in the nonagricultural economy (Figure II.C.11, Panel B). Further expansion of freelancing in EAP will require addressing issues that are related to language (mainly English), regulations, payment platforms, and trust.
Figure II.C.11. Online labor markets expand opportunities, especially for womenPanel A. Number of oDesk contractors Panel B. Global nonagricultural employment composition by
gender, offline and onlineNumber Percent of total employment
100,000
10,000
1,000
0
0 10 100 900
ARM HRV
SRB
BGR TUN
BLR
ARE
ROULKA
AUS
NPL
MAR AUS
ZAF MEX
BRADEUVNM
FRA
ARG
ESPPOL
KEN
CANGBR
UKR
IDN
CHN
PAK
BGDUSA
INDPHL
A. Total nonagricultural employment B. Online work through Elance(part of Upwork)
Men 75
Men 56
Women 44
Women 25
Population of country (millions)
Source: Agrawal and others 2013; World Development Report 2016 team; and Elance Annual Impact Report Work Differently.Note: Panel A--oDesk is now part of Upwork, together with Elance. In panel A, the line inside the figure is the line of best fit. The number of contractors refers to those who have ever worked on oDesk. Panel B --Results are population-weighted. China is not included.
EAST ASIA AND PACIFIC ECONOMIC UPDATE APRIL 2016
158 PART II. MEDIUM-TERM DEVELoPMENT AGENDA

Internet-enabled entrepreneurship. By lowering information barriers and costs, the internet increases experimentation and gives rise to new opportunities for entrepreneurship and self-employment (Box II.C.5). Many are in the ICT sector, but others are ICT-enabled. Alibaba in China, the world’s largest e-commerce platform by sales volume, supports an estimated 10 million jobs, or 1.3 percent of China’s workforce. Online shop owners using Alibaba in China each employ 2.6 additional workers, on average. Four in 10 shop owners are women, 19 percent were previously unemployed, 7 percent were farmers, and about 1 percent are persons with disabilities. Alibaba is estimated to support an additional 2 million jobs, mostly in logistics.20
20 China Association for Employment Research 2014.
Box II.C.5. The rise of the app economy: 6 of the top 20 countries by app developers are in EAP
The global app economy is growing rapidly. Like the rest of the ICT sector, production and exports of apps appears highly concentrated, with 95 percent of the estimated industry value accruing to the top-10 producing countries.
The United States is still the dominant producer, but EAP, led by China, has more developers than Western Europe. Unlike the PC software sector, where as recently as 2011, only 5 of the top 100 packaged software companies were from EAP, in the app economy, China (#2), Korea (#4), and Japan (#6) have all become top-ranked countries in terms of commercially successful app developers (Figure II.C.5.1). Vietnam has a booming app-producing sector, with the 17th-largest number of app developers in the world. Much of this was fueled by the initial success of “Flappy Bird,” a simple gaming app built by independent Vietnamese developer Dong Nguyen that became a viral sensation globally, at one point earning him US$55,000 a day in advertising revenue.
Figure II.C.5.1. Top 20 countries by number of app developers
FIN
ITA
BRA
AUS
HKG
VNM
TUR
CAN
ISR
FRA
ESP
TWN
IND
DEU
RUS
JPN
KOR
GBR
CHN
USA
0 500 1,000 1,500 2,000
143
158
173
256
351
395
776
1,567
Sources: “Winners & Losers in the Global App Economy,” Caribou Research, 2016; http://cariboudigital.net/wp-content/uploads/2016/02/Caribou-Digital-Winners-and-Losers-in-the-Global-App-Economy-2016.pdf.
Sharing economy. As online commerce, the on-demand or sharing economy—in which people rent assets or command services directly from one another, coordinated through the internet—is growing rapidly, even if still small overall and just emerging in developing countries. More than two-thirds of internet users globally are willing
GROWING CHALLENGES
II.C. REAPING DIGITAL DIVIDENDS IN EAST ASIA AND PACIFIC 159

to be part of the sharing economy.21 In Indonesia, GoJEK, the on-demand service, provides transportation and handyman services, delivers food and groceries, and even body massage. Peer-to-peer car services such as Didi Dache in China, are growing fast.22 Expanding the principles of the on-demand economy to the urban self-employed in developing countries could be particularly promising. The sharing economy’s decentralized, crowd-based rating systems can help control quality, build trust, and maintain a live “resumé”. These new jobs in the sharing economy, while offering supplemental income and flexibility for workers, do not provide much work security or worker protection.
Ì Potentialrisks:Automationandpolarizationoflabormarkets
Machines can increasingly perform routine tasks more quickly and cheaply than humans, and much of what is considered nonroutine today—such as translation, insurance underwriting, or even medical diagnostics—computers might do just as well tomorrow. Unlike previous technological transformations such as the mechanization of agriculture or the automation of manufacturing, the internet affects well-paying white-collar jobs in the service sector.23
The labor market implications in EAP countries depend on the pace of technological disruption. In China, which continues to have a number of repetitive, routine jobs, nearly 8 out of 10 occupations are susceptible to automation, while the corresponding numbers for Cambodia, Thailand, Malaysia, and Mongolia are 78, 72, 68, and 60 percent, respectively (Figure II.C.12). Not surprisingly, China is emerging as the biggest importer of industrial robots (Box II.C.6). But the actual number of job losses would be much lower in reality. Most EAP developing countries are still fairly low-tech and their wage rates are relatively low, so investments in automation technology will be less profitable for firms.
Figure II.C.12. Estimated share of employment that is susceptible to automation from a technological standpointPercent, latest year
90
80
70
60
50
40
30
20
10
0
UZB OECD KGZ MNG TJK BGR DOM GEO PRY PSE UKR NGA PAN NIC SRB ZAF BOL MUS MYS MKD CRI ECU ROU IND THA ALB AGO SLV GTM BGD CHN KHM NPL ETH
55
34
57 5860
62 62 62 63 64 64 64 65 65 65 66 67 67 67 68 68 68 69 69 6972 73 74 75 75 77 77 78 80
85
36
43
38
44 45
39
46
39 40 40
47
40
47 48
41
48 49 49 49 49 49
43
52 52 53
46 47 47
55
41 4144
J Adjusted J Unadjusted
Source: World Development Report 2016 team.Note: The unadjusted probabilities of automation for occupation are from Frey and Osborne (2013), weighted by employment. The adjusted probabilities account for the slower pace of technology adoption in poorer countries, using the adoption lag of earlier technologies (Comin and Mestieri 2013). See Monroy-Taborda, Moreno, and Santos, forthcoming, for the World Development Report 2016.
21 Based on an online survey of 60 countries worldwide done by Nielsen in 2013.
22 A recent study by China’s State Information Center reports that the sharing economy in China comprises of nearly 500 million users and 50 million service providers.
23 Autor 2014; Summers 2014; Brynjolfsson and McAfee 2014.
EAST ASIA AND PACIFIC ECONOMIC UPDATE APRIL 2016
160 PART II. MEDIUM-TERM DEVELoPMENT AGENDA

Box II.C.6. The rise of robots
Robots are machines or mechanical systems that can automatically perform tasks. They can be generally divided into two types: industrial robots (automotive, chemical, rubber, plastics, and food industries) and service robots (logistics, medicine, assisting the elderly, agriculture, floor-cleaning, civil construction, and exoskeletons). The worldwide stock of operational industrial robots at the end of 2014 was up to 1.5 million, with around 4.7 million service robots sold for personal and domestic use.24
Robots are not paid; they do not get sick; they can work as long as there is power; they are steadily gaining senses, dexterity, and intelligence; and are able to work alongside humans. China is the world’s biggest importer of industrial robots. Guangdong province recently announced a program to automate 80 percent of its factories by 2020, by substituting human labor with robots.25 Terry Gou, CEo of Foxconn Technology Group, famously said in 2012 that his company will replace 1 million Foxconn workers with robots within three years, though the company subsequently postponed that milestone by several years.
Source: World Development Report 2016 team.
A related trend is the polarization—or “hollowing out”—of the labor market, not only in advanced economies, but increasingly also in many developing countries. The share of employment in high-skilled occupations is up, as is the share of low-skilled jobs. The share of middle-skilled employment, in contrast, is down in most developed countries and increasingly in developing countries (Figure II.C.13). In EAP, the labor markets in most countries, including the Philippines, Malaysia, Korea, Thailand, and Mongolia, show signs of polarization. A notable exception is China, where growing mechanization in agriculture and labor-intensive industrialization have led to a (perhaps temporary) increase in routine, midlevel labor.26 Exceptions also include some countries rich in natural resources, and commodity exporters, which include several countries in Central Asia and Latin America, though not Mongolia.
It is important to keep in mind the historical perspective that job displacement and job losses—so called “technological unemployment”—have been a recurring concern of industrial revolutions. Even such thinkers as the economist John Maynard Keynes and the writer Isaac Asimov submitted to this fallacy.27 Yet over the centuries, economies have adapted to massive changes in labor markets—the largest by far being the shift out of agriculture.
Still, nobody can predict the full impact of technological change in the coming decades, which may be faster and broader than previous periods of technological change. What is clear, however, is that policy makers face a race between technology and education, and the most important public policy response is to help everyone to gain the skills that technology complements, and not those that technology replaces.
24 International Federation of Robotics 2015.
25 http://www.china-briefing.com/news/2015/04/22/automation-chinas-labor-force.html.
26 The number of workers in agriculture declined in China between 2000 and 2010, but the number of workers within the sector that were machine or equipment operators almost doubled (World Development Report 2016 team, based on the National Bureau of Statistics of China, various years).
27 Keynes, in the 1930s, predicted 15-hour workweeks by the end of the 20th century, and Asimov, in a 1964 essay, expected that one of the most pressing problems for humanity by 2014 would be boredom “in a society of enforced leisure”.
GROWING CHALLENGES
II.C. REAPING DIGITAL DIVIDENDS IN EAST ASIA AND PACIFIC 161

Figure II.C.13. The labor market is becoming more polarized in many countriesAnnual average change in employment share, 1995-2012, percentage points
1.5
0.5
-0.5
1.0
-1.0
-1.5
0
LUX
GRC TUR
PHIL
FRA
ESP
TUR IS
LZA
FAU
TPO
LGBR
MYS PO
LSW
EISR
KOR
CHE IR
LNO
RFIN
DNKDEU NZL
THA
CAN IT
AIN
DAU
SNLD PR
TMEX USA
HUNCH
LLK
AEG
YRU
SCZ
EMNG
PAK
ARG
CHN
PH
L -
0.9
0
MYS -
0.7
4
KO
R -
0.6
2
TH
A -
0.4
1
MN
G -
0.0
6
CH
N 0
.71
J High-skilled occupations J Middle-skilled occupations J Low-skilled occupations
Source: World Development Report 2016 team.Note: The figures display changes in employment shares between circa 1995 and circa 2012 for countries with at least seven years of data. The classification follows Autor (2014). High-skilled occupations include legislators, senior officials and managers, professionals, and technicians and associate professionals. Middle-skilled occupations comprise clerks, craft, and related trades workers, and plant and machine operators and assemblers. Low-skilled occupations refer to service and sales workers and elementary occupations. For the United States, comparable data could be accessed only for a short period (2003–08); consistent with Autor (2014), the observed polarization is limited in this period, with most of it having taken place in earlier years.
Policy options: greater connectivity and stronger complements
Fordigital technologies tobenefiteveryoneeverywhererequiresclosingtheremainingdigitaldivide,especially in internet access. But greater digital adoption will not be enough. To get the most out of the digital revolution, countries also need to work on the “analog complements” by strengthening regulations that ensure competition among businesses, by adapting workers’ skills to the demands of the new economy, and by ensuring that institutions are accountable.
Ì Making the internet accessible and affordable
Despite the rapid spread of the internet, a majority of the population in EAP do not have access to it or cannot afford it. Much of the explanation lies in continued policy failures such as regulatory capture, troubled privatizations, inefficient spectrum management, excessive taxation of the sector, and monopoly control of international gateways.
Tomake the internetaccessibleandaffordable, countriesneed topursuefirst-generation ICTpoliciesinvolving market competition, private participation, and light-touch regulation that have led to near-universal access and affordability of mobile telephony (Box II.C.7). And to achieve better development outcomes, governments need to address these failures through open, consultative policy-making processes involving the industry and users.
A useful framework for analyzing supply-side ICT policies, laid out in detail in World Development Report 2016,istoconsiderthevaluechainthatstretchesfromthepointwheretheinternetentersacountry(thefirstmile),passesthroughthatcountry(themiddlemile),toreachtheenduser(thelastmile),andcertainhiddenelementsinbetween(theinvisiblemile).But history matters, too. In the Pacific, countries first reached
EAST ASIA AND PACIFIC ECONOMIC UPDATE APRIL 2016
162 PART II. MEDIUM-TERM DEVELoPMENT AGENDA

Box II.C.7. How public-private partnership helped build the internet backbone in the Republic of Korea
Untilotherdevelopedcountriescaughtuparoundmid-2006,theRepublicofKorea’sfixedbroadbandpenetration was well ahead of its competitors (Table II.C.7.1). The country has the highest percentage of fiber among fixed broadband connections (66 percent) of any country except Japan. Korea also leads in the “internet of things” and sensor technology.
One secret to Korea’s success was a public-private partnership that combined government funding and policy direction with private infrastructure investment and management. The Korea Information Infrastructure program, which ran from 1995 to 2005, and the Broadband Convergence Network that followed it from 2005 to 2014, saw government investment of just under US$1 billion in each phase. Private investment dominated in the initial phase, as the backbone network was established and larger cities were served. During this phase, government money was used mainly to purchase bandwidth for the government’s own needs. Since 2005, government spending has been proportionately greater, as network investment reached out to rural areas, where there was less incentive for the private sector to take the lead.
Table II.C.7.1. Broadband investment program, Republic of KoreaUS$ million and percent of total
Investment Information structure, 1995–2005
Broadband convergence network, 2005–14
Total, 1995–2014
Government 806 (2.4%) 981 (38.0%) 1,787 (5.1%)Private 31,721 (97.5%) 1,599 (62.0%) 33,320 (94.9%)Total (US$ million) 32,527 2,580 35,107
Sources: World Development Report 2016 team; World Bank and Korean Development Institute 2015.
by cable, such as Fiji, tend to have lower internet prices than those reached more recently (Figure II.C.14). Once served with fiber, small island states may find that they use only a tiny amount of the capacity available; Tonga, for instance, uses barely 10 percent. Moving to flat-rate pricing (“all you can eat”) for bandwidth may be the best way to recoup the initial investment.
Figure II.C.14. The effect of history on internet prices, Pacific Islands
0 80702010 30 40 50 60
Vanuatu Digicel
Solomon Islands Our Telekom
Vanuatu Telekom
Solomon Islands beMobile
Samoa Blue Sky
Samoa Digicel
Tonga Digicel
Tonga TTC
Fiji Digicel
Fiji Vodafone
79
69
64
58
22
17
13
13
6
4
0 161442 6 8 10 12
Vanuatu Digicel
Solomon Islands Our Telekom
Vanuatu Telekom
Solomon Islands beMobile
Samoa Blue Sky
Samoa Digicel
Tonga Digicel
Tonga TTC
Fiji Digicel
Fiji Vodafone
0.9
0
0.9
0
5
5
1.5
1.5
14.8
14.8
Price per 1Gb of mobile data (US$) Years since arrival of undersea cable
Sources: World Development Report 2016 team; www.theprif.org/index.php/news/53-media-releases/169-prif-ict-study.Note: Price, per gigabyte (GB) of data in US$ a month in 2014, for prepaid mobile broadband.
GROWING CHALLENGES
II.C. REAPING DIGITAL DIVIDENDS IN EAST ASIA AND PACIFIC 163

Ì Strengthening the analog foundations of the digital revolution
The internet has great potential to promote development in EAP, but only some of that potential has so far been realized. The benefits will come to those who embrace the changes the internet brings, not to those who resist them. And the way to get internet-enabled inclusive growth, and ensure that disruption yields long-term benefits rather than costs, is to strengthen the following analog complements of digital investments:
• A pro-competition regulatory regime where firms can leverage the internet to compete and innovate for the benefit of consumers
• Workers, entrepreneurs, and public servants who have the right skills to take advantage of opportunities in the digital world
• An accountable government that effectively uses the internet to empower its citizens and deliver services.
Internet use still varies greatly among countries, as does the quality of complements, and both tend to move up with income (Figure II.C.15).
The World Development Report 2016 identifies a number of broad guiding premises for reaping digital dividends, which are also applicable to the East Asia Pacific:
• The inability to scale-up is one of the most commonly cited reasons for failed digital interventions. For every successful online commerce platform, nearly four fail to achieve scale. This is because it is easy to scale-up the technology, but difficult to improve its complements.
• The internet is no shortcut to development, but it can be an accelerator. Connectivity is important, but it is not enough. Technology can rarely bypass or substitute for other shortcomings. While the internet is no shortcut, it can be an accelerator because many digital tools improve the complements.
• Understanding the interaction between technology and human complements should guide how much to invest in each. Some services are more amenable to technology than others.
Figure II.C.15. A race between the quality of complements and technology; EAP compared to rest of the worldThe quality of complements and technology rises with incomeComplements
1.0
0.9
0.8
0.7
0.6
0.5
0.4
0.3
0.2
0.1
0
0 1.00.90.80.70.20.1 0.3 0.4 0.5 0.6
LAO
KHM
IDN
PHL VNM
THAMNG
BRNCHN
MYS
AUS
NZL SGP
KORJPN
TRANSFORMING
TRANSITIONING
EMERGING
Technology (digital adoption index)
Source: World Development Report 2016 team.Note: Technology is measured by the Digital Adoption Index (DAI). DAI is based on three sectoral subindexes covering businesses, people, and governments, with each subindex assigned an equal weight: DAI (Economy) = DAI (Businesses) + DAI (People) + DAI (Governments). Each subindex is the simple average of several normalized indicators measuring the adoption rate for the relevant groups. Similarly, complements is the average of three subindicators: starting a business; years of education adjusted for skills; and quality of institutions. See figures 5.4, 5.8, and 5.10 for more details on the construction of sectoral subindexes.
EAST ASIA AND PACIFIC ECONOMIC UPDATE APRIL 2016
164 PART II. MEDIUM-TERM DEVELoPMENT AGENDA

• A digital strategy is more about the adoption of ICTs than their production. The widespread adoption of ICTs, not their production, is responsible for most of the growth and job creation. For example, Alibaba has 30,000 employees, but provides a platform for more than 10 million ancillary jobs. The online outsourcing industry creates millions of freelancing opportunities in professional services.
• A digital strategy needs to be broader than an ICT strategy. A successful digital strategy needs to stand on two pillars—one digital and the other analog. The digital pillar deals with the supply-side issues, focusing on policies to make the internet universally accessible and affordable. The analog pillar aims to strengthen the demand-side policies by creating regulations that encourage competition, basic modern skills for all, and public institutions that are accountable. Policy priorities change as countries move along the digital transformation.
Ì Adigitalstrategythatreflectsthecountry’slevelofdevelopment
Policy priorities vary with a country’s stage of digital development, whether emerging, transitioning, or transforming. For countries where the digital economy is still emerging and access to the internet is limited, the task is to lay the analog foundations and remove barriers to adoption. For countries that are transitioning to a digital economy with fairly high technology use, the task is to ensure that everyone can take full advantage of these opportunities. For countries already transforming into a digital economy, the main task is to address the intractable problems that the internet itself creates. For these three stages, the Report proposes possible reforms for each complement.
Regulations that enable firms to connect and compete
Thepolicyobjectiveistocreateanenvironmentwhereallfirms—largeandsmall,acrossallsectors—canleveragetheinternettocompeteandinnovateforthebenefitoftheircustomers.
Emerging. Where internet use among firms is still low and markets are protected, as is the case with many Pacific Island economies and several low- and lower-middle income countries such as Cambodia, Lao PDR, and Myanmar, the priority is to remove the fundamental barriers to adoption—a lack of basic infrastructure including ICT, excessive product market regulations, and high tariffs for digital goods. For example, tariffs for computers and mobile phones are more than 25 percent in Fiji.
Transitioning. Where institutional capacity is more developed and internet use more widespread, as is the case in upper-middle-income countries such as China, Mongolia, and Myanmar, countries should implement effective competition regulations, especially for market entry in protected sectors, and strengthen enforcement. Some of the success stories in EAP—such as Alipay, iRemit, and other online financial services—came about because regulators made it easy for internet-based challengers to enter entrenched markets.
Transforming. Where digital technologies are almost universal, countries need to ensure competition among various digital platforms, rebalance regulation in the sharing economy with those in offline industries such as taxi
GROWING CHALLENGES
II.C. REAPING DIGITAL DIVIDENDS IN EAST ASIA AND PACIFIC 165

services, encourage competition across digital platforms, and enable an ecosystem of venture capital funding, dynamic regulations, and research and technology, as is being attempted in Korea (Figure II.C.16).
Figure II.C.16. Business expenditure in research and development, 2013Percentage of GDP
4
3
2
1
0
ISR KOR JPN FINTaipei,CHN SWE CHE DNK DEU SVN USA AUT CHN BEL FRA SGP ISL EST AUS NLD IRL GBR CZE NOR HUN CAN ITA PRT ESP NZL TUR SVK POL GRC ROU MEX
J ICT BERD J Rest of BERD
Source: oECD Digital Economy Outlook 2015.
Adapting workers’ skills to the demands of the new economy
The objective here is to ensure that workers, entrepreneurs, and public servants can take full advantage of opportunities in the digital world.
Emerging. Basic literacy and numeracy skills should not be neglected in the pursuit of digital ambitions. As part of broader education strategies, digital tools are best at connecting teachers to content, personalizing learning, reinforcing what is learned, encouraging collaboration, and promoting adult literacy.
Transitioning. Beyond the basics, school curriculums need to focus more on teaching the advanced cognitive and socioemotional skills demanded in the modern labor market—preparing students for careers rather than specific jobs. Initiatives such as Colombia’s Nueva Escola approach, which has been adopted in some schools in Vietnam, emphasize teamwork, interpersonal skills, and critical thinking (Box II.C.8). Transitioning countries can also emulate Singapore, which has moved from a top-down, efficiency-driven education model to a more decentralized, ability-driven model.
Transforming. When there is a strong base of foundational skills, governments can place more emphasis on promoting advanced, technical ICT skills, which will be increasing in demand as the internet spreads. Teaching technical skills early, like coding in the Estonia, Singapore, and the United Kingdom, promotes ICT literacy and influences career choices. And especially in rapidly aging societies, public and private institutions can offer more opportunities for lifelong learning.
28 The “Thinking Schools, Learning Nation” concept was articulated by the Singaporean prime minister in a speech on June 2, 1997. http://www.moe.gov.sg/media/speeches/1997/020697.htm.
EAST ASIA AND PACIFIC ECONOMIC UPDATE APRIL 2016
166 PART II. MEDIUM-TERM DEVELoPMENT AGENDA

Box II.C.8. Building new economy skills in Vietnam and Singapore
TheNewSchoolmodel(EscuelaNueva)startedinColombiain1976asaninnovationinmultigradeteaching, promoting active, participatory, and cooperative learning among primary school students. Today it serves 5 million students in 16 countries, including Brazil, the Dominican Republic, Mexico, the Philippines, Uganda, and Vietnam.
The model is based on several innovations for improving teamwork and developing critical thinking. A recent impact evaluation of the program in the first two years of implementation in Vietnam shows that the model helps children learn to work with each other and develop communication and interpersonal skills. Improved cooperative learning skills also enable a student to obtain better results in math.
Singapore has made large changes to its education system to adapt to the knowledge-based economy. The main change was in 1997, with a move from an efficiency-driven model to an ability-driven model.26 Under the new ability-driven model, schools have more autonomy over their curriculum and develop programs to suit their students. More emphasis is placed on project work, introduced from primary education onward, with a move from high-stakes examinations to smaller assessments.
Source: World Development Report 2016, based on Bodewig and others 2014.
GROWING CHALLENGES
II.C. REAPING DIGITAL DIVIDENDS IN EAST ASIA AND PACIFIC 167

References
Asimov, Isaac. 1964. “Visit to the World’s Fair of 2014.” New York Times, August 16.
Autor, David. 2014. “Polanyi’s Paradox and the Shape of Employment Growth.” Draft prepared for the Federal Reserve Bank of Kansas City.
Blinder, Alan, and Alan Krueger. 2013. “Alternative Measures of Offshorability: A Survey Approach.” Journal of Labor Economics 31 (2): S97–S128.
Bodewig, Christian, Reena Badiani-Magnusson, Kevin Macdonald, David Newhouse, and Jan Rutkowski. 2014. Skilling Up Vietnam: Preparing the Workforce for a Modern Market Economy. Washington, DC: World Bank.
Brynjolfsson, Erik, and Andrew McAfee. 2014. The Second Machine Age: Work, Progress, and Prosperity in a Time of Brilliant Technologies. New York: W. W. Norton.
Capili, Miro. 2015. “The BPO Industry in the Philippines: An Overview.” Background paper for the World Development Report 2016, World Bank, Washington, DC.
Comin, Diego, and Martí Mestieri. 2013. “If Technology Has Arrived Everywhere, Why Has Income Diverged?” INET Research Note 26, Institute for New Economic Thinking, New York.
Fernandes, Ana, Aaditya Mattoo, Huy Nguyen, and Marc Schiffbauer. 2015. “The Impact of Broadband on Chinese Exports in the Pre-Alibaba Era.” Background paper for the World Development Report 2016, World Bank, Washington, DC.
Frey, Carl, and Michael osborne. 2013. “The Future of Employment: How Susceptible Are Jobs to Computerisation?” Working paper, Oxford University, Oxford, U.K.
Graham, Mark, and Christopher Foster. 2014. “Geographies of Information Inequality in Sub-Saharan Africa.” Oxford Internet Institute, University of Oxford, U.K. http://cii.oii.ox.ac.uk/geographies-of-information-inequality-in-sub-saharan-africa.
Kennedy, Robert, Sateen Sheth, Ted London, Ekta Jhaveri, and Lea Kilibarda. 2013. Assessing the Opportunity for Building a Thriving Industry. Ann Arbor: William Davidson Institute at the University of Michigan.
Keynes, John Maynard. 1931. Essays in Persuasion. London: Macmillan.
Maloney, William, and Felipe Valencia. 2015. “Technological Adoption, Human Capital and Job Creation.” Working paper, World Bank, Washington, DC.
McKinsey Global Institute. 2014. “China’s digital transformation.” McKinsey & Company. www.mckinsey.com/industries/high-tech/our-insights/chinas-digital-transformation.
Meeker, Mary. 2015. “Internet Trends 2015: Code Conference.” www.kpcb.com/internet-trends.
Monroy-Taborda, Sebastian, Martin Moreno, and Indhira Santos. Forthcoming. “Technology Use and Changing Skills Demands: New Evidence from Developing Countries.” Background paper for the World Development Report 2016, World Bank, Washington, DC.
Moretti, E., and P. Thulin. 2013. “Local Multipliers and Human Capital in the US and Sweden.” Industrial and Corporate Change 22 (1): 339–62.
Nguyen, Huy, and Marc Schiffbauer. 2015. “Internet, Reorganization and Firm Productivity in Vietnam.” Background paper for the World Development Report 2016, World Bank, Washington, DC.
olley, G. S., and A. Pakes. 1996. “The Dynamics of Productivity in the Telecommunications Equipment Industry.” Econometrica 64: 1263–97.
EAST ASIA AND PACIFIC ECONOMIC UPDATE APRIL 2016
168 PART II. MEDIUM-TERM DEVELoPMENT AGENDA

osnago, Alberto, and Shawn W. Tan. 2015. “The Effects of the Internet on Trade Flows and Patterns.” Background paper for the World Development Report 2016, World Bank, Washington, DC.
Rodrik, Dani. 2015. “Premature Deindustrialization.” NBER Working Paper No. 20935, NBER, Washington, DC.
Summers, Lawrence. 2014. “Economic Challenge of the Future: Jobs.” Wall Street Journal, July 7. http://online.wsj.com/articles /lawrence-h-summers-on-the-economic-challenge-of-the-future-jobs-1404762501.
Tan, Shawn W. 2015. “The Effects of the Internet on Firm Export Behavior.” Background paper for the World Development Report 2016, World Bank, Washington, DC.
UN (United Nations) Population Division. 2014. Population and Development Database, http://www.un.org/en/development/desa/population/publications/development/population-development-database-2014.shtml.
World Development Report. 2016. “Digital dividends.” World Bank, Washington, DC, www.worldbank.org/en/publication/wdr2016.
———— Doing Business (database). Various years. World Bank, Washington, DC, www.doingbusiness.org.
————. 2015b. Global E-Government Systems (database). World Bank, Washington, DC, http://data.worldbank.org/data-catalog/pfm-systems-eservices-dataset.
————. 2015c. ID4D (Identification for Development database). World Bank, Washington, DC, http://data.worldbank.org/data-catalog/id4d-dataset.
World Bank and Korean Development Institute. 2015. The Korean Digital Governance and Performance Experience: Lessons and Experience. Washington, DC: World Bank.
GROWING CHALLENGES
II.C. REAPING DIGITAL DIVIDENDS IN EAST ASIA AND PACIFIC 169


Part III. Country Pages and Key Indicators
GROWING CHALLENGES
171

CAMBODIA
2015Population, million 15.6GDP, US$ billion 18.3GDP per capita, US$ 1,173Poverty rate ($1.25/day 2005 PPP terms)a 5.1Poverty rate ($2/day 2005 PPP terms)a 33.2Gini Coefficienta 28.0School enrolment rate, primary (% gross)b 124.2Life Expectancy at birth, yearsb 71.4Sources: World Bank WDI and Macro Poverty Outlook.Notes: (a) Most recent value (2012); (b) Most recent WDI value (2013).
Summary
While remaining strong, growth in 2015 eased slightly to 7.0 percent, below the 7.1 percent achieved in 2014. Some signs of moderation persist, particularly in the tourism and agriculture sectors. Performance of the garment sector, however, improved in 2015. Cambodia’s real growth is projected to remain healthy at 6.9 percent in 2016 driven partly by a significant increase in government spending. Poverty is expected to continue to trend downwards over the next few years.
Recent Economic Developments
Cambodia’s export-led growth continues (Figure 1). Garment exports accelerated with a year-on-year growth rate of 12.3 percent in 2015 in value terms compared
to 9.2 percent in 2014.1 Prices contributed 28 percent of the total increase, despite the appreciation of the dollar against the Cambodian riel, consistent with a move into higher value added products.
Strong demand underpinned construction expansion and deepening. In 2015, the construction sector grew further, with steel and other construction materials imports growing at 35.4 and 38.5 percent year-on-year, respectively. Together, the two main sectors—garments (and footwear) and construction (and real estate)—are estimated to have contributed half of last year’s growth.
The tourism sector slightly eased despite the recovery in tourist arrivals to neighboring countries. Tourist arrivals in 2015 grew by 6.1 percent (reaching 4.78 million visitors), compared to 6.9 percent in 2014.
In 2015, production of rice was estimated to be lower than in 2014 due to drought. Farmers are facing falling agricultural commodity prices, which negatively affect their earnings.
Increasing exports and tumbling oil prices narrowed the current account deficit by one percentage point of GDP, to 10.8 percent of GDP in 2015. The deficit has been financed by strong FDI inflows, averaging about 10 percent of GDP during the past few years. Gross international reserves have risen rapidly, reaching US$5.6 billion (or 4.4 months of imports) by end-2015. The riel versus dollar exchange rate remained stable, at 4,008 per dollar at end-February 2016.
Rapid expansion of the financial sector helped to accommodate economic growth. Domestic credit growth accelerated further, to 27.0 percent year-on-year in 2015, spurred in part by a construction boom and consumption growth. However, private sector deposit growth halved to 16.6 percent year-on-year
1 Figures based on customs data. Discrepancies may exist with respect to the figures presented by other government agencies.
EAST ASIA AND PACIFIC ECONOMIC UPDATE APRIL 2016
172 PART III. CoUNTRY PAGES AND KEY INDICAToRS

in 2015. As a result, the loan-to-deposit ratio rose to 95.6 percent. Inflation edged up to 2.3 percent year on-year in February 2016, compared to 1.2 percent at end-2014, driven mainly by the food, restaurants, and health sub-indices.
Fiscal consolidation underpinned macroeconomic stability. Improved tax administration has boosted revenue collection, with revenue estimated to have reached 17.5 percent of GDP in 2015 (excluding grants). Total expenditure remained contained at 20.5 percent of GDP, resulting in an improved overall fiscal deficit (including grants) of 0.8 percent of GDP in 2015.
In the last few years, real consumption growth for the bottom 40 percent of the distribution has been positive, and also higher than average consumption growth. This has led to a significant reduction in poverty incidence (under the national poverty line), which reached 17.7 percent of the population in 2012 (Figure 2), and a more equitable distribution of consumption. Economic growth accounts for 55 percent of the poverty reduction observed between 2008 and 2012 (a reduction of 16.3 percentage points), while redistribution explains 45 percent of the decline. In recent years, economic growth has played a more important role in reducing poverty, explaining 85 percent of the total change in 2011 and 2012.
Poverty incidence is still higher in rural areas than in urban areas. As of 2012 the headcount rate was 21.0 percent in rural areas compared to 8.6 percent in urban areas (in Phnom Penh only 3.8 percent of the population is poor). While rural households reaped the benefits of the growth in the agricultural sector observed during 2008–10, in recent years, urban households have benefited from the expansion of the garment and construction sectors.
Outlook
Growth is expected to remain healthy at 6.9 percent in 2016. Strong garment exports will help offset weaknesses in the agriculture sector. The current account deficit is expected to narrow, as exports accelerate. The approved budget for 2016 reflects expansionary fiscal policy, with spending increasing by 3.6 percent of GDP, of which 1.4 percent is due to rising wages and the remainder due to capital expenditure and non-wage spending.
Further reduction of poverty is expected for both urban and rural households throughout 2016. For urban households this is explained by growth in the economic sectors in which they participate (mainly construction and services). For rural households there has been an increase in sources of income apart from agricultural self-employment income.
Downside risks include potential renewed labor unrest, continued appreciation of the dollar, slower economic recovery in the Euro area, and spillovers from a slowdown in China. A hard landing of the Chinese economy could dampen growth prospects, mainly due to potentially slower Chinese tourist arrivals in the short term, and slower FDI inflows in the medium term.
Emerging Challenges
Further strengthening banking supervision is warranted to safeguard financial stability. The rising loan-to-deposit ratio warrants close monitoring, including by improving data integrity, developing necessary indicators, and establishing interagency coordination, underpinned by a crisis management framework.
Cambodian households remain highly vulnerable. The recent success in reducing poverty has resulted in many households that are living just above the poverty line. The impact of negative shocks (such as droughts and regional unrest) on poor households is exacerbated because of the limited social protection system in place.
GROWING CHALLENGES
PART III. CoUNTRY PAGES AND KEY INDICAToRS 173

Cambodia will need to scale-up domestically financed public investment to ensure competitiveness. Continued buoyant revenue collection makes this affordable, if the
wage bill can be curbed. Strengthening the rules and regulations governing public investment management is also a priority.
CAMBODIA Selected Indicators 2013 2014 2015e 2016f 2017f 2018f
Real GDP growth, at constant market prices 7.4 7.1 7.0 6.9 6.8 6.8Real GDP growth, at constant factor prices 7.5 6.8 7.1 6.8 6.8 6.7
Agriculture 1.6 0.3 0.2 0.1 1.4 1.1Industry 10.7 10.1 11.7 9.7 7.3 6.8Services 9.0 8.4 7.4 8.0 9.1 9.2
Inflation (Consumer Price Index, eop) 4.6 1.2 2.8 3.0 3.5 3.8Current Account Balance, excl. official transfers (% of GDP) -9.0 -11.9 -10.8 -9.3 -9.3 -10.0Exports, goods and services 17.0 8.6 9.2 14.9 9.1 11.7Imports, goods and services 17.4 10.7 7.4 9.6 9.9 11.6Foreign Direct Investment, US$ millions 1,826 1,677 1,803 1,653 1,748 1,780Fiscal Balance, incl. grants (% of GDP) -2.7 -1.4 -0.8 -2.8 -2.9 -4.1Sources: World Bank, Macroeconomics and Fiscal Management Global Practice, and Poverty Global Practice.Note: f = forecast.
Figure 1. Contributions to real GDP growth Figure 2. GDP per capita growth and poverty rate headcount
Percent and percentage point contributions Percent
8
6
4
2
0
-2
-4
2008 2009 2010 2011 2012 2013 2014 2015e 2016p
6.7
0.1
6.0
7.17.3 7.4
7.1 7.0 6.9
50
40
30
20
10
0
-10
20082007 2009 2010 2011 2012
J Taxes on products less subsidies J Services J Industry J Agriculture ▬ Real GDP growth ▬ GDP PC growth ▬ Poverty incidence (nat’l poverty line)
Source: The authorities and Bank staff estiamtes and projections.Notes: e=estimate; p= projection
Sources: World Bank estimates using the CSES for the poverty numbers; authorities and World Bank staff estimates for the GDP per capita (pc) growth.
EAST ASIA AND PACIFIC ECONOMIC UPDATE APRIL 2016
174 PART III. CoUNTRY PAGES AND KEY INDICAToRS

CHINA
2015Population, mn 1,374.6GDP, current US$, bn 10,763.1GDP per Capita, current US$ 7,846.5GNI per Capita, current US$ PPP1 13,170Poverty headcount ratio at $1.90 a day, 2011 PPP, % of population1
3.3
Poverty headcount ratio at $3.10 a day, 2011 PPP, % of population1
12.7
Gini coefficient, household disposable income2 0.462Life expectancy at birth, total, years3 75.4School enrollment, secondary, % gross3 92.4School enrollment, tertiary, % gross3 29.7Source: Statistics China, World Development Indicators, 2015.Notes: 1/ The data is for 2015. World Bank estimate; 2/ The data is for 2015, official data released by National Bureau of Statistics in China; 3/ The data is for 2013.
Summary
Growth in China moderated to 6.9 percent in 2015 as structural adjustments and policy efforts to address accumulated financial vulnerabilities continue. Growth is expected to decelerate to about 6.7 percent in 2016 and 6.5 percent in 2017. The poverty rate is projected to decline from 3.3 percent in 2015 to 1.9 percent in 2017.
Recent Developments
China’s orderly transition to slower but more sustainable growth has continued despite some volatility in financial markets. In 2015 gross domestic product (GDP)
expanded by 6.9 percent, in line with the government’s indicative growth target of about 7 percent. The deceleration of growth was especially pronounced in the real estate and manufacturing sectors during the first half of the year. Policy easing, including a relaxing of financial regulations and increased government spending, helped mitigate the slowdown in the second half of the year. But excess capacity has been a drag on growth and investment across a wide range of goods-producing industries. The producer price index declined further, reflecting lower commodity prices and considerable industrial overcapacity. By contrast, growth in services remained robust as the composition of growth continues to improve.
Despite slower GDP growth, employment and income growth remains robust. More than 13 million new urban jobs were created last year, exceeding the 10 million annual target for 2015, but below the 13.2 million created in 2014. Household real disposable income per capita grew by 7.4 percent, outpacing GDP growth. In urban areas real disposable income grew at 6.6 percent while in rural areas it grew by 7.5 percent, both down from 2014 when they grew at 7.4 and 9.9 percent respectively. Real wages of migrant workers grew by 7.5 percent as of the third quarter of 2015, down from 8.3 percent in 2014. In other signs of softness in the labor market, the number of people receiving unemployment insurance rose to 2.27 million, up from 2.07 million in 2014, while the number of migrant workers has leveled off, after several consecutive years of growth.
The poverty rate estimate for 2015 (using the new World Bank poverty line of US$1.90/day and new Purchasing Power Parity exchange rates based on 2011 prices) is 3.3 percent, equivalent to 45.4 million people. The official poverty headcount in rural areas stood at 55.75 million, as the Chinese official poverty line for rural areas (2,300 yuan at 2010 prices) is higher than World Bank’s US$1.90/day threshold.
GROWING CHALLENGES
PART III. CoUNTRY PAGES AND KEY INDICAToRS 175

The growth of aggregate financing—a broad measure of outstanding credit—increased in the second half of 2015 and early 2016, reversing a recent trend of deceleration. In January, total aggregate financing increased by a record amount due in large part to an increase in corporate bond issuance. This likely stimulated activity in the short-term, but delayed the deleveraging of highly-indebted entities. Aggregate financing growth in 2015 was 14 percent, still well above nominal GDP growth. As a result, leverage in the economy is still increasing. Credit to the non-government sector has reached 200 percent of GDP, which is very high by international comparison.
Financial market volatility continues. The Shanghai Composite Index has declined by a further 25 percent since the beginning of 2016. Much of the decline in early 2016 appeared connected to market concerns about the direction of policies, including exchange rate policy, rather than reflecting a significant slowdown in the real economy. The circuit breakers introduced in the first week of January to cap daily stock-market losses to a maximum of 7 percent were quickly suspended after being deemed counter-productive. Regulatory authorities decided to extend a ban on equity sales by large shareholders until permanent rules for such sales are established. Given modest banking system exposure to the stock market and the limited share of equity in corporate financing and household wealth, the implications for the real economy are expected to be contained.
Pressures on the Renminbi (RMB) partly associated with changes in exchange rate policy have eased recently. To foster greater exchange rate flexibility, China’s central bank changed the way it sets the RMB reference rate in August 2015. The PBOC also published a trade-weighted index in December, indicating a shift in policy focus away from the bilateral exchange rate with the U.S. dollar towards a basket of currencies. The renminbi has depreciated by 7 percent against the dollar since August last year, but remained broadly stable in trade-weighted terms, as other major currencies depreciated
against the U.S. dollar as well. In recent months the communication of authorities with market participants has improved, and the decline in reserves has slowed.
Gross international reserves have declined in recent months in light of significant capital outflows, but remain sizeable at an estimated US$3.2 trillion in February 2016. A significant part of this capital outflow reflects the repayment of foreign debt by firms, which had accumulated as the renminbi appreciated during 2012–14. Speculative outflows have also been sizable, and relate in part to uncertainty about the nature of China’s current and future exchange rate policy. High frequency data suggests that in recent months capital outflows have moderated.
On the external front, merchandize export and import growth remained weak, reflecting weakening external demand and declining commodity prices. In January 2016 exports fell 11.2 percent in nominal terms from a year earlier (the seventh straight month of decline), while imports tumbled 18.8 percent (the fifteenth straight month of decline).
Outlook
China’s GDP growth is on course to gradually decline in the medium term as structural adjustments and policy efforts to address accumulated financial vulnerabilities continue. The government has announced an official growth target of 6.5–7.0 percent for 2016. Growth is expected to gradually moderate to 6.7 percent in 2016 and 6.5 percent in 2017, assuming continued reforms both to enable economic restructuring as well as to address the vulnerabilities built up since the global financial crisis. over the period of the 13th Five Year Plan (2016–20) the World Bank expects growth to slow further to 6.0–6.5 percent per year on average. The poverty rate is projected to decline from 3.3 percent in 2015 to 1.9 percent in 2017.
EAST ASIA AND PACIFIC ECONOMIC UPDATE APRIL 2016
176 PART III. CoUNTRY PAGES AND KEY INDICAToRS
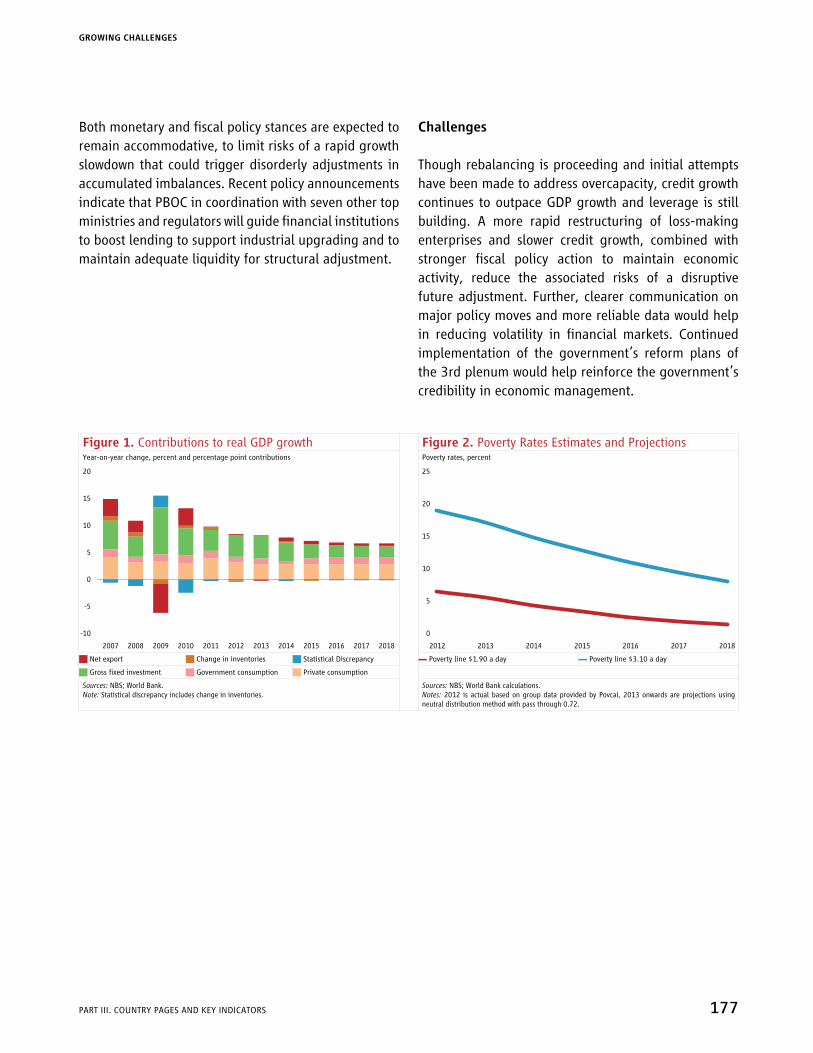
Both monetary and fiscal policy stances are expected to remain accommodative, to limit risks of a rapid growth slowdown that could trigger disorderly adjustments in accumulated imbalances. Recent policy announcements indicate that PBOC in coordination with seven other top ministries and regulators will guide financial institutions to boost lending to support industrial upgrading and to maintain adequate liquidity for structural adjustment.
Challenges
Though rebalancing is proceeding and initial attempts have been made to address overcapacity, credit growth continues to outpace GDP growth and leverage is still building. A more rapid restructuring of loss-making enterprises and slower credit growth, combined with stronger fiscal policy action to maintain economic activity, reduce the associated risks of a disruptive future adjustment. Further, clearer communication on major policy moves and more reliable data would help in reducing volatility in financial markets. Continued implementation of the government’s reform plans of the 3rd plenum would help reinforce the government’s credibility in economic management.
Figure 1. Contributions to real GDP growth Figure 2. Poverty Rates Estimates and ProjectionsYear-on-year change, percent and percentage point contributions Poverty rates, percent
20
15
10
5
0
-5
-10
2007 2008 2009 2010 2011 2012 2013 2014 2015 2016 2017 2018
25
20
15
10
5
0
2012 2013 2014 2015 2016 2017 2018
J Net export J Change in inventories J Statistical Discrepancy ▬ Poverty line $1.90 a day ▬ Poverty line $3.10 a day
J Gross fixed investment J Government consumption J Private consumption
Sources: NBS; World Bank.Note: Statistical discrepancy includes change in inventories.
Sources: NBS; World Bank calculations.Notes: 2012 is actual based on group data provided by Povcal, 2013 onwards are projections using neutral distribution method with pass through 0.72.
GROWING CHALLENGES
PART III. CoUNTRY PAGES AND KEY INDICAToRS 177
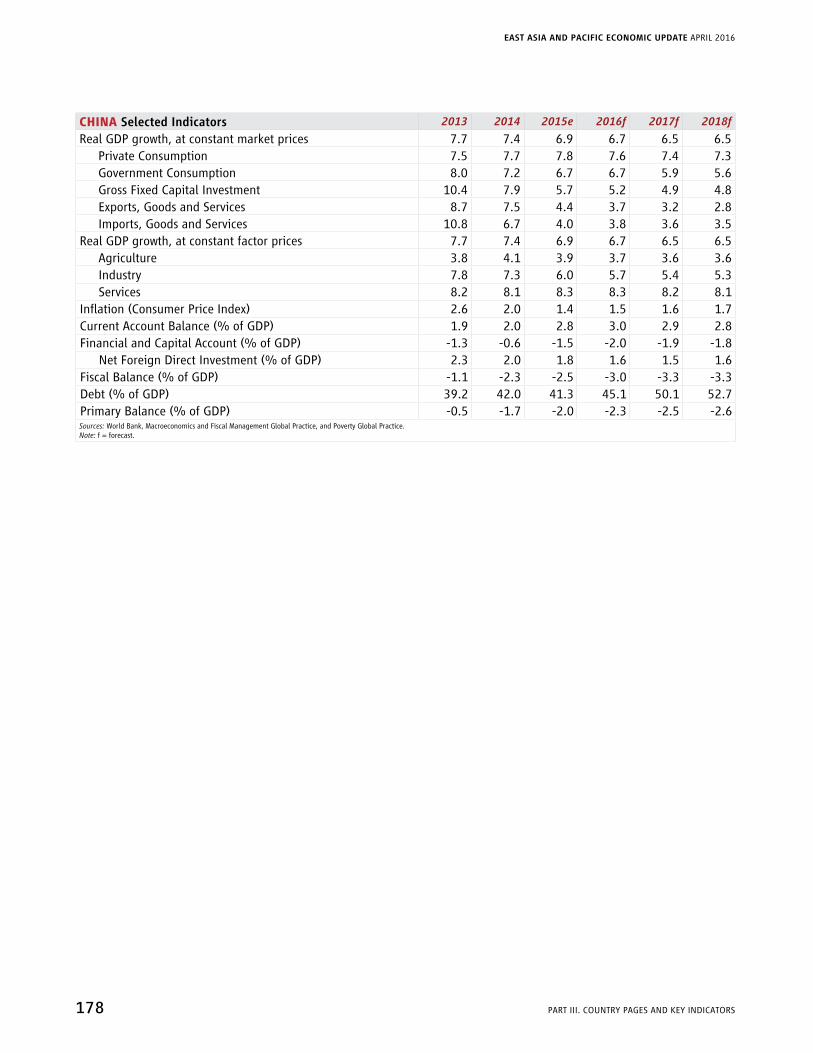
CHINA Selected Indicators 2013 2014 2015e 2016f 2017f 2018f
Real GDP growth, at constant market prices 7.7 7.4 6.9 6.7 6.5 6.5Private Consumption 7.5 7.7 7.8 7.6 7.4 7.3Government Consumption 8.0 7.2 6.7 6.7 5.9 5.6Gross Fixed Capital Investment 10.4 7.9 5.7 5.2 4.9 4.8Exports, Goods and Services 8.7 7.5 4.4 3.7 3.2 2.8Imports, Goods and Services 10.8 6.7 4.0 3.8 3.6 3.5
Real GDP growth, at constant factor prices 7.7 7.4 6.9 6.7 6.5 6.5Agriculture 3.8 4.1 3.9 3.7 3.6 3.6Industry 7.8 7.3 6.0 5.7 5.4 5.3Services 8.2 8.1 8.3 8.3 8.2 8.1
Inflation (Consumer Price Index) 2.6 2.0 1.4 1.5 1.6 1.7Current Account Balance (% of GDP) 1.9 2.0 2.8 3.0 2.9 2.8Financial and Capital Account (% of GDP) -1.3 -0.6 -1.5 -2.0 -1.9 -1.8
Net Foreign Direct Investment (% of GDP) 2.3 2.0 1.8 1.6 1.5 1.6Fiscal Balance (% of GDP) -1.1 -2.3 -2.5 -3.0 -3.3 -3.3Debt (% of GDP) 39.2 42.0 41.3 45.1 50.1 52.7Primary Balance (% of GDP) -0.5 -1.7 -2.0 -2.3 -2.5 -2.6Sources: World Bank, Macroeconomics and Fiscal Management Global Practice, and Poverty Global Practice.Note: f = forecast.
EAST ASIA AND PACIFIC ECONOMIC UPDATE APRIL 2016
178 PART III. CoUNTRY PAGES AND KEY INDICAToRS

FIJI
2015Population, mn 0.90GDP, US$, bn 4.32GNI per capita, current US$ 4,870GDP per capita, current US$ 4,805Poverty rate (2008), $3.10, PPP 3.2Gini coefficient (2008) 0.4Life expectancy 73Sources: Fiji Bureau of Statistics and World Development Indicators.
Summary
Growth remained strong in 2015, with real GDP expanding at rates well above the historical average. Poverty has declined faster in rural areas than in urban centers, although the picture may have been partially reversed by the recent cyclone which disproportionately affected rural areas. The outlook is broadly favorable but with downside risks from external developments and the quality of domestic policy adjustments. Restoring fiscal sustainability and accelerating structural reforms to improve the business climate are among the priorities for maintaining strong and inclusive growth.
Recent Economic Developments
Fiji’s growth remained strong, with real GDP expanding at an estimated 4 percent in 2015 following 5.3 percent growth in 2014—well above the historical average of 2 percent (Figure 1). Strong credit growth, buoyant
remittances, and improved labor market conditions have boosted consumer demand. Strong visitor arrivals (up 11 percent year-on-year in the three months to January) and government spending on infrastructure also supported the above-trend growth. Cyclone Winston, which hit the country on 20 February, has left many parts of the country devastated, claiming at least 44 lives and leaving thousands homeless. The country’s core tourism, industrial, and large commercial centers were relatively unscathed but sugar cane—the country’s main export commodity—sustained significant damage. The costs are still being assessed, but could rise to US$1 billion (about one quarter of annual GDP).
Inflation has risen to 1.2 percent in the year to February, with demand pressures offsetting the reduction in VAT from 15 to 9 percent and lower prices for imported food and fuels. Moderate depreciation of the Fijian dollar—by 5.5 percent against the US dollar in the year to January—also contributed to the uptick.
The external current account deficit remains high at around 8 percent of GDP due to large structural deficits in the merchandise trade account. Buoyant remittances and a large services surplus (linked to tourism and Fiji’s position as a transport hub) are providing a much needed offset. Sugar and other export crops have been adversely affected by the cyclone, but the country’s two international airports were reopened within days to protect tourism. The level of foreign reserves remained comfortable, at around 5.6 months of imports in February.
The fiscal deficit (excluding privatization receipts) widened to an estimated 8.3 percent of GDP in 2015 from 4.3 percent in 2014, driven by continued expansion in government spending. The deficit will likely remain elevated this year as the government responds to the cyclone. Government debt has reached 58 percent of GDP.
Extreme poverty is rare in Fiji, but many still live below the national basic-needs poverty line (equivalent to
GROWING CHALLENGES
PART III. CoUNTRY PAGES AND KEY INDICAToRS 179
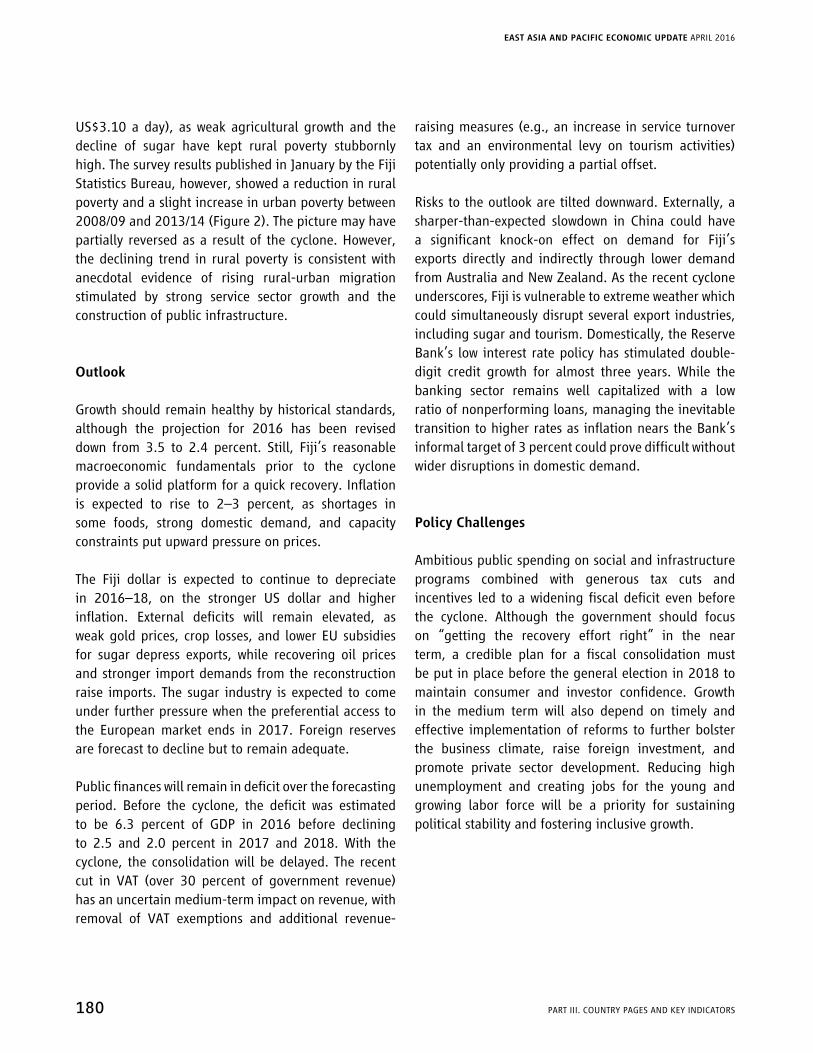
US$3.10 a day), as weak agricultural growth and the decline of sugar have kept rural poverty stubbornly high. The survey results published in January by the Fiji Statistics Bureau, however, showed a reduction in rural poverty and a slight increase in urban poverty between 2008/09 and 2013/14 (Figure 2). The picture may have partially reversed as a result of the cyclone. However, the declining trend in rural poverty is consistent with anecdotal evidence of rising rural-urban migration stimulated by strong service sector growth and the construction of public infrastructure.
Outlook
Growth should remain healthy by historical standards, although the projection for 2016 has been revised down from 3.5 to 2.4 percent. Still, Fiji’s reasonable macroeconomic fundamentals prior to the cyclone provide a solid platform for a quick recovery. Inflation is expected to rise to 2–3 percent, as shortages in some foods, strong domestic demand, and capacity constraints put upward pressure on prices.
The Fiji dollar is expected to continue to depreciate in 2016–18, on the stronger US dollar and higher inflation. External deficits will remain elevated, as weak gold prices, crop losses, and lower EU subsidies for sugar depress exports, while recovering oil prices and stronger import demands from the reconstruction raise imports. The sugar industry is expected to come under further pressure when the preferential access to the European market ends in 2017. Foreign reserves are forecast to decline but to remain adequate.
Public finances will remain in deficit over the forecasting period. Before the cyclone, the deficit was estimated to be 6.3 percent of GDP in 2016 before declining to 2.5 and 2.0 percent in 2017 and 2018. With the cyclone, the consolidation will be delayed. The recent cut in VAT (over 30 percent of government revenue) has an uncertain medium-term impact on revenue, with removal of VAT exemptions and additional revenue-
raising measures (e.g., an increase in service turnover tax and an environmental levy on tourism activities) potentially only providing a partial offset.
Risks to the outlook are tilted downward. Externally, a sharper-than-expected slowdown in China could have a significant knock-on effect on demand for Fiji’s exports directly and indirectly through lower demand from Australia and New Zealand. As the recent cyclone underscores, Fiji is vulnerable to extreme weather which could simultaneously disrupt several export industries, including sugar and tourism. Domestically, the Reserve Bank’s low interest rate policy has stimulated double-digit credit growth for almost three years. While the banking sector remains well capitalized with a low ratio of nonperforming loans, managing the inevitable transition to higher rates as inflation nears the Bank’s informal target of 3 percent could prove difficult without wider disruptions in domestic demand.
Policy Challenges
Ambitious public spending on social and infrastructure programs combined with generous tax cuts and incentives led to a widening fiscal deficit even before the cyclone. Although the government should focus on “getting the recovery effort right” in the near term, a credible plan for a fiscal consolidation must be put in place before the general election in 2018 to maintain consumer and investor confidence. Growth in the medium term will also depend on timely and effective implementation of reforms to further bolster the business climate, raise foreign investment, and promote private sector development. Reducing high unemployment and creating jobs for the young and growing labor force will be a priority for sustaining political stability and fostering inclusive growth.
EAST ASIA AND PACIFIC ECONOMIC UPDATE APRIL 2016
180 PART III. CoUNTRY PAGES AND KEY INDICAToRS
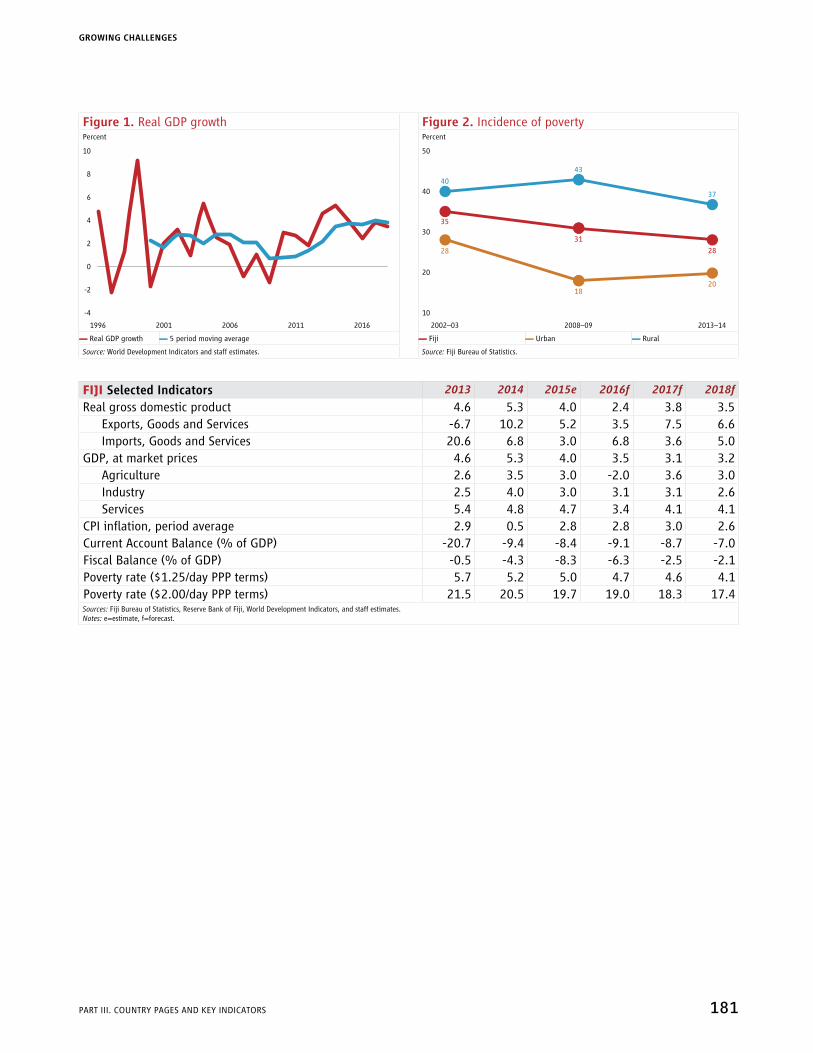
Figure 1. Real GDP growth Figure 2. Incidence of povertyPercent Percent
10
8
6
4
2
0
-2
-4
1996 2001 2006 2011 2016
50
40
30
20
10
2002–03 2008–09 2013–14
40
35
28
43
31
18
37
28
20
▬ Real GDP growth ▬ 5 period moving average ▬ Fiji ▬ Urban ▬ Rural
Source: World Development Indicators and staff estimates. Source: Fiji Bureau of Statistics.
FIJI Selected Indicators 2013 2014 2015e 2016f 2017f 2018f
Real gross domestic product 4.6 5.3 4.0 2.4 3.8 3.5Exports, Goods and Services -6.7 10.2 5.2 3.5 7.5 6.6Imports, Goods and Services 20.6 6.8 3.0 6.8 3.6 5.0
GDP, at market prices 4.6 5.3 4.0 3.5 3.1 3.2Agriculture 2.6 3.5 3.0 -2.0 3.6 3.0Industry 2.5 4.0 3.0 3.1 3.1 2.6Services 5.4 4.8 4.7 3.4 4.1 4.1
CPI inflation, period average 2.9 0.5 2.8 2.8 3.0 2.6Current Account Balance (% of GDP) -20.7 -9.4 -8.4 -9.1 -8.7 -7.0Fiscal Balance (% of GDP) -0.5 -4.3 -8.3 -6.3 -2.5 -2.1Poverty rate ($1.25/day PPP terms) 5.7 5.2 5.0 4.7 4.6 4.1Poverty rate ($2.00/day PPP terms) 21.5 20.5 19.7 19.0 18.3 17.4Sources: Fiji Bureau of Statistics, Reserve Bank of Fiji, World Development Indicators, and staff estimates.Notes: e=estimate, f=forecast.
GROWING CHALLENGES
PART III. CoUNTRY PAGES AND KEY INDICAToRS 181

INDONESIA
2015Population, million 257.6GDP, current US$ billion 862.0GDP per capita, current US$ 3,347Poverty rate ($1.9/day 2011 PPP terms)a 8.3Poverty rate ($3.1/day 2011 PPP terms)a 36.7Gini Coefficienta 40.5School enrollment, primary (% gross)b 108.5Life Expectancy at birth, yearsb 70.6Sources: World Bank WDI and Macro Poverty Outlook.Notes: (a) Most recent value (2014); (b) Most recent WDI value (2013).
Summary
Indonesia’s government has begun an important reform process as the economy continues to adjust to weak global demand for commodities, which is expected to persist over the medium term. Public infrastructure spending accelerated significantly in the second half of 2015, and a number of regulatory reforms, including a revision of some restrictions on foreign investment, have been announced. Improvements in job creation and poverty reduction will depend on the government’s success in improving the business climate, attracting private investment, and diversifying the economy. An expansion in social assistance planned for 2016 could accelerate poverty reduction, but potential El-Niño-related falls in agricultural production pose a significant threat.
Recent Economic Developments
GDP growth eased to 4.8 percent in 2015, from 5.0 percent in 2014, as external conditions remained unfavorable. Global commodity prices and demand continued to decline, further weakening investment growth. Slower job creation, significant rupiah depreciation since 2013, and persistently high consumer (especially food) price inflation also weighed on household consumption. Private consumption grew by 4.8 percent in 2015, down from 5.5 percent in 2012–13. Fewer than 200,000 new jobs were created in the year to August 2015, compared with an annual average of 2.6 million between 2006 and 2012, and relative to an increase in the working-age population of 3.1 million. As a result, the aggregate unemployment rate increased to 6.2 percent in August 2015, from 5.9 percent a year earlier. The official poverty rate also increased by 0.2 percentage points to 11.1 percent in 2015.1
The sharp fall in international commodity prices has led to a contraction in export revenues in each of the last four years, with the decline reaching 14.4 percent in 2015. While decreasing exports reduced government revenues, significant import compression due to moderating domestic demand growth and lower oil prices (Indonesia is a net oil importer) helped narrow the current account deficit to 2.1 percent of GDP in 2015. Nevertheless, external vulnerabilities remain since foreign direct investment, which declined substantially in recent years, covered about 50 percent of the current account deficit in 2014 and 2015. Consequently, the financing of the current account deficit continues to rely on potentially volatile portfolio investment.
In this challenging economic environment, the government has committed to improve growth. After a slow start to 2015, expenditure disbursement
1 However, changes in survey methodology may have rendered the latest data not directly comparable to historical numbers.
EAST ASIA AND PACIFIC ECONOMIC UPDATE APRIL 2016
182 PART III. CoUNTRY PAGES AND KEY INDICAToRS

accelerated in the second half of the year. In particular, public capital spending increased by over 40 percent in 2015 in nominal terms, supporting fixed investment while private capital formation continued to weaken. To preserve infrastructure spending, after being confronted with weaker-than-expected revenue collection, the government expanded the fiscal deficit to 2.5 percent of GDP (from 1.9 percent in the revised 2015 budget). In addition to improving the composition of spending (including by removing the explicit subsidy for gasoline and planning a significant expansion in social assistance), the government initiated an important and wide-ranging reform process by announcing ten economic policy packages since September 2015. The measures include regulatory simplification, tax incentives, easing of some restrictions on foreign ownership, and other structural reforms.
Outlook
The World Bank forecasts a gradual increase in GDP growth to 5.1 percent in 2016 and 5.3 percent in 2017. In an environment of subdued global growth and weak trade, the strengthening of economic activity in Indonesia will depend on public sector spending momentum being maintained in 2016. In this respect, the government has sent encouraging signals by requiring early procurement of contracts and frontloading of fiscal spending in the first quarter of this year. In addition, the 2016 State Budget calls for further shifts in spending toward infrastructure, health, and targeted social assistance. The litmus test of the success of the government’s reform agenda—both in terms of better fiscal expenditure allocation and improvements in the investment climate—will be a rise in business and consumer sentiment and a pickup in private sector activity. Finally, the significant decline in inflation since November 2015, mainly owing to the base effect from the sharp increase in retail fuel prices a year earlier, coupled with a relatively stable rupiah, has provided room for monetary policy to support growth as well. In January and February 2016, the central bank
cut interest rates and lowered the required reserve ratio. However, given continuing volatility in global financial markets, monetary easing is likely to be gradual.
While strengthening growth and lower inflation should promote poverty reduction, the pace of poverty reduction in recent years has been slow. On current growth and price expectations, extreme poverty (those living below US$1.90 per person per day in 2011 purchasing power parity [PPP] terms), estimated to be 7.5 percent in 2015, is projected to decline only slightly to 6.8 percent in 2016 and 6.0 percent in 2017. Moderate poverty (those living on less than US$3.10 per person per day) is expected to experience somewhat greater declines to 33.9 percent in 2016 and 32.5 percent in 2017, from an estimated 35.3 percent in 2015. The planned expansion of the national conditional cash transfer program targeted at the poor and vulnerable, beginning in 2016, should help accelerate poverty reduction, but faster job creation remains vital.
Emerging Challenges
In a difficult macroeconomic environment and with growth acceleration dependent on fiscal stimulus, weak revenue performance has emerged as a major policy challenge. The revenue-to-GDP ratio declined from 15.4 percent in 2012 to 13.0 percent in 2015. Although energy subsidy reform reduced the impact of oil prices on spending, state revenues remain significantly affected by the global commodity price cycle. Oil and gas revenues declined sharply from 3.4 percent of GDP in 2012 to 1.1 percent in 2015, due to declining prices and declining domestic oil production. In 2014 and 2015, the government undertook several short-term reforms, such as improvements in tax administration and lower tax tariff on asset revaluation, to raise revenue collection, but their effect has been limited. Therefore, weaker-than-expected revenues this year are likely to be offset by expenditure adjustment (by reducing material and contingency spending) and a higher fiscal deficit (but within the legal ceiling of 3 percent of GDP for
GROWING CHALLENGES
PART III. CoUNTRY PAGES AND KEY INDICAToRS 183
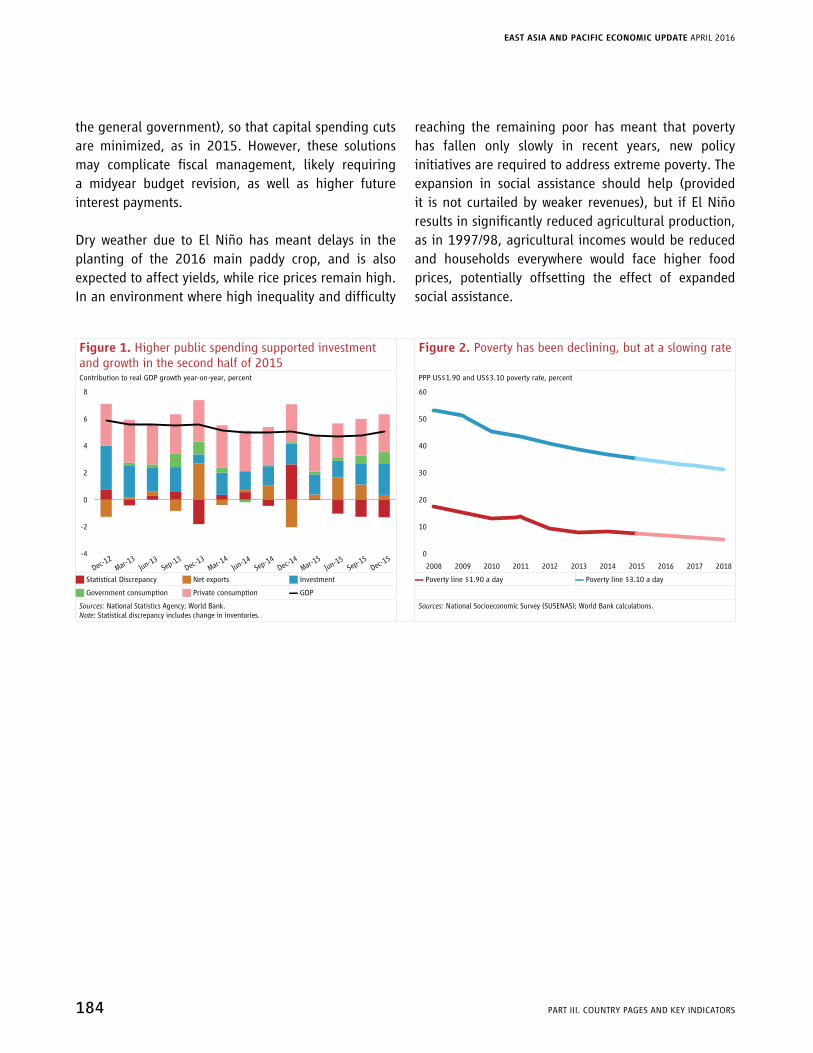
the general government), so that capital spending cuts are minimized, as in 2015. However, these solutions may complicate fiscal management, likely requiring a midyear budget revision, as well as higher future interest payments.
Dry weather due to El Niño has meant delays in the planting of the 2016 main paddy crop, and is also expected to affect yields, while rice prices remain high. In an environment where high inequality and difficulty
reaching the remaining poor has meant that poverty has fallen only slowly in recent years, new policy initiatives are required to address extreme poverty. The expansion in social assistance should help (provided it is not curtailed by weaker revenues), but if El Niño results in significantly reduced agricultural production, as in 1997/98, agricultural incomes would be reduced and households everywhere would face higher food prices, potentially offsetting the effect of expanded social assistance.
Figure 1. Higher public spending supported investment and growth in the second half of 2015
Figure 2. Poverty has been declining, but at a slowing rate
Contribution to real GDP growth year-on-year, percent PPP US$1.90 and US$3.10 poverty rate, percent
8
6
4
2
0
-2
-4
Dec-12
Dec-15
Mar-13
Jun-13Sep-13
Dec-13
Mar-14
Jun-14Sep-14
Dec-14
Mar-15
Sep-15Jun-15
60
50
40
30
20
10
0
2008 2009 2010 2011 2012 2013 2014 2015 2016 2017 2018
J Statistical Discrepancy J Net exports J Investment ▬ Poverty line $1.90 a day ▬ Poverty line $3.10 a day
J Government consumption J Private consumption ▬ GDP
Sources: National Statistics Agency; World Bank.Note: Statistical discrepancy includes change in inventories.
Sources: National Socioeconomic Survey (SUSENAS); World Bank calculations.
EAST ASIA AND PACIFIC ECONOMIC UPDATE APRIL 2016
184 PART III. CoUNTRY PAGES AND KEY INDICAToRS

INDONESIA Selected Indicators 2013 2014 2015e 2016f 2017f 2018f
Real GDP growth, at constant market prices 5.6 5.0 4.8 5.1 5.3 5.5Private Consumption 5.5 5.3 4.8 4.9 5.2 5.4Government Consumption 6.7 1.2 5.4 6.0 5.2 4.5Gross Fixed Capital Investment 5.0 4.6 5.1 5.1 5.2 6.0Exports, Goods and Services 4.2 1.0 -2.0 -3.9 3.6 5.8Imports, Goods and Services 1.9 2.2 -5.8 0.2 2.8 6.2
Real GDP growth, at constant factor prices 5.2 5.0 4.1 4.9 5.2 5.4Agriculture 4.2 4.2 4.0 4.0 4.2 4.3Industry 4.3 4.3 2.7 4.2 4.5 4.6Services 6.4 6.0 5.6 5.9 6.2 6.4
Inflation (Consumer Price Index) 6.4 6.4 6.4 4.0 4.6 4.5Current Account Balance (% of GDP) -3.2 -3.1 -2.1 -2.3 -2.5 -2.9Financial and Capital Account (% of GDP) 2.4 5.1 2.0 2.4 3.3 3.8
Net Foreign Direct Investment (% of GDP) 1.3 1.7 1.1 1.0 1.1 1.7Fiscal Balance (% of GDP) -2.2 -2.2 -2.5 -2.8 -2.8 -2.8Debt (% of GDP) 24.9 24.7 26.9 28.3 28.3 28.8Primary Balance (% of GDP) -1.0 -0.9 -1.2 -1.4 -1.4 -1.4Poverty rate ($1.9/day PPP terms)a,b,c 7.8 8.3 7.5 6.8 6.0 5.3Poverty rate ($3.1/day PPP terms)a,b,c 38.6 36.7 35.3 33.9 32.5 31.0Sources: World Bank, Macroeconomics and Fiscal Management Global Practice, and Poverty Global Practice.Notes: e = estimate, f = forecast. (a) Calculations based on EAPPoV harmonization, using 2011-SUSENAS and 2014-SUSENAS. (b) Projection using point-to-point elasticity (2011-2014) with pass-through = 0.87 based on GDP per capita constant PPP. (c) Actual data: 2013, 2014. Projections are from 2015 to 2018. All fiscal figures are for the central government.
GROWING CHALLENGES
PART III. CoUNTRY PAGES AND KEY INDICAToRS 185
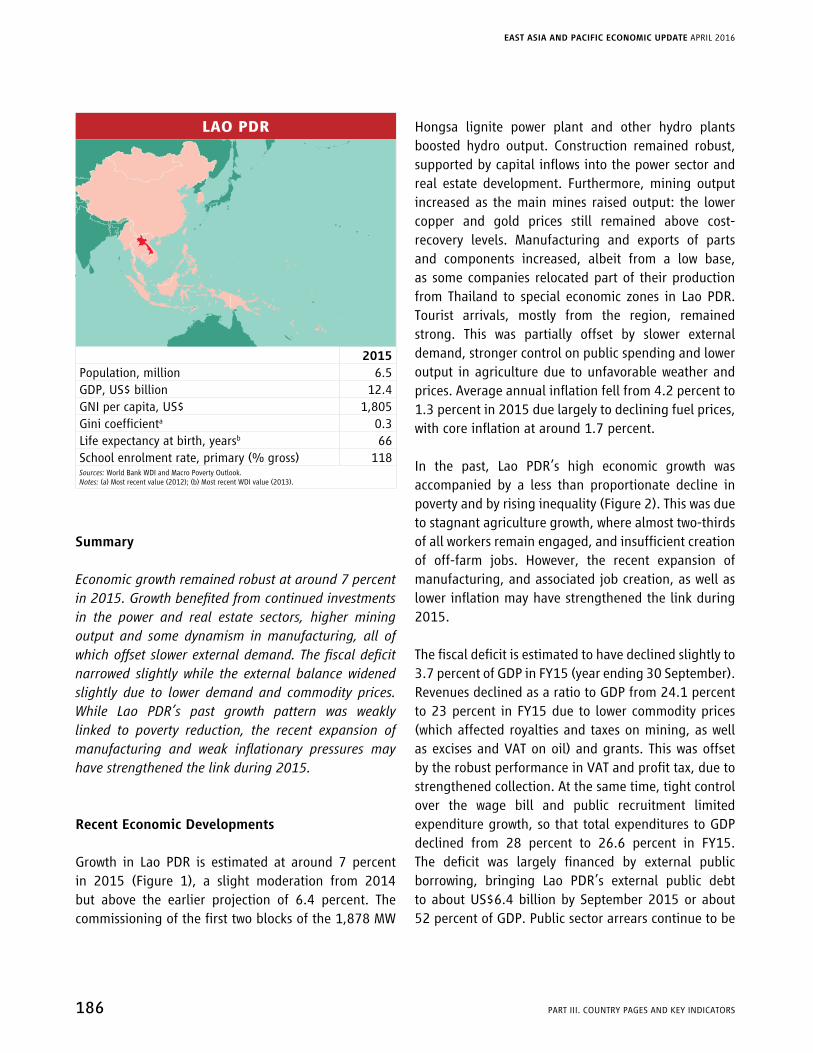
LAO PDR
2015Population, million 6.5GDP, US$ billion 12.4GNI per capita, US$ 1,805Gini coefficienta 0.3Life expectancy at birth, yearsb 66School enrolment rate, primary (% gross) 118Sources: World Bank WDI and Macro Poverty Outlook.Notes: (a) Most recent value (2012); (b) Most recent WDI value (2013).
Summary
Economic growth remained robust at around 7 percent in 2015. Growth benefited from continued investments in the power and real estate sectors, higher mining output and some dynamism in manufacturing, all of which offset slower external demand. The fiscal deficit narrowed slightly while the external balance widened slightly due to lower demand and commodity prices. While Lao PDR’s past growth pattern was weakly linked to poverty reduction, the recent expansion of manufacturing and weak inflationary pressures may have strengthened the link during 2015.
Recent Economic Developments
Growth in Lao PDR is estimated at around 7 percent in 2015 (Figure 1), a slight moderation from 2014 but above the earlier projection of 6.4 percent. The commissioning of the first two blocks of the 1,878 MW
Hongsa lignite power plant and other hydro plants boosted hydro output. Construction remained robust, supported by capital inflows into the power sector and real estate development. Furthermore, mining output increased as the main mines raised output: the lower copper and gold prices still remained above cost-recovery levels. Manufacturing and exports of parts and components increased, albeit from a low base, as some companies relocated part of their production from Thailand to special economic zones in Lao PDR. Tourist arrivals, mostly from the region, remained strong. This was partially offset by slower external demand, stronger control on public spending and lower output in agriculture due to unfavorable weather and prices. Average annual inflation fell from 4.2 percent to 1.3 percent in 2015 due largely to declining fuel prices, with core inflation at around 1.7 percent.
In the past, Lao PDR’s high economic growth was accompanied by a less than proportionate decline in poverty and by rising inequality (Figure 2). This was due to stagnant agriculture growth, where almost two-thirds of all workers remain engaged, and insufficient creation of off-farm jobs. However, the recent expansion of manufacturing, and associated job creation, as well as lower inflation may have strengthened the link during 2015.
The fiscal deficit is estimated to have declined slightly to 3.7 percent of GDP in FY15 (year ending 30 September). Revenues declined as a ratio to GDP from 24.1 percent to 23 percent in FY15 due to lower commodity prices (which affected royalties and taxes on mining, as well as excises and VAT on oil) and grants. This was offset by the robust performance in VAT and profit tax, due to strengthened collection. At the same time, tight control over the wage bill and public recruitment limited expenditure growth, so that total expenditures to GDP declined from 28 percent to 26.6 percent in FY15. The deficit was largely financed by external public borrowing, bringing Lao PDR’s external public debt to about US$6.4 billion by September 2015 or about 52 percent of GDP. Public sector arrears continue to be
EAST ASIA AND PACIFIC ECONOMIC UPDATE APRIL 2016
186 PART III. CoUNTRY PAGES AND KEY INDICAToRS

a concern, and suggest that domestic public debt may be higher than officially reported.
Monetary and exchange rate policies remained focused on tight management of the kip/US dollar exchange rate, resulting in further appreciation of the kip against regional currencies. Credit growth accelerated slightly to 17 percent by year end, potentially in response to the Bank of Laos’ policy of introducing inflation-linked caps on lending and deposit interest rates. Still, credit growth remains well below rates seen in earlier years. A significant part of the financial sector, mostly the state-owned banks, remain at risk of distress due to low capital buffers and deteriorating loan portfolios.
The current account deficit widened slightly as the increase in exports of parts and components and lower fuel prices were insufficient to offset the impact of lower copper prices and slower external demand (including demand for timber from China and Vietnam). Foreign reserves reached about US$990 million in December 2015, covering around 2.2 months of imports and about 30 percent of foreign currency deposits. This level still implies limited buffers, particularly in the context of an unofficial peg of the exchange rate of the kip to the US dollar.
Outlook
The economic outlook remains broadly favorable supported by the power sector and growing ASEAN integration, while fiscal and external deficits are expected to gradually narrow. However, risks are tilted on the downside.
GDP growth is projected to accelerate to 7 percent in 2016, driven by the operation of the Hongsa lignite power plant and other new power projects (around 500MW). Some fiscal expansion and investment as Lao PDR chairs ASEAN in 2016 will add to domestic demand. The current account deficit is expected to
narrow slightly as power exports increase and recent increases in exports of parts and components continue.
Beyond 2016, strong, though more moderate, rates of expansion of the power sector will continue to propel growth. The non-resource sector is also expected to expand due to indirect benefits from the resource sector and efforts to improve the investment climate. The fiscal deficit is projected to decline as non-resource taxation is strengthened and public financial management improves. Stronger power exports should help gradually narrow the external balance.
However, downside risks have increased. Importantly, Lao PDR should secure markets for its rapidly growing power generation and develop the required transmission systems. Additional risks include a slowdown in key trading partners such as China and Thailand that might affect trade and investment. Domestic economic risks remain elevated, including systemic risks in the banking sector (particularly the health of state-owned banks) and the weak enforcement of fiscal discipline which could result in a growing public debt burden, given Lao is already at the cusp of moderate to high risk of debt distress.
Challenges
The current growth pattern needs to become more inclusive and sustainable. With the resource sector creating few productive jobs, Lao PDR needs to broaden its sources of growth. Higher productivity in agriculture can significantly increase farmers’ incomes. Better managing natural resource rents to build human capital and streamlining the business environment can help generate more attractive jobs in the non-resource sector. In the near term, systemic risks in the financial sector need to be addressed. Furthermore, elevated public debt levels and limited reserves buffers undermine the ability to respond to adverse shocks.
GROWING CHALLENGES
PART III. CoUNTRY PAGES AND KEY INDICAToRS 187

Figure 1. Contributions to annual GDP growth Figure 2. Growth incidence curve, 2002/03–2012/13Percent and percentage point contributions Percent
15
10
5
0
-5
2011 2012 2013 2014 2015e
3
2
1
0
2 12 22 32 42 52 62 72 82 92
J Private consumption J Government consumption J Investment ▬ Annualized percentile growth rate ▬ Growth in mean consumption
J Net export ▬ Real GDP growth
Source: Staff estimates based on national statistics. Source: Staff Calculations based on LECS 4-5.
LAO PDR Selected Indicators 2014 2015e 2016f 2017f 2018f
Real GDP growth, at constant market prices 7.5 7.0 7.0 7.0 6.8Private Consumption 5.4 5.2 5.0 4.8 4.5Government Consumption -2.1 5.8 6.2 5.4 5.4Gross Fixed Capital Investment 18.0 10.4 7.9 8.9 8.8Exports, Goods and Services 16.3 -6.5 7.2 7.2 7.3Imports, Goods and Services 15.2 -4.4 5.0 5.2 5.3
Real GDP growth, at constant factor prices 7.5 7.0 7.0 7.0 6.8Agriculture 7.5 0.6 0.7 2.8 3.2Industry 7.0 11.2 11.4 10.0 9.0Services 7.8 7.8 7.0 6.6 6.7
Inflation (Consumer Price Index) 4.2 1.3 3.0 3.0 3.0Current Account Balance (% of GDP) -11.2 -11.6 -10.5 -10.4 -10.2Fiscal Balance (% of GDP) -3.8 -3.7 -4.0 -4.0 -3.9Sources: National Statistics Agency, Ministry of Finance and Bank staff estimates.Notes: e = estimate; f = forecast.
EAST ASIA AND PACIFIC ECONOMIC UPDATE APRIL 2016
188 PART III. CoUNTRY PAGES AND KEY INDICAToRS

MALAYSIA
2015Population, million 30.3GDP, current US$ billion 295.5GDP per capita, current US$ 9743Life Expectancy at birth, yearsa 74.8Sources: World Bank, World Development Indicators, and Macro Poverty Outlook.Notes: a. Life expectancy data show most recent WDI value (2013).
Summary
Growth moderated to 5 percent in 2015 compared with 6 percent in 2014, with domestic demand and export growth both slowing (Figure 1). Private consumption remained subdued, in part due to implementation of the Goods and Services Tax (GST) in April 2015. Against a backdrop of lower commodity prices and depressed external demand, net exports reduced overall growth in the first half of 2015, but contributed positively during the second half, mainly because of buoyant electrical and electronics exports. Services exports declined in part due to lower tourism revenues.
Recent Economic Developments
Malaysia’s external balances deteriorated in 2015. Weaker export revenues have reduced Malaysia’s trade surplus, narrowing the overall current account surplus to 2.9 percent of GDP in 2015, from 4.3 percent in 2014. Portfolio investment outflows were relatively high in 2015, but reversed in Q4 2015. As a result, the
ringgit depreciated by 23 percent against the US dollar in 2015. This has helped to cushion exporters’ incomes and adjust to worsening terms of trade. At the same time, Malaysian authorities have smoothed volatility and utilized reserves, which fell by US$20.7 billion in 2015 (around 17.8 percent of total reserves).
Exchange rate, monetary, and fiscal management responses have been broadly appropriate to maintain economic stability. Between January and mid-March 2016, the ringgit has appreciated by 4.7 percent, largely driven by portfolio inflows.
The overnight policy rate has remained at 3.25 percent since July 2014. Growth in business loans in the banking system accelerated to 8 percent as at Q4 2015, while household loan growth moderated to 7.7 percent, as a result of successful macroprudential regulations introduced by Bank Negara Malaysia. Inflation increased to 2.7 percent year-on-year in December 2015, mainly due to increases in some administered prices, but remains contained as a result of low fuel prices and slower wage growth. Inflation in January 2016 increased to 3.5 percent, mainly due to the base effect from the lower fuel prices in January 2015.
Lower oil prices have posed a major fiscal challenge, since oil-linked revenues accounted for 30 percent of total revenues in 2014, but removal of fuel subsidies in 2014 and introduction of GST in 2015 supported Malaysia’s fiscal deficit reduction from 3.4 percent of GDP in 2014 to 3.2 percent of GDP in 2015.
Malaysia’s economic resilience has been underpinned by a solid labor market. However, the low unemployment rate has trended up in 2015 (from 2.9 percent in 2014 to 3.3 percent in December 2015), and job creation and vacancies remain subdued (Figure 2). Real wage growth has been concentrated in the most dynamic sectors of the economy (electronics manufacturing). As a result, the rising cost of living has started to affect some vulnerable segments of the population.
GROWING CHALLENGES
PART III. CoUNTRY PAGES AND KEY INDICAToRS 189
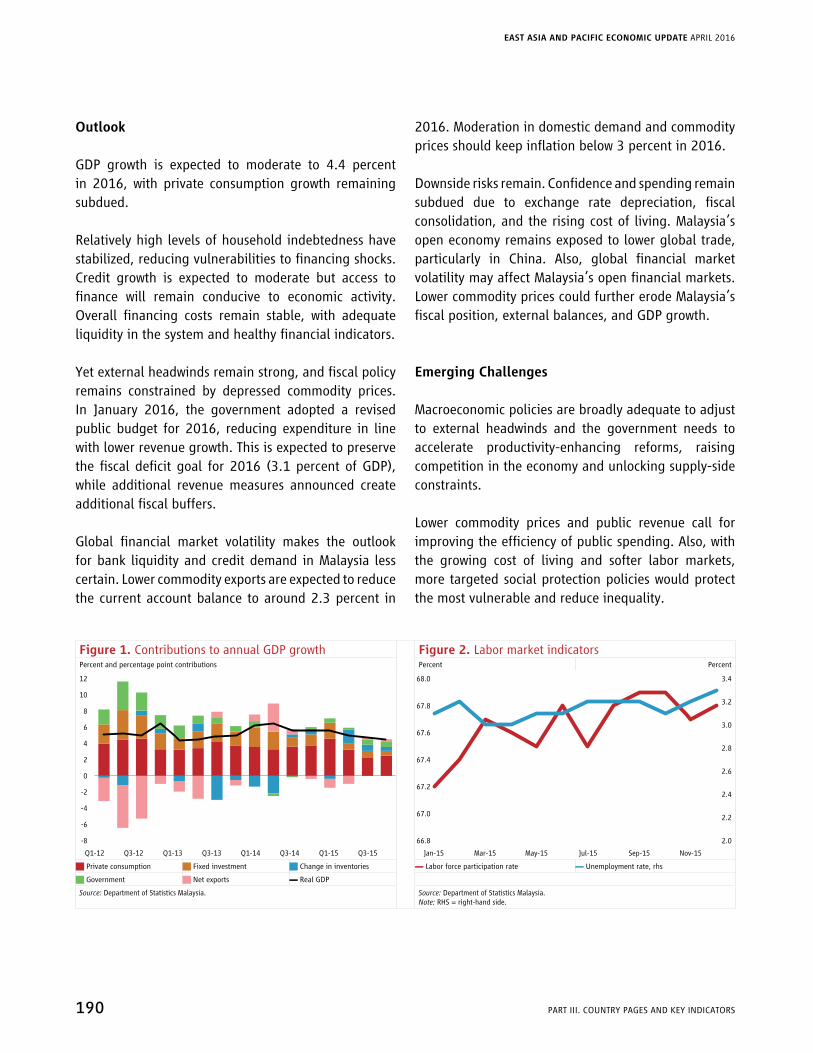
Outlook
GDP growth is expected to moderate to 4.4 percent in 2016, with private consumption growth remaining subdued.
Relatively high levels of household indebtedness have stabilized, reducing vulnerabilities to financing shocks. Credit growth is expected to moderate but access to finance will remain conducive to economic activity. overall financing costs remain stable, with adequate liquidity in the system and healthy financial indicators.
Yet external headwinds remain strong, and fiscal policy remains constrained by depressed commodity prices. In January 2016, the government adopted a revised public budget for 2016, reducing expenditure in line with lower revenue growth. This is expected to preserve the fiscal deficit goal for 2016 (3.1 percent of GDP), while additional revenue measures announced create additional fiscal buffers.
Global financial market volatility makes the outlook for bank liquidity and credit demand in Malaysia less certain. Lower commodity exports are expected to reduce the current account balance to around 2.3 percent in
2016. Moderation in domestic demand and commodity prices should keep inflation below 3 percent in 2016.
Downside risks remain. Confidence and spending remain subdued due to exchange rate depreciation, fiscal consolidation, and the rising cost of living. Malaysia’s open economy remains exposed to lower global trade, particularly in China. Also, global financial market volatility may affect Malaysia’s open financial markets. Lower commodity prices could further erode Malaysia’s fiscal position, external balances, and GDP growth.
Emerging Challenges
Macroeconomic policies are broadly adequate to adjust to external headwinds and the government needs to accelerate productivity-enhancing reforms, raising competition in the economy and unlocking supply-side constraints.
Lower commodity prices and public revenue call for improving the efficiency of public spending. Also, with the growing cost of living and softer labor markets, more targeted social protection policies would protect the most vulnerable and reduce inequality.
Figure 1. Contributions to annual GDP growth Figure 2. Labor market indicatorsPercent and percentage point contributions Percent Percent
12
10
8
6
4
2
0
-2
-4
-6
-8
Q1-12 Q3-12 Q1-13 Q1-14 Q1-15Q3-13 Q3-14 Q3-15
68.0 3.4
3.2
3.0
2.8
2.6
2.4
2.2
2.0
67.8
67.6
67.4
67.2
67.0
66.8
Jan-15 Mar-15 May-15 Jul-15 Sep-15 Nov-15
J Private consumption J Fixed investment J Change in inventories ▬ Labor force participation rate ▬ Unemployment rate, rhs
J Government J Net exports ▬ Real GDP
Source: Department of Statistics Malaysia. Source: Department of Statistics Malaysia.Note: RHS = right-hand side.
EAST ASIA AND PACIFIC ECONOMIC UPDATE APRIL 2016
190 PART III. CoUNTRY PAGES AND KEY INDICAToRS

MALAYSIA Selected Indicators 2013 2014 2015e 2016f 2017f 2018f
Real GDP growth, at constant market prices 4.7 6.0 5.0 4.4 4.5 4.7Private Consumption 7.2 7.0 6.0 5.3 5.4 5.6Government Consumption 5.9 4.4 4.2 3.8 3.7 3.9Gross Fixed Capital Investment 8.2 4.8 3.9 4.8 4.6 4.6Exports, Goods and Services 0.3 5.1 0.7 1.5 4.2 5.5Imports, Goods and Services 1.7 4.2 1.3 2.1 5.0 6.2
Real GDP growth, at constant factor prices 4.7 6.0 5.0 4.4 4.5 4.7Agriculture 1.9 5.2 0.9 2.6 1.0 2.5Industry 3.6 1.7 -0.5 4.5 5.0 5.2Services 5.9 9.2 9.2 4.6 4.6 4.6
Inflation (Consumer Price Index) 2.1 3.1 2.1 2.8 3.0 2.6Current Account Balance (% of GDP) 3.6 4.5 2.9 2.3 2.3 2.4Fiscal Balance (% of GDP) -3.8 -3.4 -3.2 -3.1 -3.1 -3.0Debt (% of GDP) 55.9 55.2 57.2 56.1 55.8 55.6Primary Balance (% of GDP) -1.7 -1.3 -1.0 -0.9 -0.9 -1.2Sources: World Bank, Macroeconomics and Fiscal Management Global Practice, and Poverty Global Practice.Note: f = forecast.
GROWING CHALLENGES
PART III. CoUNTRY PAGES AND KEY INDICAToRS 191

MONGOLIA
2015Population, million 3.1GDP, current US$ billion 11.8GDP per capita, current US$ 3,840Gini Coefficienta 33.8School enrollment, primary (% gross)b 108.8Life Expectancy at birth, yearsb 69.1Sources: World Bank WDI and Macro Poverty Outlook.Notes: (a) Most recent value (2014); (b) Most recent WDI value (2013).
Summary
Growth is expected to remain sluggish in 2016 due to weaker mining production, likely increasing poverty particularly among urban households. The economy faces short-term challenges from a fragile external environment and large external debt repayments, with limited policy buffers. Staying the course on policy adjustment is important to strengthen economic resilience to external shocks and secure a sustainable growth path.
Recent Economic Developments
Growth dropped to 2.3 percent (year-on-year [yoy]) in 2015, with a sharp weakening of investment and exports (Figure 1). Mining GDP grew 13 percent (yoy) on the back of strong production of the Oyu Tolgoi (OT) mine. Non-mining GDP contracted by 0.8 percent, reflecting subdued domestic demand. Growth in agriculture was maintained at 10.7 percent. Manufacturing growth
slowed to 1.3 percent, and wholesale and retail services and construction growth contracted by 3.6 percent and 1.4 percent, respectively.
Exports dropped 36 percent (yoy) in the last quarter of 2015, followed by a 30.4 percent fall in January. Total imports fell by 19.5 percent in January, following a 21 percent drop in the previous three months, with oil product imports halving. Sharp import compression turned the current account into a US$24 million surplus in January, from a deficit of US$130 million in the previous three months.
The balance of payments recorded a US$21.7 million surplus in January, following a US$95.6 million deficit in the final three months of 2015. A moderate current account surplus and a currency swap facility with the People’s Bank of China (PBoC) helped ease the balance of payments pressure in January. Foreign direct investment (FDI) remained weak, displaying a US$26.7 million net inflow in January. Gross international reserves declined to US$1,197 million in February from US$1,323 million at end-2015, indicating escalating balance-of-payments pressure in February. The togrog depreciated by 2.5 percent against the US dollar in the first three months of 2016, following highly limited movement in the last four months of 2015.
Bank loan growth continued to contract by 4.5 percent (yoy), and the nonperforming-loan ratio rose to 7.8 percent in February. Headline inflation remained subdued at 2 percent (yoy) in February. Amid tight credit conditions and slowing inflation, the Bank of Mongolia lowered its policy rate by 100 basis points to 12 percent in January.
The on-budget deficit, excluding the commercial project loans of the Development Bank of Mongolia (DBM), reached 5.1 percent of GDP in 2015, close to the 5 percent ceiling of the Fiscal Stability Law (FSL). Budget revenues declined by 5.4 percent compared with 2014 amid slowing growth and falling imports. Expenditures were cut through two supplementary
EAST ASIA AND PACIFIC ECONOMIC UPDATE APRIL 2016
192 PART III. CoUNTRY PAGES AND KEY INDICAToRS
budgets in response to the revenue shortage. Off-budget commercial loans of the DBM also declined to around 2.5 percent of GDP, from 3.9 percent in the previous year. Facing continued pressure on balance of payments and revenues, the government announced that a US$250 million five-year loan had been secured through a syndicated loan facility in March.
Outlook
Growth is projected to slow to 0.7 percent in 2016. Non-mining production will gradually recover with OT’s second-phase investment. Mining production is projected to decline due to weaker external demand and lower-grade ores to be tapped by the oT mine. Inflation is expected to stay moderate amid a slow recovery in demand and lower oil prices.
Weak growth in key labor-intensive sectors such as construction and retail services would have adverse welfare impacts, particularly among wage-dependent urban households. The job share of paid workers declined to 47.6 percent in 2015, from 49.4 percent one year ago. Female labor force participation remained at 54 percent, since working-age women among the poor were constrained by child care responsibilities. Loss of wage income is thus expected to raise poverty among urban households that are dependent on a single wage earner in low-skilled jobs, most of whom barely make enough to keep their households out of poverty.
The current account deficit is projected to widen to 9 to 10 percent of GDP in 2016, from 4.8 percent last year, with a sharp drop in mineral exports. The balance of payments will remain under pressure due to the widening current account deficit, while increased FDI inflows and the currency swap facility with the PBoC provide partial buffers.
The fiscal outlook remains weak. Weaker mineral exports are expected to undermine mineral revenues,
demanding continued tight spending control to meet the FSL’s deficit ceiling of 4 percent of GDP.
Emerging Challenges
Mongolia’s long-term growth prospects remain strong, but its resilience will be tested by short-term challenges from the deteriorating external environment, in the absence of proper external and fiscal buffers.
The economic prospects are subject to downside risks from the weak commodity market and China’s slowdown. A sharper drop in mineral exports would further dampen growth and erode limited reserve buffers unless foreign capital inflows significantly recover.
With its public external debt rising to 65 percent of GDP in 2015, Mongolia is vulnerable to global financial volatility, particularly exchange rate shocks and tighter refinancing conditions. Strong long-term growth prospects supported by large resource wealth indicate a low solvency risk, but the concentrated debt repayment of US$1,080 million in 2017–18 will likely pose a near-term challenge.
Priorities should be given to reducing external and fiscal vulnerabilities by deepening policy adjustment. The fiscal policy should stay the course on reducing the budget deficit and managing the public debt at a sustainable level. Monetary policy should stay focused on maintaining price stability, avoid quasi-fiscal programs, and reduce external vulnerabilities by allowing a flexible exchange rate adjustment and safeguarding reserve buffers. Continued efforts to revamp foreign capital inflows are needed.
The weak economic prospects in the near term indicate the growing risk that many households close to the poverty line may slide back into poverty. To preserve poverty gains under tight fiscal constraints, it is important to redesign the social safety nets to mitigate adverse impacts on the newly poor and the vulnerable.
GROWING CHALLENGES
PART III. CoUNTRY PAGES AND KEY INDICAToRS 193

Figure 1. Contributions to annual GDP growth Figure 2. Growth incidence curve: 2010–14Percent and percentage point contributions Annualized growth rate, percent
50
40
30
20
10
0
-10
-20
-30
-40
Q1-11 Q1-12 Q1-13 Q1-14 Q1-15Q3-11 Q3-12 Q3-13 Q3-14 Q3-15 2 12 22 32 42 52 62 72 82 92
12
10
8
6
4
2
0
-2
Per capita consumption percentile
J Final consumption J Gross capital formation J Net exports ▬ GDP ▬ Rural: 2012–14 ▬ National: 2010–12 ▬ Urban: 2012–14 ▬ National: 2012–14
Source: National Statistics office. Source: World Bank staff estimates.
MONGOLIA Selected Indicators 2013 2014 2015e 2016f 2017f 2018f
Real GDP growth, at constant market prices 11.6 7.9 2.3 0.7 2.7 6.2Private Consumption 15.4 6.3 7.8 4.9 5.0 5.2Government Consumption 15.8 12.2 -7.8 1.5 0.6 0.7Gross Fixed Capital Investment -7.2 -21.7 -38.1 16.4 29.5 7.4Exports, Goods and Services 12.8 53.2 -4.0 -13.4 -6.3 9.3Imports, Goods and Services 7.6 6.8 -16.6 -5.5 5.8 7.5
Real GDP growth, at constant factor prices 11.6 7.8 2.3 0.7 2.7 6.2Agriculture 19.3 13.6 10.7 9.5 9.5 8.5Industry 15.3 16.1 8.8 -4.6 -2.8 7.8Services 6.8 4.8 1.1 2.5 4.6 4.5
Inflation (Private Consumption Deflator) 12.3 11.0 1.9 3.8 5.0 6.5Current Account Balance (% of GDP) -25.1 -11.5 -4.8 -9.3 -14.2 -12.8Net Foreign Direct Investment (% of GDP) 16.7 2.3 1.6 6.2 13.9 13.2Fiscal Balance (% of GDP) -9.2 -10.8 -8.1 -7.3 -6.8 -6.3Debt (% of GDP) 49.4 57.7 65.6 74.3 75.3 75.4Primary Balance (% of GDP) -7.8 -8.5 -5.0 -3.8 -3.6 -2.1Sources: World Bank, Macroeconomics and Fiscal Management Global Practice, and Poverty Global Practice.Note: f = forecast.
EAST ASIA AND PACIFIC ECONOMIC UPDATE APRIL 2016
194 PART III. CoUNTRY PAGES AND KEY INDICAToRS

MYANMAR
2014a
Population, millionb 51.4GDP, current US$, billion 63.4GDP per Capita, current US$ 1,233Life expectancy at brith, years (2012) 65School enrolment, primary (2010) 114Sources: World Bank staff estimates and World Development Indicators (2014). Note: (a) 2014–15 fiscal year (April 1–March 31); (b) Provisional Census Results, 2014, Ministry of Immigration and Population, Myanmar.
Summary
Economic growth in Myanmar has eased to 7 percent in 2015–16 due to floods, inflationary pressures, and a slowdown in new investments. Medium-term growth is projected to average 8.2 percent per year. This assumes continued improvement in business regulations, and accelerated investment in critical infrastructure and supporting services.
Recent Economic Developments
Economic growth in Myanmar eased to 7 percent in real terms in 2015–16 (year ended March 31; Figure 1) due to floods in July 2015, which affected some of the poorest and most vulnerable people in the country, and a slowdown in new investments. The historic elections of November 2015 have created a general sense of economic optimism. However, the floods contributed to rising food prices and slower private consumption growth. Private investment growth in 2015–16 has also
slowed due to a combination of structural constraints and a moderation in new investments.
Agricultural output in 2015–16 is estimated to have grown at around 2 percent in real terms, compared to 6 percent in 2014–15. Total paddy production, which is around a quarter of value added in crops, has contracted. This reflects a combination of the negative flood impacts, El Niño effects, and a modest shift into higher-value export of beans and pulses. This has had spillover effects on food processing, which accounts for the bulk of manufacturing output in Myanmar. Deceleration in industrial output has been fairly broad-based. Gas output in the first three quarters of 2015–16 grew by 8 percent (year-on-year) compared with 36 percent over the same period last year.
Import growth in the first three quarters of 2015–16 (year-on-year) has decelerated to 2.5 percent compared to 25 percent in the same period last year. An important factor has been the decline in the demand for imported industrial raw materials. The overall trade deficit, however, will remain large due to a drop in exports. This is due to a combination of falling commodity prices, which have translated to a slight drop in the value of gas exports, and falling mineral exports.
A combination of the supply shock associated with the floods and a 30 percent currency devaluation has led to a rapid rise in inflation in 2015–16, peaking at 16 percent year-on-year in October 2015–16 (Figure 2). Rice prices increased by 21 percent, while prices of other processed foods increased by around 25 percent. Rice accounts for more than 50 percent of the calories consumed by poorer households, many of which fall at the margin of food security. The rural landless, smallholder, and urban poor are likely to have had more limited diets as a consequence of lower rice yields and higher prices. Poor smallholder households engage in a limited way with markets, cultivating for their own consumption, and are therefore likely to be shielded from price shocks but will be impacted by rice yield declines. Prices have more recently started to
GROWING CHALLENGES
PART III. CoUNTRY PAGES AND KEY INDICAToRS 195

come down, with average month-on-month deflation of 1.7 percent in December and January.
Broad money growth has decelerated significantly from its past five-year trend amid the ongoing slowdown in economic activity. Moderating private sector credit growth is one of the main factors behind the current broad money slowdown. Monetization of the government deficit expanded due to fiscal pressures. Following the Central Bank’s downward adjustment to the reference exchange rate in August 2015, the kyat has moved broadly in line with market forces. The kyat appreciated slightly at the beginning of 2016, largely due to seasonal factors, but has remained supportive of external competitiveness.
A revised 2015–16 Union Budget, adopted by the Parliament in November 2015, had to accommodate growing operational deficits in the power sector linked to higher energy costs resulting from weaker currency. Spending on health and education increased in the 2015–16 revised budget. These budget shifts continue to prioritize improvements in human development outcomes among poorer households. The general government deficit in the revised 2015–16 budget is projected at 5.2 percent of GDP, although improved revenue collection could potentially help contain the deficit to around 3.1 percent.
Outlook
Medium-term growth is projected to average 8.2 percent per year in real terms. This reflects pent-up demand but also assumes continued progress on structural reforms, including measures to improve business regulations, continued expansion of access to financial services, and major investments in the power sector.
Pressures on Myanmar’s current account are likely to remain strong due to the drop in international commodity prices and the slowdown in China. The fall in oil prices has already started to feed through to
Myanmar’s gas export prices, and production is unlikely to grow significantly over the medium term. The demand for and prices of mineral exports are likely to remain down. These developments may also put pressure on government receipts, though these are expected to be offset to some extent by gains from tax administration reforms.
Emerging Challenges
Structural constraints to investments will remain a major challenge to medium-term growth. Despite progress over the last four years, expansion of private business activity is now running into bottlenecks because of the lack of electricity supply, and lack of access to finance, land, and skilled labor. Rural areas remain isolated by limited transport infrastructure, which restricts the ability of farmers and local nonfarm businesses to access markets. These factors are affecting the productivity of the private sector, which is struggling to compete with imports, including in labor-intensive light manufacturing sectors. Therefore macroeconomic policies that are conducive to stability and low inflation are critical to not only offsetting loss of competitiveness, but also encouraging investments in infrastructure and supporting services.
Promoting these investments will not only require fiscal space, but also leveraging resources from the private sector. Power sector investment needs alone are projected at US$30 billion in the next 15 years. Although a gradual increase in public revenues, reprioritization in the budget, and concessional financing from external donors may contribute to this, they will not be sufficient to plug major infrastructure gaps.
EAST ASIA AND PACIFIC ECONOMIC UPDATE APRIL 2016
196 PART III. CoUNTRY PAGES AND KEY INDICAToRS

Figure 1. Contributions to annual GDP growth Figure 2. Contributions to yearly inflationPercent and percentage point contributions Percent and percentage point contributions
9
8
7
6
5
4
3
2
1
0
2012–13 2013–14 2014–15 2015–16
18
16
14
12
10
8
6
4
2
0
Apr-15 May-15 Jun-15 Jul-15 Aug-15 Sep-15 Oct-15 Nov-15 Dec-15 Jan-16
J Agriculture J Industry J Services J Food J Nonfood ▬ CPI inflation
Sources: Central Statistics office, WB Staff estimates. Sources: Central Statistics office; WB staff estimates.
MYANMAR Selected Indicators1 2014e 2015e 2016f 2017f 2018f
Real GDP growth 8.5 7.0 7.8 8.4 8.3Growth in GDP at current prices 15.6 19.1 17.0 15.3 14.8
Agriculture 12.6 13.5 13.4 12.2 11.8Industry 15.9 20.2 17.2 15.9 16.6Services 17.8 22.4 19.3 17.0 15.5
CPI inflation, period average 5.9 11.3 8.5 6.3 5.7Current account balance, % GDP -6.3 -7.9 -7.0 -5.6 -5.4Fiscal balance, % of GDP -1.8 -3.1 -3.3 -3.7 -3.5
Revenue 13.3 13.1 13.6 14.0 14.6Expenditure 15.2 16.2 16.9 17.6 18.1
Sources: Myanmar Central Statistical Organization; Ministry of Finance; Central Bank of Myanmar; IMF; World Bank staff estimates.Note: 1/ In annual percentage charge percent, unless otherwise noted; 2/ Fiscal year, April 1–March 31; e = estimate. f = forecast.
GROWING CHALLENGES
PART III. CoUNTRY PAGES AND KEY INDICAToRS 197

PAPUA NEW GUINEA
2015Population, mn 7.7GDP, US$ bn 20.0GDP per capita, US$ 2,597GDP per capita, US$, PPP 2,818Poverty rate, percent 39.9*Gini coefficient, consumption 0.41*Life expectancy 62.3Primary school enrollment rate, gross percent 114**Sources: IMF WEo 2015, WDI 2014, World Bank staff estimates.Note: *2009/10; **2012.
Summary
Growth in Papua New Guinea in 2015 was around 8.6 percent, significantly lower than earlier projections. The economy is facing strong headwinds from lower global commodity prices, which are adversely affecting growth in the extractive sector.
Recent developments
The World Bank estimates GDP growth in Papua New Guinea in 2015 at 8.6 percent, which is significantly lower than that forecast for 2015 a year ago (16 percent). The lower growth forecast stems from the strong headwinds facing PNG. Namely, lower global commodity prices coupled with unfavorable weather conditions brought on by El Niño effects and followed by possible La Niña effects.
The poor weather conditions adversely affected growth in both the agriculture and mining sectors with the suspension of production at the Ok Tedi mine and the drought and frost-like conditions reducing production in the agriculture sector.
Construction sector growth is expected to have slowed in 2015 due to a contraction in government spending given the expected shortfall in mineral and petroleum tax revenue. The World Bank estimates that the non-resource sectors have contributed, 0.5 percentage points to overall growth in 2015 while the resource sector is expected to have contributed 8.1 percentage points, with PNG LNG production reaching full capacity.
Based on the latest household survey data, the poverty rate in 2010 was 39.9 percent. The level of consumption inequality, measured by the Gini coefficient, was 0.41 in 2010.
The fiscal deficit for 2015 is expected to be 4.9 percent, lower than the deficit of 8.3 percent in 2014. Mineral and petroleum tax revenue is expected to come in at PGK 300 million, much lower than the PGK 794 million received in 2014. Expenditure is also expected to be lower in 2015 by 2 percent over the previous year.
Notwithstanding the lower commodity prices, on the back of LNG exports, the current account is expected to turn to a surplus of 4.1 percent of GDP in 2015 from a deficit of 4.2 percent in 2014. In contrast, a deficit in the capital and financial account due to a build-up in the foreign currency account balances of resident mineral companies, combined with net loan repayments by the government, is expected to result in an overall balance of payments (BoP) deficit. BoP data for the eleven months to November 2015 show an overall deficit of PGK 380.3 million compared to a deficit of PGK 757.8 million over the same period in 2014.
The currency has depreciated at a steady rate against the US dollar since mid-2014 primarily in response to the
EAST ASIA AND PACIFIC ECONOMIC UPDATE APRIL 2016
198 PART III. CoUNTRY PAGES AND KEY INDICAToRS

declining commodity prices. There is also a shortage of foreign exchange in the interbank market with foreign exchange reserves held by the central bank declining to USD 1.8 billion (2.8 months of import cover) towards the end of January 2016 as the central bank attempts to satisfy the excess demand for foreign currency.
The CPI inflation rate was 6 percent in 2015, 0.8 percentage points above the previous year.
Outlook
over the next five years, GDP growth is expected to average 3.5 percent, with growth driven almost entirely by the non- mining and petroleum sectors. Growth could be significantly higher in the next five years than projected if major mining and petroleum projects commence.
The reduction in expenditure in Budget 2016 continues the process of fiscal consolidation. The budget deficit in 2016 is projected to be 3.8 percent of GDP. According to the 2016 Budget, a significant portion of the budget deficit of PGK 2.1 billion is expected to be financed through an external sovereign bond issuance of USD 1 billion.
Given the expected continuation of subdued commodity prices in 2016, domestic revenue generation is expected to remain constrained in the near term. This implies that ensuring quality expenditure in the face of a reduced budget envelope will be key to supporting the development enablers identified by the government.
PNG continues to remain at a low risk of debt distress based on the 2015 World Bank-IMF assessment of public and publicly-guaranteed external debt.
Inflation is expected to stabilize at around 6 percent in 2016, as the effects of lower oil and commodity prices are offset by kina depreciation.
Challenges
The risks to the outlook are increasingly skewed to the downside.
Possible global financial market instability may adversely affect prospects for external commercial financing and/or foreign direct investment. There is a risk of further decline in commodity prices in response to a sustained slowdown in China, a reversal of the rebound in the US or generally anemic global growth. This may exacerbate the poor revenue performance and adversely affect foreign exchange earnings.
To preserve the foreign exchange reserve position, consideration should be given to improving the foreign exchange allocation mechanism and the monetary policy framework. These reforms should be underpinned by measured fiscal and monetary policies. This would help to take pressure off the foreign exchange market.
Moreover, if the external sovereign bond is not hedged against currency risk, a sustained depreciation of the kina could exacerbate the fiscal cost of servicing the debt and paying the principal. This would crowd—out expenditure on the development enablers the government has prioritized.
There is also a risk that fiscal consolidation, necessitated by weaker-than-anticipated revenue performance, will significantly dampen growth in the non-extractive sectors over the short run, while a weak global economy could further dampen external demand and commodity prices. This will adversely affect foreign exchange reserves.
GROWING CHALLENGES
PART III. CoUNTRY PAGES AND KEY INDICAToRS 199

Figure 1. Contributions to annual GDP growth Figure 2. Key fiscal indicatorsPercent and percentage point contributions to growth Percent of GDP
2008 2009 2010 2011 2012 2013 2014 2015e 2016f 2017f 2018f
14
12
10
8
6
4
2
0
-2
-4
2008 2009 2010 2011 2012 2013 2014 2015e 2016f 2017f 2018f
40
35
30
25
20
15
10
5
0
-5
-10
40
38
36
34
32
30
28
26
24
22
20
J Agriculture, forestry & fishing J Oil & gas extraction J Mining & quarrying J Overall budget balance J Debt
J Construction J Other ▬ Total ▬ Total expenditure & net lending, rhs ▬ Revenue incl. grants, rhs
Sources: World Bank, IMF, PNG Treasury. Sources: World Bank, IMF, PNG Treasury.
PAPUA NEW GUINEA Selected Indicators 2013 2014 2015e 2016f 2017f 2018f
Reala
GDP, at market prices 5.5 8.5 8.6 3.0 4.1 2.9Mining and Petroleum 0.5 7.9 8.1 0.1 0.1 0.2Non-mining and non-petroleum 5.0 0.6 0.5 2.9 4.0 2.7CPI inflation, period average 5.0 5.2 6.0 6.0 6.0 6.0
Fiscalb,c
Revenue 28.4 27.4 24.8 22.9 21.6 21.6Expenditure 36.1 35.7 29.7 26.8 23.9 23.1Balance -7.8 -8.3 -4.9 -3.8 -2.3 -1.5Debt 34.6 35.5 34.7 35.8 35.9 35.6
Externalb
Current account balance -31.8 -4.2 4.1 3 3.1 3.3Resource -16.4 7.4 14.5 14 14.9 14.8Non-resource -15.4 -11.5 -10.4 -11 -11.8 -11.5
Sources: World Bank, Macroeconomics and Fiscal Management Global Practice, and Poverty Global Practice.Notes: e = estimate, f = forecast. (a) Annual percentage change, unless otherwise indicated; (b) Percent of GDP, unless otherwise indicated; (c) Based on the 2016 Budget.
EAST ASIA AND PACIFIC ECONOMIC UPDATE APRIL 2016
200 PART III. CoUNTRY PAGES AND KEY INDICAToRS

PHILIPPINES
2015Population, million 100.7GDP, current US$ billion 291.9GDP per capita, current US$ 2,900Poverty rate ($1.9/day 2011 PPP terms)a 10.6Poverty rate ($3.1/day 2011 PPP terms)a 32.0Gini Coefficienta 46.5Life Expectancy at birth, yearsb 68.6Sources: World Bank WDI and Macro Poverty Outlook.Notes: (a) Most recent value (2012); (b) Most recent WDI value (2013).
Summary
Philippine economic growth decelerated to 5.8 percent in 2015 from 6.1 percent in 2014. However, the country was still among the stronger performers in the region. Growth is expected to accelerate in 2016 before tapering in 2017. Poverty is expected to fall gradually. The final stretch of the current administration presents an opportunity to accelerate the economic reform agenda and lay out a practical approach to tackle it for the next administration.
Recent Economic Developments
Despite the deceleration in GDP growth in 2015, the Philippines remained a strong performer in the region. In 2015, the combination of a weaker global environment and slower public spending brought Philippine economic growth to 5.8 percent, its lowest in four years (Figure 1). On the demand side, the strong
performance of private domestic demand, driven by record-low inflation and robust remittances, continued to support growth. Public spending recovered in the second half of 2015, but was offset by the contraction in net exports. On the supply side, agriculture growth continued to disappoint as El Niño intensified. As in previous years, the services sector drove growth, while manufacturing decelerated.
Stronger growth in the second half of 2015 led to significant improvements in unemployment. However, the quality of growth remains a concern. In January 2016, the unemployment rate fell to 5.8 percent, the second-lowest rate in a decade. However, the underemployment rate rose by 2 percentage points (ppt) to 19.7 percent. In addition, weak agricultural output led to a reduction of 935,000 jobs in agriculture, bringing net job creation to 752,000 jobs between January 2015 and January 2016.
Sustained high non-agricultural growth and effective government transfers are helping improve the welfare of the poor. However, high rates of structural poverty remain, especially among households dependent on agriculture. Recent estimates suggest that extreme poverty decreased gradually and continuously between 2012 and 2014. Extreme poverty is estimated to have decreased from 10.6 percent in 2012 to 9 percent in 2014. Despite the impact of Typhoon Yolanda in November 2013 and the artificially high rice prices created by the state monopoly on rice imports, income growth of the poor, led by non-agricultural households and substantial increases in cash transfers to the bottom quintile, helped further poverty reduction. After a decrease of only 0.3 ppt between 2009 and 2012 (in USD 2011 PPP prices and taking into account spatial-cost-of-living differences), revised PPP estimates suggest that poverty fell faster between 2012 and 2014.
The domestic financial market has experienced sharp volatility, yet fundamentals remain sound. In early 2016 the stock index, responding largely to uncertainties in China’s financial market, declined significantly by
GROWING CHALLENGES
PART III. CoUNTRY PAGES AND KEY INDICAToRS 201

12.5 percent from its end-2015 levels and 25 percent from its April 2015 peak, bringing the index to its lowest level in almost 2 years. More recently, however, the stock market has recovered strongly, posting year-to-date gains of 3.6 percent. Despite recent volatility, the domestic financial market remains resilient, and underlying fundamentals continue to be sound. The combination of low levels of nonperforming loans and higher capital adequacy ratios provides a necessary cushion for the domestic financial sector. In addition, a number of prudential measures are in place to mitigate risks. Likewise, monetary policy remains supportive, with room to respond to higher global interest rates. Finally, the peso remains flexible and is in line with market fundamentals, offering a cushion to large capital outflows.
After a slow start in the first half of 2015, government spending accelerated in the second half as budget execution bottlenecks began to be addressed and priority projects expedited. In 2015, government spending grew by 13 percent, but was still only equivalent to 87 percent of the budget. Tax effort increased marginally to 13.7 percent of GDP, aided by sustained improvements in tax administration. However, without tax policy reforms, tax effort is unlikely to increase further. Higher spending relative to 2014 led to a wider budget deficit of 0.9 percent of GDP. Given the country’s sustainable fiscal stance, this fiscal outturn suggests room for further investment in infrastructure and social services to make growth more inclusive.
Outlook
In the medium term, growth prospects remain positive. In 2016, growth is expected to accelerate to 6.4 percent before tapering to 6.2 percent in 2017. Growth this year will be supported by stronger government spending related to the election, which could stimulate private consumption and in turn increase GDP growth by 1 percentage point in H1 2016. In addition, low
inflation, fueled by low oil prices, will continue to drive domestic consumption. Risks to growth include the slowdown of remittances from oil-exporting countries and lower net exports due to weak external demand. Moreover, a stronger El Niño could lead to higher food prices, especially if food imports are delayed.
Poverty reduction is expected to continue if the country is able to maintain the relatively high economic growth rates and the more positive job trends of recent years, despite recent shocks to agriculture. The recent increase in the underemployment rate, high food inflation, and weak agricultural output in 2016 will need to be countered by a sustained increase in per capita income growth and a continued focus on reaching the structurally poor. Under these assumptions, extreme poverty is projected to further decrease from 9 percent in 2014 to 6.8 percent in 2018.
Emerging Challenges
Trends in recent years point to the beginnings of a more inclusive growth pattern, which needs to be sustained over a longer period before the poor can feel the impact of higher growth and better governance in their daily lives. The current administration has achieved much in terms of preserving macroeconomic stability, promoting transparency, and directing the growing fiscal space toward pro-poor infrastructure and social services. What is needed now is to institutionalize the reforms made and to accelerate the economic reform agenda. This includes further enhancing competition in sectors with a high impact on jobs, such as shipping and telecommunications, securing property rights through more systematic and administrative adjudication of land rights, and simplifying business regulations to encourage the growth of firms of all sizes, while continuing to sustainably ramp up public investments in infrastructure and social services. In all these, priority is needed in Mindanao, where decades of conflict and neglect have kept it from reaching its potential. To this end, the government, business, labor, and civil society
EAST ASIA AND PACIFIC ECONOMIC UPDATE APRIL 2016
202 PART III. CoUNTRY PAGES AND KEY INDICAToRS

need to work together and agree on a package of reforms that will maximize the chances that the country will now follow a more inclusive growth path.
Figure 1. Contributions to annual GDP growth Figure 2. Poverty reduction is expected to continue as per capita income increases
Percent and percentage point contributions Poverty rate, percent
12
10
8
6
4
2
0
-2
-4
2011 2012 2013 2014 2015
40
35
30
25
20
15
10
5
0
9,000
8,000
7,000
6,000
5,000
4,000
3,000
2,000
1,000
0
2000 2002 2004 2006 2008 2010 2012 2014 2016 2018
J Private consumption J Government consumption J Investments ▬ $1.9/day PPP ▬ $3.1/day PPP ▬ GDP per capita, PPP, rhs
J Discrepancy J Net exports ▬ GDP growth
Source: Philippine Statistics Authority (PSA). Source: World Bank.
PHILIPPINES Selected Indicators 2013 2014 2015 e 2016 f 2017 f 2018 f
Real GDP growth, at constant market prices 7.1 6.1 5.8 6.4 6.2 6.2Private Consumption 5.6 5.4 6.2 6.2 5.8 5.8Government Consumption 5.2 1.8 9.4 10.0 9.6 9.0Gross Fixed Capital Investment 12.2 6.8 14.0 11.0 10.4 10.8Exports, Goods and Services -1.0 11.3 5.5 4.9 7.5 7.8Imports, Goods and Services 4.4 8.7 11.9 6.0 9.4 9.8
Real GDP growth, at constant factor prices 7.1 6.1 5.8 6.4 6.2 6.2Agriculture 1.1 1.6 0.2 1.6 1.7 2.0Industry 9.2 7.9 6.0 6.5 6.5 6.4Services 7.0 5.9 6.7 7.2 6.9 6.7
Inflation (Consumer Price Index) 3.0 4.1 1.4 2.0 2.5 3.0Current Account Balance (% of GDP) 4.2 3.8 2.9 2.5 2.3 2.0Financial and Capital Account (% of GDP) 0.9 3.4 0.9 1.2 1.1 0.8
Net Foreign Direct Investment (% of GDP) 1.4 2.0 1.9 1.5 1.7 1.8Fiscal Balance (% of GDP) -1.4 -0.6 -0.9 -2.0 -2.0 -2.0Debt (% of GDP) 49.2 45.4 44.8 42.6 40.4 38.2Primary Balance (% of GDP) 1.4 1.9 1.4 1.1 1.0 0.9Poverty rate ($1.9/day PPP terms)a,b,c 9.7 9.0 8.4 7.8 7.3 6.8Poverty rate ($3.1/day PPP terms)a,b,c 30.9 29.9 29.1 28.1 27.2 26.4Sources: World Bank, Macroeconomics and Fiscal Management Global Practice, and Poverty Global Practice.Notes: e = estimate, f = forecast. (a) Calculations based on EAPPoV harmonization, using 2006-FIES and 2012-FIES. (b) Projection using annualized elasticity (2006–12) with pass-through = 1 based on GDP per capita constant PPP. (c) Projections are from 2013 to 2018.
GROWING CHALLENGES
PART III. CoUNTRY PAGES AND KEY INDICAToRS 203

SMALL PACIFIC ISLAND COUNTRIES
2015Population, million 0.86GDP, US$, billion 3.04GDP per capita, current US$ 3,539Sources: IMF WEo 2015, WDI, World Bank staff estimates.
Summary
Most Small Pacific Island Countries experienced moderate growth in 2015, driven by stimulus from public and donor-funded investments, reconstruction from recent natural disasters, and continued strength in tourism and remittances. Inflation remains moderate due to falling commodity prices, which have also supported current account positions. Fiscal sustainability remains a challenge in most countries.
Recent Economic Developments
The economy of the Federated States of Micronesia is projected to have picked up slightly in FY2015 (ending 30 September) from a contraction of 3.4 percent in FY2014, reflecting resumption of US-Compact-related infrastructure projects. Annual average inflation dipped below zero in FY2015, due to lower global oil prices and the appreciation of the US dollar (the national currency). The government is projected to have achieved a fiscal surplus of 2.8 percent in FY2015 on the back of continued strength in fishing revenues. Tax reforms to broaden the tax base and improve tax administration
were, however, repealed in FY2015, and taxes collected as a share of GDP remain among the lowest in the Pacific, at around 12 percent of GDP. The government has prudently saved surpluses into the Federated States of Micronesia Trust Fund, which will help meet potential future shortfalls stemming from the scheduled end of Compact grants from 2024.
In Kiribati, real GDP growth in 2015 moderated to an estimated 3.1 percent after reaching 3.7 percent in 2014, reflecting a slowdown in the construction sector, driven by the winding down of major donor-financed projects including road, airport, and water and sanitation rehabilitation projects. Inflation has remained low, averaging below 2 percent in 2015, as lower food and commodity prices offset the pressures from higher domestic spending in an election year and the weaker Australian dollar (the national currency).
Despite large trade deficits (ranging from 40 to 47 percent of GDP in the last five years), the current account balance is expected to register a large surplus thanks to the record fishing license revenue, and to lesser degrees, steady remittances and investment income flows to the Revenue Equalization Reserve Fund (RERF). The RERF is Kiribati’s sovereign wealth fund and the main mechanism to save wealth for future generations, as well as build buffers against shocks.
Fishing license fee revenue reached $A212 million in 2015 (about 100 percent of GDP), driven by the favorable El Niño effect, implementation of the Vessel Day Scheme, and the appreciation of the US dollar against the Australian dollar, which has resulted in a large fiscal surplus ($A126 million, or around 60 percent of GDP). The government has managed to save $A50 million in the RERF, while the consecutive fiscal surpluses in 2014–15 have led to a cash buffer of around $A100 million in government deposits outside the RERF—well above what is needed for crisis response. The decision to save or spend this money has been left until the next government is established following the presidential election in March 2016.
EAST ASIA AND PACIFIC ECONOMIC UPDATE APRIL 2016
204 PART III. CoUNTRY PAGES AND KEY INDICAToRS

Palau’s economy is projected to have expanded by around 4 percent in FY2015 (ending 30 September) from 4.9 percent in FY2014. With tourism contributing to around two-thirds of GDP, the pickup in economic activity in FY2015 is expected to have been largely driven by the rise in tourist arrivals. Tourist arrivals reached 166,136 in FY2015, a 35.2 percent increase year-on-year, more than doubling from FY2010 arrivals. Of the tourist arrivals, 54 percent came from China, despite the reduction in chartered flights from 48 to 32 to manage their influx. With a large number of hotels operating at capacity, further expansion of the tourism sector will likely be constrained until new accommodations under construction begin to operate in FY2017. Inflation moderated to 2.2 percent in FY2015, with a rising tobacco tax and higher transport and utility costs offset by lower international fuel prices (a 40 percent reduction in import values). A fiscal surplus equivalent to around 2 percent is expected in FY2015. The surplus was achieved on the back of higher fishing license fees and tourism-related taxes, and tightly managed expenditures, supported by lower input costs such as fuel. Capital expenditure continued to rise to build and maintain essential infrastructure, such as water and sewerage.
The economy of the Republic of the Marshall Islands is projected to have picked up slightly in FY2015 (ending 30 September) from a contraction of 1.1 percent in FY2014, reflecting resumption of US-Compact-related infrastructure projects. Annual average inflation dipped to -2.2 percent in FY2015, due to lower global oil prices and the appreciation of the US dollar (the national currency). Commercial decisions by US banks to terminate a correspondence relationship with the Bank of the Marshall Islands, possibly related to weak capacity to implement anti-money-laundering and banking supervision policies, is having an impact on the bank’s ability to access US dollars and on financial sector stability. Preliminary figures suggest that the government achieved a near-balanced fiscal outturn in FY2014, which is projected to improve in FY2015, reflecting higher revenues from fishing license fees,
largely offset by persistent subsidies to loss-making state-owned enterprises.
Samoa’s economy continues to grow at a modest rate overall, although the sectoral composition of growth has shifted. Real GDP increased by 1.7 percent in FY2015 (ending 30-June), up from 1.2 percent in FY2014. Growth was driven by the commerce, services, and transport sectors, which in turn benefited from increases in remittances and tourism earnings, as well as lower fuel prices. In contrast, output in the construction, manufacturing, and agriculture sectors contracted. In FY2016 and over the medium term, real GDP is expected to increase at an annual rate of around 2 percent, supported by growth in the tourism sector and a pick-up in agriculture, although the pending exit of a major manufacturer in FY2017 will temporarily lower growth during that year.
Average annual inflation was around 0.7 percent in the year to December 2015, with substantial declines in fuel and transport prices keeping overall inflation modest. Domestic food prices saw a pronounced rise in 2015, but imported food prices fell, with overall food prices increasing by 3.3 percent.
The current account deficit narrowed to around 6 percent of GDP in FY2015, due to an increase in tourism receipts and remittances, and should continue to decline in the medium term, as agricultural exports and tourism pick up. In the year to November 2015, total visitor arrivals—which include the large visiting friends and relatives (VFR) market—were up by 4.3 percent relative to the previous year, although excluding VFRs, visitor arrivals were down by 2.9 percent. Over the same period, remittances grew by 8.5 percent. A number of major hotel developments are scheduled to open in 2016, which may attract increased tourist arrivals in the coming years.
The government ran a fiscal deficit of 3.9 percent of GDP in FY2015, down from 5.3 percent in FY2014, with the less expansionary stance attributable to the winding
GROWING CHALLENGES
PART III. CoUNTRY PAGES AND KEY INDICAToRS 205

down of cyclone-related works and the continued economic recovery. Although the budget projects a deficit of 4.7 percent in FY2016, the widening is largely attributable to a substantial decline in grants from development partners, with government spending on current expenditures (excluding debt servicing) down by around 4 percent from the previous year. As a result of continued fiscal deficits (above the medium-term target of 3.5 percent of GDP) and only modest economic growth, Samoa’s external public debt has increased rapidly in recent years, from around 30 percent of GDP at end FY2008 to about 56 percent as of September 2015. To ensure overall sustainability, it is important that fiscal consolidation proceeds as planned, and that any new debt-funded projects are rigorously assessed and financed with concessional loans.
Tonga’s economic performance has strengthened, with growth in FY2016 (ending 30-June) currently projected to be the highest in the last five years, building on robust activity in both the public and private sectors. While economic conditions in Tonga are substantially affected by frequent natural disasters, remoteness from markets and small size, prudent economic and fiscal management, and a series of growth-supporting reforms have helped support increased business confidence and growth in recent years. After an earlier decline due to the completion of major public investment projects and the impact of natural disasters, growth has stabilized at about 2 percent since FY2014 and is projected to reach 2.8 percent in FY2016. Strong public expenditure has helped to support growth, as post-cyclone reconstruction projects proceed, but private sector growth has also played an important part, with expansions in a number of key sectors, including agriculture and tourism. Sizable private investments are also being made, including the redevelopment of a luxury hotel which, when completed in FY2017, will be the country’s largest hotel and mark a much-needed increase in high-end accommodation.
The government’s fiscal position has strengthened on increasing domestic revenue and continued prioritization of expenditure, although frequent civil
service pay demands and large one-off expenditures related to hosting the South Pacific Games present risks in the next few years. Domestic revenues have increased significantly from 18.0 percent of GDP in FY2012 to a projected 22.6 percent in FY2016, supported by a series of revenue policy and administration reforms. In both FY2014 and FY2015 the government delivered small fiscal surpluses. The budget is projected to fall into deficit again in FY2016, with the containment of the deficit critically dependent on the level of government financing for the construction of facilities for the South Pacific Games, to be held in 2019.
Inflation has been muted for the last five years and at the end of FY2015 stood at 0.2 percent year-on-year, with falling oil prices and improved agricultural production keeping prices low despite increased demand. Private sector credit has begun to grow after many years of decline following an earlier severe credit crisis in the housing market. Private sector credit growth was only marginal at 0.7 percent in FY2014, but picked up to 8.6 percent in FY2015. The current account deficit is expected to be just below 3 percent in FY2015. Foreign exchange reserves are adequate, at around six months of import cover.
Growth is estimated to have picked up in Tuvalu in 2015, and this trend is expected to continue into 2016 on the back of public sector investments. Growth is partly attributable to rising capital spending related to recovery and reconstruction needs associated with Tropical Cyclone (TC) Pam (damage and losses are estimated at over 30 percent of GDP). This has been complemented by increased capital and maintenance spending for other purposes, and especially to the more poverty-prone outer islands, after a period of sustained spending reductions given the tight fiscal situation in the aftermath of the global financial crises. Finally, donor-funded projects have also contributed to growth, and are expected to further contribute to growth in the near term.
EAST ASIA AND PACIFIC ECONOMIC UPDATE APRIL 2016
206 PART III. CoUNTRY PAGES AND KEY INDICAToRS

Inflation has remained moderate, but may see upward pressure in 2016. Inflation has been moderate at under 3 percent over the last several years as domestic commodity prices, including food items and fuel, have fallen since the global food and fuel crisis, albeit at a moderate pace due to the slow transmission mechanisms. However, recent expansion in capital spending together with the falling Australian dollar (the national currency) may exert upward inflationary pressure.
The government went through a period of fiscal consolidation between 2009 and 2013, but more recently adopted an expansionary fiscal policy. As noted earlier, the bulk of the increase in public expenditure is associated with capital spending. However, there have also been upward pressures on wages and salaries and transfers. The pickup in expenditure has been more than offset by rising fishing license fees, which reached around $A26 million (or over 60 percent of GDP) in 2015 on the back of favorable exchange rates, weather conditions, and negotiated rates. As a result, despite the expansionary fiscal policy, the government has achieved significant surpluses over the last two years. Surpluses have been prudently reinvested into the corpus of the Tuvalu Trust Fund.
Vanuatu is slowly recovering from TC Pam, which struck in March 2015, causing widespread damage and losses. However, unusually dry conditions triggered by El Niño have further curtailed the production of some agricultural commodities (including cocoa, kava, and beef), and have led to reports of food and water shortages on Tanna and other islands, with the impacts on hardship and vulnerability in these areas of particular concern. Total air visitors in the first half of 2015 fell by around 18 percent from their level a year earlier, but showed signs of recovery in the September quarter. Cruise ship arrivals fell even further in the aftermath of the cyclone, but look to have rebounded strongly in the period since. Overall, as a result of the ongoing impact of TC Pam and the effects of El Niño, tourism and agricultural output are both likely to have contracted in 2015, although reconstruction activities
and the commencement of several large infrastructure projects will have provided a partial offset. Activity in wholesale and retail trade is also likely to have increased, boosted by the influx of aid workers and post-cyclone spending by businesses and households on recovery and reconstruction needs.
As a result of these developments, GDP is likely to have been little changed in 2015, compared with the pre-cyclone forecast of 4.3 percent growth. In 2016, a recovery in tourism and agriculture combined with further progress on infrastructure projects is expected to propel growth to around 4 percent. However, the suspension of a number of international flights into Port Vila’s Bauerfield airport in January, due to concerns about the condition of the runway, is likely to significantly affect tourist arrivals in the first quarter of 2016.
Following the imprisonment of 14 members of Parliament for bribery, and the dissolution of Parliament in late 2015, a new coalition government was elected in January. These political developments have meant that the 2016 budget has been delayed. A plan to restore services and rebuild infrastructure damaged by TC Pam was adopted in mid-2015, but the disbursement of pledged funds for cyclone recovery projects has been delayed in a number of cases. However, construction projects that were initiated prior to the cyclone—including roads on Tanna and Malekula, and the Luganville wharf—have seen some progress. If undertaken efficiently, and with due regard to domestic capacity constraints, a scaling up of public investment should boost Vanuatu’s potential growth rate and ensure services are available to the poorest and most vulnerable. Given the government’s conservative fiscal stance in recent years, it has some fiscal space to take on moderate levels of concessional debt to meet these recovery and development needs.
GROWING CHALLENGES
PART III. CoUNTRY PAGES AND KEY INDICAToRS 207
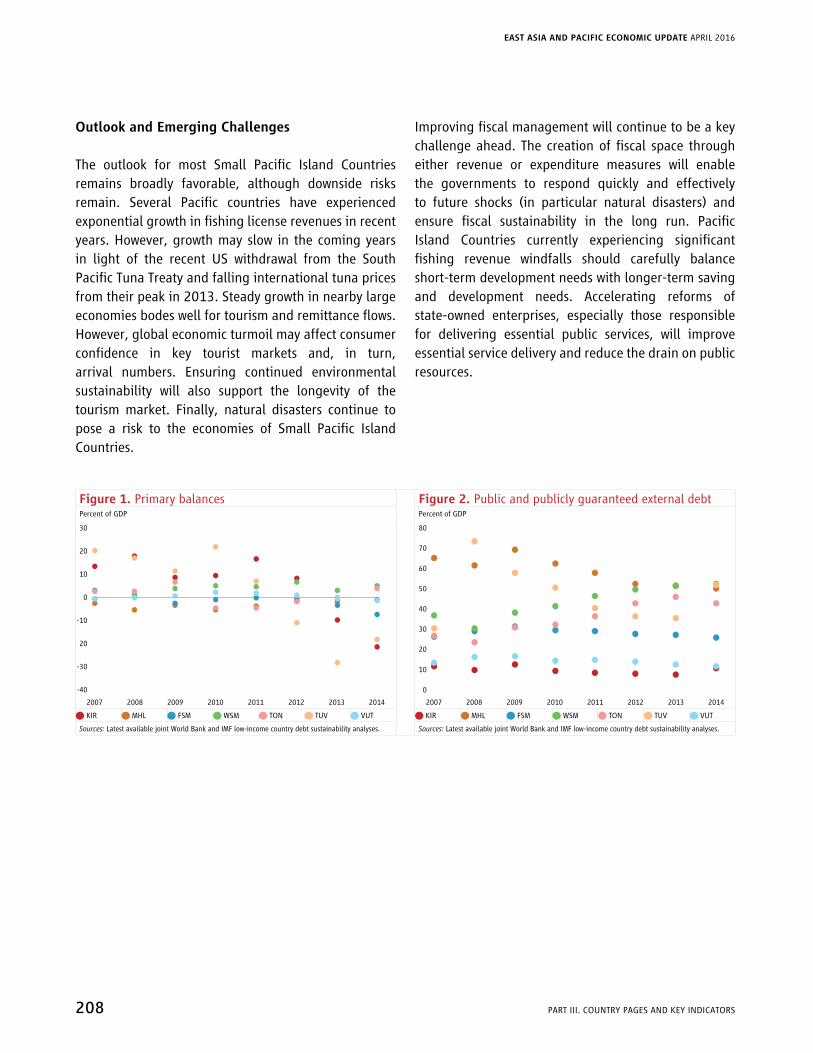
Outlook and Emerging Challenges
The outlook for most Small Pacific Island Countries remains broadly favorable, although downside risks remain. Several Pacific countries have experienced exponential growth in fishing license revenues in recent years. However, growth may slow in the coming years in light of the recent US withdrawal from the South Pacific Tuna Treaty and falling international tuna prices from their peak in 2013. Steady growth in nearby large economies bodes well for tourism and remittance flows. However, global economic turmoil may affect consumer confidence in key tourist markets and, in turn, arrival numbers. Ensuring continued environmental sustainability will also support the longevity of the tourism market. Finally, natural disasters continue to pose a risk to the economies of Small Pacific Island Countries.
Improving fiscal management will continue to be a key challenge ahead. The creation of fiscal space through either revenue or expenditure measures will enable the governments to respond quickly and effectively to future shocks (in particular natural disasters) and ensure fiscal sustainability in the long run. Pacific Island Countries currently experiencing significant fishing revenue windfalls should carefully balance short-term development needs with longer-term saving and development needs. Accelerating reforms of state-owned enterprises, especially those responsible for delivering essential public services, will improve essential service delivery and reduce the drain on public resources.
Figure 1. Primary balances Figure 2. Public and publicly guaranteed external debtPercent of GDP Percent of GDP
30
20
10
0
-10
20
-30
-40
2007 2008 2009 2010 2011 2012 2013 2014
80
70
60
50
40
30
20
10
0
2007 2008 2009 2010 2011 2012 2013 2014
Q KIR Q MHL Q FSM Q WSM Q TON Q TUV Q VUT Q KIR Q MHL Q FSM Q WSM Q TON Q TUV Q VUT
Sources: Latest available joint World Bank and IMF low-income country debt sustainability analyses. Sources: Latest available joint World Bank and IMF low-income country debt sustainability analyses.
EAST ASIA AND PACIFIC ECONOMIC UPDATE APRIL 2016
208 PART III. CoUNTRY PAGES AND KEY INDICAToRS
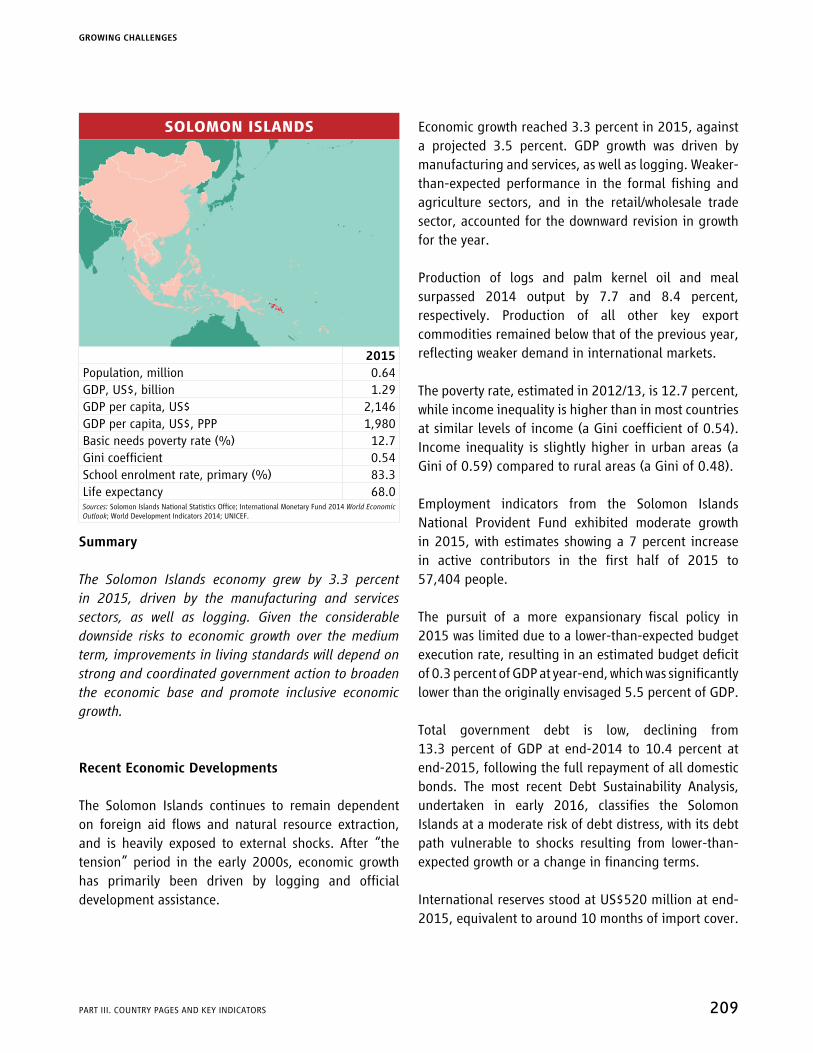
SOLOMON ISLANDS
2015Population, million 0.64GDP, US$, billion 1.29GDP per capita, US$ 2,146GDP per capita, US$, PPP 1,980Basic needs poverty rate (%) 12.7Gini coefficient 0.54School enrolment rate, primary (%) 83.3Life expectancy 68.0Sources: Solomon Islands National Statistics office; International Monetary Fund 2014 World Economic Outlook; World Development Indicators 2014; UNICEF.
Summary
The Solomon Islands economy grew by 3.3 percent in 2015, driven by the manufacturing and services sectors, as well as logging. Given the considerable downside risks to economic growth over the medium term, improvements in living standards will depend on strong and coordinated government action to broaden the economic base and promote inclusive economic growth.
Recent Economic Developments
The Solomon Islands continues to remain dependent on foreign aid flows and natural resource extraction, and is heavily exposed to external shocks. After “the tension” period in the early 2000s, economic growth has primarily been driven by logging and official development assistance.
Economic growth reached 3.3 percent in 2015, against a projected 3.5 percent. GDP growth was driven by manufacturing and services, as well as logging. Weaker-than-expected performance in the formal fishing and agriculture sectors, and in the retail/wholesale trade sector, accounted for the downward revision in growth for the year.
Production of logs and palm kernel oil and meal surpassed 2014 output by 7.7 and 8.4 percent, respectively. Production of all other key export commodities remained below that of the previous year, reflecting weaker demand in international markets.
The poverty rate, estimated in 2012/13, is 12.7 percent, while income inequality is higher than in most countries at similar levels of income (a Gini coefficient of 0.54). Income inequality is slightly higher in urban areas (a Gini of 0.59) compared to rural areas (a Gini of 0.48).
Employment indicators from the Solomon Islands National Provident Fund exhibited moderate growth in 2015, with estimates showing a 7 percent increase in active contributors in the first half of 2015 to 57,404 people.
The pursuit of a more expansionary fiscal policy in 2015 was limited due to a lower-than-expected budget execution rate, resulting in an estimated budget deficit of 0.3 percent of GDP at year-end, which was significantly lower than the originally envisaged 5.5 percent of GDP.
Total government debt is low, declining from 13.3 percent of GDP at end-2014 to 10.4 percent at end-2015, following the full repayment of all domestic bonds. The most recent Debt Sustainability Analysis, undertaken in early 2016, classifies the Solomon Islands at a moderate risk of debt distress, with its debt path vulnerable to shocks resulting from lower-than-expected growth or a change in financing terms.
International reserves stood at US$520 million at end-2015, equivalent to around 10 months of import cover.
GROWING CHALLENGES
PART III. CoUNTRY PAGES AND KEY INDICAToRS 209
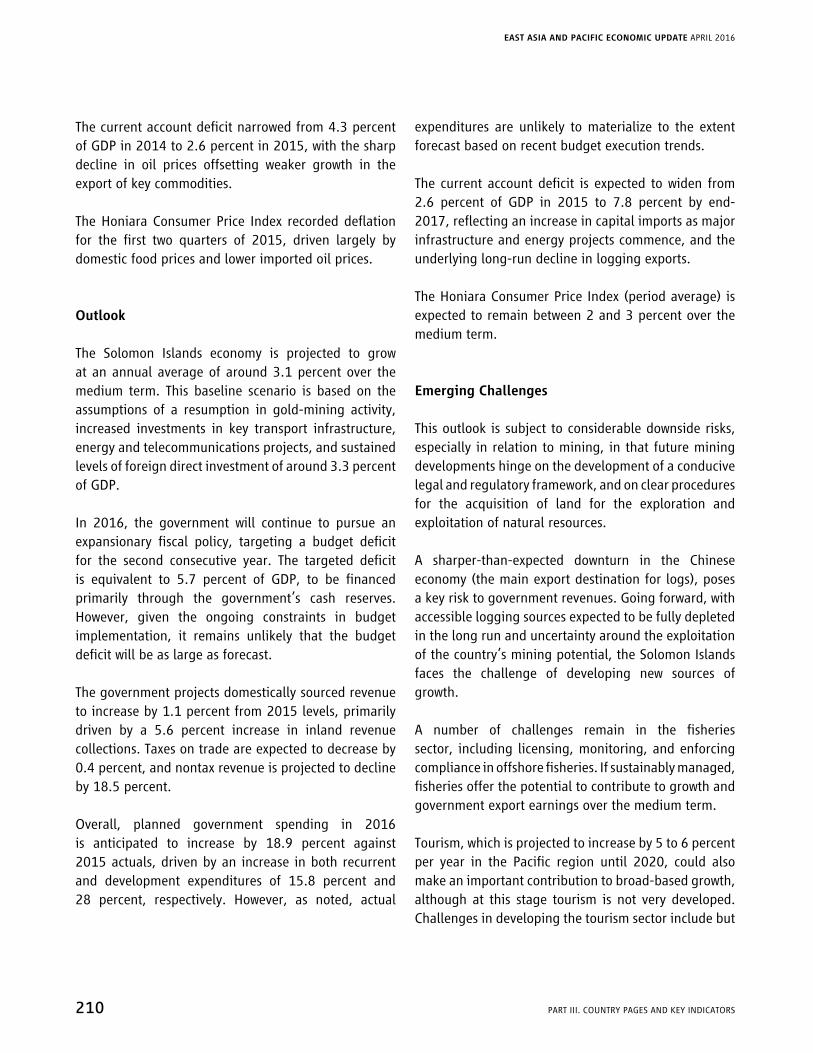
The current account deficit narrowed from 4.3 percent of GDP in 2014 to 2.6 percent in 2015, with the sharp decline in oil prices offsetting weaker growth in the export of key commodities.
The Honiara Consumer Price Index recorded deflation for the first two quarters of 2015, driven largely by domestic food prices and lower imported oil prices.
Outlook
The Solomon Islands economy is projected to grow at an annual average of around 3.1 percent over the medium term. This baseline scenario is based on the assumptions of a resumption in gold-mining activity, increased investments in key transport infrastructure, energy and telecommunications projects, and sustained levels of foreign direct investment of around 3.3 percent of GDP.
In 2016, the government will continue to pursue an expansionary fiscal policy, targeting a budget deficit for the second consecutive year. The targeted deficit is equivalent to 5.7 percent of GDP, to be financed primarily through the government’s cash reserves. However, given the ongoing constraints in budget implementation, it remains unlikely that the budget deficit will be as large as forecast.
The government projects domestically sourced revenue to increase by 1.1 percent from 2015 levels, primarily driven by a 5.6 percent increase in inland revenue collections. Taxes on trade are expected to decrease by 0.4 percent, and nontax revenue is projected to decline by 18.5 percent.
Overall, planned government spending in 2016 is anticipated to increase by 18.9 percent against 2015 actuals, driven by an increase in both recurrent and development expenditures of 15.8 percent and 28 percent, respectively. However, as noted, actual
expenditures are unlikely to materialize to the extent forecast based on recent budget execution trends.
The current account deficit is expected to widen from 2.6 percent of GDP in 2015 to 7.8 percent by end-2017, reflecting an increase in capital imports as major infrastructure and energy projects commence, and the underlying long-run decline in logging exports.
The Honiara Consumer Price Index (period average) is expected to remain between 2 and 3 percent over the medium term.
Emerging Challenges
This outlook is subject to considerable downside risks, especially in relation to mining, in that future mining developments hinge on the development of a conducive legal and regulatory framework, and on clear procedures for the acquisition of land for the exploration and exploitation of natural resources.
A sharper-than-expected downturn in the Chinese economy (the main export destination for logs), poses a key risk to government revenues. Going forward, with accessible logging sources expected to be fully depleted in the long run and uncertainty around the exploitation of the country’s mining potential, the Solomon Islands faces the challenge of developing new sources of growth.
A number of challenges remain in the fisheries sector, including licensing, monitoring, and enforcing compliance in offshore fisheries. If sustainably managed, fisheries offer the potential to contribute to growth and government export earnings over the medium term.
Tourism, which is projected to increase by 5 to 6 percent per year in the Pacific region until 2020, could also make an important contribution to broad-based growth, although at this stage tourism is not very developed. Challenges in developing the tourism sector include but
EAST ASIA AND PACIFIC ECONOMIC UPDATE APRIL 2016
210 PART III. CoUNTRY PAGES AND KEY INDICAToRS
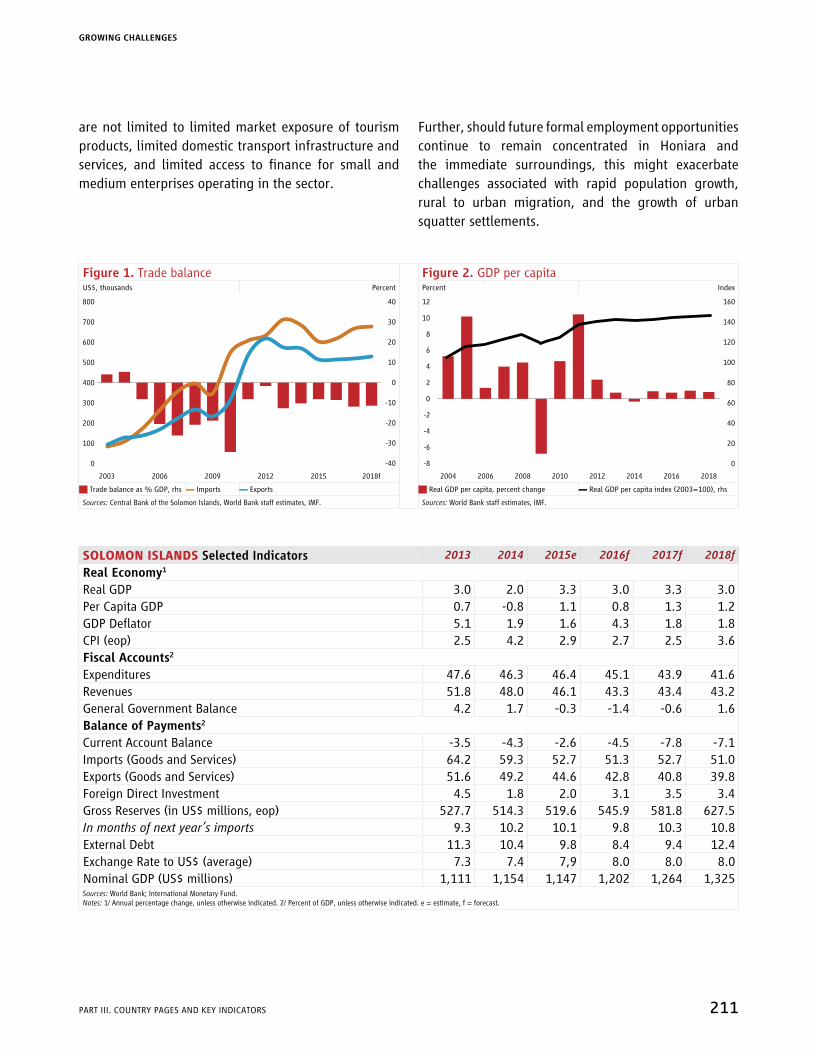
are not limited to limited market exposure of tourism products, limited domestic transport infrastructure and services, and limited access to finance for small and medium enterprises operating in the sector.
Further, should future formal employment opportunities continue to remain concentrated in Honiara and the immediate surroundings, this might exacerbate challenges associated with rapid population growth, rural to urban migration, and the growth of urban squatter settlements.
Figure 1. Trade balance Figure 2. GDP per capitaUS$, thousands Percent Percent Index
40
30
20
10
0
-10
-20
-30
-40
800
700
600
500
400
300
200
100
0
2003 2006 2009 2012 2018f2015
12
10
8
6
4
2
0
-2
-4
-6
-8
160
140
120
100
80
60
40
20
0
2004 2006 2008 2010 2012 2014 2016 2018
J Trade balance as % GDP, rhs ▬ Imports ▬ Exports J Real GDP per capita, percent change ▬ Real GDP per capita index (2003=100), rhs
Sources: Central Bank of the Solomon Islands, World Bank staff estimates, IMF. Sources: World Bank staff estimates, IMF.
SOLOMON ISLANDS Selected Indicators 2013 2014 2015e 2016f 2017f 2018f
Real Economy1
Real GDP 3.0 2.0 3.3 3.0 3.3 3.0Per Capita GDP 0.7 -0.8 1.1 0.8 1.3 1.2GDP Deflator 5.1 1.9 1.6 4.3 1.8 1.8CPI (eop) 2.5 4.2 2.9 2.7 2.5 3.6Fiscal Accounts2
Expenditures 47.6 46.3 46.4 45.1 43.9 41.6Revenues 51.8 48.0 46.1 43.3 43.4 43.2General Government Balance 4.2 1.7 -0.3 -1.4 -0.6 1.6Balance of Payments2
Current Account Balance -3.5 -4.3 -2.6 -4.5 -7.8 -7.1Imports (Goods and Services) 64.2 59.3 52.7 51.3 52.7 51.0Exports (Goods and Services) 51.6 49.2 44.6 42.8 40.8 39.8Foreign Direct Investment 4.5 1.8 2.0 3.1 3.5 3.4Gross Reserves (in US$ millions, eop) 527.7 514.3 519.6 545.9 581.8 627.5In months of next year’s imports 9.3 10.2 10.1 9.8 10.3 10.8External Debt 11.3 10.4 9.8 8.4 9.4 12.4Exchange Rate to US$ (average) 7.3 7.4 7,9 8.0 8.0 8.0Nominal GDP (US$ millions) 1,111 1,154 1,147 1,202 1,264 1,325Sources: World Bank; International Monetary Fund.Notes: 1/ Annual percentage change, unless otherwise indicated. 2/ Percent of GDP, unless otherwise indicated. e = estimate, f = forecast.
GROWING CHALLENGES
PART III. CoUNTRY PAGES AND KEY INDICAToRS 211

THAILAND
2015Population, million 68.0GDP, current US$ billion 450.9GDP per capita, current US$ 6,635Poverty rate ($1.9/day 2011PPP terms)a 0.0Poverty rate ($3.1/day 2011PPP terms)a 0.9Gini Coefficienta 37.8School enrollment, primary (% gross)b 95.4Life expectancy at birth, yearsb 74.2Sources: World Bank WDI and Macro Poverty Outlook.Notes: (a) Most recent value (2013); (b) Most recent WDI value (2013).
Summary
The Thai economy shows signs of a nascent recovery but faces headwinds on the path toward a broad-based and sustained recovery. Growth accelerated to 2.8 percent in 2015, compared to 0.8 percent in 2014, partly driven by government consumption and investment, and partly by declining imports. Tourism and private consumption have recovered modestly, whereas merchandise exports dropped in the last quarter of 2015. Economic growth is expected to moderate to 2.5 percent in 2016. Poverty rates are expected to fall gradually, with poor households in rural areas affected by falling agricultural prices.
Recent Economic Developments
Economic growth increased to 2.8 percent in 2015, compared to 0.8 percent in 2014 (Figure 1), with
public consumption the main contributor. Following stagnation in Q3 2015, domestic demand recovered in the last quarter of the year (5.1 percent growth, year-on-year), partly due to a surge in car sales prior to an increase in the automobile excise tax in January 2016. Net exports contributed positively to growth in Q3 2015, partly due to declining imports; however, merchandise exports dropped in the last quarter as growth in China slowed. Private investment remains subdued.
On the production side, the performance of the services sector in 2015 overall improved noticeably compared with 2014. In year-on-year terms, growth in tourist arrivals averaged 28 percent during the first three quarters of 2015, before easing to 4.3 percent in Q4. In contrast, agriculture and mining contracted. Manufacturing production stagnated in 2015, despite the acceleration in production of cars, rubber sheets and rolls prior to tax hikes.
The positive trade balance further expanded in the second half of the year despite the decline in exports (-6.4 percent in H2 2015, year-on-year), due to a sharp drop in imports (-13.9 percent) caused by persistently low energy prices and weak demand for raw materials and intermediate goods. The current account balance for 2015 is estimated at around 8.8 percent of GDP. Foreign direct investment inflows decelerated significantly in the third quarter, and portfolio investment remained largely negative in 2015 as, similar to other markets, foreign investors liquidated securities in response to the Fed’s policy rate hike.
The nominal exchange rate averaged 36.60 Thai baht per US dollar in February 2016, compared to 32.7 at end-2014. The baht has appreciated against the Chinese yuan over the same period, while it depreciated against the Vietnamese dong. Foreign currency reserves remained stable in 2015, at around US$150 billion. The policy interest rate was reduced by 0.25 percentage points in February 2015 and again in April, to 1.5 percent, but average inflation remained negative, at -0.5 percent year on year in February 2016.
EAST ASIA AND PACIFIC ECONOMIC UPDATE APRIL 2016
212 PART III. CoUNTRY PAGES AND KEY INDICAToRS

on the fiscal side, total revenue collection improved to 21.8 percent of GDP during January–September 2015, compared to 20.5 percent in the same period of 2014. The government deficit, estimated at around 1.9 percent of GDP in FY2015 (year ended September), would increase to around 2.7 percent of GDP in FY2016, consistent with fiscal stimulus.
Thailand has made impressive progress in reducing poverty over the last two decades. Extreme poverty as measured by the international extreme poverty line (US$1.90 per day, 2011 purchasing power parity [PPP]) is no longer a concern for Thailand as a whole, falling from 14.3 percent in 1988 to an estimate of around 0.03 percent in 2015. Based on the national poverty line (in 2013, approximately US$6.20 per day 2011 PPP), the poverty rate fell from 12.3 percent in 2011 to 10.9 percent in 2013 (Figure 2).
Outlook
Real GDP growth is projected to be around 2.5 percent in 2016. Consumption should continue to underpin modest growth, in a context of improving consumer confidence, whereas private and foreign direct investment are likely to stay at low levels due to weak external demand and political uncertainty. The current account balance is expected to narrow in the following years as imports recover. Finally, the timely implementation of public infrastructure projects (dual track rail and rail upgrading) in 2016 and 2017 would help contribute to a more positive outlook.
The stagnation of manufacturing production is likely to adversely impact poor urban households in particular with many low-skilled workers employed at the lower end of the manufacturing sector. Moreover, rising agricultural incomes in recent years have mainly reflected real increases in agricultural prices and not productivity increases in agriculture. As agricultural prices fall back to more normal levels, growth could become less inclusive, with the rural poor negatively
affected. Constrained by low levels of education and skills, a large share of the poor workers might not be able to reap the full benefit of job opportunities in the high-end services sector. As a consequence, poverty is expected to decline at a slower rate in both urban and rural areas.
Emerging Challenges
In the unlikely event of a hard landing for the Chinese economy, accompanied by global financial turmoil, Thailand would be mostly affected through the trade and financial channels, as China represents 12 percent of total exports and 8 percent of total FDI inflows. Nonetheless, Thai exports are well diversified in terms of products and markets, and authorities still have ample monetary and fiscal buffers.
The second risk is that of a return to the political gridlock seen in the years prior to the current government’s tenure, if ongoing political reforms do not satisfy civic society at large. Such a scenario could lead to renewed street protests, incapacitate key government institutions and weigh on consumer and investor confidence.
Finally, as the Thai population is aging rapidly—the share of working-age population in the total population could start to decline in 2016—demographic dividends will no longer contribute to growth and inclusiveness in the same manner as before. Pockets of poverty increasingly concentrate in the lagging Northeast, North, and Deep South, and among the households residing in remote areas and with limited means to support themselves, including elderly households.
GROWING CHALLENGES
PART III. CoUNTRY PAGES AND KEY INDICAToRS 213

Figure 1. Contributions to annual GDP growth Figure 2. Poverty rate and GDP per capitaPercent and percentage point contributions Percent Percent
20
15
10
5
0
-5
-10
2011Q1 Q2 Q3 Q4
2012 2013 2014 2015Q1 Q1 Q1 Q1Q2 Q2 Q2 Q2Q3 Q3 Q3 Q3Q4 Q4 Q4
25
20
15
10
5
0
10
8
6
4
2
0
-2
-4
200820072006 2009 2010 2011 2012 2013
J Private consumption J Government consumption J Private investment ▬ Poverty rate (National) ▬ Poverty rate $3.10/day, 2011 PPP
J Public investment J Net exports J Inventories ▬ GDP growth ▬ GDP pc growth, rhs
Sources: World Bank and National Economic and Social Development Board. Sources: World Bank and National Economic and Social Development Board.
THAILAND Selected Indicators 2013 2014 2015e 2016f 2017f 2018f
Real GDP growth, at constant market prices 2.8 0.8 2.8 2.5 2.6 3.0Private Consumption 0.8 0.6 2.2 1.7 1.9 2.1Government Consumption 4.7 1.7 2.1 3.6 3.2 2.2Gross Fixed Capital Investment -0.8 -2.6 5.7 2.9 4.1 4.6Exports, Goods and Services 2.8 0.1 0.8 1.8 2.0 2.3Imports, Goods and Services 1.4 -5.3 -1.4 1.3 2.2 2.0
Real GDP growth, at constant factor prices 2.8 0.9 2.8 2.5 2.6 3.0Agriculture 0.4 0.3 1.5 2.6 2.7 2.7Industry 1.3 -0.6 4.0 2.2 2.3 2.3Services 4.8 2.4 1.9 2.8 2.9 3.7
Inflation (Consumer Price Index) 2.2 1.9 -0.9 2.9 2.7 2.5Current Account Balance (% of GDP) -0.9 3.3 8.9 6.4 4.5 2.9Financial and Capital Account (% of GDP) 1.3 -3.2 -7.6 -5.2 -3.6 -3.9Fiscal Balance (% of GDP) -0.2 -1.8 -1.9 -2.7 -1.9 -1.7Debt (% of GDP) 42.0 43.2 40.3 41.2 41.2 41.6Primary Balance (% of GDP) 1.5 0.3 -0.8 -1.6 -0.8 -0.6Poverty rate ($1.9/day PPP terms)a,b,c 0.0 0.0 0.0 0.0 0.0 0.0Poverty rate ($3.1/day PPP terms)a,b,c 0.9 0.9 0.7 0.6 0.5 0.4Sources: World Bank, Macroeconomics and Fiscal Management Global Practice, and Poverty Global Practice.Notes: e = estimate, f = forecast. (a) Calculations based on EAPPoV harmonization, using 2008-SES and 2013-SES. “(b) Projection using annualized elasticity (2008–13) with pass-through = 1 based on GDP per capita constant PPP. “ (c) Actual data: 2013. Projections are from 2014 to 2018.
EAST ASIA AND PACIFIC ECONOMIC UPDATE APRIL 2016
214 PART III. CoUNTRY PAGES AND KEY INDICAToRS

TIMOR-LESTE
2015Population, milliona 1.2GDP, US$, billiona 1.4GDP per capita, current US$a 1192Life expectancyb 68School enrollment rate, net primaryc 91Sources: Authorities and staff estimates and projections.Note: (a) Projections; (c) Data as of 2011; (c) Data as of 2011.
Summary
Timor-Leste, previously one of the most oil-dependent countries in the world, is undergoing a momentous transition as the oil sector begins to decline. The nation’s development prospects rely on the domestic economy, supported by a sovereign wealth fund as well as continued external assistance. To make the difficult transition to a higher income level, the nation faces the challenge of how to use its finite resources and focus reform efforts to catalyze investment and job creation.
Recent Economic Developments
Economic growth in the non-oil economy of Timor-Leste bottomed out in 2013, reaching a low of 2.8 percent. Growth is estimated to have recovered to around 6 percent in 2014 and just over 4 percent in 2015, although official data are not yet available. This growth marks a slowdown from nearly 15 years of double-digit growth following independence, as the economy
developed rapidly from a low base. Growth continues to be led by government spending, with both the slowdown in 2013 and subsequent recovery largely due to changes in government expenditure. However, as infrastructure and domestic market conditions improve, stronger private sector growth is a possibility. There is the potential for the development of a number of sectors in Timor-Leste, based on its geographic positioning near Australia and within East Asian value chains, including basic manufacturing, tourism, and niche agriculture.
Developments in the oil sector have had a severe effect on macroeconomic indicators, although the real impact on the country and government budget is well buffered by large financial reserves. overall GDP, including oil production from the Joint Petroleum Development Area, stood at US$6.8 billion in 2012 and fell to a projected US$2.6 billion in 2015. This is due to both a collapse in prices and declining volumes of oil production as oil fields are becoming depleted. The main transmission mechanism for shocks in the oil sector to feed through to the domestic economy is the government budget, since oil fields are offshore and there is little local employment or domestic value added. Government revenue from the petroleum sector fell from US$3.9 billion in 2013 to US$0.96 billion in 2015.
Consumer price inflation was below 1 percent in both 2014 and 2015. Timor-Leste uses the US dollar as its legal tender, and changes in its terms of trade are mostly determined by US dollar movements. The US dollar continues to appreciate against a basket of currencies, and lower prices of imports, particularly foodstuffs, alcohol, and tobacco, have kept inflation low in Timor-Leste. The appreciation makes Timor-Leste’s exports relatively less attractive in international financial markets, which presents an increased challenge for export-oriented economic diversification.
At present, the most significant non-oil export product is coffee. Export values and volumes have fallen from US$18.8 million (34 million kilograms [kg]) in 2012 to US$15.8 million (17.6 million kg) in 2013 and
GROWING CHALLENGES
PART III. CoUNTRY PAGES AND KEY INDICAToRS 215

US$13.8 million (10.2 million kg) in 2014, although this reflects local production factors rather than changes in the internationally traded price of coffee. Overall, the balance of payments surplus has declined along with falling oil exports, from 42 percent of GDP in 2013, to 24 percent in 2014 and a projected 4.3 percent in 2015.
The government’s fiscal position is mostly determined by petroleum revenues, both on-stream now and those built up in a sovereign wealth fund (the Petroleum Fund). For 10 years, Timor-Leste has been one of the most oil-dependent countries in the world, and has established a strong governance framework that has enabled the country to amass US$16 billion in financial assets. The wealth in the Petroleum Fund supports a perpetual return to the government budget, currently estimated at about US$500 million a year. However, the value of oil yet to be extracted has fallen sharply since the collapse in prices, so the country has faced a sharp slowdown in the accumulation of reserves and a tighter fiscal envelope.
At the same time that the fiscal envelope has shrunk, the government has embarked on a large public investment program, with the 2016 Budget announcing a government infrastructure investment program over the next three years of nearly US$2.5 billion. This level of investment would constitute a significant reduction in the principal of the Petroleum Fund, reducing the amount the country can expect to earn in perpetuity. The aim of this “frontloaded” investment program is to crowd-in private investment to boost long-term growth and thereby achieve social returns greater than would have been possible by keeping the funds in the Petroleum Fund. While a feasible strategy, and one that may be appropriate given Timor-Leste’s stage of development, the success of such an investment program critically depends on the quality of the investments made and the social returns that accrue. The overall budget balance has dropped from a surplus of 53 percent of total GDP in 2013 to a projected budget deficit of 6.6 percent of total GDP in 2015. As oil prices remain low and
production drops even further, the budget deficit is expected to increase in 2016 and 2017.
Outlook
The oil sector is expected to continue to decline before production ceases completely in 2022. The onshore economy is expected to continue to grow at around 4 to 6 percent, supported by government investment. The fiscal balance will remain weaker on lower oil revenue and heightened spending, which will necessitate a drawdown from the Petroleum Fund in excess of the estimated sustainable income, as well as increased borrowing. As a result, the balance in the Petroleum Fund is expected to decline each year.
Emerging Challenges
While Timor-Leste faces a daunting infrastructure gap, there are a variety of other constraints that would also need to be addressed to support private-sector-led, inclusive growth. Timor-Leste still ranks as having one of the least conducive regulatory environments for business in the world. A lack of functioning state systems for identification, registration, and dispute resolution over land title make it extremely difficult to secure a claim over land, making it difficult for businesses to commit to investments. The lack of laws governing the enforcement of commercial and credit contracts also make it harder to do business. While Timor-Leste has much to offer, concerted effort is needed to address these critical constraints before it can realistically expect to attract foreign investment and spur domestic enterprise.
EAST ASIA AND PACIFIC ECONOMIC UPDATE APRIL 2016
216 PART III. CoUNTRY PAGES AND KEY INDICAToRS

Figure 1. Projected fiscal revenue and expenditure Figure 2. Projected Petroleum Fund balanceUS$ million, current prices US$ million, current prices
2,500
2,000
1,500
1,000
500
0
2012 2014 2016 2018 2020 2022 2024 2026
18,000
16,000
14,000
12,000
10,000
8,000
6,000
4,000
2,000
0
2012 2014 2016 2018 2020 2022 2024 2026
J Projected ESI J Projected domestic revenue J Projected expenditure
Sources: WB Staff estimates based on GoTL data. Sources: WB Staff estimates based on GoTL data.
TIMOR-LESTE Selected Indicators 2013 2014 2015 2016 2017
Real gross domestic product (nonoil) 2.8 6.0 4.3 5.0 5.5Exports, goods and services, US$ million 61.0 89.5 89.0 88.0 102.0Imports, goods and services, US$ million 1,204 1,430 1,198 1,315 1,650CPI inflation, period average 9.5 0.7 0.6 1.5 3.8Current account balance, % of GDP 42.7 24.4 4.3 13.6 -5.0Fiscal balance, % of GDP 53.2 25.8 -6.6 -11.6 -12.7Source: Government of Timor-Leste and World Bank staff estimates.
GROWING CHALLENGES
PART III. CoUNTRY PAGES AND KEY INDICAToRS 217

VIETNAM
2015Population, million 91.7GDP, current US$ billion 191.5GDP per capita, current US$ 2,089Poverty rate (US$1.9/day 2011 PPP terms)a 2.8Poverty rate (US$3.1/day 2011 PPP terms)a 10.7Gini Coefficientb 34.8School enrollment, primary (% gross)b 104.7Life Expectancy at birth, yearsc 75.6Sources: World Bank, World Development Indicators (WDI), and Macro Poverty Outlook.Note: a. Most recent value (2014); b. Most recent WDI value (2013).
Summary
GDP growth gathered momentum in 2015, underpinned by stronger domestic demand. Poverty continues to decline, with the extreme poverty rate now below 3 percent. While the medium-term outlook is broadly favorable, significant downside risks arise from large fiscal deficits and rising public debt, weak external demand, global financial volatility, and incomplete banking and state-owned enterprise (SOE) reforms. On the upside, Vietnam is strongly positioned to benefit from numerous free trade agreements, especially the Trans-Pacific Partnership.
Recent Economic Developments
Vietnam’s economy has weathered the recent global turbulence well, reflecting resilient domestic demand and the robust performance of its export-oriented
manufacturing sector. After a slowdown in 2012 and 2013, growth recovered to 6 percent in 2014 and further accelerated to an estimated 6.7 percent in 2015.
on the demand side, low inflation and strengthening consumer confidence have supported an uptick in private consumption. At the same time, investment has been lifted by strong foreign direct investment and a recovery of domestic credit growth. Government spending has also grown at a brisk pace, with recurrent expenditure increasing by 11 percent in 2015. Export growth moderated to about 8 percent in 2015 (down from 13.8 percent in 2014), owing to lower food and commodity prices, only partially offset by robust manufacturing export growth. However, imports continued to expand rapidly, causing a slight decline in net exports (Figure 1).
On the production side, GDP growth has been driven by the manufacturing and construction sectors, which expanded at 11 percent in 2015, accounting for more than half of overall GDP growth.
A gradual recovery in the property market, higher public investment in infrastructure, and the easing of regulations on foreign investment in real estate have all sustained strong performance in construction.
Buoyant retail sales—underpinned by strengthening private consumption—offset a slowdown in the tourism sector, bringing overall service sector growth to about 6 percent. Growth in agricultural production weakened in 2015 because of falling global agricultural prices and unfavorable weather conditions related to El Niño.
With sustained strong growth, poverty has continued to decline. Extreme poverty (using the new US$1.90, 2011 purchasing power parity [PPP] line) is estimated to have fallen below 3 percent. Concerns about poverty are increasingly focused on the 14 percent of the population who are members of ethnic minority groups. Large gaps persist between the welfare of the ethnic minority and that of the majority Kinh and Hoa groups.
EAST ASIA AND PACIFIC ECONOMIC UPDATE APRIL 2016
218 PART III. CoUNTRY PAGES AND KEY INDICAToRS

The majority groups have made large gains in welfare since the early 1990s, but the pace of improvement for the ethnic minorities has stagnated in recent years. Ethnic minorities remain much more likely to experience poor social indicators, an outcome driven by disadvantages in opportunities among ethnic minority children (Figure 2).
Macroeconomic stability and sustainability have been broadly maintained, although rapidly rising public debt and low (and declining) foreign exchange reserves give growing cause for concern. CPI inflation fell to below 1 percent in 2015, which wasthe lowest rate since 2001. The exchange rate was periodically adjusted against the US dollar in 2015 in response to turmoil in global financial markets. In January 2016, the State Bank of Vietnam adopted more flexible management of exchange rate policy, including daily setting of the reference rate. Nevertheless, gross international reserves have fallen to around two months of import cover, exacerbating vulnerability to potential external shocks.
Fiscal pressures have grown, with the deficit estimated at 6.5 percent of GDP in 2015, reflecting a weak revenue outturn and increased current and capital spending. Public and publicly guaranteed debt (Ministry of Finance’s definition) is estimated to have increased to 62.5 percent of GDP in 2015, up from 59.6 percent in 2014, inching quickly toward the legally mandated debt ceiling of 65 percent. The government is yet to announce credible measures to implement medium-term fiscal consolidation (on either the revenue or expenditure sides).
Progress on structural reforms has been mixed, with some progress on improving the business environment and relatively slow progress on SoE and banking sector reforms. Equitization of SoEs picked up in 2015, but its overall pace is much too slow (falling well short of the government’s own target for 2011–15). This reflects both weak market conditions and reluctance on the
government’s part to put on offer chunkier parts of healthy SoEs.
There has been progress in consolidating the banking sector through several mergers and acquisitions, but the target of reducing the total number of commercial banks to 15 to 17 by 2017 (from 34 currently) remains challenging. System-wide nonperforming loans (NPLs) are reported to have declined to about 3 percent of total loans. The reduction in NPLs is largely due to the recovery of credit growth and transfers of NPLs to the Vietnam Asset Management Company (VAMC). While banks are required to gradually provision against assets transferred to VAMC, the underlying credit and associated capital impairment risks have not been fully eliminated.
Outlook
The baseline outlook for 2016 is positive on balance, but risks are overwhelmingly on the downside. Growth is expected to moderate to 6.2 percent, driven by slower private consumption and investment growth. Inflation is projected to moderate due to subdued global conditions and low global energy and food prices. The fiscal deficit is expected to start shrinking gradually to reduce the potential for further increases in public debt. The trade deficit is projected to widen, which would turn the current account into a small deficit.
Emerging Challenges
Despite a positive outlook, there are downside risks. Relatively slow progress on structural reforms poses risks to medium-term growth. Rising fiscal risks also have to be managed. With credit growth accelerating, risks in the banking sector are also intensifying. Weaker external demand and heightened global financial volatility call for a continued focus on sound macroeconomic management to safeguard against possible shocks. Fiscal consolidation, further exchange
GROWING CHALLENGES
PART III. CoUNTRY PAGES AND KEY INDICAToRS 219

rate flexibility, and bolstering of foreign exchange reserves could all help reduce vulnerabilities.
Figure 1. Contributions to annual GDP growth Figure 2. Ethnic minority children face higher inequality of opportunity
Percent and percentage point contributions
8
7
6
5
4
3
2
1
0
-1
2011 2012 2013 2014 2015e 2016f
100
90
80
70
60
50
40
30
20
10
0Rate of enrolment
in upper secondary (%)Improved
sanitation (%)Rate of stunting
(% of children under age 5)Infant mortality rate(per 1,000 births)
39
67
52
88
31
16
44
10
J Change in inventories J Net exports J Gross fixed capital formation J Ethnic minorities J King & Hoa
J Final consumption J Residual items ▬ GDP growth
Sources: Vietnam government authorities and Macro Poverty Outlook. Source: Vietnam government authorities.
VIETNAM Selected Indicators 2013 2014 2015e 2016f 2017f 2018f
Real GDP growth, at constant market prices 5.4 6.0 6.7 6.2 6.3 6.3Private Consumption 5.2 6.1 9.3 7.5 7.5 7.0Government Consumption 7.3 7.0 7.0 6.9 7.0 7.2Gross Fixed Capital Investment 5.3 9.3 9.4 8.8 8.5 7.5Exports, Goods and Services 17.4 11.6 12.6 13.4 13.8 14.0Imports, Goods and Services 17.3 12.8 18.1 14.8 14.7 14.3
Real GDP growth, at constant factor prices 5.3 5.7 6.8 6.4 6.5 6.5Agriculture 2.6 3.4 2.4 1.0 1.5 2.0Industry 5.1 6.4 9.6 9.0 8.8 8.5Services 6.7 6.2 6.3 6.4 6.3 6.3
Inflation (Consumer Price Index) 6.6 4.1 0.6 3.5 3.8 4.0Current Account Balance (% of GDP) 5.5 4.9 0.0 -0.6 -0.5 0.2Fiscal Balance (% of GDP) -7.4 -6.2 -6.5 -5.9 -5.7 -5.5
Debt (% of GDP) 54.5 59.6 62.5 63.8 64.4 64.7Primary Balance (% of GDP) -6.1 -4.5 -4.5 -3.8 -3.5 -3.0
Poverty rate ($1.9/day PPP terms)a,b,c .. 2.8 2.5 2.1 1.8 1.5Poverty rate ($3.1/day PPP terms)a,b,c .. 10.7 9.5 8.4 7.5 6.6Sources: World Bank, Macroeconomics and Fiscal Management Global Practice, and Poverty Global Practice.Notes: e = estimate, f = forecast. (a) Calculations based on EAPPoV harmonization, using 2014-VHLSS. (b) Projection using neutral distribution (2014) with pass-through = 0.87 based on GDP per capita constant PPP. (c) Actual data: 2014. Projections are from 2015 to 2018.
EAST ASIA AND PACIFIC ECONOMIC UPDATE APRIL 2016
220 PART III. CoUNTRY PAGES AND KEY INDICAToRS


WORLD BANK EAST ASIA AND PACIFIC ECONOMIC UPDATE APRIL 2016