east asian summer monsoon in a warming world: … asian summer monsoon in a warming world: forcing...
TRANSCRIPT

East Asian Summer Monsoon in a Warming World:
Forcing from GHG, Aerosol and Natural variability
Tianjun ZHOU
Email: [email protected]
WCRP-JNU Training School on Monsoon Variability in Changing Climate
15-21 Jan 2017, Juju National University

Outline
Background
Natural variability driven by PDO
Response to GHG and aerosol forcing
Detectable Anthropogenic Shift toward
Heavy Precipitation over Eastern China
Summary

What is a Stronger Summer Monsoon ?
-
Monsoon: a seasonal reversal of surface wind

4/48
Without monsoon, EA would be covered by deserts
However, monsoon has been weakening in the 2nd half of 20th century

2000-
2008
1950S
最高频次90%
1960S
最高频次80%
1970S
最高频次60%
1980S
最高频次60%
1990S
最高频次70%
20世纪 21世纪 蓝色:降雨频次高;红色:降雨频次低
Decadal Changes of summer rainfall
(After BCC, 2010)
Monsoon Weakening 1970S

Changes of EASM : Local Pattern
Zhou, T., D. Gong, J. Li, B. Li, 2009: Detecting and understanding the multi-decadal variability of the East Asian
Summer Monsoon – Recent progress and state of affairs. Meteorologische Zeitschrift, 18 (4), 455-467
EA summer monsoon circulation index
JJA Rainfall anomalies

7
South-to-North Water Diversion Project
http://www.nsbd.gov.cn/zx/english/
Transport water from YZ river to N. China by channels

8 (http://www.nsbd.gov.cn/zx/english/20070308/)
South-to-North Water Diversion Project

Why did the monsoon show a weakening tendency :
Possible Mechanisms
• Tibetan Plateau thermal forcing,
• internal variability,
• global warming, ect.
• PDO
• Aerosol forcing,
• Up to now:
No consensus .
Zhou, T., D. Gong, J. Li, B. Li, 2009: Detecting and understanding the multi-decadal variability of the East Asian
Summer Monsoon – Recent progress and state of affairs. Meteorologische Zeitschrift, 18 (4), 455-467

Outline
Background
Natural variability driven by PDO
Response to GHG and aerosol forcing
Detectable Anthropogenic Shift toward
Heavy Precipitation over Eastern China
Summary
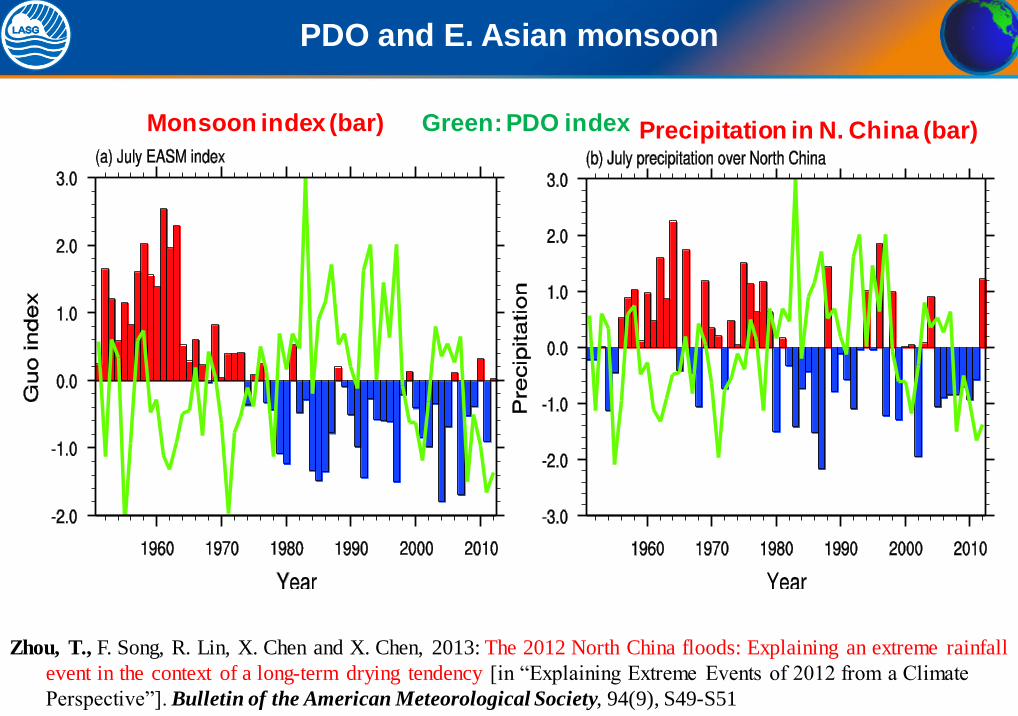
PDO and E. Asian monsoon
Green: PDO index Monsoon index (bar) Precipitation in N. China (bar)
Zhou, T., F. Song, R. Lin, X. Chen and X. Chen, 2013: The 2012 North China floods: Explaining an extreme rainfall
event in the context of a long-term drying tendency [in “Explaining Extreme Events of 2012 from a Climate
Perspective”]. Bulletin of the American Meteorological Society, 94(9), S49-S51
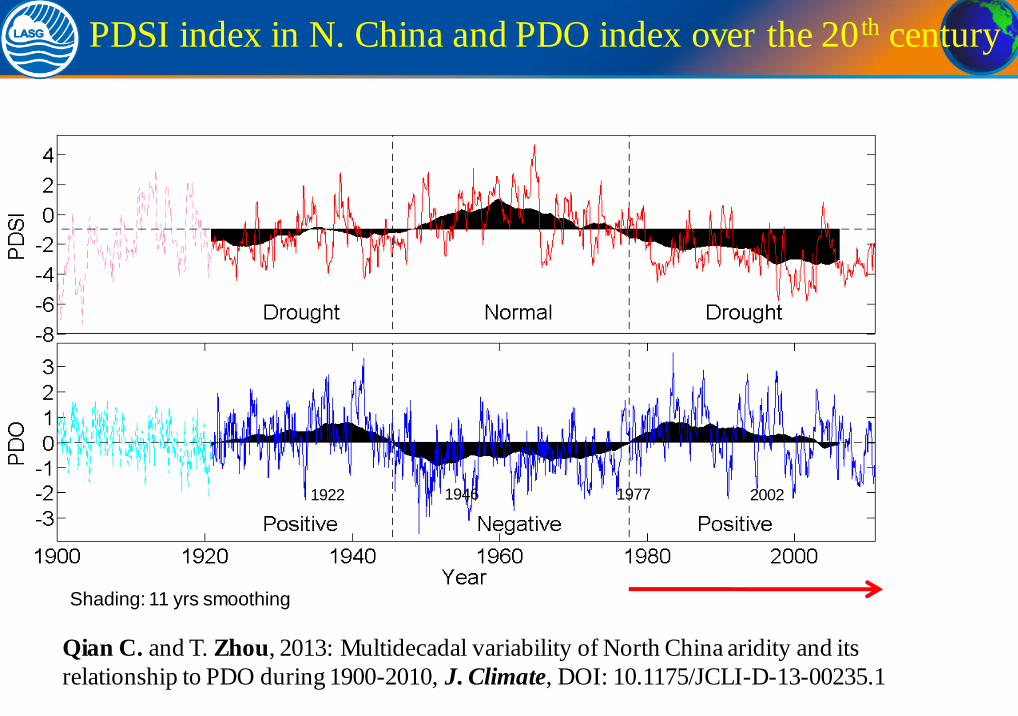
PDSI index in N. China and PDO index over the 20 th century
1922 1946 1977 2002
Qian C. and T. Zhou, 2013: Multidecadal variability of North China aridity and its
relationship to PDO during 1900-2010, J. Climate, DOI: 10.1175/JCLI-D-13-00235.1
Shading: 11 yrs smoothing

EEMD analysis of PDSI and PDO indices
50-70 yrs (56)
1945 1977 1976 1946
Qian C. and T. Zhou, 2013: Multidecadal variability of North China aridity and its
relationship to PDO during 1900-2010, J. Climate, DOI: 10.1175/JCLI-D-13-00235.1
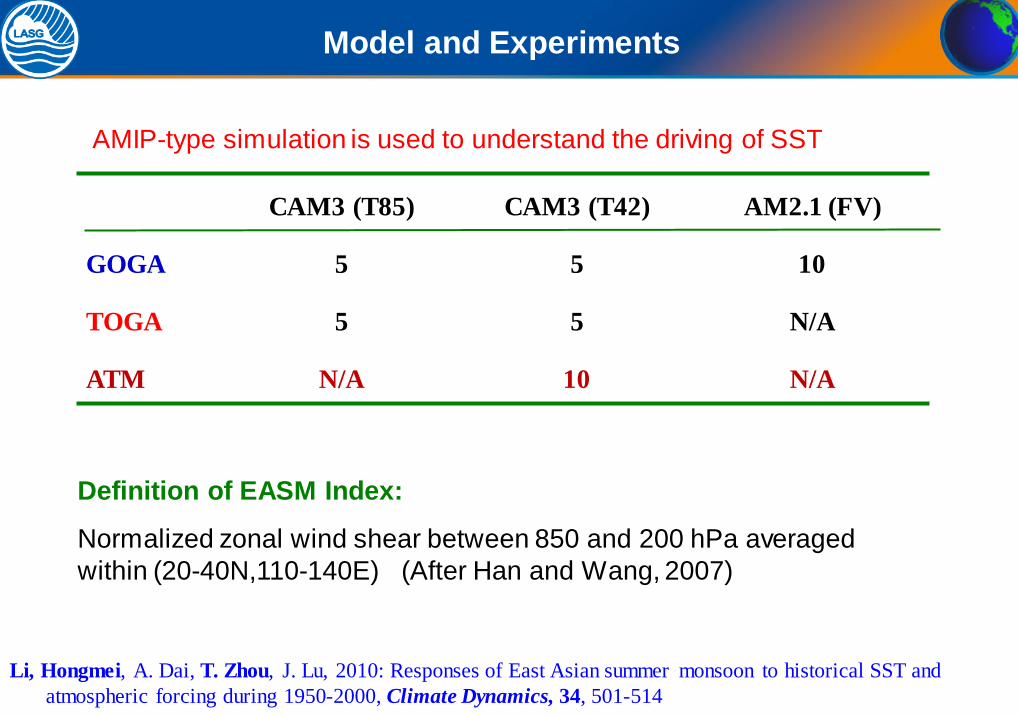
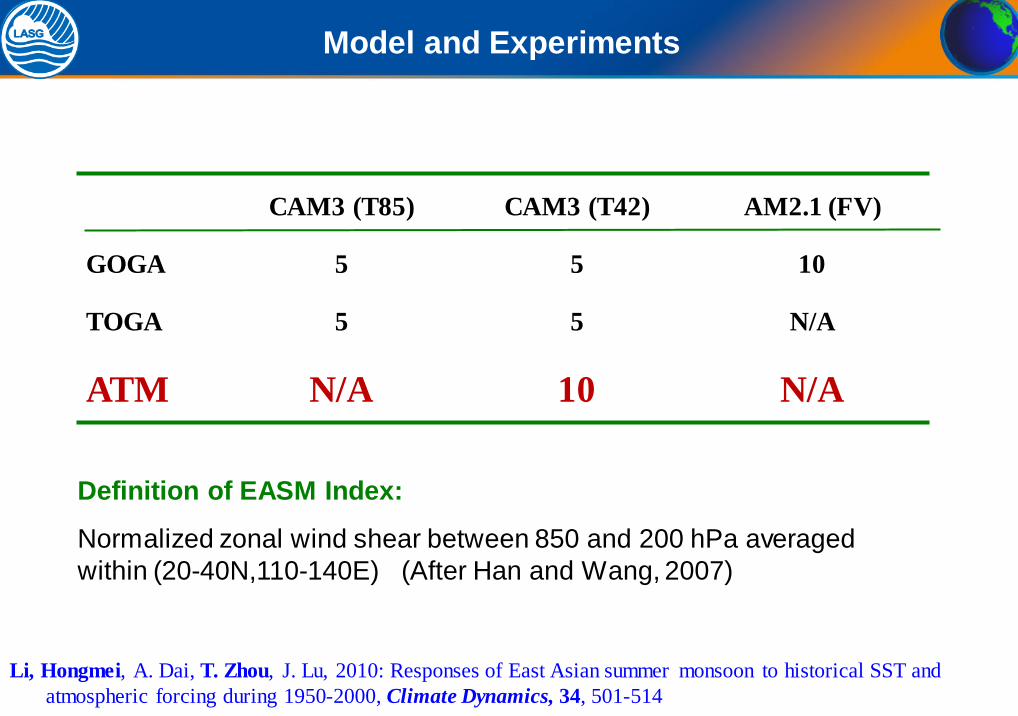
CAM3 (T85) CAM3 (T42) AM2.1 (FV)
GOGA 5 5 10
TOGA 5 5 N/A
ATM N/A 10 N/A
Model and Experiments
Definition of EASM Index:
Normalized zonal wind shear between 850 and 200 hPa averaged
within (20-40N,110-140E) (After Han and Wang, 2007)
Li, Hongmei, A. Dai, T. Zhou, J. Lu, 2010: Responses of East Asian summer monsoon to historical SST and
atmospheric forcing during 1950-2000, Climate Dynamics, 34, 501-514
AMIP-type simulation is used to understand the driving of SST
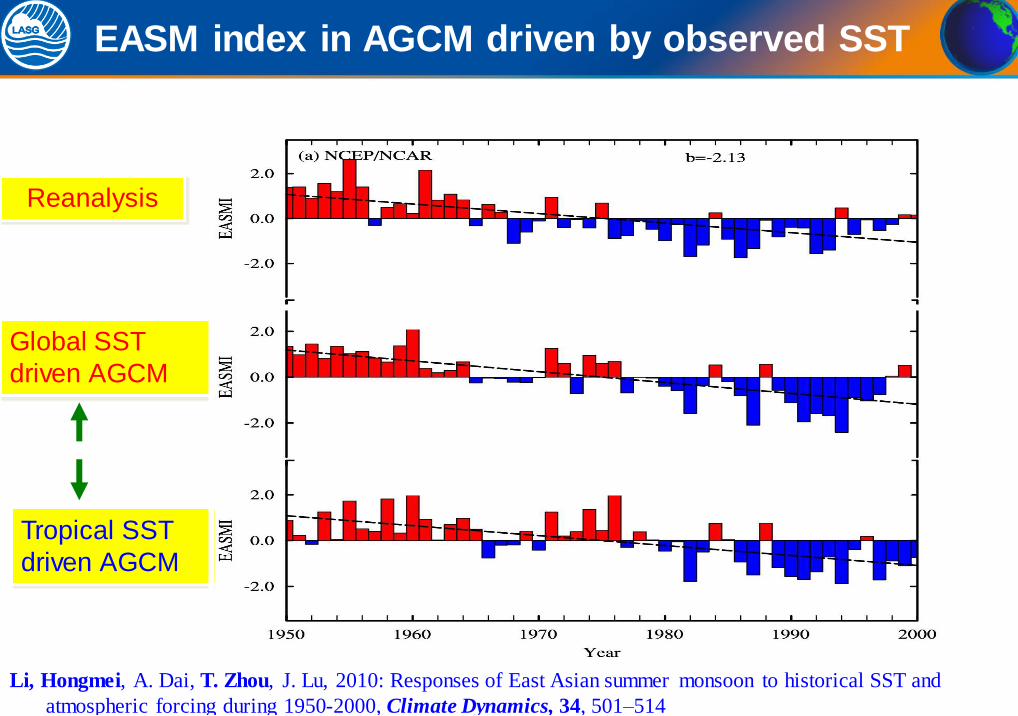
Reanalysis
Global SST
driven AGCM
Tropical SST
driven AGCM
EASM index in AGCM driven by observed SST
a
a
Li, Hongmei, A. Dai, T. Zhou, J. Lu, 2010: Responses of East Asian summer monsoon to historical SST and
atmospheric forcing during 1950-2000, Climate Dynamics, 34, 501–514
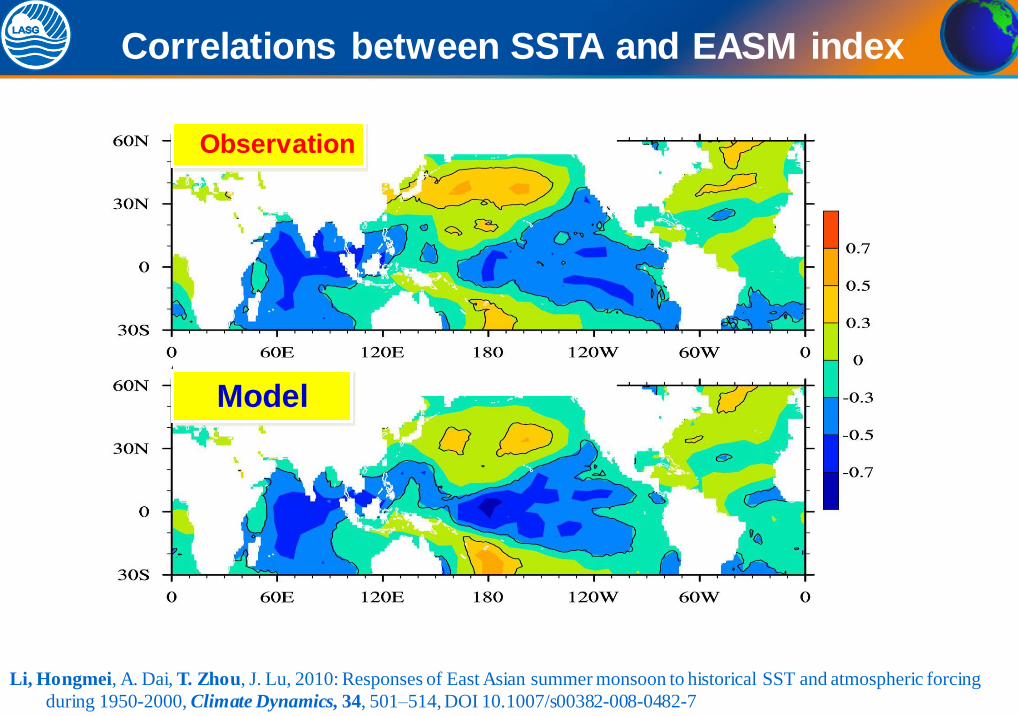
Correlations between SSTA and EASM index
Observation
Model
Li, Hongmei, A. Dai, T. Zhou, J. Lu, 2010: Responses of East Asian summer monsoon to historical SST and atmospheric forcing
during 1950-2000, Climate Dynamics, 34, 501–514, DOI 10.1007/s00382-008-0482-7

(105-122°E average)
Land-Sea Thermal Contrast change
Reanalysis
+
-
Global SST-forcing
Warm Land Cold Ocean
Tropical SST-forcing
Warm land Cold Ocean Warm land Cold Ocean
+ + - - -
Li, Hongmei, A. Dai, T. Zhou, J. Lu, 2010: Responses of East Asian summer monsoon to historical SST and atmospheric forcing
during 1950-2000, Climate Dynamics, 34, 501–514, DOI 10.1007/s00382-008-0482-7
(1980-99) -(1958-79)
CLM

Precipitation: Mean State and Inter-decadal change
GFDL AM2.1 NCAR CAM3
Ch
an
ge
M
ea
n

Point # 1
Zhou, T., D. Gong, J. Li, B. Li, 2009: Detecting and understanding the multi-decadal variability of the East Asian
Summer Monsoon – Recent progress and state of affairs. Meteorologische Zeitschrift, 18 (4), 455-467
• Data diagnosis reveals an out of phase change of E. Asian
summer monsoon circulation and PDO at inter-decadal time
scale. This relationship is evident in both the past 50 yrs and the
20th century.
• When driven by historical SST, the AGCMs are able to
reproduce to weakening tendency of E. Asian summer monsoon
circulation. The response is dominated by the tropical lobe of
PDO/IPO.
• The simulation of monsoon rain band changes remains to be a
challenge.

Outline
Background
Natural variability driven by PDO
Response to GHG and aerosol forcing
Detectable Anthropogenic Shift toward
Heavy Precipitation over Eastern China
Summary

Trend in Sunshine Duration (1954-1998)
(Kaiser and Qian, 2002)
Most stations: -2 to -3 %/decade
Average: -1.0%/decade
Reduction of sunshine duration

Menon et al. (2002):Science
Black carbon
CAM3 (T85) CAM3 (T42) AM2.1 (FV)
GOGA 5 5 10
TOGA 5 5 N/A
ATM N/A 10 N/A
Model and Experiments
Definition of EASM Index:
Normalized zonal wind shear between 850 and 200 hPa averaged
within (20-40N,110-140E) (After Han and Wang, 2007)
Li, Hongmei, A. Dai, T. Zhou, J. Lu, 2010: Responses of East Asian summer monsoon to historical SST and
atmospheric forcing during 1950-2000, Climate Dynamics, 34, 501-514

24
CAM3 T42 ATM
CAM3 T42 GOGAI-GOGA
CAM3 T85 GOGAI-GOGA
AM2.1 GOGAI-GOGA
EA
SM
ch
an
ge
s d
ue
to a
ero
so
l forc
ing
Li, Hongmei, A. Dai, T. Zhou, J. Lu, 2010: Responses of East Asian summer monsoon to historical SST and atmospheric forcing
during 1950-2000, Climate Dynamics, 34, 501–514, DOI 10.1007/s00382-008-0482-7
Weakness of the Experiment:
Stand alone AGCM and only the direct effect of
aerosol is considered

25
SAT
PRCP
Direct effect of aerosol
ENS
ENS ES02
ES02
Li, Hongmei, A. Dai, T.Zhou, J. Lu, 2010: Responses of East Asian summer monsoon to historical SST and
atmospheric forcing during 1950-2000, Climate Dynamics, 34, 501–514, DOI 10.1007/s00382-008-0482-7

New CMIP5 models
We examined the responses of East Asian
summer monsoon (EASM) to natural (solar
variability and volcanic aerosols) and
anthropogenic (greenhouse gasses and aerosols)
forcings simulated in the 17 latest Coupled
Model Intercomparison Program phase 5
(CMIP5) models with 105 realizations.
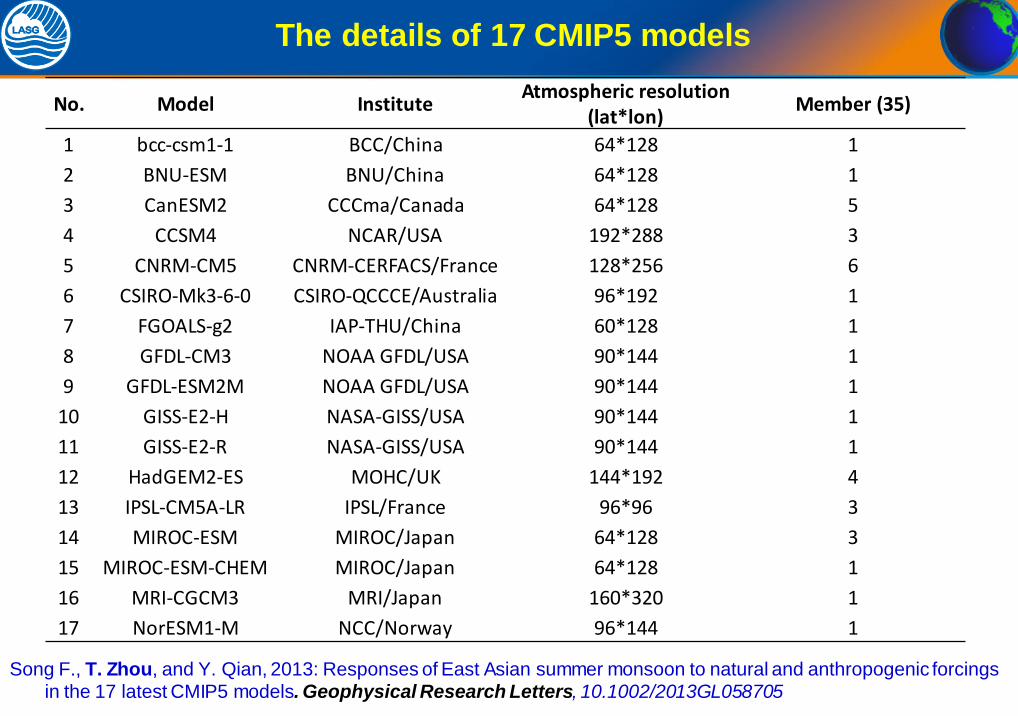
No. Model Institute Atmospheric resolution
(lat*lon) Member (35)
1 bcc-csm1-1 BCC/China 64*128 1
2 BNU-ESM BNU/China 64*128 1
3 CanESM2 CCCma/Canada 64*128 5
4 CCSM4 NCAR/USA 192*288 3
5 CNRM-CM5 CNRM-CERFACS/France 128*256 6
6 CSIRO-Mk3-6-0 CSIRO-QCCCE/Australia 96*192 1
7 FGOALS-g2 IAP-THU/China 60*128 1
8 GFDL-CM3 NOAA GFDL/USA 90*144 1
9 GFDL-ESM2M NOAA GFDL/USA 90*144 1
10 GISS-E2-H NASA-GISS/USA 90*144 1
11 GISS-E2-R NASA-GISS/USA 90*144 1
12 HadGEM2-ES MOHC/UK 144*192 4
13 IPSL-CM5A-LR IPSL/France 96*96 3
14 MIROC-ESM MIROC/Japan 64*128 3
15 MIROC-ESM-CHEM MIROC/Japan 64*128 1
16 MRI-CGCM3 MRI/Japan 160*320 1
17 NorESM1-M NCC/Norway 96*144 1
The details of 17 CMIP5 models
Song F., T. Zhou, and Y. Qian, 2013: Responses of East Asian summer monsoon to natural and anthropogenic forcings in the 17 latest CMIP5 models. Geophysical Research Letters, 10.1002/2013GL058705

No. Model Natural forcings Anthropogenic forcings
Solar Volcanic GHG Aerosol
1 bcc-csm1-1 SOLARIS A IIASA C
2 BNU-ESM SOLARIS A IIASA E1
3 CanESM2 SOLARIS S IIASA E1
4 CCSM4 SOLARIS A IIASA C
5 CNRM-CM5 SOLARIS A IIASA E1
6 CSIRO-Mk3-6-0 SOLARIS S IIASA E2
7 FGOALS-g2 SOLARIS - IIASA C
8 GFDL-CM3 SOLARIS S IIASA E1
9 GFDL-ESM2M SOLARIS S IIASA E1
10 GISS-E2-H SOLARIS S IIASA C
11 GISS-E2-R SOLARIS S IIASA C
12 HadGEM2-ES SOLARIS S IIASA E1
13 IPSL-CM5A-LR SOLARIS S IIASA E1
14 MIROC-ESM SOLARIS S IIASA E1
15 MIROC-ESM-CHEM SOLARIS S IIASA E1
16 MRI-CGCM3 SOLARIS E IIASA E1
17 NorESM1-M SOLARIS A IIASA E1
External forcing agents used in 17 CMIP5 Models
S: Sato et al. (1993);
A: Ammann et al. (2003).
E: Emission is given;
C: Concentration is given.

Experiment description CMIP5 label Major purposes Short name
Past ~1.5 centuries (1850–2005) historical Evaluation All-forcing
historical simulation but with GhG
forcing only
historicalGHG
Detection and
attribution GHG-forcing
historical simulation but with
natural forcing only
historicalNat
Detection and
attribution Natural-forcing
Details of three sets of CMIP5 experiments
• According to Taylor et al. (2009), anthropogenic-forcing is estimated by All-
forcing run minus Natural-forcing run.
• Aerosol-forcing is estimated by Anthropogenic-forcing run minus GHG-
forcing run. 105 realizations are analyzed.
Song F., T. Zhou, and Y. Qian, 2013: Responses of East Asian summer monsoon to natural and anthropogenic forcings in the 17 latest CMIP5 models. Geophysical Research Letters, 10.1002/2013GL058705

Multi-variate EOF1 of SLP and 850 hPa winds
•EOF1 features
a weakening
during 1958-
2001, recovered
since 1990s.
• Above features
are evident in
the simulation.
ERA40 MME of CMIP5
Song F., T. Zhou, and Y. Qian, 2013: Responses of East Asian summer monsoon to natural and anthropogenic forcings in the 17 latest CMIP5 models. Geophysical Research Letters, 10.1002/2013GL058705

Linear trends of SLP and 850 hPa winds (1958-2001)
ERA40 MME of CMIP5
Song F., T. Zhou, and Y. Qian, 2013: Responses of East Asian summer monsoon to natural and anthropogenic forcings in the 17 latest CMIP5 models. Geophysical Research Letters, 10.1002/2013GL058705

Linear trends of SLP and 850 hPa winds (1958-2001)
ALL
forcing GHG
forcing
Aerosol
forcing Natural
forcing
Song F., T. Zhou, and Y. Qian, 2013: Responses of East Asian summer monsoon to natural and anthropogenic forcings in the 17 latest CMIP5 models. Geophysical Research Letters, 10.1002/2013GL058705
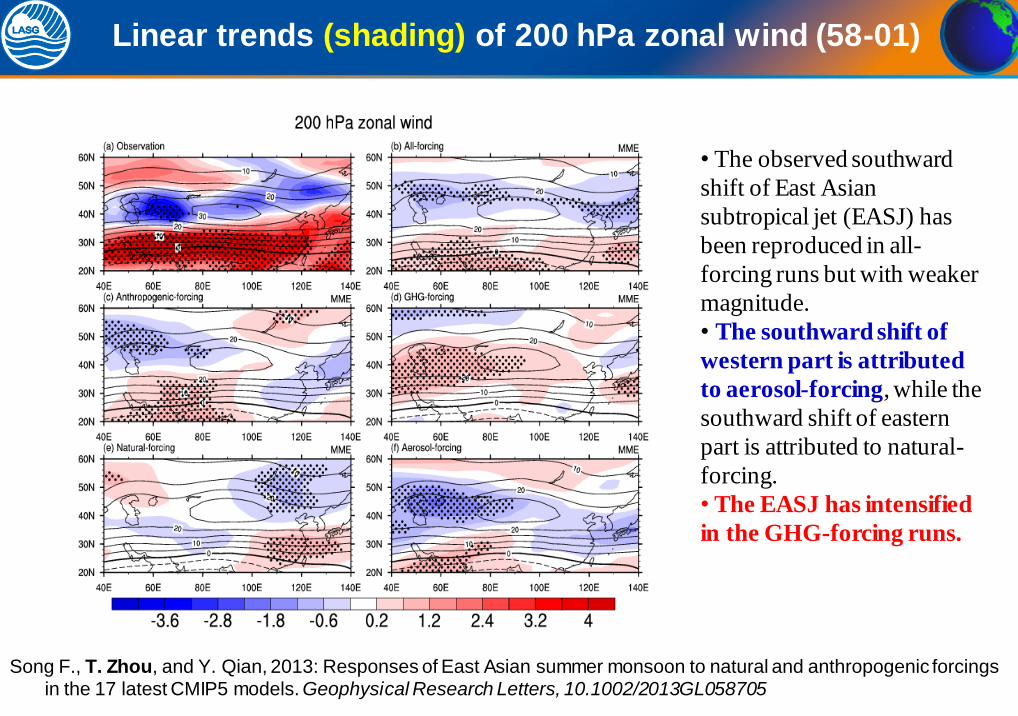
Linear trends (shading) of 200 hPa zonal wind (58-01)
• The observed southward
shift of East Asian
subtropical jet (EASJ) has
been reproduced in all-
forcing runs but with weaker
magnitude.
• The southward shift of
western part is attributed
to aerosol-forcing, while the
southward shift of eastern
part is attributed to natural-
forcing.
• The EASJ has intensified
in the GHG-forcing runs.
Song F., T. Zhou, and Y. Qian, 2013: Responses of East Asian summer monsoon to natural and anthropogenic forcings in the 17 latest CMIP5 models. Geophysical Research Letters, 10.1002/2013GL058705

The linear trends of surface air temperature (58-01)
• Aerosol forcing has led to the cooling over C. China
ALL
forcing
GHG
forcing
Aerosol
forcing
Natural
forcing
Obs
Song F., T. Zhou, and Y. Qian, 2013: Responses of East Asian summer monsoon to natural and anthropogenic forcings in the 17 latest CMIP5 models. Geophysical Research Letters, 10.1002/2013GL058705
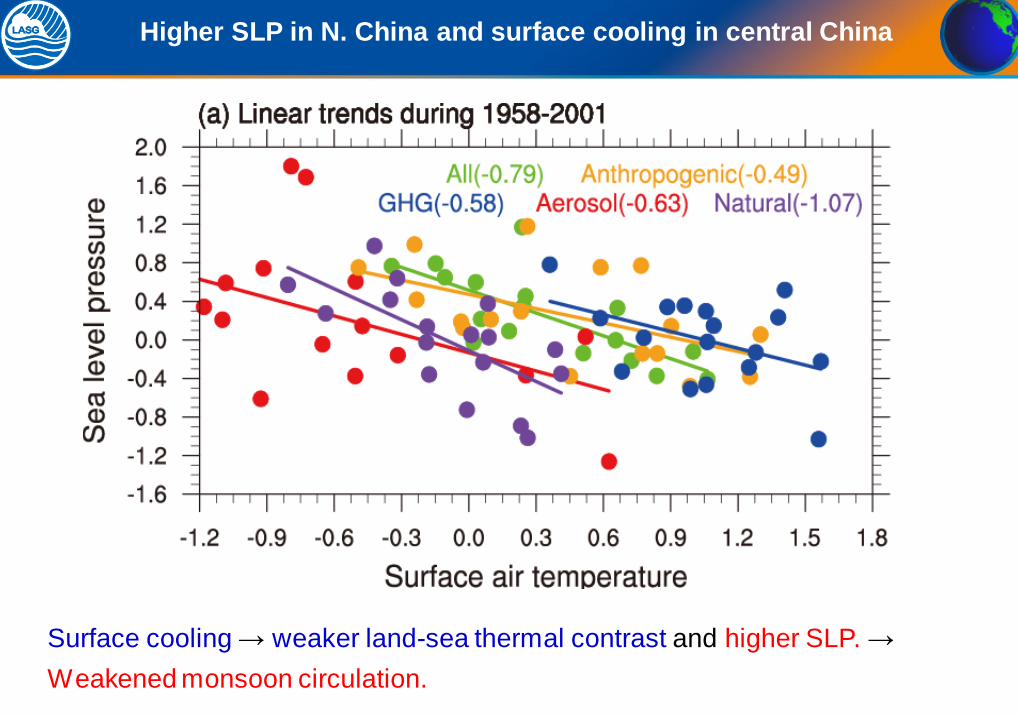
Higher SLP in N. China and surface cooling in central China
Surface cooling → weaker land-sea thermal contrast and higher SLP. →
Weakened monsoon circulation.

-0.70 -0.18 -0.15
0.18
-0.33 -0.03
The specified external forcing agents only account for 25.6% of
the observed monsoon weakening.
Trends of Land-sea thermal contrast as a measure of EASM strength

The linear trends of precipitation during 1958-2001
•Weakness:
CMIP5 models are
unable to reproduce
the precipitation
anomalies due to
their low resolutions
Song F., T. Zhou, and Y. Qian, 2013: Responses of East Asian summer monsoon to natural and anthropogenic forcings in the 17 latest CMIP5 models. Geophysical Research Letters, 10.1002/2013GL058705

Point # 2
The observed weakening trend of low-level EASM circulation during
1958–2001 is partly and weakly reproduced under all-forcing runs. A
comparison of separate forcing experiments reveals that the aerosol
forcing plays a primary role in driving the weakened low-level monsoon
circulation.
The preferential cooling over continental East Asia caused by aerosol
affects the monsoon circulation through reducing the land-sea thermal
contrast and results in higher sea level pressure over northern China.
The increasing GHG forcing is favorable for an enhanced monsoon
circulation.
The models still failed in the simulation of monsoon rainband changes.
Song F., T. Zhou, and Y. Qian, 2013: Responses of East Asian summer monsoon to natural and anthropogenic forcings in the 17 latest CMIP5 models. Geophysical Research Letters, 10.1002/2013GL058705

Outline
Background
Natural variability driven by PDO
Response to GHG and aerosol forcing
Detectable Anthropogenic Shift toward
Heavy Precipitation over Eastern China
Summary

40/48
Objectives
Are the observed changes in the amount
distributions of Eastern China
precipitation caused by external forcings
and thus detectable?
Ma, S., T. Zhou, D. Stone, D. Polson, A. Dai, P. Stott, H. Storch, Y. Qian, C. Burke, P. Wu, L. Zou,
and A. Ciavarella, 2016: Detectable anthropogenic shift toward heavy precipitation over eastern
China. Journal of Climate, doi:10.1175/JCLI-D-16-0311.1

Observation and Model Data
Observation: daily Rain-gauge data from CMA
CMIP5 20c historical climate simulation:
ALL forcing run :11 models, 54 ensemble members
ANThropogenic foring: 6 models,26 members
GHG forcing: 10 models,34 members
AA forcing: 8 models, 22 members
NATural forcing: 11 models,37 members
PIcontrol: 10 models, ~ 6000 yrs
Ma, S., T. Zhou, D. Stone, D. Polson, A. Dai, P. Stott, H. Storch, Y. Qian, C. Burke, P. Wu, L. Zou,
and A. Ciavarella, 2016: Detectable anthropogenic shift toward heavy precipitation over eastern
China. Journal of Climate, doi:10.1175/JCLI-D-16-0311.1

Optimal fingerprinting Method
0
1
( )m
i i i
i
y X
Optimal fingerprinting--Total least squares detection method
•y, observed trend, a rank-n vector, where n is the number of daily precipitation intensity
bins, with n=20 used in this analysis;
•X,fingerprints or anomalous signals, model simulated climate responses to external
forcings, a matrix with one column for each external climate forcing;
•υi, sampling noise, estimated from the preindustrial control simulations and intra-
ensemble differences;
•υ0, noise in the observations
•β, scaling factors, inconsistent with 0 indicate a detectable signal, consistent with 1,
then the model-simulated response patterns are consistent with the observed changes.
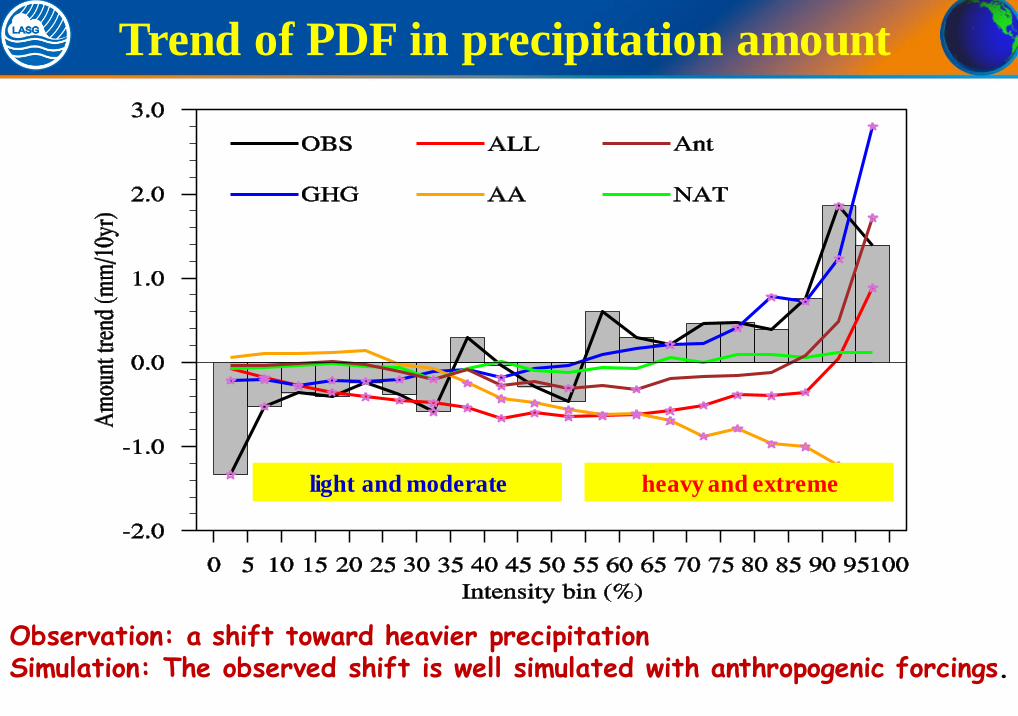
Trend of PDF in precipitation amount
Observation: a shift toward heavier precipitation Simulation: The observed shift is well simulated with anthropogenic forcings.
light and moderate heavy and extreme

Five-year mean precipitation amount anomalies
Light precipitation: daily precipitation falls into the lowest 35% intensity bins.
Decreasing trend in observed light precipitation. The simulations
with GHG forcing show similar behavior as the observations.

Five-year mean precipitation amount anomalies
Heavy precipitation: daily precipitation falls into the top 10% intensity bins.
Observation: increasing trend in heavy precipitation
Simulations: Similar behavior as the observations in the simulation with GHGs.

Linear trends of light precipitation
The observed decrease in light precipitation mainly come from the contribution of GHG
forcing. Anthropogenic aerosols partly offset the contribution of the GHGs.

Linear trends of heavy precipitation
The observed increase of heavy precipitation is dominated by the GHG forcing.

Optimal detection
ANT forcing determines the forced changes in the ALL forcing run.
The detected responses in ALL and ANT forcing runs are dominated by GHG forcing.
Solid symbols: best
estimates of regression
coefficients (β);
Solid error bars: 5-95%
uncertainty ranges of β;
Dashed error bars: 5-
95% uncertainty ranges
of β when the internal
variability is doubled.

Optimal detection
The detectable effect of ANT forcing can be separated from NAT forcing.
The detectable effect of GHG forcing can also be separated from AA forcing.
Point # 3
The anthropogenic forcing has a detectable and attributable
influence on the amount distribution of daily precipitation
over EC during the second half of the 20th century.
The observed shift from weak precipitation to intense
precipitation is due primarily to the contribution of GHG
forcing, with AA forcing offsetting some of the effects of
the GHG forcing.
Increasing of moisture and changes of monsoon circulation ,
resulting mainly from GHG-induced warming, favors heavy
precipitation over eastern China.

Summary
1. The weakening tendency of EASM during 1950-2000 is
driven by the interdecadal changes of Tropical Ocean
SSTA, which is a tropical lobe of IPO/PDO.
2. A comparison of CMIP5 separate forcing experiments
reveals that the aerosol forcing has driven a weakened
monsoon circulation, while the emission of GHG is favorable
for a stronger monsoon circulation.
3. The anthropogenic forcing has a detectable and attributable
influence on the amount distribution of daily precipitation
over EC during the second half of the 20th century.
1. Ma, S., T. Zhou, D. Stone, D. Polson, A. Dai, P. Stott, H. Storch, Y. Qian, C. Burke, P. Wu, L. Zou, and A. Ciavarella, 2016:
Detectable anthropogenic shift toward heavy precipitation over eastern China. Journal of Climate, doi:10.1175/JCLI-D-16-
0311.1
2. Song F., T. Zhou, and Y. Qian, 2013: Responses of East Asian summer monsoon to natural and anthropogenic forcings in the 17
latest CMIP5 models. Geophysical Research Letters, 10.1002/2013GL058705
3. Zhou, T., F. Song, R. Lin, X. Chen and X. Chen, 2013: The 2012 North China floods: Explaining an extreme rainfall event in
the context of a long-term drying tendency [in “Explaining Extreme Events of 2012 from a Climate Perspective”]. Bulletin of
the American Meteorological Society, 94(9), S49-S51
4. Zhou T., S. Ma, L. Zou, 2014: Understanding a hot summer in central eastern China: Summer 2013 in context of multi-model
trend analysis. Bulletin of the American Meteorological Society, accepted and in press
5. Qian C. and T. Zhou, 2014: Multidecadal variability of North China aridity and its relationship to PDO during 1900-2010, J.
Climate, 27,1210-1222, DOI: 10.1175/JCLI-D-13-00235.1
6. Lin, R. T. Zhou, Qian, 2014: Evaluation of Global Monsoon Precipitation Changes based on Five Reanalysis Datasets and
Observations. Journal of Climate, 27,1271-1289
7. Zhou, T., D. Gong, J. Li, B. Li, 2009: Detecting and understanding the multi-decadal variability of the East Asian Summer
Monsoon – Recent progress and state of affairs. Meteorologische Zeitschrift, 18 (4), 455-467
8. Zhou, T., Yu R., Li H., et al. 2008, Ocean forcing to changes in global monsoon precipitation over the recent half century, J.
Climate, 21, (15), 3833–3852
9. Li, H., A. Dai, T. Zhou, J. Lu, 2010, Responses of East Asian summer monsoon to historical SST and atmospheric forcing
during 1950-2000, Climate Dynamics, 34, 501–514, DOI 10.1007/s00382-008-0482-7
10. Zhou T., L. Zhang, and H. Li, 2008: Changes in global land monsoon area and total rainfall accumulation over the last half
century, Geophys. Res. Lett., 35, L16707, doi:10.1029/ 2008GL034881
Some further readings

http://www.lasg.ac.cn/staff/ztj

WCRP-JNU Training School on Monsoon Variability in Changing Climate
East Asian Summer Monsoon in a Warming World:
Forcing from GHG, Aerosol and Natural variability
15-21 Jan 2017, Juju National University
Tianjun ZHOU
Email: [email protected]