east atlanta village retail space - adams ... profile east atlanta village prepared by william adams...
TRANSCRIPT

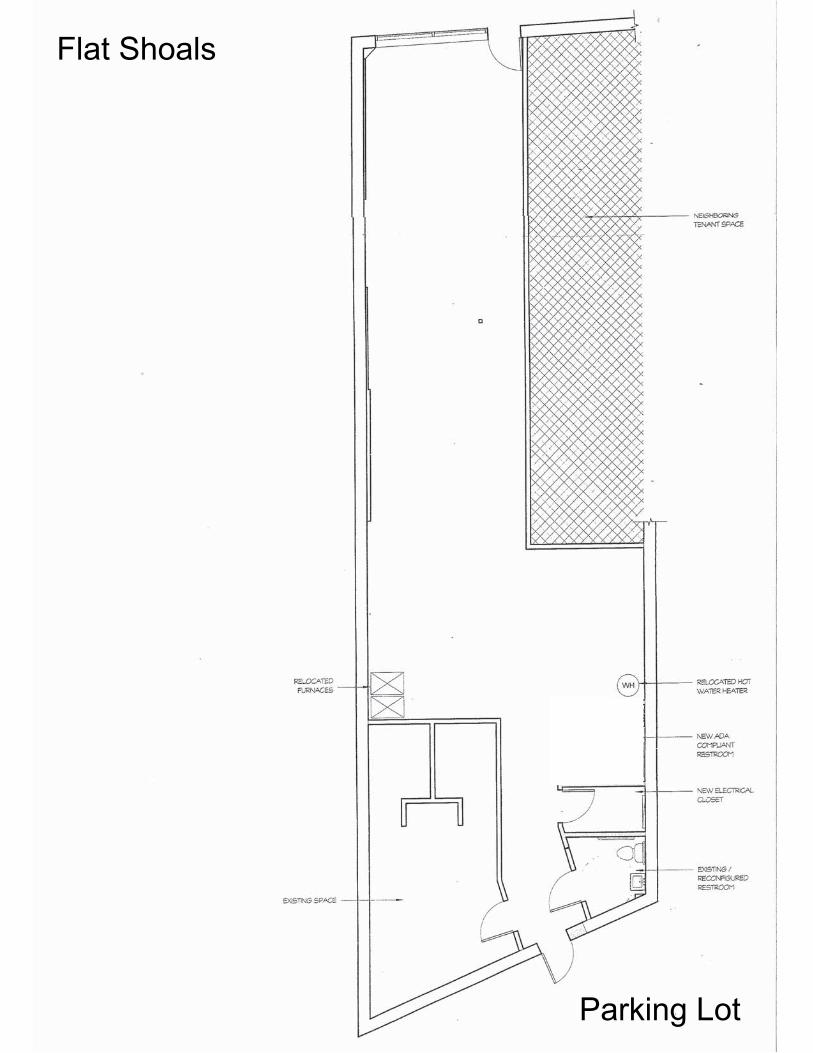
465 Flat Shoals Avenue, SE | Atlanta, GA | 30316
Free On– site parking for tenants and their guests
End unit in the heart of East Atlanta Village
Street level retail space
Exposed brick walls and glass storefront
Landlord willing to share costs with tenant for interior
demolition and reconfiguration of partition walls to suit
Rent for the 1,800 SF+/- space is $3,000 per monthFor more informa on please contact:
Talani Casariego,
Commercial Realtor
Office: 404‐688‐1222
Cell: 404‐285‐6804
Max Con guous Space: 1,800 SF +/‐
Zoning: NC‐2
Lease Rate: $20.00 PSF
Terms: Modified Gross
Parking: On‐site surface parking
Information contained herein has been obtained from the owner of the property or
other sources that we deem reliable. We have no reason to doubt it’s accuracy,
but we do not guarantee it. Offer is subject to change without notice.
458 Cherokee Ave SE, Atlanta, GA 30312
EAST ATLANTA VILLAGE RETAIL SPACE
www.adamscre.com

458 Cherokee Ave SE, Atlanta, GA 30312 www.adamscre.com
Flat Shoals
Parking Lot

Traffic Count Map - Close UpEast Atlanta Village Prepared by William Adams465 Flat Shoals Ave SE, Atlanta, Georgia, 30316 Latitude: 33.741129Ring: 1, 3, 5 Miles Longitude: -84.346552
August 27, 2014
©2014 Esri
Source: ©2011 MPSI (Market Planning Solutions Inc.) Systems Inc. d.b.a. DataMetrix®

Market ProfileEast Atlanta Village Prepared by William Adams465 Flat Shoals Ave SE, Atlanta, Georgia, 30316, Latitude: 33.741129414Rings: 1, 3, 5 mile radii Longitude: -84.34655201
1 mile 3 miles 5 milesPopulation Summary
2000 Total Population 12,933 119,832 302,6912010 Total Population 12,123 117,704 297,7702013 Total Population 13,228 123,502 306,973
2013 Group Quarters 136 9,343 32,5572018 Total Population 14,741 134,500 328,131
2013-2018 Annual Rate 2.19% 1.72% 1.34%Household Summary
2000 Households 5,066 48,736 117,4192000 Average Household Size 2.53 2.31 2.33
2010 Households 5,774 53,326 126,8612010 Average Household Size 2.08 2.04 2.09
2013 Households 6,331 56,302 131,5162013 Average Household Size 2.07 2.03 2.09
2018 Households 7,129 62,370 143,0672018 Average Household Size 2.05 2.01 2.072013-2018 Annual Rate 2.40% 2.07% 1.70%
2010 Families 2,395 21,465 53,8492010 Average Family Size 2.84 2.97 3.02
2013 Families 2,574 22,237 54,7062013 Average Family Size 2.85 2.99 3.04
2018 Families 2,850 24,134 58,2502018 Average Family Size 2.84 2.98 3.032013-2018 Annual Rate 2.06% 1.65% 1.26%
Housing Unit Summary2000 Housing Units 5,722 53,692 129,565
Owner Occupied Housing Units 51.9% 38.2% 40.6%Renter Occupied Housing Units 36.7% 52.5% 50.1%Vacant Housing Units 11.5% 9.2% 9.4%
2010 Housing Units 6,711 62,344 152,804Owner Occupied Housing Units 56.3% 41.5% 39.4%Renter Occupied Housing Units 29.7% 44.0% 43.6%Vacant Housing Units 14.0% 14.5% 17.0%
2013 Housing Units 7,024 63,951 155,730Owner Occupied Housing Units 54.6% 38.8% 36.5%Renter Occupied Housing Units 35.5% 49.2% 48.0%Vacant Housing Units 9.9% 12.0% 15.5%
2018 Housing Units 7,481 68,488 165,398Owner Occupied Housing Units 58.1% 40.1% 37.5%Renter Occupied Housing Units 37.2% 50.9% 49.0%Vacant Housing Units 4.7% 8.9% 13.5%
Median Household Income2013 $47,056 $45,654 $42,9492018 $59,306 $55,397 $51,795
Median Home Value2013 $180,032 $197,186 $195,8062018 $214,971 $230,894 $229,878
Per Capita Income2013 $31,468 $32,121 $30,2762018 $37,078 $37,800 $35,817
Median Age2010 35.6 33.8 32.52013 35.7 34.3 33.02018 36.1 34.6 33.4
Data Note: Household population includes persons not residing in group quarters. Average Household Size is the household population divided by total households.Persons in families include the householder and persons related to the householder by birth, marriage, or adoption. Per Capita Income represents the income received byall persons aged 15 years and over divided by the total population.
August 27, 2014
©2014 Esri Page 1 of 7
Source: U.S. Census Bureau, Census 2010 Summary File 1. Esri forecasts for 2013 and 2018. Esri converted Census 2000 data into 2010 geography.