east otay mesa specific plan amendment · greenhouse gas evaluation for the east otay mesa specific...
TRANSCRIPT

Greenhouse Gas Evaluation
for the
East Otay Mesa Specific Plan Amendment
Submitted To:
KLR Planning, Inc. P.O. Box 882676
San Diego, CA 92186-2676
Prepared By:
1328 Kaimalino Lane
San Diego, CA 92109 Dr. Valorie L. Thompson, Principal
(858) 488-2987
February 3, 2017
Prepared By:
Valorie L. Thompson, Ph.D. Principal
Greenhouse Gas Evaluation i 02/03/17 East Otay Mesa Specific Plan Amendment
Table of Contents
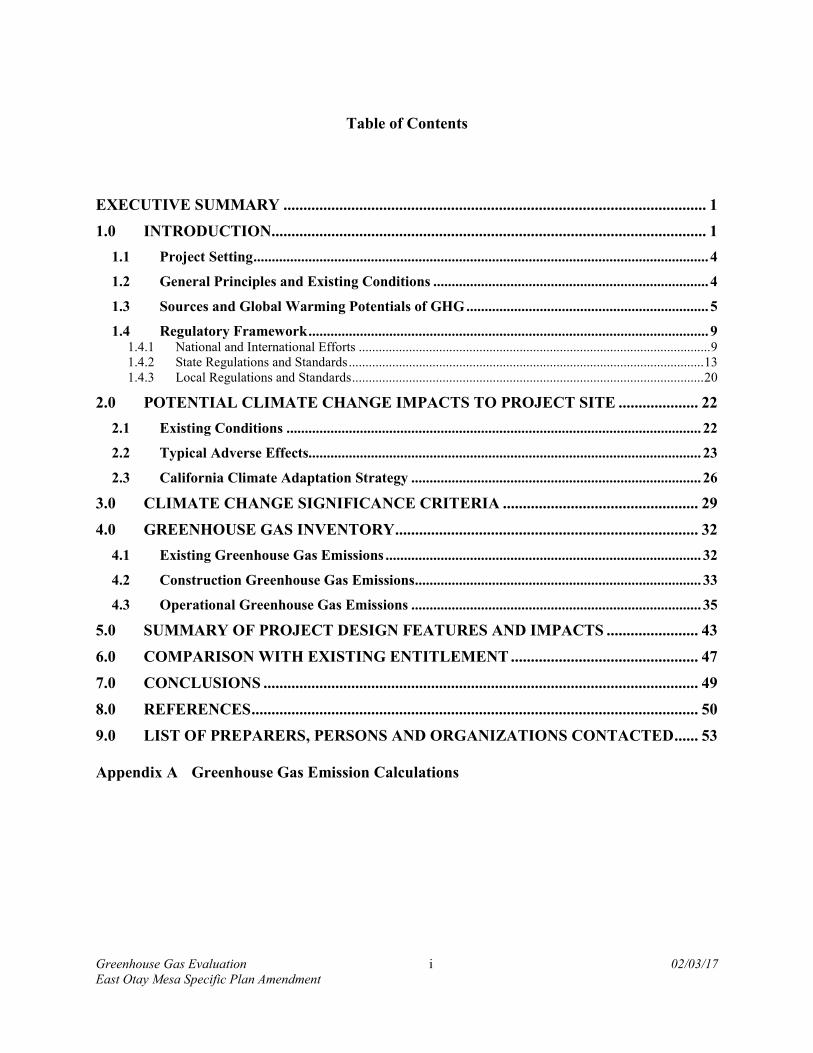
EXECUTIVE SUMMARY .......................................................................................................... 1
1.0 INTRODUCTION............................................................................................................. 1
1.1 Project Setting ............................................................................................................................ 4
1.2 General Principles and Existing Conditions ........................................................................... 4
1.3 Sources and Global Warming Potentials of GHG .................................................................. 5
1.4 Regulatory Framework ............................................................................................................. 9 1.4.1 National and International Efforts ......................................................................................................... 9 1.4.2 State Regulations and Standards .......................................................................................................... 13 1.4.3 Local Regulations and Standards ......................................................................................................... 20
2.0 POTENTIAL CLIMATE CHANGE IMPACTS TO PROJECT SITE .................... 22
2.1 Existing Conditions ................................................................................................................. 22
2.2 Typical Adverse Effects........................................................................................................... 23
2.3 California Climate Adaptation Strategy ............................................................................... 26
3.0 CLIMATE CHANGE SIGNIFICANCE CRITERIA ................................................. 29
4.0 GREENHOUSE GAS INVENTORY ............................................................................ 32
4.1 Existing Greenhouse Gas Emissions ...................................................................................... 32
4.2 Construction Greenhouse Gas Emissions .............................................................................. 33
4.3 Operational Greenhouse Gas Emissions ............................................................................... 35
5.0 SUMMARY OF PROJECT DESIGN FEATURES AND IMPACTS ....................... 43
6.0 COMPARISON WITH EXISTING ENTITLEMENT ............................................... 47
7.0 CONCLUSIONS ............................................................................................................. 49
8.0 REFERENCES ................................................................................................................ 50
9.0 LIST OF PREPARERS, PERSONS AND ORGANIZATIONS CONTACTED ...... 53 Appendix A Greenhouse Gas Emission Calculations

Greenhouse Gas Evaluation ii 02/03/17 East Otay Mesa Specific Plan Amendment
List of Acronyms APCD Air Pollution Control District AB Assembly Bill AB 32 Assembly Bill 32, Global Warming Solutions Act of 2006 ARB Air Resources Board ASTM American Society of Testing and Materials CalEEMod California Emissions Estimator Model CAPCOA California Air Pollution Control Officers Association CAT Climate Action Team CCAP Center for Clean Air Policy CCAR California Climate Action Registry CEC California Energy Commission CEQA California Environmental Quality Act CH4 Methane CO Carbon Monoxide CO2 Carbon Dioxide CO2e Carbon Dioxide Equivalent DWR Department of Water Resources EIR Environmental Impact Report EPA U.S. Environmental Protection Agency EV Electric Vehicles GCC Global Climate Change GHG Greenhouse Gas GGEP Greenhouse Gas Emissions Policy GGRP Greenhouse Gas Reduction Plan GP General Plan GWP Global Warming Potential HFCs Hydrofluorocarbons IPCC Intergovernmental Panel on Climate Change LCFS Low Carbon Fuel Standard LEED Leadership in Energy and Environmental Design MMT Million Metric Tons MW Megawatts N2O Nitrous Oxide NOx Oxides of Nitrogen OPR State Office of Planning and Research PDFs Project Design Features PFCs Perfluorocarbons PM Particulate Matter ROG Reactive Organic Gas RPS Renewable Portfolio Standards S-3-05 Executive Order S-3-05 SB Senate Bill SDCGHGI San Diego County Greenhouse Gas Inventory SRI Solar Reflective Index

Greenhouse Gas Evaluation iii 02/03/17 East Otay Mesa Specific Plan Amendment
THC Total Hydrocarbon UNFCCC United Nations Framework Convention on Climate Change USBGC U.S. Green Building Council VMT Vehicle Miles Traveled

Greenhouse Gas Evaluation ES-1 02/03/17 East Otay Mesa Specific Plan Amendment
EXECUTIVE SUMMARY This report presents an assessment of potential greenhouse gas (GHG) impacts associated with the
East Otay Mesa Specific Plan Amendment in the County of San Diego. The proposed Sunroad –
East Otay Mesa Specific Plan Amendment project site is located within the East Otay Mesa
Business Park Specific Plan (EOMSP) area and encompasses 253.13 acres of the 3,012.7-acre
Specific Plan area, including 218.12 acres of lot area and 35.01 acres of right-of-way area. The
EOMSP area is located in the unincorporated portion of southern San Diego County, within the
Otay Subregional Plan area. The undeveloped Project site is generally east of State Route 125 (SR-
125), north of Otay Mesa Road, west of Vann Centre Boulevard, and south of Zinser Road. The
site includes nine individual parcels with the following Assessor’s Parcel Numbers (APNs): 646-
240-30, 646-310-17, 646-080-26, -27, -28, -29, -31, -32, and -33.
The Project proposes a Specific Plan Amendment (SPA) to the EOMSP to establish a new Mixed-
Use Village Core area, which would allow for the establishment of a mix of employment, retail,
and residential uses. Approval of the project would allow for the entitlement of a maximum of
3,158 dwelling units, 78,000 square feet of general commercial uses, and 765,000 square feet of
employment uses, and approximately 51.3 acres of permanent biological open space.
The proposed Project would include construction of public streets within the Project boundary,
including Sunroad Boulevard, Sunroad View Drive, Alejandro Drive, and extensions of Harvest
Road and David Ridge Drive. All public Project roadways would include Class 2 bike lanes.
Project roadways would be developed as a 4-lane Major Road (Sunroad Boulevard: Lone Star
Road to Otay Mesa Road), 4-lane Collectors (Harvest Road: Sunroad Boulevard to Otay Mesa
Road, Vann Centre Boulevard: Otay Mesa Road to Lone Star Road, and Zinser Road: west of
Sunroad Boulevard), and 2-lane Collectors (David Ridge Drive: Sunroad Boulevard to Alta Road,
and Zinser Road: Sunroad Boulevard to Lone Star Road).
The proposed Project would construct off-site half-width improvements to Vann Center Boulevard
from Otay Mesa Road to just south of Lone Star Road, and to Zinser Road from west of Sunroad
Boulevard to Alejandro Drive. Vann Center Boulevard connects to the Project roadways at David

Global Climate Change Evaluation ES-2 02/03/17 East Otay Mesa Specific Plan Amendment
Ridge Drive and Otay Mesa Road. Zinser Road connects to Project roadways at Sunroad
Boulevard and Alejandro Drive.
The Project would require the extension of utility lines including sewer, water, electric, and gas
lines. Sewer lines would be provided within all Project roadways (Sunroad Boulevard, Harvest
Road, Alejandro Drive, Sunroad View Drive, and David Ridge Drive), as well as the portions of
off-site roadways within the Project footprint (Zinser Road, Lone Star Road, Vann Center Road,
and Otay Mesa Road). The existing south sewer main connection is located adjacent to the Project
site at the intersection of Harvest Road and Otay Mesa Road. The Project would connect to the
existing 12-inch sewer main at this location. The existing northern sewer main is located near the
SR-125 right-of-way, and the Project would extend a 12-inch sewer connection within Zinser Road
approximately 1,800 linear feet to connect with the existing 18-inch sewer main.
Water service would be provided by the Otay Water District. The existing main water supply for
the Project site is a 24-inch main located within Otay Mesa Road along the Project’s southern
boundary. Water supply for the Project would be delivered through a 12-inch conveyance system.
Electric lines would be provided by SDG&E within all Project roadways (Sunroad Boulevard,
Harvest Road, Alejandro Drive, Sunroad View Drive, and David Ridge Drive), as well as the
portions of off-site roadways within the Project footprint (Zinser Road, Lone Star Road, Vann
Center Road, and Otay Mesa Road). Connection for the system is anticipated to be within the
existing SDG&E easement that runs north and south through the Project site near Harvest Road.
Gas lines would be provided by SDG&E within all Project roadways (Sunroad Boulevard, Harvest
Road, Alejandro Drive, Sunroad View Drive, and David Ridge Drive), as well as the portions of
off-site roadways within the Project footprint (Zinser Road, Lone Star Road, Vann Center Road).
Connection for the gas system is anticipated to be within Otay Mesa Road adjacent to the Project
where facilities exist for that purpose.
The Project would not require off-site improvements for stormwater conveyance. Two 60-inch
reinforced concrete pipes (RCPs) located in Otay Mesa Road west of Sunroad Boulevard receive

Global Climate Change Evaluation ES-3 02/03/17 East Otay Mesa Specific Plan Amendment
runoff from the majority of the on-site systems, conveying stormwater from the Project site and
public roads. Storm drains would be constructed within on-site roadways and Zinser Road to
convey stormwater to the existing natural drainage. A portion of the stormwater runoff from Vann
Center Road would be treated within a bioretention basin/easement on the adjacent property east
of the Project site. The Project includes a trail segment that would occur in the north-central portion
of the Project site, providing pedestrian connectivity along the off-site portion of Zinser Road
between the Project’s proposed mixed-use neighborhood in the central portion of the site and open
space element in the northeastern portion of the site.
The project site is located generally at the northeastern corner of Otay Mesa Road and Harvest
Road/SR-125 in the Otay Community Planning area, within unincorporated San Diego County.
The site is subject to the County’s General Plan Regional Category Village and General Plan Land
Use Designation Specific Plan Area. The project area is assigned S-88 Zoning, and is governed by
the East Otay Mesa Business Park Specific Plan. The Specific Plan further designates the site as
Technology Business Park. The Technology Business Park Land Use Designation is intended for
development of manufacturing options and business offices that research, develop, and produce
advanced technologies.
In order to establish consistency with the County’s General Plan, the project would create a new
mixed-use land use designation allowing for a mix of residential, employment, and retail uses.
This new designation is consistent with the General Plan’s Thriving Communities goals. The
project would include a range of densities and a mix of uses across the planning area as indicated
by the new designation and is anticipated to create a catalyst for development within East Otay
Mesa. The maximum numbers of residential units will be based upon the approved peak hour
traffic volumes and is anticipated to be approximately 3,158 residential units. The amount of
development will be limited based on the total amount of trips that would be generated under the
current Specific Plan. Thus the project will not exceed the number of trips evaluated under the
prior Environmental Impact Report for the site.
The CEQA significance threshold for evaluating impacts is based on the project’s efficiency
(metric tons of CO2e per service population) at buildout. It is anticipated that the project will be

Global Climate Change Evaluation ES-4 02/03/17 East Otay Mesa Specific Plan Amendment
built out in 2028. Therefore, the significance metric under CEQA was calculated based on
statewide emissions attributable to land use project and population estimates for the year 2028.
A summary of the Project’s GHG emissions is provided in Table ES-1. As shown in Table ES-1
and discussed below, with implementation of GHG emission reduction project design features,
the project would exceed the 2028 efficiency metric of 3.0 tons per service population. This
impact is significant.
Table ES-1 SUMMARY OF PROPOSED PROJECT’S
ESTIMATED GREENHOUSE GAS EMISSIONS WITH PROJECT DESIGN FEATURES – BUILDOUT 2028
Emission Source Annual Emissions (Metric tons/year)
CO2 CH4 N2O CO2e Operational Emissions
Area Sources 326 0.0417 0.0053 329 Electricity Use 4,463 0.1858 0.0372 4,478 Natural Gas Use 3,075 0.0589 0.0564 3,092 Water Consumption 987 10.1619 0.2463 1,337 Solid Waste Handling 245 14.4607 0.0000 650 Vehicles 26,730 1.3084 0.0000 26,767 Amortized Construction 874 0.0000 0.0000 874 Amortized Land Use Change 28 0.0000 0.0000 28 Total 36,728 26.2174 0.40.3452 37,554 Global Warming Potential Factor 1 28 265 CO2 Equivalent Emissions 36,728 734 92 37,554 TOTAL CO2 Equivalent Emissions
37,554
Service Population 10,816 Metric Tons per Service Population
3.5
Project Efficiency Metric
3.0

Global Climate Change Evaluation ES-5 02/03/17 East Otay Mesa Specific Plan Amendment
Table ES-2 provides a summary of the project design features and state and local measures
included in the GHG analysis.
Table ES-2 Proposed Project Design Features to Reduce GHG Emissions
Strategy to Reduce GHG Emissions
Description Emission Reduction
Basis for Emission Reduction
Land Use and Community Design Mixed Use Development
The East Otay Mesa Specific Plan Amendment provides a mix of uses at the site, including residential, retail, and industrial/employment uses.
Based on CAPCOA’s Quantifying Greenhouse Gas Mitigation Measures, the land use index for the project projects a 15.04% reduction in VMT.
CAPCOA
Electric Vehicle Parking
Non-residential and multi-residential units will be conditioned to provide electric vehicle parking. The electric vehicle parking will conform with applicable building code requirements in place at the time of construction.
Because EMFAC2014, which is included in CalEEMod2016, accounts for penetration of electric vehicles into the fleet, no additional reductions were taken.
Provide Bike Parking in Non-Residential and Multi-Unit Residential Projects
Non-residential and multi-residential units will be conditioned to include bicycle parking. The bicycle parking will conform with applicable building code requirements in place at the time of construction.
Because the reduction in VMT is not quantifiable at this time, no additional reductions were taken.
Provide Pedestrian Network Improvements
The project will be designed with non-contiguous sidewalks to provide a pedestrian network throughout.
No credit was taken for this measure in the GHG calculations for the mitigated emission calculations.
Increase Transit Accessibility
The project will provide a new MTS bus stop. The project is within 0.5 miles of MTS bus route 905, which currently provides hourly service to the project area.
CalEEMod model reductions
CalEEMod Model
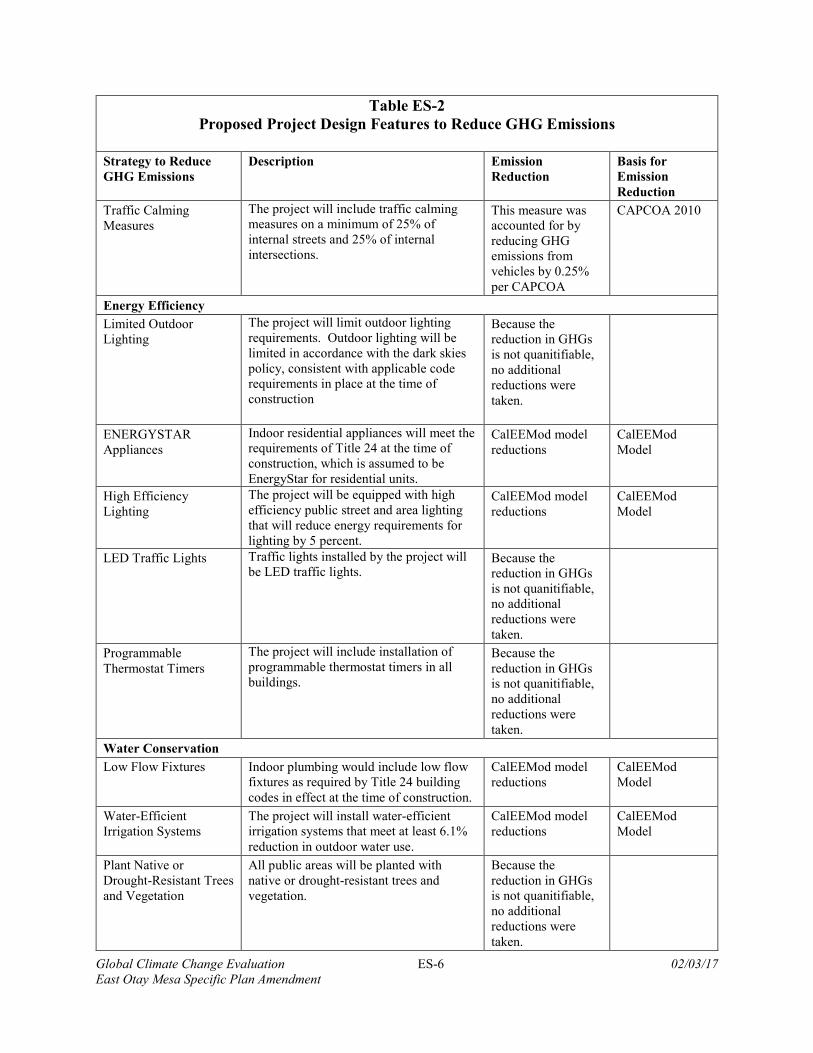
Global Climate Change Evaluation ES-6 02/03/17 East Otay Mesa Specific Plan Amendment
Table ES-2 Proposed Project Design Features to Reduce GHG Emissions
Strategy to Reduce GHG Emissions
Description Emission Reduction
Basis for Emission Reduction
Traffic Calming Measures
The project will include traffic calming measures on a minimum of 25% of internal streets and 25% of internal intersections.
This measure was accounted for by reducing GHG emissions from vehicles by 0.25% per CAPCOA
CAPCOA 2010
Energy Efficiency Limited Outdoor Lighting
The project will limit outdoor lighting requirements. Outdoor lighting will be limited in accordance with the dark skies policy, consistent with applicable code requirements in place at the time of construction
Because the reduction in GHGs is not quanitifiable, no additional reductions were taken.
ENERGYSTAR Appliances
Indoor residential appliances will meet the requirements of Title 24 at the time of construction, which is assumed to be EnergyStar for residential units.
CalEEMod model reductions
CalEEMod Model
High Efficiency Lighting
The project will be equipped with high efficiency public street and area lighting that will reduce energy requirements for lighting by 5 percent.
CalEEMod model reductions
CalEEMod Model
LED Traffic Lights Traffic lights installed by the project will be LED traffic lights.
Because the reduction in GHGs is not quanitifiable, no additional reductions were taken.
Programmable Thermostat Timers
The project will include installation of programmable thermostat timers in all buildings.
Because the reduction in GHGs is not quanitifiable, no additional reductions were taken.
Water Conservation Low Flow Fixtures Indoor plumbing would include low flow
fixtures as required by Title 24 building codes in effect at the time of construction.
CalEEMod model reductions
CalEEMod Model
Water-Efficient Irrigation Systems
The project will install water-efficient irrigation systems that meet at least 6.1% reduction in outdoor water use.
CalEEMod model reductions
CalEEMod Model
Plant Native or Drought-Resistant Trees and Vegetation
All public areas will be planted with native or drought-resistant trees and vegetation.
Because the reduction in GHGs is not quanitifiable, no additional reductions were taken.

Global Climate Change Evaluation ES-7 02/03/17 East Otay Mesa Specific Plan Amendment
Table ES-2 Proposed Project Design Features to Reduce GHG Emissions
Strategy to Reduce GHG Emissions
Description Emission Reduction
Basis for Emission Reduction
Water-Efficient Landscapes
The project will be designed to use water-efficient landscapes.
Because the reduction in GHGs is not quantifiable, no additional reductions were taken.
Building and Site Design California 2013 Title 24 Building Energy Efficiency Standards
All buildings would be designed to meet the California 2013 Title 24 Building Energy Efficiency Standards at a minimum. By the time buildings are constructed, it is likely that updated, more stringent energy efficiency standards will be adopted.
CalEEMod 2016.3.1 includes Title 24 as of 2013
CalEEMod Model
Fireplaces The residences will be constructed either with no fireplace or with natural gas fireplaces. 1,000 of the units will include natural gas fireplaces, with the remaining 2,158 unites to be constructed without fireplaces
CalEEMod Model reductions
CalEEMod Model
Use Electric Landscaping Equipment
Landscaping will use electric equipment; it is assumed that 3% of equipment would be electrically powered based on statewide average use of 3%
CalEEMod Model reductions
CalEEMod Model
Solid Waste Diversion The project would include solid waste diversion practices in accordance with AB 341, which requires 75% solid waste diversion by 2030. Current solid waste diversion rates of 52.6% for multifamily dwellings and 50% for non-residential uses were assumed in the analysis.
75% diversion rates resulting in associated GHG emissions reductions
AB 341 requirements
Because the project’s impacts exceed the efficiency metric, the following mitigation measures
are proposed to reduce GHG emissions:
Energy Efficiency
Mitigation Measure GHG-1: Exceed Title 24 Building Energy Efficiency Standards. The
project buildings will exceed Title 24 as of 2016 by 20%. This measure was included in the
mitigation measures in the CalEEMod Model.

Global Climate Change Evaluation ES-8 02/03/17 East Otay Mesa Specific Plan Amendment
Mitigation Measure GHG-2: Provide Solar Power. The project will include photovoltaic solar
panels (or their equivalent, as approved by the Development Services Director) designed to
provide 50% of the project’s commercial use electricity needs, and 50% of the residential
dwelling units shall include photovoltaic solar panels (or their equivalent, as approved by the
Development Services Director) to provide those residential dwelling units’ electricity needs.
This measure was included in the CalEEMod model under Renewable Energy.
Table ES-3 presents the results of the GHG calculations with mitigation measures included as
described above. As shown in Table ES-3, with mitigation, the project would meet the efficiency
metric and would emit 3.0 metric tons per service population. The GHG efficiency of the project
would therefore meet the efficiency metric of 3.0 metric tons per service population, and GHG
impacts would be less than significant.
Table ES-3
SUMMARY OF PROPOSED PROJECT’S ESTIMATED GREENHOUSE GAS EMISSIONS WITH PROJECT DESIGN
FEATURES AND MITIGATION MEASURES – BUILDOUT 2028
Emission Source Annual Emissions (Metric tons/year)
CO2 CH4 N2O CO2e Operational Emissions
Area Sources 326 0.0417 0.0053 329 Electricity Use 2,160 0.0899 0.0180 2,167 Natural Gas Use 2,636 0.0505 0.0483 2,650 Water Consumption 987 10.1629 0.2465 1,337 Solid Waste Handling 245 14.4607 0.0000 650 Vehicles 24,717 1.2216 0.0000 24,751 Amortized Construction 874 0.0000 0.0000 874 Amortized Land Use Change 28 0.0000 0.0000 28 Total 31,973 26.0273 0.3181 32,786 Global Warming Potential Factor 1 28 265 CO2 Equivalent Emissions 31, 973 729 84 32,786 TOTAL CO2 Equivalent Emissions 32,786 Service Population 10,816 Metric Tons per Service Population 3.0 Efficiency Metric 3.0

Global Climate Change Evaluation 1 02/03/17 East Otay Mesa Specific Plan Amendment
1.0 INTRODUCTION
This report presents an assessment of potential global climate change impacts associated with the
proposed East Otay Mesa Specific Plan Amendment. The evaluation addresses the potential for
greenhouse gas impacts during construction and after full buildout of the proposed Project.
The proposed Sunroad – East Otay Mesa Specific Plan Amendment project site is located within the
East Otay Mesa Business Park Specific Plan (EOMSP) area and encompasses 253.13 acres of the
3,012.7-acre Specific Plan area, including 218.12 acres of lot area and 35.01 acres of right-of-way
area. The EOMSP area is located in the unincorporated portion of southern San Diego County, within
the Otay Subregional Plan area. The undeveloped Project site is generally east of State Route 125
(SR-125), north of Otay Mesa Road, west of Vann Centre Boulevard, and south of Zinser Road. The
site includes nine individual parcels with the following Assessor’s Parcel Numbers (APNs): 646-
240-30, 646-310-17, 646-080-26, -27, -28, -29, -31, -32, and -33.
The Project proposes a Specific Plan Amendment (SPA) to the EOMSP to establish a new Mixed-
Use Village Core area, which would allow for the establishment of a mix of employment, retail, and
residential uses. Approval of the project would allow for the entitlement of a maximum of 3,158
dwelling units, 78,000 square feet of general commercial uses, and 765,000 square feet of
employment uses, and approximately 51.3 acres of permanent biological open space.
The proposed Project would include construction of public streets within the Project boundary,
including Sunroad Boulevard, Sunroad View Drive, Alejandro Drive, and extensions of Harvest
Road and David Ridge Drive. All public Project roadways would include Class 2 bike lanes. Project
roadways would be developed as a 4-lane Major Road (Sunroad Boulevard: Lone Star Road to Otay
Mesa Road), 4-lane Collectors (Harvest Road: Sunroad Boulevard to Otay Mesa Road, Vann Centre
Boulevard: Otay Mesa Road to Lone Star Road, and Zinser Road: west of Sunroad Boulevard), and
2-lane Collectors (David Ridge Drive: Sunroad Boulevard to Alta Road, and Zinser Road: Sunroad
Boulevard to Lone Star Road).

Global Climate Change Evaluation 2 02/03/17 East Otay Mesa Specific Plan Amendment
The proposed Project would construct off-site half-width improvements to Vann Center Boulevard
from Otay Mesa Road to just south of Lone Star Road, and to Zinser Road from west of Sunroad
Boulevard to Alejandro Drive. Vann Center Boulevard connects to the Project roadways at David
Ridge Drive and Otay Mesa Road. Zinser Road connects to Project roadways at Sunroad Boulevard
and Alejandro Drive.
The Project would require the extension of utility lines including sewer, water, electric, and gas lines.
Sewer lines would be provided within all Project roadways (Sunroad Boulevard, Harvest Road,
Alejandro Drive, Sunroad View Drive, and David Ridge Drive), as well as the portions of off-site
roadways within the Project footprint (Zinser Road, Lone Star Road, Vann Center Road, and Otay
Mesa Road). The existing south sewer main connection is located adjacent to the Project site at the
intersection of Harvest Road and Otay Mesa Road. The Project would connect to the existing 12-
inch sewer main at this location. The existing northern sewer main is located near the SR-125 right-
of-way, and the Project would extend a 12-inch sewer connection within Zinser Road approximately
1,800 linear feet to connect with the existing 18-inch sewer main.
Water service would be provided by the Otay Water District. The existing main water supply for the
Project site is a 24-inch main located within Otay Mesa Road along the Project’s southern boundary.
Water supply for the Project would be delivered through a 12-inch conveyance system.
Electric lines would be provided by SDG&E within all Project roadways (Sunroad Boulevard,
Harvest Road, Alejandro Drive, Sunroad View Drive, and David Ridge Drive), as well as the portions
of off-site roadways within the Project footprint (Zinser Road, Lone Star Road, Vann Center Road,
and Otay Mesa Road). Connection for the system is anticipated to be within the existing SDG&E
easement that runs north and south through the Project site near Harvest Road.
Gas lines would be provided by SDG&E within all Project roadways (Sunroad Boulevard, Harvest
Road, Alejandro Drive, Sunroad View Drive, and David Ridge Drive), as well as the portions of off-
site roadways within the Project footprint (Zinser Road, Lone Star Road, Vann Center Road).

Global Climate Change Evaluation 3 02/03/17 East Otay Mesa Specific Plan Amendment
Connection for the gas system is anticipated to be within Otay Mesa Road adjacent to the Project
where facilities exist for that purpose.
The Project would not require off-site improvements for stormwater conveyance. Two 60-inch
reinforced concrete pipes (RCPs) located in Otay Mesa Road west of Sunroad Boulevard receive
runoff from the majority of the on-site systems, conveying stormwater from the Project site and
public roads. Storm drains would be constructed within on-site roadways and Zinser Road to convey
stormwater to the existing natural drainage. A portion of the stormwater runoff from Vann Center
Road would be treated within a bioretention basin/easement on the adjacent property east of the
Project site. The Project includes a trail segment that would occur in the north-central portion of the
Project site, providing pedestrian connectivity along the off-site portion of Zinser Road between the
Project’s proposed mixed-use neighborhood in the central portion of the site and open space element
in the northeastern portion of the site.
The project site is located generally at the northeastern corner of Otay Mesa Road and Harvest
Road/SR-125 in the Otay Community Planning area, within unincorporated San Diego County. The
site is subject to the County’s General Plan Regional Category Village and General Plan Land Use
Designation Specific Plan Area. The project area is assigned S-88 Zoning, and is governed by the
East Otay Mesa Business Park Specific Plan. The Specific Plan further designates the site as
Technology Business Park. The Technology Business Park Land Use Designation is intended for
development of manufacturing options and business offices that research, develop, and produce
advanced technologies.
In order to establish consistency with the County’s General Plan and the East Otay Mesa Business
Park Specific Plan, the project would create a new mixed-use land use designation allowing for a
mix of residential, employment, and retail uses. This new designation is consistent with the General
Plan’s Thriving Communities goals. The project would include a range of densities and a mix of uses
across the planning area as indicated by the new designation and is anticipated to create a catalyst
for development within East Otay Mesa. The maximum numbers of residential units will be based
upon the approved peak hour traffic volumes and is anticipated to be approximately 3,158 residential
Global Climate Change Evaluation 4 02/03/17 East Otay Mesa Specific Plan Amendment
units. The amount of development will be limited based on the total amount of trips that would be
generated under the current Specific Plan. Thus the project will not exceed the number of trips
evaluated under the prior Environmental Impact Report for the site.
1.1 Project Setting
The project site is located generally at the northeastern corner of Otay Mesa Road and Harvest
Road/SR-125 in the Otay Community Planning area, within unincorporated San Diego County. The
site is subject to the County’s General Plan Regional Category Village and General Plan Land Use
Designation Specific Plan Area. The project area is assigned S-88 Zoning, and is governed by the
East Otay Mesa Business Park Specific Plan. The Specific Plan further designates the site as
Technology Business Park. The Technology Business Park Land Use Designation is intended for
development of manufacturing options and business offices that research, develop, and produce
advanced technologies.
1.2 General Principles and Existing Conditions
Global climate change (GCC) refers to changes in average climatic conditions on Earth as a whole,
including temperature, wind patterns, precipitation and storms. Global temperatures are moderated
by naturally occurring atmospheric gases, including water vapor, carbon dioxide (CO2), methane
(CH4) and nitrous oxide (N2O), which are known as greenhouse gases (GHGs). These gases allow
solar radiation (sunlight) into the Earth’s atmosphere, but prevent radiative heat from escaping, thus
warming the Earth’s atmosphere. Gases that trap heat in the atmosphere are often called greenhouse
gases, analogous to a greenhouse. The accumulation of GHGs in the atmosphere regulates the
Earth’s temperature. Without these natural GHGs, the Earth’s temperature would be about 61º
Fahrenheit cooler (California Environmental Protection Agency 2006). Emissions from human
activities, such as electricity production and vehicle use, have elevated the concentration of these
gases in the atmosphere.

Global Climate Change Evaluation 5 02/03/17 East Otay Mesa Specific Plan Amendment
GCC may result from natural factors, natural processes, and/or human activities that change the
composition of the atmosphere and alter the surface and features of land. Although the conceptual
existence of GCC is generally accepted, the extent to which global climate change attributable to
anthropogenic (human) emissions of GHGs (mainly CO2, CH4 and N2O) is currently one of the most
important and widely debated scientific, economic and political issues in the United States. There
is consensus among scientific experts that GCC is attributable to human impacts on the earth’s
environment. Historical records indicate that global climate changes have occurred in the past due
to natural phenomena (such as during previous ice ages). Some data indicate that the current global
conditions differ from past climate changes in rate and magnitude. The State of California has been
at the forefront of developing solutions to address potential anthropogenic impacts to GCC.
The United Nations Intergovernmental Panel on Climate Change (IPCC) constructed several
emission trajectories of GHGs needed to stabilize global temperatures and climate change impacts.
The IPCC concluded that a stabilization of GHGs at 400 to 450 parts per million (ppm) CO2
equivalent concentration is required to keep global mean warming below 3.6º Fahrenheit (2º Celsius),
which is assumed to be necessary to avoid dangerous climate change (Association of Environmental
Professionals 2007).
State law defines greenhouse gases as any of the following compounds: carbon dioxide (CO2),
methane (CH4), nitrous oxide (N2O), hydrofluorocarbons (HFCs), perfluorocarbons (PFCs) and
sulfur hexafluoride (SF6) (California Health and Safety Code Section 38505(g). CO2, followed by
CH4 and N2O, are the most common GHGs that result from human activity.
1.3 Sources and Global Warming Potentials of GHG
As discussed further below, the sources of GHG emissions, GWP, and atmospheric lifetime of GHGs
are all important variables to be considered in the process of calculating CO2e for discretionary land
use projects that require a climate change analysis.

Global Climate Change Evaluation 6 02/03/17 East Otay Mesa Specific Plan Amendment
The California Air Resources Board (ARB) compiled a statewide inventory of anthropogenic GHG
emissions and sinks that includes estimates for CO2, CH4, N2O, SF6, HFCs, and PFCs (ARB 2015).
The current inventory covers the years 1990 to 2013, and is summarized in Table 2. Data sources
used to calculate this GHG inventory include California and federal agencies, international
organizations, and industry associations. The calculation methodologies are consistent with
guidance from the IPCC. The 1990 emissions level is the sum total of sources and sinks from all
sectors and categories in the inventory. The inventory is divided into seven broad sectors and
categories in the inventory. These sectors include: Agriculture; Commercial; Electricity Generation;
Forestry; Industrial; Residential; and Transportation.
Table 2 State of California GHG Emissions by Sector
Sector Total 1990
Emissions (MMTCO2e)
Percent of Total 1990 Emissions
Total 2013 Emissions
(MMTCO2e)
Percent of Total 2013 Emissions
Agriculture 23.4 5% 36.21 8% Commercial 14.4 3% 15.43 3%
Electricity Generation 110.6 26% 90.45 20% Forestry (excluding
sinks) 0.2 <1% Not reported
Industrial 103.0 24% 92.68 20%
Residential 29.7 7% 28.11 6% Transportation 150.7 35% 169.02 37%
Recycling and Waste 8.87 2% High GWP Gases 18.50 4%
Forestry Sinks (6.7) Not reported
When accounting for GHGs, all types of GHG emissions are expressed in terms of CO2 equivalents
(CO2e) and are typically quantified in metric tons (MT) or millions of metric tons (MMT).
GHGs have varying global warming potential (GWP). The GWP is the potential of a gas or aerosol
to trap heat in the atmosphere; it is the “cumulative radiative forcing effect of a gas over a specified
time horizon resulting from the emission of a unit mass of gas relative to a reference gas” (USEPA

Global Climate Change Evaluation 7 02/03/17 East Otay Mesa Specific Plan Amendment
2006). The reference gas for GWP is CO2; therefore, CO2 has a GWP of 1. The other main
greenhouse gases that have been attributed to human activity include CH4, which has a GWP of 28,
and N2O, which has a GWP of 265 (ARB 2014). The CalEEMod Model calculates CO2e emissions
based on previous values for GWPs. This analysis uses the updated ARB GWP values shown above;
therefore, CalEEMod Model emission estimates were adjusted based on these GWPs. Table 3
presents the GWP and atmospheric lifetimes of the GHGs that are regulated by the state of California.
Table 3 Global Warming Potentials and Atmospheric Lifetimes of GHGs
GHG Formula 100-Year Global
Warming Potential Atmospheric
Lifetime (Years) Carbon Dioxide CO2 1 Variable
Methane CH4 28 12 Nitrous Oxide N2O 265 121
Sulfur Hexafluoride SF6 23,500 3,200 Hydrofluorocarbons HFCs 100 to 12,000 1 to 100
Perfluorocarbons PFCs 7,000 to 11,000 3.000 to 50,000 Nitrogen Trifluoride NF3 16,100 500
Source: First Update to the Climate Change Scoping Plan, ARB 2014
Human-caused sources of CO2 include combustion of fossil fuels (coal, oil, natural gas, gasoline and
wood). Data from ice cores indicate that CO2 concentrations remained steady prior to the current
period for approximately 10,000 years. Concentrations of CO2 have increased in the atmosphere
since the industrial revolution.
CH4 is the main component of natural gas and also arises naturally from anaerobic decay of organic
matter. Human-caused sources of natural gas include landfills, fermentation of manure and cattle
farming. Human-caused sources of N2O include combustion of fossil fuels and industrial processes
such as nylon production and production of nitric acid.
Other GHGs are present in trace amounts in the atmosphere and are generated from various industrial
or other uses.

Global Climate Change Evaluation 8 02/03/17 East Otay Mesa Specific Plan Amendment
In addition to the State of California GHG Inventory, a more specific regional GHG inventory was
prepared by the University of San Diego School of Law Energy Policy Initiative Center, a non-
regulatory, academic and research center (University of San Diego 2008). This San Diego County
Greenhouse Gas Inventory (SDCGHGI) is a detailed inventory that takes into account the unique
characteristics of the region in calculating emissions. The SDCGHGI calculated GHG emissions for
1990, 2006, and projected 2020 emissions.
Areas where feasible reductions can occur and the strategies for achieving those reductions are
outlined in the SDCGHGI. A summary of the various sectors that contribute GHG emissions in San
Diego County for the year 2006 is provided in Table 4. Total GHGs in San Diego County are
estimated at 34 MMTCO2e.
Table 4
San Diego County 2006 GHG Emissions by Category
Sector Total Emissions (MMTCO2e) Percent of Total Emissions On-Road Transportation 16 46%
Electricity 9 25% Natural Gas Consumption 3 9%
Civil Aviation 1.7 5% Industrial Processes &
Products 1.6 5%
Other Fuels/Other 1.1 4% Off-Road Equipment &
Vehicles 1.3 4%
Waste 0.7 2% Agriculture/Forestry/Land
Use 0.7 2%
Rail 0.3 1% Water-Born Navigation 0.13 0.4%
Source: EPIC's SDCGHGI, 2008.
According to the SDCGHGI, a majority of the region’s emissions are attributable to on-road
transportation, with the next largest source of GHG emissions attributable to electricity generation.
Similarly, a majority of the emissions resulting from land development projects will be attributable
Global Climate Change Evaluation 9 02/03/17 East Otay Mesa Specific Plan Amendment
to on-road transportation emissions. According to the SDCGHGI study, the emission reductions for
on-road transportation will be achieved in a variety of ways, including through regulations aimed at
increasing fuel efficiency standards and decreasing vehicle emissions. These regulations are outside
the control of project applicants.
Similar to on-road emissions, the SDCGHGI indicated that the necessary emission reductions for
electricity generation will be achieved in a variety of ways, including through implementation of the
renewable portfolio standard (RPS), cleaner electricity purchases by San Diego Gas & Electric,
replacement of the Boardman Contract (which allows the purchase of electricity from coal-fired
power plants), and implementation of 400 MW of photovoltaics. These measures are also outside
the control of project applicants. The SDCGHGI indicates that reduction in electricity consumption
of 10 percent would contribute to the required reduction in GHG emissions required to reduce
emissions to 1990 levels by 2020.
1.4 Regulatory Framework
All levels of government have some responsibility for the protection of air quality, and each level
(Federal, State, and regional/local) has specific responsibilities relating to air quality regulation.
GHG emissions and the regulation of GHGs is a relatively new component of air quality.
1.4.1 National and International Efforts
GCC is being addressed at both the international and federal levels. In 1988, the United Nations and
the World Meteorological Organization established the IPCC to assess the scientific, technical, and
socioeconomic information relevant to understanding the scientific basis for human-induced climate
change, its potential impacts, and options for adaptation and mitigation. The most recent reports of
the IPCC have emphasized the scientific consensus that real and measurable changes to the climate
are occurring, that they are caused by human activity, and that significant adverse impacts on the
environment, the economy, and human health and welfare are unavoidable.

Global Climate Change Evaluation 10 02/03/17 East Otay Mesa Specific Plan Amendment
On March 21, 1994, the United States joined a number of countries around the world in signing the
United Nations Framework Convention on Climate Change (UNFCCC). Under the Convention,
governments agreed to gather and share information on GHG emissions, national policies, and best
practices; launch national strategies for addressing GHG emissions and adapting to expected impacts,
including the provision of financial and technological support to developing countries; and cooperate
in preparing for adaptation to the impacts of GCC. Recently, the United States Supreme Court
declared in the court case of Massachusetts et al. vs. the Environmental Protection Agency et al., 549
C.S. 497 (2007) that the EPA does have the ability to regulate GHG emissions. In addition to the
national and international efforts described above, many local jurisdictions have adopted climate
change policies and programs.
Endangerment Finding. On April 17, 2009, EPA issued its proposed endangerment finding for
GHG emissions. On December 7, 2009, the EPA Administrator signed two distinct findings
regarding greenhouse gases under section 202(a) of the Clean Air Act:
Endangerment Finding: The Administrator finds that the current and projected
concentrations of the six key well-mixed greenhouse gases--carbon dioxide (CO2), methane
(CH4), nitrous oxide (N2O), hydrofluorocarbons (HFCs), perfluorocarbons (PFCs), and
sulfur hexafluoride (SF6)--in the atmosphere threaten the public health and welfare of
current and future generations.
Cause or Contribute Finding: The Administrator finds that the combined emissions of
these well-mixed greenhouse gases from new motor vehicles and new motor vehicle
engines contribute to the greenhouse gas pollution which threatens public health and
welfare.
The endangerment findings do not themselves impose any requirements on industry or other
entities. However, this action was a prerequisite to finalizing the EPA’s greenhouse gas emission
standards for light-duty vehicles, which were jointly proposed by EPA and the Department of
Transportation’s National Highway Safety Administration on September 15, 2009.

Global Climate Change Evaluation 11 02/03/17 East Otay Mesa Specific Plan Amendment
Mandatory GHG Reporting Rule. On March 10, 2009, in response to the FY2008 Consolidated
Appropriations Act (H.R. 2764; Public Law 110–161), EPA proposed a rule that requires mandatory
reporting of greenhouse gas (GHG) emissions from large sources in the United States. On September
22, 2009, the Final Mandatory Reporting of Greenhouse Gases Rule was signed, and was published
in the Federal Register on October 30, 2009. The rule became effective on December 29, 2009. The
rule will collect accurate and comprehensive emissions data to inform future policy decisions.
EPA is requiring suppliers of fossil fuels or industrial greenhouse gases, manufacturers of vehicles
and engines, and facilities that emit 25,000 metric tons or more per year of GHG emissions to submit
annual reports to EPA. The gases covered by the proposed rule are carbon dioxide (CO2), methane
(CH4), nitrous oxide (N2O), hydrofluorocarbons (HFC), perfluorocarbons (PFC), sulfur hexafluoride
(SF6), and other fluorinated gases including nitrogen trifluoride (NF3) and hydrofluorinated ethers
(HFE).
Federal Vehicle Standards. In response to the EPA’s actions discussed above, the Bush
Administration issued Executive Order 13432 in 2007 directing the EPA, the Department of
Transportation (DOT), and the Department of Energy (DOE) to establish regulations that reduce
GHG emissions from motor vehicles, non-road vehicles, and non-road engines by 2008. In 2009,
the National Highway Traffic Safety Administration (NHTSA) issued a final rule regulating fuel
efficiency and GHG emissions from cars and light-duty trucks for model year 2011; and, in 2010,
the EPA and NHTSA issued a final rule regulating cars and light-duty trucks for model years 2012–
2016.
In 2010, President Obama issued a memorandum directing the DOT, DOE, EPA and NHTSA to
establish additional standards regarding fuel efficiency and GHG reduction, clean fuels, and
advanced vehicle infrastructure. In response to this directive, the EPA and NHTSA proposed
stringent, coordinated federal GHG and fuel economy standards for model years 2017–2025 light-
duty vehicles. The proposed standards projected to achieve 163 grams/mile of CO2 in model year
2025, on an average industry fleet-wide basis, which is equivalent to 54.5 miles per gallon (mpg) if
this level were achieved solely through fuel efficiency. The final rule was adopted in 2012 for model
Global Climate Change Evaluation 12 02/03/17 East Otay Mesa Specific Plan Amendment
years 2017–2021, and NHTSA intends to set standards for model years 2022–2025 in a future
rulemaking.
In addition to the regulations applicable to cars and light-duty trucks described above, in 2011, the
EPA and NHTSA announced fuel economy and GHG standards for medium- and heavy-duty trucks
for model years 2014–2018. The standards for CO2 emissions and fuel consumption are tailored to
three main vehicle categories: combination tractors, heavy-duty pickup trucks and vans, and
vocational vehicles. According to the EPA, this regulatory program will reduce GHG emissions and
fuel consumption for the affected vehicles by 6 to 23 percent over the 2010 baselines.
Currently, the USEPA and the NHTSA are working with CARB to develop the next phase (Phase 2)
of the fuel economy and GHG standards for medium- and heavy-duty trucks, which will apply to
vehicles with model year 2018 and later. The USEPA and the NHTSA issued a Notice of Proposed
Rulemaking for Phase 2 in June 2015 and are expected to issue a final rule in spring 2016. Upon the
USEPA’s adoption of the Phase 2 standards, CARB staff plan to propose a Phase 2 program for
California, most likely in late 2016 or 2017.1
As discussed above, the CAFE standards are standards that have been adopted by the U.S.
Department of Transportation and the EPA. These standards are therefore federal standards and
apply to vehicles throughout the United States. As discussed in Section 1.3.2 under State Standards,
California implemented its own regulations to implement GHG standards for passenger vehicles.
The ARB’s Board originally approved regulations to reduce GHGs from passenger vehicles in
September 2004, with the regulations to take effect in 2009. These regulations were authorized by
the 2002 legislation Assembly Bill 1493 (Pavley).
The first California request to implement GHG standards for passenger vehicles, known as a waiver
request, was made in December 2005 and was denied by the EPA in March 2008. That decision was
based on a finding that California’s request to reduce GHG emissions from passenger vehicles did
1 CARB Phase 2 GHG. Available at: http://www.arb.ca.gov/msprog/onroad/caphase2ghg/caphase2ghg.htm. Accessed: August
2015.

Global Climate Change Evaluation 13 02/03/17 East Otay Mesa Specific Plan Amendment
not meet the Clean Air Act requirement of showing that the waiver was needed to meet “compelling
and extraordinary conditions.”
As discussed below in Section 1.3.2, State Regulations and Standards, ARB has adopted a second
phase of the Pavley regulations, originally termed “Pavley II” but now called the Low Emission
Vehicle III” (LEV III) Standards or Advanced Clean Cars (ACC) Program, that covers model years
2017 to 2025. CARB estimates that LEV III will reduce vehicle GHGs by an additional 4.0
MMTCO2E for an approximately 3 percent reduction over Pavley I. These reductions come from
improved vehicle technologies such as smaller engines with superchargers, continuously variable
transmissions, and hybrid electric drives. On August 7, 2012, the final regulation for the adoption of
LEV III became effective.
1.4.2 State Regulations and Standards
The following subsections describe regulations and standards that have been adopted by the State of
California to address GCC issues.
Assembly Bill 32, the California Global Warming Solutions Act of 2006. In September 2006,
Governor Schwarzenegger signed California AB 32, the global warming bill, into law. AB 32 directs
the ARB to do the following:
• Make publicly available a list of discrete early action GHG emission reduction measures that
can be implemented prior to the adoption of the statewide GHG limit and the measures
required to achieve compliance with the statewide limit.
• Make publicly available a GHG inventory for the year 1990 and determine target levels for
2020.
• On or before January 1, 2010, adopt regulations to implement the early action GHG emission
reduction measures.
• On or before January 1, 2011, adopt quantifiable, verifiable, and enforceable emission
reduction measures by regulation that will achieve the statewide GHG emissions limit by

Global Climate Change Evaluation 14 02/03/17 East Otay Mesa Specific Plan Amendment
2020, to become operative on January 1, 2012, at the latest. The emission reduction measures
may include direct emission reduction measures, alternative compliance mechanisms, and
potential monetary and non-monetary incentives that reduce GHG emissions from any
sources or categories of sources that ARB finds necessary to achieve the statewide GHG
emissions limit.
• Monitor compliance with and enforce any emission reduction measure adopted pursuant to
AB 32.
AB 32 required that by January 1, 2008, ARB determine what the statewide GHG emissions level
was in 1990, and approve a statewide GHG emissions limit that is equivalent to that level, to be
achieved by 2020. ARB adopted its Scoping Plan in December 2008, which provided estimates of
the 1990 GHG emissions level and identified sectors for the reduction of GHG emissions. The ARB
has recently published an update to the Scoping Plan (ARB 2014). The ARB has estimated that the
1990 GHG emissions level was 427 MMT net CO2e (ARB 2007b). The ARB estimated that a
reduction of 169 MMT net CO2e emissions below business-as-usual would be required by 2020 to
meet the 1990 levels (ARB 2008). This estimate was updated in the 2011 Final Supplement to the
AB 32 Scoping Plan Functional Equivalent Document (ARB 2011a) based on new economic data
and the incorporation of three regulatory standards (i.e., 2008 Title 24 standards; Pavley I standards;
20% Renewable Portfolio Standard). Based upon the update, the ARB determined in the 2011
Supplement that the State is projected to emit 507 MMT CO2e in 2020, and that a reduction of 80
MMT would be required by 2020 in order to return to the 1990 levels. The 80 MMT reduction
correlates to a 16% reduction in GHG emissions.
Senate Bill 97. Senate Bill 97, enacted in 2007, amends the CEQA statute to clearly establish that
GHG emissions and the effects of GHG emissions are appropriate subjects for CEQA analysis. It
directs OPR to develop draft CEQA guidelines “for the mitigation of greenhouse gas emissions or
the effects of greenhouse gas emissions” by July 1, 2009 and directs the Resources Agency to certify
and adopt the CEQA guidelines by January 1, 2010.
Global Climate Change Evaluation 15 02/03/17 East Otay Mesa Specific Plan Amendment
The Governor’s Office of Planning and Research (OPR) published a technical advisory on CEQA
and Climate Change on June 19, 2008. The guidance did not include a suggested threshold. The OPR
does recommend that CEQA analyses include the following components:
• Identify greenhouse gas emissions
• Determine Significance
• Mitigate Impacts
In April 2009, the OPR published its proposed revisions to CEQA to address GHG emissions. The
amendments to CEQA indicate the following:
• Climate action plans and other greenhouse gas reduction plans can be used to determine
whether a project has significant impacts, based upon its compliance with the plan.
• Local governments are encouraged to quantify the greenhouse gas emissions of proposed
projects, noting that they have the freedom to select the models and methodologies that best
meet their needs and circumstances. The section also recommends consideration of several
qualitative factors that may be used in the determination of significance, such as the extent to
which the given project complies with state, regional, or local GHG reduction plans and
policies. OPR does not set or dictate specific thresholds of significance. Consistent with
existing CEQA Guidelines, OPR encourages local governments to develop and publish their
own thresholds of significance for GHG impacts assessment.
• When creating their own thresholds of significance, local governments may consider the
thresholds of significance adopted or recommended by other public agencies, or
recommended by experts.
• New amendments include guidelines for determining methods to mitigate the effects of
greenhouse gas emissions in Appendix F of the CEQA Guidelines.
• OPR is clear to state that “to qualify as mitigation, specific measures from an existing plan
must be identified and incorporated into the project; general compliance with a plan, by itself,
is not mitigation.”

Global Climate Change Evaluation 16 02/03/17 East Otay Mesa Specific Plan Amendment
• OPR’s emphasizes the advantages of analyzing GHG impacts on an institutional,
programmatic level. OPR therefore approves tiering of environmental analyses and highlights
some benefits of such an approach.
• Environmental impact reports (EIRs) must specifically consider a project's energy use and
energy efficiency potential.
On July 3, 2009, the California Natural Resources Agency published proposed amendment of
regulations based on OPR’s proposed revisions to CEQA to address GHG emissions. On that date,
the Natural Resources Agency commenced the Administrative Procedure Act rulemaking process
for certifying and adopting these amendments pursuant to Public Resources Code section 21083.05.
Having reviewed and considered all comments received, on December 30, 2009, the Natural
Resources Agency adopted the proposed amendments to the state CEQA guidelines in the California
Code of Regulations. The amendments were formally adopted on March 18, 2010.
Executive Order S-3-05. Executive Order S-3-05, signed by Governor Schwarzenegger on June 1,
2005, calls for a reduction in GHG emissions to 1990 levels by 2020 and for an 80 percent reduction
in GHG emissions by 2050. Executive Order S-3-05 also calls for the California EPA (CalEPA) to
prepare biennial science reports on the potential impact of continued GCC on certain sectors of the
California economy. The first of these reports, “Our Changing Climate: Assessing Risks to
California”, and its supporting document “Scenarios of Climate Change in California: An Overview”
were published by the California Climate Change Center in 2006.
Executive Order B-30-15. Executive Order B-30-15 was enacted by the Governor on April 29,
2015. Executive Order B-30-15 establishes an interim GHG emission reduction goal for the state of
California to reduce GHG emissions to 40 percent below 1990 levels by the year 2030. This
Executive Order directs all state agencies with jurisdiction over GHG-emitting sources to implement
measures designed to achieve the new interim 2030 goal, as well as the pre-existing, long-term 2050
goal identified in Executive Order S-3-05 to reduce GHG emissions to 80 percent below 1990 levels
by the year 2050. The Executive Order directs ARB to update its Scoping Plan to address the 2030

Global Climate Change Evaluation 17 02/03/17 East Otay Mesa Specific Plan Amendment
goal. It is anticipated that ARB will develop statewide inventory projection data for 2030 and
commence efforts to identify reduction strategies capable of securing emission reductions that allow
for achievement of the new interim goal for 2030.
Senate Bill 32. Senate Bill 32 was enacted by the California Legislature on September 8, 2016 to
require the ARB to approve a statewide GHG emissions limit to reduce GHG emissions to 40%
below 1990 levels by 2030. The bill codified the target identified in Executive Order B-30-15 and
authorizes the ARB to adopt rules and regulations to achieve the maximum technologically feasible
and cost-effective greenhouse gas emissions reductions and ensure that statewide greenhouse gas
emissions are reduced to at least 40 percent below the statewide greenhouse gas emissions limit no
later than December 31, 2030.
Executive Order S-21-09. Executive Order S-21-09 was enacted by the Governor on September
15, 2009. Executive Order S-21-09 requires that the ARB, under its AB 32 authority, adopt a
regulation by July 31, 2010 that sets a 33 percent renewable energy target as established in Executive
Order S-14-08. Under Executive Order S-21-09, the ARB will work with the Public Utilities
Commission and California Energy Commission to encourage the creation and use of renewable
energy sources, and will regulate all California utilities. The ARB will also consult with the
Independent System Operator and other load balancing authorities on the impacts on reliability,
renewable integration requirements, and interactions with wholesale power markets in carrying out
the provisions of the Executive Order. The order requires the ARB to establish highest priority for
those resources that provide the greatest environmental benefits with the least environmental costs
and impacts on public health.
California Code of Regulations Title 24. Although not originally intended to reduce greenhouse
gas emissions, California Code of Regulations Title 24 Part 6: California’s Energy Efficiency
Standards for Residential and Nonresidential Buildings were first established in 1978 in response to
a legislative mandate to reduce California's energy consumption. The standards are updated
periodically to allow consideration and possible incorporation of new energy efficiency technologies
and methods. The GHG emission inventory was based on Title 24 as of 2008.. According to the

Global Climate Change Evaluation 18 02/03/17 East Otay Mesa Specific Plan Amendment
California Energy Commission (CEC 2012), the California Energy Commission’s (CEC) 2013
Building Energy Efficiency Standards (effective July 1, 2014) are 25 percent and 30 percent more
efficient than the 2008 Title 24standards for residential and nonresidential construction, respectively.
The 2013 standards require higher efficiency windows, insulation, lighting, ventilation systems and
other features that further reduce energy consumption in homes and businesses. Additionally, the
Standards will save 200million gallons of water per year (equal to more than 6.5million wash loads)
and avoid 170,500 tons of greenhouse gas emissions per year. Energy efficient buildings require less
electricity, natural gas, and other fuels. Electricity production from fossil fuels and on-site fuel
combustion (typically for water heating) results in greenhouse gas emissions. Therefore, increased
energy efficiency results in decreased greenhouse gas emissions.
State Standards Addressing Vehicular Emissions. California Assembly Bill 1493 (Pavley)
enacted on July 22, 2002, required the ARB to develop and adopt regulations that reduce greenhouse
gases emitted by passenger vehicles and light duty trucks. Regulations adopted by ARB would apply
to 2009 and later model year vehicles. ARB estimated that the regulation would reduce climate
change emissions from light duty passenger vehicle fleet by an estimated 18% in 2020 and by 27%
in 2030 (AEP 2007). Once implemented, emissions from new light-duty vehicles are expected to be
reduced in San Diego County by 21 percent by 2020. The ARB has adopted amendments to the
“Pavley” regulations that reduce greenhouse gas (GHG) emissions in new passenger vehicles from
2009 through 2016. The amendments, approved by the Board on September 24, 2009, are part of
California’s commitment toward a nation-wide program to reduce new passenger vehicle GHGs from
2012 through 2016. ARB’s September 2009 amendments will cement California’s enforcement of
the Pavley rule starting in 2009 while providing vehicle manufacturers with new compliance
flexibility. The amendments will also prepare California to harmonize its rules with the federal rules
for passenger vehicles. It is expected that the Pavley regulations will reduce GHG emissions from
California passenger vehicles by about 22 percent in 2012 and about 30 percent in 2016, all while
improving fuel efficiency.
Implementation of the Pavley II standards will commence in 2017 and cover vehicles manufactured
from 2017 through 2025. Based on information from the ARB (ARB 2011b), the Pavley II program

Global Climate Change Evaluation 19 02/03/17 East Otay Mesa Specific Plan Amendment
(now referred to as the “Advanced Clean Cars” program) would reduce GHG emissions from the
fleet by 3% by 2020, and by 12% by 2025, with continuing reductions in emissions of 27% by 2035
and 33% by 2050.
Executive Order S-01-07. Executive Order S-01-07 was enacted by the Governor on January 18,
2007. Essentially, the order mandates the following: 1) that a statewide goal be established to reduce
the carbon intensity of California's transportation fuels by at least 10 percent by 2020; and 2) that a
Low Carbon Fuel Standard ("LCFS") for transportation fuels be established for California. It is
assumed that the effects of the LCFS would be a 10% reduction in GHG emissions from fuel use by
2020. On April 23, 2009, ARB adopted regulations to implement the LCFS.
Senate Bill 375. Senate Bill 375 requires that regions within the state which have a metropolitan
planning organization must adopt a sustainable communities strategy as part of their regional
transportation plans. The strategy must be designed to achieve certain goals for the reduction of
GHG emissions. The bill finds that GHG from autos and light trucks can be substantially reduced
by new vehicle technology, but even so “it will be necessary to achieve significant additional
greenhouse gas reductions from changed land use patterns and improved transportation. Without
improved land use and transportation policy, California will not be able to achieve the goals of AB
32.” SB 375 provides that new CEQA provisions be enacted to “encourage developers to submit
applications and local governments to make land use decisions that will help the state achieve its
goals under AB 32,” and that “current planning models and analytical techniques used for making
transportation infrastructure decisions and for air quality planning should be able to assess the effects
of policy choices, such as residential development patterns, expanded transit service and
accessibility, the walkability of communities, and the use of economic incentives and disincentives.”
The Sustainable Communities and Climate Protection Act of 2008 (SB 375) coordinates land use
planning, regional transportation plans, and funding priorities to reduce GHG emissions from
passenger vehicles through better-integrated regional transportation, land use, and housing planning
that provides easier access to jobs, services, public transit, and active transportation options.SB 375
specifically requires the Metropolitan Planning Organization (MPO) relevant to the Project area

Global Climate Change Evaluation 20 02/03/17 East Otay Mesa Specific Plan Amendment
(here, the San Diego Association of Governments [SANDAG]) to include a Sustainable
Communities Strategy in its Regional Transportation Plan that will achieve GHG emission reduction
targets set by the ARB by reducing vehicle miles traveled from light-duty vehicles through the
development of more compact, complete, and efficient communities.
For the area under SANDAG’s jurisdiction, including the Project Site, the ARB adopted regional
targets for reduction of mobile source-related GHG emissions by 7 percent for 2020 and by 13
percent for 2035. (These targets are expressed by the ARB as a percent change in per capita GHG
emissions relative to 2005 levels.) In October 2011, SANDAG’s Board adopted its 2050 Regional
Transportation Plan and Sustainable Communities Strategy. Subsequently, in November 2011, the
ARB - by resolution – accepted SANDAG’s GHG emissions quantification analysis and
determination that, if implemented, the Sustainable Communities Strategy would achieve the ARB’s
2020 and 2035 GHG emission reduction targets for the region.
Pursuant to Government Code Section 65080(b)(2)(K), SANDAG’s Sustainable Communities
Strategy does not: (i) regulate the use of land; (ii) supersede the land use authority of cities and
counties; or (iii) require that a city’s or county’s land use policies and regulations, including those in
a general plan, be consistent with it. Nonetheless, SB 375 makes regional and local planning agencies
responsible for developing Sustainable Communities Strategy as part of the federally required
metropolitan transportation planning process and the state-mandated housing element process.
1.4.3 Local Regulations and Standards
The County has adopted its General Plan Update (County of San Diego 2011), which provides smart
growth and land use planning principles designed to reduce vehicle miles traveled (VMT) and result
in a reduction in GHG emissions. As discussed in the General Plan Update, climate change and
GHG reduction policies are addressed in plans and programs in multiple elements of the General
Plan. The strategies for reduction of GHG emissions in the General Plan Update are as follows:
• Strategy A-1: Reduce vehicle trips generated, gasoline/energy consumption, and greenhouse
gas emissions.

Global Climate Change Evaluation 21 02/03/17 East Otay Mesa Specific Plan Amendment
• Strategy A-2: Reduce non-renewable electrical and natural gas energy consumption and
generation (energy efficiency).
• Strategy A-3: Increase generation and use of renewable energy sources.
• Strategy A-4: Reduce water consumption.
• Strategy A-5: Reduce and maximize reuse of solid wastes.
• Strategy A-6: Promote carbon dioxide consuming landscapes.
• Strategy A-7: Maximize preservation of open spaces, natural areas, and agricultural lands.
The General Plan Update also includes climate adaptation strategies to deal with potential adverse
effects of climate change. The climate adaptation strategies include the following:
• Strategy B-1: Reduce risk from wildfire, flooding, and other hazards resulting from climate
change.
• Strategy B-2: Conserve and improve water supply due to shortages from climate change.
• Strategy B-3: Promote agricultural lands for local food production.
• Strategy B-4: Provide education and leadership.
The County has also implemented a number of outreach programs such as the Green Building
Program, lawn mower trade-in program, and reduction of solid waste by recycling to reduce air
quality impacts as well as GHG emissions.
The County is working on developing a new Climate Action Plan that is anticipated to be released
in 2017. The Climate Action Plan will include an updated GHG Inventory; GHG reduction targets
and an analysis of the gap that will need to be filled to meet statewide goals set forth in S-3-05 and
B-30-15 as implemented in SB 32; GHG reduction measures; and a recommended method(s) for
analysis of projects subject to CEQA.
Global Climate Change Evaluation 22 02/03/17 East Otay Mesa Specific Plan Amendment
2.0 POTENTIAL CLIMATE CHANGE IMPACTS TO PROJECT SITE 2.1 Existing Conditions
The site is currently undeveloped and includes disturbed areas and native vegetation, consisting
mainly of coastal sage scrub and grassland. Natural vegetation and soils temporarily store carbon as
part of the terrestrial carbon cycle. Carbon is assimilated into plants and animals as they grow and
then dispersed back into the environment when they die. There are two existing sources of carbon
storage at the Project site: natural vegetation and soils. It is difficult to assess net changes in carbon
storage associated with the proposed Project, but carbon sequestration rates for native vegetation in
the Otay Mesa region are relatively low in comparison to heavily vegetated areas such as forests. For
example, according to the U.S. EPA (http://www.epa.gov/sequestration/rates.html), riparian areas
are estimated to sequester from 0.1 to 0.3 metric tons of CO2e per acre per year in comparison to
forests, which are estimated to sequester 0.6 to 2.6 metric tons of CO2e per acre per year. Native
vegetation in the Otay Mesa region, which consists mainly of scrub, native- and non-native grassland,
and disturbed areas, would be expected to provide a low level of carbon sequestration. The key issue
is the balance between the loss of natural vegetation and future carbon storage associated with
landscaping. The situation is further complicated by changes in fire regime. Carbon in natural
vegetation is likely to be released into the atmosphere through wildfire every 20 to 150 years. Carbon
in landscaped areas will be protected from wildfire. The balance between these factors will influence
the long-term carbon budget on the site. As discussed in Section 4.0, the impacts of carbon
sequestration loss have been evaluated in the GHG inventory.
The majority of carbon within the site is stored in the soil. Soil carbon accumulates from inputs of
plant and animal matter, roots, and other living components of the soil ecosystem (e.g., bacteria,
worms, etc.). Soil carbon is lost through biological respiration, erosion, and other forms of
disturbance. Overall, soil carbon moves more slowly through the carbon cycle, and it offers greater
potential for long-term carbon storage. Field observations suggest that urban soils can sequester
relatively large amounts of carbon. Observations from across the United States suggest that warmer

Global Climate Change Evaluation 23 02/03/17 East Otay Mesa Specific Plan Amendment
and drier climates (such as southern California) may have slightly higher soil organic matter levels
when compared to equivalent areas before development.
Based on the site’s current conditions and the absence of development, existing GHG emissions are
negligible and assumed to be zero.
2.2 Typical Adverse Effects
The Climate Scenarios Report (CCCC 2006), uses a range of emissions scenarios developed by the
IPCC to project a series of potential warming ranges (i.e., temperature increases) that may occur in
California during the 21st century. Three warming ranges were identified: Lower warming range
(3.0 to 5.5 degrees Fahrenheit (ºF)); medium warming range (5.5 to 8.0 ºF); and higher warming
range (8.0 to 10.5ºF). The Climate Scenarios Report then presents an analysis of the future projected
climate changes in California under each warming range scenario.
According to the report, substantial temperature increases would result in a variety of impacts to the
people, economy, and environment of California. These impacts would result from a projected
increase in extreme conditions, with the severity of the impacts depending upon actual future
emissions of GHGs and associated warming. These impacts are described below.
Public Health. Higher temperatures are expected to increase the frequency, duration, and intensity
of conditions conducive to air pollution formation. For example, days with weather conducive to O3
formation are projected to increase by 25 to 35 percent under the lower warming range and 75 to 85
percent under the medium warming range. In addition, if global background O3 levels increase as is
predicted in some scenarios, it may become impossible to meet local air quality standards. An
increase in wildfires could also occur, and the corresponding increase in the release of pollutants
including PM2.5 could further compromise air quality. The Climate Scenarios Report indicates that
large wildfires could become up to 55 percent more frequent if GHG emissions are not significantly
reduced.

Global Climate Change Evaluation 24 02/03/17 East Otay Mesa Specific Plan Amendment
Potential health effects from global climate change may arise from temperature increases, climate-
sensitive diseases, extreme events, and air quality. There may be direct temperature effects through
increases in average temperature leading to more extreme heat waves and less extreme cold spells.
Those living in warmer climates are likely to experience more stress and heat-related problems (e.g.,
heat rash and heat stroke). In addition, climate sensitive diseases (such as malaria, dengue fever,
yellow fever, and encephalitis) may increase, such as those spread by mosquitoes and other disease-
carrying insects.
Potential public health impacts from climate change would be global in nature rather than site-
specific. That being said, because the project site is not located in an area that is subject to climate
sensitive diseases (such as the tropics), it is unlikely that risks associated with these diseases would
increase substantially. It is too speculative to estimate the potential frequency of heat waves at the
project site that would be associated with global climate change.
Water Resources. A vast network of reservoirs and aqueducts capture and transport water
throughout the State from northern California rivers and the Colorado River. The current distribution
system relies on Sierra Nevada mountain snowpack to supply water during the dry spring and
summer months. Rising temperatures, potentially compounded by decreases in precipitation, could
severely reduce spring snowpack, increasing the risk of summer water shortages. In addition, if
temperatures continue to rise more precipitation would fall as rain instead of snow, further reducing
the Sierra Nevada spring snowpack by as much as 70 to 90 percent. The State’s water resources are
also at risk from rising sea levels. An influx of seawater would degrade California’s estuaries,
wetlands, and groundwater aquifers.
Impacts to water resources could affect the project site through decreased availability of water in
southern California overall. Decreased availability could lead to higher prices and water rationing.
However, due to the scientific and factual uncertainties regarding the effects of climate change at a
regional level, it is too speculative to quantify the effect of this impact.

Global Climate Change Evaluation 25 02/03/17 East Otay Mesa Specific Plan Amendment
Agriculture. Increased GHG and associated increases in temperature are expected to cause
widespread changes to the agricultural industry, reducing the quantity and quality of agricultural
products statewide. Significant reductions in available water supply to support agriculture would
also impact production. Crop growth and development will change as will the intensity and
frequency of pests and diseases.
This potential effect of climate change would not impact the proposed project because the project
does not involve agricultural uses.
Ecosystems/Habitats. Continued global warming will likely shift the ranges of existing invasive
plants and weeds, thus alternating competition patterns with native plants. Range expansion is
expected in many species while range contractions are less likely in rapidly evolving species with
significant populations already established. Continued global warming is also likely to increase the
populations of and types of pests. Continued global warming would also affect natural ecosystems
and biological habitats throughout the State.
Due to the scientific and factual uncertainties regarding the effects of climate change at a regional
and site-specific level, particularly as to sensitive biological resources, it is too speculative to assess
the effect of this impact on the project site.
Wildland Fires. Global warming is expected to increase the risk of wildfire and alter the distribution
and character of natural vegetation. If temperatures rise into the medium warming range, the risk of
large wildfires in California could increase by as much as 55 percent, which is almost twice the
increase expected if temperatures stay in the lower warming range. However, since wildfire risk is
determined by a combination of factors including precipitation, winds, temperature, and landscape
and vegetation conditions, future risks will not be uniform throughout the State.
The project site generally has a low potential for fire risks due to the type of on-site native vegetation.

Global Climate Change Evaluation 26 02/03/17 East Otay Mesa Specific Plan Amendment
Sea Level Rising and Coastal Flooding. Rising sea levels, more intense coastal storms, and warmer
water temperatures will increasing threaten the State’s coastal regions. Under the high warming
scenario, sea level is anticipated to rise 22 to 35 inches by 2100. A sea level risk of this magnitude
would inundate coastal areas with salt water, accelerate coastal erosion, threaten levees and inland
water systems, and disrupt wetlands and natural habitats.
Because the site is not located in a coastal area, it is unlikely to be affected by rising sea levels.
2.3 California Climate Adaptation Strategy
As part of its climate change planning process, the California Natural Resources Agency prepared
its California Climate Adaptation Strategy (CNRA 2009) to summarize the best known science on
climate change impacts in California, with the goal of assessing vulnerability to climate change
impacts. According to the ARB, some of the potential California-specific impacts of global warming
may include loss in snow pack, sea level rise, more extreme heat days per year, more high ozone
days, more large forest fires, and more drought years. To protect the State’s public health and safety,
resources, and economy, the California Natural Resources Agency—in coordination with other state
agencies—has updated the 2009 California Climate Adaptation Strategy that is titled, Safeguarding
California: Reducing Climate Risk. The final Safeguarding California plan is dated July 2014, and
provides policy guidance for state decision makers relative to climate risks in nine sectors:
agriculture; biodiversity and habitat; emergency management; energy; forestry; ocean and coastal
ecosystems and resources; public health; transportation; and water. It also identifies policies for
reducing GHG emissions and accelerating the transition to a clean-energy economy through
reductions in emissions, readiness, and continued research.
The California Climate Adaptation Strategy takes into account the long-term, complex, and uncertain
nature of climate change and establishes a proactive foundation for an ongoing adaptation process.
The strategy made preliminary recommendations as a first step in addressing responses to impacts
of global climate change within the state. Key recommendations include:

Global Climate Change Evaluation 27 02/03/17 East Otay Mesa Specific Plan Amendment
1. A Climate Adaptation Advisory Panel (CAAP) will be appointed to assess the greatest risks
to California from climate change and recommend strategies to reduce those risks building
on California’s Climate Adaptation Strategy.
2. Identify necessary changes to California’s water management and uses.
3. Consider project alternatives that avoid significant new development in areas that cannot be
adequately protected (planning, permitting, development, and building) from flooding,
wildfire and erosion due to climate change.
4. All state agencies responsible for the management and regulation of public health,
infrastructure or habitat subject to significant climate change should prepare as appropriate
agency-specific adaptation plans, guidance, or criteria by September 2010.
5. To the extent required by CEQA Guidelines Section 15126.2, all significant state projects,
including infrastructure projects, must consider the potential impacts of locating such projects
in areas susceptible to hazards resulting from climate change.
6. The California Emergency Management Agency (Cal EMA) will collaborate with the
California Natural Resources Agency, the Climate Action Team, the Energy Commission,
and the CAAP to assess California's vulnerability to climate change, identify impacts to state
assets, and promote climate adaptation/mitigation awareness through the Hazard Mitigation
Web Portal and My Hazards Website as well as other appropriate sites.
7. Using existing research the state should identify key California land and aquatic habitats that
could change significantly during this century due to climate change. Based on this
identification, the state should develop a plan for expanding existing protected areas or
altering land and water management practices to minimize adverse effects from climate
change induced phenomena.
8. The best long-term strategy to avoid increased health impacts associated with climate change
is to ensure communities are healthy to build resilience to increased spread of disease and
temperature increases.
9. Communities with General Plans and Local Coastal Plans should begin, when possible, to
amend their plans to assess climate change impacts, identify areas most vulnerable to these
impacts, and develop reasonable and rational risk reduction strategies using the CAS as
guidance.

Global Climate Change Evaluation 28 02/03/17 East Otay Mesa Specific Plan Amendment
10. State fire fighting agencies should begin immediately to include climate change impact
information into fire program planning to inform future planning efforts.
11. State agencies should meet projected population growth and increased energy demand with
greater energy conservation and an increased use of renewable energy.
12. Existing and planned climate change research can and should be used for state planning and
public outreach purposes; new climate change impact research should be broadened and
funded.

Global Climate Change Evaluation 29 02/03/17 East Otay Mesa Specific Plan Amendment
3.0 CLIMATE CHANGE SIGNIFICANCE CRITERIA
According to Appendix G of the CEQA Guidelines, the following criteria are considered to establish
a significance threshold for GCC impacts:
Would the project:
• Generate greenhouse gas emissions, either directly or indirectly, that may have a significant
impact on the environment?
• Conflict with an applicable plan, policy, or regulation adopted for the purpose of reducing
the emissions of greenhouse gases?
As described in Section 2.2, Executive Order B-30-15 established a statewide emissions reduction
target of 40% below 1990 levels by 2030. SB 32 implements this goal and authorizes the ARB to
adopt rules and regulations to achieve the maximum technology feasible and cost-effective
greenhouse gas emissions reductions and ensure that statewide greenhouse gas emissions are
reduced to at least 40 percent below the statewide greenhouse gas emissions limit no later than
December 31, 2030. This mid-term goal was identified to keep the State on a trajectory needed to
meet the 2050 goal of reducing GHG emissions to 80% below 1990 levels by 2050 pursuant to
Executive Order S-3-05.
This project has been evaluated on the basis of an efficiency metric, which assesses the annual GHG
emissions per service population. Service population is defined as the residents plus full-time
employees. The efficiency metric is derived based on the future statewide GHG emissions reduction
goals divided the statewide service population, derived as discussed below.
The efficiency metric assesses the GHG efficiency of a project on a “service population (SP)” basis
(efficiency metric = project emissions divided by the sum of the number of jobs and the number of
residents provided by a project). The metric represents the rate of emissions needed to achieve a fair
share of the State’s emissions mandate embodied in AB 32. The use of “fair share” in this instance
indicates the GHG efficiency level that, if applied statewide, would meet the AB 32 emissions target

Global Climate Change Evaluation 30 02/03/17 East Otay Mesa Specific Plan Amendment
and support efforts to reduce emissions beyond 2020. With a reduced rate of emissions per service
population, California can accommodate expected population growth and achieve economic
development objectives, while also abiding by AB 32’s emissions target and supporting efforts to
reduce emissions beyond 2020.
The efficiency metric is based on the AB 32 GHG reduction target and GHG emissions inventory
prepared for ARB’s 2008 Scoping Plan. To develop the efficiency metric for 2020, land-use driven
sectors in ARB’s 1990 GHG inventory were identified and separated to tailor the inventory to land
use projects. This process removes emission sources not applicable to land use projects. The land-
use driven sector inventory for 1990 was divided by the service population projections for California
in 2020. The efficiency metric allows the threshold to be applied evenly to most project types
(residential, commercial/retail and mixed use) and employs an emissions inventory comprised only
of emission sources from land-use related sectors. The efficiency metric allows lead agencies to
assess whether any given project or plan would accommodate population and employment growth
in a way that is consistent with the emissions limit established under AB 32.
ARB has indicated that an average statewide GHG reduction of 5.2 percent per year between 2020
and 2050 is necessary to achieve the 2030 and 2050 emissions reduction goals of Executive Orders
B-30-15 and S-3-05 (ARB 2015). Efficiency metrics can be derived for each year between 2020
and 2050 based on this identified reduction downward direction, or based on other sources if
supported by substantial evidence. As previously noted, the intent of the 5.2 percent annual
reduction data is not to establish interim year reduction targets for the State; rather it is meant to
allow projects to develop and apply interim year efficiency metrics at their buildout year and
demonstrate consistency with the overall State reduction downward direction.
Because the project will be built out by 2028, the efficiency metric is derived for 2028. Based on
population projections and employment projections (assuming 1.491% growth in employment from
2012 through 2022), the derivation of the 2028 efficiency metric is shown in Table 5. The 2028
efficiency metric has been used in this analysis to evaluate significance of impacts.

Global Climate Change Evaluation 31 02/03/17 East Otay Mesa Specific Plan Amendment
Table 5 Derivation of Efficiency Metric, 2028 Buildout
Emissions, MT/yra 187.02
Populationb 43,424,440
Employment (assuming 1.491% change as from 2012-2022)c 19,738,382
Total 63,162,822
Metric Tons/Service Population 3.0 aAssuming 5.2% reduction per year from 2020 baseline levels of 286.70 MT CO2e bCalifornia Department of Finance, Demographic Research Unit Report P-2, State and County Population Projections by Race/Ethnicity and Age (5-year groups) 2010 through 2060 (as of July1); December 15, 2014 cCalifornia Department of Finance, Employment Development Department Industry Employment Projections, Labor Market Information Division, 2010-2020, May 23, 2012, assuming 1.491% growth in employment Based on the projections of statewide emissions and population and employment projections, the
2028 efficiency metric is 3.0 metric tons of CO2e per service population. This efficiency metric
was used to evaluate the project’s impact.

Global Climate Change Evaluation 32 02/03/17 East Otay Mesa Specific Plan Amendment
4.0 GREENHOUSE GAS INVENTORY
GHG emissions associated with the proposed Project were estimated separately for six categories
of emissions: (1) construction; (2) area sources; (3) energy use, including electricity and natural
gas usage; (4) water consumption; (5) solid waste handling; and (6) transportation.
The complete emissions inventory is summarized below and included in Appendix A.
4.1 Existing Greenhouse Gas Emissions
As discussed in Section 2.1, the site is currently undeveloped and existing site GHG emissions are
negligible. Minor amounts of GHG emissions may be associated with intermittent on-site
activities (e.g., vehicle use). This analysis includes an evaluation of the carbon sequestration loss
at the site using the CalEEMod Model.
The carbon sequestration loss calculations are based on the biological survey report for the project
site. Table 6 presents a summary of the existing on-site vegetation, and the classification within
the CalEEMod model to calculate sequestration loss.
Table 6 East Otay Mesa Specific Plan Amendment
On-site Vegetation Habitat Acres On Site CalEEMod Category
Wetland Habitat Types Disturbed Wetland1 0.83 Wetlands Non-Native Riparian 0.51 Scrub Upland Habitat Types Native Grassland 1.65 Grassland Non-Native Grassland1 239.91 Grassland Other Upland Habitats/Land Cover Developed Land 2.97 Others Disturbed Habitat 7.26 Others Total 253.13
1The project will preserve 0.3 acres of wetlands and 51.33 acres of grassland.

Global Climate Change Evaluation 33 02/03/17 East Otay Mesa Specific Plan Amendment
4.2 Construction Greenhouse Gas Emissions
Construction GHG emissions include emissions from heavy construction equipment, truck traffic,
and worker trips. Specific information on construction schedule and activities is not known at this
time. Therefore, emissions were calculated using the CalEEMod Model, based on the default
assumptions within the model, which assumes a construction schedule and tempo based on the size
of the development. Table 7 presents the assumed construction schedule for the project.
The total construction emissions were estimated to be 17,485 metric tons of CO2e. The County
Department of Planning & Development Services (PDS) follows recommendations by the
SCAQMD for purposes of evaluating construction-related GHGs under CEQA (SCAQMD 2008).
Specifically, emissions are amortized over 20 years and added to operational emissions, as
appropriate. Amortized over 20 years, construction would contribute 874 metric tons per year of
CO2e emissions. These emissions were added to the operational GHG emissions to evaluate their
significance.

Global Climate Change Evaluation 34 02/03/17 East Otay Mesa Specific Plan Amendment
Table 71
Assumed Construction Schedule
Project Element 2018 2019 2020 2021 2022 2023 2024 2025 2026 2027 TOTAL
Technology Park (square feet) 95,625 95,625 95,625 95,625 95,625 95,625 95,625 47,813 47,812 765,000 sq. ft.
Residential (units) 875 697 337 837 312 100 3,158 units
Retail (square feet) 78,000 78,000 sq. ft.
Park (acres) 8 10 9 27 acres
1This table provides an assumed phasing for the purpose of the GHG analysis to address emissions from construction on a programmatic level. Emissions are calculated and disclosed on this basis.
Global Climate Change Evaluation 35 02/03/17 East Otay Mesa Specific Plan Amendment
4.3 Operational Greenhouse Gas Emissions
Operational GHG emissions were calculated using the CalEEMod Model, with adjustments to
account for site-specific conditions.
Area Source Emissions. The CalEEMod Model calculates emissions associated with area
sources, including landscaping equipment and hearth (fireplace) use. For this analysis, it was
assumed that residential units would include a natural gas fireplace.
Energy Use Emissions. Energy use generates GHGs through emissions from power plants that
generate electricity as well as emissions from natural gas usage at the facility itself.
The CalEEMod model includes energy intensity factors for utilities that are based on emission
factors for electricity are based on Power Utility Protocol reports submitted to the California
Climate Action Registry (CCAR) with the most recent years around 2006-2008 or from the Local
Government Operations Protocol. Implementation of the RPS will affect indirect GHG emissions
associated with electricity use for the proposed Project because electricity will be purchased from
San Diego Gas and Electric. According to the SDCGHGI (USD 2008), implementation of the
20% RPS mandate by 2010, as established by Senate Bill 107, would reduce GHG emissions by
14% from 2006 levels; credit was taken for these GHG savings in this analysis. As of September
23, 2010, the ARB has adopted the regulation that implements the 33% renewable energy standard.
Implementation of the 33% target by 2020 will reduce GHG emissions by an additional 13% per
the SDCGHGI. Thus, implementation of Executive Order S-21-09 would serve to reduce GHG
emissions by a total of 27% below 2006 levels. The emission factors for utility energy use have
been adjusted to account for implementation of the 33% RPS by 2020. In addition, SDG&E is
required to meet a target of 50% RPS by 2030. To account for the additional GHG reductions due
to implementation of the 50% RPS, it was assumed that the state would achieve this goal in a linear
fashion. It was therefore assumed that the state of California would meet a goal of 46.6% RPS by
2028, the buildout year.

Global Climate Change Evaluation 36 02/03/17 East Otay Mesa Specific Plan Amendment
At a minimum, buildings would meet the energy efficiency requirements of Title 24 as of 2013,
which results in a 21.8% decrease in electricity use over Title 24 as of 2008 and 16.8% decrease
in natural gas use over Title 24 as of 2008 (CEC 2013) for non-residential uses, and a 23.3%
decrease in electricity use over Title 24 as of 2008 and 3.8% decrease in natural gas use over Title
24 as of 2008 for multi-family residential units. These decreases in energy use were accounted for
in the model. The buildings would be constructed post-2016 and would therefore be required to
meet the requirements of Title 24 as of 2016. According to the California Energy Commission
(CEC 2015), Title 24 as of 2016 would improve residential energy efficiency by 28%, and non-
residential energy efficiency by 5%.
It was also assumed that the residences would be equipped with EnergyStar appliances. The
reductions for EnergyStar appliances was accounted for within the CalEEMod model under
Energy Mitigation.
Water. Water use and energy use are often closely linked. The provision of potable water to
commercial users consumes large amounts of energy associated with five stages: source and
conveyance, treatment, distribution, end use, and wastewater treatment. GHG emissions from
water use were calculated based on the CalEEMod model, assuming that low-flow fixtures would
be used, and that water-efficient irrigation systems would be employed that would reduce outdoor
water use by 6.1% (CalEEMod default mitigation measure).
Solid Waste. The disposal of solid waste produces GHG emissions from anaerobic decomposition
in landfills, incineration, transportation of waste, and disposal. Solid waste generation rates were
estimated from CalEEMod Model, and GHG emissions from solid waste management were
estimated using the model, assuming landfilling of solid waste with flaring.
AB 341 sets forth a legislative declaration that it is the policy goal of the state that not less than
75% of solid waste generated be source reduced, recycled, or composted by the year 2020. The
County achieves a high diversion rate currently and is working on developing a high diversion
plan to meet the 75% goal. Jurisdictions were required to meet a 50% reduction goal under AB 75

Global Climate Change Evaluation 37 02/03/17 East Otay Mesa Specific Plan Amendment
by the year 2000. Therefore, for conservative purposes, solid waste was assumed to be reduced by
50% for this analysis.
Transportation. Several regulatory initiatives have been passed to reduce emissions from on-
road vehicles, as discussed in Section 1.3. The EMFAC2014 emission factors, which are included
in CalEEMod Version 2016.3.1, were used in the analysis. The EMFAC2014 emission factors
include reductions in GHG emissions for the Pavley I and Advanced Clean Cars programs.
To calculate emissions associated with vehicle trips generated by the proposed Project, the trip
generation rates from the Traffic Impact Analysis – East Otay Mesa Specific Plan Amendment
(Linscott, Law, and Greenspan 2016) were used. Vehicle miles traveled (VMT) were calculated
based on the CalEEMod Model assumptions. To account for the mix of uses at the site, which is
a project design feature, the reduction in VMT was calculated based on the land use index as
recommended by CAPCOA (CAPCOA 2010). The land use index indicates that the mix of uses
results in a reduction in VMT of 15.04%. The 15.04% reduction was applied to the emissions for
both the unmitigated and mitigated conditions, because the mix of uses is a feature of the project.
Based on CalEEMod default values, for the unmitigated emissions, CO2 emissions from vehicles
total 31,462 metric tons/year and CH4 emissions from vehicles 1.5400 metric tons/year. Applying
the 15.04% reduction to both emission estimates, the CO2 emissions total 26,730 metric tons/year
and the CH4 emissions from vehicles total 1.3084 metric tons/year. A paragraph has been added
to the text to explain this.
Table 8 presents a summary of the project design features that were included in this analysis to
reduce GHG emissions.

Global Climate Change Evaluation 38 02/03/17 East Otay Mesa Specific Plan Amendment
Table 8 Proposed Project Design Features to Reduce GHG Emissions
Strategy to Reduce GHG Emissions
Description Emission Reduction
Basis for Emission Reduction
Land Use and Community Design Mixed Use Development
The East Otay Mesa Specific Plan Amendment provides a mix of uses at the site, including residential, retail, and industrial/employment uses.
Based on CAPCOA’s Quantifying Greenhouse Gas Mitigation Measures, the land use index for the project projects a 15.04% reduction in VMT.
CAPCOA
Electric Vehicle Parking
Non-residential and multi-residential units will be conditioned to provide electric vehicle parking. The electric vehicle parking will conform with applicable building code requirements in place at the time of construction.
Because EMFAC2014, which is included in CalEEMod2016, accounts for penetration of electric vehicles into the fleet, no additional reductions were taken.
Provide Bike Parking in Non-Residential and Multi-Unit Residential Projects
Non-residential and multi-residential units will be conditioned to include bicycle parking. The bicycle parking will conform with applicable building code requirements in place at the time of construction.
Because the reduction in VMT is not quantifiable at this time, no additional reductions were taken.
Provide Pedestrian Network Improvements
The project will be designed with non-contiguous sidewalks to provide a pedestrian network throughout.
No credit was taken for this measure in the GHG calculations for the mitigated emission calculations.
Increase Transit Accessibility
The project will provide a new MTS bus stop. The project is within 0.5 miles of MTS bus route 905, which currently provides hourly service to the project area.
CalEEMod model reductions
CalEEMod Model
Traffic Calming Measures
The project will include traffic calming measures on a minimum of 25% of internal streets and 25% of internal intersections.
This measure was accounted for by reducing GHG emissions from vehicles by 0.25% per CAPCOA
CAPCOA 2010

Global Climate Change Evaluation 39 02/03/17 East Otay Mesa Specific Plan Amendment
Table 8 Proposed Project Design Features to Reduce GHG Emissions
Strategy to Reduce GHG Emissions
Description Emission Reduction
Basis for Emission Reduction
Energy Efficiency Limited Outdoor Lighting
The project will limit outdoor lighting requirements. Outdoor lighting will be limited in accordance with the dark skies policy, consistent with applicable code requirements in place at the time of construction
Because the reduction in GHGs is not quanitifiable, no additional reductions were taken.
ENERGYSTAR Appliances
Indoor residential appliances will meet the requirements of Title 24 at the time of construction, which is assumed to be EnergyStar for residential units.
CalEEMod model reductions
CalEEMod Model
High Efficiency Lighting
The project will be equipped with high efficiency public street and area lighting that will reduce energy requirements for lighting by 5 percent.
CalEEMod model reductions
CalEEMod Model
LED Traffic Lights Traffic lights installed by the project will be LED traffic lights.
Because the reduction in GHGs is not quanitifiable, no additional reductions were taken.
Programmable Thermostat Timers
The project will include installation of programmable thermostat timers in all buildings.
Because the reduction in GHGs is not quanitifiable, no additional reductions were taken.
Water Conservation Low Flow Fixtures Indoor plumbing would include low flow
fixtures as required by Title 24 building codes in effect at the time of construction.
CalEEMod model reductions
CalEEMod Model
Water-Efficient Irrigation Systems
The project will install water-efficient irrigation systems that meet at least 6.1% reduction in outdoor water use.
CalEEMod model reductions
CalEEMod Model
Plant Native or Drought-Resistant Trees and Vegetation
All public areas will be planted with native or drought-resistant trees and vegetation.
Because the reduction in GHGs is not quanitifiable, no additional reductions were taken.
Water-Efficient Landscapes
The project will be designed to use water-efficient landscapes.
Because the reduction in GHGs is not quanitifiable, no additional

Global Climate Change Evaluation 40 02/03/17 East Otay Mesa Specific Plan Amendment
Table 8 Proposed Project Design Features to Reduce GHG Emissions
Strategy to Reduce GHG Emissions
Description Emission Reduction
Basis for Emission Reduction
reductions were taken.
Building and Site Design California 2013 Title 24 Building Energy Efficiency Standards
All buildings would be designed to meet the California 2013 Title 24 Building Energy Efficiency Standards at a minimum. By the time buildings are constructed, it is likely that updated, more stringent energy efficiency standards will be adopted.
CalEEMod 2016.3.1 includes Title 24 as of 2013
CalEEMod Model
Fireplaces The residences will be constructed either with no fireplace or with natural gas fireplaces. 1,000 of the units will include natural gas fireplaces, with the remaining 2,158 units to be constructed without fireplaces
CalEEMod Model reductions
CalEEMod Model
Use Electric Landscaping Equipment.
Landscaping will use electric equipment; it is assumed that 3% of equipment would be electrically powered based on statewide average use of 3%.
CalEEMod model reductions
CalEEMod Model
Solid Waste Diversion The project would include solid waste diversion practices in accordance with AB 341, which requires 75% solid waste diversion by 2030. Current solid waste diversion rates of 52.6% for multifamily dwellings and 50% for non-residential uses were assumed in the analysis.
75% diversion rates resulting in associated GHG emissions reductions
AB 341 requirements
To account for the inclusion of a mix of uses at the site, the Traffic Impact Analysis assumed a
reduction in trips of 10%. This reduction was not included in the GHG analysis. The CalEEMod
Model assumes some reductions in VMT for internal trips; however, according to the CAPCOA
guidance document, Quantifying Greenhouse Gas Reductions from Mitigation Measures
(CAPCOA 2010), under GHG Reduction Measure LUT-3, the reduction in vehicles miles traveled
(VMT) associated with a mix of uses at the site can be calculated using the Land Use Index
approach. The Land Use Index provides a means of estimating the reductions anticipated due to
the mix of uses. The Land Use Index calculation for this project is provided in Appendix A. For
the East Otay Mesa Specific Plan Amendment, the mix of uses at the site would result in a
reduction in VMT of 15.04%.

Global Climate Change Evaluation 41 02/03/17 East Otay Mesa Specific Plan Amendment
The results of the GHG inventory for buildout emissions (2028) with implementation of GHG
reduction measures are presented in Table 9.
The site residential service population was calculated based on the SANDAG population
projections for residential population in the Otay Subregional Plan Area for 2030, for an average
of 2.87 residents per dwelling unit for a total of 9,063 residents. The occupational service
population was calculated based on the City of San Diego’s Jobs-Housing Nexus Study (Keyser
Marston 2013). While the analysis evaluated jobs and housing within the City of San Diego, it
represents the most recent regional date on employment by land use. Based on the Keyser
Marston study, Research and Development/Manufacturing/Industrial land uses such as that
proposed for the Technology Park portion of the project would generate 1 job per 500 square feet
for a total of 1,530 jobs. Retail uses would generate 1 job per 350 square feet for a total of 223
jobs. No data were available for employees for the park uses; therefore, park employees were not
considered in the service population calculation. The total service population for the East Otay
Mesa Specific Plan Amendment is 10, 816.
The project has been evaluated on the basis of a buildout year of 2028 efficiency metric of 3.0
metric tons per service population. As shown in Table 9, the project would not meet this
efficiency metric and would emit 3.5 metric tons per service population. GHG impacts would
therefore be significant.

Global Climate Change Evaluation 42 02/03/17 East Otay Mesa Specific Plan Amendment
Table 9 SUMMARY OF PROPOSED PROJECT’S
ESTIMATED GREENHOUSE GAS EMISSIONS WITH PROJECT DESIGN FEATURES – BUILDOUT 2028
Emission Source Annual Emissions (Metric tons/year)
CO2 CH4 N2O CO2e Operational Emissions
Area Sources 326 0.0417 0.0053 329 Electricity Use 4,463 0.1858 0.0372 4,478 Natural Gas Use 3,075 0.0589 0.0564 3,092 Water Consumption 987 10.1619 0.2463 1,337 Solid Waste Handling 245 14.4607 0.0000 650 Vehicles 26,730 1.3084 0.0000 26,767 Amortized Construction 874 0.0000 0.0000 874 Amortized Land Use Change 28 0.0000 0.0000 28 Total 36,728 26.2174 0.40.3452 37,554 Global Warming Potential Factor 1 28 265 CO2 Equivalent Emissions 36,728 734 92 37,554 TOTAL CO2 Equivalent Emissions
37,554
Service Population 10,816 Metric Tons per Service Population
3.5
Project Efficiency Metric
3.0

Global Climate Change Evaluation 43 02/03/17 East Otay Mesa Specific Plan Amendment
5.0 SUMMARY OF PROJECT DESIGN FEATURES AND MITIGATION
MEASURES
As stated in the introduction, each phase of the project would be required to undergo a site plan
review, and at that time, may be required to demonstrate that each site plan’s emissions would
meet the County’s GHG requirements. At this time, the analysis demonstrates that reductions
would not meet the efficiency metric of 3.0 metric tons per service population in 2028. This
impact is significant.
Because the project would result in a significant impact, the following mitigation measures are
proposed to reduce the potential for GHG impacts:
Energy Efficiency
Mitigation Measure GHG-1: Exceed Title 24 Building Energy Efficiency Standards. The
project buildings will exceed Title 24 as of 2016 by 20%. This measure was included in the
mitigation measures in the CalEEMod Model.
Mitigation Measure GHG-2: Provide Solar Power. The project will include photovoltaic
solar panels or their equivalent, as approved by the Development Services Director) designed to
provide 50% of the project’s commercial use electricity needs, and 50% of the residential
dwelling units shall include photovoltaic solar panels (or their equivalent, as approved by the
Development Services Director) to provide those residential dwelling units’ electricity needs.
This measure was included in the CalEEMod model under Renewable Energy.
Table 10 presents the results of the GHG calculations with mitigation measures included as
described above. As shown in table 10, with mitigation, the project would meet the efficiency
metric of 3.0 metric tons perservice population. The GHG efficiency of the project would
therefore meet the efficiency metric of 3.0 metric tons per service population, and GHG impacts
would be less than significant.
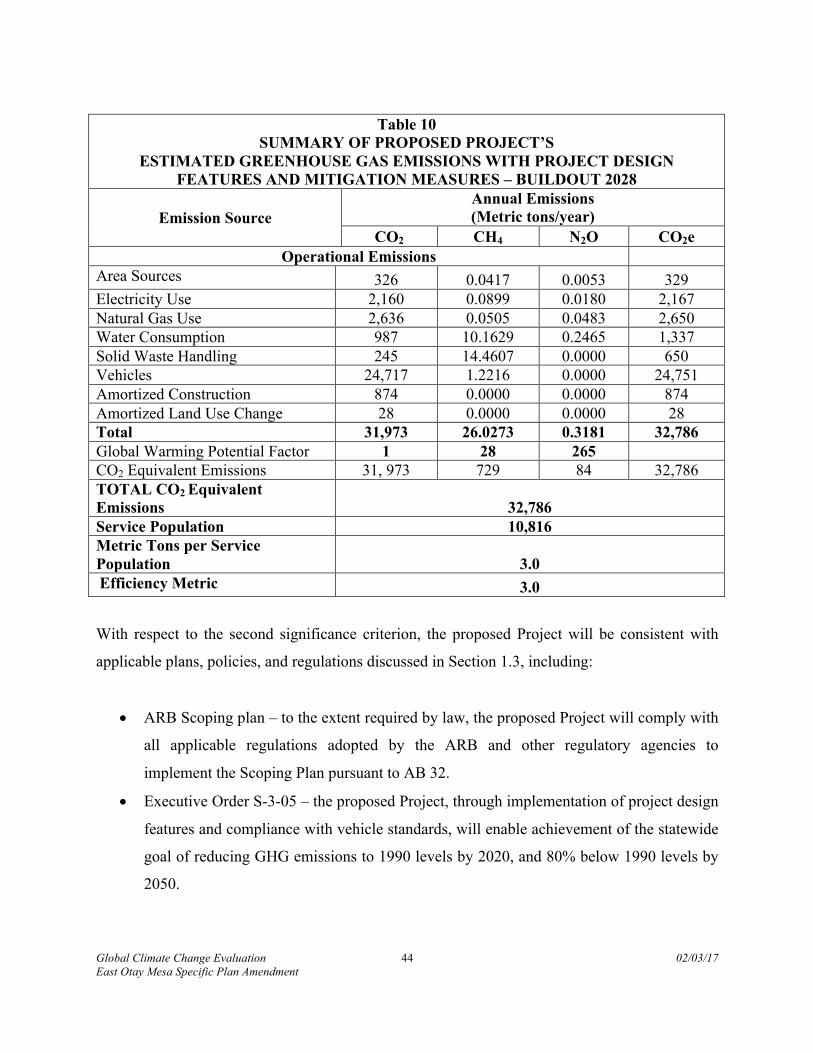
Global Climate Change Evaluation 44 02/03/17 East Otay Mesa Specific Plan Amendment
Table 10
SUMMARY OF PROPOSED PROJECT’S ESTIMATED GREENHOUSE GAS EMISSIONS WITH PROJECT DESIGN
FEATURES AND MITIGATION MEASURES – BUILDOUT 2028
Emission Source Annual Emissions (Metric tons/year)
CO2 CH4 N2O CO2e Operational Emissions
Area Sources 326 0.0417 0.0053 329 Electricity Use 2,160 0.0899 0.0180 2,167 Natural Gas Use 2,636 0.0505 0.0483 2,650 Water Consumption 987 10.1629 0.2465 1,337 Solid Waste Handling 245 14.4607 0.0000 650 Vehicles 24,717 1.2216 0.0000 24,751 Amortized Construction 874 0.0000 0.0000 874 Amortized Land Use Change 28 0.0000 0.0000 28 Total 31,973 26.0273 0.3181 32,786 Global Warming Potential Factor 1 28 265 CO2 Equivalent Emissions 31, 973 729 84 32,786 TOTAL CO2 Equivalent Emissions 32,786 Service Population 10,816 Metric Tons per Service Population 3.0 Efficiency Metric 3.0
With respect to the second significance criterion, the proposed Project will be consistent with
applicable plans, policies, and regulations discussed in Section 1.3, including:
• ARB Scoping plan – to the extent required by law, the proposed Project will comply with
all applicable regulations adopted by the ARB and other regulatory agencies to
implement the Scoping Plan pursuant to AB 32.
• Executive Order S-3-05 – the proposed Project, through implementation of project design
features and compliance with vehicle standards, will enable achievement of the statewide
goal of reducing GHG emissions to 1990 levels by 2020, and 80% below 1990 levels by
2050.

Global Climate Change Evaluation 45 02/03/17 East Otay Mesa Specific Plan Amendment
• Executive Order B-30-15 – the proposed Project would achieve substantial progress toward
meeting the targets of Executive Order B-30-15 and S-3-05 for milestone years 2030 and
2050 by further reducing GHG emissions from the Project site.
• Executive Order S-21-09 – the proposed Project will purchase power from San Diego Gas
and Electric, which is developing its renewable portfolio standard in accordance with state
mandates.
• California Code of Regulations Title 24 – the proposed Project will comply with the then-
applicable Title 24 standards, thereby demonstrating a commitment to the energy efficient
design, construction and operation of residential and non-residential structures.
• State Vehicle Standards – vehicles operating within the proposed Project will meet Pavley
and LCFS standards to the extent required by law.
• Senate Bill 375 – the proposed Project is part of a master-planned community that provides
a mix of uses serving the community, consistent with the general objectives of SB 375, as
discussed below.
• County General Plan Policies: Policy COS-14.1 (Land Use Development), Policy COS-
14.2 (Villages and Rural Villages), Policy COS-14.3 (Sustainable Development), Policy
COS-15.1 (Design and Construction of New Buildings), COS-15.4 (Title 24 Energy
Standards), and COS-19.1 (Sustainable Water Supply – Sustainable Development
Practices).
SANDAG’s inclusion of the proposed land use development on the Project site in the Sustainable
Communities Strategy’s forecasted development pattern for the region (see Gov. Code,
§65080(b)(2)(B)(vii)) is consistent with the fact that SANDAG was required to utilize the “most
recent planning assumptions considering local general plans and other factors” when preparing the
Sustainable Communities Strategy (Gov. Code, §65080(b)(2)(B)). Here, the Otay 250 – Sunroad
East Otay Mesa Business Park Specific Plan Amendment project (i.e., the proposed Project) is part
of the Otay Subregional Plan, as adopted in 2011. The County and other regional planning agencies
(i.e., SANDAG) have been anticipating development on the Project site since that time.

Global Climate Change Evaluation 46 02/03/17 East Otay Mesa Specific Plan Amendment
Additionally, for purposes of SB 375’s underlying policy goals, it is important to recognize that
the proposed Project is part of the planned and approved East Otay Mesa Business Park Specific
Plan community, which contains a mix of residential, commercial, civic, recreational, and public
facilities, all of which – when viewed from an integrated perspective – reduce the amount of
vehicle miles traveled and corresponding GHG emissions. The proposed Project would further
reduce the amount of vehicle miles traveled by incorporating into the Specific Plan an increase in
residential units at high densities mixed with supporting retail and employment uses, adding to
what was previously a primarily light industrial/technology center to create a Village setting.
In addition to being part of a larger Specific Plan area, the proposed Project itself contributes a
more integrated and balanced mix of uses, including community-serving commercial, light
industrial employment uses, a 50.3-acre open space preserve, and trail amenities. The Project’s
mix of uses allows for the Project to internally capture approximately 15.04 percent of all vehicle
trips (i.e., these trips remain within the boundaries of the Project site). Further, the Project’s mix
of land uses, including residential in conjunction with the retail and employment, is coupled with
an integrated pathway and trail plan and traffic calming features along internal streets and roads
that promote a pedestrian experience for the Project’s residents and visitors and facilitate non-
vehicular travel, consistent with SB 375.
The Project will be consistent with the County’s General Plan policies that are designed to
reduce GHG emissions through implementation of the measures identified above.
The proposed Project would be consistent with the targets of Executive Order B-30-15 and SB
32 because it would meet the efficiency metric for GHGs with mitigation measures implemented.
Impacts would therefore be less than significant.

Global Climate Change Evaluation 47 02/03/17 East Otay Mesa Specific Plan Amendment
6.0 COMPARISON WITH EXISTING ENTITLEMENT If constructed as currently approved, the East Otay Mesa Specific Plan Area’s existing
entitlement would result in emissions of GHGs. The existing entitlement includes 27.37 acres of
approved commercial uses (383,180 square feet) and 130.18 acres of approved technology park
uses (1,562,200 square feet). The service population is based on the employment of the existing
entitlement and was calculated as 4,219.
Table 11 presents a summary of the emissions from the existing entitlement and the existing
entitlement’s efficiency, assuming buildout in 2028.
Table 11
SUMMARY OF EXISTING ENTITLEMENT’S ESTIMATED GREENHOUSE GAS EMISSIONS WITH PROJECT DESIGN
FEATURES AND MITIGATION MEASURES – BUILDOUT 2028
Emission Source Annual Emissions (Metric tons/year)
CO2 CH4 N2O CO2e Operational Emissions
Area Sources 0.0343 0.0001 0.0000 0 Electricity Use 4,320 0.1799 0.0360 4,750 Natural Gas Use 1,736 0.0333 0.0318 1,568 Water Consumption 792 10.1860 0.2456 1,206 Solid Waste Handling 237 14.0326 0.0000 315 Vehicles 19,881 1.0089 0 19,909 Amortized Construction 622 0.0000 0.0000 622 Amortized Land Use Change 28 0.0000 0.0000 28 Total 27,615 25.4408 0.3134 28,411 Global Warming Potential Factor 1 28 265 CO2 Equivalent Emissions 27,615 712 83 28,411 TOTAL CO2 Equivalent Emissions 28,411 Service Population 4,219 Metric Tons per Service Population 6.7 Project Efficiency Metric 3.0
Global Climate Change Evaluation 48 02/03/17 East Otay Mesa Specific Plan Amendment
As shown in Table 11, the CO2e per service population of the existing entitlement is far higher
than the CO2e per service population of the proposed project. The proposed project includes a
mix of uses and would also site residential uses in an area that is an employment center, reducing
VMT within the Otay Mesa area. Therefore, the project represents an increase in efficiency
relative to GHG emissions per service population over the existing entitlement.

Global Climate Change Evaluation 49 02/03/17 East Otay Mesa Specific Plan Amendment
7.0 CONCLUSIONS
Emissions of GHGs would result in a net increase in emissions from construction and operations.
As discussed in Section 5.0, however, emissions would exceed the 2028 efficiency metric of 3.0
metric tons CO2e per service population. The project would implement Mitigation Measures
GHG-1 and GHG-2 to reduce GHG emissions to the extent feasible. With mitigation, the
project’s GHG efficiency would meet the 2028 efficiency metric of 3.0 metric tons CO2e per
service population. Therefore, the project would not generate GHG emissions that may have a
significant impact on the environment.
Because the proposed Project is consistent with the applicable plans, policies, and regulations
adopted for regulations of GHG emissions, the Project would not:
• Conflict with an applicable plan, policy, or regulation adopted for the purpose of
reducing the emissions of greenhouse gases.
Because the project would meet the efficiency metric of 3.0 metric tons of CO2e per service
population, the project would be consistent with the goals of Executive Order B-30-15 and SB32
that requires the state to reduce its GHG emission to 40% below 1990 levels by 2030. This
impact is less than significant.

Global Climate Change Evaluation 50 02/03/17 East Otay Mesa Specific Plan Amendment
8.0 REFERENCES Architectural Energy Corporation. 2007. 2008 Update to the California Energy Efficiency
Standards for Residential and Nonresidential Buildings. Prepared for the California Energy Commission. November 7.
Association of Environmental Professionals. 2007. Recommendations by the Association of
Environmental Professionals (AEP) on How to Analyze Greenhouse Gas Emissions and Global Climate Change in CEQA Documents. June.
California Air Pollution Control Officers Association. 2008. CEQA and Climate Change –
Evaluating and Addressing Greenhouse Gas Emissions from Projects Subject to the California Environmental Quality Act. January.
California Air Pollution Control Officers Association. 2010. Quantifying Greenhouse Gas
Mitigaiton Measures. August. California Air Resources Board. 2008. Climate Change Scoping Plan. December California Air Resources Board. 2008b. Comparison of Greenhouse Gas Reductions for the
United States and Canada under U.S. CAFE Standards and California Air Resources Board Greenhouse Gas Regulations. Table 4. February 25.
California Air Resources Board. 2010. Greenhouse Gas Inventory – 2020 Forecast.
http://www.arb.ca.gov/cc/inventory/data/forecast.htm. California Air Resources Board. 2010. Draft Regional Greenhouse Gas Emission Reduction
Targets For Automobiles And Light Trucks Pursuant To Senate Bill 375. June 30. California Air Resources Board. 2011a. Supplement to the Climate Change Scoping Plan
Functional Equivalent Document. December California Air Resources Board. 2011b. Staff Report: Initial Statement of Reasons for Proposed
Rulemaking, Public Hearing to Consider the “LEV III” Amendments to the California Greenhouse Gas and Criteria Pollutant Exhaust and Evaporative Emission Standards and Test Procedures and to the On-Board Diagnostic System Requirements for Passenger Cars, Light-Duty Trucks, and Medium-Duty Vehicles, and to the Evaporative Emission Requirements for Heavy-Duty Vehicles. December 7.
California Air Resources Board. 2014. First Update to the Climate Change Scoping Plan. California Air Resources Board. 2015. California Greenhouse Gas Inventory for 2000-2013.
June.

Global Climate Change Evaluation 51 02/03/17 East Otay Mesa Specific Plan Amendment
California Building Officials. 2012. CALBO Model Green Building Ordinance. http://www.calbo.org/consumer/Resources/modelgreenbuilding.aspx.
California Climate Action Registry General Reporting Protocol, Version 3.1. 2009.January. California Climate Change Center (CCCC). 2006. Our Changing Climate, Assessing the Risks to
California: A Summary Report from the California Climate Change Center. July. California Coastal Commission (CCC). 2006. Discussion Draft – Global Warming and the
California Coastal Commission. December 12. California Energy Commission. 2013. Impact Analysis – California’s 2013 Building Energy
Efficiency Standards. July. California Energy Commission. 2013. Inventory of California Greenhouse Gas Emissions and
Sinks: 1990 to 2012. California Energy Commission. 2007. The Role of Land Use in Meeting California’s Energy and
Climate Change Goals. CEC-600-2007-008-SD. June. California Energy Commission. 2012. Building Energy Efficiency Standards.
http://www.energy.ca.gov/title24/2013standards/rulemaking/documents/2013_Building_Energy_Efficiency_Standards_FAQ.pdf.
County of San Diego. 2010. General Plan Update.
http://www.sdcounty.ca.gov/dplu/gpupdate/bos_oct2010.html. County of San Diego. 2014. Telephone communication regarding solid waste GHG reductions,
December.
Keyser Marston Associates, Inc. 2013. Jobs-Housing Nexus Study. August.
Linscott, Law, and Greenspan. 2016. Traffic Impact Analysis – East Otay Mesa Specific Plan Amendment. August.
South Coast Air Quality Management District. 2008. Interim CEQA GHG Significance Threshold for Stationary Sources, Rules and Plans. December 5.
South Coast Air Quality Management District. 2010. Minutes for the GHG CEQA Significance Threshold Stakeholder Working Group #15. September 28.
South Coast Air Quality Management District. 2016. CalEEMod Model, Version 2016.3.1. United Nations Framework Convention on Climate Change. 2006. Greenhouse Gas Emissions
Data, Predefined Queries, Annex I Parties – GHG total without LULUCF (land-use, land-

Global Climate Change Evaluation 52 02/03/17 East Otay Mesa Specific Plan Amendment
use change and forestry). http://unfccc.int/ghg_emissions_data/predefined_queries/items/3841.php.
U.S. EPA. 2006. The U.S. Inventory of Greenhouse Gas Emissions and Sinks: Fast
Facts.www.epa.gov/climatechange/emissions/downloads06/06FastFacts.pdf. University of San Diego. 2008. San Diego County Greenhouse Gas Inventory. September.

Global Climate Change Evaluation 53 02/03/17 East Otay Mesa Specific Plan Amendment
9.0 LIST OF PREPARERS, PERSONS AND ORGANIZATIONS CONTACTED Preparer: Valorie L. Thompson, Ph.D. Scientific Resources Associated 1328 Kaimalino Lane San Diego, CA 92109 (858) 488-2987 Contacts: Department of Planning and Development Services 5510 Overland Avenue San Diego, CA 92123

Global Climate Change Evaluation 02/03/17 East Otay Mesa Specific Plan Amendment
Appendix A
Greenhouse Gas Emission Calculations
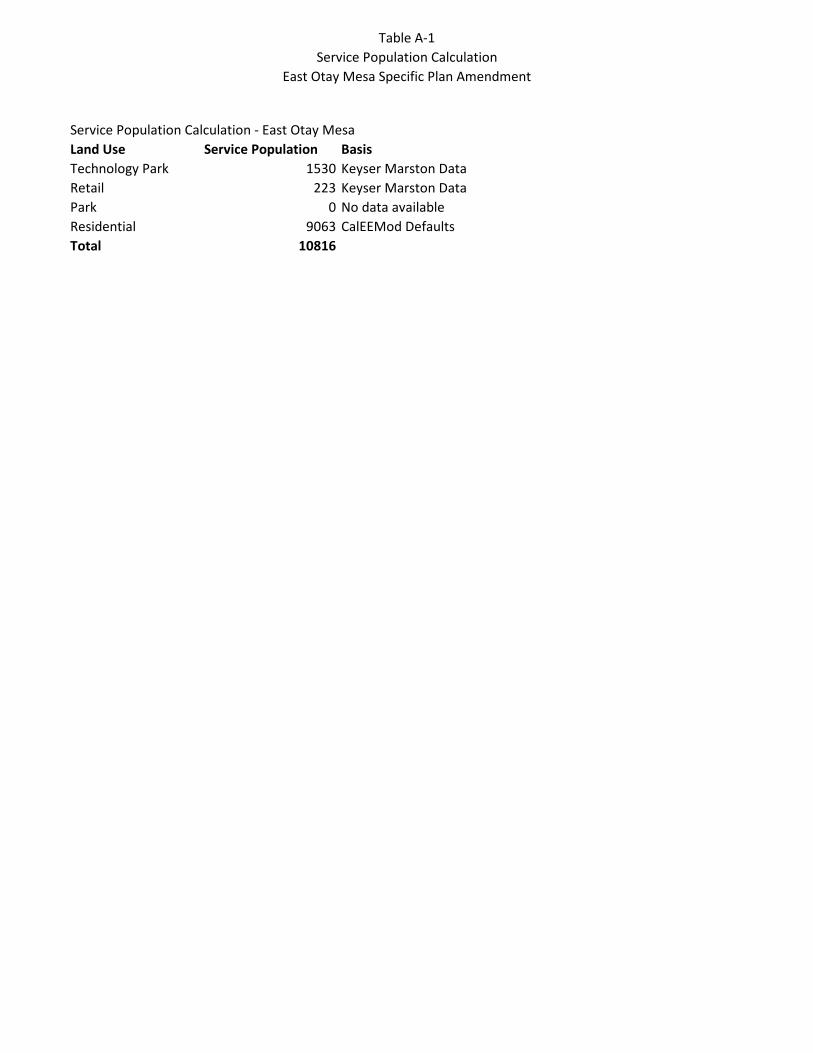
Table A-1Service Population Calculation
East Otay Mesa Specific Plan Amendment
Service Population Calculation - East Otay MesaLand Use Service Population BasisTechnology Park 1530 Keyser Marston DataRetail 223 Keyser Marston DataPark 0 No data availableResidential 9063 CalEEMod DefaultsTotal 10816

Table A-2Calculation of Land Use Index
Mixed Uses
A-2
Category Land Use Type Number Acres Square FeetResidential Condo/Townhouse 3158 Dwelling Unit 124.4 3158000Industrial Industrial Park 765 1000sqft 47.72 765000Retail Regional Shopping Cen 68 1000sqft 6.8 68000Retail Strip Mall 10 1000sqft 1 10000Total 4001000
Land Use Type Symbol Value LNValue ai x LN(ai)Single Family a1 0.01 -4.605170186 -0.04605Multifamily a2 0.789303 -0.236605414 -0.18675Commercial a3 0.019495 -3.937590782 -0.07676Industrial a4 0.191202 -1.654423775 -0.31633Institutional a5 0.01 -4.605170186 -0.04605Park a6 0.01 -4.605170186 -0.04605
Calculation of Land Use Indexa -0.718-a/LN(6) 0.400724(land use index - .15)/.15 1.671496
Land Use Index 0.150435

Solid Waste Generation and Diversion Rate Calculation
Based on information in the CalRecycle database for unincorporated San Diego County for the year 2015 (included as Attachment A), multi-family dwelling units generate a total of 30,158 tons per year. With a total of 34,495 occupied units, the average solid waste generation rate is 0.8742 tons per unit per year.
The CalEEMod default waste disposal rate for multi-family units is based on a waste generation rate of 0.46 tons per unit per year. Thus the CalEEMod default disposal rates would assume that within the unincorporated County, the waste diversion rate that is accounted for within the CalEEMod model is calculated to be approximately 52.6% based on County-specific data.
The CalRecycle database does not provide information on solid waste generation rates based on square footage in the same manner that CalEEMod calculates variables. Within the unincorporated County, the current solid waste diversion rate for non-residential uses is 34.2%, based on a comparison of waste generation and waste disposal rates. For conservative purposes, this was assumed to be 50%.
To account for a 75% solid waste diversion rate, which will be achieved within the County by the buildout year of 2028, the unmitigated solid waste disposal rates and associated GHG emissions were reduced as follows: to reduce non-residential disposal rates from 50% to 25%, the additional diversion rate would be 50%.
To reduce multi-family residential disposal rates from 0.46 tons per residence per year to 25% of 0.8742 tons per residence per year, the reduction would be as follows:
0.8742 x .25 = 0.21855 tons per residence per year at 75% diversion rate
0.46 tons per residence per year x .4751 = 0.21855 tons per residence per year
Therefore, to reduce residential disposal rates from 52.6% to 25%, the additional diversion rate wold be 47.51%.
Table A presents a summary of the GHG emissions for the unmitigated and mitigated case for the East Otay Mesa Specific Plan Area.
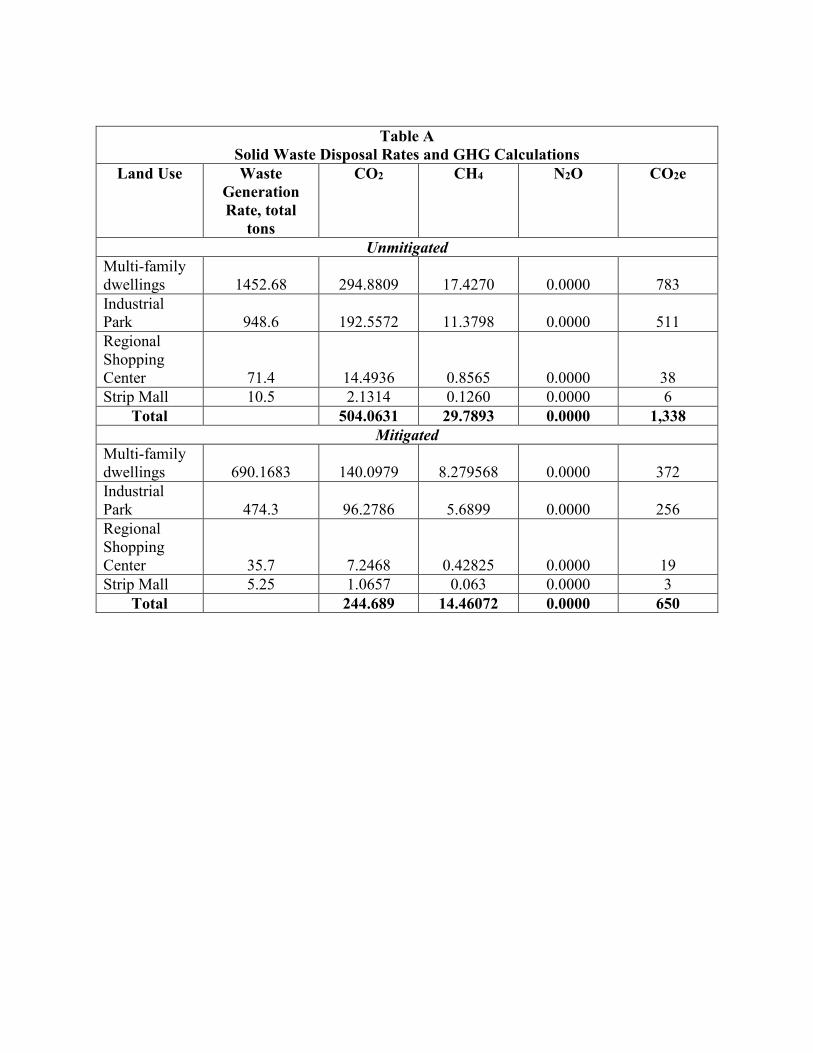
Table A Solid Waste Disposal Rates and GHG Calculations
Land Use Waste Generation Rate, total
tons
CO2 CH4 N2O CO2e
Unmitigated Multi-family dwellings 1452.68 294.8809 17.4270 0.0000 783 Industrial Park 948.6 192.5572 11.3798 0.0000 511 Regional Shopping Center 71.4 14.4936 0.8565 0.0000 38 Strip Mall 10.5 2.1314 0.1260 0.0000 6
Total 504.0631 29.7893 0.0000 1,338 Mitigated
Multi-family dwellings 690.1683 140.0979 8.279568 0.0000 372 Industrial Park 474.3 96.2786 5.6899 0.0000 256 Regional Shopping Center 35.7 7.2468 0.42825 0.0000 19 Strip Mall 5.25 1.0657 0.063 0.0000 3
Total 244.689 14.46072 0.0000 650

Business Group Jurisdiction(s) Material TypeEmployee Count
Occupied Multifamily Units
TPEPY Disposed
Tons Disposed
Tons Total Generation
Percent of Total Generation
Multifamily San Diego County (Unincorporated) All Material Types 0 34,495 0.00 25,508 30,158 19.2%Arts, Entertainment, & Recreation San Diego County (Unincorporated) All Material Types 11,213 0 1.94 21,767 25,808 16.4%Services - Professional, Technical, & Financial San Diego County (Unincorporated) All Material Types 7,919 0 1.61 12,757 16,036 10.2%Retail Trade - Food & Beverage Stores San Diego County (Unincorporated) All Material Types 2,441 0 0.94 2,294 12,412 7.9%Restaurants San Diego County (Unincorporated) All Material Types 6,215 0 1.57 9,769 11,945 7.6%Services - Management, Administrative, Support, & Social San Diego County (Unincorporated) All Material Types 8,152 0 0.60 4,896 9,622 6.1%Retail Trade - All Other San Diego County (Unincorporated) All Material Types 4,651 0 1.74 8,089 9,113 5.8%Not Elsewhere Classified San Diego County (Unincorporated) All Material Types 8,188 0 0.46 3,799 8,961 5.7%Hotels & Lodging San Diego County (Unincorporated) All Material Types 3,685 0 1.40 5,175 6,503 4.1%Durable Wholesale & Trucking San Diego County (Unincorporated) All Material Types 2,120 0 0.57 1,212 6,168 3.9%Education San Diego County (Unincorporated) All Material Types 8,361 0 0.38 3,209 3,762 2.4%Medical & Health San Diego County (Unincorporated) All Material Types 5,821 0 0.57 3,318 3,642 2.3%Manufacturing - All Other San Diego County (Unincorporated) All Material Types 2,156 0 0.44 942 3,169 2.0%Services - Repair & Personal San Diego County (Unincorporated) All Material Types 2,194 0 0.85 1,866 2,980 1.9%Manufacturing - Food & Nondurable Wholesale San Diego County (Unincorporated) All Material Types 1,422 0 1.23 1,750 2,540 1.6%Manufacturing -Electronic Equipment San Diego County (Unincorporated) All Material Types 3,177 0 0.31 994 2,367 1.5%Public Administration San Diego County (Unincorporated) All Material Types 6,096 0 0.30 1,848 2,226 1.4%
Diversion RatMultifamily Total per Unit 0.7395 0.8742 15.4%Non-Residential Total all categories 83,684 127,255 34.2%

tblAreaMitigation UseLowVOCPaintNonresidentialExteriorValue
250 0
tblAreaCoating Area_Residential_Exterior 2131650 0
tblAreaCoating Area_Residential_Interior 6394950 0
tblAreaCoating Area_Nonresidential_Exterior 302305 0
tblAreaCoating Area_Nonresidential_Interior 906915 0
1.3 User Entered Comments & Non-Default Data
Table Name Column Name Default Value New Value
tblAreaCoating Area_EF_Parking 250 0
CO2 Intensity (lb/MWhr)
619.62 CH4 Intensity (lb/MWhr)
0.025 N2O Intensity (lb/MWhr)
0.005
40
Climate Zone 13 Operational Year 2020
Utility Company San Diego Gas & Electric
1.2 Other Project Characteristics
Urbanization Urban Wind Speed (m/s) 2.6 Precipitation Freq (Days)
Strip Mall 10.89 1000sqft 1.00 10,890.00 0
Regional Shopping Center 74.05 1000sqft 6.80 74,050.00 0
Condo/Townhouse 3,158.00 Dwelling Unit 124.40 3,158,000.00 9032
Floor Surface Area Population
Industrial Park 519.67 1000sqft 47.72 519,670.00 0
1.0 Project Characteristics
1.1 Land Usage
Land Uses Size Metric Lot Acreage
CalEEMod Version: CalEEMod.2016.3.1 Page 1 of 1 Date: 10/24/2016 3:54 PM
East Otay Mesa Specific Plan Amendment - San Diego Air Basin, Annual
East Otay Mesa Specific Plan AmendmentSan Diego Air Basin, Annual

2.0 Emissions Summary
2.1 Overall Construction
tblTripsAndVMT HaulingTripLength 20.00 0.50
tblTripsAndVMT WorkerTripNumber 43.00 20.00
tblProjectCharacteristics N2OIntensityFactor 0.006 0.005
tblProjectCharacteristics OperationalYear 2018 2020
tblProjectCharacteristics CH4IntensityFactor 0.029 0.025
tblProjectCharacteristics CO2IntensityFactor 720.49 619.62
tblOffRoadEquipment OffRoadEquipmentUnitAmount 2.00 4.00
tblOffRoadEquipment OffRoadEquipmentUnitAmount 2.00 4.00
tblOffRoadEquipment OffRoadEquipmentUnitAmount 1.00 2.00
tblOffRoadEquipment OffRoadEquipmentUnitAmount 1.00 3.00
tblOffRoadEquipment HorsePower 367.00 361.00
tblOffRoadEquipment OffRoadEquipmentUnitAmount 2.00 4.00
tblOffRoadEquipment HorsePower 247.00 255.00
tblOffRoadEquipment HorsePower 247.00 255.00
tblOffRoadEquipment HorsePower 158.00 162.00
tblOffRoadEquipment HorsePower 187.00 174.00
tblLandUse LotAcreage 1.70 6.80
tblLandUse LotAcreage 0.25 1.00
tblLandUse LotAcreage 11.93 47.72
tblLandUse LotAcreage 197.38 124.40
tblGrading AcresOfGrading 0.00 180.00
tblGrading MaterialImported 0.00 1,350,000.00
tblConstDustMitigation WaterUnpavedRoadVehicleSpeed 40 15
tblGrading AcresOfGrading 1,550.00 180.00
tblAreaMitigation UseLowVOCPaintResidentialExteriorValue
250 0
tblAreaMitigation UseLowVOCPaintResidentialInteriorValue
250 0
tblAreaMitigation UseLowVOCPaintNonresidentialInteriorValue
250 0

2 1-24-2017 4-23-2017 7.2034 7.2034
3 4-24-2017 7-23-2017 7.4152 7.4152
Quarter Start Date End Date Maximum Unmitigated ROG + NOX (tons/quarter) Maximum Mitigated ROG + NOX (tons/quarter)
1 10-24-2016 1-23-2017 7.6746 7.6746
0.00 0.00 0.00 0.00 0.00 0.0060.17 0.00 50.68 60.58 0.00 45.46
NBio-CO2 Total CO2 CH4 N20 CO2e
Percent Reduction
0.00 0.00 0.00 0.00
Exhaust PM10
PM10 Total
Fugitive PM2.5
Exhaust PM2.5
PM2.5 Total
Bio- CO2ROG NOx CO SO2 Fugitive PM10
0.0000 1,574.4286
1,574.4286 0.4331 0.0000 1,585.1831
1.6783 0.7380 2.4162 0.8601 0.6793 1.5394Maximum 1.4372 19.1359 11.0614 0.0167
0.0000 1,574.4286
1,574.4286 0.4302 0.0000 1,585.1831
1.2128 0.6209 1.8337 0.6223 0.5715 1.19382017 1.2621 17.9527 9.7021 0.0167
0.0000 1,543.6735
1,543.6735 0.4331 0.0000 1,554.5002
1.6783 0.7380 2.4162 0.8601 0.6793 1.53942016 1.4372 19.1359 11.0614 0.0162
Total CO2 CH4 N2O CO2e
Year tons/yr MT/yr
PM10 Total
Fugitive PM2.5
Exhaust PM2.5
PM2.5 Total
Bio- CO2 NBio- CO2
Mitigated Construction
ROG NOx CO SO2 Fugitive PM10
Exhaust PM10
0.0000 1,574.4298
1,574.4298 0.4331 0.0000 1,585.1844
4.2220 0.7380 4.9599 2.1838 0.6793 2.8631Maximum 1.4372 19.1360 11.0614 0.0167
0.0000 1,574.4298
1,574.4298 0.4302 0.0000 1,585.1844
3.0371 0.6209 3.6580 1.5763 0.5715 2.14782017 1.2621 17.9528 9.7021 0.0167
0.0000 1,543.6748
1,543.6748 0.4331 0.0000 1,554.5015
4.2220 0.7380 4.9599 2.1838 0.6793 2.86312016 1.4372 19.1360 11.0614 0.0162
NBio- CO2 Total CO2 CH4 N2O CO2e
Year tons/yr MT/yr
Exhaust PM10
PM10 Total
Fugitive PM2.5
Exhaust PM2.5
PM2.5 Total
Bio- CO2
Unmitigated Construction
ROG NOx CO SO2 Fugitive PM10

0.0000 26,904.0868
26,904.0868
1.4782 0.0000 26,941.0423
24.2221 0.2947 24.5168 6.4870 0.2765 6.7636Mobile 7.7273 34.2094 90.8546 0.2922
0.0000 10,535.1222
10,535.1222
0.3519 0.1205 10,579.8161
0.2411 0.2411 0.2411 0.2411Energy 0.3489 3.0133 1.5001 0.0190
3,262.0804
1,406.3825
4,668.4629 3.0477 0.2566 4,821.1194
34.4243 34.4243 34.4243 34.4243Area 213.5643 4.1419 268.1298 0.4444
Total CO2 CH4 N2O CO2e
Category tons/yr MT/yr
PM10 Total
Fugitive PM2.5
Exhaust PM2.5
PM2.5 Total
Bio- CO2 NBio- CO2
Mitigated Operational
ROG NOx CO SO2 Fugitive PM10
Exhaust PM10
3,811.2681
40,478.4777
44,289.7458
41.9964 0.6458 45,532.1135
24.2221 34.9601 59.1822 6.4870 34.9419 41.4290Total 221.6405 41.3645 360.4845 0.7556
105.3987 1,632.8862
1,738.2848 10.8913 0.2688 2,090.6673
0.0000 0.0000 0.0000 0.0000Water
443.7890 0.0000 443.7890 26.2272 0.0000 1,099.4684
0.0000 0.0000 0.0000 0.0000Waste
0.0000 26,904.0868
26,904.0868
1.4782 0.0000 26,941.0423
24.2221 0.2947 24.5168 6.4870 0.2765 6.7636Mobile 7.7273 34.2094 90.8546 0.2922
0.0000 10,535.1222
10,535.1222
0.3519 0.1205 10,579.8161
0.2411 0.2411 0.2411 0.2411Energy 0.3489 3.0133 1.5001 0.0190
3,262.0804
1,406.3825
4,668.4629 3.0477 0.2566 4,821.1194
34.4243 34.4243 34.4243 34.4243Area 213.5643 4.1419 268.1298 0.4444
Total CO2 CH4 N2O CO2e
Category tons/yr MT/yr
PM10 Total
Fugitive PM2.5
Exhaust PM2.5
PM2.5 Total
Bio- CO2 NBio- CO2
2.2 Overall OperationalUnmitigated Operational
ROG NOx CO SO2 Fugitive PM10
Exhaust PM10
4 7-24-2017 9-30-2017 2.5261 2.5261
Highest 7.6746 7.6746

Grading Tractors/Loaders/Backhoes 4 8.00 97 0.37
Grading Scrapers 4 8.00 361 0.48
Grading Rubber Tired Dozers 3 8.00 255 0.40
Grading Graders 2 8.00 174 0.41
Grading Excavators 4 8.00 162 0.38
Site Preparation Tractors/Loaders/Backhoes 4 8.00 97 0.37
Load Factor
Site Preparation Rubber Tired Dozers 3 8.00 255 0.40
Acres of Grading (Site Preparation Phase): 180
Acres of Grading (Grading Phase): 180
Acres of Paving: 0
Residential Indoor: 0; Residential Outdoor: 0; Non-Residential Indoor: 0; Non-Residential Outdoor: 0; Striped Parking Area: 0
OffRoad Equipment
Phase Name Offroad Equipment Type Amount Usage Hours Horse Power
120
2 Grading Grading 6/17/2016 8/24/2017 5 310
End Date Num Days Week
Num Days Phase Description
1 Site Preparation Site Preparation 1/1/2016 6/16/2016 5
3.0 Construction Detail
Construction Phase
Phase Number
Phase Name Phase Type Start Date
0.00 0.00 0.00 0.00 0.00 0.000.00 0.00 0.00 0.00 0.00 0.00
NBio-CO2 Total CO2 CH4 N20 CO2e
Percent Reduction
0.00 0.00 0.00 0.00
Exhaust PM10
PM10 Total
Fugitive PM2.5
Exhaust PM2.5
PM2.5 Total
Bio- CO2ROG NOx CO SO2 Fugitive PM10
3,811.2681
40,478.4777
44,289.7458
41.9964 0.6458 45,532.1135
24.2221 34.9601 59.1822 6.4870 34.9419 41.4290Total 221.6405 41.3645 360.4845 0.7556
105.3987 1,632.8862
1,738.2848 10.8913 0.2688 2,090.6673
0.0000 0.0000 0.0000 0.0000Water
443.7890 0.0000 443.7890 26.2272 0.0000 1,099.4684
0.0000 0.0000 0.0000 0.0000Waste

0.0000 0.0000 0.0000 0.0000 0.0000 0.00000.0000 0.0000 0.0000 0.0000 0.0000 0.0000Hauling 0.0000 0.0000 0.0000 0.0000
Total CO2 CH4 N2O CO2e
Category tons/yr MT/yr
PM10 Total
Fugitive PM2.5
Exhaust PM2.5
PM2.5 Total
Bio- CO2 NBio- CO2
Unmitigated Construction Off-Site
ROG NOx CO SO2 Fugitive PM10
Exhaust PM10
0.0000 221.2626 221.2626 0.0667 0.0000 222.93121.1794 0.1763 1.3557 0.6062 0.1622 0.7684Total 0.3046 3.2779 2.4663 2.3400e-003
0.0000 221.2626 221.2626 0.0667 0.0000 222.93120.1763 0.1763 0.1622 0.1622Off-Road 0.3046 3.2779 2.4663 2.3400e-003
0.0000 0.0000 0.0000 0.0000 0.0000 0.00001.1794 0.0000 1.1794 0.6062 0.0000 0.6062
CO2e
Category tons/yr MT/yr
Fugitive Dust
PM2.5 Total
Bio- CO2 NBio- CO2 Total CO2 CH4 N2OSO2 Fugitive PM10
Exhaust PM10
PM10 Total
Fugitive PM2.5
Exhaust PM2.5
3.1 Mitigation Measures Construction
Water Exposed Area
Reduce Vehicle Speed on Unpaved Roads
3.2 Site Preparation - 2016Unmitigated Construction On-Site
ROG NOx CO
10.80 7.30 0.50 LD_Mix HDT_Mix HHDT
7.30 20.00 LD_Mix HDT_Mix HHDT
Grading 17 20.00 0.00 168,750.00
Site Preparation 7 18.00 0.00 0.00 10.80
Worker Trip Length
Vendor Trip Length
Hauling Trip Length
Worker Vehicle Class
Vendor Vehicle Class
Hauling Vehicle Class
Trips and VMT
Phase Name Offroad Equipment Count
Worker Trip Number
Vendor Trip Number
Hauling Trip Number
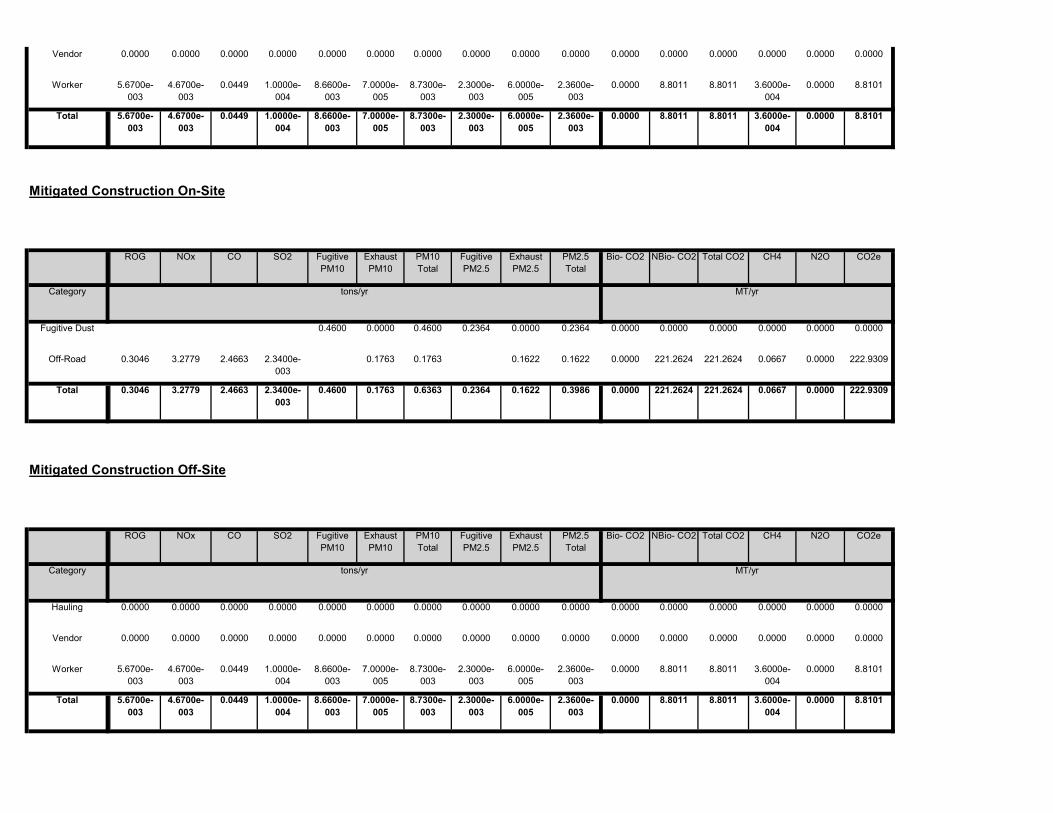
0.0000 8.8011 8.8011 3.6000e-004
0.0000 8.81018.6600e-003
7.0000e-005
8.7300e-003
2.3000e-003
6.0000e-005
2.3600e-003
Total 5.6700e-003
4.6700e-003
0.0449 1.0000e-004
0.0000 8.8011 8.8011 3.6000e-004
0.0000 8.81018.6600e-003
7.0000e-005
8.7300e-003
2.3000e-003
6.0000e-005
2.3600e-003
Worker 5.6700e-003
4.6700e-003
0.0449 1.0000e-004
0.0000 0.0000 0.0000 0.0000 0.0000 0.00000.0000 0.0000 0.0000 0.0000 0.0000 0.0000Vendor 0.0000 0.0000 0.0000 0.0000
0.0000 0.0000 0.0000 0.0000 0.0000 0.00000.0000 0.0000 0.0000 0.0000 0.0000 0.0000Hauling 0.0000 0.0000 0.0000 0.0000
Total CO2 CH4 N2O CO2e
Category tons/yr MT/yr
PM10 Total
Fugitive PM2.5
Exhaust PM2.5
PM2.5 Total
Bio- CO2 NBio- CO2
Mitigated Construction Off-Site
ROG NOx CO SO2 Fugitive PM10
Exhaust PM10
0.0000 221.2624 221.2624 0.0667 0.0000 222.93090.4600 0.1763 0.6363 0.2364 0.1622 0.3986Total 0.3046 3.2779 2.4663 2.3400e-003
0.0000 221.2624 221.2624 0.0667 0.0000 222.93090.1763 0.1763 0.1622 0.1622Off-Road 0.3046 3.2779 2.4663 2.3400e-003
0.0000 0.0000 0.0000 0.0000 0.0000 0.00000.4600 0.0000 0.4600 0.2364 0.0000 0.2364Fugitive Dust
Total CO2 CH4 N2O CO2e
Category tons/yr MT/yr
PM10 Total
Fugitive PM2.5
Exhaust PM2.5
PM2.5 Total
Bio- CO2 NBio- CO2
Mitigated Construction On-Site
ROG NOx CO SO2 Fugitive PM10
Exhaust PM10
0.0000 8.8011 8.8011 3.6000e-004
0.0000 8.81018.6600e-003
7.0000e-005
8.7300e-003
2.3000e-003
6.0000e-005
2.3600e-003
Total 5.6700e-003
4.6700e-003
0.0449 1.0000e-004
0.0000 8.8011 8.8011 3.6000e-004
0.0000 8.81018.6600e-003
7.0000e-005
8.7300e-003
2.3000e-003
6.0000e-005
2.3600e-003
Worker 5.6700e-003
4.6700e-003
0.0449 1.0000e-004
0.0000 0.0000 0.0000 0.0000 0.0000 0.00000.0000 0.0000 0.0000 0.0000 0.0000 0.0000Vendor 0.0000 0.0000 0.0000 0.0000

Total CO2 CH4 N2O CO2ePM10 Total
Fugitive PM2.5
Exhaust PM2.5
PM2.5 Total
Bio- CO2 NBio- CO2
Mitigated Construction On-Site
ROG NOx CO SO2 Fugitive PM10
Exhaust PM10
0.0000 433.9918 433.9918 0.1006 0.0000 436.50800.0433 0.0107 0.0540 0.0114 0.0102 0.0217Total 0.1260 4.3267 0.8826 4.4500e-003
0.0000 11.4903 11.4903 4.7000e-004
0.0000 11.50200.0113 9.0000e-005
0.0114 3.0000e-003
8.0000e-005
3.0900e-003
Worker 7.4000e-003
6.1000e-003
0.0587 1.3000e-004
0.0000 0.0000 0.0000 0.0000 0.0000 0.00000.0000 0.0000 0.0000 0.0000 0.0000 0.0000Vendor 0.0000 0.0000 0.0000 0.0000
0.0000 422.5016 422.5016 0.1002 0.0000 425.00590.0320 0.0106 0.0426 8.4300e-003
0.0101 0.0186Hauling 0.1186 4.3206 0.8239 4.3200e-003
Total CO2 CH4 N2O CO2e
Category tons/yr MT/yr
PM10 Total
Fugitive PM2.5
Exhaust PM2.5
PM2.5 Total
Bio- CO2 NBio- CO2
Unmitigated Construction Off-Site
ROG NOx CO SO2 Fugitive PM10
Exhaust PM10
0.0000 879.6192 879.6192 0.2653 0.0000 886.25242.9906 0.5509 3.5415 1.5639 0.5068 2.0707Total 1.0009 11.5266 7.6676 9.3300e-003
0.0000 879.6192 879.6192 0.2653 0.0000 886.25240.5509 0.5509 0.5068 0.5068Off-Road 1.0009 11.5266 7.6676 9.3300e-003
0.0000 0.0000 0.0000 0.0000 0.0000 0.00002.9906 0.0000 2.9906 1.5639 0.0000 1.5639Fugitive Dust
Total CO2 CH4 N2O CO2e
Category tons/yr MT/yr
PM10 Total
Fugitive PM2.5
Exhaust PM2.5
PM2.5 Total
Bio- CO2 NBio- CO2
3.3 Grading - 2016Unmitigated Construction On-Site
ROG NOx CO SO2 Fugitive PM10
Exhaust PM10

0.0000 1,037.6879
1,037.6879 0.3180 0.0000 1,045.6365
0.6124 0.6124 0.5634 0.5634Off-Road 1.1313 12.8758 8.7500 0.0112
0.0000 0.0000 0.0000 0.0000 0.0000 0.00002.9906 0.0000 2.9906 1.5639 0.0000 1.5639Fugitive Dust
Total CO2 CH4 N2O CO2e
Category tons/yr MT/yr
PM10 Total
Fugitive PM2.5
Exhaust PM2.5
PM2.5 Total
Bio- CO2 NBio- CO2
3.3 Grading - 2017Unmitigated Construction On-Site
ROG NOx CO SO2 Fugitive PM10
Exhaust PM10
0.0000 433.9918 433.9918 0.1006 0.0000 436.50800.0433 0.0107 0.0540 0.0114 0.0102 0.0217Total 0.1260 4.3267 0.8826 4.4500e-003
0.0000 11.4903 11.4903 4.7000e-004
0.0000 11.50200.0113 9.0000e-005
0.0114 3.0000e-003
8.0000e-005
3.0900e-003
Worker 7.4000e-003
6.1000e-003
0.0587 1.3000e-004
0.0000 0.0000 0.0000 0.0000 0.0000 0.00000.0000 0.0000 0.0000 0.0000 0.0000 0.0000Vendor 0.0000 0.0000 0.0000 0.0000
0.0000 422.5016 422.5016 0.1002 0.0000 425.00590.0320 0.0106 0.0426 8.4300e-003
0.0101 0.0186Hauling 0.1186 4.3206 0.8239 4.3200e-003
Total CO2 CH4 N2O CO2e
Category tons/yr MT/yr
PM10 Total
Fugitive PM2.5
Exhaust PM2.5
PM2.5 Total
Bio- CO2 NBio- CO2
Mitigated Construction Off-Site
ROG NOx CO SO2 Fugitive PM10
Exhaust PM10
0.0000 879.6182 879.6182 0.2653 0.0000 886.25131.1663 0.5509 1.7172 0.6099 0.5068 1.1167Total 1.0009 11.5266 7.6676 9.3300e-003
0.0000 879.6182 879.6182 0.2653 0.0000 886.25130.5509 0.5509 0.5068 0.5068Off-Road 1.0009 11.5266 7.6676 9.3300e-003
0.0000 0.0000 0.0000 0.0000 0.0000 0.00001.1663 0.0000 1.1663 0.6099 0.0000 0.6099Fugitive Dust
Category tons/yr MT/yr

Mitigated Construction Off-Site
0.0000 1,037.6867
1,037.6867 0.3180 0.0000 1,045.6353
1.1663 0.6124 1.7787 0.6099 0.5634 1.1733Total 1.1313 12.8758 8.7500 0.0112
0.0000 1,037.6867
1,037.6867 0.3180 0.0000 1,045.6353
0.6124 0.6124 0.5634 0.5634Off-Road 1.1313 12.8758 8.7500 0.0112
0.0000 0.0000 0.0000 0.0000 0.0000 0.00001.1663 0.0000 1.1663 0.6099 0.0000 0.6099Fugitive Dust
Total CO2 CH4 N2O CO2e
Category tons/yr MT/yr
PM10 Total
Fugitive PM2.5
Exhaust PM2.5
PM2.5 Total
Bio- CO2 NBio- CO2
Mitigated Construction On-Site
ROG NOx CO SO2 Fugitive PM10
Exhaust PM10
0.0000 536.7419 536.7419 0.1122 0.0000 539.54780.0465 8.4900e-003
0.0550 0.0124 8.1200e-003
0.0205Total 0.1308 5.0769 0.9520 5.4900e-003
0.0000 13.4205 13.4205 5.0000e-004
0.0000 13.43310.0136 1.0000e-004
0.0137 3.6000e-003
9.0000e-005
3.7000e-003
Worker 7.9800e-003
6.4700e-003
0.0621 1.5000e-004
0.0000 0.0000 0.0000 0.0000 0.0000 0.00000.0000 0.0000 0.0000 0.0000 0.0000 0.0000Vendor 0.0000 0.0000 0.0000 0.0000
0.0000 523.3214 523.3214 0.1117 0.0000 526.11480.0330 8.3900e-003
0.0414 8.7800e-003
8.0300e-003
0.0168Hauling 0.1228 5.0705 0.8899 5.3400e-003
Total CO2 CH4 N2O CO2e
Category tons/yr MT/yr
PM10 Total
Fugitive PM2.5
Exhaust PM2.5
PM2.5 Total
Bio- CO2 NBio- CO2
Unmitigated Construction Off-Site
ROG NOx CO SO2 Fugitive PM10
Exhaust PM10
0.0000 1,037.6879
1,037.6879 0.3180 0.0000 1,045.6365
2.9906 0.6124 3.6030 1.5639 0.5634 2.1273Total 1.1313 12.8758 8.7500 0.0112
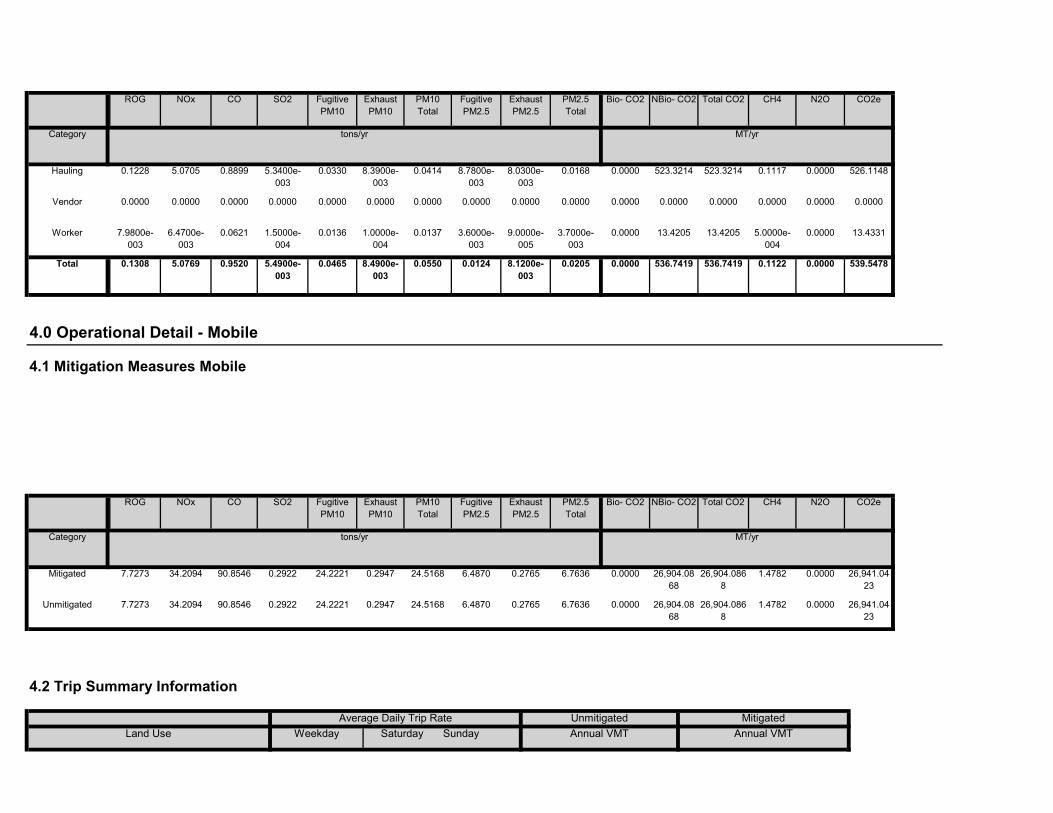
Annual VMT
4.2 Trip Summary Information
Average Daily Trip Rate Unmitigated MitigatedLand Use Weekday Saturday Sunday Annual VMT
0.0000 26,904.0868
26,904.0868
1.4782 0.0000 26,941.0423
24.2221 0.2947 24.5168 6.4870 0.2765 6.7636Unmitigated 7.7273 34.2094 90.8546 0.2922
0.0000 26,904.0868
26,904.0868
1.4782 0.0000 26,941.0423
24.2221 0.2947 24.5168 6.4870 0.2765 6.7636Mitigated 7.7273 34.2094 90.8546 0.2922
NBio- CO2 Total CO2 CH4 N2O CO2e
Category tons/yr MT/yr
Exhaust PM10
PM10 Total
Fugitive PM2.5
Exhaust PM2.5
PM2.5 Total
Bio- CO2
4.0 Operational Detail - Mobile
4.1 Mitigation Measures Mobile
ROG NOx CO SO2 Fugitive PM10
0.0000 536.7419 536.7419 0.1122 0.0000 539.54780.0465 8.4900e-003
0.0550 0.0124 8.1200e-003
0.0205Total 0.1308 5.0769 0.9520 5.4900e-003
0.0000 13.4205 13.4205 5.0000e-004
0.0000 13.43310.0136 1.0000e-004
0.0137 3.6000e-003
9.0000e-005
3.7000e-003
Worker 7.9800e-003
6.4700e-003
0.0621 1.5000e-004
0.0000 0.0000 0.0000 0.0000 0.0000 0.00000.0000 0.0000 0.0000 0.0000 0.0000 0.0000Vendor 0.0000 0.0000 0.0000 0.0000
0.0000 523.3214 523.3214 0.1117 0.0000 526.11480.0330 8.3900e-003
0.0414 8.7800e-003
8.0300e-003
0.0168Hauling 0.1228 5.0705 0.8899 5.3400e-003
Total CO2 CH4 N2O CO2e
Category tons/yr MT/yr
PM10 Total
Fugitive PM2.5
Exhaust PM2.5
PM2.5 Total
Bio- CO2 NBio- CO2ROG NOx CO SO2 Fugitive PM10
Exhaust PM10

CO2e
Category tons/yr MT/yr
PM2.5 Total
Bio- CO2 NBio- CO2 Total CO2 CH4 N2OSO2 Fugitive PM10
Exhaust PM10
PM10 Total
Fugitive PM2.5
Exhaust PM2.5
0.000745 0.001271
5.0 Energy Detail
Historical Energy Use: N
5.1 Mitigation Measures Energy
ROG NOx CO
0.005558 0.015534 0.023021 0.001902 0.002024 0.006181Strip Mall 0.588316 0.042913 0.184449 0.110793 0.017294
0.023021 0.001902 0.002024 0.006181 0.000745 0.001271
0.000745 0.001271
Regional Shopping Center 0.588316 0.042913 0.184449 0.110793 0.017294 0.005558 0.015534
0.005558 0.015534 0.023021 0.001902 0.002024 0.006181Condo/Townhouse 0.588316 0.042913 0.184449 0.110793 0.017294
0.023021 0.001902 0.002024 0.006181 0.000745 0.001271
SBUS MH
Industrial Park 0.588316 0.042913 0.184449 0.110793 0.017294 0.005558 0.015534
LHD2 MHD HHD OBUS UBUS MCYLand Use LDA LDT1 LDT2 MDV LHD1
64.40 19.00 45 40 15
4.4 Fleet Mix
64.70 19.00 54 35 11
Strip Mall 9.50 7.30 7.30 16.60
28.00 13.00 79 19 2
Regional Shopping Center 9.50 7.30 7.30 16.30
18.80 39.60 86 11 3
Industrial Park 9.50 7.30 7.30 59.00
H-S or C-C H-O or C-NW Primary Diverted Pass-by
Condo/Townhouse 10.80 7.30 7.50 41.60
4.3 Trip Type Information
Miles Trip % Trip Purpose %
Land Use H-W or C-W H-S or C-C H-O or C-NW H-W or C-W
Total 25,541.91 23,357.93 17,755.58 64,268,356 64,268,356Strip Mall 482.64 457.82 222.48 680,590 680,590
Regional Shopping Center 3,161.94 3,700.28 1869.02 5,354,837 5,354,837Industrial Park 3,549.35 1,293.98 379.36 7,273,726 7,273,726
Condo/Townhouse 18,347.98 17,905.86 15284.72 50,959,203 50,959,203

562.1189 0.0108 0.0103 565.45930.0392 0.0392 0.0392 0.0000 562.1189
2,898.0205
Industrial Park 1.05337e+007
0.0568 0.5164 0.4337 3.1000e-003
0.0392
0.2011 0.0000 2,880.9008 2,880.9008
0.0552 0.05280.0159 0.2011 0.2011 0.2011
Land Use kBTU/yr tons/yr MT/yr
Condo/Townhouse 5.3986e+007
0.2911 2.4876 1.0586
Bio- CO2 NBio- CO2 Total CO2 CH4 N2O CO2eFugitive PM10
Exhaust PM10
PM10 Total
Fugitive PM2.5
Exhaust PM2.5
PM2.5 Total
3,473.6935
Mitigated
NaturalGas Use
ROG NOx CO SO2
0.2411 0.0000 3,453.1730 3,453.1730
0.0662 0.06330.0190 0.2411 0.2411 0.2411
1.3017 2.0000e-005
2.0000e-005
1.3095
Total 0.3489 3.0133 1.5001
9.0000e-005
9.0000e-005
9.0000e-005
0.0000 1.3017
8.9042
Strip Mall 24393.6 1.3000e-004
1.2000e-003
1.0000e-003
1.0000e-005
9.0000e-005
6.2000e-004
0.0000 8.8516 8.8516 1.7000e-004
1.6000e-004
5.0000e-005
6.2000e-004
6.2000e-004
6.2000e-004
562.1189 0.0108 0.0103 565.4593
Regional Shopping Center
165872 8.9000e-004
8.1300e-003
6.8300e-003
0.0392 0.0392 0.0392 0.0000 562.1189
2,898.0205
Industrial Park 1.05337e+007
0.0568 0.5164 0.4337 3.1000e-003
0.0392
0.2011 0.0000 2,880.9008 2,880.9008
0.0552 0.05280.0159 0.2011 0.2011 0.2011Condo/Townhouse 5.3986e+007
0.2911 2.4876 1.0586
NBio- CO2 Total CO2 CH4 N2O CO2e
Land Use kBTU/yr tons/yr MT/yr
Exhaust PM10
PM10 Total
Fugitive PM2.5
Exhaust PM2.5
PM2.5 Total
Bio- CO2
5.2 Energy by Land Use - NaturalGasUnmitigated
NaturalGas Use
ROG NOx CO SO2 Fugitive PM10
0.0000 3,453.1730
3,453.1730 0.0662 0.0633 3,473.6935
0.2411 0.2411 0.2411 0.2411NaturalGas Unmitigated
0.3489 3.0133 1.5001 0.0190
0.0000 3,453.1730
3,453.1730 0.0662 0.0633 3,473.6935
0.2411 0.2411 0.2411 0.2411NaturalGas Mitigated
0.3489 3.0133 1.5001 0.0190
0.0000 7,081.9492
7,081.9492 0.2857 0.0572 7,106.1226
0.0000 0.0000 0.0000 0.0000Electricity Unmitigated
0.0000 7,081.9492
7,081.9492 0.2857 0.0572 7,106.1226
0.0000 0.0000 0.0000 0.0000Electricity Mitigated

269.1839Regional Shopping Center
954505 268.2682 0.0108 2.1600e-003
4,780.7640
Industrial Park 7.15066e+006
2,009.7278 0.0811 0.0162 2,016.5878
Land Use kWh/yr ton
MT/yr
Condo/Townhouse 1.69522e+007
4,764.5010 0.1922 0.0385
7,106.1226
Mitigated
Electricity Use
Total CO2 CH4 N2O CO2e
Total 7,081.9492 0.2857 0.0572
269.1839
Strip Mall 140372 39.4523 1.5900e-003
3.2000e-004
39.5869
Regional Shopping Center
954505 268.2682 0.0108 2.1600e-003
4,780.7640
Industrial Park 7.15066e+006
2,009.7278 0.0811 0.0162 2,016.5878
Land Use kWh/yr ton
MT/yr
Condo/Townhouse 1.69522e+007
4,764.5010 0.1922 0.0385
3,473.6935
5.3 Energy by Land Use - ElectricityUnmitigated
Electricity Use
Total CO2 CH4 N2O CO2e
0.2411 0.0000 3,453.1730 3,453.1730
0.0662 0.06330.0190 0.2411 0.2411 0.2411
1.3017 2.0000e-005
2.0000e-005
1.3095
Total 0.3489 3.0133 1.5001
9.0000e-005
9.0000e-005
9.0000e-005
0.0000 1.3017
8.9042
Strip Mall 24393.6 1.3000e-004
1.2000e-003
1.0000e-003
1.0000e-005
9.0000e-005
6.2000e-004
0.0000 8.8516 8.8516 1.7000e-004
1.6000e-004
5.0000e-005
6.2000e-004
6.2000e-004
6.2000e-004
Regional Shopping Center
165872 8.9000e-004
8.1300e-003
6.8300e-003

3,262.0804
1,368.0690
4,630.1494 3.0104 0.2566 4,781.8714
34.2949 34.2949 34.2949 34.2949Hearth 198.1525 3.8697 244.5977 0.4431
0.0000 0.0000 0.0000 0.0000 0.0000 0.00000.0000 0.0000 0.0000 0.0000Consumer Products
14.6949
0.0000 0.0000 0.0000 0.0000 0.0000 0.00000.0000 0.0000 0.0000 0.0000Architectural Coating
0.0000
Total CO2 CH4 N2O CO2e
SubCategory tons/yr MT/yr
PM10 Total
Fugitive PM2.5
Exhaust PM2.5
PM2.5 Total
Bio- CO2 NBio- CO2
6.2 Area by SubCategoryUnmitigated
ROG NOx CO SO2 Fugitive PM10
Exhaust PM10
3,262.0804
1,406.3825
4,668.4629 3.0477 0.2566 4,821.1194
34.4243 34.4243 34.4243 34.4243Unmitigated 213.5643 4.1419 268.1298 0.4444
3,262.0804
1,406.3825
4,668.4629 3.0477 0.2566 4,821.1194
34.4243 34.4243 34.4243 34.4243Mitigated 213.5643 4.1419 268.1298 0.4444
NBio- CO2 Total CO2 CH4 N2O CO2e
Category tons/yr MT/yr
Exhaust PM10
PM10 Total
Fugitive PM2.5
Exhaust PM2.5
PM2.5 Total
Bio- CO2
7,106.1226
6.0 Area Detail
6.1 Mitigation Measures Area
ROG NOx CO SO2 Fugitive PM10
Total 7,081.9492 0.2857 0.0572
Strip Mall 140372 39.4523 1.5900e-003
3.2000e-004
39.5869

Unmitigated 1,738.2848 10.8913 0.2688 2,090.6673
Category ton
MT/yr
Mitigated 1,738.2848 10.8913 0.2688 2,090.6673
7.0 Water Detail
7.1 Mitigation Measures Water
Total CO2 CH4 N2O CO2e
3,262.0804
1,406.3825
4,668.4629 3.0477 0.2566 4,821.1193
34.4243 34.4243 34.4243 34.4243Total 213.5643 4.1419 268.1298 0.4444
0.0000 38.3135 38.3135 0.0374 0.0000 39.24800.1294 0.1294 0.1294 0.1294Landscaping 0.7169 0.2722 23.5321 1.2400e-003
3,262.0804
1,368.0690
4,630.1494 3.0104 0.2566 4,781.8714
34.2949 34.2949 34.2949 34.2949Hearth 198.1525 3.8697 244.5977 0.4431
0.0000 0.0000 0.0000 0.0000 0.0000 0.00000.0000 0.0000 0.0000 0.0000Consumer Products
14.6949
0.0000 0.0000 0.0000 0.0000 0.0000 0.00000.0000 0.0000 0.0000 0.0000Architectural Coating
0.0000
Total CO2 CH4 N2O CO2e
SubCategory tons/yr MT/yr
PM10 Total
Fugitive PM2.5
Exhaust PM2.5
PM2.5 Total
Bio- CO2 NBio- CO2
Mitigated
ROG NOx CO SO2 Fugitive PM10
Exhaust PM10
3,262.0804
1,406.3825
4,668.4629 3.0477 0.2566 4,821.1193
34.4243 34.4243 34.4243 34.4243Total 213.5643 4.1419 268.1298 0.4444
0.0000 38.3135 38.3135 0.0374 0.0000 39.24800.1294 0.1294 0.1294 0.1294Landscaping 0.7169 0.2722 23.5321 1.2400e-003

2,090.6673
Total 1,738.2848 10.8913 0.2688
38.1410
Strip Mall 0.80665 / 0.494398
4.7517 0.0265 6.6000e-004
5.6091
Regional Shopping Center
5.48507 / 3.36182
32.3108 0.1800 4.4700e-003
1,442.0507
Industrial Park 120.174 / 0 477.9151 3.9336 0.0960 604.8665
Land Use Mgal ton
MT/yr
Condo/Townhouse 205.756 / 129.716
1,223.3073 6.7513 0.1677
2,090.6673
Mitigated
Indoor/Outdoor Use
Total CO2 CH4 N2O CO2e
Total 1,738.2848 10.8913 0.2688
38.1410
Strip Mall 0.80665 / 0.494398
4.7517 0.0265 6.6000e-004
5.6091
Regional Shopping Center
5.48507 / 3.36182
32.3108 0.1800 4.4700e-003
1,442.0507
Industrial Park 120.174 / 0 477.9151 3.9336 0.0960 604.8665
Land Use Mgal ton
MT/yr
Condo/Townhouse 205.756 / 129.716
1,223.3073 6.7513 0.1677
7.2 Water by Land UseUnmitigated
Indoor/Outdoor Use
Total CO2 CH4 N2O CO2e

1,099.4684
Total 443.7890 26.2272 0.0000
39.1006
Strip Mall 11.43 2.3202 0.1371 0.0000 5.7482
Regional Shopping Center
77.75 15.7826 0.9327 0.0000
730.5550
Industrial Park 644.39 130.8054 7.7304 0.0000 324.0647
Land Use tons ton
MT/yr
Condo/Townhouse 1452.68 294.8809 17.4270 0.0000
8.2 Waste by Land UseUnmitigated
Waste Disposed
Total CO2 CH4 N2O CO2e
Unmitigated 443.7890 26.2272 0.0000 1,099.4684
ton
MT/yr
Mitigated 443.7890 26.2272 0.0000 1,099.4684
8.0 Waste Detail
8.1 Mitigation Measures Waste
Category/Year
Total CO2 CH4 N2O CO2e

User Defined Equipment
Equipment Type Number
11.0 Vegetation
Load Factor Fuel Type
Boilers
Equipment Type Number Heat Input/Day Heat Input/Year Boiler Rating Fuel Type
Horse Power Load Factor Fuel Type
10.0 Stationary Equipment
Fire Pumps and Emergency Generators
Equipment Type Number Hours/Day Hours/Year Horse Power
1,099.4684
9.0 Operational Offroad
Equipment Type Number Hours/Day Days/Year
Total 443.7890 26.2272 0.0000
39.1006
Strip Mall 11.43 2.3202 0.1371 0.0000 5.7482
Regional Shopping Center
77.75 15.7826 0.9327 0.0000
730.5550
Industrial Park 644.39 130.8054 7.7304 0.0000 324.0647
Land Use tons ton
MT/yr
Condo/Townhouse 1452.68 294.8809 17.4270 0.0000
Mitigated
Waste Disposed
Total CO2 CH4 N2O CO2e

tblAreaCoating Area_Nonresidential_Exterior 174240 0
tblArchitecturalCoating EF_Residential_Interior 250.00 50.00
tblAreaCoating Area_EF_Parking 250 0
tblArchitecturalCoating EF_Parking 250.00 100.00
tblArchitecturalCoating EF_Residential_Exterior 250.00 100.00
tblArchitecturalCoating EF_Nonresidential_Exterior 250.00 100.00
tblArchitecturalCoating EF_Nonresidential_Interior 250.00 50.00
1.3 User Entered Comments & Non-Default Data
Architectural Coating - Rule 67.0.1 coatings
Table Name Column Name Default Value New Value
CO2 Intensity (lb/MWhr)
720.49 CH4 Intensity (lb/MWhr)
0.029 N2O Intensity (lb/MWhr)
0.006
40
Climate Zone 13 Operational Year 2018
Utility Company San Diego Gas & Electric
1.2 Other Project Characteristics
Urbanization Urban Wind Speed (m/s) 2.6 Precipitation Freq (Days)
Condo/Townhouse 875.00 Dwelling Unit 54.69 875,000.00 2503
Floor Surface Area Population
City Park 8.00 Acre 8.00 348,480.00 0
1.0 Project Characteristics
1.1 Land Usage
Land Uses Size Metric Lot Acreage
CalEEMod Version: CalEEMod.2016.3.1 Page 1 of 1 Date: 10/24/2016 2:28 PM
East Otay Mesa Specific Plan Amendment Phase 1 Construction - San Diego Air Basin, Annual
East Otay Mesa Specific Plan Amendment Phase 1 ConstructionSan Diego Air Basin, Annual

tblConstructionPhase NumDays 1,110.00 261.00
tblConstEquipMitigation Tier No Change Tier 3
tblConstructionPhase NumDays 75.00 131.00
tblConstEquipMitigation Tier No Change Tier 3
tblConstEquipMitigation Tier No Change Tier 3
tblConstEquipMitigation Tier No Change Tier 3
tblConstEquipMitigation Tier No Change Tier 3
tblConstEquipMitigation Tier No Change Tier 3
tblConstEquipMitigation Tier No Change Tier 3
tblConstEquipMitigation Tier No Change Tier 3
tblConstEquipMitigation Tier No Change Tier 3
tblConstEquipMitigation NumberOfEquipmentMitigated 0.00 2.00
tblConstEquipMitigation Tier No Change Tier 3
tblConstEquipMitigation NumberOfEquipmentMitigated 0.00 2.00
tblConstEquipMitigation NumberOfEquipmentMitigated 0.00 7.00
tblConstEquipMitigation NumberOfEquipmentMitigated 0.00 2.00
tblConstEquipMitigation NumberOfEquipmentMitigated 0.00 2.00
tblConstEquipMitigation NumberOfEquipmentMitigated 0.00 6.00
tblConstEquipMitigation NumberOfEquipmentMitigated 0.00 2.00
tblConstEquipMitigation NumberOfEquipmentMitigated 0.00 2.00
tblConstEquipMitigation NumberOfEquipmentMitigated 0.00 2.00
tblConstDustMitigation WaterUnpavedRoadVehicleSpeed 40 15
tblConstEquipMitigation NumberOfEquipmentMitigated 0.00 2.00
tblAreaMitigation UseLowVOCPaintResidentialExteriorValue
250 0
tblAreaMitigation UseLowVOCPaintResidentialInteriorValue
250 0
tblAreaMitigation UseLowVOCPaintNonresidentialExteriorValue
250 0
tblAreaMitigation UseLowVOCPaintNonresidentialInteriorValue
250 0
tblAreaCoating Area_Residential_Exterior 590625 0
tblAreaCoating Area_Residential_Interior 1771875 0
tblAreaCoating Area_Nonresidential_Interior 522720 0

Mitigated Construction
0.0000 2,432.2085
2,432.2085 0.3268 0.0000 2,440.3782
1.0888 0.5976 1.6864 0.2923 0.5611 0.8534Maximum 8.2596 12.1780 11.8174 0.0267
0.0000 2,432.2085
2,432.2085 0.3268 0.0000 2,440.3782
1.0888 0.5976 1.6864 0.2923 0.5611 0.85342018 8.2596 12.1780 11.8174 0.0267
NBio- CO2 Total CO2 CH4 N2O CO2e
Year tons/yr MT/yr
Exhaust PM10
PM10 Total
Fugitive PM2.5
Exhaust PM2.5
PM2.5 Total
Bio- CO2
2.0 Emissions Summary
2.1 Overall ConstructionUnmitigated Construction
ROG NOx CO SO2 Fugitive PM10
tblOffRoadEquipment OffRoadEquipmentUnitAmount 3.00 6.00
tblOffRoadEquipment OffRoadEquipmentUnitAmount 1.00 2.00
tblOffRoadEquipment OffRoadEquipmentUnitAmount 3.00 6.00
tblOffRoadEquipment OffRoadEquipmentUnitAmount 1.00 2.00
tblOffRoadEquipment OffRoadEquipmentUnitAmount 1.00 2.00
tblOffRoadEquipment OffRoadEquipmentUnitAmount 1.00 2.00
tblOffRoadEquipment HorsePower 130.00 125.00
tblOffRoadEquipment HorsePower 132.00 130.00
tblLandUse GreenSpaceSquareFeet 348,480.00 0.00
tblOffRoadEquipment HorsePower 231.00 226.00
tblLandUse BuildingSpaceSquareFeet 0.00 348,480.00
tblLandUse GreenSpaceAllowEdit 1.00 0.00
tblConstructionPhase NumDays 75.00 261.00

0.0000 6,279.3613
6,279.3613 0.3676 0.0000 6,288.5517
5.3682 0.0817 5.4500 1.4380 0.0771 1.5151Mobile 1.9691 8.5919 23.7119 0.0684
0.0000 2,333.2495
2,333.2495 0.0771 0.0274 2,343.3469
0.0557 0.0557 0.0557 0.0557Energy 0.0807 0.6893 0.2933 4.4000e-003
903.8380 389.6693 1,293.5073 0.8446 0.0711 1,335.8085
9.5380 9.5380 9.5380 9.5380Area 59.8829 1.1481 74.3147 0.1231
Total CO2 CH4 N2O CO2e
Category tons/yr MT/yr
PM10 Total
Fugitive PM2.5
Exhaust PM2.5
PM2.5 Total
Bio- CO2 NBio- CO2
2.2 Overall OperationalUnmitigated Operational
ROG NOx CO SO2 Fugitive PM10
Exhaust PM10
8 7-24-2018 9-30-2018 4.2331 3.4306
Highest 5.6649 4.5910
6 1-24-2018 4-23-2018 3.8294 2.8209
7 4-24-2018 7-23-2018 5.6649 4.5910
Quarter Start Date End Date Maximum Unmitigated ROG + NOX (tons/quarter) Maximum Mitigated ROG + NOX (tons/quarter)
5 10-24-2017 1-23-2018 0.8355 0.5787
0.00 0.00 0.00 0.00 0.00 0.000.00 37.18 13.18 0.00 33.35 21.93
NBio-CO2 Total CO2 CH4 N20 CO2e
Percent Reduction
9.04 28.80 -2.60 0.00
Exhaust PM10
PM10 Total
Fugitive PM2.5
Exhaust PM2.5
PM2.5 Total
Bio- CO2ROG NOx CO SO2 Fugitive PM10
0.0000 2,432.2074
2,432.2074 0.3268 0.0000 2,440.3770
1.0888 0.3754 1.4642 0.2923 0.3740 0.6663Maximum 7.5126 8.6704 12.1247 0.0267
0.0000 2,432.2074
2,432.2074 0.3268 0.0000 2,440.3770
1.0888 0.3754 1.4642 0.2923 0.3740 0.66632018 7.5126 8.6704 12.1247 0.0267
Total CO2 CH4 N2O CO2e
Year tons/yr MT/yr
PM10 Total
Fugitive PM2.5
Exhaust PM2.5
PM2.5 Total
Bio- CO2 NBio- CO2ROG NOx CO SO2 Fugitive PM10
Exhaust PM10

261
2 Paving Paving 1/1/2018 12/31/2018 5 261
End Date Num Days Week
Num Days Phase Description
1 Building Construction Building Construction 1/1/2018 12/31/2018 5
3.0 Construction Detail
Construction Phase
Phase Number
Phase Name Phase Type Start Date
0.00 0.00 0.00 0.00 0.00 0.000.00 0.00 0.00 0.00 0.00 0.00
NBio-CO2 Total CO2 CH4 N20 CO2e
Percent Reduction
0.00 0.00 0.00 0.00
Exhaust PM10
PM10 Total
Fugitive PM2.5
Exhaust PM2.5
PM2.5 Total
Bio- CO2ROG NOx CO SO2 Fugitive PM10
1,003.7685
9,409.9829
10,413.7514
8.0002 0.1458 10,657.1962
5.3682 9.6754 15.0436 1.4380 9.6707 11.1088Total 61.9327 10.4293 98.3199 0.1959
18.0866 407.7028 425.7893 1.8741 0.0473 486.72430.0000 0.0000 0.0000 0.0000Water
81.8439 0.0000 81.8439 4.8368 0.0000 202.76490.0000 0.0000 0.0000 0.0000Waste
0.0000 6,279.3613
6,279.3613 0.3676 0.0000 6,288.5517
5.3682 0.0817 5.4500 1.4380 0.0771 1.5151Mobile 1.9691 8.5919 23.7119 0.0684
0.0000 2,333.2495
2,333.2495 0.0771 0.0274 2,343.3469
0.0557 0.0557 0.0557 0.0557Energy 0.0807 0.6893 0.2933 4.4000e-003
903.8380 389.6693 1,293.5073 0.8446 0.0711 1,335.8085
9.5380 9.5380 9.5380 9.5380Area 59.8829 1.1481 74.3147 0.1231
Total CO2 CH4 N2O CO2e
Category tons/yr MT/yr
PM10 Total
Fugitive PM2.5
Exhaust PM2.5
PM2.5 Total
Bio- CO2 NBio- CO2
Mitigated Operational
ROG NOx CO SO2 Fugitive PM10
Exhaust PM10
1,003.7685
9,409.9829
10,413.7514
8.0002 0.1458 10,657.1962
5.3682 9.6754 15.0436 1.4380 9.6707 11.1088Total 61.9327 10.4293 98.3199 0.1959
18.0866 407.7028 425.7893 1.8741 0.0473 486.72430.0000 0.0000 0.0000 0.0000Water
81.8439 0.0000 81.8439 4.8368 0.0000 202.76490.0000 0.0000 0.0000 0.0000Waste

Use Cleaner Engines for Construction Equipment
7.30 20.00 LD_Mix HDT_Mix HHDT
3.1 Mitigation Measures Construction
Architectural Coating 2 155.00 0.00 0.00 10.80
10.80 7.30 20.00 LD_Mix HDT_Mix HHDT
7.30 20.00 LD_Mix HDT_Mix HHDT
Paving 9 23.00 0.00 0.00
Building Construction 18 776.00 151.00 0.00 10.80
Worker Trip Length
Vendor Trip Length
Hauling Trip Length
Worker Vehicle Class
Vendor Vehicle Class
Hauling Vehicle Class
Trips and VMT
Phase Name Offroad Equipment Count
Worker Trip Number
Vendor Trip Number
Hauling Trip Number
Architectural Coating Air Compressors 2 6.00 78 0.48
Paving Tractors/Loaders/Backhoes 1 8.00 97 0.37
Paving Rollers 2 8.00 80 0.38
Paving Paving Equipment 2 8.00 130 0.36
Paving Pavers 2 8.00 125 0.42
Paving Cement and Mortar Mixers 2 8.00 9 0.56
Building Construction Welders 2 8.00 46 0.45
Building Construction Tractors/Loaders/Backhoes 6 7.00 97 0.37
Building Construction Generator Sets 2 8.00 84 0.74
Building Construction Forklifts 6 8.00 89 0.20
Load Factor
Building Construction Cranes 2 7.00 226 0.29
OffRoad Equipment
Phase Name Offroad Equipment Type Amount Usage Hours Horse Power
131
Acres of Grading (Site Preparation Phase): 0
Acres of Grading (Grading Phase): 0
Acres of Paving: 0
Residential Indoor: 1,771,875; Residential Outdoor: 590,625; Non-Residential Indoor: 522,720; Non-Residential Outdoor: 174,240;
3 Architectural Coating Architectural Coating 4/1/2018 12/31/2018 5

Mitigated Construction On-Site
0.0000 1,308.9964
1,308.9964 0.0704 0.0000 1,310.7574
0.9429 0.0264 0.9693 0.2536 0.0251 0.2786Total 0.5362 2.9732 4.0105 0.0141
0.0000 781.5614 781.5614 0.0270 0.0000 782.23570.8121 5.9900e-003
0.8181 0.2158 5.5200e-003
0.2213Worker 0.4328 0.3427 3.2871 8.6500e-003
0.0000 527.4351 527.4351 0.0435 0.0000 528.52170.1308 0.0205 0.1512 0.0378 0.0196 0.0573Vendor 0.1034 2.6305 0.7235 5.4300e-003
0.0000 0.0000 0.0000 0.0000 0.0000 0.00000.0000 0.0000 0.0000 0.0000 0.0000 0.0000Hauling 0.0000 0.0000 0.0000 0.0000
Total CO2 CH4 N2O CO2e
Category tons/yr MT/yr
PM10 Total
Fugitive PM2.5
Exhaust PM2.5
PM2.5 Total
Bio- CO2 NBio- CO2
Unmitigated Construction Off-Site
ROG NOx CO SO2 Fugitive PM10
Exhaust PM10
0.0000 617.9689 617.9689 0.1512 0.0000 621.74960.3900 0.3900 0.3667 0.3667Total 0.6965 6.0711 4.5760 7.0000e-003
0.0000 617.9689 617.9689 0.1512 0.0000 621.74960.3900 0.3900 0.3667 0.3667
CO2e
Category tons/yr MT/yr
Off-Road 0.6965 6.0711 4.5760 7.0000e-003
PM2.5 Total
Bio- CO2 NBio- CO2 Total CO2 CH4 N2OSO2 Fugitive PM10
Exhaust PM10
PM10 Total
Fugitive PM2.5
Exhaust PM2.5
Water Exposed Area
Reduce Vehicle Speed on Unpaved Roads
3.2 Building Construction - 2018Unmitigated Construction On-Site
ROG NOx CO
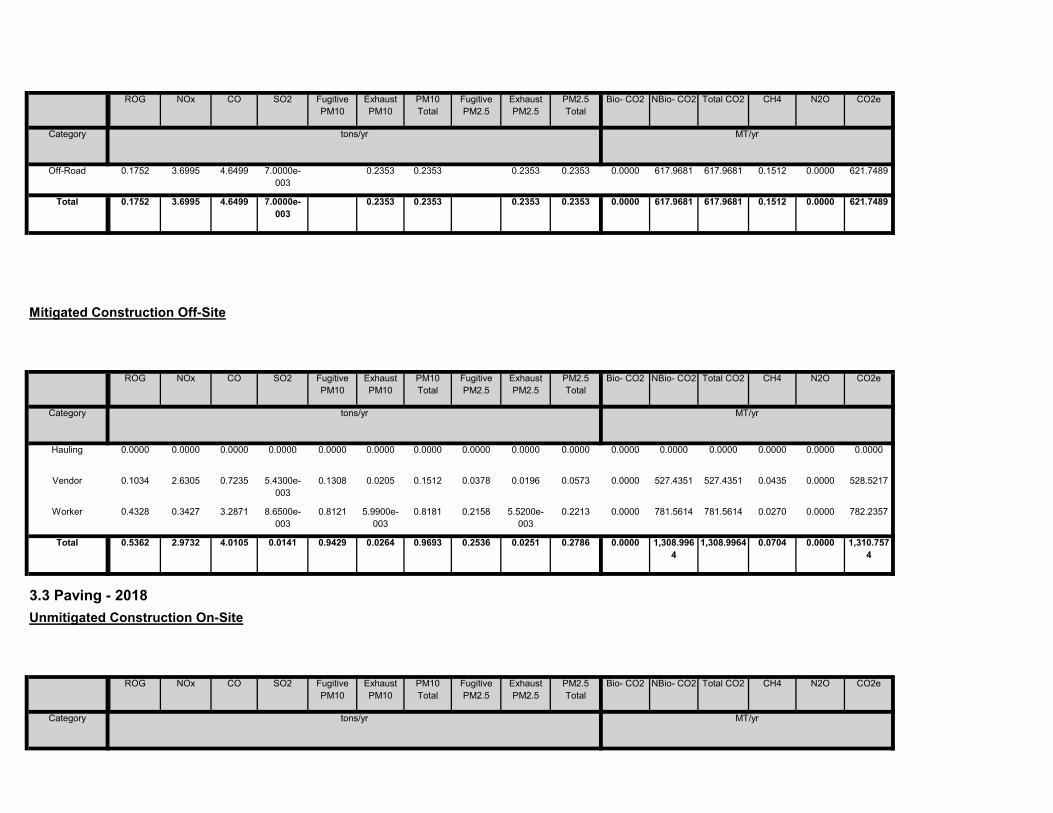
Total CO2 CH4 N2O CO2e
Category tons/yr MT/yr
PM10 Total
Fugitive PM2.5
Exhaust PM2.5
PM2.5 Total
Bio- CO2 NBio- CO2
3.3 Paving - 2018Unmitigated Construction On-Site
ROG NOx CO SO2 Fugitive PM10
Exhaust PM10
0.0000 1,308.9964
1,308.9964 0.0704 0.0000 1,310.7574
0.9429 0.0264 0.9693 0.2536 0.0251 0.2786Total 0.5362 2.9732 4.0105 0.0141
0.0000 781.5614 781.5614 0.0270 0.0000 782.23570.8121 5.9900e-003
0.8181 0.2158 5.5200e-003
0.2213Worker 0.4328 0.3427 3.2871 8.6500e-003
0.0000 527.4351 527.4351 0.0435 0.0000 528.52170.1308 0.0205 0.1512 0.0378 0.0196 0.0573Vendor 0.1034 2.6305 0.7235 5.4300e-003
0.0000 0.0000 0.0000 0.0000 0.0000 0.00000.0000 0.0000 0.0000 0.0000 0.0000 0.0000Hauling 0.0000 0.0000 0.0000 0.0000
Total CO2 CH4 N2O CO2e
Category tons/yr MT/yr
PM10 Total
Fugitive PM2.5
Exhaust PM2.5
PM2.5 Total
Bio- CO2 NBio- CO2
Mitigated Construction Off-Site
ROG NOx CO SO2 Fugitive PM10
Exhaust PM10
0.0000 617.9681 617.9681 0.1512 0.0000 621.74890.2353 0.2353 0.2353 0.2353Total 0.1752 3.6995 4.6499 7.0000e-003
0.0000 617.9681 617.9681 0.1512 0.0000 621.74890.2353 0.2353 0.2353 0.2353Off-Road 0.1752 3.6995 4.6499 7.0000e-003
Total CO2 CH4 N2O CO2e
Category tons/yr MT/yr
PM10 Total
Fugitive PM2.5
Exhaust PM2.5
PM2.5 Total
Bio- CO2 NBio- CO2ROG NOx CO SO2 Fugitive PM10
Exhaust PM10
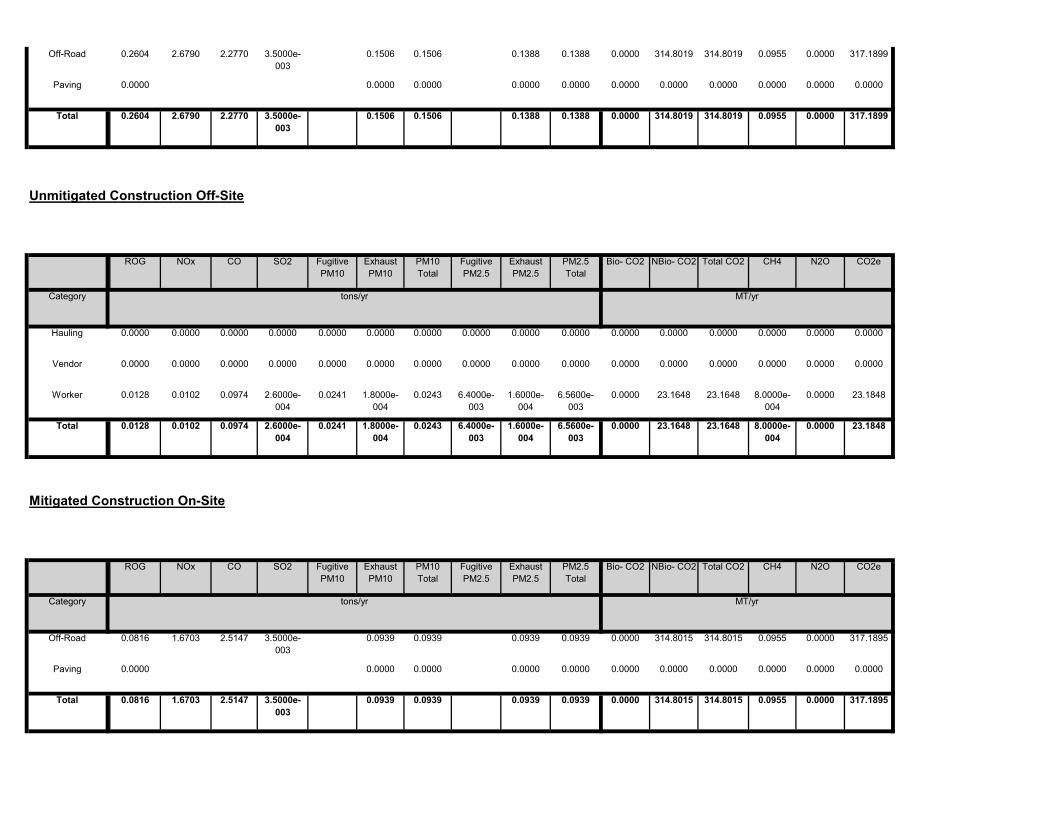
0.0000 314.8015 314.8015 0.0955 0.0000 317.18950.0939 0.0939 0.0939 0.0939Total 0.0816 1.6703 2.5147 3.5000e-003
0.0000 0.0000 0.0000 0.0000 0.0000 0.00000.0000 0.0000 0.0000 0.0000Paving 0.0000
0.0000 314.8015 314.8015 0.0955 0.0000 317.18950.0939 0.0939 0.0939 0.0939Off-Road 0.0816 1.6703 2.5147 3.5000e-003
Total CO2 CH4 N2O CO2e
Category tons/yr MT/yr
PM10 Total
Fugitive PM2.5
Exhaust PM2.5
PM2.5 Total
Bio- CO2 NBio- CO2
Mitigated Construction On-Site
ROG NOx CO SO2 Fugitive PM10
Exhaust PM10
0.0000 23.1648 23.1648 8.0000e-004
0.0000 23.18480.0241 1.8000e-004
0.0243 6.4000e-003
1.6000e-004
6.5600e-003
Total 0.0128 0.0102 0.0974 2.6000e-004
0.0000 23.1648 23.1648 8.0000e-004
0.0000 23.18480.0241 1.8000e-004
0.0243 6.4000e-003
1.6000e-004
6.5600e-003
Worker 0.0128 0.0102 0.0974 2.6000e-004
0.0000 0.0000 0.0000 0.0000 0.0000 0.00000.0000 0.0000 0.0000 0.0000 0.0000 0.0000Vendor 0.0000 0.0000 0.0000 0.0000
0.0000 0.0000 0.0000 0.0000 0.0000 0.00000.0000 0.0000 0.0000 0.0000 0.0000 0.0000Hauling 0.0000 0.0000 0.0000 0.0000
Total CO2 CH4 N2O CO2e
Category tons/yr MT/yr
PM10 Total
Fugitive PM2.5
Exhaust PM2.5
PM2.5 Total
Bio- CO2 NBio- CO2
Unmitigated Construction Off-Site
ROG NOx CO SO2 Fugitive PM10
Exhaust PM10
0.0000 314.8019 314.8019 0.0955 0.0000 317.18990.1506 0.1506 0.1388 0.1388Total 0.2604 2.6790 2.2770 3.5000e-003
0.0000 0.0000 0.0000 0.0000 0.0000 0.00000.0000 0.0000 0.0000 0.0000Paving 0.0000
0.0000 314.8019 314.8019 0.0955 0.0000 317.18990.1506 0.1506 0.1388 0.1388Off-Road 0.2604 2.6790 2.2770 3.5000e-003

Total CO2 CH4 N2O CO2ePM10 Total
Fugitive PM2.5
Exhaust PM2.5
PM2.5 Total
Bio- CO2 NBio- CO2
Unmitigated Construction Off-Site
ROG NOx CO SO2 Fugitive PM10
Exhaust PM10
0.0000 50.0439 50.0439 4.7600e-003
0.0000 50.16270.0295 0.0295 0.0295 0.0295Total 6.6888 0.3931 0.3634 5.8000e-004
0.0000 50.0439 50.0439 4.7600e-003
0.0000 50.16270.0295 0.0295 0.0295 0.0295Off-Road 0.0585 0.3931 0.3634 5.8000e-004
0.0000 0.0000 0.0000 0.0000 0.0000 0.00000.0000 0.0000 0.0000 0.0000Archit. Coating 6.6302
Total CO2 CH4 N2O CO2e
Category tons/yr MT/yr
PM10 Total
Fugitive PM2.5
Exhaust PM2.5
PM2.5 Total
Bio- CO2 NBio- CO2
3.4 Architectural Coating - 2018Unmitigated Construction On-Site
ROG NOx CO SO2 Fugitive PM10
Exhaust PM10
0.0000 23.1648 23.1648 8.0000e-004
0.0000 23.18480.0241 1.8000e-004
0.0243 6.4000e-003
1.6000e-004
6.5600e-003
Total 0.0128 0.0102 0.0974 2.6000e-004
0.0000 23.1648 23.1648 8.0000e-004
0.0000 23.18480.0241 1.8000e-004
0.0243 6.4000e-003
1.6000e-004
6.5600e-003
Worker 0.0128 0.0102 0.0974 2.6000e-004
0.0000 0.0000 0.0000 0.0000 0.0000 0.00000.0000 0.0000 0.0000 0.0000 0.0000 0.0000Vendor 0.0000 0.0000 0.0000 0.0000
0.0000 0.0000 0.0000 0.0000 0.0000 0.00000.0000 0.0000 0.0000 0.0000 0.0000 0.0000Hauling 0.0000 0.0000 0.0000 0.0000
Total CO2 CH4 N2O CO2e
Category tons/yr MT/yr
PM10 Total
Fugitive PM2.5
Exhaust PM2.5
PM2.5 Total
Bio- CO2 NBio- CO2
Mitigated Construction Off-Site
ROG NOx CO SO2 Fugitive PM10
Exhaust PM10

0.0000 117.2327 117.2327 4.0500e-003
0.0000 117.33380.1218 9.0000e-004
0.1227 0.0324 8.3000e-004
0.0332Worker 0.0649 0.0514 0.4931 1.3000e-003
0.0000 0.0000 0.0000 0.0000 0.0000 0.00000.0000 0.0000 0.0000 0.0000 0.0000 0.0000Vendor 0.0000 0.0000 0.0000 0.0000
0.0000 0.0000 0.0000 0.0000 0.0000 0.00000.0000 0.0000 0.0000 0.0000 0.0000 0.0000Hauling 0.0000 0.0000 0.0000 0.0000
Total CO2 CH4 N2O CO2e
Category tons/yr MT/yr
PM10 Total
Fugitive PM2.5
Exhaust PM2.5
PM2.5 Total
Bio- CO2 NBio- CO2
Mitigated Construction Off-Site
ROG NOx CO SO2 Fugitive PM10
Exhaust PM10
0.0000 50.0438 50.0438 4.7600e-003
0.0000 50.16270.0186 0.0186 0.0186 0.0186Total 6.6419 0.2660 0.3592 5.8000e-004
0.0000 50.0438 50.0438 4.7600e-003
0.0000 50.16270.0186 0.0186 0.0186 0.0186Off-Road 0.0117 0.2660 0.3592 5.8000e-004
0.0000 0.0000 0.0000 0.0000 0.0000 0.00000.0000 0.0000 0.0000 0.0000Archit. Coating 6.6302
Total CO2 CH4 N2O CO2e
Category tons/yr MT/yr
PM10 Total
Fugitive PM2.5
Exhaust PM2.5
PM2.5 Total
Bio- CO2 NBio- CO2
Mitigated Construction On-Site
ROG NOx CO SO2 Fugitive PM10
Exhaust PM10
0.0000 117.2327 117.2327 4.0500e-003
0.0000 117.33380.1218 9.0000e-004
0.1227 0.0324 8.3000e-004
0.0332Total 0.0649 0.0514 0.4931 1.3000e-003
0.0000 117.2327 117.2327 4.0500e-003
0.0000 117.33380.1218 9.0000e-004
0.1227 0.0324 8.3000e-004
0.0332Worker 0.0649 0.0514 0.4931 1.3000e-003
0.0000 0.0000 0.0000 0.0000 0.0000 0.00000.0000 0.0000 0.0000 0.0000 0.0000 0.0000Vendor 0.0000 0.0000 0.0000 0.0000
0.0000 0.0000 0.0000 0.0000 0.0000 0.00000.0000 0.0000 0.0000 0.0000 0.0000 0.0000Hauling 0.0000 0.0000 0.0000 0.0000
Category tons/yr MT/yr

18.80 39.60 86 11 3
4.4 Fleet Mix
48.00 19.00 66 28 6
Condo/Townhouse 10.80 7.30 7.50 41.60
H-S or C-C H-O or C-NW Primary Diverted Pass-by
City Park 9.50 7.30 7.30 33.00
4.3 Trip Type Information
Miles Trip % Trip Purpose %
Land Use H-W or C-W H-S or C-C H-O or C-NW H-W or C-W
Total 5,098.87 5,143.25 4,368.92 14,238,880 14,238,880Condo/Townhouse 5,083.75 4,961.25 4235.00 14,119,475 14,119,475
Annual VMT
City Park 15.12 182.00 133.92 119,405 119,405
4.2 Trip Summary Information
Average Daily Trip Rate Unmitigated MitigatedLand Use Weekday Saturday Sunday Annual VMT
0.0000 6,279.3613
6,279.3613 0.3676 0.0000 6,288.5517
5.3682 0.0817 5.4500 1.4380 0.0771 1.5151Unmitigated 1.9691 8.5919 23.7119 0.0684
0.0000 6,279.3613
6,279.3613 0.3676 0.0000 6,288.5517
5.3682 0.0817 5.4500 1.4380 0.0771 1.5151Mitigated 1.9691 8.5919 23.7119 0.0684
NBio- CO2 Total CO2 CH4 N2O CO2e
Category tons/yr MT/yr
Exhaust PM10
PM10 Total
Fugitive PM2.5
Exhaust PM2.5
PM2.5 Total
Bio- CO2
4.0 Operational Detail - Mobile
4.1 Mitigation Measures Mobile
ROG NOx CO SO2 Fugitive PM10
0.0000 117.2327 117.2327 4.0500e-003
0.0000 117.33380.1218 9.0000e-004
0.1227 0.0324 8.3000e-004
0.0332Total 0.0649 0.0514 0.4931 1.3000e-003
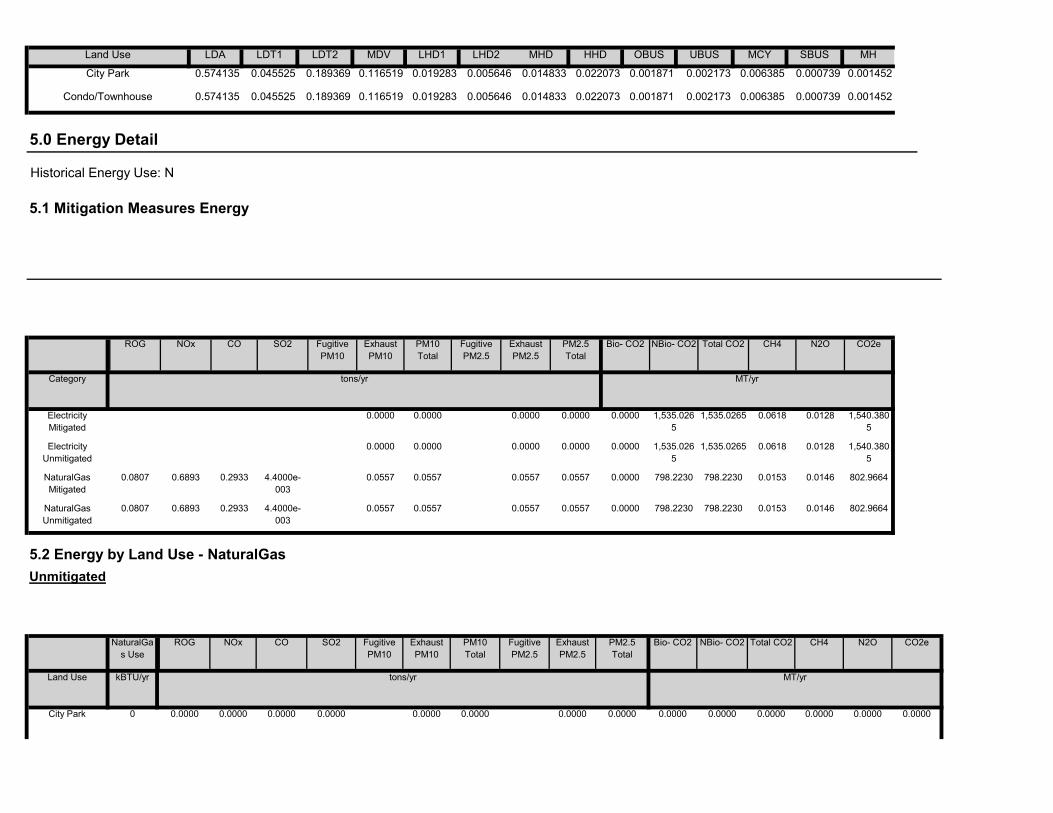
0.00000.0000 0.0000 0.0000 0.0000 0.0000 0.00000.0000 0.0000 0.0000 0.0000City Park 0 0.0000 0.0000 0.0000
NBio- CO2 Total CO2 CH4 N2O CO2e
Land Use kBTU/yr tons/yr MT/yr
Exhaust PM10
PM10 Total
Fugitive PM2.5
Exhaust PM2.5
PM2.5 Total
Bio- CO2
5.2 Energy by Land Use - NaturalGasUnmitigated
NaturalGas Use
ROG NOx CO SO2 Fugitive PM10
0.0000 798.2230 798.2230 0.0153 0.0146 802.96640.0557 0.0557 0.0557 0.0557NaturalGas Unmitigated
0.0807 0.6893 0.2933 4.4000e-003
0.0000 798.2230 798.2230 0.0153 0.0146 802.96640.0557 0.0557 0.0557 0.0557NaturalGas Mitigated
0.0807 0.6893 0.2933 4.4000e-003
0.0000 1,535.0265
1,535.0265 0.0618 0.0128 1,540.3805
0.0000 0.0000 0.0000 0.0000Electricity Unmitigated
0.0000 1,535.0265
1,535.0265 0.0618 0.0128 1,540.3805
0.0000 0.0000 0.0000 0.0000
CO2e
Category tons/yr MT/yr
Electricity Mitigated
PM2.5 Total
Bio- CO2 NBio- CO2 Total CO2 CH4 N2OSO2 Fugitive PM10
Exhaust PM10
PM10 Total
Fugitive PM2.5
Exhaust PM2.5
0.000739 0.001452
5.0 Energy Detail
Historical Energy Use: N
5.1 Mitigation Measures Energy
ROG NOx CO
0.005646 0.014833 0.022073 0.001871 0.002173 0.006385Condo/Townhouse 0.574135 0.045525 0.189369 0.116519 0.019283
0.022073 0.001871 0.002173 0.006385 0.000739 0.001452
SBUS MH
City Park 0.574135 0.045525 0.189369 0.116519 0.019283 0.005646 0.014833
LHD2 MHD HHD OBUS UBUS MCYLand Use LDA LDT1 LDT2 MDV LHD1

1,540.3805
Mitigated
Total 1,535.0265 0.0618 0.0128
0.0000
Condo/Townhouse 4.69702e+006
1,535.0265 0.0618 0.0128 1,540.3805
Land Use kWh/yr ton
MT/yr
City Park 0 0.0000 0.0000 0.0000
802.9664
5.3 Energy by Land Use - ElectricityUnmitigated
Electricity Use
Total CO2 CH4 N2O CO2e
0.0557 0.0000 798.2230 798.2230 0.0153 0.01464.4000e-003
0.0557 0.0557 0.0557
798.2230 0.0153 0.0146 802.9664
Total 0.0807 0.6893 0.2933
0.0557 0.0557 0.0557 0.0000 798.2230
0.0000
Condo/Townhouse 1.49581e+007
0.0807 0.6893 0.2933 4.4000e-003
0.0557
0.0000 0.0000 0.0000 0.0000 0.0000 0.00000.0000 0.0000 0.0000 0.0000
Land Use kBTU/yr tons/yr MT/yr
City Park 0 0.0000 0.0000 0.0000
Bio- CO2 NBio- CO2 Total CO2 CH4 N2O CO2eFugitive PM10
Exhaust PM10
PM10 Total
Fugitive PM2.5
Exhaust PM2.5
PM2.5 Total
802.9664
Mitigated
NaturalGas Use
ROG NOx CO SO2
0.0557 0.0000 798.2230 798.2230 0.0153 0.01464.4000e-003
0.0557 0.0557 0.0557
798.2230 0.0153 0.0146 802.9664
Total 0.0807 0.6893 0.2933
0.0557 0.0557 0.0557 0.0000 798.2230Condo/Townhouse 1.49581e+007
0.0807 0.6893 0.2933 4.4000e-003
0.0557

Total CO2 CH4 N2O CO2ePM10 Total
Fugitive PM2.5
Exhaust PM2.5
PM2.5 Total
Bio- CO2 NBio- CO2
6.2 Area by SubCategoryUnmitigated
ROG NOx CO SO2 Fugitive PM10
Exhaust PM10
903.8380 389.6693 1,293.5073 0.8446 0.0711 1,335.8085
9.5380 9.5380 9.5380 9.5380Unmitigated 59.8829 1.1481 74.3147 0.1231
903.8380 389.6693 1,293.5073 0.8446 0.0711 1,335.8085
9.5380 9.5380 9.5380 9.5380Mitigated 59.8829 1.1481 74.3147 0.1231
NBio- CO2 Total CO2 CH4 N2O CO2e
Category tons/yr MT/yr
Exhaust PM10
PM10 Total
Fugitive PM2.5
Exhaust PM2.5
PM2.5 Total
Bio- CO2
1,540.3805
6.0 Area Detail
6.1 Mitigation Measures Area
ROG NOx CO SO2 Fugitive PM10
Total 1,535.0265 0.0618 0.0128
0.0000
Condo/Townhouse 4.69702e+006
1,535.0265 0.0618 0.0128 1,540.3805
Land Use kWh/yr ton
MT/yr
City Park 0 0.0000 0.0000 0.0000
Electricity Use
Total CO2 CH4 N2O CO2e

7.0 Water Detail
7.1 Mitigation Measures Water
903.8380 389.6693 1,293.5073 0.8446 0.0711 1,335.8085
9.5380 9.5380 9.5380 9.5380Total 59.8829 1.1481 74.3147 0.1231
0.0000 10.6128 10.6128 0.0105 0.0000 10.87580.0357 0.0357 0.0357 0.0357Landscaping 0.2017 0.0759 6.5430 3.4000e-004
903.8380 379.0565 1,282.8945 0.8341 0.0711 1,324.9327
9.5022 9.5022 9.5022 9.5022Hearth 54.9029 1.0722 67.7717 0.1228
0.0000 0.0000 0.0000 0.0000 0.0000 0.00000.0000 0.0000 0.0000 0.0000Consumer Products
4.7783
0.0000 0.0000 0.0000 0.0000 0.0000 0.00000.0000 0.0000 0.0000 0.0000Architectural Coating
0.0000
Total CO2 CH4 N2O CO2e
SubCategory tons/yr MT/yr
PM10 Total
Fugitive PM2.5
Exhaust PM2.5
PM2.5 Total
Bio- CO2 NBio- CO2
Mitigated
ROG NOx CO SO2 Fugitive PM10
Exhaust PM10
903.8380 389.6693 1,293.5073 0.8446 0.0711 1,335.8085
9.5380 9.5380 9.5380 9.5380Total 59.8829 1.1481 74.3147 0.1231
0.0000 10.6128 10.6128 0.0105 0.0000 10.87580.0357 0.0357 0.0357 0.0357Landscaping 0.2017 0.0759 6.5430 3.4000e-004
903.8380 379.0565 1,282.8945 0.8341 0.0711 1,324.9327
9.5022 9.5022 9.5022 9.5022Hearth 54.9029 1.0722 67.7717 0.1228
0.0000 0.0000 0.0000 0.0000 0.0000 0.00000.0000 0.0000 0.0000 0.0000Consumer Products
4.7783
0.0000 0.0000 0.0000 0.0000 0.0000 0.00000.0000 0.0000 0.0000 0.0000Architectural Coating
0.0000
SubCategory tons/yr MT/yr

34.7294
Condo/Townhouse 57.0098 / 35.9409
391.1807 1.8727 0.0470 451.9949
Land Use Mgal ton
MT/yr
City Park 0 / 9.53185 34.6087 1.3900e-003
2.9000e-004
486.7243
Mitigated
Indoor/Outdoor Use
Total CO2 CH4 N2O CO2e
Total 425.7893 1.8741 0.0473
34.7294
Condo/Townhouse 57.0098 / 35.9409
391.1807 1.8727 0.0470 451.9949
Land Use Mgal ton
MT/yr
City Park 0 / 9.53185 34.6087 1.3900e-003
2.9000e-004
7.2 Water by Land UseUnmitigated
Indoor/Outdoor Use
Total CO2 CH4 N2O CO2e
Unmitigated 425.7893 1.8741 0.0473 486.7243
Category ton
MT/yr
Mitigated 425.7893 1.8741 0.0473 486.7243
Total CO2 CH4 N2O CO2e

202.7649Total 81.8439 4.8368 0.0000
0.3470
Condo/Townhouse 402.5 81.7039 4.8286 0.0000 202.4179
Land Use tons ton
MT/yr
City Park 0.69 0.1401 8.2800e-003
0.0000
8.2 Waste by Land UseUnmitigated
Waste Disposed
Total CO2 CH4 N2O CO2e
Unmitigated 81.8439 4.8368 0.0000 202.7649
ton
MT/yr
Mitigated 81.8439 4.8368 0.0000 202.7649
486.7243
8.0 Waste Detail
8.1 Mitigation Measures Waste
Category/Year
Total CO2 CH4 N2O CO2e
Total 425.7893 1.8741 0.0473

User Defined Equipment
Equipment Type Number
11.0 Vegetation
Load Factor Fuel Type
Boilers
Equipment Type Number Heat Input/Day Heat Input/Year Boiler Rating Fuel Type
Horse Power Load Factor Fuel Type
10.0 Stationary Equipment
Fire Pumps and Emergency Generators
Equipment Type Number Hours/Day Hours/Year Horse Power
202.7649
9.0 Operational Offroad
Equipment Type Number Hours/Day Days/Year
Total 81.8439 4.8368 0.0000
0.3470
Condo/Townhouse 402.5 81.7039 4.8286 0.0000 202.4179
Land Use tons ton
MT/yr
City Park 0.69 0.1401 8.2800e-003
0.0000
Mitigated
Waste Disposed
Total CO2 CH4 N2O CO2e
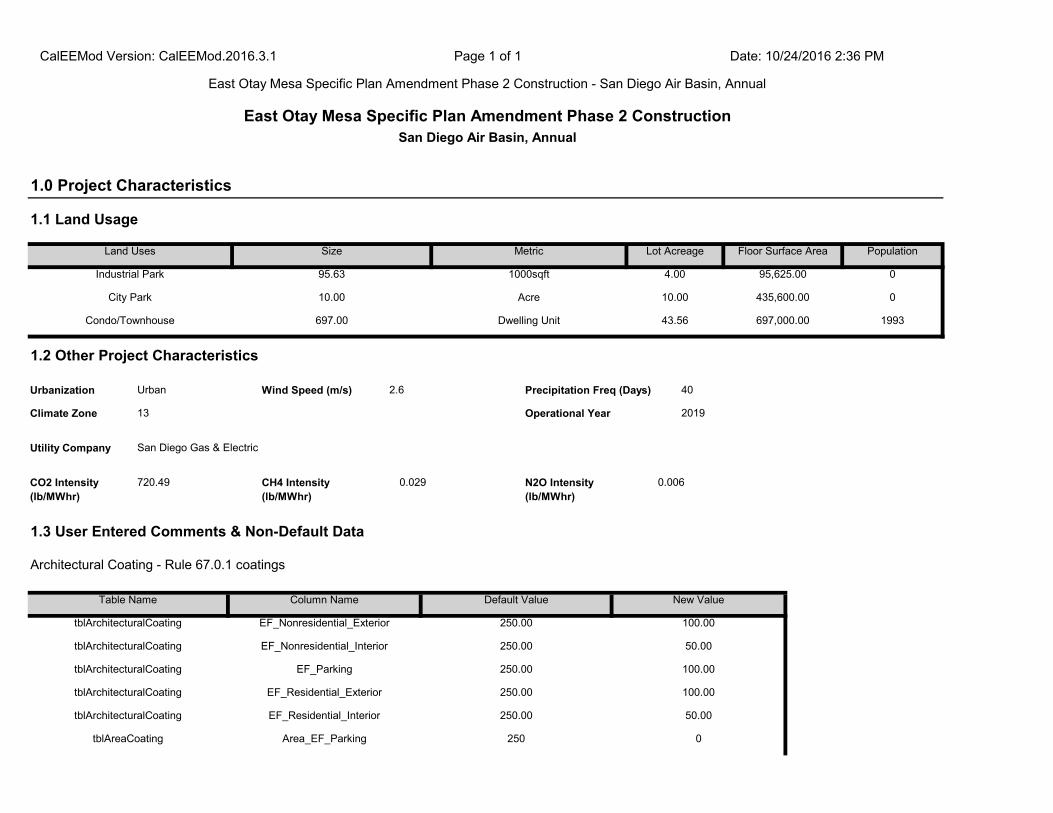
tblArchitecturalCoating EF_Residential_Interior 250.00 50.00
tblAreaCoating Area_EF_Parking 250 0
tblArchitecturalCoating EF_Parking 250.00 100.00
tblArchitecturalCoating EF_Residential_Exterior 250.00 100.00
tblArchitecturalCoating EF_Nonresidential_Exterior 250.00 100.00
tblArchitecturalCoating EF_Nonresidential_Interior 250.00 50.00
1.3 User Entered Comments & Non-Default Data
Architectural Coating - Rule 67.0.1 coatings
Table Name Column Name Default Value New Value
CO2 Intensity (lb/MWhr)
720.49 CH4 Intensity (lb/MWhr)
0.029 N2O Intensity (lb/MWhr)
0.006
40
Climate Zone 13 Operational Year 2019
Utility Company San Diego Gas & Electric
1.2 Other Project Characteristics
Urbanization Urban Wind Speed (m/s) 2.6 Precipitation Freq (Days)
Condo/Townhouse 697.00 Dwelling Unit 43.56 697,000.00 1993
City Park 10.00 Acre 10.00 435,600.00 0
Floor Surface Area Population
Industrial Park 95.63 1000sqft 4.00 95,625.00 0
1.0 Project Characteristics
1.1 Land Usage
Land Uses Size Metric Lot Acreage
CalEEMod Version: CalEEMod.2016.3.1 Page 1 of 1 Date: 10/24/2016 2:36 PM
East Otay Mesa Specific Plan Amendment Phase 2 Construction - San Diego Air Basin, Annual
East Otay Mesa Specific Plan Amendment Phase 2 ConstructionSan Diego Air Basin, Annual

tblConstEquipMitigation Tier No Change Tier 3
tblConstructionPhase NumDays 75.00 132.00
tblConstEquipMitigation Tier No Change Tier 3
tblConstEquipMitigation Tier No Change Tier 3
tblConstEquipMitigation Tier No Change Tier 3
tblConstEquipMitigation Tier No Change Tier 3
tblConstEquipMitigation Tier No Change Tier 3
tblConstEquipMitigation Tier No Change Tier 3
tblConstEquipMitigation Tier No Change Tier 3
tblConstEquipMitigation Tier No Change Tier 3
tblConstEquipMitigation NumberOfEquipmentMitigated 0.00 2.00
tblConstEquipMitigation Tier No Change Tier 3
tblConstEquipMitigation NumberOfEquipmentMitigated 0.00 2.00
tblConstEquipMitigation NumberOfEquipmentMitigated 0.00 8.00
tblConstEquipMitigation NumberOfEquipmentMitigated 0.00 2.00
tblConstEquipMitigation NumberOfEquipmentMitigated 0.00 2.00
tblConstEquipMitigation NumberOfEquipmentMitigated 0.00 6.00
tblConstEquipMitigation NumberOfEquipmentMitigated 0.00 2.00
tblConstEquipMitigation NumberOfEquipmentMitigated 0.00 2.00
tblConstEquipMitigation NumberOfEquipmentMitigated 0.00 2.00
tblConstDustMitigation WaterUnpavedRoadVehicleSpeed 40 15
tblConstEquipMitigation NumberOfEquipmentMitigated 0.00 2.00
tblAreaMitigation UseLowVOCPaintResidentialExteriorValue
250 0
tblAreaMitigation UseLowVOCPaintResidentialInteriorValue
250 0
tblAreaMitigation UseLowVOCPaintNonresidentialExteriorValue
250 0
tblAreaMitigation UseLowVOCPaintNonresidentialInteriorValue
250 0
tblAreaCoating Area_Residential_Exterior 470475 0
tblAreaCoating Area_Residential_Interior 1411425 0
tblAreaCoating Area_Nonresidential_Exterior 265613 0
tblAreaCoating Area_Nonresidential_Interior 796838 0

0.0000 2,459.8897
2,459.8897 0.3345 0.0000 2,468.2525
1.0769 0.5443 1.6213 0.2894 0.5113 0.8007Maximum 9.9375 11.6130 11.6354 0.0271
0.0000 2,459.8897
2,459.8897 0.3345 0.0000 2,468.2525
1.0769 0.5443 1.6213 0.2894 0.5113 0.80072019 9.9375 11.6130 11.6354 0.0271
NBio- CO2 Total CO2 CH4 N2O CO2e
Year tons/yr MT/yr
Exhaust PM10
PM10 Total
Fugitive PM2.5
Exhaust PM2.5
PM2.5 Total
Bio- CO2
2.0 Emissions Summary
2.1 Overall ConstructionUnmitigated Construction
ROG NOx CO SO2 Fugitive PM10
tblOffRoadEquipment OffRoadEquipmentUnitAmount 1.00 2.00
tblProjectCharacteristics OperationalYear 2018 2019
tblOffRoadEquipment OffRoadEquipmentUnitAmount 1.00 2.00
tblOffRoadEquipment OffRoadEquipmentUnitAmount 3.00 6.00
tblOffRoadEquipment OffRoadEquipmentUnitAmount 1.00 2.00
tblOffRoadEquipment OffRoadEquipmentUnitAmount 3.00 6.00
tblOffRoadEquipment HorsePower 132.00 130.00
tblOffRoadEquipment OffRoadEquipmentUnitAmount 1.00 2.00
tblOffRoadEquipment HorsePower 231.00 226.00
tblOffRoadEquipment HorsePower 130.00 125.00
tblLandUse LandUseSquareFeet 95,630.00 95,625.00
tblLandUse LotAcreage 2.20 4.00
tblLandUse GreenSpaceAllowEdit 1.00 0.00
tblLandUse GreenSpaceSquareFeet 435,600.00 0.00
tblLandUse BuildingSpaceSquareFeet 95,630.00 95,625.00
tblLandUse BuildingSpaceSquareFeet 0.00 435,600.00
tblConstructionPhase NumDays 1,110.00 261.00
tblConstructionPhase NumDays 75.00 261.00

Total CO2 CH4 N2O CO2e
Category tons/yr MT/yr
PM10 Total
Fugitive PM2.5
Exhaust PM2.5
PM2.5 Total
Bio- CO2 NBio- CO2
2.2 Overall OperationalUnmitigated Operational
ROG NOx CO SO2 Fugitive PM10
Exhaust PM10
12 7-24-2019 9-30-2019 3.9976 3.3799
Highest 5.3497 4.5231
10 1-24-2019 4-23-2019 5.2513 4.4428
11 4-24-2019 7-23-2019 5.3497 4.5231
Quarter Start Date End Date Maximum Unmitigated ROG + NOX (tons/quarter) Maximum Mitigated ROG + NOX (tons/quarter)
9 10-24-2018 1-23-2019 1.3588 1.1499
0.00 0.00 0.00 0.00 0.00 0.000.00 27.41 9.20 0.00 22.98 14.67
NBio-CO2 Total CO2 CH4 N20 CO2e
Percent Reduction
6.67 22.87 -3.81 0.00
Exhaust PM10
PM10 Total
Fugitive PM2.5
Exhaust PM2.5
PM2.5 Total
Bio- CO2ROG NOx CO SO2 Fugitive PM10
0.0000 2,459.8885
2,459.8885 0.3345 0.0000 2,468.2512
1.0769 0.3951 1.4721 0.2894 0.3938 0.6832Maximum 9.2742 8.9571 12.0788 0.0271
0.0000 2,459.8885
2,459.8885 0.3345 0.0000 2,468.2512
1.0769 0.3951 1.4721 0.2894 0.3938 0.68322019 9.2742 8.9571 12.0788 0.0271
Total CO2 CH4 N2O CO2e
Year tons/yr MT/yr
PM10 Total
Fugitive PM2.5
Exhaust PM2.5
PM2.5 Total
Bio- CO2 NBio- CO2
Mitigated Construction
ROG NOx CO SO2 Fugitive PM10
Exhaust PM10

3.0 Construction Detail
Construction Phase
0.00 0.00 0.00 0.00 0.00 0.000.00 0.00 0.00 0.00 0.00 0.00
NBio-CO2 Total CO2 CH4 N20 CO2e
Percent Reduction
0.00 0.00 0.00 0.00
Exhaust PM10
PM10 Total
Fugitive PM2.5
Exhaust PM2.5
PM2.5 Total
Bio- CO2ROG NOx CO SO2 Fugitive PM10
830.7229 8,603.5738
9,434.2967 8.5596 0.1395 9,689.8645
4.8003 7.7172 12.5175 1.2857 7.7132 8.9989Total 50.3820 8.7685 78.8291 0.1616
21.4231 434.5622 455.9853 2.2179 0.0556 527.99280.0000 0.0000 0.0000 0.0000Water
89.3282 0.0000 89.3282 5.2792 0.0000 221.30680.0000 0.0000 0.0000 0.0000Waste
0.0000 5,466.5595
5,466.5595 0.3092 0.0000 5,474.2894
4.8003 0.0679 4.8682 1.2857 0.0639 1.3496Mobile 1.6171 7.2101 19.3288 0.0594
0.0000 2,392.0509
2,392.0509 0.0807 0.0273 2,402.2088
0.0516 0.0516 0.0516 0.0516Energy 0.0747 0.6441 0.3134 4.0700e-003
719.9715 310.4012 1,030.3727 0.6727 0.0566 1,064.0668
7.5977 7.5977 7.5977 7.5977Area 48.6902 0.9143 59.1869 0.0981
Total CO2 CH4 N2O CO2e
Category tons/yr MT/yr
PM10 Total
Fugitive PM2.5
Exhaust PM2.5
PM2.5 Total
Bio- CO2 NBio- CO2
Mitigated Operational
ROG NOx CO SO2 Fugitive PM10
Exhaust PM10
830.7229 8,603.5738
9,434.2967 8.5596 0.1395 9,689.8645
4.8003 7.7172 12.5175 1.2857 7.7132 8.9989Total 50.3820 8.7685 78.8291 0.1616
21.4231 434.5622 455.9853 2.2179 0.0556 527.99280.0000 0.0000 0.0000 0.0000Water
89.3282 0.0000 89.3282 5.2792 0.0000 221.30680.0000 0.0000 0.0000 0.0000Waste
0.0000 5,466.5595
5,466.5595 0.3092 0.0000 5,474.2894
4.8003 0.0679 4.8682 1.2857 0.0639 1.3496Mobile 1.6171 7.2101 19.3288 0.0594
0.0000 2,392.0509
2,392.0509 0.0807 0.0273 2,402.2088
0.0516 0.0516 0.0516 0.0516Energy 0.0747 0.6441 0.3134 4.0700e-003
719.9715 310.4012 1,030.3727 0.6727 0.0566 1,064.0668
7.5977 7.5977 7.5977 7.5977Area 48.6902 0.9143 59.1869 0.0981

10.80 7.30 20.00 LD_Mix HDT_Mix HHDT
7.30 20.00 LD_Mix HDT_Mix HHDT
Paving 10 25.00 0.00 0.00
Building Construction 18 725.00 162.00 0.00 10.80
Worker Trip Length
Vendor Trip Length
Hauling Trip Length
Worker Vehicle Class
Vendor Vehicle Class
Hauling Vehicle Class
Trips and VMT
Phase Name Offroad Equipment Count
Worker Trip Number
Vendor Trip Number
Hauling Trip Number
Architectural Coating Air Compressors 2 6.00 78 0.48
Paving Tractors/Loaders/Backhoes 2 8.00 97 0.37
Paving Rollers 2 8.00 80 0.38
Paving Paving Equipment 2 8.00 130 0.36
Paving Pavers 2 8.00 125 0.42
Paving Cement and Mortar Mixers 2 8.00 9 0.56
Building Construction Welders 2 8.00 46 0.45
Building Construction Tractors/Loaders/Backhoes 6 7.00 97 0.37
Building Construction Generator Sets 2 8.00 84 0.74
Building Construction Forklifts 6 8.00 89 0.20
Load Factor
Building Construction Cranes 2 7.00 226 0.29
OffRoad Equipment
Phase Name Offroad Equipment Type Amount Usage Hours Horse Power
132
Acres of Grading (Site Preparation Phase): 0
Acres of Grading (Grading Phase): 0
Acres of Paving: 0
Residential Indoor: 1,411,425; Residential Outdoor: 470,475; Non-Residential Indoor: 796,838; Non-Residential Outdoor: 265,613;
3 Architectural Coating Architectural Coating 1/1/2019 12/31/2019 5
261
2 Paving Paving 1/1/2019 12/31/2019 5 261
End Date Num Days Week
Num Days Phase Description
1 Building Construction Building Construction 1/1/2019 12/31/2019 5
Phase Number
Phase Name Phase Type Start Date

0.0000 708.1713 708.1713 0.0228 0.0000 708.74060.7587 5.5400e-003
0.7643 0.2016 5.1000e-003
0.2067Worker 0.3730 0.2862 2.7683 7.8400e-003
0.0000 561.6698 561.6698 0.0451 0.0000 562.79670.1403 0.0184 0.1587 0.0405 0.0176 0.0581Vendor 0.0990 2.6535 0.7129 5.7800e-003
0.0000 0.0000 0.0000 0.0000 0.0000 0.00000.0000 0.0000 0.0000 0.0000 0.0000 0.0000Hauling 0.0000 0.0000 0.0000 0.0000
Total CO2 CH4 N2O CO2e
Category tons/yr MT/yr
PM10 Total
Fugitive PM2.5
Exhaust PM2.5
PM2.5 Total
Bio- CO2 NBio- CO2
Unmitigated Construction Off-Site
ROG NOx CO SO2 Fugitive PM10
Exhaust PM10
0.0000 611.0604 611.0604 0.1487 0.0000 614.77730.3354 0.3354 0.3154 0.3154Total 0.6138 5.4719 4.4684 7.0000e-003
0.0000 611.0604 611.0604 0.1487 0.0000 614.77730.3354 0.3354 0.3154 0.3154
CO2e
Category tons/yr MT/yr
Off-Road 0.6138 5.4719 4.4684 7.0000e-003
PM2.5 Total
Bio- CO2 NBio- CO2 Total CO2 CH4 N2OSO2 Fugitive PM10
Exhaust PM10
PM10 Total
Fugitive PM2.5
Exhaust PM2.5
Use Cleaner Engines for Construction Equipment
Water Exposed Area
Reduce Vehicle Speed on Unpaved Roads
3.2 Building Construction - 2019Unmitigated Construction On-Site
ROG NOx CO
7.30 20.00 LD_Mix HDT_Mix HHDT
3.1 Mitigation Measures Construction
Architectural Coating 2 145.00 0.00 0.00 10.80

3.3 Paving - 2019Unmitigated Construction On-Site
0.0000 1,269.8411
1,269.8411 0.0679 0.0000 1,271.5372
0.8990 0.0239 0.9229 0.2421 0.0227 0.2648Total 0.4720 2.9398 3.4812 0.0136
0.0000 708.1713 708.1713 0.0228 0.0000 708.74060.7587 5.5400e-003
0.7643 0.2016 5.1000e-003
0.2067Worker 0.3730 0.2862 2.7683 7.8400e-003
0.0000 561.6698 561.6698 0.0451 0.0000 562.79670.1403 0.0184 0.1587 0.0405 0.0176 0.0581Vendor 0.0990 2.6535 0.7129 5.7800e-003
0.0000 0.0000 0.0000 0.0000 0.0000 0.00000.0000 0.0000 0.0000 0.0000 0.0000 0.0000Hauling 0.0000 0.0000 0.0000 0.0000
Total CO2 CH4 N2O CO2e
Category tons/yr MT/yr
PM10 Total
Fugitive PM2.5
Exhaust PM2.5
PM2.5 Total
Bio- CO2 NBio- CO2
Mitigated Construction Off-Site
ROG NOx CO SO2 Fugitive PM10
Exhaust PM10
0.0000 611.0597 611.0597 0.1487 0.0000 614.77650.2353 0.2353 0.2353 0.2353Total 0.1752 3.6995 4.6499 7.0000e-003
0.0000 611.0597 611.0597 0.1487 0.0000 614.77650.2353 0.2353 0.2353 0.2353Off-Road 0.1752 3.6995 4.6499 7.0000e-003
Total CO2 CH4 N2O CO2e
Category tons/yr MT/yr
PM10 Total
Fugitive PM2.5
Exhaust PM2.5
PM2.5 Total
Bio- CO2 NBio- CO2
Mitigated Construction On-Site
ROG NOx CO SO2 Fugitive PM10
Exhaust PM10
0.0000 1,269.8411
1,269.8411 0.0679 0.0000 1,271.5372
0.8990 0.0239 0.9229 0.2421 0.0227 0.2648Total 0.4720 2.9398 3.4812 0.0136

Total CO2 CH4 N2O CO2e
Category tons/yr MT/yr
PM10 Total
Fugitive PM2.5
Exhaust PM2.5
PM2.5 Total
Bio- CO2 NBio- CO2
Mitigated Construction On-Site
ROG NOx CO SO2 Fugitive PM10
Exhaust PM10
0.0000 24.4197 24.4197 7.9000e-004
0.0000 24.43930.0262 1.9000e-004
0.0264 6.9500e-003
1.8000e-004
7.1300e-003
Total 0.0129 9.8700e-003
0.0955 2.7000e-004
0.0000 24.4197 24.4197 7.9000e-004
0.0000 24.43930.0262 1.9000e-004
0.0264 6.9500e-003
1.8000e-004
7.1300e-003
Worker 0.0129 9.8700e-003
0.0955 2.7000e-004
0.0000 0.0000 0.0000 0.0000 0.0000 0.00000.0000 0.0000 0.0000 0.0000 0.0000 0.0000Vendor 0.0000 0.0000 0.0000 0.0000
0.0000 0.0000 0.0000 0.0000 0.0000 0.00000.0000 0.0000 0.0000 0.0000 0.0000 0.0000Hauling 0.0000 0.0000 0.0000 0.0000
Total CO2 CH4 N2O CO2e
Category tons/yr MT/yr
PM10 Total
Fugitive PM2.5
Exhaust PM2.5
PM2.5 Total
Bio- CO2 NBio- CO2
Unmitigated Construction Off-Site
ROG NOx CO SO2 Fugitive PM10
Exhaust PM10
0.0000 346.2944 346.2944 0.1070 0.0000 348.96990.1501 0.1501 0.1384 0.1384Total 0.2622 2.6552 2.5561 3.9100e-003
0.0000 0.0000 0.0000 0.0000 0.0000 0.00000.0000 0.0000 0.0000 0.0000Paving 0.0000
0.0000 346.2944 346.2944 0.1070 0.0000 348.96990.1501 0.1501 0.1384 0.1384Off-Road 0.2622 2.6552 2.5561 3.9100e-003
Total CO2 CH4 N2O CO2e
Category tons/yr MT/yr
PM10 Total
Fugitive PM2.5
Exhaust PM2.5
PM2.5 Total
Bio- CO2 NBio- CO2ROG NOx CO SO2 Fugitive PM10
Exhaust PM10

0.0000 66.6399 66.6399 5.6300e-003
0.0000 66.78060.0336 0.0336 0.0336 0.0336Total 8.5020 0.4790 0.4806 7.8000e-004
0.0000 66.6399 66.6399 5.6300e-003
0.0000 66.78060.0336 0.0336 0.0336 0.0336Off-Road 0.0695 0.4790 0.4806 7.8000e-004
0.0000 0.0000 0.0000 0.0000 0.0000 0.00000.0000 0.0000 0.0000 0.0000Archit. Coating 8.4325
Total CO2 CH4 N2O CO2e
Category tons/yr MT/yr
PM10 Total
Fugitive PM2.5
Exhaust PM2.5
PM2.5 Total
Bio- CO2 NBio- CO2
3.4 Architectural Coating - 2019Unmitigated Construction On-Site
ROG NOx CO SO2 Fugitive PM10
Exhaust PM10
0.0000 24.4197 24.4197 7.9000e-004
0.0000 24.43930.0262 1.9000e-004
0.0264 6.9500e-003
1.8000e-004
7.1300e-003
Total 0.0129 9.8700e-003
0.0955 2.7000e-004
0.0000 24.4197 24.4197 7.9000e-004
0.0000 24.43930.0262 1.9000e-004
0.0264 6.9500e-003
1.8000e-004
7.1300e-003
Worker 0.0129 9.8700e-003
0.0955 2.7000e-004
0.0000 0.0000 0.0000 0.0000 0.0000 0.00000.0000 0.0000 0.0000 0.0000 0.0000 0.0000Vendor 0.0000 0.0000 0.0000 0.0000
0.0000 0.0000 0.0000 0.0000 0.0000 0.00000.0000 0.0000 0.0000 0.0000 0.0000 0.0000Hauling 0.0000 0.0000 0.0000 0.0000
Total CO2 CH4 N2O CO2e
Category tons/yr MT/yr
PM10 Total
Fugitive PM2.5
Exhaust PM2.5
PM2.5 Total
Bio- CO2 NBio- CO2
Mitigated Construction Off-Site
ROG NOx CO SO2 Fugitive PM10
Exhaust PM10
0.0000 346.2939 346.2939 0.1070 0.0000 348.96950.1098 0.1098 0.1098 0.1098Total 0.0915 1.8966 2.8203 3.9100e-003
0.0000 0.0000 0.0000 0.0000 0.0000 0.00000.0000 0.0000 0.0000 0.0000Paving 0.0000
0.0000 346.2939 346.2939 0.1070 0.0000 348.96950.1098 0.1098 0.1098 0.1098Off-Road 0.0915 1.8966 2.8203 3.9100e-003
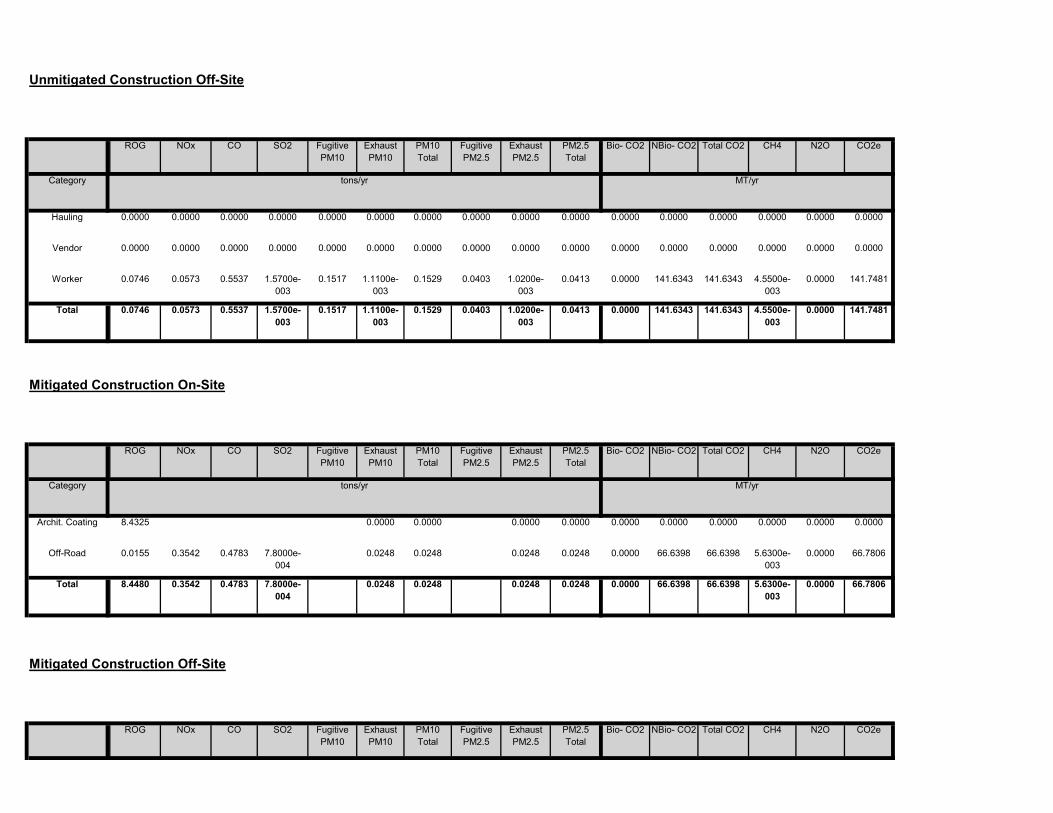
Total CO2 CH4 N2O CO2ePM10 Total
Fugitive PM2.5
Exhaust PM2.5
PM2.5 Total
Bio- CO2 NBio- CO2
Mitigated Construction Off-Site
ROG NOx CO SO2 Fugitive PM10
Exhaust PM10
0.0000 66.6398 66.6398 5.6300e-003
0.0000 66.78060.0248 0.0248 0.0248 0.0248Total 8.4480 0.3542 0.4783 7.8000e-004
0.0000 66.6398 66.6398 5.6300e-003
0.0000 66.78060.0248 0.0248 0.0248 0.0248Off-Road 0.0155 0.3542 0.4783 7.8000e-004
0.0000 0.0000 0.0000 0.0000 0.0000 0.00000.0000 0.0000 0.0000 0.0000Archit. Coating 8.4325
Total CO2 CH4 N2O CO2e
Category tons/yr MT/yr
PM10 Total
Fugitive PM2.5
Exhaust PM2.5
PM2.5 Total
Bio- CO2 NBio- CO2
Mitigated Construction On-Site
ROG NOx CO SO2 Fugitive PM10
Exhaust PM10
0.0000 141.6343 141.6343 4.5500e-003
0.0000 141.74810.1517 1.1100e-003
0.1529 0.0403 1.0200e-003
0.0413Total 0.0746 0.0573 0.5537 1.5700e-003
0.0000 141.6343 141.6343 4.5500e-003
0.0000 141.74810.1517 1.1100e-003
0.1529 0.0403 1.0200e-003
0.0413Worker 0.0746 0.0573 0.5537 1.5700e-003
0.0000 0.0000 0.0000 0.0000 0.0000 0.00000.0000 0.0000 0.0000 0.0000 0.0000 0.0000Vendor 0.0000 0.0000 0.0000 0.0000
0.0000 0.0000 0.0000 0.0000 0.0000 0.00000.0000 0.0000 0.0000 0.0000 0.0000 0.0000Hauling 0.0000 0.0000 0.0000 0.0000
Total CO2 CH4 N2O CO2e
Category tons/yr MT/yr
PM10 Total
Fugitive PM2.5
Exhaust PM2.5
PM2.5 Total
Bio- CO2 NBio- CO2
Unmitigated Construction Off-Site
ROG NOx CO SO2 Fugitive PM10
Exhaust PM10

Total 4,721.62 4,417.61 3,610.69 12,734,943 12,734,943Industrial Park 653.15 238.12 69.81 1,338,516 1,338,516
Condo/Townhouse 4,049.57 3,951.99 3373.48 11,247,170 11,247,170
Annual VMT
City Park 18.90 227.50 167.40 149,257 149,257
4.2 Trip Summary Information
Average Daily Trip Rate Unmitigated MitigatedLand Use Weekday Saturday Sunday Annual VMT
0.0000 5,466.5595
5,466.5595 0.3092 0.0000 5,474.2894
4.8003 0.0679 4.8682 1.2857 0.0639 1.3496Unmitigated 1.6171 7.2101 19.3288 0.0594
0.0000 5,466.5595
5,466.5595 0.3092 0.0000 5,474.2894
4.8003 0.0679 4.8682 1.2857 0.0639 1.3496Mitigated 1.6171 7.2101 19.3288 0.0594
NBio- CO2 Total CO2 CH4 N2O CO2e
Category tons/yr MT/yr
Exhaust PM10
PM10 Total
Fugitive PM2.5
Exhaust PM2.5
PM2.5 Total
Bio- CO2
4.0 Operational Detail - Mobile
4.1 Mitigation Measures Mobile
ROG NOx CO SO2 Fugitive PM10
0.0000 141.6343 141.6343 4.5500e-003
0.0000 141.74810.1517 1.1100e-003
0.1529 0.0403 1.0200e-003
0.0413Total 0.0746 0.0573 0.5537 1.5700e-003
0.0000 141.6343 141.6343 4.5500e-003
0.0000 141.74810.1517 1.1100e-003
0.1529 0.0403 1.0200e-003
0.0413Worker 0.0746 0.0573 0.5537 1.5700e-003
0.0000 0.0000 0.0000 0.0000 0.0000 0.00000.0000 0.0000 0.0000 0.0000 0.0000 0.0000Vendor 0.0000 0.0000 0.0000 0.0000
0.0000 0.0000 0.0000 0.0000 0.0000 0.00000.0000 0.0000 0.0000 0.0000 0.0000 0.0000Hauling 0.0000 0.0000 0.0000 0.0000
Category tons/yr MT/yr

0.0000 739.2777 739.2777 0.0142 0.0136 743.67090.0516 0.0516 0.0516 0.0516NaturalGas Unmitigated
0.0747 0.6441 0.3134 4.0700e-003
0.0000 739.2777 739.2777 0.0142 0.0136 743.67090.0516 0.0516 0.0516 0.0516NaturalGas Mitigated
0.0747 0.6441 0.3134 4.0700e-003
0.0000 1,652.7732
1,652.7732 0.0665 0.0138 1,658.5379
0.0000 0.0000 0.0000 0.0000Electricity Unmitigated
0.0000 1,652.7732
1,652.7732 0.0665 0.0138 1,658.5379
0.0000 0.0000 0.0000 0.0000Electricity Mitigated
NBio- CO2 Total CO2 CH4 N2O CO2e
Category tons/yr MT/yr
Exhaust PM10
PM10 Total
Fugitive PM2.5
Exhaust PM2.5
PM2.5 Total
Bio- CO2
5.0 Energy Detail
Historical Energy Use: N
5.1 Mitigation Measures Energy
ROG NOx CO SO2 Fugitive PM10
0.022573 0.001888 0.002088 0.006279 0.000742 0.001357
0.000742 0.001357
Condo/Townhouse 0.581689 0.044135 0.186694 0.113515 0.018244 0.005600 0.015197
0.005600 0.015197 0.022573 0.001888 0.002088 0.006279City Park 0.581689 0.044135 0.186694 0.113515 0.018244
0.022573 0.001888 0.002088 0.006279 0.000742 0.001357
SBUS MH
Industrial Park 0.581689 0.044135 0.186694 0.113515 0.018244 0.005600 0.015197
LHD2 MHD HHD OBUS UBUS MCYLand Use LDA LDT1 LDT2 MDV LHD1
28.00 13.00 79 19 2
4.4 Fleet Mix
18.80 39.60 86 11 3
Industrial Park 9.50 7.30 7.30 59.00
48.00 19.00 66 28 6
Condo/Townhouse 10.80 7.30 7.50 41.60
H-S or C-C H-O or C-NW Primary Diverted Pass-by
City Park 9.50 7.30 7.30 33.00
4.3 Trip Type Information
Miles Trip % Trip Purpose %
Land Use H-W or C-W H-S or C-C H-O or C-NW H-W or C-W

Unmitigated
739.2777 739.2777 0.0142 0.0136 743.6709
5.3 Energy by Land Use - Electricity
0.0516 0.0516 0.0516 0.0516 0.0000
1.9000e-003
104.0507
Total 0.0747 0.6441 0.3134 4.0700e-003
7.2200e-003
7.2200e-003
0.0000 103.4361 103.4361 1.9800e-003
0.0798 5.7000e-004
7.2200e-003
7.2200e-003
635.8416 635.8416 0.0122 0.0117 639.6201
Industrial Park 1.93832e+006
0.0105 0.0950
0.0444 0.0444 0.0444 0.0444 0.0000
0.0000 0.0000
Condo/Townhouse 1.19152e+007
0.0643 0.5490 0.2336 3.5000e-003
0.0000 0.0000 0.0000 0.0000 0.0000 0.00000.0000 0.0000 0.0000 0.0000
CO2e
Land Use kBTU/yr tons/yr MT/yr
City Park 0 0.0000 0.0000
PM2.5 Total
Bio- CO2 NBio- CO2 Total CO2 CH4 N2OSO2 Fugitive PM10
Exhaust PM10
PM10 Total
Fugitive PM2.5
Exhaust PM2.5
NaturalGas Use
ROG NOx CO
739.2777 0.0142 0.0136 743.6709
Mitigated
0.0516 0.0516 0.0516 0.0000 739.2777
104.0507
Total 0.0747 0.6441 0.3134 4.0700e-003
0.0516
7.2200e-003
0.0000 103.4361 103.4361 1.9800e-003
1.9000e-003
5.7000e-004
7.2200e-003
7.2200e-003
7.2200e-003
635.8416 0.0122 0.0117 639.6201
Industrial Park 1.93832e+006
0.0105 0.0950 0.0798
0.0444 0.0444 0.0444 0.0000 635.8416
0.0000
Condo/Townhouse 1.19152e+007
0.0643 0.5490 0.2336 3.5000e-003
0.0444
0.0000 0.0000 0.0000 0.0000 0.0000 0.00000.0000 0.0000 0.0000 0.0000City Park 0 0.0000 0.0000 0.0000
NBio- CO2 Total CO2 CH4 N2O CO2e
Land Use kBTU/yr tons/yr MT/yr
Exhaust PM10
PM10 Total
Fugitive PM2.5
Exhaust PM2.5
PM2.5 Total
Bio- CO2
5.2 Energy by Land Use - NaturalGasUnmitigated
NaturalGas Use
ROG NOx CO SO2 Fugitive PM10

6.0 Area Detail
6.1 Mitigation Measures Area
431.5148
Total 1,652.7732 0.0665 0.0138 1,658.5379
Industrial Park 1.3158e+006
430.0150 0.0173 3.5800e-003
0.0000
Condo/Townhouse 3.74151e+006
1,222.7583 0.0492 0.0102 1,227.0231
Land Use kWh/yr ton
MT/yr
City Park 0 0.0000 0.0000 0.0000
Mitigated
Electricity Use
Total CO2 CH4 N2O CO2e
431.5148
Total 1,652.7732 0.0665 0.0138 1,658.5379
Industrial Park 1.3158e+006
430.0150 0.0173 3.5800e-003
0.0000
Condo/Townhouse 3.74151e+006
1,222.7583 0.0492 0.0102 1,227.0231
Land Use kWh/yr ton
MT/yr
City Park 0 0.0000 0.0000 0.0000
Electricity Use
Total CO2 CH4 N2O CO2e

0.0000 0.0000 0.0000 0.0000 0.0000 0.00000.0000 0.0000 0.0000 0.0000Architectural Coating
0.0000
Total CO2 CH4 N2O CO2e
SubCategory tons/yr MT/yr
PM10 Total
Fugitive PM2.5
Exhaust PM2.5
PM2.5 Total
Bio- CO2 NBio- CO2
Mitigated
ROG NOx CO SO2 Fugitive PM10
Exhaust PM10
719.9715 310.4012 1,030.3727 0.6727 0.0566 1,064.0668
7.5977 7.5977 7.5977 7.5977Total 48.6902 0.9143 59.1869 0.0981
0.0000 8.4557 8.4557 8.3000e-003
0.0000 8.66320.0285 0.0285 0.0285 0.0285Landscaping 0.1593 0.0603 5.2019 2.7000e-004
719.9715 301.9456 1,021.9171 0.6644 0.0566 1,055.4035
7.5692 7.5692 7.5692 7.5692Hearth 43.7341 0.8541 53.9850 0.0978
0.0000 0.0000 0.0000 0.0000 0.0000 0.00000.0000 0.0000 0.0000 0.0000Consumer Products
4.7968
0.0000 0.0000 0.0000 0.0000 0.0000 0.00000.0000 0.0000 0.0000 0.0000Architectural Coating
0.0000
Total CO2 CH4 N2O CO2e
SubCategory tons/yr MT/yr
PM10 Total
Fugitive PM2.5
Exhaust PM2.5
PM2.5 Total
Bio- CO2 NBio- CO2
6.2 Area by SubCategoryUnmitigated
ROG NOx CO SO2 Fugitive PM10
Exhaust PM10
719.9715 310.4012 1,030.3727 0.6727 0.0566 1,064.0668
7.5977 7.5977 7.5977 7.5977Unmitigated 48.6902 0.9143 59.1869 0.0981
719.9715 310.4012 1,030.3727 0.6727 0.0566 1,064.0668
7.5977 7.5977 7.5977 7.5977Mitigated 48.6902 0.9143 59.1869 0.0981
NBio- CO2 Total CO2 CH4 N2O CO2e
Category tons/yr MT/yr
Exhaust PM10
PM10 Total
Fugitive PM2.5
Exhaust PM2.5
PM2.5 Total
Bio- CO2ROG NOx CO SO2 Fugitive PM10
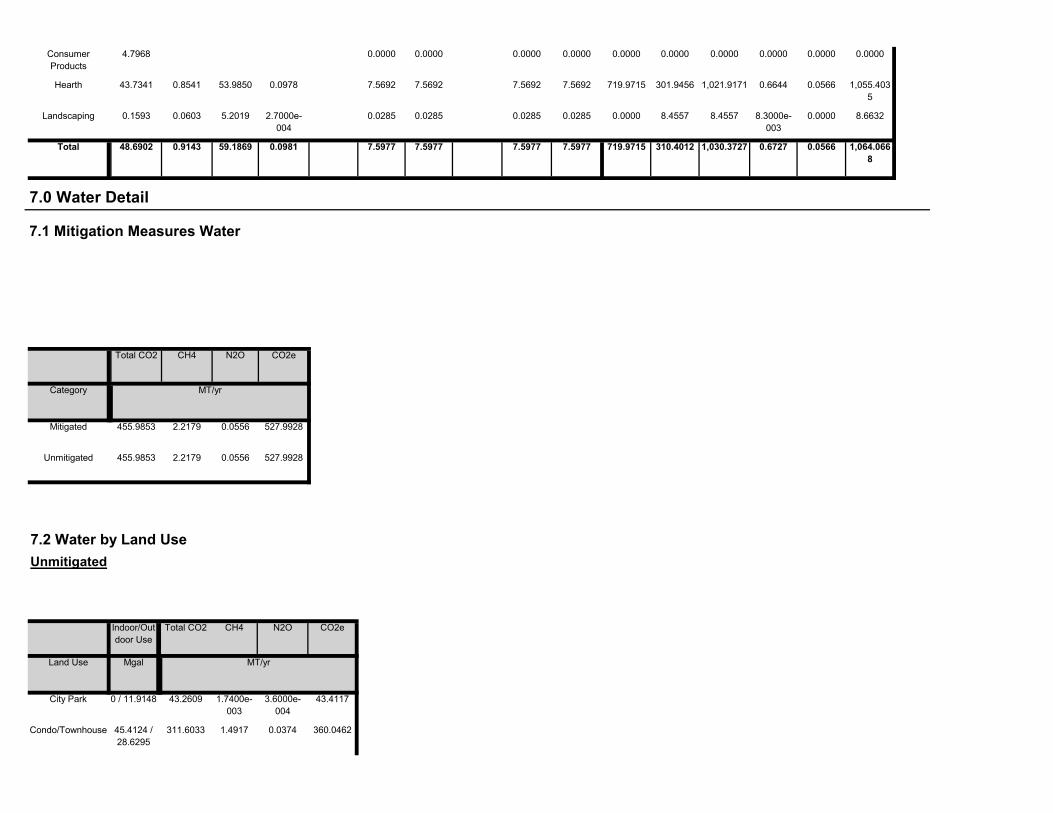
43.4117
Condo/Townhouse 45.4124 / 28.6295
311.6033 1.4917 0.0374 360.0462
Land Use Mgal ton
MT/yr
City Park 0 / 11.9148 43.2609 1.7400e-003
3.6000e-004
7.2 Water by Land UseUnmitigated
Indoor/Outdoor Use
Total CO2 CH4 N2O CO2e
Unmitigated 455.9853 2.2179 0.0556 527.9928
Category ton
MT/yr
Mitigated 455.9853 2.2179 0.0556 527.9928
7.0 Water Detail
7.1 Mitigation Measures Water
Total CO2 CH4 N2O CO2e
719.9715 310.4012 1,030.3727 0.6727 0.0566 1,064.0668
7.5977 7.5977 7.5977 7.5977Total 48.6902 0.9143 59.1869 0.0981
0.0000 8.4557 8.4557 8.3000e-003
0.0000 8.66320.0285 0.0285 0.0285 0.0285Landscaping 0.1593 0.0603 5.2019 2.7000e-004
719.9715 301.9456 1,021.9171 0.6644 0.0566 1,055.4035
7.5692 7.5692 7.5692 7.5692Hearth 43.7341 0.8541 53.9850 0.0978
0.0000 0.0000 0.0000 0.0000 0.0000 0.00000.0000 0.0000 0.0000 0.0000Consumer Products
4.7968

Unmitigated 89.3282 5.2792 0.0000 221.3068
ton
MT/yr
Mitigated 89.3282 5.2792 0.0000 221.3068
8.0 Waste Detail
8.1 Mitigation Measures Waste
Category/Year
Total CO2 CH4 N2O CO2e
124.5348
Total 455.9853 2.2179 0.0556 527.9928
Industrial Park 22.1144 / 0 101.1212 0.7244 0.0178
43.4117
Condo/Townhouse 45.4124 / 28.6295
311.6033 1.4917 0.0374 360.0462
Land Use Mgal ton
MT/yr
City Park 0 / 11.9148 43.2609 1.7400e-003
3.6000e-004
Mitigated
Indoor/Outdoor Use
Total CO2 CH4 N2O CO2e
124.5348
Total 455.9853 2.2179 0.0556 527.9928
Industrial Park 22.1144 / 0 101.1212 0.7244 0.0178

9.0 Operational Offroad
59.6341
Total 89.3282 5.2792 0.0000 221.3068
Industrial Park 118.58 24.0707 1.4225 0.0000
0.4325
Condo/Townhouse 320.62 65.0830 3.8463 0.0000 161.2403
Land Use tons ton
MT/yr
City Park 0.86 0.1746 0.0103 0.0000
Mitigated
Waste Disposed
Total CO2 CH4 N2O CO2e
59.6341
Total 89.3282 5.2792 0.0000 221.3068
Industrial Park 118.58 24.0707 1.4225 0.0000
0.4325
Condo/Townhouse 320.62 65.0830 3.8463 0.0000 161.2403
Land Use tons ton
MT/yr
City Park 0.86 0.1746 0.0103 0.0000
8.2 Waste by Land UseUnmitigated
Waste Disposed
Total CO2 CH4 N2O CO2e
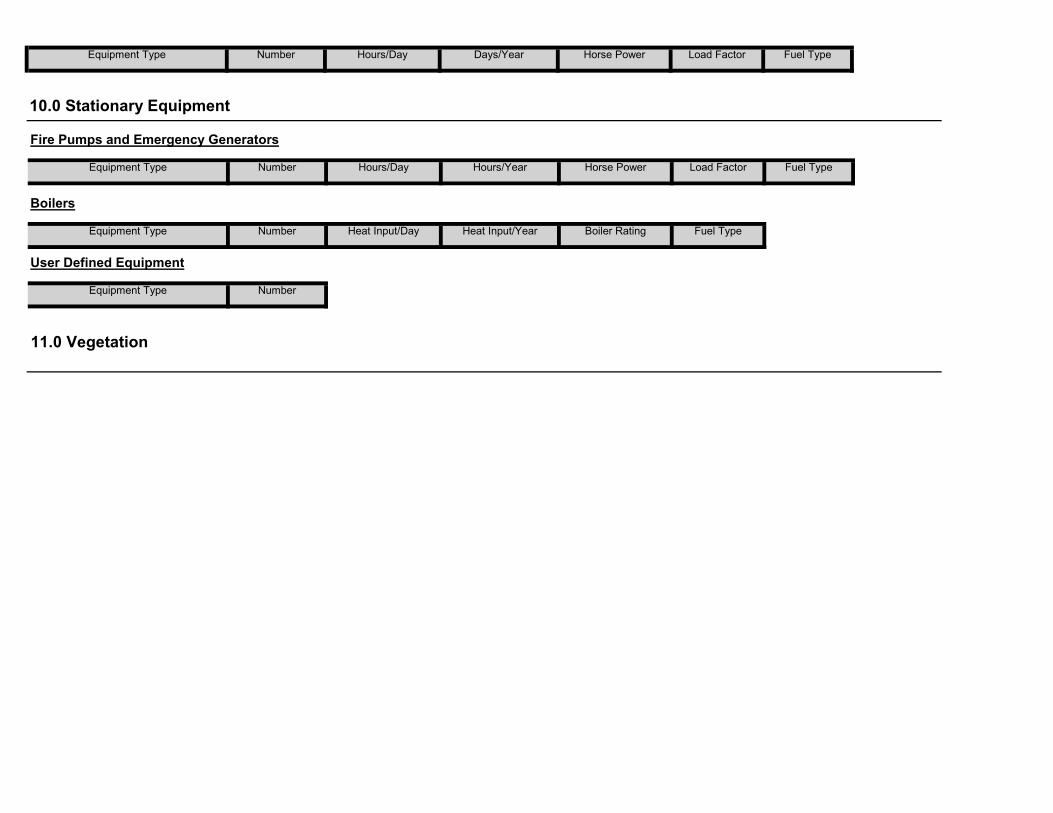
User Defined Equipment
Equipment Type Number
11.0 Vegetation
Fuel Type
Boilers
Equipment Type Number Heat Input/Day Heat Input/Year Boiler Rating Fuel Type
Load Factor Fuel Type
10.0 Stationary Equipment
Fire Pumps and Emergency Generators
Equipment Type Number Hours/Day Hours/Year Horse Power Load Factor
Equipment Type Number Hours/Day Days/Year Horse Power
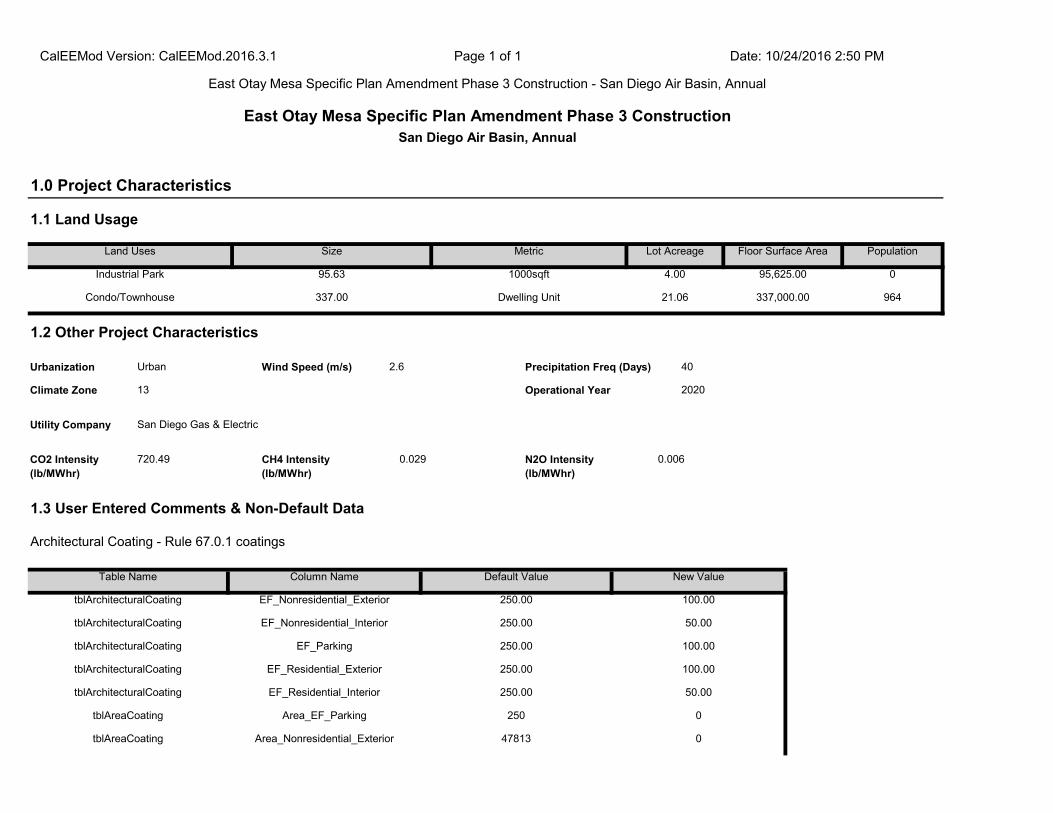
tblAreaCoating Area_Nonresidential_Exterior 47813 0
tblArchitecturalCoating EF_Residential_Interior 250.00 50.00
tblAreaCoating Area_EF_Parking 250 0
tblArchitecturalCoating EF_Parking 250.00 100.00
tblArchitecturalCoating EF_Residential_Exterior 250.00 100.00
tblArchitecturalCoating EF_Nonresidential_Exterior 250.00 100.00
tblArchitecturalCoating EF_Nonresidential_Interior 250.00 50.00
1.3 User Entered Comments & Non-Default Data
Architectural Coating - Rule 67.0.1 coatings
Table Name Column Name Default Value New Value
CO2 Intensity (lb/MWhr)
720.49 CH4 Intensity (lb/MWhr)
0.029 N2O Intensity (lb/MWhr)
0.006
40
Climate Zone 13 Operational Year 2020
Utility Company San Diego Gas & Electric
1.2 Other Project Characteristics
Urbanization Urban Wind Speed (m/s) 2.6 Precipitation Freq (Days)
Condo/Townhouse 337.00 Dwelling Unit 21.06 337,000.00 964
Floor Surface Area Population
Industrial Park 95.63 1000sqft 4.00 95,625.00 0
1.0 Project Characteristics
1.1 Land Usage
Land Uses Size Metric Lot Acreage
CalEEMod Version: CalEEMod.2016.3.1 Page 1 of 1 Date: 10/24/2016 2:50 PM
East Otay Mesa Specific Plan Amendment Phase 3 Construction - San Diego Air Basin, Annual
East Otay Mesa Specific Plan Amendment Phase 3 ConstructionSan Diego Air Basin, Annual
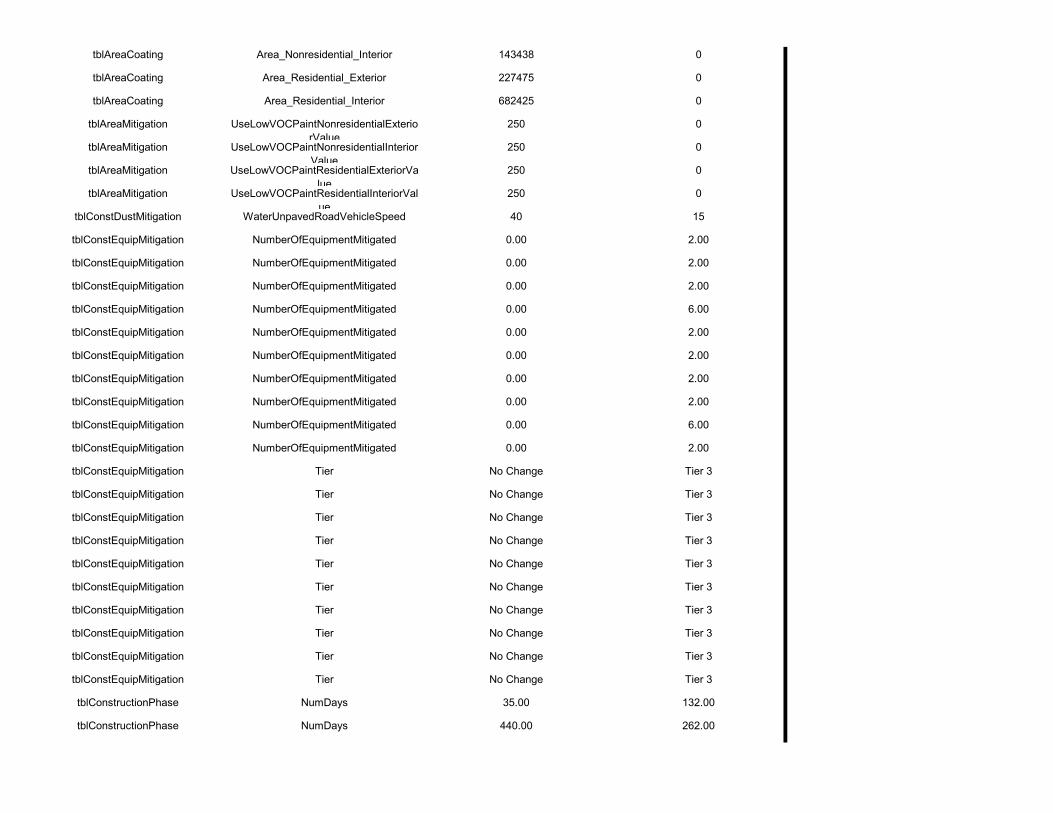
tblConstructionPhase NumDays 440.00 262.00
tblConstEquipMitigation Tier No Change Tier 3
tblConstructionPhase NumDays 35.00 132.00
tblConstEquipMitigation Tier No Change Tier 3
tblConstEquipMitigation Tier No Change Tier 3
tblConstEquipMitigation Tier No Change Tier 3
tblConstEquipMitigation Tier No Change Tier 3
tblConstEquipMitigation Tier No Change Tier 3
tblConstEquipMitigation Tier No Change Tier 3
tblConstEquipMitigation Tier No Change Tier 3
tblConstEquipMitigation Tier No Change Tier 3
tblConstEquipMitigation NumberOfEquipmentMitigated 0.00 2.00
tblConstEquipMitigation Tier No Change Tier 3
tblConstEquipMitigation NumberOfEquipmentMitigated 0.00 2.00
tblConstEquipMitigation NumberOfEquipmentMitigated 0.00 6.00
tblConstEquipMitigation NumberOfEquipmentMitigated 0.00 2.00
tblConstEquipMitigation NumberOfEquipmentMitigated 0.00 2.00
tblConstEquipMitigation NumberOfEquipmentMitigated 0.00 6.00
tblConstEquipMitigation NumberOfEquipmentMitigated 0.00 2.00
tblConstEquipMitigation NumberOfEquipmentMitigated 0.00 2.00
tblConstEquipMitigation NumberOfEquipmentMitigated 0.00 2.00
tblConstDustMitigation WaterUnpavedRoadVehicleSpeed 40 15
tblConstEquipMitigation NumberOfEquipmentMitigated 0.00 2.00
tblAreaMitigation UseLowVOCPaintResidentialExteriorValue
250 0
tblAreaMitigation UseLowVOCPaintResidentialInteriorValue
250 0
tblAreaMitigation UseLowVOCPaintNonresidentialExteriorValue
250 0
tblAreaMitigation UseLowVOCPaintNonresidentialInteriorValue
250 0
tblAreaCoating Area_Residential_Exterior 227475 0
tblAreaCoating Area_Residential_Interior 682425 0
tblAreaCoating Area_Nonresidential_Interior 143438 0

0.0000 1,466.3334
1,466.3334 0.2609 0.0000 1,472.8556
0.4287 0.4277 0.8564 0.1149 0.4022 0.5172Maximum 4.1742 8.2503 8.3304 0.0166
0.0000 1,466.3334
1,466.3334 0.2609 0.0000 1,472.8556
0.4287 0.4277 0.8564 0.1149 0.4022 0.51722020 4.1742 8.2503 8.3304 0.0166
NBio- CO2 Total CO2 CH4 N2O CO2e
Year tons/yr MT/yr
Exhaust PM10
PM10 Total
Fugitive PM2.5
Exhaust PM2.5
PM2.5 Total
Bio- CO2
2.0 Emissions Summary
2.1 Overall ConstructionUnmitigated Construction
ROG NOx CO SO2 Fugitive PM10
tblProjectCharacteristics OperationalYear 2018 2020
tblTripsAndVMT WorkerTripNumber 20.00 25.00
tblOffRoadEquipment OffRoadEquipmentUnitAmount 3.00 6.00
tblOffRoadEquipment OffRoadEquipmentUnitAmount 1.00 2.00
tblOffRoadEquipment OffRoadEquipmentUnitAmount 3.00 6.00
tblOffRoadEquipment OffRoadEquipmentUnitAmount 1.00 2.00
tblOffRoadEquipment OffRoadEquipmentUnitAmount 1.00 2.00
tblOffRoadEquipment OffRoadEquipmentUnitAmount 1.00 2.00
tblOffRoadEquipment HorsePower 130.00 125.00
tblOffRoadEquipment HorsePower 132.00 130.00
tblLandUse LotAcreage 2.20 4.00
tblOffRoadEquipment HorsePower 231.00 226.00
tblLandUse BuildingSpaceSquareFeet 95,630.00 95,625.00
tblLandUse LandUseSquareFeet 95,630.00 95,625.00
tblConstructionPhase NumDays 35.00 262.00

0.0000 1,432.0854
1,432.0854 0.0490 0.0160 1,438.0889
0.0287 0.0287 0.0287 0.0287Energy 0.0415 0.3605 0.1928 2.2600e-003
348.1068 150.0800 498.1868 0.3252 0.0274 514.47723.6735 3.6735 3.6735 3.6735Area 22.9116 0.4420 28.6133 0.0474
Total CO2 CH4 N2O CO2e
Category tons/yr MT/yr
PM10 Total
Fugitive PM2.5
Exhaust PM2.5
PM2.5 Total
Bio- CO2 NBio- CO2
2.2 Overall OperationalUnmitigated Operational
ROG NOx CO SO2 Fugitive PM10
Exhaust PM10
16 7-24-2020 9-30-2020 2.2993 1.8603
Highest 3.0770 2.4896
14 1-24-2020 4-23-2020 3.0502 2.4692
15 4-24-2020 7-23-2020 3.0770 2.4896
Quarter Start Date End Date Maximum Unmitigated ROG + NOX (tons/quarter) Maximum Mitigated ROG + NOX (tons/quarter)
13 10-24-2019 1-23-2020 0.7801 0.6316
0.00 0.00 0.00 0.00 0.00 0.000.00 19.10 9.54 0.00 14.06 10.94
NBio-CO2 Total CO2 CH4 N20 CO2e
Percent Reduction
13.01 22.12 -6.25 0.00
Exhaust PM10
PM10 Total
Fugitive PM2.5
Exhaust PM2.5
PM2.5 Total
Bio- CO2ROG NOx CO SO2 Fugitive PM10
0.0000 1,466.3323
1,466.3323 0.2609 0.0000 1,472.8545
0.4287 0.3460 0.7747 0.1149 0.3457 0.4606Maximum 3.6313 6.4255 8.8511 0.0166
0.0000 1,466.3323
1,466.3323 0.2609 0.0000 1,472.8545
0.4287 0.3460 0.7747 0.1149 0.3457 0.46062020 3.6313 6.4255 8.8511 0.0166
Total CO2 CH4 N2O CO2e
Year tons/yr MT/yr
PM10 Total
Fugitive PM2.5
Exhaust PM2.5
PM2.5 Total
Bio- CO2 NBio- CO2
Mitigated Construction
ROG NOx CO SO2 Fugitive PM10
Exhaust PM10

262
End Date Num Days Week
Num Days Phase Description
1 Building Construction Building Construction 1/1/2020 12/31/2020 5
3.0 Construction Detail
Construction Phase
Phase Number
Phase Name Phase Type Start Date
0.00 0.00 0.00 0.00 0.00 0.000.00 0.00 0.00 0.00 0.00 0.00
NBio-CO2 Total CO2 CH4 N20 CO2e
Percent Reduction
0.00 0.00 0.00 0.00
Exhaust PM10
PM10 Total
Fugitive PM2.5
Exhaust PM2.5
PM2.5 Total
Bio- CO2ROG NOx CO SO2 Fugitive PM10
417.6269 4,648.2668
5,065.8936 5.2563 0.0793 5,220.9344
2.5540 3.7331 6.2871 0.6840 3.7312 4.4152Total 23.7439 4.3385 38.2680 0.0804
13.9818 237.7998 251.7816 1.4456 0.0359 298.61740.0000 0.0000 0.0000 0.0000Water
55.5383 0.0000 55.5383 3.2822 0.0000 137.59390.0000 0.0000 0.0000 0.0000Waste
0.0000 2,828.3015
2,828.3015 0.1542 0.0000 2,832.1570
2.5540 0.0309 2.5849 0.6840 0.0290 0.7130Mobile 0.7907 3.5361 9.4619 0.0307
0.0000 1,432.0854
1,432.0854 0.0490 0.0160 1,438.0889
0.0287 0.0287 0.0287 0.0287Energy 0.0415 0.3605 0.1928 2.2600e-003
348.1068 150.0800 498.1868 0.3252 0.0274 514.47723.6735 3.6735 3.6735 3.6735Area 22.9116 0.4420 28.6133 0.0474
Total CO2 CH4 N2O CO2e
Category tons/yr MT/yr
PM10 Total
Fugitive PM2.5
Exhaust PM2.5
PM2.5 Total
Bio- CO2 NBio- CO2
Mitigated Operational
ROG NOx CO SO2 Fugitive PM10
Exhaust PM10
417.6269 4,648.2668
5,065.8936 5.2563 0.0793 5,220.9344
2.5540 3.7331 6.2871 0.6840 3.7312 4.4152Total 23.7439 4.3385 38.2680 0.0804
13.9818 237.7998 251.7816 1.4456 0.0359 298.61740.0000 0.0000 0.0000 0.0000Water
55.5383 0.0000 55.5383 3.2822 0.0000 137.59390.0000 0.0000 0.0000 0.0000Waste
0.0000 2,828.3015
2,828.3015 0.1542 0.0000 2,832.1570
2.5540 0.0309 2.5849 0.6840 0.0290 0.7130Mobile 0.7907 3.5361 9.4619 0.0307

Use Cleaner Engines for Construction Equipment
7.30 20.00 LD_Mix HDT_Mix HHDT
3.1 Mitigation Measures Construction
Architectural Coating 2 57.00 0.00 0.00 10.80
10.80 7.30 20.00 LD_Mix HDT_Mix HHDT
7.30 20.00 LD_Mix HDT_Mix HHDT
Paving 8 25.00 0.00 0.00
Building Construction 18 283.00 52.00 0.00 10.80
Worker Trip Length
Vendor Trip Length
Hauling Trip Length
Worker Vehicle Class
Vendor Vehicle Class
Hauling Vehicle Class
Trips and VMT
Phase Name Offroad Equipment Count
Worker Trip Number
Vendor Trip Number
Hauling Trip Number
Architectural Coating Air Compressors 2 6.00 78 0.48
Paving Rollers 2 8.00 80 0.38
Paving Paving Equipment 2 8.00 130 0.36
Paving Pavers 2 8.00 125 0.42
Paving Cement and Mortar Mixers 2 8.00 9 0.56
Building Construction Welders 2 8.00 46 0.45
Building Construction Tractors/Loaders/Backhoes 6 7.00 97 0.37
Building Construction Generator Sets 2 8.00 84 0.74
Building Construction Forklifts 6 8.00 89 0.20
Load Factor
Building Construction Cranes 2 7.00 226 0.29
OffRoad Equipment
Phase Name Offroad Equipment Type Amount Usage Hours Horse Power
132
Acres of Grading (Site Preparation Phase): 0
Acres of Grading (Grading Phase): 0
Acres of Paving: 0
Residential Indoor: 682,425; Residential Outdoor: 227,475; Non-Residential Indoor: 143,438; Non-Residential Outdoor: 47,813; Striped
3 Architectural Coating Architectural Coating 1/1/2020 12/31/2020 5
2 Paving Paving 1/1/2020 12/31/2020 5 262

Mitigated Construction On-Site
0.0000 448.4755 448.4755 0.0219 0.0000 449.02160.3425 5.9300e-003
0.3484 0.0921 5.5900e-003
0.0977Total 0.1626 0.8776 1.1983 4.8200e-003
0.0000 268.7331 268.7331 8.0700e-003
0.0000 268.93480.2973 2.1400e-003
0.2994 0.0790 1.9700e-003
0.0810Worker 0.1367 0.1012 0.9920 2.9700e-003
0.0000 179.7424 179.7424 0.0138 0.0000 180.08680.0452 3.7900e-003
0.0490 0.0131 3.6200e-003
0.0167Vendor 0.0260 0.7765 0.2063 1.8500e-003
0.0000 0.0000 0.0000 0.0000 0.0000 0.00000.0000 0.0000 0.0000 0.0000 0.0000 0.0000Hauling 0.0000 0.0000 0.0000 0.0000
Total CO2 CH4 N2O CO2e
Category tons/yr MT/yr
PM10 Total
Fugitive PM2.5
Exhaust PM2.5
PM2.5 Total
Bio- CO2 NBio- CO2
Unmitigated Construction Off-Site
ROG NOx CO SO2 Fugitive PM10
Exhaust PM10
0.0000 604.3027 604.3027 0.1472 0.0000 607.98350.2916 0.2916 0.2742 0.2742Total 0.5532 5.0000 4.4038 7.0200e-003
0.0000 604.3027 604.3027 0.1472 0.0000 607.98350.2916 0.2916 0.2742 0.2742
CO2e
Category tons/yr MT/yr
Off-Road 0.5532 5.0000 4.4038 7.0200e-003
PM2.5 Total
Bio- CO2 NBio- CO2 Total CO2 CH4 N2OSO2 Fugitive PM10
Exhaust PM10
PM10 Total
Fugitive PM2.5
Exhaust PM2.5
Water Exposed Area
Reduce Vehicle Speed on Unpaved Roads
3.2 Building Construction - 2020Unmitigated Construction On-Site
ROG NOx CO

Total CO2 CH4 N2O CO2e
Category tons/yr MT/yr
PM10 Total
Fugitive PM2.5
Exhaust PM2.5
PM2.5 Total
Bio- CO2 NBio- CO2
3.3 Paving - 2020Unmitigated Construction On-Site
ROG NOx CO SO2 Fugitive PM10
Exhaust PM10
0.0000 448.4755 448.4755 0.0219 0.0000 449.02160.3425 5.9300e-003
0.3484 0.0921 5.5900e-003
0.0977Total 0.1626 0.8776 1.1983 4.8200e-003
0.0000 268.7331 268.7331 8.0700e-003
0.0000 268.93480.2973 2.1400e-003
0.2994 0.0790 1.9700e-003
0.0810Worker 0.1367 0.1012 0.9920 2.9700e-003
0.0000 179.7424 179.7424 0.0138 0.0000 180.08680.0452 3.7900e-003
0.0490 0.0131 3.6200e-003
0.0167Vendor 0.0260 0.7765 0.2063 1.8500e-003
0.0000 0.0000 0.0000 0.0000 0.0000 0.00000.0000 0.0000 0.0000 0.0000 0.0000 0.0000Hauling 0.0000 0.0000 0.0000 0.0000
Total CO2 CH4 N2O CO2e
Category tons/yr MT/yr
PM10 Total
Fugitive PM2.5
Exhaust PM2.5
PM2.5 Total
Bio- CO2 NBio- CO2
Mitigated Construction Off-Site
ROG NOx CO SO2 Fugitive PM10
Exhaust PM10
0.0000 604.3020 604.3020 0.1472 0.0000 607.98270.2362 0.2362 0.2362 0.2362Total 0.1759 3.7136 4.6677 7.0200e-003
0.0000 604.3020 604.3020 0.1472 0.0000 607.98270.2362 0.2362 0.2362 0.2362Off-Road 0.1759 3.7136 4.6677 7.0200e-003
Total CO2 CH4 N2O CO2e
Category tons/yr MT/yr
PM10 Total
Fugitive PM2.5
Exhaust PM2.5
PM2.5 Total
Bio- CO2 NBio- CO2ROG NOx CO SO2 Fugitive PM10
Exhaust PM10

0.0000 268.7935 268.7935 0.0843 0.0000 270.90090.0784 0.0784 0.0784 0.0784Total 0.0719 1.4494 2.2175 3.1100e-003
0.0000 0.0000 0.0000 0.0000 0.0000 0.00000.0000 0.0000 0.0000 0.0000Paving 0.0000
0.0000 268.7935 268.7935 0.0843 0.0000 270.90090.0784 0.0784 0.0784 0.0784Off-Road 0.0719 1.4494 2.2175 3.1100e-003
Total CO2 CH4 N2O CO2e
Category tons/yr MT/yr
PM10 Total
Fugitive PM2.5
Exhaust PM2.5
PM2.5 Total
Bio- CO2 NBio- CO2
Mitigated Construction On-Site
ROG NOx CO SO2 Fugitive PM10
Exhaust PM10
0.0000 23.7397 23.7397 7.1000e-004
0.0000 23.75750.0263 1.9000e-004
0.0265 6.9800e-003
1.7000e-004
7.1500e-003
Total 0.0121 8.9400e-003
0.0876 2.6000e-004
0.0000 23.7397 23.7397 7.1000e-004
0.0000 23.75750.0263 1.9000e-004
0.0265 6.9800e-003
1.7000e-004
7.1500e-003
Worker 0.0121 8.9400e-003
0.0876 2.6000e-004
0.0000 0.0000 0.0000 0.0000 0.0000 0.00000.0000 0.0000 0.0000 0.0000 0.0000 0.0000Vendor 0.0000 0.0000 0.0000 0.0000
0.0000 0.0000 0.0000 0.0000 0.0000 0.00000.0000 0.0000 0.0000 0.0000 0.0000 0.0000Hauling 0.0000 0.0000 0.0000 0.0000
Total CO2 CH4 N2O CO2e
Category tons/yr MT/yr
PM10 Total
Fugitive PM2.5
Exhaust PM2.5
PM2.5 Total
Bio- CO2 NBio- CO2
Unmitigated Construction Off-Site
ROG NOx CO SO2 Fugitive PM10
Exhaust PM10
0.0000 268.7938 268.7938 0.0843 0.0000 270.90120.1006 0.1006 0.0928 0.0928Total 0.1896 1.9022 1.9610 3.1100e-003
0.0000 0.0000 0.0000 0.0000 0.0000 0.00000.0000 0.0000 0.0000 0.0000Paving 0.0000
0.0000 268.7938 268.7938 0.0843 0.0000 270.90120.1006 0.1006 0.0928 0.0928Off-Road 0.1896 1.9022 1.9610 3.1100e-003

Total CO2 CH4 N2O CO2ePM10 Total
Fugitive PM2.5
Exhaust PM2.5
PM2.5 Total
Bio- CO2 NBio- CO2
Unmitigated Construction Off-Site
ROG NOx CO SO2 Fugitive PM10
Exhaust PM10
0.0000 66.8953 66.8953 5.1800e-003
0.0000 67.02470.0291 0.0291 0.0291 0.0291Total 3.2292 0.4412 0.4798 7.8000e-004
0.0000 66.8953 66.8953 5.1800e-003
0.0000 67.02470.0291 0.0291 0.0291 0.0291Off-Road 0.0635 0.4412 0.4798 7.8000e-004
0.0000 0.0000 0.0000 0.0000 0.0000 0.00000.0000 0.0000 0.0000 0.0000Archit. Coating 3.1657
Total CO2 CH4 N2O CO2e
Category tons/yr MT/yr
PM10 Total
Fugitive PM2.5
Exhaust PM2.5
PM2.5 Total
Bio- CO2 NBio- CO2
3.4 Architectural Coating - 2020Unmitigated Construction On-Site
ROG NOx CO SO2 Fugitive PM10
Exhaust PM10
0.0000 23.7397 23.7397 7.1000e-004
0.0000 23.75750.0263 1.9000e-004
0.0265 6.9800e-003
1.7000e-004
7.1500e-003
Total 0.0121 8.9400e-003
0.0876 2.6000e-004
0.0000 23.7397 23.7397 7.1000e-004
0.0000 23.75750.0263 1.9000e-004
0.0265 6.9800e-003
1.7000e-004
7.1500e-003
Worker 0.0121 8.9400e-003
0.0876 2.6000e-004
0.0000 0.0000 0.0000 0.0000 0.0000 0.00000.0000 0.0000 0.0000 0.0000 0.0000 0.0000Vendor 0.0000 0.0000 0.0000 0.0000
0.0000 0.0000 0.0000 0.0000 0.0000 0.00000.0000 0.0000 0.0000 0.0000 0.0000 0.0000Hauling 0.0000 0.0000 0.0000 0.0000
Total CO2 CH4 N2O CO2e
Category tons/yr MT/yr
PM10 Total
Fugitive PM2.5
Exhaust PM2.5
PM2.5 Total
Bio- CO2 NBio- CO2
Mitigated Construction Off-Site
ROG NOx CO SO2 Fugitive PM10
Exhaust PM10

0.0000 54.1265 54.1265 1.6200e-003
0.0000 54.16710.0599 4.3000e-004
0.0603 0.0159 4.0000e-004
0.0163Worker 0.0275 0.0204 0.1998 6.0000e-004
0.0000 0.0000 0.0000 0.0000 0.0000 0.00000.0000 0.0000 0.0000 0.0000 0.0000 0.0000Vendor 0.0000 0.0000 0.0000 0.0000
0.0000 0.0000 0.0000 0.0000 0.0000 0.00000.0000 0.0000 0.0000 0.0000 0.0000 0.0000Hauling 0.0000 0.0000 0.0000 0.0000
Total CO2 CH4 N2O CO2e
Category tons/yr MT/yr
PM10 Total
Fugitive PM2.5
Exhaust PM2.5
PM2.5 Total
Bio- CO2 NBio- CO2
Mitigated Construction Off-Site
ROG NOx CO SO2 Fugitive PM10
Exhaust PM10
0.0000 66.8952 66.8952 5.1800e-003
0.0000 67.02470.0249 0.0249 0.0249 0.0249Total 3.1813 0.3555 0.4801 7.8000e-004
0.0000 66.8952 66.8952 5.1800e-003
0.0000 67.02470.0249 0.0249 0.0249 0.0249Off-Road 0.0156 0.3555 0.4801 7.8000e-004
0.0000 0.0000 0.0000 0.0000 0.0000 0.00000.0000 0.0000 0.0000 0.0000Archit. Coating 3.1657
Total CO2 CH4 N2O CO2e
Category tons/yr MT/yr
PM10 Total
Fugitive PM2.5
Exhaust PM2.5
PM2.5 Total
Bio- CO2 NBio- CO2
Mitigated Construction On-Site
ROG NOx CO SO2 Fugitive PM10
Exhaust PM10
0.0000 54.1265 54.1265 1.6200e-003
0.0000 54.16710.0599 4.3000e-004
0.0603 0.0159 4.0000e-004
0.0163Total 0.0275 0.0204 0.1998 6.0000e-004
0.0000 54.1265 54.1265 1.6200e-003
0.0000 54.16710.0599 4.3000e-004
0.0603 0.0159 4.0000e-004
0.0163Worker 0.0275 0.0204 0.1998 6.0000e-004
0.0000 0.0000 0.0000 0.0000 0.0000 0.00000.0000 0.0000 0.0000 0.0000 0.0000 0.0000Vendor 0.0000 0.0000 0.0000 0.0000
0.0000 0.0000 0.0000 0.0000 0.0000 0.00000.0000 0.0000 0.0000 0.0000 0.0000 0.0000Hauling 0.0000 0.0000 0.0000 0.0000
Category tons/yr MT/yr

28.00 13.00 79 19 2
4.4 Fleet Mix
18.80 39.60 86 11 3
Industrial Park 9.50 7.30 7.30 59.00
H-S or C-C H-O or C-NW Primary Diverted Pass-by
Condo/Townhouse 10.80 7.30 7.50 41.60
4.3 Trip Type Information
Miles Trip % Trip Purpose %
Land Use H-W or C-W H-S or C-C H-O or C-NW H-W or C-W
Total 2,611.12 2,148.91 1,700.89 6,776,531 6,776,531Industrial Park 653.15 238.12 69.81 1,338,516 1,338,516
Annual VMT
Condo/Townhouse 1,957.97 1,910.79 1631.08 5,438,015 5,438,015
4.2 Trip Summary Information
Average Daily Trip Rate Unmitigated MitigatedLand Use Weekday Saturday Sunday Annual VMT
0.0000 2,828.3015
2,828.3015 0.1542 0.0000 2,832.1570
2.5540 0.0309 2.5849 0.6840 0.0290 0.7130Unmitigated 0.7907 3.5361 9.4619 0.0307
0.0000 2,828.3015
2,828.3015 0.1542 0.0000 2,832.1570
2.5540 0.0309 2.5849 0.6840 0.0290 0.7130Mitigated 0.7907 3.5361 9.4619 0.0307
NBio- CO2 Total CO2 CH4 N2O CO2e
Category tons/yr MT/yr
Exhaust PM10
PM10 Total
Fugitive PM2.5
Exhaust PM2.5
PM2.5 Total
Bio- CO2
4.0 Operational Detail - Mobile
4.1 Mitigation Measures Mobile
ROG NOx CO SO2 Fugitive PM10
0.0000 54.1265 54.1265 1.6200e-003
0.0000 54.16710.0599 4.3000e-004
0.0603 0.0159 4.0000e-004
0.0163Total 0.0275 0.0204 0.1998 6.0000e-004

309.25680.0215 0.0000 307.4299 307.4299 5.8900e-003
5.6400e-003
1.6900e-003
0.0215 0.0215 0.0215Condo/Townhouse 5.76102e+006
0.0311 0.2655 0.1130
NBio- CO2 Total CO2 CH4 N2O CO2e
Land Use kBTU/yr tons/yr MT/yr
Exhaust PM10
PM10 Total
Fugitive PM2.5
Exhaust PM2.5
PM2.5 Total
Bio- CO2
5.2 Energy by Land Use - NaturalGasUnmitigated
NaturalGas Use
ROG NOx CO SO2 Fugitive PM10
0.0000 410.8660 410.8660 7.8700e-003
7.5300e-003
413.30750.0287 0.0287 0.0287 0.0287NaturalGas Unmitigated
0.0415 0.3605 0.1928 2.2600e-003
0.0000 410.8660 410.8660 7.8700e-003
7.5300e-003
413.30750.0287 0.0287 0.0287 0.0287NaturalGas Mitigated
0.0415 0.3605 0.1928 2.2600e-003
0.0000 1,021.2195
1,021.2195 0.0411 8.5000e-003
1,024.7814
0.0000 0.0000 0.0000 0.0000Electricity Unmitigated
0.0000 1,021.2195
1,021.2195 0.0411 8.5000e-003
1,024.7814
0.0000 0.0000 0.0000 0.0000
CO2e
Category tons/yr MT/yr
Electricity Mitigated
PM2.5 Total
Bio- CO2 NBio- CO2 Total CO2 CH4 N2OSO2 Fugitive PM10
Exhaust PM10
PM10 Total
Fugitive PM2.5
Exhaust PM2.5
0.000745 0.001271
5.0 Energy Detail
Historical Energy Use: N
5.1 Mitigation Measures Energy
ROG NOx CO
0.005558 0.015534 0.023021 0.001902 0.002024 0.006181Condo/Townhouse 0.588316 0.042913 0.184449 0.110793 0.017294
0.023021 0.001902 0.002024 0.006181 0.000745 0.001271
SBUS MH
Industrial Park 0.588316 0.042913 0.184449 0.110793 0.017294 0.005558 0.015534
LHD2 MHD HHD OBUS UBUS MCYLand Use LDA LDT1 LDT2 MDV LHD1

1,024.7814
Mitigated
Total 1,021.2195 0.0411 8.5000e-003
593.2666
Industrial Park 1.3158e+006
430.0150 0.0173 3.5800e-003
431.5148
Land Use kWh/yr ton
MT/yr
Condo/Townhouse 1.80902e+006
591.2045 0.0238 4.9200e-003
413.3075
5.3 Energy by Land Use - ElectricityUnmitigated
Electricity Use
Total CO2 CH4 N2O CO2e
0.0287 0.0000 410.8660 410.8660 7.8700e-003
7.5400e-003
2.2600e-003
0.0287 0.0287 0.0287
103.4361 1.9800e-003
1.9000e-003
104.0507
Total 0.0415 0.3605 0.1928
7.2200e-003
7.2200e-003
7.2200e-003
0.0000 103.4361
309.2568
Industrial Park 1.93832e+006
0.0105 0.0950 0.0798 5.7000e-004
7.2200e-003
0.0215 0.0000 307.4299 307.4299 5.8900e-003
5.6400e-003
1.6900e-003
0.0215 0.0215 0.0215
Land Use kBTU/yr tons/yr MT/yr
Condo/Townhouse 5.76102e+006
0.0311 0.2655 0.1130
Bio- CO2 NBio- CO2 Total CO2 CH4 N2O CO2eFugitive PM10
Exhaust PM10
PM10 Total
Fugitive PM2.5
Exhaust PM2.5
PM2.5 Total
413.3075
Mitigated
NaturalGas Use
ROG NOx CO SO2
0.0287 0.0000 410.8660 410.8660 7.8700e-003
7.5400e-003
2.2600e-003
0.0287 0.0287 0.0287
103.4361 1.9800e-003
1.9000e-003
104.0507
Total 0.0415 0.3605 0.1928
7.2200e-003
7.2200e-003
7.2200e-003
0.0000 103.4361Industrial Park 1.93832e+006
0.0105 0.0950 0.0798 5.7000e-004
7.2200e-003

Total CO2 CH4 N2O CO2ePM10 Total
Fugitive PM2.5
Exhaust PM2.5
PM2.5 Total
Bio- CO2 NBio- CO2
6.2 Area by SubCategoryUnmitigated
ROG NOx CO SO2 Fugitive PM10
Exhaust PM10
348.1068 150.0800 498.1868 0.3252 0.0274 514.47723.6735 3.6735 3.6735 3.6735Unmitigated 22.9116 0.4420 28.6133 0.0474
348.1068 150.0800 498.1868 0.3252 0.0274 514.47723.6735 3.6735 3.6735 3.6735Mitigated 22.9116 0.4420 28.6133 0.0474
NBio- CO2 Total CO2 CH4 N2O CO2e
Category tons/yr MT/yr
Exhaust PM10
PM10 Total
Fugitive PM2.5
Exhaust PM2.5
PM2.5 Total
Bio- CO2
1,024.7814
6.0 Area Detail
6.1 Mitigation Measures Area
ROG NOx CO SO2 Fugitive PM10
Total 1,021.2195 0.0411 8.5000e-003
593.2666
Industrial Park 1.3158e+006
430.0150 0.0173 3.5800e-003
431.5148
Land Use kWh/yr ton
MT/yr
Condo/Townhouse 1.80902e+006
591.2045 0.0238 4.9200e-003
Electricity Use
Total CO2 CH4 N2O CO2e

7.0 Water Detail
7.1 Mitigation Measures Water
348.1068 150.0800 498.1868 0.3252 0.0274 514.47723.6735 3.6735 3.6735 3.6735Total 22.9116 0.4420 28.6133 0.0474
0.0000 4.0891 4.0891 3.9900e-003
0.0000 4.18890.0138 0.0138 0.0138 0.0138Landscaping 0.0765 0.0291 2.5115 1.3000e-004
348.1068 145.9909 494.0976 0.3212 0.0274 510.28843.6597 3.6597 3.6597 3.6597Hearth 21.1455 0.4130 26.1018 0.0473
0.0000 0.0000 0.0000 0.0000 0.0000 0.00000.0000 0.0000 0.0000 0.0000Consumer Products
1.6896
0.0000 0.0000 0.0000 0.0000 0.0000 0.00000.0000 0.0000 0.0000 0.0000Architectural Coating
0.0000
Total CO2 CH4 N2O CO2e
SubCategory tons/yr MT/yr
PM10 Total
Fugitive PM2.5
Exhaust PM2.5
PM2.5 Total
Bio- CO2 NBio- CO2
Mitigated
ROG NOx CO SO2 Fugitive PM10
Exhaust PM10
348.1068 150.0800 498.1868 0.3252 0.0274 514.47723.6735 3.6735 3.6735 3.6735Total 22.9116 0.4420 28.6133 0.0474
0.0000 4.0891 4.0891 3.9900e-003
0.0000 4.18890.0138 0.0138 0.0138 0.0138Landscaping 0.0765 0.0291 2.5115 1.3000e-004
348.1068 145.9909 494.0976 0.3212 0.0274 510.28843.6597 3.6597 3.6597 3.6597Hearth 21.1455 0.4130 26.1018 0.0473
0.0000 0.0000 0.0000 0.0000 0.0000 0.00000.0000 0.0000 0.0000 0.0000Consumer Products
1.6896
0.0000 0.0000 0.0000 0.0000 0.0000 0.00000.0000 0.0000 0.0000 0.0000Architectural Coating
0.0000
SubCategory tons/yr MT/yr

174.0826
Industrial Park 22.1144 / 0 101.1212 0.7244 0.0178 124.5348
Land Use Mgal ton
MT/yr
Condo/Townhouse 21.9569 / 13.8424
150.6604 0.7213 0.0181
298.6174
Mitigated
Indoor/Outdoor Use
Total CO2 CH4 N2O CO2e
Total 251.7816 1.4456 0.0359
174.0826
Industrial Park 22.1144 / 0 101.1212 0.7244 0.0178 124.5348
Land Use Mgal ton
MT/yr
Condo/Townhouse 21.9569 / 13.8424
150.6604 0.7213 0.0181
7.2 Water by Land UseUnmitigated
Indoor/Outdoor Use
Total CO2 CH4 N2O CO2e
Unmitigated 251.7816 1.4456 0.0359 298.6174
Category ton
MT/yr
Mitigated 251.7816 1.4456 0.0359 298.6174
Total CO2 CH4 N2O CO2e

137.5939Total 55.5383 3.2822 0.0000
77.9598
Industrial Park 118.58 24.0707 1.4225 0.0000 59.6341
Land Use tons ton
MT/yr
Condo/Townhouse 155.02 31.4677 1.8597 0.0000
8.2 Waste by Land UseUnmitigated
Waste Disposed
Total CO2 CH4 N2O CO2e
Unmitigated 55.5383 3.2822 0.0000 137.5939
ton
MT/yr
Mitigated 55.5383 3.2822 0.0000 137.5939
298.6174
8.0 Waste Detail
8.1 Mitigation Measures Waste
Category/Year
Total CO2 CH4 N2O CO2e
Total 251.7816 1.4456 0.0359

User Defined Equipment
Equipment Type Number
11.0 Vegetation
Load Factor Fuel Type
Boilers
Equipment Type Number Heat Input/Day Heat Input/Year Boiler Rating Fuel Type
Horse Power Load Factor Fuel Type
10.0 Stationary Equipment
Fire Pumps and Emergency Generators
Equipment Type Number Hours/Day Hours/Year Horse Power
137.5939
9.0 Operational Offroad
Equipment Type Number Hours/Day Days/Year
Total 55.5383 3.2822 0.0000
77.9598
Industrial Park 118.58 24.0707 1.4225 0.0000 59.6341
Land Use tons ton
MT/yr
Condo/Townhouse 155.02 31.4677 1.8597 0.0000
Mitigated
Waste Disposed
Total CO2 CH4 N2O CO2e

tblArchitecturalCoating EF_Residential_Interior 250.00 50.00
tblAreaCoating Area_EF_Parking 250 0
tblArchitecturalCoating EF_Parking 250.00 100.00
tblArchitecturalCoating EF_Residential_Exterior 250.00 100.00
tblArchitecturalCoating EF_Nonresidential_Exterior 250.00 100.00
tblArchitecturalCoating EF_Nonresidential_Interior 250.00 50.00
1.3 User Entered Comments & Non-Default Data
Architectural Coating - Rule 67.0.1 coatings
Table Name Column Name Default Value New Value
CO2 Intensity (lb/MWhr)
720.49 CH4 Intensity (lb/MWhr)
0.029 N2O Intensity (lb/MWhr)
0.006
40
Climate Zone 13 Operational Year 2021
Utility Company San Diego Gas & Electric
1.2 Other Project Characteristics
Urbanization Urban Wind Speed (m/s) 2.6 Precipitation Freq (Days)
Condo/Townhouse 837.00 Dwelling Unit 52.31 837,000.00 2394
City Park 9.00 Acre 9.00 392,040.00 0
Floor Surface Area Population
Industrial Park 95.63 1000sqft 4.00 95,625.00 0
1.0 Project Characteristics
1.1 Land Usage
Land Uses Size Metric Lot Acreage
CalEEMod Version: CalEEMod.2016.3.1 Page 1 of 1 Date: 10/24/2016 2:58 PM
East Otay Mesa Specific Plan Amendment Phase 4 Construction - San Diego Air Basin, Annual
East Otay Mesa Specific Plan Amendment Phase 4 ConstructionSan Diego Air Basin, Annual

tblConstEquipMitigation Tier No Change Tier 3
tblConstructionPhase NumDays 75.00 132.00
tblConstEquipMitigation Tier No Change Tier 3
tblConstEquipMitigation Tier No Change Tier 3
tblConstEquipMitigation Tier No Change Tier 3
tblConstEquipMitigation Tier No Change Tier 3
tblConstEquipMitigation Tier No Change Tier 3
tblConstEquipMitigation Tier No Change Tier 3
tblConstEquipMitigation Tier No Change Tier 3
tblConstEquipMitigation Tier No Change Tier 3
tblConstEquipMitigation NumberOfEquipmentMitigated 0.00 2.00
tblConstEquipMitigation Tier No Change Tier 3
tblConstEquipMitigation NumberOfEquipmentMitigated 0.00 2.00
tblConstEquipMitigation NumberOfEquipmentMitigated 0.00 7.00
tblConstEquipMitigation NumberOfEquipmentMitigated 0.00 2.00
tblConstEquipMitigation NumberOfEquipmentMitigated 0.00 2.00
tblConstEquipMitigation NumberOfEquipmentMitigated 0.00 6.00
tblConstEquipMitigation NumberOfEquipmentMitigated 0.00 2.00
tblConstEquipMitigation NumberOfEquipmentMitigated 0.00 2.00
tblConstEquipMitigation NumberOfEquipmentMitigated 0.00 2.00
tblConstDustMitigation WaterUnpavedRoadVehicleSpeed 40 15
tblConstEquipMitigation NumberOfEquipmentMitigated 0.00 2.00
tblAreaMitigation UseLowVOCPaintResidentialExteriorValue
250 0
tblAreaMitigation UseLowVOCPaintResidentialInteriorValue
250 0
tblAreaMitigation UseLowVOCPaintNonresidentialExteriorValue
250 0
tblAreaMitigation UseLowVOCPaintNonresidentialInteriorValue
250 0
tblAreaCoating Area_Residential_Exterior 564975 0
tblAreaCoating Area_Residential_Interior 1694925 0
tblAreaCoating Area_Nonresidential_Exterior 243833 0
tblAreaCoating Area_Nonresidential_Interior 731498 0
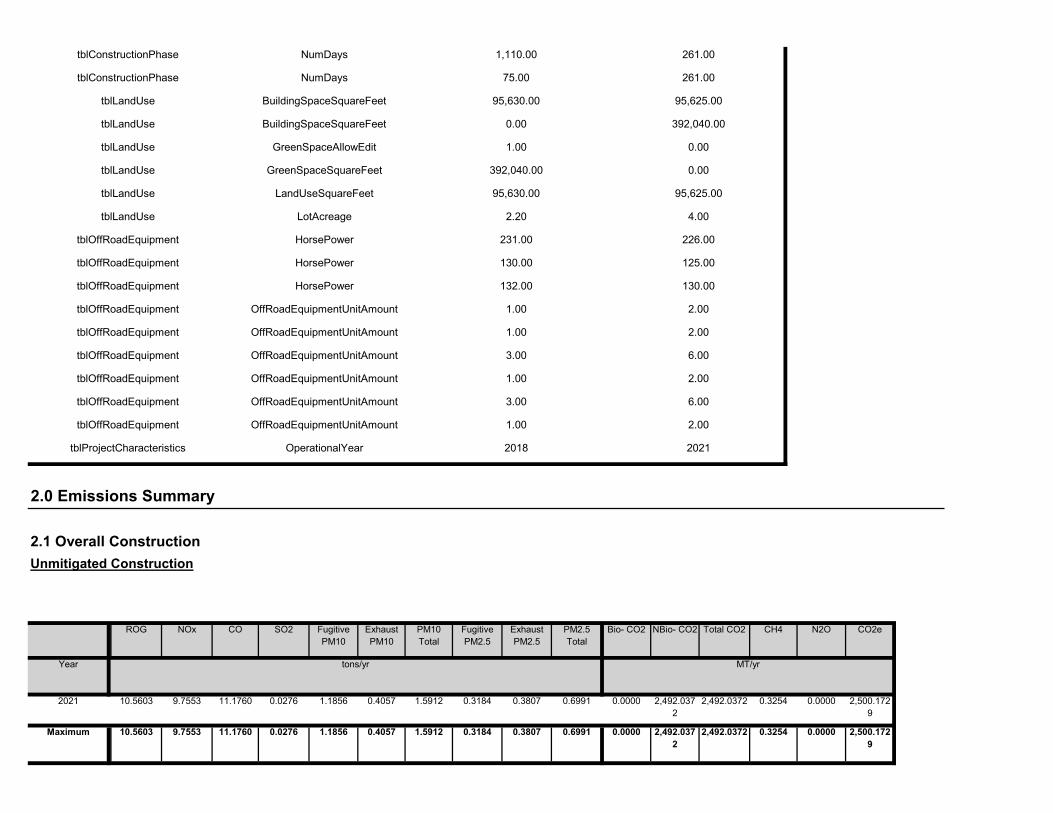
0.0000 2,492.0372
2,492.0372 0.3254 0.0000 2,500.1729
1.1856 0.4057 1.5912 0.3184 0.3807 0.6991Maximum 10.5603 9.7553 11.1760 0.0276
0.0000 2,492.0372
2,492.0372 0.3254 0.0000 2,500.1729
1.1856 0.4057 1.5912 0.3184 0.3807 0.69912021 10.5603 9.7553 11.1760 0.0276
NBio- CO2 Total CO2 CH4 N2O CO2e
Year tons/yr MT/yr
Exhaust PM10
PM10 Total
Fugitive PM2.5
Exhaust PM2.5
PM2.5 Total
Bio- CO2
2.0 Emissions Summary
2.1 Overall ConstructionUnmitigated Construction
ROG NOx CO SO2 Fugitive PM10
tblOffRoadEquipment OffRoadEquipmentUnitAmount 1.00 2.00
tblProjectCharacteristics OperationalYear 2018 2021
tblOffRoadEquipment OffRoadEquipmentUnitAmount 1.00 2.00
tblOffRoadEquipment OffRoadEquipmentUnitAmount 3.00 6.00
tblOffRoadEquipment OffRoadEquipmentUnitAmount 1.00 2.00
tblOffRoadEquipment OffRoadEquipmentUnitAmount 3.00 6.00
tblOffRoadEquipment HorsePower 132.00 130.00
tblOffRoadEquipment OffRoadEquipmentUnitAmount 1.00 2.00
tblOffRoadEquipment HorsePower 231.00 226.00
tblOffRoadEquipment HorsePower 130.00 125.00
tblLandUse LandUseSquareFeet 95,630.00 95,625.00
tblLandUse LotAcreage 2.20 4.00
tblLandUse GreenSpaceAllowEdit 1.00 0.00
tblLandUse GreenSpaceSquareFeet 392,040.00 0.00
tblLandUse BuildingSpaceSquareFeet 95,630.00 95,625.00
tblLandUse BuildingSpaceSquareFeet 0.00 392,040.00
tblConstructionPhase NumDays 1,110.00 261.00
tblConstructionPhase NumDays 75.00 261.00

Total CO2 CH4 N2O CO2e
Category tons/yr MT/yr
PM10 Total
Fugitive PM2.5
Exhaust PM2.5
PM2.5 Total
Bio- CO2 NBio- CO2
2.2 Overall OperationalUnmitigated Operational
ROG NOx CO SO2 Fugitive PM10
Exhaust PM10
20 7-24-2021 9-30-2021 3.7705 3.4583
Highest 5.0458 4.6281
18 1-24-2021 4-23-2021 4.9518 4.5432
19 4-24-2021 7-23-2021 5.0458 4.6281
Quarter Start Date End Date Maximum Unmitigated ROG + NOX (tons/quarter) Maximum Mitigated ROG + NOX (tons/quarter)
17 10-24-2020 1-23-2021 1.2812 1.1756
0.00 0.00 0.00 0.00 0.00 0.000.00 6.11 1.56 0.00 0.45 0.25
NBio-CO2 Total CO2 CH4 N20 CO2e
Percent Reduction
4.55 12.27 -5.41 0.00
Exhaust PM10
PM10 Total
Fugitive PM2.5
Exhaust PM2.5
PM2.5 Total
Bio- CO2ROG NOx CO SO2 Fugitive PM10
0.0000 2,492.0360
2,492.0360 0.3254 0.0000 2,500.1717
1.1856 0.3809 1.5664 0.3184 0.3790 0.6974Maximum 10.0801 8.5579 11.7802 0.0276
0.0000 2,492.0360
2,492.0360 0.3254 0.0000 2,500.1717
1.1856 0.3809 1.5664 0.3184 0.3790 0.69742021 10.0801 8.5579 11.7802 0.0276
Total CO2 CH4 N2O CO2e
Year tons/yr MT/yr
PM10 Total
Fugitive PM2.5
Exhaust PM2.5
PM2.5 Total
Bio- CO2 NBio- CO2
Mitigated Construction
ROG NOx CO SO2 Fugitive PM10
Exhaust PM10

3.0 Construction Detail
Construction Phase
0.00 0.00 0.00 0.00 0.00 0.000.00 0.00 0.00 0.00 0.00 0.00
NBio-CO2 Total CO2 CH4 N20 CO2e
Percent Reduction
0.00 0.00 0.00 0.00
Exhaust PM10
PM10 Total
Fugitive PM2.5
Exhaust PM2.5
PM2.5 Total
Bio- CO2ROG NOx CO SO2 Fugitive PM10
991.2851 9,697.2302
10,688.5154
9.7913 0.1628 10,981.8001
5.6451 9.2405 14.8856 1.5117 9.2368 10.7486Total 59.5802 9.0144 90.8771 0.1884
24.3170 489.9312 514.2482 2.5173 0.0631 595.97080.0000 0.0000 0.0000 0.0000Water
102.3826 0.0000 102.3826 6.0506 0.0000 253.64840.0000 0.0000 0.0000 0.0000Waste
0.0000 6,069.1800
6,069.1800 0.3226 0.0000 6,077.2440
5.6451 0.0561 5.7012 1.5117 0.0524 1.5641Mobile 1.6117 7.1625 19.4590 0.0659
0.0000 2,765.3708
2,765.3708 0.0930 0.0317 2,777.1443
0.0605 0.0605 0.0605 0.0605Energy 0.0876 0.7543 0.3604 4.7800e-003
864.5856 372.7483 1,237.3339 0.8077 0.0680 1,277.7925
9.1239 9.1239 9.1239 9.1239Area 57.8808 1.0975 71.0578 0.1178
Total CO2 CH4 N2O CO2e
Category tons/yr MT/yr
PM10 Total
Fugitive PM2.5
Exhaust PM2.5
PM2.5 Total
Bio- CO2 NBio- CO2
Mitigated Operational
ROG NOx CO SO2 Fugitive PM10
Exhaust PM10
991.2851 9,697.2302
10,688.5154
9.7913 0.1628 10,981.8001
5.6451 9.2405 14.8856 1.5117 9.2368 10.7486Total 59.5802 9.0144 90.8771 0.1884
24.3170 489.9312 514.2482 2.5173 0.0631 595.97080.0000 0.0000 0.0000 0.0000Water
102.3826 0.0000 102.3826 6.0506 0.0000 253.64840.0000 0.0000 0.0000 0.0000Waste
0.0000 6,069.1800
6,069.1800 0.3226 0.0000 6,077.2440
5.6451 0.0561 5.7012 1.5117 0.0524 1.5641Mobile 1.6117 7.1625 19.4590 0.0659
0.0000 2,765.3708
2,765.3708 0.0930 0.0317 2,777.1443
0.0605 0.0605 0.0605 0.0605Energy 0.0876 0.7543 0.3604 4.7800e-003
864.5856 372.7483 1,237.3339 0.8077 0.0680 1,277.7925
9.1239 9.1239 9.1239 9.1239Area 57.8808 1.0975 71.0578 0.1178

10.80 7.30 20.00 LD_Mix HDT_Mix HHDT
7.30 20.00 LD_Mix HDT_Mix HHDT
Paving 10 25.00 0.00 0.00
Building Construction 18 807.00 169.00 0.00 10.80
Worker Trip Length
Vendor Trip Length
Hauling Trip Length
Worker Vehicle Class
Vendor Vehicle Class
Hauling Vehicle Class
Trips and VMT
Phase Name Offroad Equipment Count
Worker Trip Number
Vendor Trip Number
Hauling Trip Number
Architectural Coating Air Compressors 2 6.00 78 0.48
Paving Tractors/Loaders/Backhoes 2 8.00 97 0.37
Paving Rollers 2 8.00 80 0.38
Paving Paving Equipment 2 8.00 130 0.36
Paving Pavers 2 8.00 125 0.42
Paving Cement and Mortar Mixers 2 8.00 9 0.56
Building Construction Welders 2 8.00 46 0.45
Building Construction Tractors/Loaders/Backhoes 6 7.00 97 0.37
Building Construction Generator Sets 2 8.00 84 0.74
Building Construction Forklifts 6 8.00 89 0.20
Load Factor
Building Construction Cranes 2 7.00 226 0.29
OffRoad Equipment
Phase Name Offroad Equipment Type Amount Usage Hours Horse Power
132
Acres of Grading (Site Preparation Phase): 0
Acres of Grading (Grading Phase): 0
Acres of Paving: 0
Residential Indoor: 1,694,925; Residential Outdoor: 564,975; Non-Residential Indoor: 731,498; Non-Residential Outdoor: 243,833;
3 Architectural Coating Architectural Coating 1/1/2021 12/31/2021 5
261
2 Paving Paving 1/1/2021 12/31/2021 5 261
End Date Num Days Week
Num Days Phase Description
1 Building Construction Building Construction 1/1/2021 12/31/2021 5
Phase Number
Phase Name Phase Type Start Date

0.0000 737.7449 737.7449 0.0212 0.0000 738.27350.8445 5.9800e-003
0.8505 0.2244 5.5000e-003
0.2299Worker 0.3661 0.2612 2.6310 8.1600e-003
0.0000 576.5929 576.5929 0.0428 0.0000 577.66280.1464 4.8000e-003
0.1512 0.0423 4.5900e-003
0.0469Vendor 0.0682 2.2665 0.6044 5.9100e-003
0.0000 0.0000 0.0000 0.0000 0.0000 0.00000.0000 0.0000 0.0000 0.0000 0.0000 0.0000Hauling 0.0000 0.0000 0.0000 0.0000
Total CO2 CH4 N2O CO2e
Category tons/yr MT/yr
PM10 Total
Fugitive PM2.5
Exhaust PM2.5
PM2.5 Total
Bio- CO2 NBio- CO2
Unmitigated Construction Off-Site
ROG NOx CO SO2 Fugitive PM10
Exhaust PM10
0.0000 602.0677 602.0677 0.1451 0.0000 605.69390.2492 0.2492 0.2343 0.2343Total 0.4941 4.5258 4.3163 7.0000e-003
0.0000 602.0677 602.0677 0.1451 0.0000 605.69390.2492 0.2492 0.2343 0.2343
CO2e
Category tons/yr MT/yr
Off-Road 0.4941 4.5258 4.3163 7.0000e-003
PM2.5 Total
Bio- CO2 NBio- CO2 Total CO2 CH4 N2OSO2 Fugitive PM10
Exhaust PM10
PM10 Total
Fugitive PM2.5
Exhaust PM2.5
Use Cleaner Engines for Construction Equipment
Water Exposed Area
Reduce Vehicle Speed on Unpaved Roads
3.2 Building Construction - 2021Unmitigated Construction On-Site
ROG NOx CO
7.30 20.00 LD_Mix HDT_Mix HHDT
3.1 Mitigation Measures Construction
Architectural Coating 2 161.00 0.00 0.00 10.80

3.3 Paving - 2021Unmitigated Construction On-Site
0.0000 1,314.3378
1,314.3378 0.0639 0.0000 1,315.9363
0.9909 0.0108 1.0017 0.2667 0.0101 0.2768Total 0.4343 2.5277 3.2354 0.0141
0.0000 737.7449 737.7449 0.0212 0.0000 738.27350.8445 5.9800e-003
0.8505 0.2244 5.5000e-003
0.2299Worker 0.3661 0.2612 2.6310 8.1600e-003
0.0000 576.5929 576.5929 0.0428 0.0000 577.66280.1464 4.8000e-003
0.1512 0.0423 4.5900e-003
0.0469Vendor 0.0682 2.2665 0.6044 5.9100e-003
0.0000 0.0000 0.0000 0.0000 0.0000 0.00000.0000 0.0000 0.0000 0.0000 0.0000 0.0000Hauling 0.0000 0.0000 0.0000 0.0000
Total CO2 CH4 N2O CO2e
Category tons/yr MT/yr
PM10 Total
Fugitive PM2.5
Exhaust PM2.5
PM2.5 Total
Bio- CO2 NBio- CO2
Mitigated Construction Off-Site
ROG NOx CO SO2 Fugitive PM10
Exhaust PM10
0.0000 602.0670 602.0670 0.1451 0.0000 605.69310.2344 0.2344 0.2337 0.2337Total 0.1851 3.7138 4.6426 7.0000e-003
0.0000 602.0670 602.0670 0.1451 0.0000 605.69310.2344 0.2344 0.2337 0.2337Off-Road 0.1851 3.7138 4.6426 7.0000e-003
Total CO2 CH4 N2O CO2e
Category tons/yr MT/yr
PM10 Total
Fugitive PM2.5
Exhaust PM2.5
PM2.5 Total
Bio- CO2 NBio- CO2
Mitigated Construction On-Site
ROG NOx CO SO2 Fugitive PM10
Exhaust PM10
0.0000 1,314.3378
1,314.3378 0.0639 0.0000 1,315.9363
0.9909 0.0108 1.0017 0.2667 0.0101 0.2768Total 0.4343 2.5277 3.2354 0.0141

Total CO2 CH4 N2O CO2e
Category tons/yr MT/yr
PM10 Total
Fugitive PM2.5
Exhaust PM2.5
PM2.5 Total
Bio- CO2 NBio- CO2
Mitigated Construction On-Site
ROG NOx CO SO2 Fugitive PM10
Exhaust PM10
0.0000 22.8546 22.8546 6.6000e-004
0.0000 22.87090.0262 1.9000e-004
0.0264 6.9500e-003
1.7000e-004
7.1200e-003
Total 0.0113 8.0900e-003
0.0815 2.5000e-004
0.0000 22.8546 22.8546 6.6000e-004
0.0000 22.87090.0262 1.9000e-004
0.0264 6.9500e-003
1.7000e-004
7.1200e-003
Worker 0.0113 8.0900e-003
0.0815 2.5000e-004
0.0000 0.0000 0.0000 0.0000 0.0000 0.00000.0000 0.0000 0.0000 0.0000 0.0000 0.0000Vendor 0.0000 0.0000 0.0000 0.0000
0.0000 0.0000 0.0000 0.0000 0.0000 0.00000.0000 0.0000 0.0000 0.0000 0.0000 0.0000Hauling 0.0000 0.0000 0.0000 0.0000
Total CO2 CH4 N2O CO2e
Category tons/yr MT/yr
PM10 Total
Fugitive PM2.5
Exhaust PM2.5
PM2.5 Total
Bio- CO2 NBio- CO2
Unmitigated Construction Off-Site
ROG NOx CO SO2 Fugitive PM10
Exhaust PM10
0.0000 338.9539 338.9539 0.1070 0.0000 341.62880.1197 0.1197 0.1104 0.1104Total 0.2248 2.2431 2.5434 3.9100e-003
0.0000 0.0000 0.0000 0.0000 0.0000 0.00000.0000 0.0000 0.0000 0.0000Paving 0.0000
0.0000 338.9539 338.9539 0.1070 0.0000 341.62880.1197 0.1197 0.1104 0.1104Off-Road 0.2248 2.2431 2.5434 3.9100e-003
Total CO2 CH4 N2O CO2e
Category tons/yr MT/yr
PM10 Total
Fugitive PM2.5
Exhaust PM2.5
PM2.5 Total
Bio- CO2 NBio- CO2ROG NOx CO SO2 Fugitive PM10
Exhaust PM10
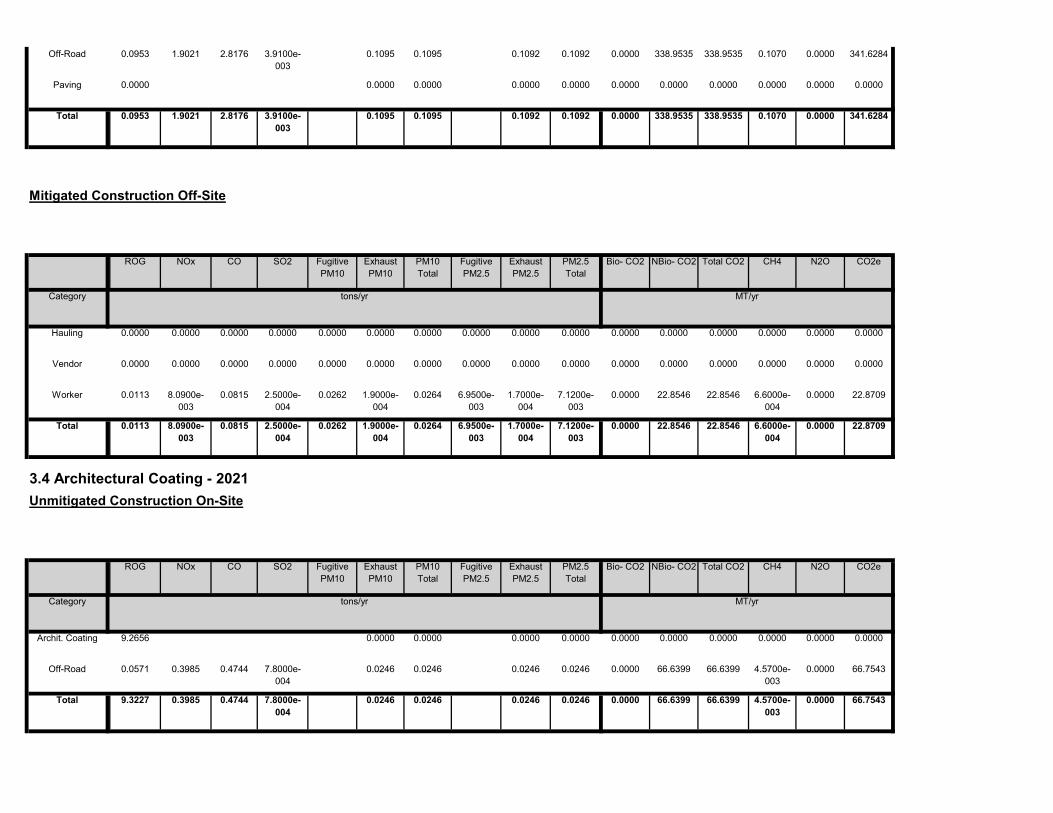
0.0000 66.6399 66.6399 4.5700e-003
0.0000 66.75430.0246 0.0246 0.0246 0.0246Total 9.3227 0.3985 0.4744 7.8000e-004
0.0000 66.6399 66.6399 4.5700e-003
0.0000 66.75430.0246 0.0246 0.0246 0.0246Off-Road 0.0571 0.3985 0.4744 7.8000e-004
0.0000 0.0000 0.0000 0.0000 0.0000 0.00000.0000 0.0000 0.0000 0.0000Archit. Coating 9.2656
Total CO2 CH4 N2O CO2e
Category tons/yr MT/yr
PM10 Total
Fugitive PM2.5
Exhaust PM2.5
PM2.5 Total
Bio- CO2 NBio- CO2
3.4 Architectural Coating - 2021Unmitigated Construction On-Site
ROG NOx CO SO2 Fugitive PM10
Exhaust PM10
0.0000 22.8546 22.8546 6.6000e-004
0.0000 22.87090.0262 1.9000e-004
0.0264 6.9500e-003
1.7000e-004
7.1200e-003
Total 0.0113 8.0900e-003
0.0815 2.5000e-004
0.0000 22.8546 22.8546 6.6000e-004
0.0000 22.87090.0262 1.9000e-004
0.0264 6.9500e-003
1.7000e-004
7.1200e-003
Worker 0.0113 8.0900e-003
0.0815 2.5000e-004
0.0000 0.0000 0.0000 0.0000 0.0000 0.00000.0000 0.0000 0.0000 0.0000 0.0000 0.0000Vendor 0.0000 0.0000 0.0000 0.0000
0.0000 0.0000 0.0000 0.0000 0.0000 0.00000.0000 0.0000 0.0000 0.0000 0.0000 0.0000Hauling 0.0000 0.0000 0.0000 0.0000
Total CO2 CH4 N2O CO2e
Category tons/yr MT/yr
PM10 Total
Fugitive PM2.5
Exhaust PM2.5
PM2.5 Total
Bio- CO2 NBio- CO2
Mitigated Construction Off-Site
ROG NOx CO SO2 Fugitive PM10
Exhaust PM10
0.0000 338.9535 338.9535 0.1070 0.0000 341.62840.1095 0.1095 0.1092 0.1092Total 0.0953 1.9021 2.8176 3.9100e-003
0.0000 0.0000 0.0000 0.0000 0.0000 0.00000.0000 0.0000 0.0000 0.0000Paving 0.0000
0.0000 338.9535 338.9535 0.1070 0.0000 341.62840.1095 0.1095 0.1092 0.1092Off-Road 0.0953 1.9021 2.8176 3.9100e-003
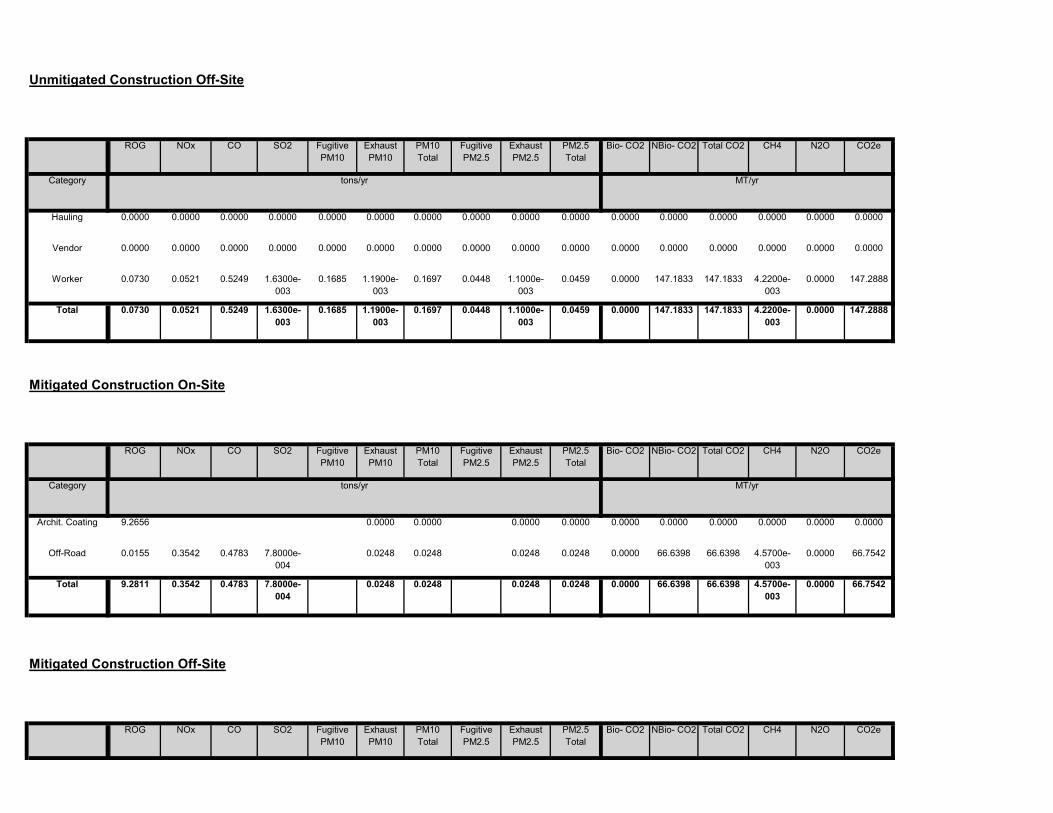
Total CO2 CH4 N2O CO2ePM10 Total
Fugitive PM2.5
Exhaust PM2.5
PM2.5 Total
Bio- CO2 NBio- CO2
Mitigated Construction Off-Site
ROG NOx CO SO2 Fugitive PM10
Exhaust PM10
0.0000 66.6398 66.6398 4.5700e-003
0.0000 66.75420.0248 0.0248 0.0248 0.0248Total 9.2811 0.3542 0.4783 7.8000e-004
0.0000 66.6398 66.6398 4.5700e-003
0.0000 66.75420.0248 0.0248 0.0248 0.0248Off-Road 0.0155 0.3542 0.4783 7.8000e-004
0.0000 0.0000 0.0000 0.0000 0.0000 0.00000.0000 0.0000 0.0000 0.0000Archit. Coating 9.2656
Total CO2 CH4 N2O CO2e
Category tons/yr MT/yr
PM10 Total
Fugitive PM2.5
Exhaust PM2.5
PM2.5 Total
Bio- CO2 NBio- CO2
Mitigated Construction On-Site
ROG NOx CO SO2 Fugitive PM10
Exhaust PM10
0.0000 147.1833 147.1833 4.2200e-003
0.0000 147.28880.1685 1.1900e-003
0.1697 0.0448 1.1000e-003
0.0459Total 0.0730 0.0521 0.5249 1.6300e-003
0.0000 147.1833 147.1833 4.2200e-003
0.0000 147.28880.1685 1.1900e-003
0.1697 0.0448 1.1000e-003
0.0459Worker 0.0730 0.0521 0.5249 1.6300e-003
0.0000 0.0000 0.0000 0.0000 0.0000 0.00000.0000 0.0000 0.0000 0.0000 0.0000 0.0000Vendor 0.0000 0.0000 0.0000 0.0000
0.0000 0.0000 0.0000 0.0000 0.0000 0.00000.0000 0.0000 0.0000 0.0000 0.0000 0.0000Hauling 0.0000 0.0000 0.0000 0.0000
Total CO2 CH4 N2O CO2e
Category tons/yr MT/yr
PM10 Total
Fugitive PM2.5
Exhaust PM2.5
PM2.5 Total
Bio- CO2 NBio- CO2
Unmitigated Construction Off-Site
ROG NOx CO SO2 Fugitive PM10
Exhaust PM10
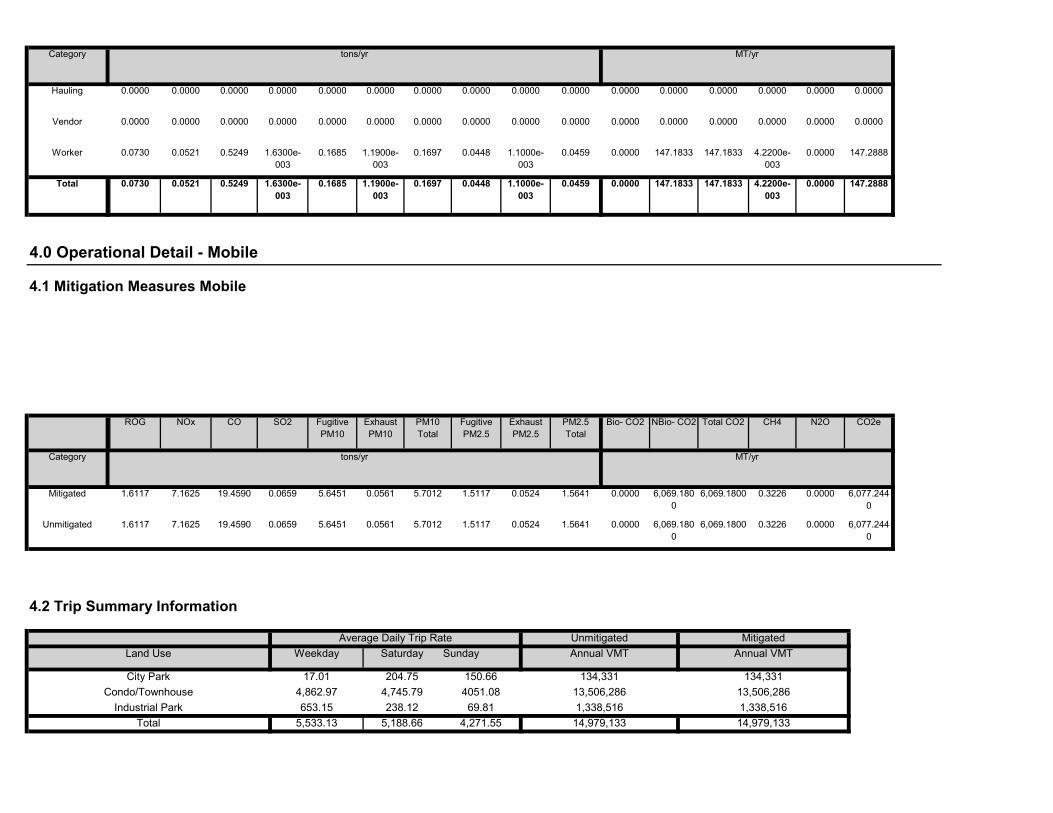
Total 5,533.13 5,188.66 4,271.55 14,979,133 14,979,133Industrial Park 653.15 238.12 69.81 1,338,516 1,338,516
Condo/Townhouse 4,862.97 4,745.79 4051.08 13,506,286 13,506,286
Annual VMT
City Park 17.01 204.75 150.66 134,331 134,331
4.2 Trip Summary Information
Average Daily Trip Rate Unmitigated MitigatedLand Use Weekday Saturday Sunday Annual VMT
0.0000 6,069.1800
6,069.1800 0.3226 0.0000 6,077.2440
5.6451 0.0561 5.7012 1.5117 0.0524 1.5641Unmitigated 1.6117 7.1625 19.4590 0.0659
0.0000 6,069.1800
6,069.1800 0.3226 0.0000 6,077.2440
5.6451 0.0561 5.7012 1.5117 0.0524 1.5641Mitigated 1.6117 7.1625 19.4590 0.0659
NBio- CO2 Total CO2 CH4 N2O CO2e
Category tons/yr MT/yr
Exhaust PM10
PM10 Total
Fugitive PM2.5
Exhaust PM2.5
PM2.5 Total
Bio- CO2
4.0 Operational Detail - Mobile
4.1 Mitigation Measures Mobile
ROG NOx CO SO2 Fugitive PM10
0.0000 147.1833 147.1833 4.2200e-003
0.0000 147.28880.1685 1.1900e-003
0.1697 0.0448 1.1000e-003
0.0459Total 0.0730 0.0521 0.5249 1.6300e-003
0.0000 147.1833 147.1833 4.2200e-003
0.0000 147.28880.1685 1.1900e-003
0.1697 0.0448 1.1000e-003
0.0459Worker 0.0730 0.0521 0.5249 1.6300e-003
0.0000 0.0000 0.0000 0.0000 0.0000 0.00000.0000 0.0000 0.0000 0.0000 0.0000 0.0000Vendor 0.0000 0.0000 0.0000 0.0000
0.0000 0.0000 0.0000 0.0000 0.0000 0.00000.0000 0.0000 0.0000 0.0000 0.0000 0.0000Hauling 0.0000 0.0000 0.0000 0.0000
Category tons/yr MT/yr

0.0000 866.9934 866.9934 0.0166 0.0159 872.14550.0605 0.0605 0.0605 0.0605NaturalGas Unmitigated
0.0876 0.7543 0.3604 4.7800e-003
0.0000 866.9934 866.9934 0.0166 0.0159 872.14550.0605 0.0605 0.0605 0.0605NaturalGas Mitigated
0.0876 0.7543 0.3604 4.7800e-003
0.0000 1,898.3775
1,898.3775 0.0764 0.0158 1,904.9988
0.0000 0.0000 0.0000 0.0000Electricity Unmitigated
0.0000 1,898.3775
1,898.3775 0.0764 0.0158 1,904.9988
0.0000 0.0000 0.0000 0.0000Electricity Mitigated
NBio- CO2 Total CO2 CH4 N2O CO2e
Category tons/yr MT/yr
Exhaust PM10
PM10 Total
Fugitive PM2.5
Exhaust PM2.5
PM2.5 Total
Bio- CO2
5.0 Energy Detail
Historical Energy Use: N
5.1 Mitigation Measures Energy
ROG NOx CO SO2 Fugitive PM10
0.023523 0.001912 0.001972 0.006090 0.000748 0.001193
0.000748 0.001193
Condo/Townhouse 0.593936 0.041843 0.182569 0.108325 0.016436 0.005513 0.015940
0.005513 0.015940 0.023523 0.001912 0.001972 0.006090City Park 0.593936 0.041843 0.182569 0.108325 0.016436
0.023523 0.001912 0.001972 0.006090 0.000748 0.001193
SBUS MH
Industrial Park 0.593936 0.041843 0.182569 0.108325 0.016436 0.005513 0.015940
LHD2 MHD HHD OBUS UBUS MCYLand Use LDA LDT1 LDT2 MDV LHD1
28.00 13.00 79 19 2
4.4 Fleet Mix
18.80 39.60 86 11 3
Industrial Park 9.50 7.30 7.30 59.00
48.00 19.00 66 28 6
Condo/Townhouse 10.80 7.30 7.50 41.60
H-S or C-C H-O or C-NW Primary Diverted Pass-by
City Park 9.50 7.30 7.30 33.00
4.3 Trip Type Information
Miles Trip % Trip Purpose %
Land Use H-W or C-W H-S or C-C H-O or C-NW H-W or C-W

Unmitigated
866.9934 866.9934 0.0166 0.0159 872.1455
5.3 Energy by Land Use - Electricity
0.0605 0.0605 0.0605 0.0605 0.0000
1.9000e-003
104.0507
Total 0.0876 0.7543 0.3604 4.7800e-003
7.2200e-003
7.2200e-003
0.0000 103.4361 103.4361 1.9800e-003
0.0798 5.7000e-004
7.2200e-003
7.2200e-003
763.5573 763.5573 0.0146 0.0140 768.0947
Industrial Park 1.93832e+006
0.0105 0.0950
0.0533 0.0533 0.0533 0.0533 0.0000
0.0000 0.0000
Condo/Townhouse 1.43085e+007
0.0772 0.6593 0.2806 4.2100e-003
0.0000 0.0000 0.0000 0.0000 0.0000 0.00000.0000 0.0000 0.0000 0.0000
CO2e
Land Use kBTU/yr tons/yr MT/yr
City Park 0 0.0000 0.0000
PM2.5 Total
Bio- CO2 NBio- CO2 Total CO2 CH4 N2OSO2 Fugitive PM10
Exhaust PM10
PM10 Total
Fugitive PM2.5
Exhaust PM2.5
NaturalGas Use
ROG NOx CO
866.9934 0.0166 0.0159 872.1455
Mitigated
0.0605 0.0605 0.0605 0.0000 866.9934
104.0507
Total 0.0876 0.7543 0.3604 4.7800e-003
0.0605
7.2200e-003
0.0000 103.4361 103.4361 1.9800e-003
1.9000e-003
5.7000e-004
7.2200e-003
7.2200e-003
7.2200e-003
763.5573 0.0146 0.0140 768.0947
Industrial Park 1.93832e+006
0.0105 0.0950 0.0798
0.0533 0.0533 0.0533 0.0000 763.5573
0.0000
Condo/Townhouse 1.43085e+007
0.0772 0.6593 0.2806 4.2100e-003
0.0533
0.0000 0.0000 0.0000 0.0000 0.0000 0.00000.0000 0.0000 0.0000 0.0000City Park 0 0.0000 0.0000 0.0000
NBio- CO2 Total CO2 CH4 N2O CO2e
Land Use kBTU/yr tons/yr MT/yr
Exhaust PM10
PM10 Total
Fugitive PM2.5
Exhaust PM2.5
PM2.5 Total
Bio- CO2
5.2 Energy by Land Use - NaturalGasUnmitigated
NaturalGas Use
ROG NOx CO SO2 Fugitive PM10

6.0 Area Detail
6.1 Mitigation Measures Area
431.5148
Total 1,898.3775 0.0764 0.0158 1,904.9988
Industrial Park 1.3158e+006
430.0150 0.0173 3.5800e-003
0.0000
Condo/Townhouse 4.49303e+006
1,468.3625 0.0591 0.0122 1,473.4840
Land Use kWh/yr ton
MT/yr
City Park 0 0.0000 0.0000 0.0000
Mitigated
Electricity Use
Total CO2 CH4 N2O CO2e
431.5148
Total 1,898.3775 0.0764 0.0158 1,904.9988
Industrial Park 1.3158e+006
430.0150 0.0173 3.5800e-003
0.0000
Condo/Townhouse 4.49303e+006
1,468.3625 0.0591 0.0122 1,473.4840
Land Use kWh/yr ton
MT/yr
City Park 0 0.0000 0.0000 0.0000
Electricity Use
Total CO2 CH4 N2O CO2e

0.0000 0.0000 0.0000 0.0000 0.0000 0.00000.0000 0.0000 0.0000 0.0000Architectural Coating
0.0000
Total CO2 CH4 N2O CO2e
SubCategory tons/yr MT/yr
PM10 Total
Fugitive PM2.5
Exhaust PM2.5
PM2.5 Total
Bio- CO2 NBio- CO2
Mitigated
ROG NOx CO SO2 Fugitive PM10
Exhaust PM10
864.5856 372.7483 1,237.3339 0.8077 0.0680 1,277.7925
9.1239 9.1239 9.1239 9.1239Total 57.8808 1.0975 71.0578 0.1178
0.0000 10.1537 10.1537 9.8400e-003
0.0000 10.39970.0343 0.0343 0.0343 0.0343Landscaping 0.1888 0.0719 6.2293 3.3000e-004
864.5856 362.5946 1,227.1802 0.7979 0.0680 1,267.3928
9.0896 9.0896 9.0896 9.0896Hearth 52.5186 1.0256 64.8285 0.1175
0.0000 0.0000 0.0000 0.0000 0.0000 0.00000.0000 0.0000 0.0000 0.0000Consumer Products
5.1735
0.0000 0.0000 0.0000 0.0000 0.0000 0.00000.0000 0.0000 0.0000 0.0000Architectural Coating
0.0000
Total CO2 CH4 N2O CO2e
SubCategory tons/yr MT/yr
PM10 Total
Fugitive PM2.5
Exhaust PM2.5
PM2.5 Total
Bio- CO2 NBio- CO2
6.2 Area by SubCategoryUnmitigated
ROG NOx CO SO2 Fugitive PM10
Exhaust PM10
864.5856 372.7483 1,237.3339 0.8077 0.0680 1,277.7925
9.1239 9.1239 9.1239 9.1239Unmitigated 57.8808 1.0975 71.0578 0.1178
864.5856 372.7483 1,237.3339 0.8077 0.0680 1,277.7925
9.1239 9.1239 9.1239 9.1239Mitigated 57.8808 1.0975 71.0578 0.1178
NBio- CO2 Total CO2 CH4 N2O CO2e
Category tons/yr MT/yr
Exhaust PM10
PM10 Total
Fugitive PM2.5
Exhaust PM2.5
PM2.5 Total
Bio- CO2ROG NOx CO SO2 Fugitive PM10

39.0706
Condo/Townhouse 54.5339 / 34.3801
374.1922 1.7914 0.0449 432.3654
Land Use Mgal ton
MT/yr
City Park 0 / 10.7233 38.9348 1.5700e-003
3.2000e-004
7.2 Water by Land UseUnmitigated
Indoor/Outdoor Use
Total CO2 CH4 N2O CO2e
Unmitigated 514.2482 2.5173 0.0631 595.9708
Category ton
MT/yr
Mitigated 514.2482 2.5173 0.0631 595.9708
7.0 Water Detail
7.1 Mitigation Measures Water
Total CO2 CH4 N2O CO2e
864.5856 372.7483 1,237.3339 0.8077 0.0680 1,277.7925
9.1239 9.1239 9.1239 9.1239Total 57.8808 1.0975 71.0578 0.1178
0.0000 10.1537 10.1537 9.8400e-003
0.0000 10.39970.0343 0.0343 0.0343 0.0343Landscaping 0.1888 0.0719 6.2293 3.3000e-004
864.5856 362.5946 1,227.1802 0.7979 0.0680 1,267.3928
9.0896 9.0896 9.0896 9.0896Hearth 52.5186 1.0256 64.8285 0.1175
0.0000 0.0000 0.0000 0.0000 0.0000 0.00000.0000 0.0000 0.0000 0.0000Consumer Products
5.1735

Unmitigated 102.3826 6.0506 0.0000 253.6484
ton
MT/yr
Mitigated 102.3826 6.0506 0.0000 253.6484
8.0 Waste Detail
8.1 Mitigation Measures Waste
Category/Year
Total CO2 CH4 N2O CO2e
124.5348
Total 514.2482 2.5173 0.0631 595.9708
Industrial Park 22.1144 / 0 101.1212 0.7244 0.0178
39.0706
Condo/Townhouse 54.5339 / 34.3801
374.1922 1.7914 0.0449 432.3654
Land Use Mgal ton
MT/yr
City Park 0 / 10.7233 38.9348 1.5700e-003
3.2000e-004
Mitigated
Indoor/Outdoor Use
Total CO2 CH4 N2O CO2e
124.5348
Total 514.2482 2.5173 0.0631 595.9708
Industrial Park 22.1144 / 0 101.1212 0.7244 0.0178

9.0 Operational Offroad
59.6341
Total 102.3826 6.0506 0.0000 253.6484
Industrial Park 118.58 24.0707 1.4225 0.0000
0.3872
Condo/Townhouse 385.02 78.1556 4.6189 0.0000 193.6271
Land Use tons ton
MT/yr
City Park 0.77 0.1563 9.2400e-003
0.0000
Mitigated
Waste Disposed
Total CO2 CH4 N2O CO2e
59.6341
Total 102.3826 6.0506 0.0000 253.6484
Industrial Park 118.58 24.0707 1.4225 0.0000
0.3872
Condo/Townhouse 385.02 78.1556 4.6189 0.0000 193.6271
Land Use tons ton
MT/yr
City Park 0.77 0.1563 9.2400e-003
0.0000
8.2 Waste by Land UseUnmitigated
Waste Disposed
Total CO2 CH4 N2O CO2e

User Defined Equipment
Equipment Type Number
11.0 Vegetation
Fuel Type
Boilers
Equipment Type Number Heat Input/Day Heat Input/Year Boiler Rating Fuel Type
Load Factor Fuel Type
10.0 Stationary Equipment
Fire Pumps and Emergency Generators
Equipment Type Number Hours/Day Hours/Year Horse Power Load Factor
Equipment Type Number Hours/Day Days/Year Horse Power

tblAreaCoating Area_Nonresidential_Exterior 47813 0
tblArchitecturalCoating EF_Residential_Interior 250.00 50.00
tblAreaCoating Area_EF_Parking 250 0
tblArchitecturalCoating EF_Parking 250.00 100.00
tblArchitecturalCoating EF_Residential_Exterior 250.00 100.00
tblArchitecturalCoating EF_Nonresidential_Exterior 250.00 100.00
tblArchitecturalCoating EF_Nonresidential_Interior 250.00 50.00
1.3 User Entered Comments & Non-Default Data
Architectural Coating - Rule 67.0.1 coatings
Table Name Column Name Default Value New Value
CO2 Intensity (lb/MWhr)
720.49 CH4 Intensity (lb/MWhr)
0.029 N2O Intensity (lb/MWhr)
0.006
40
Climate Zone 13 Operational Year 2022
Utility Company San Diego Gas & Electric
1.2 Other Project Characteristics
Urbanization Urban Wind Speed (m/s) 2.6 Precipitation Freq (Days)
Condo/Townhouse 312.00 Dwelling Unit 19.50 312,000.00 892
Floor Surface Area Population
Industrial Park 95.63 1000sqft 4.00 95,625.00 0
1.0 Project Characteristics
1.1 Land Usage
Land Uses Size Metric Lot Acreage
CalEEMod Version: CalEEMod.2016.3.1 Page 1 of 1 Date: 10/24/2016 3:05 PM
East Otay Mesa Specific Plan Amendment Phase 5 Construction - San Diego Air Basin, Annual
East Otay Mesa Specific Plan Amendment Phase 5 ConstructionSan Diego Air Basin, Annual

tblConstructionPhase NumDays 370.00 260.00
tblConstEquipMitigation Tier No Change Tier 3
tblConstructionPhase NumDays 20.00 131.00
tblConstEquipMitigation Tier No Change Tier 3
tblConstEquipMitigation Tier No Change Tier 3
tblConstEquipMitigation Tier No Change Tier 3
tblConstEquipMitigation Tier No Change Tier 3
tblConstEquipMitigation Tier No Change Tier 3
tblConstEquipMitigation Tier No Change Tier 3
tblConstEquipMitigation Tier No Change Tier 3
tblConstEquipMitigation Tier No Change Tier 3
tblConstEquipMitigation NumberOfEquipmentMitigated 0.00 2.00
tblConstEquipMitigation Tier No Change Tier 3
tblConstEquipMitigation NumberOfEquipmentMitigated 0.00 2.00
tblConstEquipMitigation NumberOfEquipmentMitigated 0.00 7.00
tblConstEquipMitigation NumberOfEquipmentMitigated 0.00 2.00
tblConstEquipMitigation NumberOfEquipmentMitigated 0.00 2.00
tblConstEquipMitigation NumberOfEquipmentMitigated 0.00 6.00
tblConstEquipMitigation NumberOfEquipmentMitigated 0.00 2.00
tblConstEquipMitigation NumberOfEquipmentMitigated 0.00 2.00
tblConstEquipMitigation NumberOfEquipmentMitigated 0.00 2.00
tblConstDustMitigation WaterUnpavedRoadVehicleSpeed 40 15
tblConstEquipMitigation NumberOfEquipmentMitigated 0.00 2.00
tblAreaMitigation UseLowVOCPaintResidentialExteriorValue
250 0
tblAreaMitigation UseLowVOCPaintResidentialInteriorValue
250 0
tblAreaMitigation UseLowVOCPaintNonresidentialExteriorValue
250 0
tblAreaMitigation UseLowVOCPaintNonresidentialInteriorValue
250 0
tblAreaCoating Area_Residential_Exterior 210600 0
tblAreaCoating Area_Residential_Interior 631800 0
tblAreaCoating Area_Nonresidential_Interior 143438 0

Mitigated Construction
0.0000 1,470.0328
1,470.0328 0.2747 0.0000 1,476.8992
0.3999 0.3341 0.7339 0.1072 0.3138 0.4210Maximum 3.8302 7.0745 8.4349 0.0167
0.0000 1,470.0328
1,470.0328 0.2747 0.0000 1,476.8992
0.3999 0.3341 0.7339 0.1072 0.3138 0.42102022 3.8302 7.0745 8.4349 0.0167
CH4 N2O CO2e
Year tons/yr MT/yr
Fugitive PM2.5
Exhaust PM2.5
PM2.5 Total
Bio- CO2 NBio- CO2 Total CO2
Unmitigated Construction
ROG NOx CO SO2 Fugitive PM10
Exhaust PM10
PM10 Total
tblProjectCharacteristics OperationalYear 2018 2022
2.0 Emissions Summary
2.1 Overall Construction
tblOffRoadEquipment OffRoadEquipmentUnitAmount 3.00 6.00
tblOffRoadEquipment OffRoadEquipmentUnitAmount 1.00 2.00
tblOffRoadEquipment OffRoadEquipmentUnitAmount 3.00 6.00
tblOffRoadEquipment OffRoadEquipmentUnitAmount 1.00 2.00
tblOffRoadEquipment OffRoadEquipmentUnitAmount 1.00 2.00
tblOffRoadEquipment OffRoadEquipmentUnitAmount 1.00 2.00
tblOffRoadEquipment HorsePower 130.00 125.00
tblOffRoadEquipment HorsePower 132.00 130.00
tblLandUse LotAcreage 2.20 4.00
tblOffRoadEquipment HorsePower 231.00 226.00
tblLandUse BuildingSpaceSquareFeet 95,630.00 95,625.00
tblLandUse LandUseSquareFeet 95,630.00 95,625.00
tblConstructionPhase NumDays 20.00 260.00
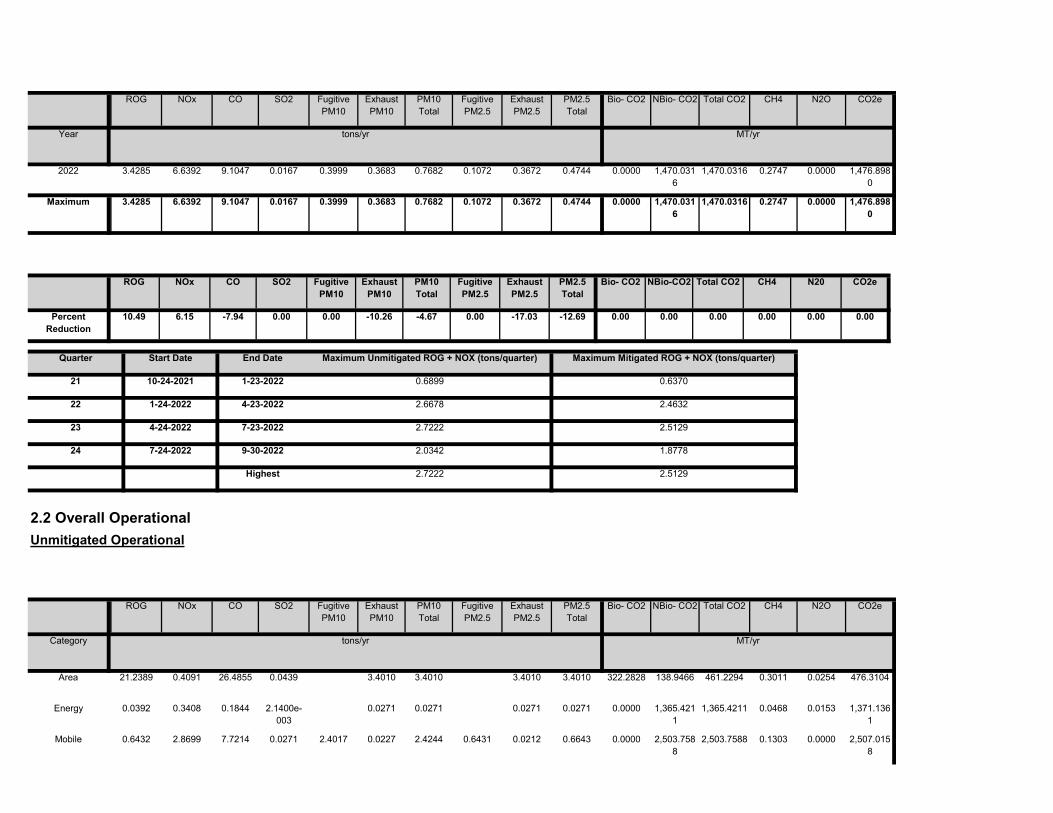
0.0000 2,503.7588
2,503.7588 0.1303 0.0000 2,507.0158
2.4017 0.0227 2.4244 0.6431 0.0212 0.6643Mobile 0.6432 2.8699 7.7214 0.0271
0.0000 1,365.4211
1,365.4211 0.0468 0.0153 1,371.1361
0.0271 0.0271 0.0271 0.0271Energy 0.0392 0.3408 0.1844 2.1400e-003
322.2828 138.9466 461.2294 0.3011 0.0254 476.31043.4010 3.4010 3.4010 3.4010Area 21.2389 0.4091 26.4855 0.0439
Total CO2 CH4 N2O CO2e
Category tons/yr MT/yr
PM10 Total
Fugitive PM2.5
Exhaust PM2.5
PM2.5 Total
Bio- CO2 NBio- CO2
2.2 Overall OperationalUnmitigated Operational
ROG NOx CO SO2 Fugitive PM10
Exhaust PM10
24 7-24-2022 9-30-2022 2.0342 1.8778
Highest 2.7222 2.5129
22 1-24-2022 4-23-2022 2.6678 2.4632
23 4-24-2022 7-23-2022 2.7222 2.5129
Quarter Start Date End Date Maximum Unmitigated ROG + NOX (tons/quarter) Maximum Mitigated ROG + NOX (tons/quarter)
21 10-24-2021 1-23-2022 0.6899 0.6370
0.00 0.00 0.00 0.00 0.00 0.000.00 -10.26 -4.67 0.00 -17.03 -12.69
NBio-CO2 Total CO2 CH4 N20 CO2e
Percent Reduction
10.49 6.15 -7.94 0.00
Exhaust PM10
PM10 Total
Fugitive PM2.5
Exhaust PM2.5
PM2.5 Total
Bio- CO2ROG NOx CO SO2 Fugitive PM10
0.0000 1,470.0316
1,470.0316 0.2747 0.0000 1,476.8980
0.3999 0.3683 0.7682 0.1072 0.3672 0.4744Maximum 3.4285 6.6392 9.1047 0.0167
0.0000 1,470.0316
1,470.0316 0.2747 0.0000 1,476.8980
0.3999 0.3683 0.7682 0.1072 0.3672 0.47442022 3.4285 6.6392 9.1047 0.0167
Total CO2 CH4 N2O CO2e
Year tons/yr MT/yr
PM10 Total
Fugitive PM2.5
Exhaust PM2.5
PM2.5 Total
Bio- CO2 NBio- CO2ROG NOx CO SO2 Fugitive PM10
Exhaust PM10

260
2 Paving Paving 1/1/2022 12/31/2022 5 260
End Date Num Days Week
Num Days Phase Description
1 Building Construction Building Construction 1/1/2022 12/31/2022 5
3.0 Construction Detail
Construction Phase
Phase Number
Phase Name Phase Type Start Date
0.00 0.00 0.00 0.00 0.00 0.000.00 0.00 0.00 0.00 0.00 0.00
NBio-CO2 Total CO2 CH4 N20 CO2e
Percent Reduction
0.00 0.00 0.00 0.00
Exhaust PM10
PM10 Total
Fugitive PM2.5
Exhaust PM2.5
PM2.5 Total
Bio- CO2ROG NOx CO SO2 Fugitive PM10
388.9518 4,235.2665
4,624.2183 5.0145 0.0752 4,771.9761
2.4017 3.4508 5.8526 0.6431 3.4493 4.0925Total 21.9213 3.6197 34.3913 0.0732
13.4651 227.1400 240.6050 1.3921 0.0346 285.70330.0000 0.0000 0.0000 0.0000Water
53.2039 0.0000 53.2039 3.1443 0.0000 131.81050.0000 0.0000 0.0000 0.0000Waste
0.0000 2,503.7588
2,503.7588 0.1303 0.0000 2,507.0158
2.4017 0.0227 2.4244 0.6431 0.0212 0.6643Mobile 0.6432 2.8699 7.7214 0.0271
0.0000 1,365.4211
1,365.4211 0.0468 0.0153 1,371.1361
0.0271 0.0271 0.0271 0.0271Energy 0.0392 0.3408 0.1844 2.1400e-003
322.2828 138.9466 461.2294 0.3011 0.0254 476.31043.4010 3.4010 3.4010 3.4010Area 21.2389 0.4091 26.4855 0.0439
Total CO2 CH4 N2O CO2e
Category tons/yr MT/yr
PM10 Total
Fugitive PM2.5
Exhaust PM2.5
PM2.5 Total
Bio- CO2 NBio- CO2
Mitigated Operational
ROG NOx CO SO2 Fugitive PM10
Exhaust PM10
388.9518 4,235.2665
4,624.2183 5.0145 0.0752 4,771.9761
2.4017 3.4508 5.8526 0.6431 3.4493 4.0925Total 21.9213 3.6197 34.3913 0.0732
13.4651 227.1400 240.6050 1.3921 0.0346 285.70330.0000 0.0000 0.0000 0.0000Water
53.2039 0.0000 53.2039 3.1443 0.0000 131.81050.0000 0.0000 0.0000 0.0000Waste

Use Cleaner Engines for Construction Equipment
7.30 20.00 LD_Mix HDT_Mix HHDT
3.1 Mitigation Measures Construction
Architectural Coating 2 53.00 0.00 0.00 10.80
10.80 7.30 20.00 LD_Mix HDT_Mix HHDT
7.30 20.00 LD_Mix HDT_Mix HHDT
Paving 10 25.00 0.00 0.00
Building Construction 18 265.00 49.00 0.00 10.80
Worker Trip Length
Vendor Trip Length
Hauling Trip Length
Worker Vehicle Class
Vendor Vehicle Class
Hauling Vehicle Class
Trips and VMT
Phase Name Offroad Equipment Count
Worker Trip Number
Vendor Trip Number
Hauling Trip Number
Architectural Coating Air Compressors 2 6.00 78 0.48
Paving Tractors/Loaders/Backhoes 2 8.00 97 0.37
Paving Rollers 2 8.00 80 0.38
Paving Paving Equipment 2 8.00 130 0.36
Paving Pavers 2 8.00 125 0.42
Paving Cement and Mortar Mixers 2 8.00 9 0.56
Building Construction Welders 2 8.00 46 0.45
Building Construction Tractors/Loaders/Backhoes 6 7.00 97 0.37
Building Construction Generator Sets 2 8.00 84 0.74
Building Construction Forklifts 6 8.00 89 0.20
Load Factor
Building Construction Cranes 2 7.00 226 0.29
OffRoad Equipment
Phase Name Offroad Equipment Type Amount Usage Hours Horse Power
131
Acres of Grading (Site Preparation Phase): 0
Acres of Grading (Grading Phase): 0
Acres of Paving: 0
Residential Indoor: 631,800; Residential Outdoor: 210,600; Non-Residential Indoor: 143,438; Non-Residential Outdoor: 47,813; Striped
3 Architectural Coating Architectural Coating 1/1/2022 12/31/2022 5

Mitigated Construction On-Site
0.0000 397.4436 397.4436 0.0183 0.0000 397.90130.3185 3.1000e-003
0.3216 0.0856 2.9000e-003
0.0885Total 0.1316 0.6961 0.9643 4.2600e-003
0.0000 232.4834 232.4834 6.3400e-003
0.0000 232.64180.2763 1.9100e-003
0.2782 0.0734 1.7600e-003
0.0752Worker 0.1133 0.0779 0.7990 2.5700e-003
0.0000 164.9602 164.9602 0.0120 0.0000 165.25950.0423 1.1900e-003
0.0435 0.0122 1.1400e-003
0.0134Vendor 0.0183 0.6182 0.1653 1.6900e-003
0.0000 0.0000 0.0000 0.0000 0.0000 0.00000.0000 0.0000 0.0000 0.0000 0.0000 0.0000Hauling 0.0000 0.0000 0.0000 0.0000
Total CO2 CH4 N2O CO2e
Category tons/yr MT/yr
PM10 Total
Fugitive PM2.5
Exhaust PM2.5
PM2.5 Total
Bio- CO2 NBio- CO2
Unmitigated Construction Off-Site
ROG NOx CO SO2 Fugitive PM10
Exhaust PM10
0.0000 599.9892 599.9892 0.1435 0.0000 603.57750.2095 0.2095 0.1971 0.1971Total 0.4418 4.0395 4.2452 6.9700e-003
0.0000 599.9892 599.9892 0.1435 0.0000 603.57750.2095 0.2095 0.1971 0.1971
CO2e
Category tons/yr MT/yr
Off-Road 0.4418 4.0395 4.2452 6.9700e-003
PM2.5 Total
Bio- CO2 NBio- CO2 Total CO2 CH4 N2OSO2 Fugitive PM10
Exhaust PM10
PM10 Total
Fugitive PM2.5
Exhaust PM2.5
Water Exposed Area
Reduce Vehicle Speed on Unpaved Roads
3.2 Building Construction - 2022Unmitigated Construction On-Site
ROG NOx CO

Total CO2 CH4 N2O CO2e
Category tons/yr MT/yr
PM10 Total
Fugitive PM2.5
Exhaust PM2.5
PM2.5 Total
Bio- CO2 NBio- CO2
3.3 Paving - 2022Unmitigated Construction On-Site
ROG NOx CO SO2 Fugitive PM10
Exhaust PM10
0.0000 397.4436 397.4436 0.0183 0.0000 397.90130.3185 3.1000e-003
0.3216 0.0856 2.9000e-003
0.0885Total 0.1316 0.6961 0.9643 4.2600e-003
0.0000 232.4834 232.4834 6.3400e-003
0.0000 232.64180.2763 1.9100e-003
0.2782 0.0734 1.7600e-003
0.0752Worker 0.1133 0.0779 0.7990 2.5700e-003
0.0000 164.9602 164.9602 0.0120 0.0000 165.25950.0423 1.1900e-003
0.0435 0.0122 1.1400e-003
0.0134Vendor 0.0183 0.6182 0.1653 1.6900e-003
0.0000 0.0000 0.0000 0.0000 0.0000 0.00000.0000 0.0000 0.0000 0.0000 0.0000 0.0000Hauling 0.0000 0.0000 0.0000 0.0000
Total CO2 CH4 N2O CO2e
Category tons/yr MT/yr
PM10 Total
Fugitive PM2.5
Exhaust PM2.5
PM2.5 Total
Bio- CO2 NBio- CO2
Mitigated Construction Off-Site
ROG NOx CO SO2 Fugitive PM10
Exhaust PM10
0.0000 599.9885 599.9885 0.1435 0.0000 603.57680.2316 0.2316 0.2310 0.2310Total 0.1824 3.6801 4.6228 6.9700e-003
0.0000 599.9885 599.9885 0.1435 0.0000 603.57680.2316 0.2316 0.2310 0.2310Off-Road 0.1824 3.6801 4.6228 6.9700e-003
Total CO2 CH4 N2O CO2e
Category tons/yr MT/yr
PM10 Total
Fugitive PM2.5
Exhaust PM2.5
PM2.5 Total
Bio- CO2 NBio- CO2ROG NOx CO SO2 Fugitive PM10
Exhaust PM10

0.0000 337.7859 337.7859 0.1066 0.0000 340.45170.1083 0.1083 0.1081 0.1081Total 0.0941 1.8873 2.8060 3.9000e-003
0.0000 0.0000 0.0000 0.0000 0.0000 0.00000.0000 0.0000 0.0000 0.0000Paving 0.0000
0.0000 337.7859 337.7859 0.1066 0.0000 340.45170.1083 0.1083 0.1081 0.1081Off-Road 0.0941 1.8873 2.8060 3.9000e-003
Total CO2 CH4 N2O CO2e
Category tons/yr MT/yr
PM10 Total
Fugitive PM2.5
Exhaust PM2.5
PM2.5 Total
Bio- CO2 NBio- CO2
Mitigated Construction On-Site
ROG NOx CO SO2 Fugitive PM10
Exhaust PM10
0.0000 21.9324 21.9324 6.0000e-004
0.0000 21.94730.0261 1.8000e-004
0.0262 6.9300e-003
1.7000e-004
7.0900e-003
Total 0.0107 7.3500e-003
0.0754 2.4000e-004
0.0000 21.9324 21.9324 6.0000e-004
0.0000 21.94730.0261 1.8000e-004
0.0262 6.9300e-003
1.7000e-004
7.0900e-003
Worker 0.0107 7.3500e-003
0.0754 2.4000e-004
0.0000 0.0000 0.0000 0.0000 0.0000 0.00000.0000 0.0000 0.0000 0.0000 0.0000 0.0000Vendor 0.0000 0.0000 0.0000 0.0000
0.0000 0.0000 0.0000 0.0000 0.0000 0.00000.0000 0.0000 0.0000 0.0000 0.0000 0.0000Hauling 0.0000 0.0000 0.0000 0.0000
Total CO2 CH4 N2O CO2e
Category tons/yr MT/yr
PM10 Total
Fugitive PM2.5
Exhaust PM2.5
PM2.5 Total
Bio- CO2 NBio- CO2
Unmitigated Construction Off-Site
ROG NOx CO SO2 Fugitive PM10
Exhaust PM10
0.0000 337.7863 337.7863 0.1066 0.0000 340.45210.0997 0.0997 0.0920 0.0920Total 0.1987 1.9498 2.5187 3.9000e-003
0.0000 0.0000 0.0000 0.0000 0.0000 0.00000.0000 0.0000 0.0000 0.0000Paving 0.0000
0.0000 337.7863 337.7863 0.1066 0.0000 340.45210.0997 0.0997 0.0920 0.0920Off-Road 0.1987 1.9498 2.5187 3.9000e-003
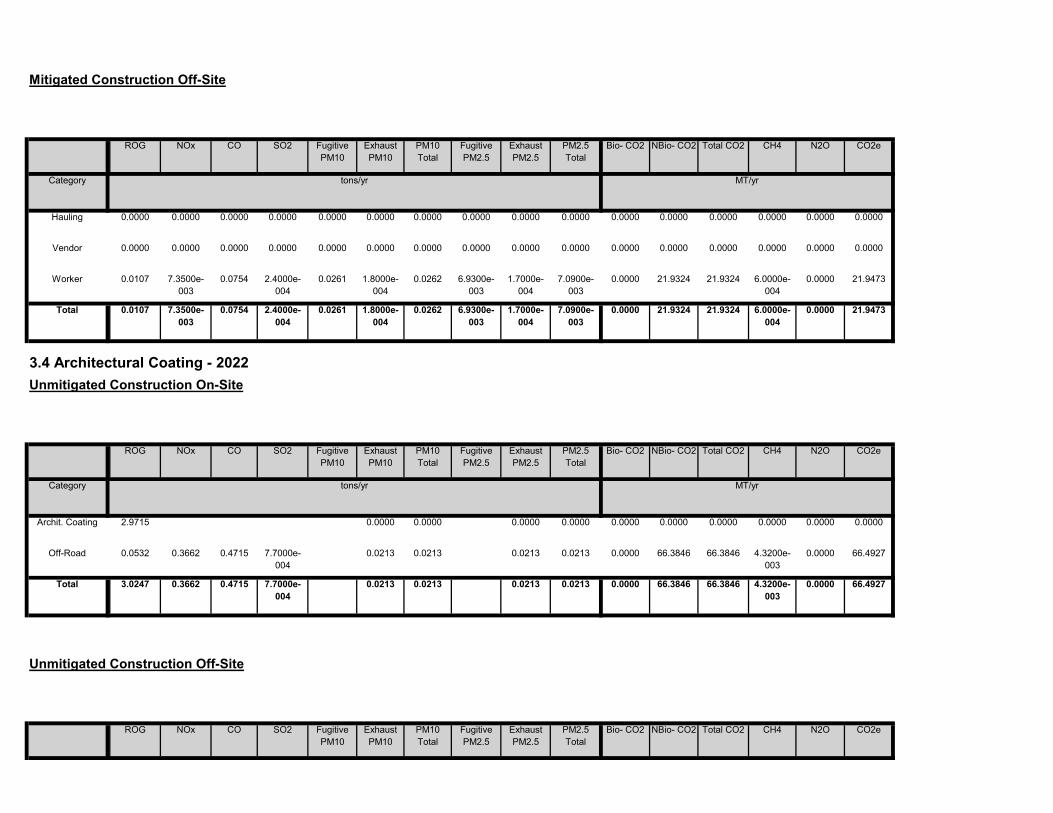
Total CO2 CH4 N2O CO2ePM10 Total
Fugitive PM2.5
Exhaust PM2.5
PM2.5 Total
Bio- CO2 NBio- CO2
Unmitigated Construction Off-Site
ROG NOx CO SO2 Fugitive PM10
Exhaust PM10
0.0000 66.3846 66.3846 4.3200e-003
0.0000 66.49270.0213 0.0213 0.0213 0.0213Total 3.0247 0.3662 0.4715 7.7000e-004
0.0000 66.3846 66.3846 4.3200e-003
0.0000 66.49270.0213 0.0213 0.0213 0.0213Off-Road 0.0532 0.3662 0.4715 7.7000e-004
0.0000 0.0000 0.0000 0.0000 0.0000 0.00000.0000 0.0000 0.0000 0.0000Archit. Coating 2.9715
Total CO2 CH4 N2O CO2e
Category tons/yr MT/yr
PM10 Total
Fugitive PM2.5
Exhaust PM2.5
PM2.5 Total
Bio- CO2 NBio- CO2
3.4 Architectural Coating - 2022Unmitigated Construction On-Site
ROG NOx CO SO2 Fugitive PM10
Exhaust PM10
0.0000 21.9324 21.9324 6.0000e-004
0.0000 21.94730.0261 1.8000e-004
0.0262 6.9300e-003
1.7000e-004
7.0900e-003
Total 0.0107 7.3500e-003
0.0754 2.4000e-004
0.0000 21.9324 21.9324 6.0000e-004
0.0000 21.94730.0261 1.8000e-004
0.0262 6.9300e-003
1.7000e-004
7.0900e-003
Worker 0.0107 7.3500e-003
0.0754 2.4000e-004
0.0000 0.0000 0.0000 0.0000 0.0000 0.00000.0000 0.0000 0.0000 0.0000 0.0000 0.0000Vendor 0.0000 0.0000 0.0000 0.0000
0.0000 0.0000 0.0000 0.0000 0.0000 0.00000.0000 0.0000 0.0000 0.0000 0.0000 0.0000Hauling 0.0000 0.0000 0.0000 0.0000
Total CO2 CH4 N2O CO2e
Category tons/yr MT/yr
PM10 Total
Fugitive PM2.5
Exhaust PM2.5
PM2.5 Total
Bio- CO2 NBio- CO2
Mitigated Construction Off-Site
ROG NOx CO SO2 Fugitive PM10
Exhaust PM10
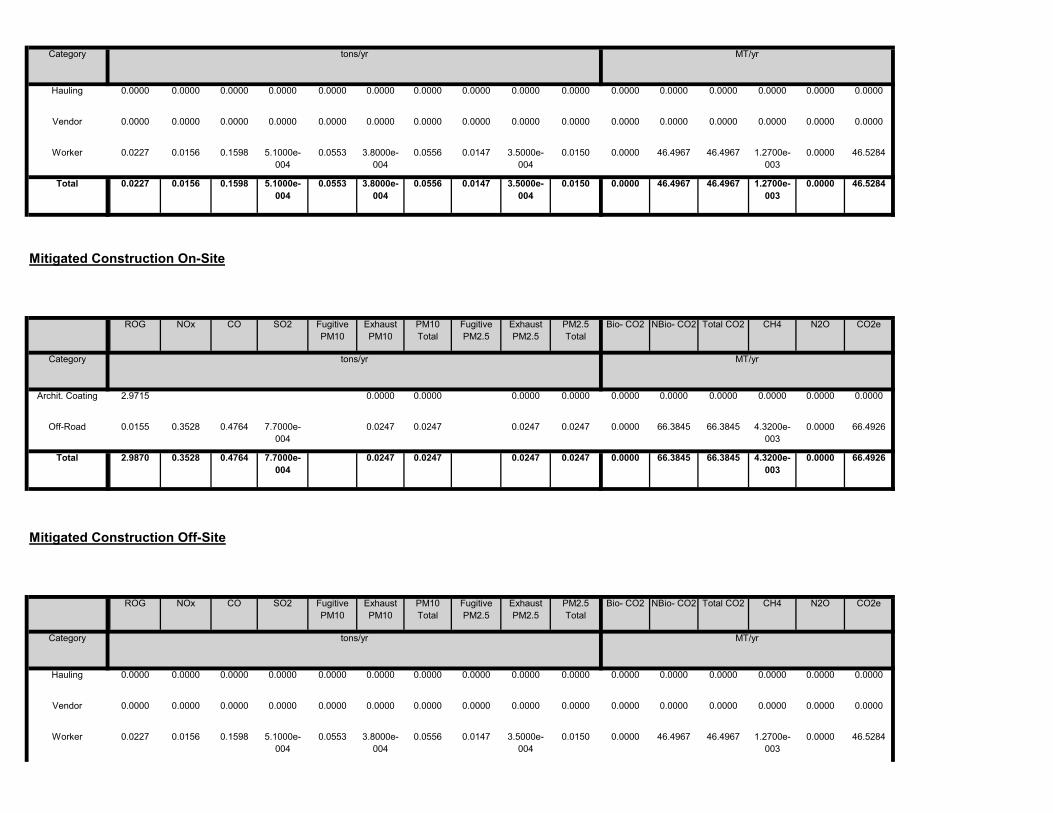
0.0000 46.4967 46.4967 1.2700e-003
0.0000 46.52840.0553 3.8000e-004
0.0556 0.0147 3.5000e-004
0.0150Worker 0.0227 0.0156 0.1598 5.1000e-004
0.0000 0.0000 0.0000 0.0000 0.0000 0.00000.0000 0.0000 0.0000 0.0000 0.0000 0.0000Vendor 0.0000 0.0000 0.0000 0.0000
0.0000 0.0000 0.0000 0.0000 0.0000 0.00000.0000 0.0000 0.0000 0.0000 0.0000 0.0000Hauling 0.0000 0.0000 0.0000 0.0000
Total CO2 CH4 N2O CO2e
Category tons/yr MT/yr
PM10 Total
Fugitive PM2.5
Exhaust PM2.5
PM2.5 Total
Bio- CO2 NBio- CO2
Mitigated Construction Off-Site
ROG NOx CO SO2 Fugitive PM10
Exhaust PM10
0.0000 66.3845 66.3845 4.3200e-003
0.0000 66.49260.0247 0.0247 0.0247 0.0247Total 2.9870 0.3528 0.4764 7.7000e-004
0.0000 66.3845 66.3845 4.3200e-003
0.0000 66.49260.0247 0.0247 0.0247 0.0247Off-Road 0.0155 0.3528 0.4764 7.7000e-004
0.0000 0.0000 0.0000 0.0000 0.0000 0.00000.0000 0.0000 0.0000 0.0000Archit. Coating 2.9715
Total CO2 CH4 N2O CO2e
Category tons/yr MT/yr
PM10 Total
Fugitive PM2.5
Exhaust PM2.5
PM2.5 Total
Bio- CO2 NBio- CO2
Mitigated Construction On-Site
ROG NOx CO SO2 Fugitive PM10
Exhaust PM10
0.0000 46.4967 46.4967 1.2700e-003
0.0000 46.52840.0553 3.8000e-004
0.0556 0.0147 3.5000e-004
0.0150Total 0.0227 0.0156 0.1598 5.1000e-004
0.0000 46.4967 46.4967 1.2700e-003
0.0000 46.52840.0553 3.8000e-004
0.0556 0.0147 3.5000e-004
0.0150Worker 0.0227 0.0156 0.1598 5.1000e-004
0.0000 0.0000 0.0000 0.0000 0.0000 0.00000.0000 0.0000 0.0000 0.0000 0.0000 0.0000Vendor 0.0000 0.0000 0.0000 0.0000
0.0000 0.0000 0.0000 0.0000 0.0000 0.00000.0000 0.0000 0.0000 0.0000 0.0000 0.0000Hauling 0.0000 0.0000 0.0000 0.0000
Category tons/yr MT/yr

28.00 13.00 79 19 2
4.4 Fleet Mix
18.80 39.60 86 11 3
Industrial Park 9.50 7.30 7.30 59.00
H-S or C-C H-O or C-NW Primary Diverted Pass-by
Condo/Townhouse 10.80 7.30 7.50 41.60
4.3 Trip Type Information
Miles Trip % Trip Purpose %
Land Use H-W or C-W H-S or C-C H-O or C-NW H-W or C-W
Total 2,465.87 2,007.16 1,579.89 6,373,117 6,373,117Industrial Park 653.15 238.12 69.81 1,338,516 1,338,516
Annual VMT
Condo/Townhouse 1,812.72 1,769.04 1510.08 5,034,601 5,034,601
4.2 Trip Summary Information
Average Daily Trip Rate Unmitigated MitigatedLand Use Weekday Saturday Sunday Annual VMT
0.0000 2,503.7588
2,503.7588 0.1303 0.0000 2,507.0158
2.4017 0.0227 2.4244 0.6431 0.0212 0.6643Unmitigated 0.6432 2.8699 7.7214 0.0271
0.0000 2,503.7588
2,503.7588 0.1303 0.0000 2,507.0158
2.4017 0.0227 2.4244 0.6431 0.0212 0.6643Mitigated 0.6432 2.8699 7.7214 0.0271
NBio- CO2 Total CO2 CH4 N2O CO2e
Category tons/yr MT/yr
Exhaust PM10
PM10 Total
Fugitive PM2.5
Exhaust PM2.5
PM2.5 Total
Bio- CO2
4.0 Operational Detail - Mobile
4.1 Mitigation Measures Mobile
ROG NOx CO SO2 Fugitive PM10
0.0000 46.4967 46.4967 1.2700e-003
0.0000 46.52840.0553 3.8000e-004
0.0556 0.0147 3.5000e-004
0.0150Total 0.0227 0.0156 0.1598 5.1000e-004
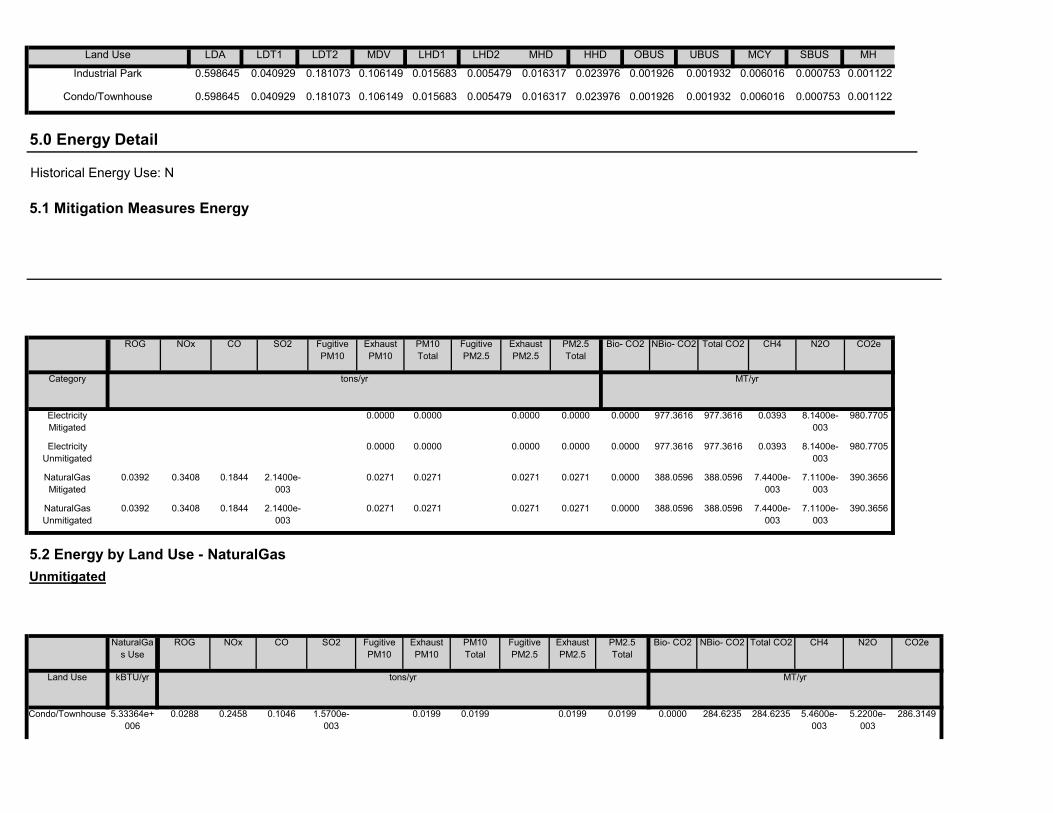
286.31490.0199 0.0000 284.6235 284.6235 5.4600e-003
5.2200e-003
1.5700e-003
0.0199 0.0199 0.0199Condo/Townhouse 5.33364e+006
0.0288 0.2458 0.1046
NBio- CO2 Total CO2 CH4 N2O CO2e
Land Use kBTU/yr tons/yr MT/yr
Exhaust PM10
PM10 Total
Fugitive PM2.5
Exhaust PM2.5
PM2.5 Total
Bio- CO2
5.2 Energy by Land Use - NaturalGasUnmitigated
NaturalGas Use
ROG NOx CO SO2 Fugitive PM10
0.0000 388.0596 388.0596 7.4400e-003
7.1100e-003
390.36560.0271 0.0271 0.0271 0.0271NaturalGas Unmitigated
0.0392 0.3408 0.1844 2.1400e-003
0.0000 388.0596 388.0596 7.4400e-003
7.1100e-003
390.36560.0271 0.0271 0.0271 0.0271NaturalGas Mitigated
0.0392 0.3408 0.1844 2.1400e-003
0.0000 977.3616 977.3616 0.0393 8.1400e-003
980.77050.0000 0.0000 0.0000 0.0000Electricity Unmitigated
0.0000 977.3616 977.3616 0.0393 8.1400e-003
980.77050.0000 0.0000 0.0000 0.0000
CO2e
Category tons/yr MT/yr
Electricity Mitigated
PM2.5 Total
Bio- CO2 NBio- CO2 Total CO2 CH4 N2OSO2 Fugitive PM10
Exhaust PM10
PM10 Total
Fugitive PM2.5
Exhaust PM2.5
0.000753 0.001122
5.0 Energy Detail
Historical Energy Use: N
5.1 Mitigation Measures Energy
ROG NOx CO
0.005479 0.016317 0.023976 0.001926 0.001932 0.006016Condo/Townhouse 0.598645 0.040929 0.181073 0.106149 0.015683
0.023976 0.001926 0.001932 0.006016 0.000753 0.001122
SBUS MH
Industrial Park 0.598645 0.040929 0.181073 0.106149 0.015683 0.005479 0.016317
LHD2 MHD HHD OBUS UBUS MCYLand Use LDA LDT1 LDT2 MDV LHD1

980.7705
Mitigated
Total 977.3616 0.0393 8.1400e-003
549.2557
Industrial Park 1.3158e+006
430.0150 0.0173 3.5800e-003
431.5148
Land Use kWh/yr ton
MT/yr
Condo/Townhouse 1.67482e+006
547.3466 0.0220 4.5600e-003
390.3656
5.3 Energy by Land Use - ElectricityUnmitigated
Electricity Use
Total CO2 CH4 N2O CO2e
0.0271 0.0000 388.0596 388.0596 7.4400e-003
7.1200e-003
2.1400e-003
0.0271 0.0271 0.0271
103.4361 1.9800e-003
1.9000e-003
104.0507
Total 0.0392 0.3408 0.1844
7.2200e-003
7.2200e-003
7.2200e-003
0.0000 103.4361
286.3149
Industrial Park 1.93832e+006
0.0105 0.0950 0.0798 5.7000e-004
7.2200e-003
0.0199 0.0000 284.6235 284.6235 5.4600e-003
5.2200e-003
1.5700e-003
0.0199 0.0199 0.0199
Land Use kBTU/yr tons/yr MT/yr
Condo/Townhouse 5.33364e+006
0.0288 0.2458 0.1046
Bio- CO2 NBio- CO2 Total CO2 CH4 N2O CO2eFugitive PM10
Exhaust PM10
PM10 Total
Fugitive PM2.5
Exhaust PM2.5
PM2.5 Total
390.3656
Mitigated
NaturalGas Use
ROG NOx CO SO2
0.0271 0.0000 388.0596 388.0596 7.4400e-003
7.1200e-003
2.1400e-003
0.0271 0.0271 0.0271
103.4361 1.9800e-003
1.9000e-003
104.0507
Total 0.0392 0.3408 0.1844
7.2200e-003
7.2200e-003
7.2200e-003
0.0000 103.4361Industrial Park 1.93832e+006
0.0105 0.0950 0.0798 5.7000e-004
7.2200e-003

Total CO2 CH4 N2O CO2ePM10 Total
Fugitive PM2.5
Exhaust PM2.5
PM2.5 Total
Bio- CO2 NBio- CO2
6.2 Area by SubCategoryUnmitigated
ROG NOx CO SO2 Fugitive PM10
Exhaust PM10
322.2828 138.9466 461.2294 0.3011 0.0254 476.31043.4010 3.4010 3.4010 3.4010Unmitigated 21.2389 0.4091 26.4855 0.0439
322.2828 138.9466 461.2294 0.3011 0.0254 476.31043.4010 3.4010 3.4010 3.4010Mitigated 21.2389 0.4091 26.4855 0.0439
NBio- CO2 Total CO2 CH4 N2O CO2e
Category tons/yr MT/yr
Exhaust PM10
PM10 Total
Fugitive PM2.5
Exhaust PM2.5
PM2.5 Total
Bio- CO2
980.7705
6.0 Area Detail
6.1 Mitigation Measures Area
ROG NOx CO SO2 Fugitive PM10
Total 977.3616 0.0393 8.1400e-003
549.2557
Industrial Park 1.3158e+006
430.0150 0.0173 3.5800e-003
431.5148
Land Use kWh/yr ton
MT/yr
Condo/Townhouse 1.67482e+006
547.3466 0.0220 4.5600e-003
Electricity Use
Total CO2 CH4 N2O CO2e

7.0 Water Detail
7.1 Mitigation Measures Water
322.2828 138.9466 461.2294 0.3011 0.0254 476.31043.4011 3.4011 3.4011 3.4011Total 21.2389 0.4091 26.4855 0.0439
0.0000 3.7859 3.7859 3.6600e-003
0.0000 3.87730.0128 0.0128 0.0128 0.0128Landscaping 0.0701 0.0268 2.3200 1.2000e-004
322.2828 135.1607 457.4435 0.2974 0.0254 472.43313.3882 3.3882 3.3882 3.3882Hearth 19.5768 0.3823 24.1655 0.0438
0.0000 0.0000 0.0000 0.0000 0.0000 0.00000.0000 0.0000 0.0000 0.0000Consumer Products
1.5920
0.0000 0.0000 0.0000 0.0000 0.0000 0.00000.0000 0.0000 0.0000 0.0000Architectural Coating
0.0000
Total CO2 CH4 N2O CO2e
SubCategory tons/yr MT/yr
PM10 Total
Fugitive PM2.5
Exhaust PM2.5
PM2.5 Total
Bio- CO2 NBio- CO2
Mitigated
ROG NOx CO SO2 Fugitive PM10
Exhaust PM10
322.2828 138.9466 461.2294 0.3011 0.0254 476.31043.4011 3.4011 3.4011 3.4011Total 21.2389 0.4091 26.4855 0.0439
0.0000 3.7859 3.7859 3.6600e-003
0.0000 3.87730.0128 0.0128 0.0128 0.0128Landscaping 0.0701 0.0268 2.3200 1.2000e-004
322.2828 135.1607 457.4435 0.2974 0.0254 472.43313.3882 3.3882 3.3882 3.3882Hearth 19.5768 0.3823 24.1655 0.0438
0.0000 0.0000 0.0000 0.0000 0.0000 0.00000.0000 0.0000 0.0000 0.0000Consumer Products
1.5920
0.0000 0.0000 0.0000 0.0000 0.0000 0.00000.0000 0.0000 0.0000 0.0000Architectural Coating
0.0000
SubCategory tons/yr MT/yr

161.1685
Industrial Park 22.1144 / 0 101.1212 0.7244 0.0178 124.5348
Land Use Mgal ton
MT/yr
Condo/Townhouse 20.3281 / 12.8155
139.4838 0.6677 0.0168
285.7033
Mitigated
Indoor/Outdoor Use
Total CO2 CH4 N2O CO2e
Total 240.6050 1.3921 0.0346
161.1685
Industrial Park 22.1144 / 0 101.1212 0.7244 0.0178 124.5348
Land Use Mgal ton
MT/yr
Condo/Townhouse 20.3281 / 12.8155
139.4838 0.6677 0.0168
7.2 Water by Land UseUnmitigated
Indoor/Outdoor Use
Total CO2 CH4 N2O CO2e
Unmitigated 240.6050 1.3921 0.0346 285.7033
Category ton
MT/yr
Mitigated 240.6050 1.3921 0.0346 285.7033
Total CO2 CH4 N2O CO2e

131.8105Total 53.2039 3.1443 0.0000
72.1764
Industrial Park 118.58 24.0707 1.4225 0.0000 59.6341
Land Use tons ton
MT/yr
Condo/Townhouse 143.52 29.1333 1.7217 0.0000
8.2 Waste by Land UseUnmitigated
Waste Disposed
Total CO2 CH4 N2O CO2e
Unmitigated 53.2039 3.1443 0.0000 131.8105
ton
MT/yr
Mitigated 53.2039 3.1443 0.0000 131.8105
285.7033
8.0 Waste Detail
8.1 Mitigation Measures Waste
Category/Year
Total CO2 CH4 N2O CO2e
Total 240.6050 1.3921 0.0346

User Defined Equipment
Equipment Type Number
11.0 Vegetation
Load Factor Fuel Type
Boilers
Equipment Type Number Heat Input/Day Heat Input/Year Boiler Rating Fuel Type
Horse Power Load Factor Fuel Type
10.0 Stationary Equipment
Fire Pumps and Emergency Generators
Equipment Type Number Hours/Day Hours/Year Horse Power
131.8105
9.0 Operational Offroad
Equipment Type Number Hours/Day Days/Year
Total 53.2039 3.1443 0.0000
72.1764
Industrial Park 118.58 24.0707 1.4225 0.0000 59.6341
Land Use tons ton
MT/yr
Condo/Townhouse 143.52 29.1333 1.7217 0.0000
Mitigated
Waste Disposed
Total CO2 CH4 N2O CO2e

tblArchitecturalCoating EF_Residential_Interior 250.00 50.00
tblAreaCoating Area_EF_Parking 250 0
tblArchitecturalCoating EF_Parking 250.00 100.00
tblArchitecturalCoating EF_Residential_Exterior 250.00 100.00
tblArchitecturalCoating EF_Nonresidential_Exterior 250.00 100.00
tblArchitecturalCoating EF_Nonresidential_Interior 250.00 50.00
1.3 User Entered Comments & Non-Default Data
Architectural Coating - Rule 67.0.1 coatings
Table Name Column Name Default Value New Value
CO2 Intensity (lb/MWhr)
720.49 CH4 Intensity (lb/MWhr)
0.029 N2O Intensity (lb/MWhr)
0.006
40
Climate Zone 13 Operational Year 2023
Utility Company San Diego Gas & Electric
1.2 Other Project Characteristics
Urbanization Urban Wind Speed (m/s) 2.6 Precipitation Freq (Days)
Strip Mall 78.00 1000sqft 1.79 78,000.00 0
Condo/Townhouse 100.00 Dwelling Unit 6.25 100,000.00 286
Floor Surface Area Population
Industrial Park 95.63 1000sqft 2.20 95,625.00 0
1.0 Project Characteristics
1.1 Land Usage
Land Uses Size Metric Lot Acreage
CalEEMod Version: CalEEMod.2016.3.1 Page 1 of 1 Date: 10/24/2016 3:12 PM
East Otay Mesa Specific Plan Amendment Phase 6 Construction - San Diego Air Basin, Annual
East Otay Mesa Specific Plan Amendment Phase 6 ConstructionSan Diego Air Basin, Annual

tblConstEquipMitigation Tier No Change Tier 3
tblConstructionPhase NumDays 20.00 130.00
tblConstEquipMitigation Tier No Change Tier 3
tblConstEquipMitigation Tier No Change Tier 3
tblConstEquipMitigation Tier No Change Tier 3
tblConstEquipMitigation Tier No Change Tier 3
tblConstEquipMitigation Tier No Change Tier 3
tblConstEquipMitigation Tier No Change Tier 3
tblConstEquipMitigation Tier No Change Tier 3
tblConstEquipMitigation Tier No Change Tier 3
tblConstEquipMitigation NumberOfEquipmentMitigated 0.00 2.00
tblConstEquipMitigation Tier No Change Tier 3
tblConstEquipMitigation NumberOfEquipmentMitigated 0.00 2.00
tblConstEquipMitigation NumberOfEquipmentMitigated 0.00 8.00
tblConstEquipMitigation NumberOfEquipmentMitigated 0.00 2.00
tblConstEquipMitigation NumberOfEquipmentMitigated 0.00 2.00
tblConstEquipMitigation NumberOfEquipmentMitigated 0.00 6.00
tblConstEquipMitigation NumberOfEquipmentMitigated 0.00 2.00
tblConstEquipMitigation NumberOfEquipmentMitigated 0.00 2.00
tblConstEquipMitigation NumberOfEquipmentMitigated 0.00 2.00
tblConstDustMitigation WaterUnpavedRoadVehicleSpeed 40 15
tblConstEquipMitigation NumberOfEquipmentMitigated 0.00 2.00
tblAreaMitigation UseLowVOCPaintResidentialExteriorValue
250 0
tblAreaMitigation UseLowVOCPaintResidentialInteriorValue
250 0
tblAreaMitigation UseLowVOCPaintNonresidentialExteriorValue
250 0
tblAreaMitigation UseLowVOCPaintNonresidentialInteriorValue
250 0
tblAreaCoating Area_Residential_Exterior 67500 0
tblAreaCoating Area_Residential_Interior 202500 0
tblAreaCoating Area_Nonresidential_Exterior 86813 0
tblAreaCoating Area_Nonresidential_Interior 260438 0

Mitigated Construction
0.0000 1,291.9029
1,291.9029 0.2660 0.0000 1,298.5535
0.2307 0.2899 0.5206 0.0621 0.2723 0.3344Maximum 2.5193 6.2921 7.8510 0.0147
0.0000 1,291.9029
1,291.9029 0.2660 0.0000 1,298.5535
0.2307 0.2899 0.5206 0.0621 0.2723 0.33442023 2.5193 6.2921 7.8510 0.0147
NBio- CO2 Total CO2 CH4 N2O CO2e
Year tons/yr MT/yr
Exhaust PM10
PM10 Total
Fugitive PM2.5
Exhaust PM2.5
PM2.5 Total
Bio- CO2
2.0 Emissions Summary
2.1 Overall ConstructionUnmitigated Construction
ROG NOx CO SO2 Fugitive PM10
tblOffRoadEquipment OffRoadEquipmentUnitAmount 1.00 2.00
tblProjectCharacteristics OperationalYear 2018 2023
tblOffRoadEquipment OffRoadEquipmentUnitAmount 1.00 2.00
tblOffRoadEquipment OffRoadEquipmentUnitAmount 3.00 6.00
tblOffRoadEquipment OffRoadEquipmentUnitAmount 1.00 2.00
tblOffRoadEquipment OffRoadEquipmentUnitAmount 3.00 6.00
tblOffRoadEquipment HorsePower 132.00 130.00
tblOffRoadEquipment OffRoadEquipmentUnitAmount 1.00 2.00
tblOffRoadEquipment HorsePower 231.00 226.00
tblOffRoadEquipment HorsePower 130.00 125.00
tblLandUse BuildingSpaceSquareFeet 95,630.00 95,625.00
tblLandUse LandUseSquareFeet 95,630.00 95,625.00
tblConstructionPhase NumDays 300.00 260.00
tblConstructionPhase NumDays 20.00 260.00

0.0000 3,059.2280
3,059.2280 0.1633 0.0000 3,063.3107
2.9494 0.0263 2.9757 0.7898 0.0245 0.8143Mobile 0.9486 3.6172 9.9001 0.0331
0.0000 1,138.0119
1,138.0119 0.0415 0.0115 1,142.4819
0.0142 0.0142 0.0142 0.0142Energy 0.0206 0.1824 0.1205 1.1200e-003
103.2958 44.5367 147.8325 0.0965 8.1200e-003
152.66621.0901 1.0901 1.0901 1.0901Area 7.3658 0.1311 8.4896 0.0141
Total CO2 CH4 N2O CO2e
Category tons/yr MT/yr
PM10 Total
Fugitive PM2.5
Exhaust PM2.5
PM2.5 Total
Bio- CO2 NBio- CO2
2.2 Overall OperationalUnmitigated Operational
ROG NOx CO SO2 Fugitive PM10
Exhaust PM10
28 7-24-2023 9-30-2023 1.6446 1.5905
Highest 2.2008 2.1284
26 1-24-2023 4-23-2023 2.1552 2.0844
27 4-24-2023 7-23-2023 2.2008 2.1284
Quarter Start Date End Date Maximum Unmitigated ROG + NOX (tons/quarter) Maximum Mitigated ROG + NOX (tons/quarter)
25 10-24-2022 1-23-2023 0.5572 0.5389
0.00 0.00 0.00 0.00 0.00 0.000.00 -27.72 -15.44 0.00 -35.93 -29.25
NBio-CO2 Total CO2 CH4 N20 CO2e
Percent Reduction
14.38 -1.15 -9.11 0.00
Exhaust PM10
PM10 Total
Fugitive PM2.5
Exhaust PM2.5
PM2.5 Total
Bio- CO2ROG NOx CO SO2 Fugitive PM10
0.0000 1,291.9017
1,291.9017 0.2660 0.0000 1,298.5523
0.2307 0.3703 0.6010 0.0621 0.3702 0.4322Maximum 2.1571 6.3647 8.5663 0.0147
0.0000 1,291.9017
1,291.9017 0.2660 0.0000 1,298.5523
0.2307 0.3703 0.6010 0.0621 0.3702 0.43222023 2.1571 6.3647 8.5663 0.0147
Total CO2 CH4 N2O CO2e
Year tons/yr MT/yr
PM10 Total
Fugitive PM2.5
Exhaust PM2.5
PM2.5 Total
Bio- CO2 NBio- CO2ROG NOx CO SO2 Fugitive PM10
Exhaust PM10

260
2 Paving Paving 1/1/2023 12/31/2023 5 260
End Date Num Days Week
Num Days Phase Description
1 Building Construction Building Construction 1/1/2023 12/31/2023 5
3.0 Construction Detail
Construction Phase
Phase Number
Phase Name Phase Type Start Date
0.00 0.00 0.00 0.00 0.00 0.000.00 0.00 0.00 0.00 0.00 0.00
NBio-CO2 Total CO2 CH4 N20 CO2e
Percent Reduction
0.00 0.00 0.00 0.00
Exhaust PM10
PM10 Total
Fugitive PM2.5
Exhaust PM2.5
PM2.5 Total
Bio- CO2ROG NOx CO SO2 Fugitive PM10
164.2449 4,415.9647
4,580.2096 4.3864 0.0476 4,704.0437
2.9494 1.1307 4.0801 0.7898 1.1288 1.9186Total 8.3349 3.9306 18.5102 0.0483
10.9159 174.1881 185.1040 1.1282 0.0279 221.62980.0000 0.0000 0.0000 0.0000Water
50.0332 0.0000 50.0332 2.9569 0.0000 123.95520.0000 0.0000 0.0000 0.0000Waste
0.0000 3,059.2280
3,059.2280 0.1633 0.0000 3,063.3107
2.9494 0.0263 2.9757 0.7898 0.0245 0.8143Mobile 0.9486 3.6172 9.9001 0.0331
0.0000 1,138.0119
1,138.0119 0.0415 0.0115 1,142.4819
0.0142 0.0142 0.0142 0.0142Energy 0.0206 0.1824 0.1205 1.1200e-003
103.2958 44.5367 147.8325 0.0965 8.1200e-003
152.66621.0901 1.0901 1.0901 1.0901Area 7.3658 0.1311 8.4896 0.0141
Total CO2 CH4 N2O CO2e
Category tons/yr MT/yr
PM10 Total
Fugitive PM2.5
Exhaust PM2.5
PM2.5 Total
Bio- CO2 NBio- CO2
Mitigated Operational
ROG NOx CO SO2 Fugitive PM10
Exhaust PM10
164.2449 4,415.9647
4,580.2096 4.3864 0.0476 4,704.0437
2.9494 1.1307 4.0801 0.7898 1.1288 1.9186Total 8.3349 3.9306 18.5102 0.0483
10.9159 174.1881 185.1040 1.1282 0.0279 221.62980.0000 0.0000 0.0000 0.0000Water
50.0332 0.0000 50.0332 2.9569 0.0000 123.95520.0000 0.0000 0.0000 0.0000Waste

Use Cleaner Engines for Construction Equipment
7.30 20.00 LD_Mix HDT_Mix HHDT
3.1 Mitigation Measures Construction
Architectural Coating 2 27.00 0.00 0.00 10.80
10.80 7.30 20.00 LD_Mix HDT_Mix HHDT
7.30 20.00 LD_Mix HDT_Mix HHDT
Paving 10 25.00 0.00 0.00
Building Construction 18 137.00 39.00 0.00 10.80
Worker Trip Length
Vendor Trip Length
Hauling Trip Length
Worker Vehicle Class
Vendor Vehicle Class
Hauling Vehicle Class
Trips and VMT
Phase Name Offroad Equipment Count
Worker Trip Number
Vendor Trip Number
Hauling Trip Number
Architectural Coating Air Compressors 2 6.00 78 0.48
Paving Tractors/Loaders/Backhoes 2 8.00 97 0.37
Paving Rollers 2 8.00 80 0.38
Paving Paving Equipment 2 8.00 130 0.36
Paving Pavers 2 8.00 125 0.42
Paving Cement and Mortar Mixers 2 8.00 9 0.56
Building Construction Welders 2 8.00 46 0.45
Building Construction Tractors/Loaders/Backhoes 6 7.00 97 0.37
Building Construction Generator Sets 2 8.00 84 0.74
Building Construction Forklifts 6 8.00 89 0.20
Load Factor
Building Construction Cranes 2 7.00 226 0.29
OffRoad Equipment
Phase Name Offroad Equipment Type Amount Usage Hours Horse Power
130
Acres of Grading (Site Preparation Phase): 0
Acres of Grading (Grading Phase): 0
Acres of Paving: 0
Residential Indoor: 202,500; Residential Outdoor: 67,500; Non-Residential Indoor: 260,438; Non-Residential Outdoor: 86,813; Striped
3 Architectural Coating Architectural Coating 1/1/2023 12/31/2023 5

Mitigated Construction On-Site
0.0000 243.5882 243.5882 0.0117 0.0000 243.88070.1765 1.4300e-003
0.1779 0.0477 1.3300e-003
0.0490Total 0.0668 0.4233 0.5029 2.5900e-003
0.0000 115.5986 115.5986 3.0000e-003
0.0000 115.67340.1428 9.7000e-004
0.1438 0.0380 8.9000e-004
0.0388Worker 0.0555 0.0368 0.3831 1.2800e-003
0.0000 127.9897 127.9897 8.7000e-003
0.0000 128.20720.0337 4.6000e-004
0.0341 9.7200e-003
4.4000e-004
0.0102Vendor 0.0113 0.3865 0.1198 1.3100e-003
0.0000 0.0000 0.0000 0.0000 0.0000 0.00000.0000 0.0000 0.0000 0.0000 0.0000 0.0000Hauling 0.0000 0.0000 0.0000 0.0000
Total CO2 CH4 N2O CO2e
Category tons/yr MT/yr
PM10 Total
Fugitive PM2.5
Exhaust PM2.5
PM2.5 Total
Bio- CO2 NBio- CO2
Unmitigated Construction Off-Site
ROG NOx CO SO2 Fugitive PM10
Exhaust PM10
0.0000 600.1960 600.1960 0.1426 0.0000 603.76010.1812 0.1812 0.1705 0.1705Total 0.4072 3.7213 4.2144 6.9800e-003
0.0000 600.1960 600.1960 0.1426 0.0000 603.76010.1812 0.1812 0.1705 0.1705
CO2e
Category tons/yr MT/yr
Off-Road 0.4072 3.7213 4.2144 6.9800e-003
PM2.5 Total
Bio- CO2 NBio- CO2 Total CO2 CH4 N2OSO2 Fugitive PM10
Exhaust PM10
PM10 Total
Fugitive PM2.5
Exhaust PM2.5
Water Exposed Area
Reduce Vehicle Speed on Unpaved Roads
3.2 Building Construction - 2023Unmitigated Construction On-Site
ROG NOx CO
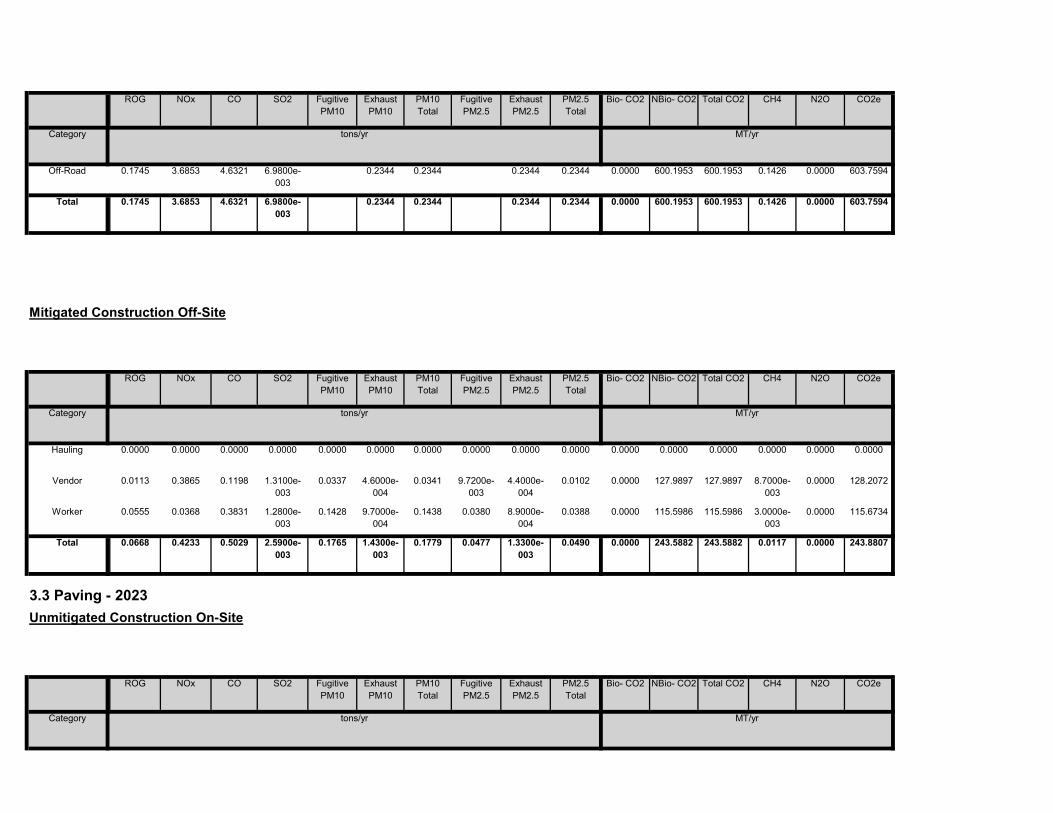
Total CO2 CH4 N2O CO2e
Category tons/yr MT/yr
PM10 Total
Fugitive PM2.5
Exhaust PM2.5
PM2.5 Total
Bio- CO2 NBio- CO2
3.3 Paving - 2023Unmitigated Construction On-Site
ROG NOx CO SO2 Fugitive PM10
Exhaust PM10
0.0000 243.5882 243.5882 0.0117 0.0000 243.88070.1765 1.4300e-003
0.1779 0.0477 1.3300e-003
0.0490Total 0.0668 0.4233 0.5029 2.5900e-003
0.0000 115.5986 115.5986 3.0000e-003
0.0000 115.67340.1428 9.7000e-004
0.1438 0.0380 8.9000e-004
0.0388Worker 0.0555 0.0368 0.3831 1.2800e-003
0.0000 127.9897 127.9897 8.7000e-003
0.0000 128.20720.0337 4.6000e-004
0.0341 9.7200e-003
4.4000e-004
0.0102Vendor 0.0113 0.3865 0.1198 1.3100e-003
0.0000 0.0000 0.0000 0.0000 0.0000 0.00000.0000 0.0000 0.0000 0.0000 0.0000 0.0000Hauling 0.0000 0.0000 0.0000 0.0000
Total CO2 CH4 N2O CO2e
Category tons/yr MT/yr
PM10 Total
Fugitive PM2.5
Exhaust PM2.5
PM2.5 Total
Bio- CO2 NBio- CO2
Mitigated Construction Off-Site
ROG NOx CO SO2 Fugitive PM10
Exhaust PM10
0.0000 600.1953 600.1953 0.1426 0.0000 603.75940.2344 0.2344 0.2344 0.2344Total 0.1745 3.6853 4.6321 6.9800e-003
0.0000 600.1953 600.1953 0.1426 0.0000 603.75940.2344 0.2344 0.2344 0.2344Off-Road 0.1745 3.6853 4.6321 6.9800e-003
Total CO2 CH4 N2O CO2e
Category tons/yr MT/yr
PM10 Total
Fugitive PM2.5
Exhaust PM2.5
PM2.5 Total
Bio- CO2 NBio- CO2ROG NOx CO SO2 Fugitive PM10
Exhaust PM10

0.0000 337.8569 337.8569 0.1067 0.0000 340.52320.1094 0.1094 0.1094 0.1094Total 0.0911 1.8893 2.8095 3.9000e-003
0.0000 0.0000 0.0000 0.0000 0.0000 0.00000.0000 0.0000 0.0000 0.0000Paving 0.0000
0.0000 337.8569 337.8569 0.1067 0.0000 340.52320.1094 0.1094 0.1094 0.1094Off-Road 0.0911 1.8893 2.8095 3.9000e-003
Total CO2 CH4 N2O CO2e
Category tons/yr MT/yr
PM10 Total
Fugitive PM2.5
Exhaust PM2.5
PM2.5 Total
Bio- CO2 NBio- CO2
Mitigated Construction On-Site
ROG NOx CO SO2 Fugitive PM10
Exhaust PM10
0.0000 21.0946 21.0946 5.5000e-004
0.0000 21.10830.0261 1.8000e-004
0.0262 6.9300e-003
1.6000e-004
7.0900e-003
Total 0.0101 6.7100e-003
0.0699 2.3000e-004
0.0000 21.0946 21.0946 5.5000e-004
0.0000 21.10830.0261 1.8000e-004
0.0262 6.9300e-003
1.6000e-004
7.0900e-003
Worker 0.0101 6.7100e-003
0.0699 2.3000e-004
0.0000 0.0000 0.0000 0.0000 0.0000 0.00000.0000 0.0000 0.0000 0.0000 0.0000 0.0000Vendor 0.0000 0.0000 0.0000 0.0000
0.0000 0.0000 0.0000 0.0000 0.0000 0.00000.0000 0.0000 0.0000 0.0000 0.0000 0.0000Hauling 0.0000 0.0000 0.0000 0.0000
Total CO2 CH4 N2O CO2e
Category tons/yr MT/yr
PM10 Total
Fugitive PM2.5
Exhaust PM2.5
PM2.5 Total
Bio- CO2 NBio- CO2
Unmitigated Construction Off-Site
ROG NOx CO SO2 Fugitive PM10
Exhaust PM10
0.0000 337.8573 337.8573 0.1067 0.0000 340.52360.0886 0.0886 0.0818 0.0818Total 0.1863 1.7948 2.5174 3.9000e-003
0.0000 0.0000 0.0000 0.0000 0.0000 0.00000.0000 0.0000 0.0000 0.0000Paving 0.0000
0.0000 337.8573 337.8573 0.1067 0.0000 340.52360.0886 0.0886 0.0818 0.0818Off-Road 0.1863 1.7948 2.5174 3.9000e-003

Total CO2 CH4 N2O CO2ePM10 Total
Fugitive PM2.5
Exhaust PM2.5
PM2.5 Total
Bio- CO2 NBio- CO2
Unmitigated Construction Off-Site
ROG NOx CO SO2 Fugitive PM10
Exhaust PM10
0.0000 66.3846 66.3846 3.9700e-003
0.0000 66.48390.0184 0.0184 0.0184 0.0184Total 1.8379 0.3388 0.4709 7.7000e-004
0.0000 66.3846 66.3846 3.9700e-003
0.0000 66.48390.0184 0.0184 0.0184 0.0184Off-Road 0.0498 0.3388 0.4709 7.7000e-004
0.0000 0.0000 0.0000 0.0000 0.0000 0.00000.0000 0.0000 0.0000 0.0000Archit. Coating 1.7881
Total CO2 CH4 N2O CO2e
Category tons/yr MT/yr
PM10 Total
Fugitive PM2.5
Exhaust PM2.5
PM2.5 Total
Bio- CO2 NBio- CO2
3.4 Architectural Coating - 2023Unmitigated Construction On-Site
ROG NOx CO SO2 Fugitive PM10
Exhaust PM10
0.0000 21.0946 21.0946 5.5000e-004
0.0000 21.10830.0261 1.8000e-004
0.0262 6.9300e-003
1.6000e-004
7.0900e-003
Total 0.0101 6.7100e-003
0.0699 2.3000e-004
0.0000 21.0946 21.0946 5.5000e-004
0.0000 21.10830.0261 1.8000e-004
0.0262 6.9300e-003
1.6000e-004
7.0900e-003
Worker 0.0101 6.7100e-003
0.0699 2.3000e-004
0.0000 0.0000 0.0000 0.0000 0.0000 0.00000.0000 0.0000 0.0000 0.0000 0.0000 0.0000Vendor 0.0000 0.0000 0.0000 0.0000
0.0000 0.0000 0.0000 0.0000 0.0000 0.00000.0000 0.0000 0.0000 0.0000 0.0000 0.0000Hauling 0.0000 0.0000 0.0000 0.0000
Total CO2 CH4 N2O CO2e
Category tons/yr MT/yr
PM10 Total
Fugitive PM2.5
Exhaust PM2.5
PM2.5 Total
Bio- CO2 NBio- CO2
Mitigated Construction Off-Site
ROG NOx CO SO2 Fugitive PM10
Exhaust PM10

0.0000 22.7822 22.7822 5.9000e-004
0.0000 22.79700.0282 1.9000e-004
0.0283 7.4800e-003
1.8000e-004
7.6600e-003
Worker 0.0109 7.2500e-003
0.0755 2.5000e-004
0.0000 0.0000 0.0000 0.0000 0.0000 0.00000.0000 0.0000 0.0000 0.0000 0.0000 0.0000Vendor 0.0000 0.0000 0.0000 0.0000
0.0000 0.0000 0.0000 0.0000 0.0000 0.00000.0000 0.0000 0.0000 0.0000 0.0000 0.0000Hauling 0.0000 0.0000 0.0000 0.0000
Total CO2 CH4 N2O CO2e
Category tons/yr MT/yr
PM10 Total
Fugitive PM2.5
Exhaust PM2.5
PM2.5 Total
Bio- CO2 NBio- CO2
Mitigated Construction Off-Site
ROG NOx CO SO2 Fugitive PM10
Exhaust PM10
0.0000 66.3845 66.3845 3.9700e-003
0.0000 66.48380.0247 0.0247 0.0247 0.0247Total 1.8036 0.3528 0.4764 7.7000e-004
0.0000 66.3845 66.3845 3.9700e-003
0.0000 66.48380.0247 0.0247 0.0247 0.0247Off-Road 0.0155 0.3528 0.4764 7.7000e-004
0.0000 0.0000 0.0000 0.0000 0.0000 0.00000.0000 0.0000 0.0000 0.0000Archit. Coating 1.7881
Total CO2 CH4 N2O CO2e
Category tons/yr MT/yr
PM10 Total
Fugitive PM2.5
Exhaust PM2.5
PM2.5 Total
Bio- CO2 NBio- CO2
Mitigated Construction On-Site
ROG NOx CO SO2 Fugitive PM10
Exhaust PM10
0.0000 22.7822 22.7822 5.9000e-004
0.0000 22.79700.0282 1.9000e-004
0.0283 7.4800e-003
1.8000e-004
7.6600e-003
Total 0.0109 7.2500e-003
0.0755 2.5000e-004
0.0000 22.7822 22.7822 5.9000e-004
0.0000 22.79700.0282 1.9000e-004
0.0283 7.4800e-003
1.8000e-004
7.6600e-003
Worker 0.0109 7.2500e-003
0.0755 2.5000e-004
0.0000 0.0000 0.0000 0.0000 0.0000 0.00000.0000 0.0000 0.0000 0.0000 0.0000 0.0000Vendor 0.0000 0.0000 0.0000 0.0000
0.0000 0.0000 0.0000 0.0000 0.0000 0.00000.0000 0.0000 0.0000 0.0000 0.0000 0.0000Hauling 0.0000 0.0000 0.0000 0.0000
Category tons/yr MT/yr

64.40 19.00 45 40 15
28.00 13.00 79 19 2
Strip Mall 9.50 7.30 7.30 16.60
18.80 39.60 86 11 3
Industrial Park 9.50 7.30 7.30 59.00
H-S or C-C H-O or C-NW Primary Diverted Pass-by
Condo/Townhouse 10.80 7.30 7.50 41.60
4.3 Trip Type Information
Miles Trip % Trip Purpose %
Land Use H-W or C-W H-S or C-C H-O or C-NW H-W or C-W
Total 4,691.11 4,084.24 2,147.35 7,826,916 7,826,916Strip Mall 3,456.96 3,279.12 1593.54 4,874,746 4,874,746
Industrial Park 653.15 238.12 69.81 1,338,516 1,338,516
Annual VMT
Condo/Townhouse 581.00 567.00 484.00 1,613,654 1,613,654
4.2 Trip Summary Information
Average Daily Trip Rate Unmitigated MitigatedLand Use Weekday Saturday Sunday Annual VMT
0.0000 3,059.2280
3,059.2280 0.1633 0.0000 3,063.3107
2.9494 0.0263 2.9757 0.7898 0.0245 0.8143Unmitigated 0.9486 3.6172 9.9001 0.0331
0.0000 3,059.2280
3,059.2280 0.1633 0.0000 3,063.3107
2.9494 0.0263 2.9757 0.7898 0.0245 0.8143Mitigated 0.9486 3.6172 9.9001 0.0331
NBio- CO2 Total CO2 CH4 N2O CO2e
Category tons/yr MT/yr
Exhaust PM10
PM10 Total
Fugitive PM2.5
Exhaust PM2.5
PM2.5 Total
Bio- CO2
4.0 Operational Detail - Mobile
4.1 Mitigation Measures Mobile
ROG NOx CO SO2 Fugitive PM10
0.0000 22.7822 22.7822 5.9000e-004
0.0000 22.79700.0282 1.9000e-004
0.0283 7.4800e-003
1.8000e-004
7.6600e-003
Total 0.0109 7.2500e-003
0.0755 2.5000e-004

NBio- CO2 Total CO2 CH4 N2O CO2e
Land Use kBTU/yr tons/yr MT/yr
Exhaust PM10
PM10 Total
Fugitive PM2.5
Exhaust PM2.5
PM2.5 Total
Bio- CO2
5.2 Energy by Land Use - NaturalGasUnmitigated
NaturalGas Use
ROG NOx CO SO2 Fugitive PM10
0.0000 203.9853 203.9853 3.9100e-003
3.7400e-003
205.19750.0142 0.0142 0.0142 0.0142NaturalGas Unmitigated
0.0206 0.1824 0.1205 1.1200e-003
0.0000 203.9853 203.9853 3.9100e-003
3.7400e-003
205.19750.0142 0.0142 0.0142 0.0142NaturalGas Mitigated
0.0206 0.1824 0.1205 1.1200e-003
0.0000 934.0266 934.0266 0.0376 7.7800e-003
937.28440.0000 0.0000 0.0000 0.0000Electricity Unmitigated
0.0000 934.0266 934.0266 0.0376 7.7800e-003
937.28440.0000 0.0000 0.0000 0.0000Electricity Mitigated
NBio- CO2 Total CO2 CH4 N2O CO2e
Category tons/yr MT/yr
Exhaust PM10
PM10 Total
Fugitive PM2.5
Exhaust PM2.5
PM2.5 Total
Bio- CO2
5.0 Energy Detail
Historical Energy Use: N
5.1 Mitigation Measures Energy
ROG NOx CO SO2 Fugitive PM10
0.024350 0.001934 0.001888 0.005938 0.000757 0.001056
0.000757 0.001056
Strip Mall 0.602700 0.040134 0.179939 0.104242 0.014985 0.005435 0.016642
0.005435 0.016642 0.024350 0.001934 0.001888 0.005938Condo/Townhouse 0.602700 0.040134 0.179939 0.104242 0.014985
0.024350 0.001934 0.001888 0.005938 0.000757 0.001056
SBUS MH
Industrial Park 0.602700 0.040134 0.179939 0.104242 0.014985 0.005435 0.016642
LHD2 MHD HHD OBUS UBUS MCYLand Use LDA LDT1 LDT2 MDV LHD1
4.4 Fleet Mix

329.7261Strip Mall 1.00542e+006
328.5801 0.0132 2.7400e-003
176.0435
Industrial Park 1.3158e+006
430.0150 0.0173 3.5800e-003
431.5148
Land Use kWh/yr ton
MT/yr
Condo/Townhouse 536802 175.4316 7.0600e-003
1.4600e-003
Unmitigated
Electricity Use
Total CO2 CH4 N2O CO2e
203.9853 203.9853 3.9100e-003
3.7400e-003
205.1975
5.3 Energy by Land Use - Electricity
0.0142 0.0142 0.0142 0.0142 0.0000
1.7000e-004
9.3791
Total 0.0206 0.1824 0.1205 1.1200e-003
6.5000e-004
6.5000e-004
0.0000 9.3237 9.3237 1.8000e-004
7.1900e-003
5.0000e-005
6.5000e-004
6.5000e-004
103.4361 103.4361 1.9800e-003
1.9000e-003
104.0507
Strip Mall 174720 9.4000e-004
8.5600e-003
7.2200e-003
7.2200e-003
7.2200e-003
7.2200e-003
0.0000
1.6700e-003
91.7676
Industrial Park 1.93832e+006
0.0105 0.0950 0.0798 5.7000e-004
6.3700e-003
6.3700e-003
0.0000 91.2255 91.2255 1.7500e-003
0.0335 5.0000e-004
6.3700e-003
6.3700e-003
CO2e
Land Use kBTU/yr tons/yr MT/yr
Condo/Townhouse 1.7095e+006
9.2200e-003
0.0788
PM2.5 Total
Bio- CO2 NBio- CO2 Total CO2 CH4 N2OSO2 Fugitive PM10
Exhaust PM10
PM10 Total
Fugitive PM2.5
Exhaust PM2.5
NaturalGas Use
ROG NOx CO
203.9853 3.9100e-003
3.7400e-003
205.1975
Mitigated
0.0142 0.0142 0.0142 0.0000 203.9853
9.3791
Total 0.0206 0.1824 0.1205 1.1200e-003
0.0142
6.5000e-004
0.0000 9.3237 9.3237 1.8000e-004
1.7000e-004
5.0000e-005
6.5000e-004
6.5000e-004
6.5000e-004
103.4361 1.9800e-003
1.9000e-003
104.0507
Strip Mall 174720 9.4000e-004
8.5600e-003
7.1900e-003
7.2200e-003
7.2200e-003
7.2200e-003
0.0000 103.4361
91.7676
Industrial Park 1.93832e+006
0.0105 0.0950 0.0798 5.7000e-004
7.2200e-003
6.3700e-003
0.0000 91.2255 91.2255 1.7500e-003
1.6700e-003
5.0000e-004
6.3700e-003
6.3700e-003
6.3700e-003
Condo/Townhouse 1.7095e+006
9.2200e-003
0.0788 0.0335

103.2958 44.5367 147.8325 0.0965 8.1200e-003
152.66621.0901 1.0901 1.0901 1.0901Unmitigated 7.3658 0.1311 8.4896 0.0141
103.2958 44.5367 147.8325 0.0965 8.1200e-003
152.66621.0901 1.0901 1.0901 1.0901Mitigated 7.3658 0.1311 8.4896 0.0141
NBio- CO2 Total CO2 CH4 N2O CO2e
Category tons/yr MT/yr
Exhaust PM10
PM10 Total
Fugitive PM2.5
Exhaust PM2.5
PM2.5 Total
Bio- CO2
6.0 Area Detail
6.1 Mitigation Measures Area
ROG NOx CO SO2 Fugitive PM10
329.7261
Total 934.0267 0.0376 7.7800e-003
937.2845
Strip Mall 1.00542e+006
328.5801 0.0132 2.7400e-003
176.0435
Industrial Park 1.3158e+006
430.0150 0.0173 3.5800e-003
431.5148
Land Use kWh/yr ton
MT/yr
Condo/Townhouse 536802 175.4316 7.0600e-003
1.4600e-003
Mitigated
Electricity Use
Total CO2 CH4 N2O CO2e
Total 934.0267 0.0376 7.7800e-003
937.2845

7.0 Water Detail
103.2958 44.5367 147.8325 0.0965 8.1200e-003
152.66621.0901 1.0901 1.0901 1.0901Total 7.3658 0.1311 8.4896 0.0141
0.0000 1.2160 1.2160 1.1700e-003
0.0000 1.24534.1200e-003
4.1200e-003
4.1200e-003
4.1200e-003
Landscaping 0.0225 8.5800e-003
0.7443 4.0000e-005
103.2958 43.3207 146.6165 0.0953 8.1200e-003
151.42091.0860 1.0860 1.0860 1.0860Hearth 6.2746 0.1225 7.7453 0.0140
0.0000 0.0000 0.0000 0.0000 0.0000 0.00000.0000 0.0000 0.0000 0.0000Consumer Products
1.0686
0.0000 0.0000 0.0000 0.0000 0.0000 0.00000.0000 0.0000 0.0000 0.0000Architectural Coating
0.0000
Total CO2 CH4 N2O CO2e
SubCategory tons/yr MT/yr
PM10 Total
Fugitive PM2.5
Exhaust PM2.5
PM2.5 Total
Bio- CO2 NBio- CO2
Mitigated
ROG NOx CO SO2 Fugitive PM10
Exhaust PM10
103.2958 44.5367 147.8325 0.0965 8.1200e-003
152.66621.0901 1.0901 1.0901 1.0901Total 7.3658 0.1311 8.4896 0.0141
0.0000 1.2160 1.2160 1.1700e-003
0.0000 1.24534.1200e-003
4.1200e-003
4.1200e-003
4.1200e-003
Landscaping 0.0225 8.5800e-003
0.7443 4.0000e-005
103.2958 43.3207 146.6165 0.0953 8.1200e-003
151.42091.0860 1.0860 1.0860 1.0860Hearth 6.2746 0.1225 7.7453 0.0140
0.0000 0.0000 0.0000 0.0000 0.0000 0.00000.0000 0.0000 0.0000 0.0000Consumer Products
1.0686
0.0000 0.0000 0.0000 0.0000 0.0000 0.00000.0000 0.0000 0.0000 0.0000Architectural Coating
0.0000
Total CO2 CH4 N2O CO2e
SubCategory tons/yr MT/yr
PM10 Total
Fugitive PM2.5
Exhaust PM2.5
PM2.5 Total
Bio- CO2 NBio- CO2
6.2 Area by SubCategoryUnmitigated
ROG NOx CO SO2 Fugitive PM10
Exhaust PM10

Mitigated
45.4384
Total 185.1040 1.1282 0.0279 221.6298
Strip Mall 5.77766 / 3.54114
39.2764 0.1898 4.7600e-003
51.6566
Industrial Park 22.1144 / 0 101.1212 0.7244 0.0178 124.5348
Land Use Mgal ton
MT/yr
Condo/Townhouse 6.5154 / 4.10754
44.7064 0.2140 5.3700e-003
7.2 Water by Land UseUnmitigated
Indoor/Outdoor Use
Total CO2 CH4 N2O CO2e
Unmitigated 185.1040 1.1282 0.0279 221.6298
Category ton
MT/yr
Mitigated 185.1040 1.1282 0.0279 221.6298
7.1 Mitigation Measures Water
Total CO2 CH4 N2O CO2e

8.2 Waste by Land UseUnmitigated
Waste Disposed
Total CO2 CH4 N2O CO2e
Unmitigated 50.0332 2.9569 0.0000 123.9552
ton
MT/yr
Mitigated 50.0332 2.9569 0.0000 123.9552
8.0 Waste Detail
8.1 Mitigation Measures Waste
Category/Year
Total CO2 CH4 N2O CO2e
45.4384
Total 185.1040 1.1282 0.0279 221.6298
Strip Mall 5.77766 / 3.54114
39.2764 0.1898 4.7600e-003
51.6566
Industrial Park 22.1144 / 0 101.1212 0.7244 0.0178 124.5348
Land Use Mgal ton
MT/yr
Condo/Townhouse 6.5154 / 4.10754
44.7064 0.2140 5.3700e-003
Indoor/Outdoor Use
Total CO2 CH4 N2O CO2e

Fuel Type
Boilers
Load Factor Fuel Type
10.0 Stationary Equipment
Fire Pumps and Emergency Generators
Equipment Type Number Hours/Day Hours/Year Horse Power Load Factor
9.0 Operational Offroad
Equipment Type Number Hours/Day Days/Year Horse Power
41.1876
Total 50.0332 2.9569 0.0000 123.9552
Strip Mall 81.9 16.6250 0.9825 0.0000
23.1335
Industrial Park 118.58 24.0707 1.4225 0.0000 59.6341
Land Use tons ton
MT/yr
Condo/Townhouse 46 9.3376 0.5518 0.0000
Mitigated
Waste Disposed
Total CO2 CH4 N2O CO2e
41.1876
Total 50.0332 2.9569 0.0000 123.9552
Strip Mall 81.9 16.6250 0.9825 0.0000
23.1335
Industrial Park 118.58 24.0707 1.4225 0.0000 59.6341
Land Use tons ton
MT/yr
Condo/Townhouse 46 9.3376 0.5518 0.0000

User Defined Equipment
Equipment Type Number
11.0 Vegetation
Equipment Type Number Heat Input/Day Heat Input/Year Boiler Rating Fuel Type

tblAreaCoating Area_Nonresidential_Exterior 47813 0
tblAreaCoating Area_Nonresidential_Interior 143438 0
tblArchitecturalCoating EF_Residential_Interior 250.00 50.00
tblAreaCoating Area_EF_Parking 250 0
tblArchitecturalCoating EF_Parking 250.00 100.00
tblArchitecturalCoating EF_Residential_Exterior 250.00 100.00
tblArchitecturalCoating EF_Nonresidential_Exterior 250.00 100.00
tblArchitecturalCoating EF_Nonresidential_Interior 250.00 50.00
1.3 User Entered Comments & Non-Default Data
Architectural Coating - Rule 67.0.1 coatings
Table Name Column Name Default Value New Value
CO2 Intensity (lb/MWhr)
720.49 CH4 Intensity (lb/MWhr)
0.029 N2O Intensity (lb/MWhr)
0.006
40
Climate Zone 13 Operational Year 2024
Utility Company San Diego Gas & Electric
1.2 Other Project Characteristics
Urbanization Urban Wind Speed (m/s) 2.6 Precipitation Freq (Days)
Floor Surface Area Population
Industrial Park 95.63 1000sqft 4.00 95,625.00 0
1.0 Project Characteristics
1.1 Land Usage
Land Uses Size Metric Lot Acreage
CalEEMod Version: CalEEMod.2016.3.1 Page 1 of 1 Date: 10/24/2016 3:20 PM
East Otay Mesa Specific Plan Amendment Construction Phase 7 - San Diego Air Basin, Annual
East Otay Mesa Specific Plan Amendment Construction Phase 7San Diego Air Basin, Annual
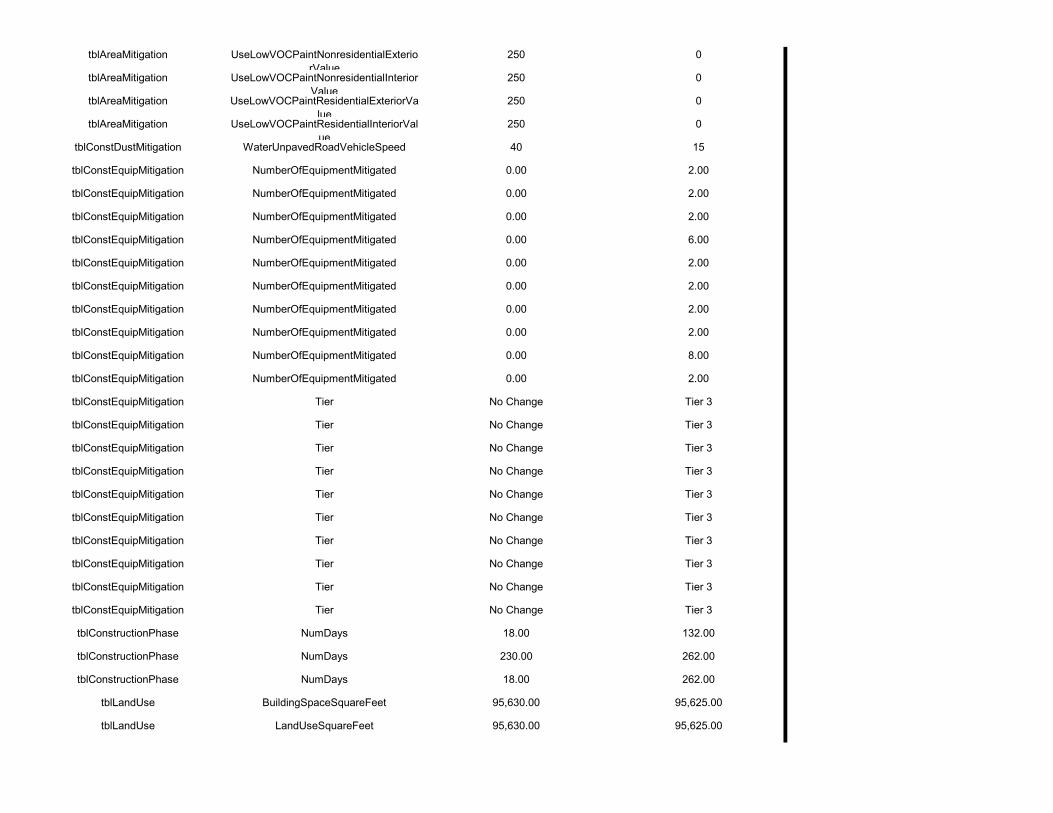
tblLandUse BuildingSpaceSquareFeet 95,630.00 95,625.00
tblLandUse LandUseSquareFeet 95,630.00 95,625.00
tblConstructionPhase NumDays 230.00 262.00
tblConstructionPhase NumDays 18.00 262.00
tblConstEquipMitigation Tier No Change Tier 3
tblConstructionPhase NumDays 18.00 132.00
tblConstEquipMitigation Tier No Change Tier 3
tblConstEquipMitigation Tier No Change Tier 3
tblConstEquipMitigation Tier No Change Tier 3
tblConstEquipMitigation Tier No Change Tier 3
tblConstEquipMitigation Tier No Change Tier 3
tblConstEquipMitigation Tier No Change Tier 3
tblConstEquipMitigation Tier No Change Tier 3
tblConstEquipMitigation Tier No Change Tier 3
tblConstEquipMitigation NumberOfEquipmentMitigated 0.00 2.00
tblConstEquipMitigation Tier No Change Tier 3
tblConstEquipMitigation NumberOfEquipmentMitigated 0.00 2.00
tblConstEquipMitigation NumberOfEquipmentMitigated 0.00 8.00
tblConstEquipMitigation NumberOfEquipmentMitigated 0.00 2.00
tblConstEquipMitigation NumberOfEquipmentMitigated 0.00 2.00
tblConstEquipMitigation NumberOfEquipmentMitigated 0.00 6.00
tblConstEquipMitigation NumberOfEquipmentMitigated 0.00 2.00
tblConstEquipMitigation NumberOfEquipmentMitigated 0.00 2.00
tblConstEquipMitigation NumberOfEquipmentMitigated 0.00 2.00
tblConstDustMitigation WaterUnpavedRoadVehicleSpeed 40 15
tblConstEquipMitigation NumberOfEquipmentMitigated 0.00 2.00
tblAreaMitigation UseLowVOCPaintResidentialExteriorValue
250 0
tblAreaMitigation UseLowVOCPaintResidentialInteriorValue
250 0
tblAreaMitigation UseLowVOCPaintNonresidentialExteriorValue
250 0
tblAreaMitigation UseLowVOCPaintNonresidentialInteriorValue
250 0
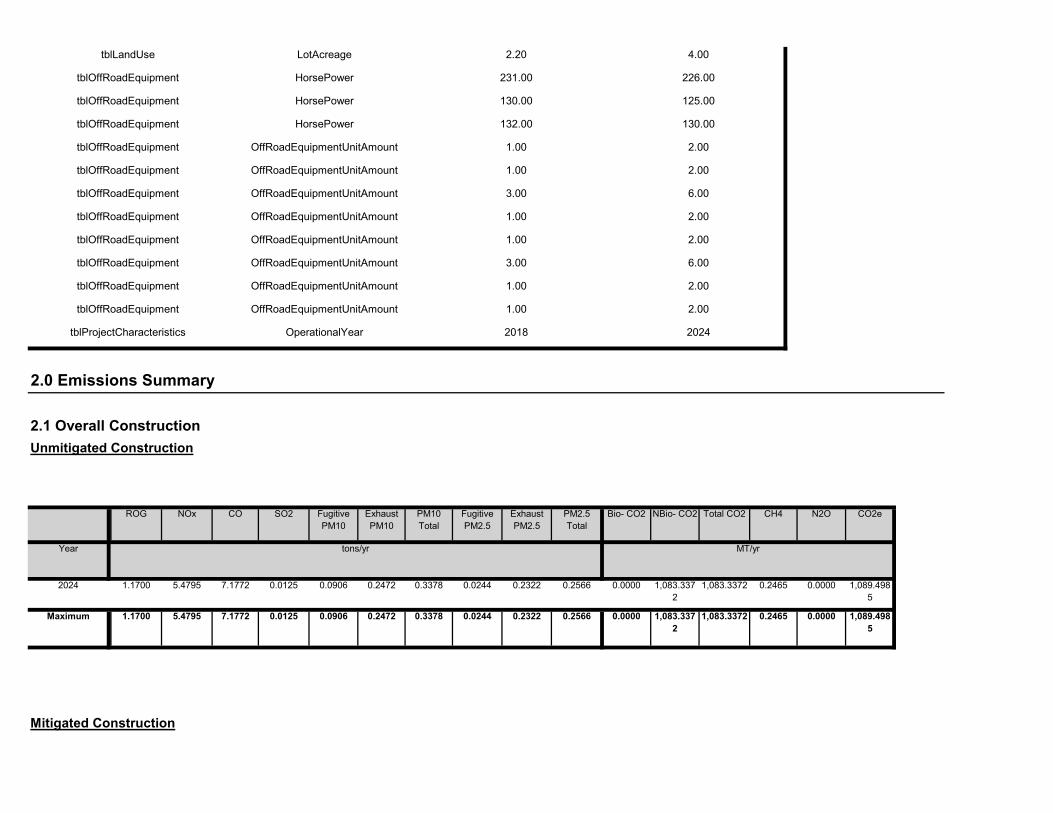
Mitigated Construction
0.0000 1,083.3372
1,083.3372 0.2465 0.0000 1,089.4985
0.0906 0.2472 0.3378 0.0244 0.2322 0.2566Maximum 1.1700 5.4795 7.1772 0.0125
0.0000 1,083.3372
1,083.3372 0.2465 0.0000 1,089.4985
0.0906 0.2472 0.3378 0.0244 0.2322 0.25662024 1.1700 5.4795 7.1772 0.0125
CH4 N2O CO2e
Year tons/yr MT/yr
Fugitive PM2.5
Exhaust PM2.5
PM2.5 Total
Bio- CO2 NBio- CO2 Total CO2
Unmitigated Construction
ROG NOx CO SO2 Fugitive PM10
Exhaust PM10
PM10 Total
tblProjectCharacteristics OperationalYear 2018 2024
2.0 Emissions Summary
2.1 Overall Construction
tblOffRoadEquipment OffRoadEquipmentUnitAmount 1.00 2.00
tblOffRoadEquipment OffRoadEquipmentUnitAmount 1.00 2.00
tblOffRoadEquipment OffRoadEquipmentUnitAmount 1.00 2.00
tblOffRoadEquipment OffRoadEquipmentUnitAmount 3.00 6.00
tblOffRoadEquipment OffRoadEquipmentUnitAmount 3.00 6.00
tblOffRoadEquipment OffRoadEquipmentUnitAmount 1.00 2.00
tblOffRoadEquipment OffRoadEquipmentUnitAmount 1.00 2.00
tblOffRoadEquipment OffRoadEquipmentUnitAmount 1.00 2.00
tblOffRoadEquipment HorsePower 130.00 125.00
tblOffRoadEquipment HorsePower 132.00 130.00
tblLandUse LotAcreage 2.20 4.00
tblOffRoadEquipment HorsePower 231.00 226.00

0.0000 492.6979 492.6979 0.0246 0.0000 493.31370.5043 4.1600e-003
0.5085 0.1350 3.8700e-003
0.1389Mobile 0.1227 0.4958 1.4505 5.3300e-003
0.0000 533.4511 533.4511 0.0193 5.4800e-003
535.56567.2200e-003
7.2200e-003
7.2200e-003
7.2200e-003
Energy 0.0105 0.0950 0.0798 5.7000e-004
0.0000 1.7100e-003
1.7100e-003
0.0000 0.0000 1.8200e-003
0.0000 0.0000 0.0000 0.0000Area 0.3735 1.0000e-005
8.8000e-004
0.0000
Total CO2 CH4 N2O CO2e
Category tons/yr MT/yr
PM10 Total
Fugitive PM2.5
Exhaust PM2.5
PM2.5 Total
Bio- CO2 NBio- CO2
2.2 Overall OperationalUnmitigated Operational
ROG NOx CO SO2 Fugitive PM10
Exhaust PM10
32 7-24-2024 9-30-2024 1.2322 1.2568
Highest 1.6489 1.6819
30 1-24-2024 4-23-2024 1.6318 1.6644
31 4-24-2024 7-23-2024 1.6489 1.6819
Quarter Start Date End Date Maximum Unmitigated ROG + NOX (tons/quarter) Maximum Mitigated ROG + NOX (tons/quarter)
29 10-24-2023 1-23-2024 0.4171 0.4254
0.00 0.00 0.00 0.00 0.00 0.000.00 -45.34 -33.18 0.00 -54.67 -49.47
NBio-CO2 Total CO2 CH4 N20 CO2e
Percent Reduction
26.90 -8.17 -9.92 0.00
Exhaust PM10
PM10 Total
Fugitive PM2.5
Exhaust PM2.5
PM2.5 Total
Bio- CO2ROG NOx CO SO2 Fugitive PM10
0.0000 1,083.3360
1,083.3360 0.2465 0.0000 1,089.4974
0.0906 0.3592 0.4498 0.0244 0.3592 0.3836Maximum 0.8552 5.9270 7.8890 0.0125
0.0000 1,083.3360
1,083.3360 0.2465 0.0000 1,089.4974
0.0906 0.3592 0.4498 0.0244 0.3592 0.38362024 0.8552 5.9270 7.8890 0.0125
Total CO2 CH4 N2O CO2e
Year tons/yr MT/yr
PM10 Total
Fugitive PM2.5
Exhaust PM2.5
PM2.5 Total
Bio- CO2 NBio- CO2ROG NOx CO SO2 Fugitive PM10
Exhaust PM10

262
2 Paving Paving 1/1/2024 12/31/2024 5 262
End Date Num Days Week
Num Days Phase Description
1 Building Construction Building Construction 1/1/2024 12/31/2024 5
3.0 Construction Detail
Construction Phase
Phase Number
Phase Name Phase Type Start Date
0.00 0.00 0.00 0.00 0.00 0.000.00 0.00 0.00 0.00 0.00 0.00
NBio-CO2 Total CO2 CH4 N20 CO2e
Percent Reduction
0.00 0.00 0.00 0.00
Exhaust PM10
PM10 Total
Fugitive PM2.5
Exhaust PM2.5
PM2.5 Total
Bio- CO2ROG NOx CO SO2 Fugitive PM10
31.0866 1,120.2559
1,151.3425 2.1909 0.0233 1,213.0499
0.5043 0.0114 0.5157 0.1350 0.0111 0.1461Total 0.5067 0.5908 1.5312 5.9000e-003
7.0159 94.1053 101.1212 0.7244 0.0178 124.53480.0000 0.0000 0.0000 0.0000Water
24.0707 0.0000 24.0707 1.4225 0.0000 59.63410.0000 0.0000 0.0000 0.0000Waste
0.0000 492.6979 492.6979 0.0246 0.0000 493.31370.5043 4.1600e-003
0.5085 0.1350 3.8700e-003
0.1389Mobile 0.1227 0.4958 1.4505 5.3300e-003
0.0000 533.4511 533.4511 0.0193 5.4800e-003
535.56567.2200e-003
7.2200e-003
7.2200e-003
7.2200e-003
Energy 0.0105 0.0950 0.0798 5.7000e-004
0.0000 1.7100e-003
1.7100e-003
0.0000 0.0000 1.8200e-003
0.0000 0.0000 0.0000 0.0000Area 0.3735 1.0000e-005
8.8000e-004
0.0000
Total CO2 CH4 N2O CO2e
Category tons/yr MT/yr
PM10 Total
Fugitive PM2.5
Exhaust PM2.5
PM2.5 Total
Bio- CO2 NBio- CO2
Mitigated Operational
ROG NOx CO SO2 Fugitive PM10
Exhaust PM10
31.0866 1,120.2559
1,151.3425 2.1909 0.0233 1,213.0499
0.5043 0.0114 0.5157 0.1350 0.0111 0.1461Total 0.5067 0.5908 1.5312 5.9000e-003
7.0159 94.1053 101.1212 0.7244 0.0178 124.53480.0000 0.0000 0.0000 0.0000Water
24.0707 0.0000 24.0707 1.4225 0.0000 59.63410.0000 0.0000 0.0000 0.0000Waste

Use Cleaner Engines for Construction Equipment
7.30 20.00 LD_Mix HDT_Mix HHDT
3.1 Mitigation Measures Construction
Architectural Coating 2 8.00 0.00 0.00 10.80
10.80 7.30 20.00 LD_Mix HDT_Mix HHDT
7.30 20.00 LD_Mix HDT_Mix HHDT
Paving 10 25.00 0.00 0.00
Building Construction 18 40.00 16.00 0.00 10.80
Worker Trip Length
Vendor Trip Length
Hauling Trip Length
Worker Vehicle Class
Vendor Vehicle Class
Hauling Vehicle Class
Trips and VMT
Phase Name Offroad Equipment Count
Worker Trip Number
Vendor Trip Number
Hauling Trip Number
Architectural Coating Air Compressors 2 6.00 78 0.48
Paving Tractors/Loaders/Backhoes 2 8.00 97 0.37
Paving Rollers 2 6.00 80 0.38
Paving Paving Equipment 2 6.00 130 0.36
Paving Pavers 2 8.00 125 0.42
Paving Cement and Mortar Mixers 2 6.00 9 0.56
Building Construction Welders 2 8.00 46 0.45
Building Construction Tractors/Loaders/Backhoes 6 7.00 97 0.37
Building Construction Generator Sets 2 8.00 84 0.74
Building Construction Forklifts 6 8.00 89 0.20
Load Factor
Building Construction Cranes 2 7.00 226 0.29
OffRoad Equipment
Phase Name Offroad Equipment Type Amount Usage Hours Horse Power
132
Acres of Grading (Site Preparation Phase): 0
Acres of Grading (Grading Phase): 0
Acres of Paving: 0
Residential Indoor: 0; Residential Outdoor: 0; Non-Residential Indoor: 143,438; Non-Residential Outdoor: 47,813; Striped Parking Area:
3 Architectural Coating Architectural Coating 1/1/2024 12/31/2024 5

Mitigated Construction On-Site
0.0000 85.2482 85.2482 4.3600e-003
0.0000 85.35730.0559 4.7000e-004
0.0564 0.0152 4.4000e-004
0.0156Total 0.0200 0.1675 0.1532 9.0000e-004
0.0000 32.6721 32.6721 8.1000e-004
0.0000 32.69230.0420 2.8000e-004
0.0423 0.0112 2.6000e-004
0.0114Worker 0.0155 9.9200e-003
0.1053 3.6000e-004
0.0000 52.5762 52.5762 3.5500e-003
0.0000 52.66500.0139 1.9000e-004
0.0141 4.0200e-003
1.8000e-004
4.1900e-003
Vendor 4.4900e-003
0.1576 0.0480 5.4000e-004
0.0000 0.0000 0.0000 0.0000 0.0000 0.00000.0000 0.0000 0.0000 0.0000 0.0000 0.0000Hauling 0.0000 0.0000 0.0000 0.0000
Total CO2 CH4 N2O CO2e
Category tons/yr MT/yr
PM10 Total
Fugitive PM2.5
Exhaust PM2.5
PM2.5 Total
Bio- CO2 NBio- CO2
Unmitigated Construction Off-Site
ROG NOx CO SO2 Fugitive PM10
Exhaust PM10
0.0000 604.9292 604.9292 0.1428 0.0000 608.49990.1600 0.1600 0.1505 0.1505Total 0.3839 3.5049 4.2269 7.0300e-003
0.0000 604.9292 604.9292 0.1428 0.0000 608.49990.1600 0.1600 0.1505 0.1505
CO2e
Category tons/yr MT/yr
Off-Road 0.3839 3.5049 4.2269 7.0300e-003
PM2.5 Total
Bio- CO2 NBio- CO2 Total CO2 CH4 N2OSO2 Fugitive PM10
Exhaust PM10
PM10 Total
Fugitive PM2.5
Exhaust PM2.5
Water Exposed Area
Reduce Vehicle Speed on Unpaved Roads
3.2 Building Construction - 2024Unmitigated Construction On-Site
ROG NOx CO

Total CO2 CH4 N2O CO2e
Category tons/yr MT/yr
PM10 Total
Fugitive PM2.5
Exhaust PM2.5
PM2.5 Total
Bio- CO2 NBio- CO2
3.3 Paving - 2024Unmitigated Construction On-Site
ROG NOx CO SO2 Fugitive PM10
Exhaust PM10
0.0000 85.2482 85.2482 4.3600e-003
0.0000 85.35730.0559 4.7000e-004
0.0564 0.0152 4.4000e-004
0.0156Total 0.0200 0.1675 0.1532 9.0000e-004
0.0000 32.6721 32.6721 8.1000e-004
0.0000 32.69230.0420 2.8000e-004
0.0423 0.0112 2.6000e-004
0.0114Worker 0.0155 9.9200e-003
0.1053 3.6000e-004
0.0000 52.5762 52.5762 3.5500e-003
0.0000 52.66500.0139 1.9000e-004
0.0141 4.0200e-003
1.8000e-004
4.1900e-003
Vendor 4.4900e-003
0.1576 0.0480 5.4000e-004
0.0000 0.0000 0.0000 0.0000 0.0000 0.00000.0000 0.0000 0.0000 0.0000 0.0000 0.0000Hauling 0.0000 0.0000 0.0000 0.0000
Total CO2 CH4 N2O CO2e
Category tons/yr MT/yr
PM10 Total
Fugitive PM2.5
Exhaust PM2.5
PM2.5 Total
Bio- CO2 NBio- CO2
Mitigated Construction Off-Site
ROG NOx CO SO2 Fugitive PM10
Exhaust PM10
0.0000 604.9284 604.9284 0.1428 0.0000 608.49920.2362 0.2362 0.2362 0.2362Total 0.1759 3.7136 4.6677 7.0300e-003
0.0000 604.9284 604.9284 0.1428 0.0000 608.49920.2362 0.2362 0.2362 0.2362Off-Road 0.1759 3.7136 4.6677 7.0300e-003
Total CO2 CH4 N2O CO2e
Category tons/yr MT/yr
PM10 Total
Fugitive PM2.5
Exhaust PM2.5
PM2.5 Total
Bio- CO2 NBio- CO2ROG NOx CO SO2 Fugitive PM10
Exhaust PM10

0.0000 299.3098 299.3098 0.0948 0.0000 301.68040.0974 0.0974 0.0974 0.0974Total 0.0811 1.6822 2.5012 3.4500e-003
0.0000 0.0000 0.0000 0.0000 0.0000 0.00000.0000 0.0000 0.0000 0.0000Paving 0.0000
0.0000 299.3098 299.3098 0.0948 0.0000 301.68040.0974 0.0974 0.0974 0.0974Off-Road 0.0811 1.6822 2.5012 3.4500e-003
Total CO2 CH4 N2O CO2e
Category tons/yr MT/yr
PM10 Total
Fugitive PM2.5
Exhaust PM2.5
PM2.5 Total
Bio- CO2 NBio- CO2
Mitigated Construction On-Site
ROG NOx CO SO2 Fugitive PM10
Exhaust PM10
0.0000 20.4200 20.4200 5.1000e-004
0.0000 20.43270.0263 1.7000e-004
0.0264 6.9800e-003
1.6000e-004
7.1400e-003
Total 9.7100e-003
6.2000e-003
0.0658 2.3000e-004
0.0000 20.4200 20.4200 5.1000e-004
0.0000 20.43270.0263 1.7000e-004
0.0264 6.9800e-003
1.6000e-004
7.1400e-003
Worker 9.7100e-003
6.2000e-003
0.0658 2.3000e-004
0.0000 0.0000 0.0000 0.0000 0.0000 0.00000.0000 0.0000 0.0000 0.0000 0.0000 0.0000Vendor 0.0000 0.0000 0.0000 0.0000
0.0000 0.0000 0.0000 0.0000 0.0000 0.00000.0000 0.0000 0.0000 0.0000 0.0000 0.0000Hauling 0.0000 0.0000 0.0000 0.0000
Total CO2 CH4 N2O CO2e
Category tons/yr MT/yr
PM10 Total
Fugitive PM2.5
Exhaust PM2.5
PM2.5 Total
Bio- CO2 NBio- CO2
Unmitigated Construction Off-Site
ROG NOx CO SO2 Fugitive PM10
Exhaust PM10
0.0000 299.3101 299.3101 0.0948 0.0000 301.68070.0706 0.0706 0.0651 0.0651Total 0.1560 1.4797 2.2360 3.4500e-003
0.0000 0.0000 0.0000 0.0000 0.0000 0.00000.0000 0.0000 0.0000 0.0000Paving 0.0000
0.0000 299.3101 299.3101 0.0948 0.0000 301.68070.0706 0.0706 0.0651 0.0651Off-Road 0.1560 1.4797 2.2360 3.4500e-003

Total CO2 CH4 N2O CO2ePM10 Total
Fugitive PM2.5
Exhaust PM2.5
PM2.5 Total
Bio- CO2 NBio- CO2
Unmitigated Construction Off-Site
ROG NOx CO SO2 Fugitive PM10
Exhaust PM10
0.0000 66.8953 66.8953 3.7700e-003
0.0000 66.98940.0160 0.0160 0.0160 0.0160Total 0.5972 0.3193 0.4743 7.8000e-004
0.0000 66.8953 66.8953 3.7700e-003
0.0000 66.98940.0160 0.0160 0.0160 0.0160Off-Road 0.0474 0.3193 0.4743 7.8000e-004
0.0000 0.0000 0.0000 0.0000 0.0000 0.00000.0000 0.0000 0.0000 0.0000Archit. Coating 0.5498
Total CO2 CH4 N2O CO2e
Category tons/yr MT/yr
PM10 Total
Fugitive PM2.5
Exhaust PM2.5
PM2.5 Total
Bio- CO2 NBio- CO2
3.4 Architectural Coating - 2024Unmitigated Construction On-Site
ROG NOx CO SO2 Fugitive PM10
Exhaust PM10
0.0000 20.4200 20.4200 5.1000e-004
0.0000 20.43270.0263 1.7000e-004
0.0264 6.9800e-003
1.6000e-004
7.1400e-003
Total 9.7100e-003
6.2000e-003
0.0658 2.3000e-004
0.0000 20.4200 20.4200 5.1000e-004
0.0000 20.43270.0263 1.7000e-004
0.0264 6.9800e-003
1.6000e-004
7.1400e-003
Worker 9.7100e-003
6.2000e-003
0.0658 2.3000e-004
0.0000 0.0000 0.0000 0.0000 0.0000 0.00000.0000 0.0000 0.0000 0.0000 0.0000 0.0000Vendor 0.0000 0.0000 0.0000 0.0000
0.0000 0.0000 0.0000 0.0000 0.0000 0.00000.0000 0.0000 0.0000 0.0000 0.0000 0.0000Hauling 0.0000 0.0000 0.0000 0.0000
Total CO2 CH4 N2O CO2e
Category tons/yr MT/yr
PM10 Total
Fugitive PM2.5
Exhaust PM2.5
PM2.5 Total
Bio- CO2 NBio- CO2
Mitigated Construction Off-Site
ROG NOx CO SO2 Fugitive PM10
Exhaust PM10

0.0000 6.5344 6.5344 1.6000e-004
0.0000 6.53858.4000e-003
6.0000e-005
8.4600e-003
2.2300e-003
5.0000e-005
2.2800e-003
Worker 3.1100e-003
1.9800e-003
0.0211 7.0000e-005
0.0000 0.0000 0.0000 0.0000 0.0000 0.00000.0000 0.0000 0.0000 0.0000 0.0000 0.0000Vendor 0.0000 0.0000 0.0000 0.0000
0.0000 0.0000 0.0000 0.0000 0.0000 0.00000.0000 0.0000 0.0000 0.0000 0.0000 0.0000Hauling 0.0000 0.0000 0.0000 0.0000
Total CO2 CH4 N2O CO2e
Category tons/yr MT/yr
PM10 Total
Fugitive PM2.5
Exhaust PM2.5
PM2.5 Total
Bio- CO2 NBio- CO2
Mitigated Construction Off-Site
ROG NOx CO SO2 Fugitive PM10
Exhaust PM10
0.0000 66.8952 66.8952 3.7700e-003
0.0000 66.98930.0249 0.0249 0.0249 0.0249Total 0.5654 0.3555 0.4801 7.8000e-004
0.0000 66.8952 66.8952 3.7700e-003
0.0000 66.98930.0249 0.0249 0.0249 0.0249Off-Road 0.0156 0.3555 0.4801 7.8000e-004
0.0000 0.0000 0.0000 0.0000 0.0000 0.00000.0000 0.0000 0.0000 0.0000Archit. Coating 0.5498
Total CO2 CH4 N2O CO2e
Category tons/yr MT/yr
PM10 Total
Fugitive PM2.5
Exhaust PM2.5
PM2.5 Total
Bio- CO2 NBio- CO2
Mitigated Construction On-Site
ROG NOx CO SO2 Fugitive PM10
Exhaust PM10
0.0000 6.5344 6.5344 1.6000e-004
0.0000 6.53858.4000e-003
6.0000e-005
8.4600e-003
2.2300e-003
5.0000e-005
2.2800e-003
Total 3.1100e-003
1.9800e-003
0.0211 7.0000e-005
0.0000 6.5344 6.5344 1.6000e-004
0.0000 6.53858.4000e-003
6.0000e-005
8.4600e-003
2.2300e-003
5.0000e-005
2.2800e-003
Worker 3.1100e-003
1.9800e-003
0.0211 7.0000e-005
0.0000 0.0000 0.0000 0.0000 0.0000 0.00000.0000 0.0000 0.0000 0.0000 0.0000 0.0000Vendor 0.0000 0.0000 0.0000 0.0000
0.0000 0.0000 0.0000 0.0000 0.0000 0.00000.0000 0.0000 0.0000 0.0000 0.0000 0.0000Hauling 0.0000 0.0000 0.0000 0.0000
Category tons/yr MT/yr

0.024508 0.001929 0.001857 0.005869 0.000761 0.000998
SBUS MH
Industrial Park 0.606234 0.039465 0.179154 0.102641 0.014368 0.005395 0.016820
LHD2 MHD HHD OBUS UBUS MCYLand Use LDA LDT1 LDT2 MDV LHD1
28.00 13.00 79 19 2
4.4 Fleet Mix
H-S or C-C H-O or C-NW Primary Diverted Pass-by
Industrial Park 9.50 7.30 7.30 59.00
4.3 Trip Type Information
Miles Trip % Trip Purpose %
Land Use H-W or C-W H-S or C-C H-O or C-NW H-W or C-W
Total 653.15 238.12 69.81 1,338,516 1,338,516
Annual VMT
Industrial Park 653.15 238.12 69.81 1,338,516 1,338,516
4.2 Trip Summary Information
Average Daily Trip Rate Unmitigated MitigatedLand Use Weekday Saturday Sunday Annual VMT
0.0000 492.6979 492.6979 0.0246 0.0000 493.31370.5043 4.1600e-003
0.5085 0.1350 3.8700e-003
0.1389Unmitigated 0.1227 0.4958 1.4505 5.3300e-003
0.0000 492.6979 492.6979 0.0246 0.0000 493.31370.5043 4.1600e-003
0.5085 0.1350 3.8700e-003
0.1389Mitigated 0.1227 0.4958 1.4505 5.3300e-003
NBio- CO2 Total CO2 CH4 N2O CO2e
Category tons/yr MT/yr
Exhaust PM10
PM10 Total
Fugitive PM2.5
Exhaust PM2.5
PM2.5 Total
Bio- CO2
4.0 Operational Detail - Mobile
4.1 Mitigation Measures Mobile
ROG NOx CO SO2 Fugitive PM10
0.0000 6.5344 6.5344 1.6000e-004
0.0000 6.53858.4000e-003
6.0000e-005
8.4600e-003
2.2300e-003
5.0000e-005
2.2800e-003
Total 3.1100e-003
1.9800e-003
0.0211 7.0000e-005

103.4361 1.9800e-003
1.9000e-003
104.05077.2200e-003
7.2200e-003
7.2200e-003
0.0000 103.4361
104.0507
Total 0.0105 0.0950 0.0798 5.7000e-004
7.2200e-003
7.2200e-003
0.0000 103.4361 103.4361 1.9800e-003
1.9000e-003
5.7000e-004
7.2200e-003
7.2200e-003
7.2200e-003
Industrial Park 1.93832e+006
0.0105 0.0950 0.0798
NBio- CO2 Total CO2 CH4 N2O CO2e
Land Use kBTU/yr tons/yr MT/yr
Exhaust PM10
PM10 Total
Fugitive PM2.5
Exhaust PM2.5
PM2.5 Total
Bio- CO2
5.2 Energy by Land Use - NaturalGasUnmitigated
NaturalGas Use
ROG NOx CO SO2 Fugitive PM10
0.0000 103.4361 103.4361 1.9800e-003
1.9000e-003
104.05077.2200e-003
7.2200e-003
7.2200e-003
7.2200e-003
NaturalGas Unmitigated
0.0105 0.0950 0.0798 5.7000e-004
0.0000 103.4361 103.4361 1.9800e-003
1.9000e-003
104.05077.2200e-003
7.2200e-003
7.2200e-003
7.2200e-003
NaturalGas Mitigated
0.0105 0.0950 0.0798 5.7000e-004
0.0000 430.0150 430.0150 0.0173 3.5800e-003
431.51480.0000 0.0000 0.0000 0.0000Electricity Unmitigated
0.0000 430.0150 430.0150 0.0173 3.5800e-003
431.51480.0000 0.0000 0.0000 0.0000Electricity Mitigated
NBio- CO2 Total CO2 CH4 N2O CO2e
Category tons/yr MT/yr
Exhaust PM10
PM10 Total
Fugitive PM2.5
Exhaust PM2.5
PM2.5 Total
Bio- CO2
5.0 Energy Detail
Historical Energy Use: N
5.1 Mitigation Measures Energy
ROG NOx CO SO2 Fugitive PM10

Mitigated
Electricity Use
Total CO2 CH4 N2O CO2e
431.5148
Total 430.0150 0.0173 3.5800e-003
431.5148
Land Use kWh/yr ton
MT/yr
Industrial Park 1.3158e+006
430.0150 0.0173 3.5800e-003
Unmitigated
Electricity Use
Total CO2 CH4 N2O CO2e
103.4361 103.4361 1.9800e-003
1.9000e-003
104.0507
5.3 Energy by Land Use - Electricity
7.2200e-003
7.2200e-003
7.2200e-003
7.2200e-003
0.0000
1.9000e-003
104.0507
Total 0.0105 0.0950 0.0798 5.7000e-004
7.2200e-003
7.2200e-003
0.0000 103.4361 103.4361 1.9800e-003
0.0798 5.7000e-004
7.2200e-003
7.2200e-003
CO2e
Land Use kBTU/yr tons/yr MT/yr
Industrial Park 1.93832e+006
0.0105 0.0950
PM2.5 Total
Bio- CO2 NBio- CO2 Total CO2 CH4 N2OSO2 Fugitive PM10
Exhaust PM10
PM10 Total
Fugitive PM2.5
Exhaust PM2.5
NaturalGas Use
ROG NOx CO
Mitigated
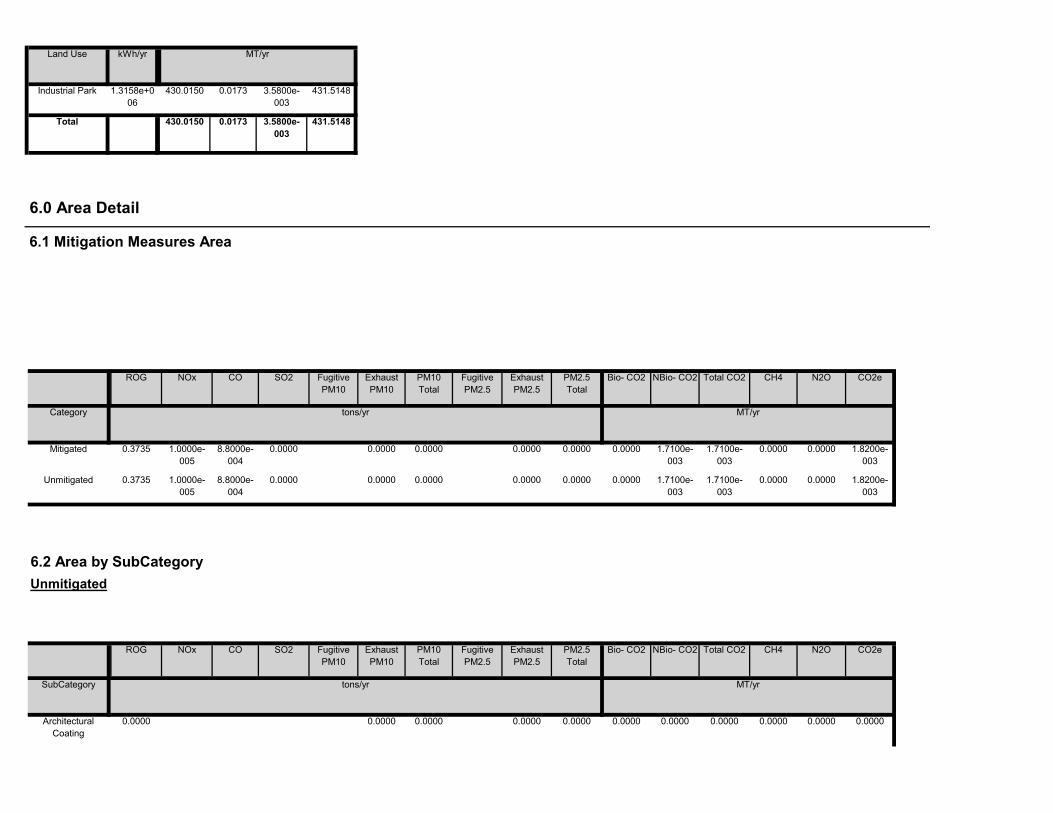
0.0000 0.0000 0.0000 0.0000 0.0000 0.00000.0000 0.0000 0.0000 0.0000Architectural Coating
0.0000
Total CO2 CH4 N2O CO2e
SubCategory tons/yr MT/yr
PM10 Total
Fugitive PM2.5
Exhaust PM2.5
PM2.5 Total
Bio- CO2 NBio- CO2
6.2 Area by SubCategoryUnmitigated
ROG NOx CO SO2 Fugitive PM10
Exhaust PM10
0.0000 1.7100e-003
1.7100e-003
0.0000 0.0000 1.8200e-003
0.0000 0.0000 0.0000 0.0000Unmitigated 0.3735 1.0000e-005
8.8000e-004
0.0000
0.0000 1.7100e-003
1.7100e-003
0.0000 0.0000 1.8200e-003
0.0000 0.0000 0.0000 0.0000Mitigated 0.3735 1.0000e-005
8.8000e-004
0.0000
NBio- CO2 Total CO2 CH4 N2O CO2e
Category tons/yr MT/yr
Exhaust PM10
PM10 Total
Fugitive PM2.5
Exhaust PM2.5
PM2.5 Total
Bio- CO2
6.0 Area Detail
6.1 Mitigation Measures Area
ROG NOx CO SO2 Fugitive PM10
431.5148
Total 430.0150 0.0173 3.5800e-003
431.5148
Land Use kWh/yr ton
MT/yr
Industrial Park 1.3158e+006
430.0150 0.0173 3.5800e-003

Unmitigated 101.1212 0.7244 0.0178 124.5348
Category ton
MT/yr
Mitigated 101.1212 0.7244 0.0178 124.5348
7.0 Water Detail
7.1 Mitigation Measures Water
Total CO2 CH4 N2O CO2e
0.0000 1.7100e-003
1.7100e-003
0.0000 0.0000 1.8200e-003
0.0000 0.0000 0.0000 0.0000Total 0.3735 1.0000e-005
8.8000e-004
0.0000
0.0000 1.7100e-003
1.7100e-003
0.0000 0.0000 1.8200e-003
0.0000 0.0000 0.0000 0.0000Landscaping 8.0000e-005
1.0000e-005
8.8000e-004
0.0000
0.0000 0.0000 0.0000 0.0000 0.0000 0.00000.0000 0.0000 0.0000 0.0000Consumer Products
0.3735
0.0000 0.0000 0.0000 0.0000 0.0000 0.00000.0000 0.0000 0.0000 0.0000Architectural Coating
0.0000
Total CO2 CH4 N2O CO2e
SubCategory tons/yr MT/yr
PM10 Total
Fugitive PM2.5
Exhaust PM2.5
PM2.5 Total
Bio- CO2 NBio- CO2
Mitigated
ROG NOx CO SO2 Fugitive PM10
Exhaust PM10
0.0000 1.7100e-003
1.7100e-003
0.0000 0.0000 1.8200e-003
0.0000 0.0000 0.0000 0.0000Total 0.3735 1.0000e-005
8.8000e-004
0.0000
0.0000 1.7100e-003
1.7100e-003
0.0000 0.0000 1.8200e-003
0.0000 0.0000 0.0000 0.0000Landscaping 8.0000e-005
1.0000e-005
8.8000e-004
0.0000
0.0000 0.0000 0.0000 0.0000 0.0000 0.00000.0000 0.0000 0.0000 0.0000Consumer Products
0.3735

8.0 Waste Detail
8.1 Mitigation Measures Waste
124.5348
Total 101.1212 0.7244 0.0178 124.5348
Land Use Mgal ton
MT/yr
Industrial Park 22.1144 / 0 101.1212 0.7244 0.0178
Mitigated
Indoor/Outdoor Use
Total CO2 CH4 N2O CO2e
124.5348
Total 101.1212 0.7244 0.0178 124.5348
Land Use Mgal ton
MT/yr
Industrial Park 22.1144 / 0 101.1212 0.7244 0.0178
7.2 Water by Land UseUnmitigated
Indoor/Outdoor Use
Total CO2 CH4 N2O CO2e

Land Use tons ton
MT/yr
Mitigated
Waste Disposed
Total CO2 CH4 N2O CO2e
59.6341
Total 24.0707 1.4225 0.0000 59.6341
Land Use tons ton
MT/yr
Industrial Park 118.58 24.0707 1.4225 0.0000
8.2 Waste by Land UseUnmitigated
Waste Disposed
Total CO2 CH4 N2O CO2e
Unmitigated 24.0707 1.4225 0.0000 59.6341
ton
MT/yr
Mitigated 24.0707 1.4225 0.0000 59.6341
Category/Year
Total CO2 CH4 N2O CO2e

User Defined Equipment
Equipment Type Number
11.0 Vegetation
Fuel Type
Boilers
Equipment Type Number Heat Input/Day Heat Input/Year Boiler Rating Fuel Type
Load Factor Fuel Type
10.0 Stationary Equipment
Fire Pumps and Emergency Generators
Equipment Type Number Hours/Day Hours/Year Horse Power Load Factor
9.0 Operational Offroad
Equipment Type Number Hours/Day Days/Year Horse Power
59.6341
Total 24.0707 1.4225 0.0000 59.6341
Industrial Park 118.58 24.0707 1.4225 0.0000

CalEEMod Version: CalEEMod.2016.3.1 Page 1 of 1 Date: 10/24/2016 3:25 PM
East Otay Mesa Specific Plan Amendment Construction Phase 8 - San Diego Air Basin, Annual
East Otay Mesa Specific Plan Amendment Construction Phase 8San Diego Air Basin, Annual
1.0 Project Characteristics
1.1 Land Usage
Land Uses Size Metric Lot Acreage Floor Surface Area Population
Industrial Park 95.63 1000sqft 4.00 95,625.00 0
1.2 Other Project Characteristics
Urbanization Urban Wind Speed (m/s) 2.6 Precipitation Freq (Days) 40
Climate Zone 13 Operational Year 2025
Utility Company San Diego Gas & Electric
CO2 Intensity (lb/MWhr)
720.49 CH4 Intensity (lb/MWhr)
0.029 N2O Intensity (lb/MWhr)
0.006
1.3 User Entered Comments & Non-Default Data
Architectural Coating - Rule 67.0.1 coatings
Table Name Column Name Default Value New Value
tblArchitecturalCoating EF_Nonresidential_Exterior 250.00 100.00
tblArchitecturalCoating EF_Nonresidential_Interior 250.00 50.00
tblArchitecturalCoating EF_Parking 250.00 100.00
tblArchitecturalCoating EF_Residential_Exterior 250.00 100.00
tblArchitecturalCoating EF_Residential_Interior 250.00 50.00
tblAreaCoating Area_EF_Parking 250 0
tblAreaCoating Area_Nonresidential_Exterior 47813 0
tblAreaCoating Area_Nonresidential_Interior 143438 0

tblAreaMitigation UseLowVOCPaintNonresidentialExteriorValue
250 0
tblAreaMitigation UseLowVOCPaintNonresidentialInteriorValue
250 0
tblAreaMitigation UseLowVOCPaintResidentialExteriorValue
250 0
tblAreaMitigation UseLowVOCPaintResidentialInteriorValue
250 0
tblConstDustMitigation WaterUnpavedRoadVehicleSpeed 40 15
tblConstEquipMitigation NumberOfEquipmentMitigated 0.00 2.00
tblConstEquipMitigation NumberOfEquipmentMitigated 0.00 2.00
tblConstEquipMitigation NumberOfEquipmentMitigated 0.00 2.00
tblConstEquipMitigation NumberOfEquipmentMitigated 0.00 6.00
tblConstEquipMitigation NumberOfEquipmentMitigated 0.00 2.00
tblConstEquipMitigation NumberOfEquipmentMitigated 0.00 2.00
tblConstEquipMitigation NumberOfEquipmentMitigated 0.00 2.00
tblConstEquipMitigation NumberOfEquipmentMitigated 0.00 2.00
tblConstEquipMitigation NumberOfEquipmentMitigated 0.00 8.00
tblConstEquipMitigation NumberOfEquipmentMitigated 0.00 2.00
tblConstEquipMitigation Tier No Change Tier 3
tblConstEquipMitigation Tier No Change Tier 3
tblConstEquipMitigation Tier No Change Tier 3
tblConstEquipMitigation Tier No Change Tier 3
tblConstEquipMitigation Tier No Change Tier 3
tblConstEquipMitigation Tier No Change Tier 3
tblConstEquipMitigation Tier No Change Tier 3
tblConstEquipMitigation Tier No Change Tier 3
tblConstEquipMitigation Tier No Change Tier 3
tblConstEquipMitigation Tier No Change Tier 3
tblConstructionPhase NumDays 18.00 132.00
tblConstructionPhase NumDays 230.00 262.00
tblConstructionPhase NumDays 18.00 262.00
tblLandUse BuildingSpaceSquareFeet 95,630.00 95,625.00
tblLandUse LandUseSquareFeet 95,630.00 95,625.00

tblLandUse LotAcreage 2.20 4.00
tblOffRoadEquipment HorsePower 231.00 226.00
tblOffRoadEquipment HorsePower 130.00 125.00
tblOffRoadEquipment HorsePower 132.00 130.00
tblOffRoadEquipment OffRoadEquipmentUnitAmount 1.00 2.00
tblOffRoadEquipment OffRoadEquipmentUnitAmount 1.00 2.00
tblOffRoadEquipment OffRoadEquipmentUnitAmount 3.00 6.00
tblOffRoadEquipment OffRoadEquipmentUnitAmount 1.00 2.00
tblOffRoadEquipment OffRoadEquipmentUnitAmount 1.00 2.00
tblOffRoadEquipment OffRoadEquipmentUnitAmount 3.00 6.00
tblOffRoadEquipment OffRoadEquipmentUnitAmount 1.00 2.00
tblOffRoadEquipment OffRoadEquipmentUnitAmount 1.00 2.00
Exhaust PM10
PM10 Total
tblProjectCharacteristics OperationalYear 2018 2025
2.0 Emissions Summary
2.1 Overall Construction
NBio- CO2 Total CO2
Unmitigated Construction
ROG NOx CO SO2 Fugitive PM10
CH4 N2O CO2e
Year tons/yr MT/yr
Fugitive PM2.5
Exhaust PM2.5
PM2.5 Total
Bio- CO2
2025 1.1237 5.0533 7.1086 0.0124 0.0903 0.2129 0.3032 0.0243 0.2001 0.2244 0.0000 1,076.6551
1,076.6551 0.2444 0.0000 1,082.7660
Maximum 1.1237 5.0533 7.1086 0.0124 0.2444 0.0000 1,082.7660
0.0903 0.2129 0.3032 0.0243 0.2001 0.2244 0.0000 1,076.6551
1,076.6551
Mitigated Construction

SO2 Fugitive PM10
Exhaust PM10
PM2.5 Total
Bio- CO2 NBio- CO2ROG NOx CO Total CO2 CH4 N2O CO2e
Year tons/yr MT/yr
PM10 Total
Fugitive PM2.5
Exhaust PM2.5
2025 0.8506 5.9007 7.8452 0.0124 0.0903 0.3579 0.4481 0.0243 0.3578 0.3821 0.0000 1,076.6540
1,076.6540 0.2444 0.0000 1,082.7648
Maximum 0.8506 5.9007 7.8452 0.0124 0.0903 0.3579 0.4481 0.0243 0.3578 0.3821 0.0000 1,076.6540
1,076.6540 0.2444 0.0000 1,082.7648
ROG NOx CO SO2 Fugitive PM10
Exhaust PM10
PM10 Total
Fugitive PM2.5
Exhaust PM2.5
PM2.5 Total
Bio- CO2 NBio-CO2 Total CO2 CH4 N20 CO2e
Percent Reduction
24.31 -16.77 -10.36 0.00 0.00 -68.05 -47.79 0.00 -78.85 -70.31 0.00 0.00 0.00 0.00 0.00 0.00
Quarter Start Date End Date Maximum Unmitigated ROG + NOX (tons/quarter) Maximum Mitigated ROG + NOX (tons/quarter)
33 10-24-2024 1-23-2025 0.3890 0.4251
34 1-24-2025 4-23-2025 1.5048 1.6447
35 4-24-2025 7-23-2025 1.5376 1.6806
1.2559
Highest 1.5376 1.6806
SO2 Fugitive PM10
Exhaust PM10
36 7-24-2025 9-30-2025 1.1490
PM2.5 Total
Bio- CO2 NBio- CO2
2.2 Overall OperationalUnmitigated Operational
ROG NOx CO Total CO2 CH4 N2O CO2e
Category tons/yr MT/yr
PM10 Total
Fugitive PM2.5
Exhaust PM2.5
Area 0.3735 1.0000e-005
8.8000e-004
0.0000 0.0000 0.0000 0.0000 0.0000 0.0000 1.7100e-003
1.7100e-003
0.0000 0.0000 1.8200e-003
Energy 0.0105 0.0950 0.0798 5.7000e-004
7.2200e-003
7.2200e-003
7.2200e-003
7.2200e-003
0.0000 533.4511 533.4511 0.0193 5.4800e-003
535.5656
Mobile 0.1167 0.4771 1.3710 5.1400e-003
0.5043 4.0500e-003
0.5083 0.1350 3.7700e-003
0.1388 0.0000 476.2813 476.2813 0.0236 0.0000 476.8718
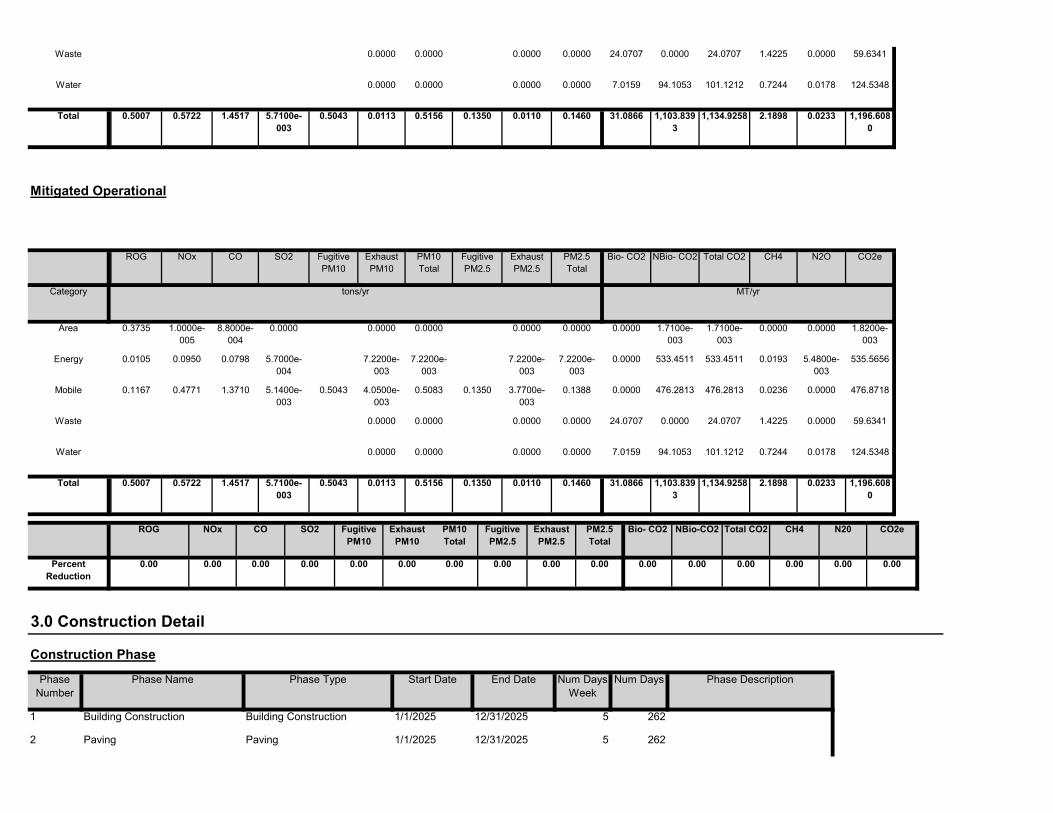
Waste 0.0000 0.0000 0.0000 0.0000 24.0707 0.0000 24.0707 1.4225 0.0000 59.6341
Water 0.0000 0.0000 0.0000 0.0000 7.0159 94.1053 101.1212 0.7244 0.0178 124.5348
Total 0.5007 0.5722 1.4517 5.7100e-003
2.1898 0.0233 1,196.6080
0.5043 0.0113 0.5156 0.1350 0.0110 0.1460
SO2 Fugitive PM10
Exhaust PM10
31.0866 1,103.8393
1,134.9258
PM2.5 Total
Bio- CO2 NBio- CO2
Mitigated Operational
ROG NOx CO Total CO2 CH4 N2O CO2e
Category tons/yr MT/yr
PM10 Total
Fugitive PM2.5
Exhaust PM2.5
Area 0.3735 1.0000e-005
8.8000e-004
0.0000 0.0000 0.0000 0.0000 0.0000 0.0000 1.7100e-003
1.7100e-003
0.0000 0.0000 1.8200e-003
Energy 0.0105 0.0950 0.0798 5.7000e-004
7.2200e-003
7.2200e-003
7.2200e-003
7.2200e-003
0.0000 533.4511 533.4511 0.0193 5.4800e-003
535.5656
Mobile 0.1167 0.4771 1.3710 5.1400e-003
0.5043 4.0500e-003
0.5083 0.1350 3.7700e-003
0.1388 0.0000 476.2813 476.2813 0.0236 0.0000 476.8718
Waste 0.0000 0.0000 0.0000 0.0000 24.0707 0.0000 24.0707 1.4225 0.0000 59.6341
Water 0.0000 0.0000 0.0000 0.0000 7.0159 94.1053 101.1212 0.7244 0.0178 124.5348
Total 0.5007 0.5722 1.4517 5.7100e-003
0.5043 0.0113 0.5156 0.1350 0.0110 0.1460 31.0866 1,103.8393
1,134.9258 2.1898 0.0233 1,196.6080
ROG NOx CO SO2 Fugitive PM10
Exhaust PM10
PM10 Total
Fugitive PM2.5
Exhaust PM2.5
PM2.5 Total
Bio- CO2 NBio-CO2 Total CO2 CH4 N20 CO2e
Percent Reduction
0.00 0.00 0.00 0.00 0.00 0.00 0.00 0.00 0.00 0.00 0.00 0.00 0.00 0.00 0.00 0.00
3.0 Construction Detail
Construction Phase
Phase Number
Phase Name Phase Type Start Date
1 Building Construction Building Construction 1/1/2025 12/31/2025 5
262
End Date Num Days Week
Num Days Phase Description
262
2 Paving Paving 1/1/2025 12/31/2025 5
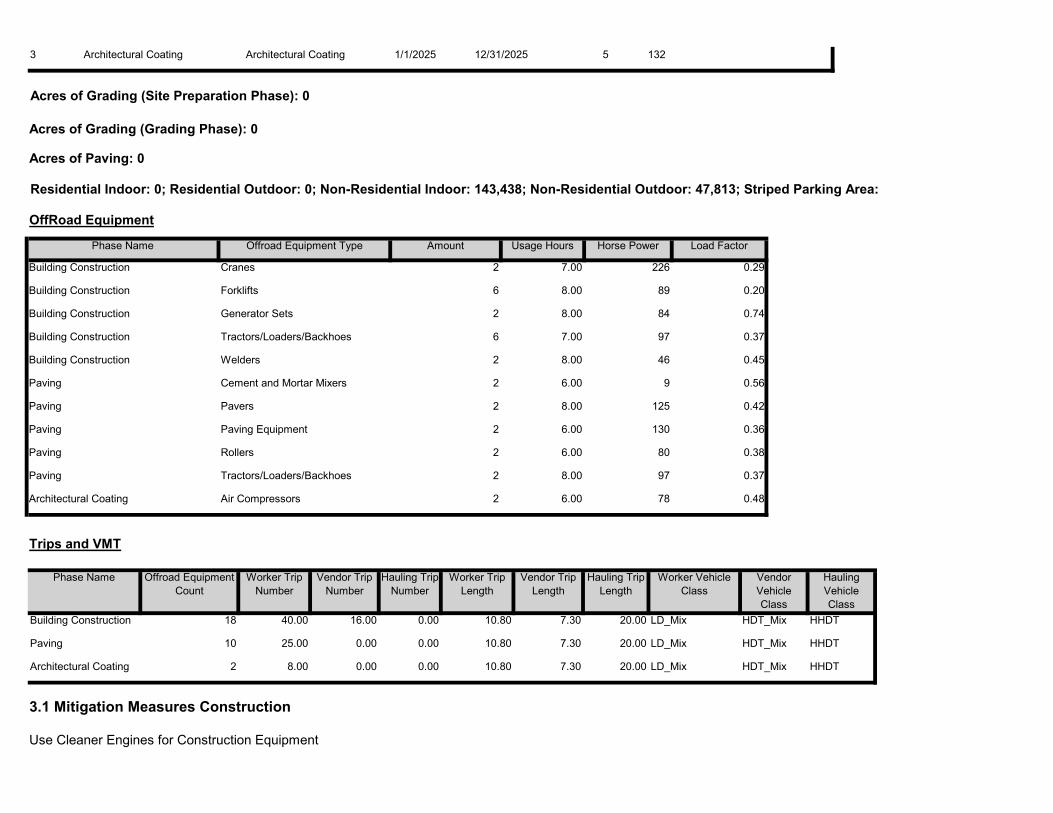
12/31/2025 5 132
Acres of Grading (Site Preparation Phase): 0
Acres of Grading (Grading Phase): 0
Acres of Paving: 0
Residential Indoor: 0; Residential Outdoor: 0; Non-Residential Indoor: 143,438; Non-Residential Outdoor: 47,813; Striped Parking Area:
3 Architectural Coating Architectural Coating 1/1/2025
OffRoad Equipment
Phase Name Offroad Equipment Type Amount Usage Hours Horse Power Load Factor
Building Construction Cranes 2 7.00 226 0.29
Building Construction Forklifts 6 8.00 89 0.20
Building Construction Generator Sets 2 8.00 84 0.74
Building Construction Tractors/Loaders/Backhoes 6 7.00 97 0.37
Building Construction Welders 2 8.00 46 0.45
Paving Cement and Mortar Mixers 2 6.00 9 0.56
Paving Pavers 2 8.00 125 0.42
Paving Paving Equipment 2 6.00 130 0.36
Paving Rollers 2 6.00 80 0.38
Paving Tractors/Loaders/Backhoes 2 8.00 97 0.37
Architectural Coating Air Compressors 2 6.00 78 0.48
Hauling Vehicle Class
Trips and VMT
Phase Name Offroad Equipment Count
Worker Trip Number
Vendor Trip Number
Hauling Trip Number
10.80
Worker Trip Length
Vendor Trip Length
Hauling Trip Length
Worker Vehicle Class
Vendor Vehicle Class
Paving 10 25.00 0.00 0.00
Building Construction 18 40.00 16.00 0.00
HDT_Mix HHDT
7.30 20.00 LD_Mix HDT_Mix HHDT
0.00 10.80
10.80 7.30 20.00 LD_Mix
7.30 20.00 LD_Mix HDT_Mix HHDT
3.1 Mitigation Measures Construction
Architectural Coating 2 8.00 0.00
Use Cleaner Engines for Construction Equipment
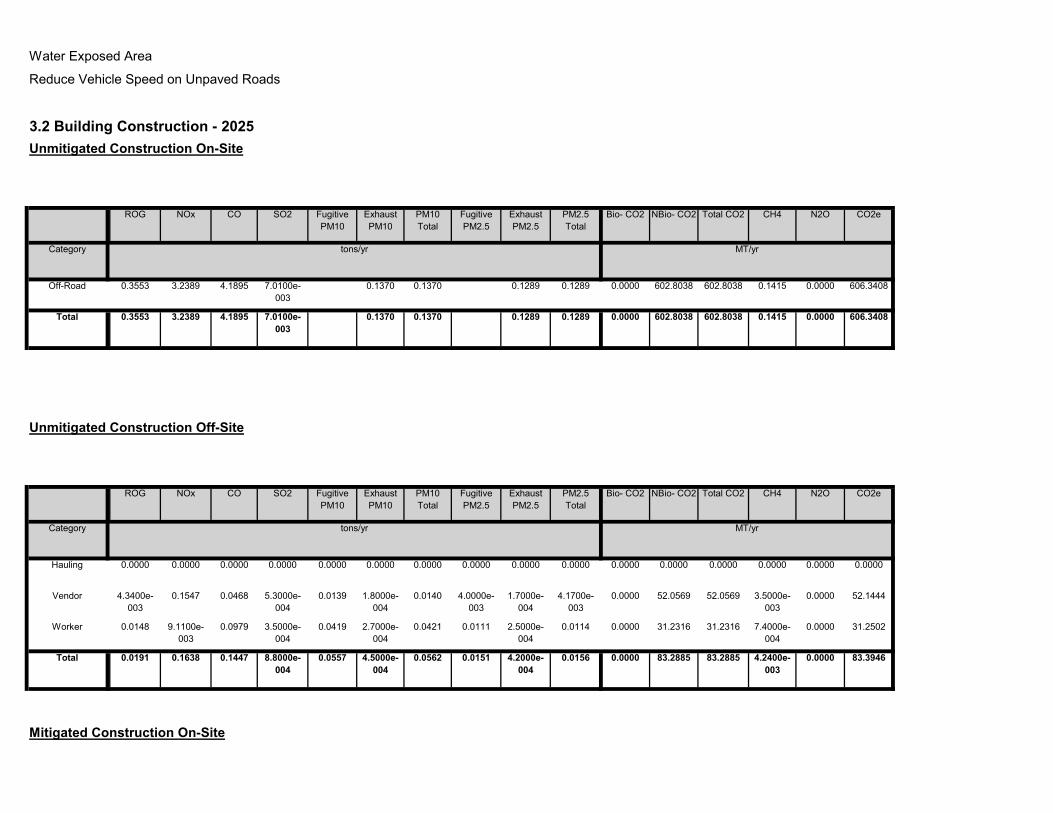
Water Exposed Area
Reduce Vehicle Speed on Unpaved Roads
3.2 Building Construction - 2025Unmitigated Construction On-Site
ROG NOx CO SO2 Fugitive PM10
Exhaust PM10
PM10 Total
Fugitive PM2.5
Exhaust PM2.5
PM2.5 Total
Bio- CO2 NBio- CO2 Total CO2 CH4 N2O CO2e
Category tons/yr MT/yr
Off-Road 0.3553 3.2389 4.1895 7.0100e-003
0.1370 0.1370 0.1289 0.1289 0.0000 602.8038 602.8038 0.1415 0.0000 606.3408
Total 0.3553 3.2389 4.1895 7.0100e-003
0.1415 0.0000 606.34080.1370 0.1370 0.1289 0.1289
SO2 Fugitive PM10
Exhaust PM10
0.0000 602.8038 602.8038
PM2.5 Total
Bio- CO2 NBio- CO2
Unmitigated Construction Off-Site
ROG NOx CO Total CO2 CH4 N2O CO2e
Category tons/yr MT/yr
PM10 Total
Fugitive PM2.5
Exhaust PM2.5
Hauling 0.0000 0.0000 0.0000 0.0000 0.0000 0.0000 0.0000 0.0000 0.0000 0.0000 0.0000 0.0000 0.0000 0.0000 0.0000 0.0000
Vendor 4.3400e-003
0.1547 0.0468 5.3000e-004
0.0139 1.8000e-004
0.0140 4.0000e-003
1.7000e-004
4.1700e-003
0.0000 52.0569 52.0569 3.5000e-003
0.0000 52.1444
Worker 0.0148 9.1100e-003
0.0979 3.5000e-004
0.0419 2.7000e-004
0.0421 0.0111 2.5000e-004
0.0114 0.0000 31.2316 31.2316 7.4000e-004
0.0000 31.2502
Total 0.0191 0.1638 0.1447 8.8000e-004
4.2400e-003
0.0000 83.39460.0557 4.5000e-004
0.0562 0.0151 4.2000e-004
0.0156 0.0000 83.2885 83.2885
Mitigated Construction On-Site

SO2 Fugitive PM10
Exhaust PM10
PM2.5 Total
Bio- CO2 NBio- CO2ROG NOx CO Total CO2 CH4 N2O CO2e
Category tons/yr MT/yr
PM10 Total
Fugitive PM2.5
Exhaust PM2.5
Off-Road 0.1752 3.6995 4.6499 7.0100e-003
0.2353 0.2353 0.2353 0.2353 0.0000 602.8031 602.8031 0.1415 0.0000 606.3400
Total 0.1752 3.6995 4.6499 7.0100e-003
0.1415 0.0000 606.34000.2353 0.2353 0.2353 0.2353
SO2 Fugitive PM10
Exhaust PM10
0.0000 602.8031 602.8031
PM2.5 Total
Bio- CO2 NBio- CO2
Mitigated Construction Off-Site
ROG NOx CO Total CO2 CH4 N2O CO2e
Category tons/yr MT/yr
PM10 Total
Fugitive PM2.5
Exhaust PM2.5
Hauling 0.0000 0.0000 0.0000 0.0000 0.0000 0.0000 0.0000 0.0000 0.0000 0.0000 0.0000 0.0000 0.0000 0.0000 0.0000 0.0000
Vendor 4.3400e-003
0.1547 0.0468 5.3000e-004
0.0139 1.8000e-004
0.0140 4.0000e-003
1.7000e-004
4.1700e-003
0.0000 52.0569 52.0569 3.5000e-003
0.0000 52.1444
Worker 0.0148 9.1100e-003
0.0979 3.5000e-004
0.0419 2.7000e-004
0.0421 0.0111 2.5000e-004
0.0114 0.0000 31.2316 31.2316 7.4000e-004
0.0000 31.2502
Total 0.0191 0.1638 0.1447 8.8000e-004
4.2400e-003
0.0000 83.39460.0557 4.5000e-004
0.0562 0.0151 4.2000e-004
0.0156
SO2 Fugitive PM10
Exhaust PM10
0.0000 83.2885 83.2885
PM2.5 Total
Bio- CO2 NBio- CO2
3.3 Paving - 2025Unmitigated Construction On-Site
ROG NOx CO Total CO2 CH4 N2O CO2e
Category tons/yr MT/yr
PM10 Total
Fugitive PM2.5
Exhaust PM2.5

Off-Road 0.1447 1.3441 2.2215 3.4300e-003
0.0618 0.0618 0.0571 0.0571 0.0000 298.1569 298.1569 0.0945 0.0000 300.5184
Paving 0.0000 0.0000 0.0000 0.0000 0.0000 0.0000 0.0000 0.0000 0.0000 0.0000 0.0000
Total 0.1447 1.3441 2.2215 3.4300e-003
0.0945 0.0000 300.51840.0618 0.0618 0.0571 0.0571
SO2 Fugitive PM10
Exhaust PM10
0.0000 298.1569 298.1569
PM2.5 Total
Bio- CO2 NBio- CO2
Unmitigated Construction Off-Site
ROG NOx CO Total CO2 CH4 N2O CO2e
Category tons/yr MT/yr
PM10 Total
Fugitive PM2.5
Exhaust PM2.5
Hauling 0.0000 0.0000 0.0000 0.0000 0.0000 0.0000 0.0000 0.0000 0.0000 0.0000 0.0000 0.0000 0.0000 0.0000 0.0000 0.0000
Vendor 0.0000 0.0000 0.0000 0.0000 0.0000 0.0000 0.0000 0.0000 0.0000 0.0000 0.0000 0.0000 0.0000 0.0000 0.0000 0.0000
Worker 9.2400e-003
5.7000e-003
0.0612 2.2000e-004
0.0262 1.7000e-004
0.0263 6.9500e-003
1.6000e-004
7.1100e-003
0.0000 19.5197 19.5197 4.7000e-004
0.0000 19.5314
Total 9.2400e-003
5.7000e-003
0.0612 2.2000e-004
4.7000e-004
0.0000 19.53140.0262 1.7000e-004
0.0263 6.9500e-003
1.6000e-004
7.1100e-003
SO2 Fugitive PM10
Exhaust PM10
0.0000 19.5197 19.5197
PM2.5 Total
Bio- CO2 NBio- CO2
Mitigated Construction On-Site
ROG NOx CO Total CO2 CH4 N2O CO2e
Category tons/yr MT/yr
PM10 Total
Fugitive PM2.5
Exhaust PM2.5
Off-Road 0.0808 1.6758 2.4916 3.4300e-003
0.0970 0.0970 0.0970 0.0970 0.0000 298.1565 298.1565 0.0945 0.0000 300.5180
Paving 0.0000 0.0000 0.0000 0.0000 0.0000 0.0000 0.0000 0.0000 0.0000 0.0000 0.0000
Total 0.0808 1.6758 2.4916 3.4300e-003
0.0945 0.0000 300.51800.0970 0.0970 0.0970 0.0970 0.0000 298.1565 298.1565

SO2 Fugitive PM10
Exhaust PM10
PM2.5 Total
Bio- CO2 NBio- CO2
Mitigated Construction Off-Site
ROG NOx CO Total CO2 CH4 N2O CO2e
Category tons/yr MT/yr
PM10 Total
Fugitive PM2.5
Exhaust PM2.5
Hauling 0.0000 0.0000 0.0000 0.0000 0.0000 0.0000 0.0000 0.0000 0.0000 0.0000 0.0000 0.0000 0.0000 0.0000 0.0000 0.0000
Vendor 0.0000 0.0000 0.0000 0.0000 0.0000 0.0000 0.0000 0.0000 0.0000 0.0000 0.0000 0.0000 0.0000 0.0000 0.0000 0.0000
Worker 9.2400e-003
5.7000e-003
0.0612 2.2000e-004
0.0262 1.7000e-004
0.0263 6.9500e-003
1.6000e-004
7.1100e-003
0.0000 19.5197 19.5197 4.7000e-004
0.0000 19.5314
Total 9.2400e-003
5.7000e-003
0.0612 2.2000e-004
4.7000e-004
0.0000 19.53140.0262 1.7000e-004
0.0263 6.9500e-003
1.6000e-004
7.1100e-003
SO2 Fugitive PM10
Exhaust PM10
0.0000 19.5197 19.5197
PM2.5 Total
Bio- CO2 NBio- CO2
3.4 Architectural Coating - 2025Unmitigated Construction On-Site
ROG NOx CO Total CO2 CH4 N2O CO2e
Category tons/yr MT/yr
PM10 Total
Fugitive PM2.5
Exhaust PM2.5
Archit. Coating 0.5477 0.0000 0.0000 0.0000 0.0000 0.0000 0.0000 0.0000 0.0000 0.0000 0.0000
Off-Road 0.0446 0.2990 0.4722 7.8000e-004
0.0134 0.0134 0.0134 0.0134 0.0000 66.6399 66.6399 3.6400e-003
0.0000 66.7308
Total 0.5923 0.2990 0.4722 7.8000e-004
3.6400e-003
0.0000 66.73080.0134 0.0134 0.0134 0.0134
SO2 Fugitive PM10
Exhaust PM10
0.0000 66.6399 66.6399
PM2.5 Total
Bio- CO2 NBio- CO2
Unmitigated Construction Off-Site
ROG NOx CO Total CO2 CH4 N2O CO2ePM10 Total
Fugitive PM2.5
Exhaust PM2.5

Category tons/yr MT/yr
Hauling 0.0000 0.0000 0.0000 0.0000 0.0000 0.0000 0.0000 0.0000 0.0000 0.0000 0.0000 0.0000 0.0000 0.0000 0.0000 0.0000
Vendor 0.0000 0.0000 0.0000 0.0000 0.0000 0.0000 0.0000 0.0000 0.0000 0.0000 0.0000 0.0000 0.0000 0.0000 0.0000 0.0000
Worker 2.9600e-003
1.8200e-003
0.0196 7.0000e-005
8.3700e-003
5.0000e-005
8.4300e-003
2.2200e-003
5.0000e-005
2.2800e-003
0.0000 6.2463 6.2463 1.5000e-004
0.0000 6.2500
Total 2.9600e-003
1.8200e-003
0.0196 7.0000e-005
1.5000e-004
0.0000 6.25008.3700e-003
5.0000e-005
8.4300e-003
2.2200e-003
5.0000e-005
2.2800e-003
SO2 Fugitive PM10
Exhaust PM10
0.0000 6.2463 6.2463
PM2.5 Total
Bio- CO2 NBio- CO2
Mitigated Construction On-Site
ROG NOx CO Total CO2 CH4 N2O CO2e
Category tons/yr MT/yr
PM10 Total
Fugitive PM2.5
Exhaust PM2.5
Archit. Coating 0.5477 0.0000 0.0000 0.0000 0.0000 0.0000 0.0000 0.0000 0.0000 0.0000 0.0000
Off-Road 0.0155 0.3542 0.4783 7.8000e-004
0.0248 0.0248 0.0248 0.0248 0.0000 66.6398 66.6398 3.6400e-003
0.0000 66.7307
Total 0.5633 0.3542 0.4783 7.8000e-004
3.6400e-003
0.0000 66.73070.0248 0.0248 0.0248 0.0248
SO2 Fugitive PM10
Exhaust PM10
0.0000 66.6398 66.6398
PM2.5 Total
Bio- CO2 NBio- CO2
Mitigated Construction Off-Site
ROG NOx CO Total CO2 CH4 N2O CO2e
Category tons/yr MT/yr
PM10 Total
Fugitive PM2.5
Exhaust PM2.5
Hauling 0.0000 0.0000 0.0000 0.0000 0.0000 0.0000 0.0000 0.0000 0.0000 0.0000 0.0000 0.0000 0.0000 0.0000 0.0000 0.0000
Vendor 0.0000 0.0000 0.0000 0.0000 0.0000 0.0000 0.0000 0.0000 0.0000 0.0000 0.0000 0.0000 0.0000 0.0000 0.0000 0.0000
Worker 2.9600e-003
1.8200e-003
0.0196 7.0000e-005
8.3700e-003
5.0000e-005
8.4300e-003
2.2200e-003
5.0000e-005
2.2800e-003
0.0000 6.2463 6.2463 1.5000e-004
0.0000 6.2500

Total 2.9600e-003
1.8200e-003
0.0196 7.0000e-005
1.5000e-004
0.0000 6.25008.3700e-003
5.0000e-005
8.4300e-003
2.2200e-003
5.0000e-005
2.2800e-003
CO SO2 Fugitive PM10
0.0000 6.2463 6.2463
Fugitive PM2.5
Exhaust PM2.5
PM2.5 Total
Bio- CO2
4.0 Operational Detail - Mobile
4.1 Mitigation Measures Mobile
ROG NOx NBio- CO2 Total CO2 CH4 N2O CO2e
Category tons/yr MT/yr
Exhaust PM10
PM10 Total
Mitigated 0.1167 0.4771 1.3710 5.1400e-003
0.5043 4.0500e-003
0.5083 0.1350 3.7700e-003
0.1388 0.0000 476.2813 476.2813 0.0236 0.0000 476.8718
Unmitigated 0.1167 0.4771 1.3710 5.1400e-003
0.5043 4.0500e-003
0.5083 0.1350 3.7700e-003
0.1388 0.0000 476.2813 476.2813 0.0236 0.0000 476.8718
4.2 Trip Summary Information
Average Daily Trip Rate Unmitigated MitigatedLand Use Weekday Saturday Sunday Annual VMT Annual VMT
Industrial Park 653.15 238.12 69.81 1,338,516 1,338,516Total 653.15 238.12 69.81 1,338,516 1,338,516
4.3 Trip Type Information
Miles Trip % Trip Purpose %
Land Use H-W or C-W H-S or C-C H-O or C-NW H-W or C-W
H-S or C-C H-O or C-NW Primary Diverted Pass-by
Industrial Park 9.50 7.30 7.30 59.00 28.00 13.00 79 19 2
4.4 Fleet MixHHD OBUS UBUS MCYLand Use LDA LDT1 LDT2 MDV LHD1
0.101308 0.013823 0.005356 0.016956
LHD2 MHD
0.001823 0.005807 0.000764 0.000950
SBUS MH
0.024628 0.001928Industrial Park 0.609162 0.038894 0.178600

NOx CO SO2 Fugitive PM10
Fugitive PM2.5
Exhaust PM2.5
PM2.5 Total
Bio- CO2
5.0 Energy Detail
Historical Energy Use: N
5.1 Mitigation Measures Energy
ROG NBio- CO2 Total CO2 CH4 N2O CO2e
Category tons/yr MT/yr
Exhaust PM10
PM10 Total
Electricity Mitigated
0.0000 0.0000 0.0000 0.0000 0.0000 430.0150 430.0150 0.0173 3.5800e-003
431.5148
Electricity Unmitigated
0.0000 0.0000 0.0000 0.0000 0.0000 430.0150 430.0150 0.0173 3.5800e-003
431.5148
NaturalGas Mitigated
0.0105 0.0950 0.0798 5.7000e-004
7.2200e-003
7.2200e-003
7.2200e-003
7.2200e-003
0.0000 103.4361 103.4361 1.9800e-003
1.9000e-003
104.0507
NaturalGas Unmitigated
0.0105 0.0950 0.0798 5.7000e-004
103.4361 103.4361 1.9800e-003
1.9000e-003
104.05077.2200e-003
7.2200e-003
7.2200e-003
ROG NOx CO SO2 Fugitive PM10
0.00007.2200e-003
PM10 Total
Fugitive PM2.5
Exhaust PM2.5
PM2.5 Total
Bio- CO2
5.2 Energy by Land Use - NaturalGasUnmitigated
NaturalGas Use
NBio- CO2 Total CO2 CH4 N2O CO2e
Land Use kBTU/yr tons/yr MT/yr
Exhaust PM10
Industrial Park 1.93832e+006
0.0105 0.0950 0.0798 1.9800e-003
1.9000e-003
5.7000e-004
7.2200e-003
7.2200e-003
7.2200e-003
7.2200e-003
7.2200e-003
0.0000 103.4361 103.4361
0.0000 103.4361
104.0507
Total 0.0105 0.0950 0.0798 5.7000e-004
103.4361 1.9800e-003
1.9000e-003
104.05077.2200e-003
7.2200e-003
7.2200e-003

Mitigated
NaturalGas Use
ROG NOx CO SO2 Fugitive PM10
Exhaust PM10
PM10 Total
Fugitive PM2.5
Exhaust PM2.5
PM2.5 Total
Bio- CO2 NBio- CO2 Total CO2 CH4 N2O CO2e
Land Use kBTU/yr tons/yr MT/yr
Industrial Park 1.93832e+006
0.0105 0.0950 103.4361 1.9800e-003
0.0798 5.7000e-004
7.2200e-003
7.2200e-003
5.7000e-004
7.2200e-003
7.2200e-003
0.0000 103.4361
7.2200e-003
0.0000
1.9000e-003
104.0507
Total 0.0105 0.0950 0.0798 103.4361 103.4361 1.9800e-003
1.9000e-003
104.0507
5.3 Energy by Land Use - Electricity
7.2200e-003
7.2200e-003
7.2200e-003
Unmitigated
Electricity Use
Total CO2 CH4 N2O CO2e
Land Use kWh/yr ton
MT/yr
Industrial Park 1.3158e+006
430.0150 0.0173 3.5800e-003
431.5148
Total 430.0150 0.0173 3.5800e-003
431.5148
Mitigated
Electricity Use
Total CO2 CH4 N2O CO2e

3.5800e-003
431.5148
Land Use kWh/yr ton
MT/yr
Industrial Park 1.3158e+006
430.0150 0.0173
CO SO2 Fugitive PM10
431.5148
Total 430.0150 0.0173 3.5800e-003
Fugitive PM2.5
Exhaust PM2.5
PM2.5 Total
Bio- CO2
6.0 Area Detail
6.1 Mitigation Measures Area
ROG NOx NBio- CO2 Total CO2 CH4 N2O CO2e
Category tons/yr MT/yr
Exhaust PM10
PM10 Total
Mitigated 0.3735 1.0000e-005
8.8000e-004
0.0000 0.0000 0.0000 0.0000 0.0000 0.0000 1.7100e-003
1.7100e-003
0.0000 0.0000 1.8200e-003
Unmitigated 0.3735 1.0000e-005
8.8000e-004
0.0000 0.0000 0.0000 1.8200e-003
0.0000 0.0000 0.0000 0.0000
SO2 Fugitive PM10
Exhaust PM10
0.0000 1.7100e-003
1.7100e-003
PM2.5 Total
Bio- CO2 NBio- CO2
6.2 Area by SubCategoryUnmitigated
ROG NOx CO Total CO2 CH4 N2O CO2e
SubCategory tons/yr MT/yr
PM10 Total
Fugitive PM2.5
Exhaust PM2.5
Architectural Coating
0.0000 0.0000 0.0000 0.0000 0.0000 0.0000 0.0000 0.0000 0.0000 0.0000 0.0000

Consumer Products
0.3735 0.0000 0.0000 0.0000 0.0000 0.0000 0.0000 0.0000 0.0000 0.0000 0.0000
Landscaping 8.0000e-005
1.0000e-005
8.8000e-004
0.0000 0.0000 0.0000 0.0000 0.0000 0.0000 1.7100e-003
1.7100e-003
0.0000 0.0000 1.8200e-003
Total 0.3735 1.0000e-005
8.8000e-004
0.0000 0.0000 0.0000 1.8200e-003
0.0000 0.0000 0.0000 0.0000
SO2 Fugitive PM10
Exhaust PM10
0.0000 1.7100e-003
1.7100e-003
PM2.5 Total
Bio- CO2 NBio- CO2
Mitigated
ROG NOx CO Total CO2 CH4 N2O CO2e
SubCategory tons/yr MT/yr
PM10 Total
Fugitive PM2.5
Exhaust PM2.5
Architectural Coating
0.0000 0.0000 0.0000 0.0000 0.0000 0.0000 0.0000 0.0000 0.0000 0.0000 0.0000
Consumer Products
0.3735 0.0000 0.0000 0.0000 0.0000 0.0000 0.0000 0.0000 0.0000 0.0000 0.0000
Landscaping 8.0000e-005
1.0000e-005
8.8000e-004
0.0000 0.0000 0.0000 0.0000 0.0000 0.0000 1.7100e-003
1.7100e-003
0.0000 0.0000 1.8200e-003
Total 0.3735 1.0000e-005
8.8000e-004
0.0000 0.0000 0.0000 0.0000 0.0000 0.0000 1.7100e-003
1.7100e-003
0.0000 0.0000 1.8200e-003
7.0 Water Detail
7.1 Mitigation Measures Water
Total CO2 CH4 N2O CO2e
Category ton
MT/yr
Mitigated 101.1212 0.7244 0.0178 124.5348
Unmitigated 101.1212 0.7244 0.0178 124.5348

7.2 Water by Land UseUnmitigated
Indoor/Outdoor Use
Total CO2 CH4 N2O CO2e
Land Use Mgal ton
MT/yr
Industrial Park 22.1144 / 0 101.1212 0.7244 0.0178 124.5348
Total 101.1212 0.7244 0.0178 124.5348
Mitigated
Indoor/Outdoor Use
Total CO2 CH4 N2O CO2e
Land Use Mgal ton
MT/yr
Industrial Park 22.1144 / 0 101.1212 0.7244 0.0178 124.5348
Total 101.1212 0.7244 0.0178 124.5348
8.0 Waste Detail
8.1 Mitigation Measures Waste

Category/Year
Total CO2 CH4 N2O CO2e
ton
MT/yr
Mitigated 24.0707 1.4225 0.0000 59.6341
Unmitigated 24.0707 1.4225 0.0000 59.6341
8.2 Waste by Land UseUnmitigated
Waste Disposed
Total CO2 CH4 N2O CO2e
Land Use tons ton
MT/yr
Industrial Park 118.58 24.0707 1.4225 0.0000 59.6341
Total 24.0707 1.4225 0.0000 59.6341
Mitigated
Waste Disposed
Total CO2 CH4 N2O CO2e
Land Use tons ton
MT/yr

Industrial Park 118.58 24.0707 1.4225 0.0000 59.6341
Total 24.0707 1.4225 0.0000 59.6341
Horse Power Load Factor
9.0 Operational Offroad
Equipment Type Number Hours/Day Days/Year Horse Power
Boiler Rating Fuel Type
Load Factor Fuel Type
10.0 Stationary Equipment
Fire Pumps and Emergency Generators
Equipment Type Number Hours/Day Hours/Year
User Defined Equipment
Equipment Type Number
11.0 Vegetation
Fuel Type
Boilers
Equipment Type Number Heat Input/Day Heat Input/Year
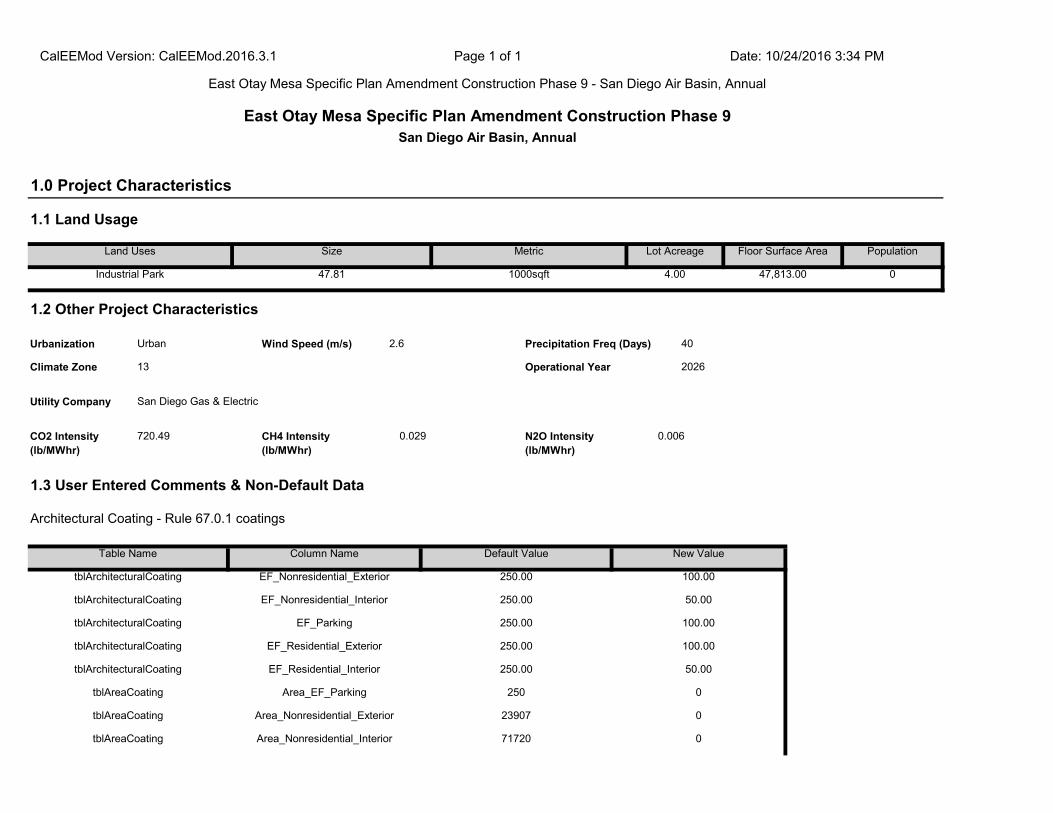
tblAreaCoating Area_Nonresidential_Exterior 23907 0
tblAreaCoating Area_Nonresidential_Interior 71720 0
tblArchitecturalCoating EF_Residential_Interior 250.00 50.00
tblAreaCoating Area_EF_Parking 250 0
tblArchitecturalCoating EF_Parking 250.00 100.00
tblArchitecturalCoating EF_Residential_Exterior 250.00 100.00
tblArchitecturalCoating EF_Nonresidential_Exterior 250.00 100.00
tblArchitecturalCoating EF_Nonresidential_Interior 250.00 50.00
1.3 User Entered Comments & Non-Default Data
Architectural Coating - Rule 67.0.1 coatings
Table Name Column Name Default Value New Value
CO2 Intensity (lb/MWhr)
720.49 CH4 Intensity (lb/MWhr)
0.029 N2O Intensity (lb/MWhr)
0.006
40
Climate Zone 13 Operational Year 2026
Utility Company San Diego Gas & Electric
1.2 Other Project Characteristics
Urbanization Urban Wind Speed (m/s) 2.6 Precipitation Freq (Days)
Floor Surface Area Population
Industrial Park 47.81 1000sqft 4.00 47,813.00 0
1.0 Project Characteristics
1.1 Land Usage
Land Uses Size Metric Lot Acreage
CalEEMod Version: CalEEMod.2016.3.1 Page 1 of 1 Date: 10/24/2016 3:34 PM
East Otay Mesa Specific Plan Amendment Construction Phase 9 - San Diego Air Basin, Annual
East Otay Mesa Specific Plan Amendment Construction Phase 9San Diego Air Basin, Annual

tblLandUse BuildingSpaceSquareFeet 47,810.00 47,813.00
tblLandUse LandUseSquareFeet 47,810.00 47,813.00
tblConstructionPhase NumDays 230.00 262.00
tblConstructionPhase NumDays 18.00 262.00
tblConstEquipMitigation Tier No Change Tier 3
tblConstructionPhase NumDays 18.00 132.00
tblConstEquipMitigation Tier No Change Tier 3
tblConstEquipMitigation Tier No Change Tier 3
tblConstEquipMitigation Tier No Change Tier 3
tblConstEquipMitigation Tier No Change Tier 3
tblConstEquipMitigation Tier No Change Tier 3
tblConstEquipMitigation Tier No Change Tier 3
tblConstEquipMitigation Tier No Change Tier 3
tblConstEquipMitigation Tier No Change Tier 3
tblConstEquipMitigation NumberOfEquipmentMitigated 0.00 2.00
tblConstEquipMitigation Tier No Change Tier 3
tblConstEquipMitigation NumberOfEquipmentMitigated 0.00 2.00
tblConstEquipMitigation NumberOfEquipmentMitigated 0.00 8.00
tblConstEquipMitigation NumberOfEquipmentMitigated 0.00 2.00
tblConstEquipMitigation NumberOfEquipmentMitigated 0.00 2.00
tblConstEquipMitigation NumberOfEquipmentMitigated 0.00 6.00
tblConstEquipMitigation NumberOfEquipmentMitigated 0.00 2.00
tblConstEquipMitigation NumberOfEquipmentMitigated 0.00 2.00
tblConstEquipMitigation NumberOfEquipmentMitigated 0.00 2.00
tblConstDustMitigation WaterUnpavedRoadVehicleSpeed 40 15
tblConstEquipMitigation NumberOfEquipmentMitigated 0.00 2.00
tblAreaMitigation UseLowVOCPaintResidentialExteriorValue
250 0
tblAreaMitigation UseLowVOCPaintResidentialInteriorValue
250 0
tblAreaMitigation UseLowVOCPaintNonresidentialExteriorValue
250 0
tblAreaMitigation UseLowVOCPaintNonresidentialInteriorValue
250 0

Mitigated Construction
0.0000 1,030.3376
1,030.3376 0.2422 0.0000 1,036.3915
0.0582 0.2127 0.2709 0.0156 0.1998 0.2154Maximum 0.8380 4.9686 7.0189 0.0119
0.0000 1,030.3376
1,030.3376 0.2422 0.0000 1,036.3915
0.0582 0.2127 0.2709 0.0156 0.1998 0.21542026 0.8380 4.9686 7.0189 0.0119
CH4 N2O CO2e
Year tons/yr MT/yr
Fugitive PM2.5
Exhaust PM2.5
PM2.5 Total
Bio- CO2 NBio- CO2 Total CO2
Unmitigated Construction
ROG NOx CO SO2 Fugitive PM10
Exhaust PM10
PM10 Total
tblProjectCharacteristics OperationalYear 2018 2026
2.0 Emissions Summary
2.1 Overall Construction
tblOffRoadEquipment OffRoadEquipmentUnitAmount 1.00 2.00
tblOffRoadEquipment OffRoadEquipmentUnitAmount 1.00 2.00
tblOffRoadEquipment OffRoadEquipmentUnitAmount 1.00 2.00
tblOffRoadEquipment OffRoadEquipmentUnitAmount 3.00 6.00
tblOffRoadEquipment OffRoadEquipmentUnitAmount 3.00 6.00
tblOffRoadEquipment OffRoadEquipmentUnitAmount 1.00 2.00
tblOffRoadEquipment OffRoadEquipmentUnitAmount 1.00 2.00
tblOffRoadEquipment OffRoadEquipmentUnitAmount 1.00 2.00
tblOffRoadEquipment HorsePower 130.00 125.00
tblOffRoadEquipment HorsePower 132.00 130.00
tblLandUse LotAcreage 1.10 4.00
tblOffRoadEquipment HorsePower 231.00 226.00

0.0000 231.1635 231.1635 0.0114 0.0000 231.44860.2521 1.9400e-003
0.2540 0.0675 1.8100e-003
0.0693Mobile 0.0558 0.2307 0.6534 2.4900e-003
0.0000 266.7283 266.7283 9.6500e-003
2.7400e-003
267.78563.6100e-003
3.6100e-003
3.6100e-003
3.6100e-003
Energy 5.2300e-003
0.0475 0.0399 2.9000e-004
0.0000 8.5000e-004
8.5000e-004
0.0000 0.0000 9.1000e-004
0.0000 0.0000 0.0000 0.0000Area 0.1868 0.0000 4.4000e-004
0.0000
Total CO2 CH4 N2O CO2e
Category tons/yr MT/yr
PM10 Total
Fugitive PM2.5
Exhaust PM2.5
PM2.5 Total
Bio- CO2 NBio- CO2
2.2 Overall OperationalUnmitigated Operational
ROG NOx CO SO2 Fugitive PM10
Exhaust PM10
40 7-24-2026 9-30-2026 1.0803 1.1872
Highest 1.4457 1.5887
38 1-24-2026 4-23-2026 1.4145 1.5544
39 4-24-2026 7-23-2026 1.4457 1.5887
Quarter Start Date End Date Maximum Unmitigated ROG + NOX (tons/quarter) Maximum Mitigated ROG + NOX (tons/quarter)
37 10-24-2025 1-23-2026 0.3656 0.4018
0.00 0.00 0.00 0.00 0.00 0.000.00 -68.14 -53.50 0.00 -78.94 -73.21
NBio-CO2 Total CO2 CH4 N20 CO2e
Percent Reduction
32.60 -17.05 -10.49 0.00
Exhaust PM10
PM10 Total
Fugitive PM2.5
Exhaust PM2.5
PM2.5 Total
Bio- CO2ROG NOx CO SO2 Fugitive PM10
0.0000 1,030.3364
1,030.3364 0.2422 0.0000 1,036.3904
0.0582 0.3576 0.4158 0.0156 0.3576 0.3732Maximum 0.5649 5.8160 7.7555 0.0119
0.0000 1,030.3364
1,030.3364 0.2422 0.0000 1,036.3904
0.0582 0.3576 0.4158 0.0156 0.3576 0.37322026 0.5649 5.8160 7.7555 0.0119
Total CO2 CH4 N2O CO2e
Year tons/yr MT/yr
PM10 Total
Fugitive PM2.5
Exhaust PM2.5
PM2.5 Total
Bio- CO2 NBio- CO2ROG NOx CO SO2 Fugitive PM10
Exhaust PM10

262
2 Paving Paving 1/1/2026 12/31/2026 5 262
End Date Num Days Week
Num Days Phase Description
1 Building Construction Building Construction 1/1/2026 12/31/2026 5
3.0 Construction Detail
Construction Phase
Phase Number
Phase Name Phase Type Start Date
0.00 0.00 0.00 0.00 0.00 0.000.00 0.00 0.00 0.00 0.00 0.00
NBio-CO2 Total CO2 CH4 N20 CO2e
Percent Reduction
0.00 0.00 0.00 0.00
Exhaust PM10
PM10 Total
Fugitive PM2.5
Exhaust PM2.5
PM2.5 Total
Bio- CO2ROG NOx CO SO2 Fugitive PM10
15.5409 544.9404 560.4813 1.0944 0.0116 591.30800.2521 5.5500e-003
0.2577 0.0675 5.4200e-003
0.0729Total 0.2478 0.2782 0.6938 2.7800e-003
3.5076 47.0477 50.5553 0.3622 8.9000e-003
62.26090.0000 0.0000 0.0000 0.0000Water
12.0333 0.0000 12.0333 0.7112 0.0000 29.81200.0000 0.0000 0.0000 0.0000Waste
0.0000 231.1635 231.1635 0.0114 0.0000 231.44860.2521 1.9400e-003
0.2540 0.0675 1.8100e-003
0.0693Mobile 0.0558 0.2307 0.6534 2.4900e-003
0.0000 266.7283 266.7283 9.6500e-003
2.7400e-003
267.78563.6100e-003
3.6100e-003
3.6100e-003
3.6100e-003
Energy 5.2300e-003
0.0475 0.0399 2.9000e-004
0.0000 8.5000e-004
8.5000e-004
0.0000 0.0000 9.1000e-004
0.0000 0.0000 0.0000 0.0000Area 0.1868 0.0000 4.4000e-004
0.0000
Total CO2 CH4 N2O CO2e
Category tons/yr MT/yr
PM10 Total
Fugitive PM2.5
Exhaust PM2.5
PM2.5 Total
Bio- CO2 NBio- CO2
Mitigated Operational
ROG NOx CO SO2 Fugitive PM10
Exhaust PM10
15.5409 544.9404 560.4813 1.0944 0.0116 591.30800.2521 5.5500e-003
0.2577 0.0675 5.4200e-003
0.0729Total 0.2478 0.2782 0.6938 2.7800e-003
3.5076 47.0477 50.5553 0.3622 8.9000e-003
62.26090.0000 0.0000 0.0000 0.0000Water
12.0333 0.0000 12.0333 0.7112 0.0000 29.81200.0000 0.0000 0.0000 0.0000Waste

Use Cleaner Engines for Construction Equipment
7.30 20.00 LD_Mix HDT_Mix HHDT
3.1 Mitigation Measures Construction
Architectural Coating 2 4.00 0.00 0.00 10.80
10.80 7.30 20.00 LD_Mix HDT_Mix HHDT
7.30 20.00 LD_Mix HDT_Mix HHDT
Paving 10 25.00 0.00 0.00
Building Construction 18 20.00 8.00 0.00 10.80
Worker Trip Length
Vendor Trip Length
Hauling Trip Length
Worker Vehicle Class
Vendor Vehicle Class
Hauling Vehicle Class
Trips and VMT
Phase Name Offroad Equipment Count
Worker Trip Number
Vendor Trip Number
Hauling Trip Number
Architectural Coating Air Compressors 2 6.00 78 0.48
Paving Tractors/Loaders/Backhoes 2 8.00 97 0.37
Paving Rollers 2 6.00 80 0.38
Paving Paving Equipment 2 6.00 130 0.36
Paving Pavers 2 8.00 125 0.42
Paving Cement and Mortar Mixers 2 6.00 9 0.56
Building Construction Welders 2 8.00 46 0.45
Building Construction Tractors/Loaders/Backhoes 6 7.00 97 0.37
Building Construction Generator Sets 2 8.00 84 0.74
Building Construction Forklifts 6 8.00 89 0.20
Load Factor
Building Construction Cranes 2 7.00 226 0.29
OffRoad Equipment
Phase Name Offroad Equipment Type Amount Usage Hours Horse Power
132
Acres of Grading (Site Preparation Phase): 0
Acres of Grading (Grading Phase): 0
Acres of Paving: 0
Residential Indoor: 0; Residential Outdoor: 0; Non-Residential Indoor: 71,720; Non-Residential Outdoor: 23,907; Striped Parking Area: 0
3 Architectural Coating Architectural Coating 1/1/2026 12/31/2026 5
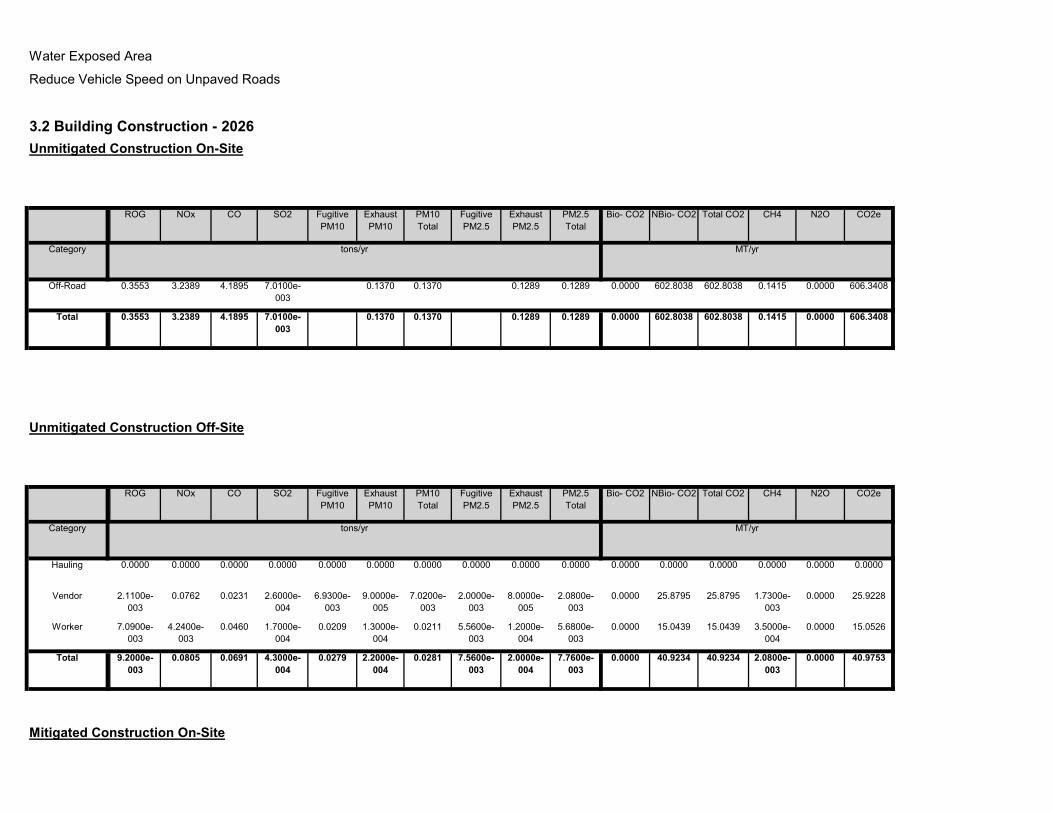
Mitigated Construction On-Site
0.0000 40.9234 40.9234 2.0800e-003
0.0000 40.97530.0279 2.2000e-004
0.0281 7.5600e-003
2.0000e-004
7.7600e-003
Total 9.2000e-003
0.0805 0.0691 4.3000e-004
0.0000 15.0439 15.0439 3.5000e-004
0.0000 15.05260.0209 1.3000e-004
0.0211 5.5600e-003
1.2000e-004
5.6800e-003
Worker 7.0900e-003
4.2400e-003
0.0460 1.7000e-004
0.0000 25.8795 25.8795 1.7300e-003
0.0000 25.92286.9300e-003
9.0000e-005
7.0200e-003
2.0000e-003
8.0000e-005
2.0800e-003
Vendor 2.1100e-003
0.0762 0.0231 2.6000e-004
0.0000 0.0000 0.0000 0.0000 0.0000 0.00000.0000 0.0000 0.0000 0.0000 0.0000 0.0000Hauling 0.0000 0.0000 0.0000 0.0000
Total CO2 CH4 N2O CO2e
Category tons/yr MT/yr
PM10 Total
Fugitive PM2.5
Exhaust PM2.5
PM2.5 Total
Bio- CO2 NBio- CO2
Unmitigated Construction Off-Site
ROG NOx CO SO2 Fugitive PM10
Exhaust PM10
0.0000 602.8038 602.8038 0.1415 0.0000 606.34080.1370 0.1370 0.1289 0.1289Total 0.3553 3.2389 4.1895 7.0100e-003
0.0000 602.8038 602.8038 0.1415 0.0000 606.34080.1370 0.1370 0.1289 0.1289
CO2e
Category tons/yr MT/yr
Off-Road 0.3553 3.2389 4.1895 7.0100e-003
PM2.5 Total
Bio- CO2 NBio- CO2 Total CO2 CH4 N2OSO2 Fugitive PM10
Exhaust PM10
PM10 Total
Fugitive PM2.5
Exhaust PM2.5
Water Exposed Area
Reduce Vehicle Speed on Unpaved Roads
3.2 Building Construction - 2026Unmitigated Construction On-Site
ROG NOx CO

Total CO2 CH4 N2O CO2e
Category tons/yr MT/yr
PM10 Total
Fugitive PM2.5
Exhaust PM2.5
PM2.5 Total
Bio- CO2 NBio- CO2
3.3 Paving - 2026Unmitigated Construction On-Site
ROG NOx CO SO2 Fugitive PM10
Exhaust PM10
0.0000 40.9234 40.9234 2.0800e-003
0.0000 40.97530.0279 2.2000e-004
0.0281 7.5600e-003
2.0000e-004
7.7600e-003
Total 9.2000e-003
0.0805 0.0691 4.3000e-004
0.0000 15.0439 15.0439 3.5000e-004
0.0000 15.05260.0209 1.3000e-004
0.0211 5.5600e-003
1.2000e-004
5.6800e-003
Worker 7.0900e-003
4.2400e-003
0.0460 1.7000e-004
0.0000 25.8795 25.8795 1.7300e-003
0.0000 25.92286.9300e-003
9.0000e-005
7.0200e-003
2.0000e-003
8.0000e-005
2.0800e-003
Vendor 2.1100e-003
0.0762 0.0231 2.6000e-004
0.0000 0.0000 0.0000 0.0000 0.0000 0.00000.0000 0.0000 0.0000 0.0000 0.0000 0.0000Hauling 0.0000 0.0000 0.0000 0.0000
Total CO2 CH4 N2O CO2e
Category tons/yr MT/yr
PM10 Total
Fugitive PM2.5
Exhaust PM2.5
PM2.5 Total
Bio- CO2 NBio- CO2
Mitigated Construction Off-Site
ROG NOx CO SO2 Fugitive PM10
Exhaust PM10
0.0000 602.8031 602.8031 0.1415 0.0000 606.34000.2353 0.2353 0.2353 0.2353Total 0.1752 3.6995 4.6499 7.0100e-003
0.0000 602.8031 602.8031 0.1415 0.0000 606.34000.2353 0.2353 0.2353 0.2353Off-Road 0.1752 3.6995 4.6499 7.0100e-003
Total CO2 CH4 N2O CO2e
Category tons/yr MT/yr
PM10 Total
Fugitive PM2.5
Exhaust PM2.5
PM2.5 Total
Bio- CO2 NBio- CO2ROG NOx CO SO2 Fugitive PM10
Exhaust PM10

0.0000 298.1565 298.1565 0.0945 0.0000 300.51800.0970 0.0970 0.0970 0.0970Total 0.0808 1.6758 2.4916 3.4300e-003
0.0000 0.0000 0.0000 0.0000 0.0000 0.00000.0000 0.0000 0.0000 0.0000Paving 0.0000
0.0000 298.1565 298.1565 0.0945 0.0000 300.51800.0970 0.0970 0.0970 0.0970Off-Road 0.0808 1.6758 2.4916 3.4300e-003
Total CO2 CH4 N2O CO2e
Category tons/yr MT/yr
PM10 Total
Fugitive PM2.5
Exhaust PM2.5
PM2.5 Total
Bio- CO2 NBio- CO2
Mitigated Construction On-Site
ROG NOx CO SO2 Fugitive PM10
Exhaust PM10
0.0000 18.8049 18.8049 4.3000e-004
0.0000 18.81570.0262 1.7000e-004
0.0263 6.9500e-003
1.5000e-004
7.1100e-003
Total 8.8600e-003
5.3000e-003
0.0575 2.1000e-004
0.0000 18.8049 18.8049 4.3000e-004
0.0000 18.81570.0262 1.7000e-004
0.0263 6.9500e-003
1.5000e-004
7.1100e-003
Worker 8.8600e-003
5.3000e-003
0.0575 2.1000e-004
0.0000 0.0000 0.0000 0.0000 0.0000 0.00000.0000 0.0000 0.0000 0.0000 0.0000 0.0000Vendor 0.0000 0.0000 0.0000 0.0000
0.0000 0.0000 0.0000 0.0000 0.0000 0.00000.0000 0.0000 0.0000 0.0000 0.0000 0.0000Hauling 0.0000 0.0000 0.0000 0.0000
Total CO2 CH4 N2O CO2e
Category tons/yr MT/yr
PM10 Total
Fugitive PM2.5
Exhaust PM2.5
PM2.5 Total
Bio- CO2 NBio- CO2
Unmitigated Construction Off-Site
ROG NOx CO SO2 Fugitive PM10
Exhaust PM10
0.0000 298.1569 298.1569 0.0945 0.0000 300.51840.0618 0.0618 0.0571 0.0571Total 0.1447 1.3441 2.2215 3.4300e-003
0.0000 0.0000 0.0000 0.0000 0.0000 0.00000.0000 0.0000 0.0000 0.0000Paving 0.0000
0.0000 298.1569 298.1569 0.0945 0.0000 300.51840.0618 0.0618 0.0571 0.0571Off-Road 0.1447 1.3441 2.2215 3.4300e-003

Total CO2 CH4 N2O CO2ePM10 Total
Fugitive PM2.5
Exhaust PM2.5
PM2.5 Total
Bio- CO2 NBio- CO2
Unmitigated Construction Off-Site
ROG NOx CO SO2 Fugitive PM10
Exhaust PM10
0.0000 66.6399 66.6399 3.6400e-003
0.0000 66.73080.0134 0.0134 0.0134 0.0134Total 0.3185 0.2990 0.4722 7.8000e-004
0.0000 66.6399 66.6399 3.6400e-003
0.0000 66.73080.0134 0.0134 0.0134 0.0134Off-Road 0.0446 0.2990 0.4722 7.8000e-004
0.0000 0.0000 0.0000 0.0000 0.0000 0.00000.0000 0.0000 0.0000 0.0000Archit. Coating 0.2739
Total CO2 CH4 N2O CO2e
Category tons/yr MT/yr
PM10 Total
Fugitive PM2.5
Exhaust PM2.5
PM2.5 Total
Bio- CO2 NBio- CO2
3.4 Architectural Coating - 2026Unmitigated Construction On-Site
ROG NOx CO SO2 Fugitive PM10
Exhaust PM10
0.0000 18.8049 18.8049 4.3000e-004
0.0000 18.81570.0262 1.7000e-004
0.0263 6.9500e-003
1.5000e-004
7.1100e-003
Total 8.8600e-003
5.3000e-003
0.0575 2.1000e-004
0.0000 18.8049 18.8049 4.3000e-004
0.0000 18.81570.0262 1.7000e-004
0.0263 6.9500e-003
1.5000e-004
7.1100e-003
Worker 8.8600e-003
5.3000e-003
0.0575 2.1000e-004
0.0000 0.0000 0.0000 0.0000 0.0000 0.00000.0000 0.0000 0.0000 0.0000 0.0000 0.0000Vendor 0.0000 0.0000 0.0000 0.0000
0.0000 0.0000 0.0000 0.0000 0.0000 0.00000.0000 0.0000 0.0000 0.0000 0.0000 0.0000Hauling 0.0000 0.0000 0.0000 0.0000
Total CO2 CH4 N2O CO2e
Category tons/yr MT/yr
PM10 Total
Fugitive PM2.5
Exhaust PM2.5
PM2.5 Total
Bio- CO2 NBio- CO2
Mitigated Construction Off-Site
ROG NOx CO SO2 Fugitive PM10
Exhaust PM10

0.0000 3.0088 3.0088 7.0000e-005
0.0000 3.01054.1900e-003
3.0000e-005
4.2100e-003
1.1100e-003
2.0000e-005
1.1400e-003
Worker 1.4200e-003
8.5000e-004
9.2000e-003
3.0000e-005
0.0000 0.0000 0.0000 0.0000 0.0000 0.00000.0000 0.0000 0.0000 0.0000 0.0000 0.0000Vendor 0.0000 0.0000 0.0000 0.0000
0.0000 0.0000 0.0000 0.0000 0.0000 0.00000.0000 0.0000 0.0000 0.0000 0.0000 0.0000Hauling 0.0000 0.0000 0.0000 0.0000
Total CO2 CH4 N2O CO2e
Category tons/yr MT/yr
PM10 Total
Fugitive PM2.5
Exhaust PM2.5
PM2.5 Total
Bio- CO2 NBio- CO2
Mitigated Construction Off-Site
ROG NOx CO SO2 Fugitive PM10
Exhaust PM10
0.0000 66.6398 66.6398 3.6400e-003
0.0000 66.73070.0248 0.0248 0.0248 0.0248Total 0.2894 0.3542 0.4783 7.8000e-004
0.0000 66.6398 66.6398 3.6400e-003
0.0000 66.73070.0248 0.0248 0.0248 0.0248Off-Road 0.0155 0.3542 0.4783 7.8000e-004
0.0000 0.0000 0.0000 0.0000 0.0000 0.00000.0000 0.0000 0.0000 0.0000Archit. Coating 0.2739
Total CO2 CH4 N2O CO2e
Category tons/yr MT/yr
PM10 Total
Fugitive PM2.5
Exhaust PM2.5
PM2.5 Total
Bio- CO2 NBio- CO2
Mitigated Construction On-Site
ROG NOx CO SO2 Fugitive PM10
Exhaust PM10
0.0000 3.0088 3.0088 7.0000e-005
0.0000 3.01054.1900e-003
3.0000e-005
4.2100e-003
1.1100e-003
2.0000e-005
1.1400e-003
Total 1.4200e-003
8.5000e-004
9.2000e-003
3.0000e-005
0.0000 3.0088 3.0088 7.0000e-005
0.0000 3.01054.1900e-003
3.0000e-005
4.2100e-003
1.1100e-003
2.0000e-005
1.1400e-003
Worker 1.4200e-003
8.5000e-004
9.2000e-003
3.0000e-005
0.0000 0.0000 0.0000 0.0000 0.0000 0.00000.0000 0.0000 0.0000 0.0000 0.0000 0.0000Vendor 0.0000 0.0000 0.0000 0.0000
0.0000 0.0000 0.0000 0.0000 0.0000 0.00000.0000 0.0000 0.0000 0.0000 0.0000 0.0000Hauling 0.0000 0.0000 0.0000 0.0000
Category tons/yr MT/yr

0.024839 0.001931 0.001783 0.005765 0.000770 0.000908
SBUS MH
Industrial Park 0.611343 0.038414 0.178161 0.100214 0.013382 0.005338 0.017151
LHD2 MHD HHD OBUS UBUS MCYLand Use LDA LDT1 LDT2 MDV LHD1
28.00 13.00 79 19 2
4.4 Fleet Mix
H-S or C-C H-O or C-NW Primary Diverted Pass-by
Industrial Park 9.50 7.30 7.30 59.00
4.3 Trip Type Information
Miles Trip % Trip Purpose %
Land Use H-W or C-W H-S or C-C H-O or C-NW H-W or C-W
Total 326.54 119.05 34.90 669,188 669,188
Annual VMT
Industrial Park 326.54 119.05 34.90 669,188 669,188
4.2 Trip Summary Information
Average Daily Trip Rate Unmitigated MitigatedLand Use Weekday Saturday Sunday Annual VMT
0.0000 231.1635 231.1635 0.0114 0.0000 231.44860.2521 1.9400e-003
0.2540 0.0675 1.8100e-003
0.0693Unmitigated 0.0558 0.2307 0.6534 2.4900e-003
0.0000 231.1635 231.1635 0.0114 0.0000 231.44860.2521 1.9400e-003
0.2540 0.0675 1.8100e-003
0.0693Mitigated 0.0558 0.2307 0.6534 2.4900e-003
NBio- CO2 Total CO2 CH4 N2O CO2e
Category tons/yr MT/yr
Exhaust PM10
PM10 Total
Fugitive PM2.5
Exhaust PM2.5
PM2.5 Total
Bio- CO2
4.0 Operational Detail - Mobile
4.1 Mitigation Measures Mobile
ROG NOx CO SO2 Fugitive PM10
0.0000 3.0088 3.0088 7.0000e-005
0.0000 3.01054.1900e-003
3.0000e-005
4.2100e-003
1.1100e-003
2.0000e-005
1.1400e-003
Total 1.4200e-003
8.5000e-004
9.2000e-003
3.0000e-005

51.7186 9.9000e-004
9.5000e-004
52.02593.6100e-003
3.6100e-003
3.6100e-003
0.0000 51.7186
52.0259
Total 5.2300e-003
0.0475 0.0399 2.9000e-004
3.6100e-003
3.6100e-003
0.0000 51.7186 51.7186 9.9000e-004
9.5000e-004
2.9000e-004
3.6100e-003
3.6100e-003
3.6100e-003
Industrial Park 969170 5.2300e-003
0.0475 0.0399
NBio- CO2 Total CO2 CH4 N2O CO2e
Land Use kBTU/yr tons/yr MT/yr
Exhaust PM10
PM10 Total
Fugitive PM2.5
Exhaust PM2.5
PM2.5 Total
Bio- CO2
5.2 Energy by Land Use - NaturalGasUnmitigated
NaturalGas Use
ROG NOx CO SO2 Fugitive PM10
0.0000 51.7186 51.7186 9.9000e-004
9.5000e-004
52.02593.6100e-003
3.6100e-003
3.6100e-003
3.6100e-003
NaturalGas Unmitigated
5.2300e-003
0.0475 0.0399 2.9000e-004
0.0000 51.7186 51.7186 9.9000e-004
9.5000e-004
52.02593.6100e-003
3.6100e-003
3.6100e-003
3.6100e-003
NaturalGas Mitigated
5.2300e-003
0.0475 0.0399 2.9000e-004
0.0000 215.0097 215.0097 8.6500e-003
1.7900e-003
215.75970.0000 0.0000 0.0000 0.0000Electricity Unmitigated
0.0000 215.0097 215.0097 8.6500e-003
1.7900e-003
215.75970.0000 0.0000 0.0000 0.0000Electricity Mitigated
NBio- CO2 Total CO2 CH4 N2O CO2e
Category tons/yr MT/yr
Exhaust PM10
PM10 Total
Fugitive PM2.5
Exhaust PM2.5
PM2.5 Total
Bio- CO2
5.0 Energy Detail
Historical Energy Use: N
5.1 Mitigation Measures Energy
ROG NOx CO SO2 Fugitive PM10
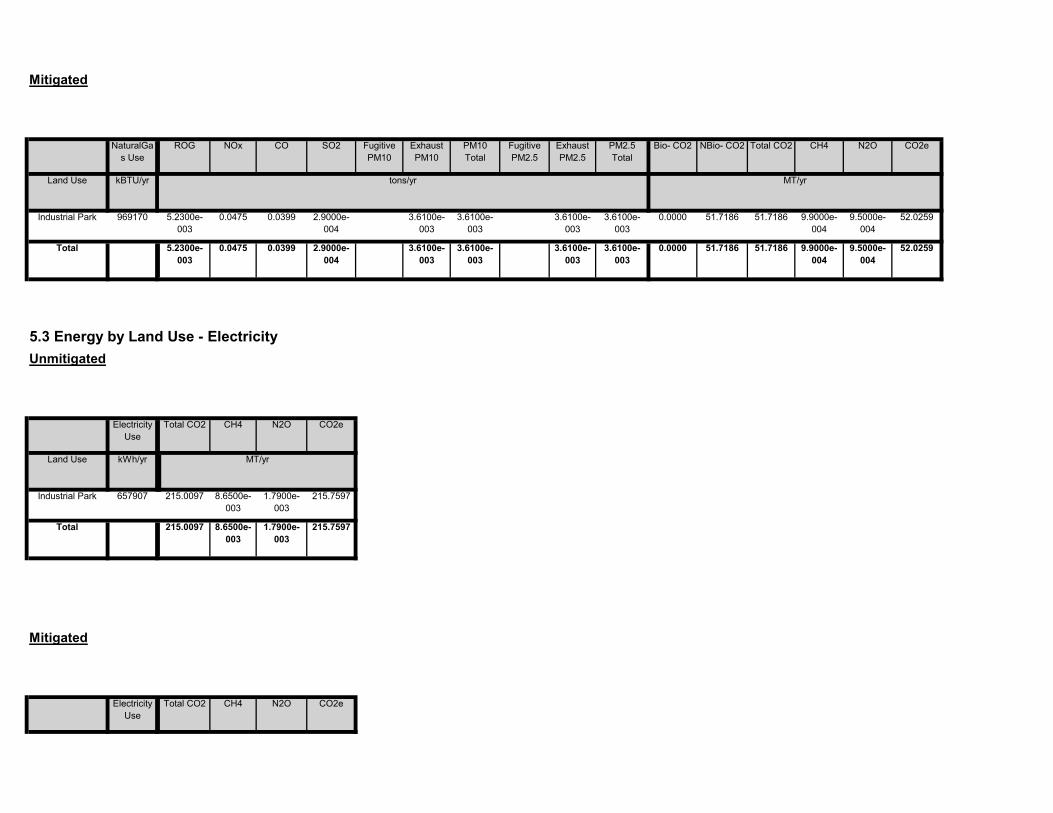
Mitigated
Electricity Use
Total CO2 CH4 N2O CO2e
215.7597
Total 215.0097 8.6500e-003
1.7900e-003
215.7597
Land Use kWh/yr ton
MT/yr
Industrial Park 657907 215.0097 8.6500e-003
1.7900e-003
Unmitigated
Electricity Use
Total CO2 CH4 N2O CO2e
51.7186 51.7186 9.9000e-004
9.5000e-004
52.0259
5.3 Energy by Land Use - Electricity
3.6100e-003
3.6100e-003
3.6100e-003
3.6100e-003
0.0000
9.5000e-004
52.0259
Total 5.2300e-003
0.0475 0.0399 2.9000e-004
3.6100e-003
3.6100e-003
0.0000 51.7186 51.7186 9.9000e-004
0.0399 2.9000e-004
3.6100e-003
3.6100e-003
CO2e
Land Use kBTU/yr tons/yr MT/yr
Industrial Park 969170 5.2300e-003
0.0475
PM2.5 Total
Bio- CO2 NBio- CO2 Total CO2 CH4 N2OSO2 Fugitive PM10
Exhaust PM10
PM10 Total
Fugitive PM2.5
Exhaust PM2.5
NaturalGas Use
ROG NOx CO
Mitigated

0.0000 0.0000 0.0000 0.0000 0.0000 0.00000.0000 0.0000 0.0000 0.0000Architectural Coating
0.0000
Total CO2 CH4 N2O CO2e
SubCategory tons/yr MT/yr
PM10 Total
Fugitive PM2.5
Exhaust PM2.5
PM2.5 Total
Bio- CO2 NBio- CO2
6.2 Area by SubCategoryUnmitigated
ROG NOx CO SO2 Fugitive PM10
Exhaust PM10
0.0000 8.5000e-004
8.5000e-004
0.0000 0.0000 9.1000e-004
0.0000 0.0000 0.0000 0.0000Unmitigated 0.1868 0.0000 4.4000e-004
0.0000
0.0000 8.5000e-004
8.5000e-004
0.0000 0.0000 9.1000e-004
0.0000 0.0000 0.0000 0.0000Mitigated 0.1868 0.0000 4.4000e-004
0.0000
NBio- CO2 Total CO2 CH4 N2O CO2e
Category tons/yr MT/yr
Exhaust PM10
PM10 Total
Fugitive PM2.5
Exhaust PM2.5
PM2.5 Total
Bio- CO2
6.0 Area Detail
6.1 Mitigation Measures Area
ROG NOx CO SO2 Fugitive PM10
215.7597
Total 215.0097 8.6500e-003
1.7900e-003
215.7597
Land Use kWh/yr ton
MT/yr
Industrial Park 657907 215.0097 8.6500e-003
1.7900e-003

Unmitigated 50.5553 0.3622 8.9000e-003
62.2609
Category ton
MT/yr
Mitigated 50.5553 0.3622 8.9000e-003
62.2609
7.0 Water Detail
7.1 Mitigation Measures Water
Total CO2 CH4 N2O CO2e
0.0000 8.5000e-004
8.5000e-004
0.0000 0.0000 9.1000e-004
0.0000 0.0000 0.0000 0.0000Total 0.1868 0.0000 4.4000e-004
0.0000
0.0000 8.5000e-004
8.5000e-004
0.0000 0.0000 9.1000e-004
0.0000 0.0000 0.0000 0.0000Landscaping 4.0000e-005
0.0000 4.4000e-004
0.0000
0.0000 0.0000 0.0000 0.0000 0.0000 0.00000.0000 0.0000 0.0000 0.0000Consumer Products
0.1867
0.0000 0.0000 0.0000 0.0000 0.0000 0.00000.0000 0.0000 0.0000 0.0000Architectural Coating
0.0000
Total CO2 CH4 N2O CO2e
SubCategory tons/yr MT/yr
PM10 Total
Fugitive PM2.5
Exhaust PM2.5
PM2.5 Total
Bio- CO2 NBio- CO2
Mitigated
ROG NOx CO SO2 Fugitive PM10
Exhaust PM10
0.0000 8.5000e-004
8.5000e-004
0.0000 0.0000 9.1000e-004
0.0000 0.0000 0.0000 0.0000Total 0.1868 0.0000 4.4000e-004
0.0000
0.0000 8.5000e-004
8.5000e-004
0.0000 0.0000 9.1000e-004
0.0000 0.0000 0.0000 0.0000Landscaping 4.0000e-005
0.0000 4.4000e-004
0.0000
0.0000 0.0000 0.0000 0.0000 0.0000 0.00000.0000 0.0000 0.0000 0.0000Consumer Products
0.1867

8.0 Waste Detail
8.1 Mitigation Measures Waste
62.2609
Total 50.5553 0.3622 8.9000e-003
62.2609
Land Use Mgal ton
MT/yr
Industrial Park 11.0561 / 0 50.5553 0.3622 8.9000e-003
Mitigated
Indoor/Outdoor Use
Total CO2 CH4 N2O CO2e
62.2609
Total 50.5553 0.3622 8.9000e-003
62.2609
Land Use Mgal ton
MT/yr
Industrial Park 11.0561 / 0 50.5553 0.3622 8.9000e-003
7.2 Water by Land UseUnmitigated
Indoor/Outdoor Use
Total CO2 CH4 N2O CO2e

Land Use tons ton
MT/yr
Mitigated
Waste Disposed
Total CO2 CH4 N2O CO2e
29.8120
Total 12.0333 0.7112 0.0000 29.8120
Land Use tons ton
MT/yr
Industrial Park 59.28 12.0333 0.7112 0.0000
8.2 Waste by Land UseUnmitigated
Waste Disposed
Total CO2 CH4 N2O CO2e
Unmitigated 12.0333 0.7112 0.0000 29.8120
ton
MT/yr
Mitigated 12.0333 0.7112 0.0000 29.8120
Category/Year
Total CO2 CH4 N2O CO2e
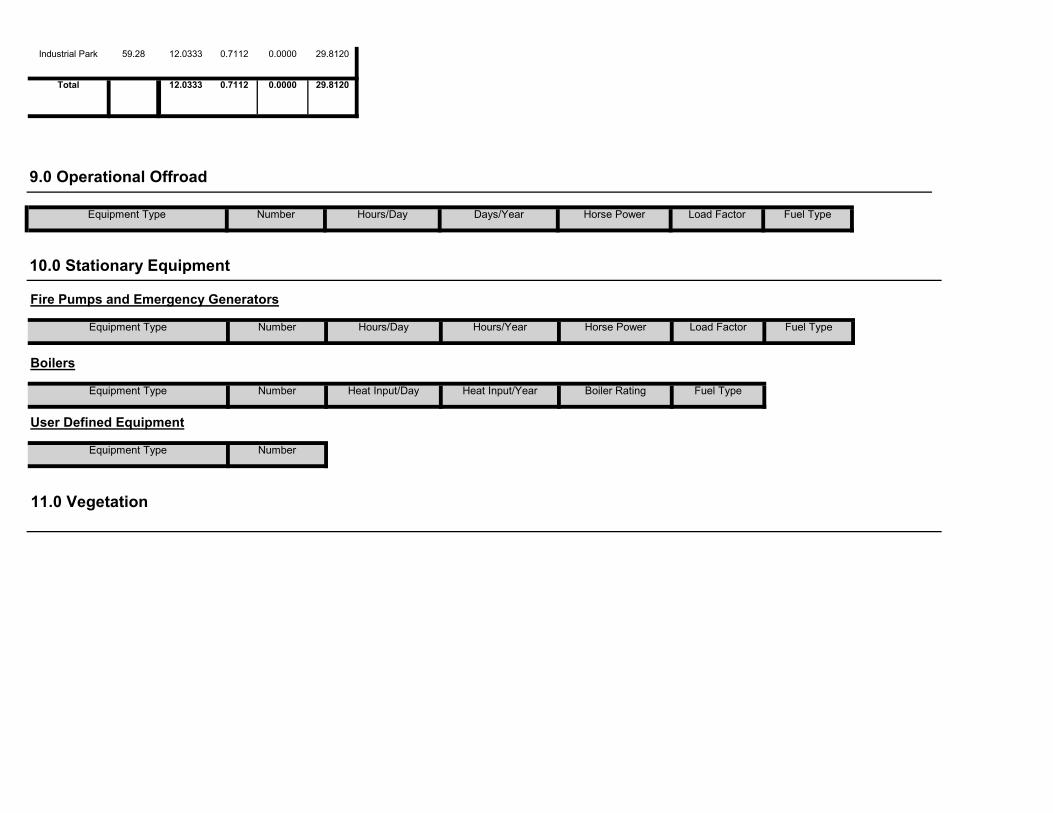
User Defined Equipment
Equipment Type Number
11.0 Vegetation
Fuel Type
Boilers
Equipment Type Number Heat Input/Day Heat Input/Year Boiler Rating Fuel Type
Load Factor Fuel Type
10.0 Stationary Equipment
Fire Pumps and Emergency Generators
Equipment Type Number Hours/Day Hours/Year Horse Power Load Factor
9.0 Operational Offroad
Equipment Type Number Hours/Day Days/Year Horse Power
29.8120
Total 12.0333 0.7112 0.0000 29.8120
Industrial Park 59.28 12.0333 0.7112 0.0000

tblAreaCoating Area_Nonresidential_Exterior 23907 0
tblAreaCoating Area_Nonresidential_Interior 71720 0
tblArchitecturalCoating EF_Residential_Interior 250.00 50.00
tblAreaCoating Area_EF_Parking 250 0
tblArchitecturalCoating EF_Parking 250.00 100.00
tblArchitecturalCoating EF_Residential_Exterior 250.00 100.00
tblArchitecturalCoating EF_Nonresidential_Exterior 250.00 100.00
tblArchitecturalCoating EF_Nonresidential_Interior 250.00 50.00
1.3 User Entered Comments & Non-Default Data
Architectural Coating - Rule 67.0.1 coatings
Table Name Column Name Default Value New Value
CO2 Intensity (lb/MWhr)
720.49 CH4 Intensity (lb/MWhr)
0.029 N2O Intensity (lb/MWhr)
0.006
40
Climate Zone 13 Operational Year 2027
Utility Company San Diego Gas & Electric
1.2 Other Project Characteristics
Urbanization Urban Wind Speed (m/s) 2.6 Precipitation Freq (Days)
Floor Surface Area Population
Industrial Park 47.81 1000sqft 4.00 47,813.00 0
1.0 Project Characteristics
1.1 Land Usage
Land Uses Size Metric Lot Acreage
CalEEMod Version: CalEEMod.2016.3.1 Page 1 of 1 Date: 10/24/2016 3:49 PM
East Otay Mesa Specific Plan Amendment Construction Phase 10 - San Diego Air Basin, Annual
East Otay Mesa Specific Plan Amendment Construction Phase 10San Diego Air Basin, Annual
tblLandUse BuildingSpaceSquareFeet 47,810.00 47,813.00
tblLandUse LandUseSquareFeet 47,810.00 47,813.00
tblConstructionPhase NumDays 230.00 262.00
tblConstructionPhase NumDays 18.00 262.00
tblConstEquipMitigation Tier No Change Tier 3
tblConstructionPhase NumDays 18.00 132.00
tblConstEquipMitigation Tier No Change Tier 3
tblConstEquipMitigation Tier No Change Tier 3
tblConstEquipMitigation Tier No Change Tier 3
tblConstEquipMitigation Tier No Change Tier 3
tblConstEquipMitigation Tier No Change Tier 3
tblConstEquipMitigation Tier No Change Tier 3
tblConstEquipMitigation Tier No Change Tier 3
tblConstEquipMitigation Tier No Change Tier 3
tblConstEquipMitigation NumberOfEquipmentMitigated 0.00 2.00
tblConstEquipMitigation Tier No Change Tier 3
tblConstEquipMitigation NumberOfEquipmentMitigated 0.00 2.00
tblConstEquipMitigation NumberOfEquipmentMitigated 0.00 8.00
tblConstEquipMitigation NumberOfEquipmentMitigated 0.00 2.00
tblConstEquipMitigation NumberOfEquipmentMitigated 0.00 2.00
tblConstEquipMitigation NumberOfEquipmentMitigated 0.00 6.00
tblConstEquipMitigation NumberOfEquipmentMitigated 0.00 2.00
tblConstEquipMitigation NumberOfEquipmentMitigated 0.00 2.00
tblConstEquipMitigation NumberOfEquipmentMitigated 0.00 2.00
tblConstDustMitigation WaterUnpavedRoadVehicleSpeed 40 15
tblConstEquipMitigation NumberOfEquipmentMitigated 0.00 2.00
tblAreaMitigation UseLowVOCPaintResidentialExteriorValue
250 0
tblAreaMitigation UseLowVOCPaintResidentialInteriorValue
250 0
tblAreaMitigation UseLowVOCPaintNonresidentialExteriorValue
250 0
tblAreaMitigation UseLowVOCPaintNonresidentialInteriorValue
250 0

Mitigated Construction
0.0000 1,028.9663
1,028.9663 0.2421 0.0000 1,035.0185
0.0582 0.2127 0.2709 0.0156 0.1998 0.2154Maximum 0.8372 4.9669 7.0122 0.0119
0.0000 1,028.9663
1,028.9663 0.2421 0.0000 1,035.0185
0.0582 0.2127 0.2709 0.0156 0.1998 0.21542027 0.8372 4.9669 7.0122 0.0119
CH4 N2O CO2e
Year tons/yr MT/yr
Fugitive PM2.5
Exhaust PM2.5
PM2.5 Total
Bio- CO2 NBio- CO2 Total CO2
Unmitigated Construction
ROG NOx CO SO2 Fugitive PM10
Exhaust PM10
PM10 Total
tblProjectCharacteristics OperationalYear 2018 2027
2.0 Emissions Summary
2.1 Overall Construction
tblOffRoadEquipment OffRoadEquipmentUnitAmount 1.00 2.00
tblOffRoadEquipment OffRoadEquipmentUnitAmount 1.00 2.00
tblOffRoadEquipment OffRoadEquipmentUnitAmount 1.00 2.00
tblOffRoadEquipment OffRoadEquipmentUnitAmount 3.00 6.00
tblOffRoadEquipment OffRoadEquipmentUnitAmount 3.00 6.00
tblOffRoadEquipment OffRoadEquipmentUnitAmount 1.00 2.00
tblOffRoadEquipment OffRoadEquipmentUnitAmount 1.00 2.00
tblOffRoadEquipment OffRoadEquipmentUnitAmount 1.00 2.00
tblOffRoadEquipment HorsePower 130.00 125.00
tblOffRoadEquipment HorsePower 132.00 130.00
tblLandUse LotAcreage 1.10 4.00
tblOffRoadEquipment HorsePower 231.00 226.00

0.0000 225.0127 225.0127 0.0111 0.0000 225.28890.2521 1.8400e-003
0.2539 0.0675 1.7100e-003
0.0692Mobile 0.0535 0.2237 0.6257 2.4300e-003
0.0000 266.7283 266.7283 9.6500e-003
2.7400e-003
267.78563.6100e-003
3.6100e-003
3.6100e-003
3.6100e-003
Energy 5.2300e-003
0.0475 0.0399 2.9000e-004
0.0000 8.5000e-004
8.5000e-004
0.0000 0.0000 9.1000e-004
0.0000 0.0000 0.0000 0.0000Area 0.1868 0.0000 4.4000e-004
0.0000
Total CO2 CH4 N2O CO2e
Category tons/yr MT/yr
PM10 Total
Fugitive PM2.5
Exhaust PM2.5
PM2.5 Total
Bio- CO2 NBio- CO2
2.2 Overall OperationalUnmitigated Operational
ROG NOx CO SO2 Fugitive PM10
Exhaust PM10
44 7-24-2027 9-30-2027 1.0798 1.1867
Highest 1.4451 1.5881
42 1-24-2027 4-23-2027 1.4139 1.5538
43 4-24-2027 7-23-2027 1.4451 1.5881
Quarter Start Date End Date Maximum Unmitigated ROG + NOX (tons/quarter) Maximum Mitigated ROG + NOX (tons/quarter)
41 10-24-2026 1-23-2027 0.3654 0.4016
0.00 0.00 0.00 0.00 0.00 0.000.00 -68.14 -53.50 0.00 -78.95 -73.22
NBio-CO2 Total CO2 CH4 N20 CO2e
Percent Reduction
32.63 -17.06 -10.50 0.00
Exhaust PM10
PM10 Total
Fugitive PM2.5
Exhaust PM2.5
PM2.5 Total
Bio- CO2ROG NOx CO SO2 Fugitive PM10
0.0000 1,028.9652
1,028.9652 0.2421 0.0000 1,035.0173
0.0582 0.3576 0.4158 0.0156 0.3575 0.3732Maximum 0.5641 5.8143 7.7488 0.0119
0.0000 1,028.9652
1,028.9652 0.2421 0.0000 1,035.0173
0.0582 0.3576 0.4158 0.0156 0.3575 0.37322027 0.5641 5.8143 7.7488 0.0119
Total CO2 CH4 N2O CO2e
Year tons/yr MT/yr
PM10 Total
Fugitive PM2.5
Exhaust PM2.5
PM2.5 Total
Bio- CO2 NBio- CO2ROG NOx CO SO2 Fugitive PM10
Exhaust PM10

262
2 Paving Paving 1/1/2027 12/31/2027 5 262
End Date Num Days Week
Num Days Phase Description
1 Building Construction Building Construction 1/1/2027 12/31/2027 5
3.0 Construction Detail
Construction Phase
Phase Number
Phase Name Phase Type Start Date
0.00 0.00 0.00 0.00 0.00 0.000.00 0.00 0.00 0.00 0.00 0.00
NBio-CO2 Total CO2 CH4 N20 CO2e
Percent Reduction
0.00 0.00 0.00 0.00
Exhaust PM10
PM10 Total
Fugitive PM2.5
Exhaust PM2.5
PM2.5 Total
Bio- CO2ROG NOx CO SO2 Fugitive PM10
15.5409 538.7896 554.3305 1.0940 0.0116 585.14830.2521 5.4500e-003
0.2575 0.0675 5.3200e-003
0.0728Total 0.2455 0.2712 0.6660 2.7200e-003
3.5076 47.0477 50.5553 0.3622 8.9000e-003
62.26090.0000 0.0000 0.0000 0.0000Water
12.0333 0.0000 12.0333 0.7112 0.0000 29.81200.0000 0.0000 0.0000 0.0000Waste
0.0000 225.0127 225.0127 0.0111 0.0000 225.28890.2521 1.8400e-003
0.2539 0.0675 1.7100e-003
0.0692Mobile 0.0535 0.2237 0.6257 2.4300e-003
0.0000 266.7283 266.7283 9.6500e-003
2.7400e-003
267.78563.6100e-003
3.6100e-003
3.6100e-003
3.6100e-003
Energy 5.2300e-003
0.0475 0.0399 2.9000e-004
0.0000 8.5000e-004
8.5000e-004
0.0000 0.0000 9.1000e-004
0.0000 0.0000 0.0000 0.0000Area 0.1868 0.0000 4.4000e-004
0.0000
Total CO2 CH4 N2O CO2e
Category tons/yr MT/yr
PM10 Total
Fugitive PM2.5
Exhaust PM2.5
PM2.5 Total
Bio- CO2 NBio- CO2
Mitigated Operational
ROG NOx CO SO2 Fugitive PM10
Exhaust PM10
15.5409 538.7896 554.3305 1.0940 0.0116 585.14830.2521 5.4500e-003
0.2575 0.0675 5.3200e-003
0.0728Total 0.2455 0.2712 0.6660 2.7200e-003
3.5076 47.0477 50.5553 0.3622 8.9000e-003
62.26090.0000 0.0000 0.0000 0.0000Water
12.0333 0.0000 12.0333 0.7112 0.0000 29.81200.0000 0.0000 0.0000 0.0000Waste

Use Cleaner Engines for Construction Equipment
7.30 20.00 LD_Mix HDT_Mix HHDT
3.1 Mitigation Measures Construction
Architectural Coating 2 4.00 0.00 0.00 10.80
10.80 7.30 20.00 LD_Mix HDT_Mix HHDT
7.30 20.00 LD_Mix HDT_Mix HHDT
Paving 10 25.00 0.00 0.00
Building Construction 18 20.00 8.00 0.00 10.80
Worker Trip Length
Vendor Trip Length
Hauling Trip Length
Worker Vehicle Class
Vendor Vehicle Class
Hauling Vehicle Class
Trips and VMT
Phase Name Offroad Equipment Count
Worker Trip Number
Vendor Trip Number
Hauling Trip Number
Architectural Coating Air Compressors 2 6.00 78 0.48
Paving Tractors/Loaders/Backhoes 2 8.00 97 0.37
Paving Rollers 2 6.00 80 0.38
Paving Paving Equipment 2 6.00 130 0.36
Paving Pavers 2 8.00 125 0.42
Paving Cement and Mortar Mixers 2 6.00 9 0.56
Building Construction Welders 2 8.00 46 0.45
Building Construction Tractors/Loaders/Backhoes 6 7.00 97 0.37
Building Construction Generator Sets 2 8.00 84 0.74
Building Construction Forklifts 6 8.00 89 0.20
Load Factor
Building Construction Cranes 2 7.00 226 0.29
OffRoad Equipment
Phase Name Offroad Equipment Type Amount Usage Hours Horse Power
132
Acres of Grading (Site Preparation Phase): 0
Acres of Grading (Grading Phase): 0
Acres of Paving: 0
Residential Indoor: 0; Residential Outdoor: 0; Non-Residential Indoor: 71,720; Non-Residential Outdoor: 23,907; Striped Parking Area: 0
3 Architectural Coating Architectural Coating 1/1/2027 12/31/2027 5

Mitigated Construction On-Site
0.0000 40.2828 40.2828 2.0400e-003
0.0000 40.33390.0279 2.2000e-004
0.0281 7.5600e-003
2.0000e-004
7.7600e-003
Total 8.8500e-003
0.0791 0.0662 4.2000e-004
0.0000 14.5399 14.5399 3.2000e-004
0.0000 14.54810.0209 1.3000e-004
0.0211 5.5600e-003
1.2000e-004
5.6800e-003
Worker 6.7800e-003
3.9600e-003
0.0434 1.6000e-004
0.0000 25.7429 25.7429 1.7200e-003
0.0000 25.78586.9300e-003
9.0000e-005
7.0100e-003
2.0000e-003
8.0000e-005
2.0800e-003
Vendor 2.0700e-003
0.0752 0.0228 2.6000e-004
0.0000 0.0000 0.0000 0.0000 0.0000 0.00000.0000 0.0000 0.0000 0.0000 0.0000 0.0000Hauling 0.0000 0.0000 0.0000 0.0000
Total CO2 CH4 N2O CO2e
Category tons/yr MT/yr
PM10 Total
Fugitive PM2.5
Exhaust PM2.5
PM2.5 Total
Bio- CO2 NBio- CO2
Unmitigated Construction Off-Site
ROG NOx CO SO2 Fugitive PM10
Exhaust PM10
0.0000 602.8038 602.8038 0.1415 0.0000 606.34080.1370 0.1370 0.1289 0.1289Total 0.3553 3.2389 4.1895 7.0100e-003
0.0000 602.8038 602.8038 0.1415 0.0000 606.34080.1370 0.1370 0.1289 0.1289
CO2e
Category tons/yr MT/yr
Off-Road 0.3553 3.2389 4.1895 7.0100e-003
PM2.5 Total
Bio- CO2 NBio- CO2 Total CO2 CH4 N2OSO2 Fugitive PM10
Exhaust PM10
PM10 Total
Fugitive PM2.5
Exhaust PM2.5
Water Exposed Area
Reduce Vehicle Speed on Unpaved Roads
3.2 Building Construction - 2027Unmitigated Construction On-Site
ROG NOx CO

Total CO2 CH4 N2O CO2e
Category tons/yr MT/yr
PM10 Total
Fugitive PM2.5
Exhaust PM2.5
PM2.5 Total
Bio- CO2 NBio- CO2
3.3 Paving - 2027Unmitigated Construction On-Site
ROG NOx CO SO2 Fugitive PM10
Exhaust PM10
0.0000 40.2828 40.2828 2.0400e-003
0.0000 40.33390.0279 2.2000e-004
0.0281 7.5600e-003
2.0000e-004
7.7600e-003
Total 8.8500e-003
0.0791 0.0662 4.2000e-004
0.0000 14.5399 14.5399 3.2000e-004
0.0000 14.54810.0209 1.3000e-004
0.0211 5.5600e-003
1.2000e-004
5.6800e-003
Worker 6.7800e-003
3.9600e-003
0.0434 1.6000e-004
0.0000 25.7429 25.7429 1.7200e-003
0.0000 25.78586.9300e-003
9.0000e-005
7.0100e-003
2.0000e-003
8.0000e-005
2.0800e-003
Vendor 2.0700e-003
0.0752 0.0228 2.6000e-004
0.0000 0.0000 0.0000 0.0000 0.0000 0.00000.0000 0.0000 0.0000 0.0000 0.0000 0.0000Hauling 0.0000 0.0000 0.0000 0.0000
Total CO2 CH4 N2O CO2e
Category tons/yr MT/yr
PM10 Total
Fugitive PM2.5
Exhaust PM2.5
PM2.5 Total
Bio- CO2 NBio- CO2
Mitigated Construction Off-Site
ROG NOx CO SO2 Fugitive PM10
Exhaust PM10
0.0000 602.8031 602.8031 0.1415 0.0000 606.34000.2353 0.2353 0.2353 0.2353Total 0.1752 3.6995 4.6499 7.0100e-003
0.0000 602.8031 602.8031 0.1415 0.0000 606.34000.2353 0.2353 0.2353 0.2353Off-Road 0.1752 3.6995 4.6499 7.0100e-003
Total CO2 CH4 N2O CO2e
Category tons/yr MT/yr
PM10 Total
Fugitive PM2.5
Exhaust PM2.5
PM2.5 Total
Bio- CO2 NBio- CO2ROG NOx CO SO2 Fugitive PM10
Exhaust PM10

0.0000 298.1565 298.1565 0.0945 0.0000 300.51800.0970 0.0970 0.0970 0.0970Total 0.0808 1.6758 2.4916 3.4300e-003
0.0000 0.0000 0.0000 0.0000 0.0000 0.00000.0000 0.0000 0.0000 0.0000Paving 0.0000
0.0000 298.1565 298.1565 0.0945 0.0000 300.51800.0970 0.0970 0.0970 0.0970Off-Road 0.0808 1.6758 2.4916 3.4300e-003
Total CO2 CH4 N2O CO2e
Category tons/yr MT/yr
PM10 Total
Fugitive PM2.5
Exhaust PM2.5
PM2.5 Total
Bio- CO2 NBio- CO2
Mitigated Construction On-Site
ROG NOx CO SO2 Fugitive PM10
Exhaust PM10
0.0000 18.1749 18.1749 4.1000e-004
0.0000 18.18510.0262 1.6000e-004
0.0263 6.9500e-003
1.4000e-004
7.1000e-003
Total 8.4800e-003
4.9400e-003
0.0542 2.0000e-004
0.0000 18.1749 18.1749 4.1000e-004
0.0000 18.18510.0262 1.6000e-004
0.0263 6.9500e-003
1.4000e-004
7.1000e-003
Worker 8.4800e-003
4.9400e-003
0.0542 2.0000e-004
0.0000 0.0000 0.0000 0.0000 0.0000 0.00000.0000 0.0000 0.0000 0.0000 0.0000 0.0000Vendor 0.0000 0.0000 0.0000 0.0000
0.0000 0.0000 0.0000 0.0000 0.0000 0.00000.0000 0.0000 0.0000 0.0000 0.0000 0.0000Hauling 0.0000 0.0000 0.0000 0.0000
Total CO2 CH4 N2O CO2e
Category tons/yr MT/yr
PM10 Total
Fugitive PM2.5
Exhaust PM2.5
PM2.5 Total
Bio- CO2 NBio- CO2
Unmitigated Construction Off-Site
ROG NOx CO SO2 Fugitive PM10
Exhaust PM10
0.0000 298.1569 298.1569 0.0945 0.0000 300.51840.0618 0.0618 0.0571 0.0571Total 0.1447 1.3441 2.2215 3.4300e-003
0.0000 0.0000 0.0000 0.0000 0.0000 0.00000.0000 0.0000 0.0000 0.0000Paving 0.0000
0.0000 298.1569 298.1569 0.0945 0.0000 300.51840.0618 0.0618 0.0571 0.0571Off-Road 0.1447 1.3441 2.2215 3.4300e-003

Total CO2 CH4 N2O CO2ePM10 Total
Fugitive PM2.5
Exhaust PM2.5
PM2.5 Total
Bio- CO2 NBio- CO2
Unmitigated Construction Off-Site
ROG NOx CO SO2 Fugitive PM10
Exhaust PM10
0.0000 66.6399 66.6399 3.6400e-003
0.0000 66.73080.0134 0.0134 0.0134 0.0134Total 0.3185 0.2990 0.4722 7.8000e-004
0.0000 66.6399 66.6399 3.6400e-003
0.0000 66.73080.0134 0.0134 0.0134 0.0134Off-Road 0.0446 0.2990 0.4722 7.8000e-004
0.0000 0.0000 0.0000 0.0000 0.0000 0.00000.0000 0.0000 0.0000 0.0000Archit. Coating 0.2739
Total CO2 CH4 N2O CO2e
Category tons/yr MT/yr
PM10 Total
Fugitive PM2.5
Exhaust PM2.5
PM2.5 Total
Bio- CO2 NBio- CO2
3.4 Architectural Coating - 2027Unmitigated Construction On-Site
ROG NOx CO SO2 Fugitive PM10
Exhaust PM10
0.0000 18.1749 18.1749 4.1000e-004
0.0000 18.18510.0262 1.6000e-004
0.0263 6.9500e-003
1.4000e-004
7.1000e-003
Total 8.4800e-003
4.9400e-003
0.0542 2.0000e-004
0.0000 18.1749 18.1749 4.1000e-004
0.0000 18.18510.0262 1.6000e-004
0.0263 6.9500e-003
1.4000e-004
7.1000e-003
Worker 8.4800e-003
4.9400e-003
0.0542 2.0000e-004
0.0000 0.0000 0.0000 0.0000 0.0000 0.00000.0000 0.0000 0.0000 0.0000 0.0000 0.0000Vendor 0.0000 0.0000 0.0000 0.0000
0.0000 0.0000 0.0000 0.0000 0.0000 0.00000.0000 0.0000 0.0000 0.0000 0.0000 0.0000Hauling 0.0000 0.0000 0.0000 0.0000
Total CO2 CH4 N2O CO2e
Category tons/yr MT/yr
PM10 Total
Fugitive PM2.5
Exhaust PM2.5
PM2.5 Total
Bio- CO2 NBio- CO2
Mitigated Construction Off-Site
ROG NOx CO SO2 Fugitive PM10
Exhaust PM10

0.0000 2.9080 2.9080 6.0000e-005
0.0000 2.90964.1900e-003
3.0000e-005
4.2100e-003
1.1100e-003
2.0000e-005
1.1400e-003
Worker 1.3600e-003
7.9000e-004
8.6700e-003
3.0000e-005
0.0000 0.0000 0.0000 0.0000 0.0000 0.00000.0000 0.0000 0.0000 0.0000 0.0000 0.0000Vendor 0.0000 0.0000 0.0000 0.0000
0.0000 0.0000 0.0000 0.0000 0.0000 0.00000.0000 0.0000 0.0000 0.0000 0.0000 0.0000Hauling 0.0000 0.0000 0.0000 0.0000
Total CO2 CH4 N2O CO2e
Category tons/yr MT/yr
PM10 Total
Fugitive PM2.5
Exhaust PM2.5
PM2.5 Total
Bio- CO2 NBio- CO2
Mitigated Construction Off-Site
ROG NOx CO SO2 Fugitive PM10
Exhaust PM10
0.0000 66.6398 66.6398 3.6400e-003
0.0000 66.73070.0248 0.0248 0.0248 0.0248Total 0.2894 0.3542 0.4783 7.8000e-004
0.0000 66.6398 66.6398 3.6400e-003
0.0000 66.73070.0248 0.0248 0.0248 0.0248Off-Road 0.0155 0.3542 0.4783 7.8000e-004
0.0000 0.0000 0.0000 0.0000 0.0000 0.00000.0000 0.0000 0.0000 0.0000Archit. Coating 0.2739
Total CO2 CH4 N2O CO2e
Category tons/yr MT/yr
PM10 Total
Fugitive PM2.5
Exhaust PM2.5
PM2.5 Total
Bio- CO2 NBio- CO2
Mitigated Construction On-Site
ROG NOx CO SO2 Fugitive PM10
Exhaust PM10
0.0000 2.9080 2.9080 6.0000e-005
0.0000 2.90964.1900e-003
3.0000e-005
4.2100e-003
1.1100e-003
2.0000e-005
1.1400e-003
Total 1.3600e-003
7.9000e-004
8.6700e-003
3.0000e-005
0.0000 2.9080 2.9080 6.0000e-005
0.0000 2.90964.1900e-003
3.0000e-005
4.2100e-003
1.1100e-003
2.0000e-005
1.1400e-003
Worker 1.3600e-003
7.9000e-004
8.6700e-003
3.0000e-005
0.0000 0.0000 0.0000 0.0000 0.0000 0.00000.0000 0.0000 0.0000 0.0000 0.0000 0.0000Vendor 0.0000 0.0000 0.0000 0.0000
0.0000 0.0000 0.0000 0.0000 0.0000 0.00000.0000 0.0000 0.0000 0.0000 0.0000 0.0000Hauling 0.0000 0.0000 0.0000 0.0000
Category tons/yr MT/yr

0.024998 0.001928 0.001754 0.005717 0.000774 0.000870
SBUS MH
Industrial Park 0.613162 0.038013 0.177872 0.099323 0.012979 0.005313 0.017297
LHD2 MHD HHD OBUS UBUS MCYLand Use LDA LDT1 LDT2 MDV LHD1
28.00 13.00 79 19 2
4.4 Fleet Mix
H-S or C-C H-O or C-NW Primary Diverted Pass-by
Industrial Park 9.50 7.30 7.30 59.00
4.3 Trip Type Information
Miles Trip % Trip Purpose %
Land Use H-W or C-W H-S or C-C H-O or C-NW H-W or C-W
Total 326.54 119.05 34.90 669,188 669,188
Annual VMT
Industrial Park 326.54 119.05 34.90 669,188 669,188
4.2 Trip Summary Information
Average Daily Trip Rate Unmitigated MitigatedLand Use Weekday Saturday Sunday Annual VMT
0.0000 225.0127 225.0127 0.0111 0.0000 225.28890.2521 1.8400e-003
0.2539 0.0675 1.7100e-003
0.0692Unmitigated 0.0535 0.2237 0.6257 2.4300e-003
0.0000 225.0127 225.0127 0.0111 0.0000 225.28890.2521 1.8400e-003
0.2539 0.0675 1.7100e-003
0.0692Mitigated 0.0535 0.2237 0.6257 2.4300e-003
NBio- CO2 Total CO2 CH4 N2O CO2e
Category tons/yr MT/yr
Exhaust PM10
PM10 Total
Fugitive PM2.5
Exhaust PM2.5
PM2.5 Total
Bio- CO2
4.0 Operational Detail - Mobile
4.1 Mitigation Measures Mobile
ROG NOx CO SO2 Fugitive PM10
0.0000 2.9080 2.9080 6.0000e-005
0.0000 2.90964.1900e-003
3.0000e-005
4.2100e-003
1.1100e-003
2.0000e-005
1.1400e-003
Total 1.3600e-003
7.9000e-004
8.6700e-003
3.0000e-005

51.7186 9.9000e-004
9.5000e-004
52.02593.6100e-003
3.6100e-003
3.6100e-003
0.0000 51.7186
52.0259
Total 5.2300e-003
0.0475 0.0399 2.9000e-004
3.6100e-003
3.6100e-003
0.0000 51.7186 51.7186 9.9000e-004
9.5000e-004
2.9000e-004
3.6100e-003
3.6100e-003
3.6100e-003
Industrial Park 969170 5.2300e-003
0.0475 0.0399
NBio- CO2 Total CO2 CH4 N2O CO2e
Land Use kBTU/yr tons/yr MT/yr
Exhaust PM10
PM10 Total
Fugitive PM2.5
Exhaust PM2.5
PM2.5 Total
Bio- CO2
5.2 Energy by Land Use - NaturalGasUnmitigated
NaturalGas Use
ROG NOx CO SO2 Fugitive PM10
0.0000 51.7186 51.7186 9.9000e-004
9.5000e-004
52.02593.6100e-003
3.6100e-003
3.6100e-003
3.6100e-003
NaturalGas Unmitigated
5.2300e-003
0.0475 0.0399 2.9000e-004
0.0000 51.7186 51.7186 9.9000e-004
9.5000e-004
52.02593.6100e-003
3.6100e-003
3.6100e-003
3.6100e-003
NaturalGas Mitigated
5.2300e-003
0.0475 0.0399 2.9000e-004
0.0000 215.0097 215.0097 8.6500e-003
1.7900e-003
215.75970.0000 0.0000 0.0000 0.0000Electricity Unmitigated
0.0000 215.0097 215.0097 8.6500e-003
1.7900e-003
215.75970.0000 0.0000 0.0000 0.0000Electricity Mitigated
NBio- CO2 Total CO2 CH4 N2O CO2e
Category tons/yr MT/yr
Exhaust PM10
PM10 Total
Fugitive PM2.5
Exhaust PM2.5
PM2.5 Total
Bio- CO2
5.0 Energy Detail
Historical Energy Use: N
5.1 Mitigation Measures Energy
ROG NOx CO SO2 Fugitive PM10

Mitigated
Electricity Use
Total CO2 CH4 N2O CO2e
215.7597
Total 215.0097 8.6500e-003
1.7900e-003
215.7597
Land Use kWh/yr ton
MT/yr
Industrial Park 657907 215.0097 8.6500e-003
1.7900e-003
Unmitigated
Electricity Use
Total CO2 CH4 N2O CO2e
51.7186 51.7186 9.9000e-004
9.5000e-004
52.0259
5.3 Energy by Land Use - Electricity
3.6100e-003
3.6100e-003
3.6100e-003
3.6100e-003
0.0000
9.5000e-004
52.0259
Total 5.2300e-003
0.0475 0.0399 2.9000e-004
3.6100e-003
3.6100e-003
0.0000 51.7186 51.7186 9.9000e-004
0.0399 2.9000e-004
3.6100e-003
3.6100e-003
CO2e
Land Use kBTU/yr tons/yr MT/yr
Industrial Park 969170 5.2300e-003
0.0475
PM2.5 Total
Bio- CO2 NBio- CO2 Total CO2 CH4 N2OSO2 Fugitive PM10
Exhaust PM10
PM10 Total
Fugitive PM2.5
Exhaust PM2.5
NaturalGas Use
ROG NOx CO
Mitigated

0.0000 0.0000 0.0000 0.0000 0.0000 0.00000.0000 0.0000 0.0000 0.0000Architectural Coating
0.0000
Total CO2 CH4 N2O CO2e
SubCategory tons/yr MT/yr
PM10 Total
Fugitive PM2.5
Exhaust PM2.5
PM2.5 Total
Bio- CO2 NBio- CO2
6.2 Area by SubCategoryUnmitigated
ROG NOx CO SO2 Fugitive PM10
Exhaust PM10
0.0000 8.5000e-004
8.5000e-004
0.0000 0.0000 9.1000e-004
0.0000 0.0000 0.0000 0.0000Unmitigated 0.1868 0.0000 4.4000e-004
0.0000
0.0000 8.5000e-004
8.5000e-004
0.0000 0.0000 9.1000e-004
0.0000 0.0000 0.0000 0.0000Mitigated 0.1868 0.0000 4.4000e-004
0.0000
NBio- CO2 Total CO2 CH4 N2O CO2e
Category tons/yr MT/yr
Exhaust PM10
PM10 Total
Fugitive PM2.5
Exhaust PM2.5
PM2.5 Total
Bio- CO2
6.0 Area Detail
6.1 Mitigation Measures Area
ROG NOx CO SO2 Fugitive PM10
215.7597
Total 215.0097 8.6500e-003
1.7900e-003
215.7597
Land Use kWh/yr ton
MT/yr
Industrial Park 657907 215.0097 8.6500e-003
1.7900e-003

Unmitigated 50.5553 0.3622 8.9000e-003
62.2609
Category ton
MT/yr
Mitigated 50.5553 0.3622 8.9000e-003
62.2609
7.0 Water Detail
7.1 Mitigation Measures Water
Total CO2 CH4 N2O CO2e
0.0000 8.5000e-004
8.5000e-004
0.0000 0.0000 9.1000e-004
0.0000 0.0000 0.0000 0.0000Total 0.1868 0.0000 4.4000e-004
0.0000
0.0000 8.5000e-004
8.5000e-004
0.0000 0.0000 9.1000e-004
0.0000 0.0000 0.0000 0.0000Landscaping 4.0000e-005
0.0000 4.4000e-004
0.0000
0.0000 0.0000 0.0000 0.0000 0.0000 0.00000.0000 0.0000 0.0000 0.0000Consumer Products
0.1867
0.0000 0.0000 0.0000 0.0000 0.0000 0.00000.0000 0.0000 0.0000 0.0000Architectural Coating
0.0000
Total CO2 CH4 N2O CO2e
SubCategory tons/yr MT/yr
PM10 Total
Fugitive PM2.5
Exhaust PM2.5
PM2.5 Total
Bio- CO2 NBio- CO2
Mitigated
ROG NOx CO SO2 Fugitive PM10
Exhaust PM10
0.0000 8.5000e-004
8.5000e-004
0.0000 0.0000 9.1000e-004
0.0000 0.0000 0.0000 0.0000Total 0.1868 0.0000 4.4000e-004
0.0000
0.0000 8.5000e-004
8.5000e-004
0.0000 0.0000 9.1000e-004
0.0000 0.0000 0.0000 0.0000Landscaping 4.0000e-005
0.0000 4.4000e-004
0.0000
0.0000 0.0000 0.0000 0.0000 0.0000 0.00000.0000 0.0000 0.0000 0.0000Consumer Products
0.1867

8.0 Waste Detail
8.1 Mitigation Measures Waste
62.2609
Total 50.5553 0.3622 8.9000e-003
62.2609
Land Use Mgal ton
MT/yr
Industrial Park 11.0561 / 0 50.5553 0.3622 8.9000e-003
Mitigated
Indoor/Outdoor Use
Total CO2 CH4 N2O CO2e
62.2609
Total 50.5553 0.3622 8.9000e-003
62.2609
Land Use Mgal ton
MT/yr
Industrial Park 11.0561 / 0 50.5553 0.3622 8.9000e-003
7.2 Water by Land UseUnmitigated
Indoor/Outdoor Use
Total CO2 CH4 N2O CO2e

Land Use tons ton
MT/yr
Mitigated
Waste Disposed
Total CO2 CH4 N2O CO2e
29.8120
Total 12.0333 0.7112 0.0000 29.8120
Land Use tons ton
MT/yr
Industrial Park 59.28 12.0333 0.7112 0.0000
8.2 Waste by Land UseUnmitigated
Waste Disposed
Total CO2 CH4 N2O CO2e
Unmitigated 12.0333 0.7112 0.0000 29.8120
ton
MT/yr
Mitigated 12.0333 0.7112 0.0000 29.8120
Category/Year
Total CO2 CH4 N2O CO2e

User Defined Equipment
Equipment Type Number
11.0 Vegetation
Fuel Type
Boilers
Equipment Type Number Heat Input/Day Heat Input/Year Boiler Rating Fuel Type
Load Factor Fuel Type
10.0 Stationary Equipment
Fire Pumps and Emergency Generators
Equipment Type Number Hours/Day Hours/Year Horse Power Load Factor
9.0 Operational Offroad
Equipment Type Number Hours/Day Days/Year Horse Power
29.8120
Total 12.0333 0.7112 0.0000 29.8120
Industrial Park 59.28 12.0333 0.7112 0.0000

tblArchitecturalCoating EF_Parking 250.00 0.00
tblAreaCoating Area_EF_Nonresidential_Exterior 250 100
1.3 User Entered Comments & Non-Default Data
Vehicle Emission Factors -
Vehicle Emission Factors -
Vehicle Emission Factors -
Energy Mitigation -
Table Name Column Name Default Value New Value
CO2 Intensity (lb/MWhr)
360.25 CH4 Intensity (lb/MWhr)
0.015 N2O Intensity (lb/MWhr)
0.003
40
Climate Zone 13 Operational Year 2028
Utility Company San Diego Gas & Electric
1.2 Other Project Characteristics
Urbanization Urban Wind Speed (m/s) 2.6 Precipitation Freq (Days)
Strip Mall 10.00 1000sqft 1.00 10,000.00 0
Regional Shopping Center 68.00 1000sqft 6.80 68,000.00 0
Condo/Townhouse 3,158.00 Dwelling Unit 124.40 3,158,000.00 9032
Floor Surface Area Population
Industrial Park 765.00 1000sqft 47.72 765,000.00 0
1.0 Project Characteristics
1.1 Land Usage
Land Uses Size Metric Lot Acreage
CalEEMod Version: CalEEMod.2016.3.1 Page 1 of 1 Date: 1/13/2017 2:47 PM
East Otay Mesa Specific Plan Amendment - San Diego Air Basin, Annual
East Otay Mesa Specific Plan Amendment - Operation with PDFsSan Diego Air Basin, Annual

tblLandUse LotAcreage 1.56 6.80
tblLandUse LotAcreage 0.23 1.00
tblLandUse LotAcreage 17.56 47.72
tblLandUse LotAcreage 197.38 124.40
tblFireplaces NumberNoFireplace 315.80 2,158.00
tblFireplaces NumberWood 1,105.30 0.00
tblFireplaces FireplaceDayYear 82.00 30.00
tblFireplaces NumberGas 1,736.90 1,000.00
tblEnergyUse T24NG 1.15 1.09
tblEnergyUse T24NG 1.15 1.09
tblEnergyUse T24NG 12,915.01 9,298.81
tblEnergyUse T24NG 16.07 15.27
tblEnergyUse T24E 3.34 3.17
tblEnergyUse T24E 3.34 3.17
tblEnergyUse T24E 257.33 185.28
tblEnergyUse T24E 4.88 4.64
tblConstructionPhase NumDays 220.00 0.00
tblConstructionPhase NumDays 120.00 0.00
tblConstructionPhase NumDays 200.00 0.00
tblConstructionPhase NumDays 310.00 0.00
tblConstructionPhase NumDays 220.00 0.00
tblConstructionPhase NumDays 3,100.00 0.00
tblAreaMitigation UseLowVOCPaintResidentialExteriorValue
100 0
tblAreaMitigation UseLowVOCPaintResidentialInteriorValue
50 0
tblAreaMitigation UseLowVOCPaintNonresidentialInteriorValue
50 0
tblAreaMitigation UseLowVOCPaintParkingValue 250 0
tblAreaCoating Area_EF_Residential_Interior 250 50
tblAreaMitigation UseLowVOCPaintNonresidentialExteriorValue
100 0
tblAreaCoating Area_EF_Nonresidential_Interior 250 50
tblAreaCoating Area_EF_Residential_Exterior 250 100

tblVehicleTrips SU_TR 25.24 96.00
tblVehicleTrips SU_TR 20.43 40.00
tblVehicleTrips ST_TR 42.04 40.00
tblVehicleTrips SU_TR 4.84 8.00
tblVehicleTrips ST_TR 5.67 8.00
tblVehicleTrips ST_TR 49.97 96.00
tblTripsAndVMT WorkerTripNumber 23.00 18.00
tblTripsAndVMT WorkerTripNumber 13.00 5.00
tblTripsAndVMT WorkerTripNumber 18.00 10.00
tblTripsAndVMT WorkerTripNumber 23.00 10.00
tblTripsAndVMT WorkerTripNumber 524.00 0.00
tblTripsAndVMT WorkerTripNumber 2,620.00 0.00
tblProjectCharacteristics N2OIntensityFactor 0.006 0.003
tblProjectCharacteristics OperationalYear 2018 2028
tblProjectCharacteristics CH4IntensityFactor 0.029 0.015
tblProjectCharacteristics CO2IntensityFactor 720.49 360.25
tblOffRoadEquipment UsageHours 7.00 8.00
tblOffRoadEquipment UsageHours 8.00 6.00
tblOffRoadEquipment UsageHours 8.00 1.00
tblOffRoadEquipment UsageHours 8.00 1.00
tblOffRoadEquipment UsageHours 8.00 7.00
tblOffRoadEquipment UsageHours 8.00 7.00
tblOffRoadEquipment UsageHours 7.00 4.00
tblOffRoadEquipment UsageHours 8.00 6.00
tblOffRoadEquipment OffRoadEquipmentUnitAmount 3.00 2.00
tblOffRoadEquipment OffRoadEquipmentUnitAmount 4.00 1.00
tblOffRoadEquipment OffRoadEquipmentUnitAmount 2.00 1.00
tblOffRoadEquipment OffRoadEquipmentUnitAmount 2.00 1.00
tblOffRoadEquipment OffRoadEquipmentUnitAmount 3.00 2.00
tblOffRoadEquipment OffRoadEquipmentUnitAmount 2.00 1.00
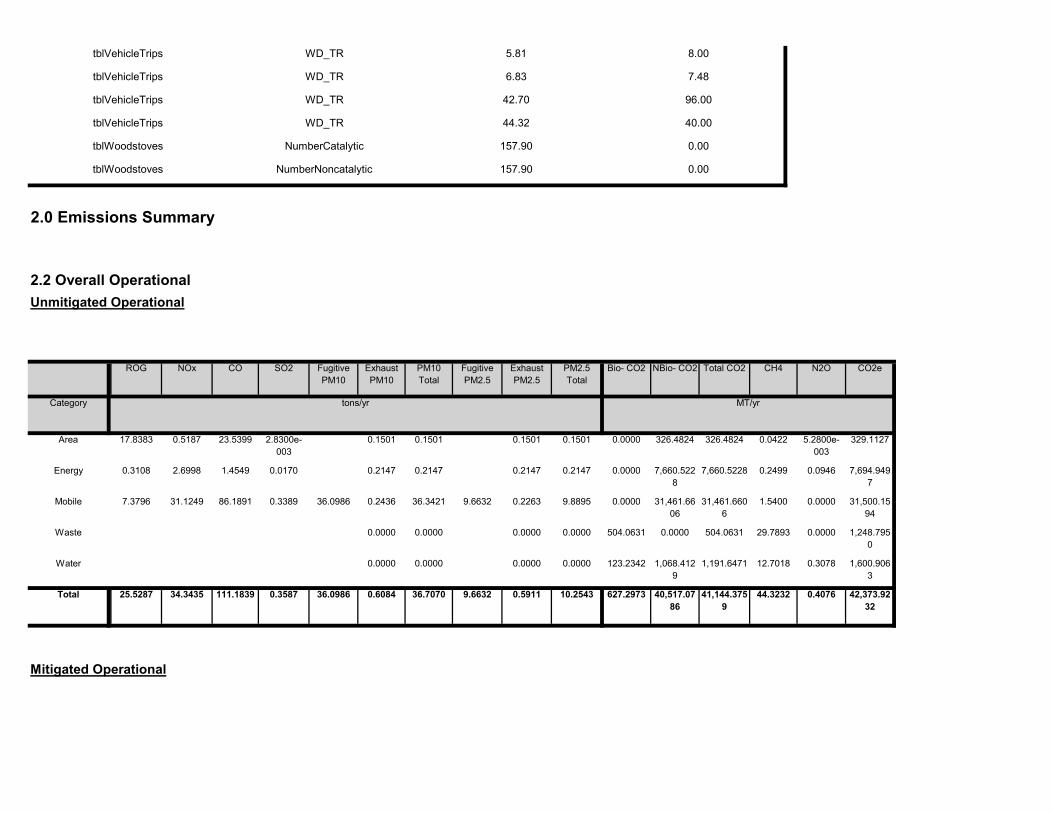
Mitigated Operational
627.2973 40,517.0786
41,144.3759
44.3232 0.4076 42,373.9232
36.0986 0.6084 36.7070 9.6632 0.5911 10.2543Total 25.5287 34.3435 111.1839 0.3587
123.2342 1,068.4129
1,191.6471 12.7018 0.3078 1,600.9063
0.0000 0.0000 0.0000 0.0000Water
504.0631 0.0000 504.0631 29.7893 0.0000 1,248.7950
0.0000 0.0000 0.0000 0.0000Waste
0.0000 31,461.6606
31,461.6606
1.5400 0.0000 31,500.1594
36.0986 0.2436 36.3421 9.6632 0.2263 9.8895Mobile 7.3796 31.1249 86.1891 0.3389
0.0000 7,660.5228
7,660.5228 0.2499 0.0946 7,694.9497
0.2147 0.2147 0.2147 0.2147Energy 0.3108 2.6998 1.4549 0.0170
0.0000 326.4824 326.4824 0.0422 5.2800e-003
329.11270.1501 0.1501 0.1501 0.1501Area 17.8383 0.5187 23.5399 2.8300e-003
Total CO2 CH4 N2O CO2e
Category tons/yr MT/yr
PM10 Total
Fugitive PM2.5
Exhaust PM2.5
PM2.5 Total
Bio- CO2 NBio- CO2
2.2 Overall OperationalUnmitigated Operational
ROG NOx CO SO2 Fugitive PM10
Exhaust PM10
2.0 Emissions Summary
tblWoodstoves NumberCatalytic 157.90 0.00
tblWoodstoves NumberNoncatalytic 157.90 0.00
tblVehicleTrips WD_TR 42.70 96.00
tblVehicleTrips WD_TR 44.32 40.00
tblVehicleTrips WD_TR 5.81 8.00
tblVehicleTrips WD_TR 6.83 7.48

4.0 Operational Detail - Mobile
Vegetation Land Change
-827.1843
Total -827.1843
2.3 VegetationVegetation
CO2e
Category ton
MT
3.93 6.42 6.38 5.96 15.28 6.397.84 2.89 7.76 7.84 2.77 7.55
NBio-CO2 Total CO2 CH4 N20 CO2e
Percent Reduction
1.00 3.30 4.83 6.92
Exhaust PM10
PM10 Total
Fugitive PM2.5
Exhaust PM2.5
PM2.5 Total
Bio- CO2ROG NOx CO SO2 Fugitive PM10
602.6505 37,917.6216
38,520.2720
41.6802 0.3453 39,665.1819
33.2688 0.5908 33.8596 8.9057 0.5747 9.4804Total 25.2740 33.2085 105.8098 0.3339
98.5874 888.3574 986.9447 10.1629 0.2465 1,314.4706
0.0000 0.0000 0.0000 0.0000Water
504.0631 0.0000 504.0631 29.7893 0.0000 1,248.7950
0.0000 0.0000 0.0000 0.0000Waste
0.0000 29,164.8643
29,164.8643
1.4415 0.0000 29,200.9030
33.2688 0.2270 33.4958 8.9057 0.2109 9.1166Mobile 7.1348 29.9916 80.9837 0.3141
0.0000 7,538.2627
7,538.2627 0.2448 0.0936 7,572.2589
0.2147 0.2147 0.2147 0.2147Energy 0.3108 2.6998 1.4549 0.0170
0.0000 326.1371 326.1371 0.0417 5.2800e-003
328.75440.1491 0.1491 0.1491 0.1491Area 17.8284 0.5171 23.3711 2.8100e-003
Total CO2 CH4 N2O CO2e
Category tons/yr MT/yr
PM10 Total
Fugitive PM2.5
Exhaust PM2.5
PM2.5 Total
Bio- CO2 NBio- CO2ROG NOx CO SO2 Fugitive PM10
Exhaust PM10

64.40 19.00 45 40 15
4.4 Fleet Mix
64.70 19.00 54 35 11
Strip Mall 9.50 7.30 7.30 16.60
28.00 13.00 79 19 2
Regional Shopping Center 9.50 7.30 7.30 16.30
18.80 39.60 86 11 3
Industrial Park 9.50 7.30 7.30 59.00
H-S or C-C H-O or C-NW Primary Diverted Pass-by
Condo/Townhouse 10.80 7.30 7.50 41.60
4.3 Trip Type Information
Miles Trip % Trip Purpose %
Land Use H-W or C-W H-S or C-C H-O or C-NW H-W or C-W
Total 37,914.20 34,096.85 32,750.45 95,836,754 88,324,111Strip Mall 400.00 400.00 400.00 616,013 567,724
Regional Shopping Center 6,528.00 6,528.00 6528.00 11,445,574 10,548,355Industrial Park 5,722.20 1,904.85 558.45 11,638,783 10,726,419
Annual VMT
Condo/Townhouse 25,264.00 25,264.00 25264.00 72,136,384 66,481,613
4.2 Trip Summary Information
Average Daily Trip Rate Unmitigated MitigatedLand Use Weekday Saturday Sunday Annual VMT
0.0000 31,461.6606
31,461.6606
1.5400 0.0000 31,500.1594
36.0986 0.2436 36.3421 9.6632 0.2263 9.8895Unmitigated 7.3796 31.1249 86.1891 0.3389
0.0000 29,164.8643
29,164.8643
1.4415 0.0000 29,200.9030
33.2688 0.2270 33.4958 8.9057 0.2109 9.1166Mitigated 7.1348 29.9916 80.9837 0.3141
NBio- CO2 Total CO2 CH4 N2O CO2e
Category tons/yr MT/yr
Exhaust PM10
PM10 Total
Fugitive PM2.5
Exhaust PM2.5
PM2.5 Total
Bio- CO2
4.1 Mitigation Measures Mobile
Increase Transit Accessibility
ROG NOx CO SO2 Fugitive PM10

NBio- CO2 Total CO2 CH4 N2O CO2eExhaust PM10
PM10 Total
Fugitive PM2.5
Exhaust PM2.5
PM2.5 Total
Bio- CO2
5.2 Energy by Land Use - NaturalGasUnmitigated
NaturalGas Use
ROG NOx CO SO2 Fugitive PM10
0.0000 3,075.3921
3,075.3921 0.0590 0.0564 3,093.6677
0.2147 0.2147 0.2147 0.2147NaturalGas Unmitigated
0.3108 2.6998 1.4549 0.0170
0.0000 3,075.3921
3,075.3921 0.0590 0.0564 3,093.6677
0.2147 0.2147 0.2147 0.2147NaturalGas Mitigated
0.3108 2.6998 1.4549 0.0170
0.0000 4,585.1307
4,585.1307 0.1909 0.0382 4,601.2821
0.0000 0.0000 0.0000 0.0000Electricity Unmitigated
0.0000 4,462.8706
4,462.8706 0.1858 0.0372 4,478.5913
0.0000 0.0000 0.0000 0.0000Electricity Mitigated
CH4 N2O CO2e
Category tons/yr MT/yr
Fugitive PM2.5
Exhaust PM2.5
PM2.5 Total
Bio- CO2 NBio- CO2 Total CO2
Install Energy Efficient Appliances
ROG NOx CO SO2 Fugitive PM10
Exhaust PM10
PM10 Total
0.000778 0.000837
5.0 Energy Detail
Historical Energy Use: N
5.1 Mitigation Measures Energy
Install High Efficiency Lighting
0.005296 0.017422 0.025155 0.001929 0.001711 0.005676Strip Mall 0.614571 0.037691 0.177673 0.098627 0.012633
0.025155 0.001929 0.001711 0.005676 0.000778 0.000837
0.000778 0.000837
Regional Shopping Center 0.614571 0.037691 0.177673 0.098627 0.012633 0.005296 0.017422
0.005296 0.017422 0.025155 0.001929 0.001711 0.005676Condo/Townhouse 0.614571 0.037691 0.177673 0.098627 0.012633
0.025155 0.001929 0.001711 0.005676 0.000778 0.000837
SBUS MH
Industrial Park 0.614571 0.037691 0.177673 0.098627 0.012633 0.005296 0.017422
LHD2 MHD HHD OBUS UBUS MCYLand Use LDA LDT1 LDT2 MDV LHD1

Land Use kWh/yr ton
MT/yr
3,093.6676
5.3 Energy by Land Use - ElectricityUnmitigated
Electricity Use
Total CO2 CH4 N2O CO2e
0.2147 0.0000 3,075.3921 3,075.3921
0.0589 0.05640.0170 0.2147 0.2147 0.2147
1.1633 2.0000e-005
2.0000e-005
1.1702
Total 0.3108 2.6998 1.4549
8.0000e-005
8.0000e-005
8.0000e-005
0.0000 1.1633
7.9577
Strip Mall 21800 1.2000e-004
1.0700e-003
9.0000e-004
1.0000e-005
8.0000e-005
5.5000e-004
0.0000 7.9107 7.9107 1.5000e-004
1.5000e-004
4.0000e-005
5.5000e-004
5.5000e-004
5.5000e-004
794.8299 0.0152 0.0146 799.5532
Regional Shopping Center
148240 8.0000e-004
7.2700e-003
6.1000e-003
0.0555 0.0555 0.0555 0.0000 794.8299
2,284.9866
Industrial Park 1.48946e+007
0.0803 0.7301 0.6133 4.3800e-003
0.0555
0.1586 0.0000 2,271.4882 2,271.4882
0.0435 0.04160.0125 0.1586 0.1586 0.1586
Land Use kBTU/yr tons/yr MT/yr
Condo/Townhouse 4.25661e+007
0.2295 1.9614 0.8346
Bio- CO2 NBio- CO2 Total CO2 CH4 N2O CO2eFugitive PM10
Exhaust PM10
PM10 Total
Fugitive PM2.5
Exhaust PM2.5
PM2.5 Total
3,093.6676
Mitigated
NaturalGas Use
ROG NOx CO SO2
0.2147 0.0000 3,075.3921 3,075.3921
0.0589 0.05640.0170 0.2147 0.2147 0.2147
1.1633 2.0000e-005
2.0000e-005
1.1702
Total 0.3108 2.6998 1.4549
8.0000e-005
8.0000e-005
8.0000e-005
0.0000 1.1633
7.9577
Strip Mall 21800 1.2000e-004
1.0700e-003
9.0000e-004
1.0000e-005
8.0000e-005
5.5000e-004
0.0000 7.9107 7.9107 1.5000e-004
1.5000e-004
4.0000e-005
5.5000e-004
5.5000e-004
5.5000e-004
794.8299 0.0152 0.0146 799.5532
Regional Shopping Center
148240 8.0000e-004
7.2700e-003
6.1000e-003
0.0555 0.0555 0.0555 0.0000 794.8299
2,284.9866
Industrial Park 1.48946e+007
0.0803 0.7301 0.6133 4.3800e-003
0.0555
0.1586 0.0000 2,271.4882 2,271.4882
0.0435 0.04160.0125 0.1586 0.1586 0.1586Condo/Townhouse 4.25661e+007
0.2295 1.9614 0.8346
Land Use kBTU/yr tons/yr MT/yr

4,478.5913
6.0 Area Detail
6.1 Mitigation Measures Area
Use Electric Lawnmower
Use Electric Leafblower
Use Electric Chainsaw
Total 4,462.8706 0.1858 0.0372
138.2754
Strip Mall 124005 20.2632 8.4000e-004
1.7000e-004
20.3346
Regional Shopping Center
843234 137.7900 5.7400e-003
1.1500e-003
2,648.4703
Industrial Park 1.01932e+007
1,665.6436 0.0694 0.0139 1,671.5109
Land Use kWh/yr ton
MT/yr
Condo/Townhouse 1.6151e+007
2,639.1737 0.1099 0.0220
4,601.2821
Mitigated
Electricity Use
Total CO2 CH4 N2O CO2e
Total 4,585.1307 0.1909 0.0382
141.8381
Strip Mall 127200 20.7853 8.7000e-004
1.7000e-004
20.8585
Regional Shopping Center
864960 141.3402 5.8900e-003
1.1800e-003
2,742.5497
Industrial Park 1.03428e+007
1,690.0823 0.0704 0.0141 1,696.0357
Condo/Townhouse 1.67247e+007
2,732.9229 0.1138 0.0228

Mitigated
0.0000 326.4824 326.4824 0.0422 5.2800e-003
329.11270.1501 0.1501 0.1501 0.1501Total 17.8383 0.5187 23.5399 2.8300e-003
0.0000 38.3178 38.3178 0.0367 0.0000 39.23580.1300 0.1300 0.1300 0.1300Landscaping 0.7041 0.2699 23.4340 1.2400e-003
0.0000 288.1646 288.1646 5.5200e-003
5.2800e-003
289.87700.0201 0.0201 0.0201 0.0201Hearth 0.0291 0.2488 0.1059 1.5900e-003
0.0000 0.0000 0.0000 0.0000 0.0000 0.00000.0000 0.0000 0.0000 0.0000Consumer Products
15.6259
0.0000 0.0000 0.0000 0.0000 0.0000 0.00000.0000 0.0000 0.0000 0.0000Architectural Coating
1.4792
NBio- CO2 Total CO2 CH4 N2O CO2e
SubCategory tons/yr MT/yr
Exhaust PM10
PM10 Total
Fugitive PM2.5
Exhaust PM2.5
PM2.5 Total
Bio- CO2
329.1127
6.2 Area by SubCategoryUnmitigated
ROG NOx CO SO2 Fugitive PM10
0.1501 0.0000 326.4824 326.4824 0.0422 5.2800e-003
2.8300e-003
0.1501 0.1501 0.1501
326.1371 326.1371 0.0417 5.2800e-003
328.7544
Unmitigated 17.8383 0.5187 23.5399
0.1491 0.1491 0.1491 0.1491 0.0000
Category tons/yr MT/yr
Mitigated 17.8284 0.5171 23.3711 2.8100e-003
Bio- CO2 NBio- CO2 Total CO2 CH4 N2O CO2eFugitive PM10
Exhaust PM10
PM10 Total
Fugitive PM2.5
Exhaust PM2.5
PM2.5 Total
ROG NOx CO SO2

Unmitigated 1,191.6471 12.7018 0.3078 1,600.9063
Category ton
MT/yr
Mitigated 986.9447 10.1629 0.2465 1,314.4706
Use Water Efficient Irrigation System
Total CO2 CH4 N2O CO2e
7.0 Water Detail
7.1 Mitigation Measures Water
Install Low Flow Bathroom Faucet
Install Low Flow Kitchen Faucet
Install Low Flow Toilet
Install Low Flow Shower
0.0000 326.1371 326.1371 0.0417 5.2800e-003
328.75440.1491 0.1491 0.1491 0.1491Total 17.8284 0.5171 23.3711 2.8200e-003
0.0000 37.9726 37.9726 0.0362 0.0000 38.87740.1290 0.1290 0.1290 0.1290Landscaping 0.6942 0.2682 23.2652 1.2300e-003
0.0000 288.1646 288.1646 5.5200e-003
5.2800e-003
289.87700.0201 0.0201 0.0201 0.0201Hearth 0.0291 0.2488 0.1059 1.5900e-003
0.0000 0.0000 0.0000 0.0000 0.0000 0.00000.0000 0.0000 0.0000 0.0000Consumer Products
15.6259
0.0000 0.0000 0.0000 0.0000 0.0000 0.00000.0000 0.0000 0.0000 0.0000Architectural Coating
1.4792
Total CO2 CH4 N2O CO2e
SubCategory tons/yr MT/yr
PM10 Total
Fugitive PM2.5
Exhaust PM2.5
PM2.5 Total
Bio- CO2 NBio- CO2ROG NOx CO SO2 Fugitive PM10
Exhaust PM10

1,314.4706
8.0 Waste Detail
Total 986.9447 10.1629 0.2465
19.3700
Strip Mall 0.59258 / 0.426299
2.2228 0.0194 4.7000e-004
2.8485
Regional Shopping Center
4.02955 / 2.89884
15.1148 0.1319 3.2200e-003
797.4277
Industrial Park 141.525 / 0 346.0246 4.6241 0.1114 494.8244
Land Use Mgal ton
MT/yr
Condo/Townhouse 164.605 / 121.803
623.5825 5.3875 0.1314
1,600.9063
Mitigated
Indoor/Outdoor Use
Total CO2 CH4 N2O CO2e
Total 1,191.6471 12.7018 0.3078
23.2353
Strip Mall 0.740725 / 0.453993
2.6353 0.0242 5.9000e-004
3.4170
Regional Shopping Center
5.03693 / 3.08715
17.9197 0.1648 4.0100e-003
955.7236
Industrial Park 176.906 / 0 432.5308 5.7802 0.1393 618.5305
Land Use Mgal ton
MT/yr
Condo/Townhouse 205.756 / 129.716
738.5613 6.7326 0.1639
7.2 Water by Land UseUnmitigated
Indoor/Outdoor Use
Total CO2 CH4 N2O CO2e

1,248.7950
Mitigated
Total 504.0631 29.7893 0.0000
35.9072
Strip Mall 10.5 2.1314 0.1260 0.0000 5.2805
Regional Shopping Center
71.4 14.4936 0.8565 0.0000
730.5550
Industrial Park 948.6 192.5572 11.3798 0.0000 477.0524
Land Use tons ton
MT/yr
Condo/Townhouse 1452.68 294.8809 17.4270 0.0000
8.2 Waste by Land UseUnmitigated
Waste Disposed
Total CO2 CH4 N2O CO2e
Unmitigated 504.0631 29.7893 0.0000 1,248.7950
ton
MT/yr
Mitigated 504.0631 29.7893 0.0000 1,248.7950
8.1 Mitigation Measures Waste
Category/Year
Total CO2 CH4 N2O CO2e

User Defined Equipment
Equipment Type Number
11.0 Vegetation
Load Factor Fuel Type
Boilers
Equipment Type Number Heat Input/Day Heat Input/Year Boiler Rating Fuel Type
Horse Power Load Factor Fuel Type
10.0 Stationary Equipment
Fire Pumps and Emergency Generators
Equipment Type Number Hours/Day Hours/Year Horse Power
1,248.7950
9.0 Operational Offroad
Equipment Type Number Hours/Day Days/Year
Total 504.0631 29.7893 0.0000
35.9072
Strip Mall 10.5 2.1314 0.1260 0.0000 5.2805
Regional Shopping Center
71.4 14.4936 0.8565 0.0000
730.5550
Industrial Park 948.6 192.5572 11.3798 0.0000 477.0524
Land Use tons ton
MT/yr
Condo/Townhouse 1452.68 294.8809 17.4270 0.0000
Waste Disposed
Total CO2 CH4 N2O CO2e

-827.1843Total -827.1843 0.0000 0.0000
-7.2930
Wetlands 0.83 / 0.3 0.0000 0.0000 0.0000 0.0000
Scrub 0.51 / 0 -7.2930 0.0000 0.0000
0.0000
Others 7.26 / 0 0.0000 0.0000 0.0000 0.0000
Others 2.97 / 0 0.0000 0.0000 0.0000
-812.7798
Grassland 1.65 / 0 -7.1115 0.0000 0.0000 -7.1115
Acres ton
MT
Grassland 239.91 / 51.33
-812.7798 0.0000 0.0000
11.1 Vegetation Land ChangeVegetation Type
Initial/Final Total CO2 CH4 N2O CO2e
Category ton
MT
Unmitigated -827.1843 0.0000 0.0000 -827.1843
Total CO2 CH4 N2O CO2e

tblAreaCoating Area_EF_Nonresidential_Interior 250 50
tblArchitecturalCoating EF_Parking 250.00 0.00
tblAreaCoating Area_EF_Nonresidential_Exterior 250 100
1.3 User Entered Comments & Non-Default Data
Vehicle Emission Factors -
Vehicle Emission Factors -
Vehicle Emission Factors -
Table Name Column Name Default Value New Value
CO2 Intensity (lb/MWhr)
360.25 CH4 Intensity (lb/MWhr)
0.015 N2O Intensity (lb/MWhr)
0.003
40
Climate Zone 13 Operational Year 2028
Utility Company San Diego Gas & Electric
1.2 Other Project Characteristics
Urbanization Urban Wind Speed (m/s) 2.6 Precipitation Freq (Days)
Strip Mall 10.00 1000sqft 1.00 10,000.00 0
Regional Shopping Center 68.00 1000sqft 6.80 68,000.00 0
Condo/Townhouse 3,158.00 Dwelling Unit 124.40 3,158,000.00 9032
Floor Surface Area Population
Industrial Park 765.00 1000sqft 47.72 765,000.00 0
1.0 Project Characteristics
1.1 Land Usage
Land Uses Size Metric Lot Acreage
CalEEMod Version: CalEEMod.2016.3.1 Page 1 of 1 Date: 1/4/2017 4:06 PM
East Otay Mesa Specific Plan Amendment - San Diego Air Basin, Annual
East Otay Mesa Specific Plan Amendment - Operations with MitigationSan Diego Air Basin, Annual

tblOffRoadEquipment OffRoadEquipmentUnitAmount 3.00 2.00
tblLandUse LotAcreage 1.56 6.80
tblLandUse LotAcreage 0.23 1.00
tblLandUse LotAcreage 17.56 47.72
tblLandUse LotAcreage 197.38 124.40
tblFireplaces NumberNoFireplace 315.80 2,158.00
tblFireplaces NumberWood 1,105.30 0.00
tblFireplaces FireplaceDayYear 82.00 30.00
tblFireplaces NumberGas 1,736.90 1,000.00
tblEnergyUse T24NG 1.15 1.09
tblEnergyUse T24NG 1.15 1.09
tblEnergyUse T24NG 12,915.01 9,298.81
tblEnergyUse T24NG 16.07 15.27
tblEnergyUse T24E 3.34 3.17
tblEnergyUse T24E 3.34 3.17
tblEnergyUse T24E 257.33 185.28
tblEnergyUse T24E 4.88 4.64
tblConstructionPhase NumDays 220.00 0.00
tblConstructionPhase NumDays 120.00 0.00
tblConstructionPhase NumDays 200.00 0.00
tblConstructionPhase NumDays 310.00 0.00
tblConstructionPhase NumDays 220.00 0.00
tblConstructionPhase NumDays 3,100.00 0.00
tblAreaMitigation UseLowVOCPaintResidentialExteriorValue
100 0
tblAreaMitigation UseLowVOCPaintResidentialInteriorValue
50 0
tblAreaMitigation UseLowVOCPaintNonresidentialInteriorValue
50 0
tblAreaMitigation UseLowVOCPaintParkingValue 250 0
tblAreaCoating Area_EF_Residential_Interior 250 50
tblAreaMitigation UseLowVOCPaintNonresidentialExteriorValue
100 0
tblAreaCoating Area_EF_Residential_Exterior 250 100
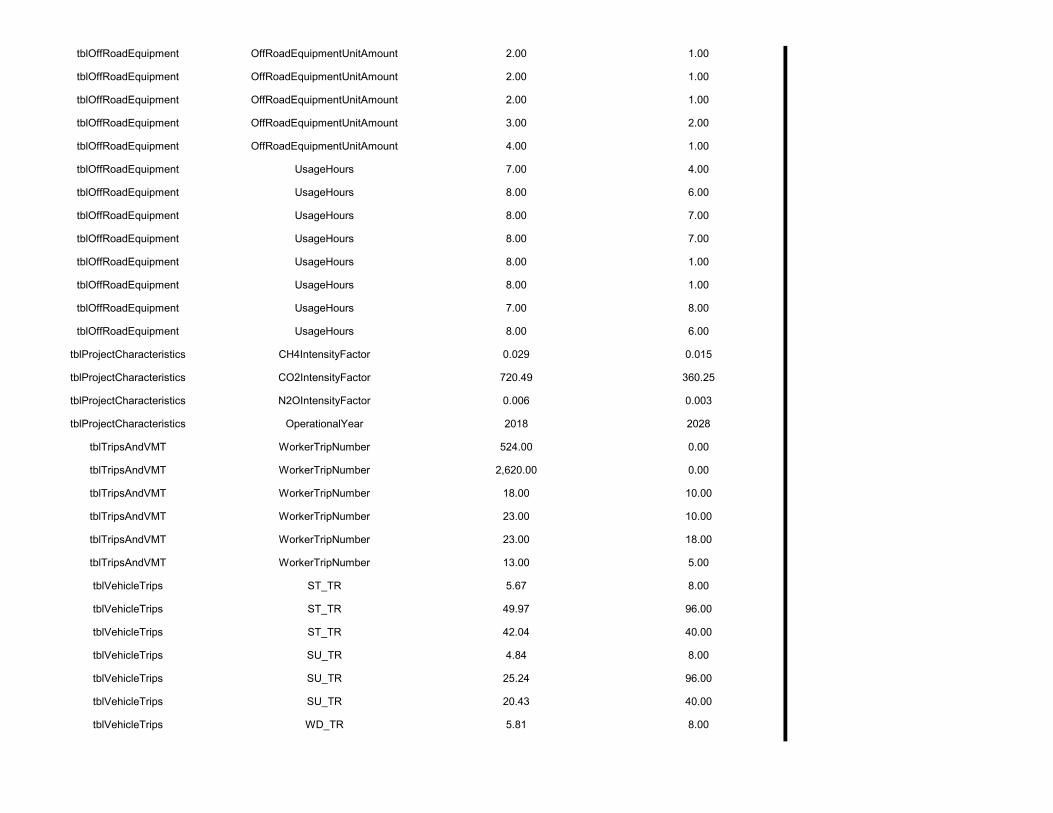
tblVehicleTrips WD_TR 5.81 8.00
tblVehicleTrips SU_TR 25.24 96.00
tblVehicleTrips SU_TR 20.43 40.00
tblVehicleTrips ST_TR 42.04 40.00
tblVehicleTrips SU_TR 4.84 8.00
tblVehicleTrips ST_TR 5.67 8.00
tblVehicleTrips ST_TR 49.97 96.00
tblTripsAndVMT WorkerTripNumber 23.00 18.00
tblTripsAndVMT WorkerTripNumber 13.00 5.00
tblTripsAndVMT WorkerTripNumber 18.00 10.00
tblTripsAndVMT WorkerTripNumber 23.00 10.00
tblTripsAndVMT WorkerTripNumber 524.00 0.00
tblTripsAndVMT WorkerTripNumber 2,620.00 0.00
tblProjectCharacteristics N2OIntensityFactor 0.006 0.003
tblProjectCharacteristics OperationalYear 2018 2028
tblProjectCharacteristics CH4IntensityFactor 0.029 0.015
tblProjectCharacteristics CO2IntensityFactor 720.49 360.25
tblOffRoadEquipment UsageHours 7.00 8.00
tblOffRoadEquipment UsageHours 8.00 6.00
tblOffRoadEquipment UsageHours 8.00 1.00
tblOffRoadEquipment UsageHours 8.00 1.00
tblOffRoadEquipment UsageHours 8.00 7.00
tblOffRoadEquipment UsageHours 8.00 7.00
tblOffRoadEquipment UsageHours 7.00 4.00
tblOffRoadEquipment UsageHours 8.00 6.00
tblOffRoadEquipment OffRoadEquipmentUnitAmount 3.00 2.00
tblOffRoadEquipment OffRoadEquipmentUnitAmount 4.00 1.00
tblOffRoadEquipment OffRoadEquipmentUnitAmount 2.00 1.00
tblOffRoadEquipment OffRoadEquipmentUnitAmount 2.00 1.00
tblOffRoadEquipment OffRoadEquipmentUnitAmount 2.00 1.00

Total CO2 CH4 N2O CO2ePM10 Total
Fugitive PM2.5
Exhaust PM2.5
PM2.5 Total
Bio- CO2 NBio- CO2
Mitigated Operational
ROG NOx CO SO2 Fugitive PM10
Exhaust PM10
627.2973 40,517.0786
41,144.3759
44.3232 0.4076 42,373.9232
36.0986 0.6084 36.7070 9.6632 0.5911 10.2543Total 25.5287 34.3435 111.1839 0.3587
123.2342 1,068.4129
1,191.6471 12.7018 0.3078 1,600.9063
0.0000 0.0000 0.0000 0.0000Water
504.0631 0.0000 504.0631 29.7893 0.0000 1,248.7950
0.0000 0.0000 0.0000 0.0000Waste
0.0000 31,461.6606
31,461.6606
1.5400 0.0000 31,500.1594
36.0986 0.2436 36.3421 9.6632 0.2263 9.8895Mobile 7.3796 31.1249 86.1891 0.3389
0.0000 7,660.5228
7,660.5228 0.2499 0.0946 7,694.9497
0.2147 0.2147 0.2147 0.2147Energy 0.3108 2.6998 1.4549 0.0170
0.0000 326.4824 326.4824 0.0422 5.2800e-003
329.11270.1501 0.1501 0.1501 0.1501Area 17.8383 0.5187 23.5399 2.8300e-003
Total CO2 CH4 N2O CO2e
Category tons/yr MT/yr
PM10 Total
Fugitive PM2.5
Exhaust PM2.5
PM2.5 Total
Bio- CO2 NBio- CO2
2.2 Overall OperationalUnmitigated Operational
ROG NOx CO SO2 Fugitive PM10
Exhaust PM10
2.0 Emissions Summary
tblWoodstoves NumberCatalytic 157.90 0.00
tblWoodstoves NumberNoncatalytic 157.90 0.00
tblVehicleTrips WD_TR 42.70 96.00
tblVehicleTrips WD_TR 44.32 40.00
tblVehicleTrips WD_TR 6.83 7.48

4.0 Operational Detail - Mobile
4.1 Mitigation Measures Mobile
Increase Transit Accessibility
Vegetation Land Change
-827.1843
Total -827.1843
2.3 VegetationVegetation
CO2e
Category ton
MT
3.93 13.18 13.04 6.20 21.96 12.897.84 7.92 7.84 7.84 7.96 7.85
NBio-CO2 Total CO2 CH4 N20 CO2e
Percent Reduction
1.17 4.43 5.02 7.59
Exhaust PM10
PM10 Total
Fugitive PM2.5
Exhaust PM2.5
PM2.5 Total
Bio- CO2ROG NOx CO SO2 Fugitive PM10
602.6505 35,175.5876
35,778.2380
41.5759 0.3181 36,912.4266
33.2688 0.5602 33.8290 8.9057 0.5441 9.4498Total 25.2296 32.8225 105.5977 0.3315
98.5874 888.3574 986.9447 10.1629 0.2465 1,314.4706
0.0000 0.0000 0.0000 0.0000Water
504.0631 0.0000 504.0631 29.7893 0.0000 1,248.7950
0.0000 0.0000 0.0000 0.0000Waste
0.0000 29,164.8643
29,164.8643
1.4415 0.0000 29,200.9030
33.2688 0.2270 33.4958 8.9057 0.2109 9.1166Mobile 7.1348 29.9916 80.9837 0.3141
0.0000 4,796.2288
4,796.2288 0.1405 0.0663 4,819.5037
0.1841 0.1841 0.1841 0.1841Energy 0.2664 2.3139 1.2429 0.0145
0.0000 326.1371 326.1371 0.0417 5.2800e-003
328.75440.1491 0.1491 0.1491 0.1491Area 17.8284 0.5171 23.3711 2.8100e-003
Category tons/yr MT/yr

0.000778 0.0008370.005296 0.017422 0.025155 0.001929 0.001711 0.005676Condo/Townhouse 0.614571 0.037691 0.177673 0.098627 0.012633
0.025155 0.001929 0.001711 0.005676 0.000778 0.000837
SBUS MH
Industrial Park 0.614571 0.037691 0.177673 0.098627 0.012633 0.005296 0.017422
LHD2 MHD HHD OBUS UBUS MCYLand Use LDA LDT1 LDT2 MDV LHD1
64.40 19.00 45 40 15
4.4 Fleet Mix
64.70 19.00 54 35 11
Strip Mall 9.50 7.30 7.30 16.60
28.00 13.00 79 19 2
Regional Shopping Center 9.50 7.30 7.30 16.30
18.80 39.60 86 11 3
Industrial Park 9.50 7.30 7.30 59.00
H-S or C-C H-O or C-NW Primary Diverted Pass-by
Condo/Townhouse 10.80 7.30 7.50 41.60
4.3 Trip Type Information
Miles Trip % Trip Purpose %
Land Use H-W or C-W H-S or C-C H-O or C-NW H-W or C-W
Total 37,914.20 34,096.85 32,750.45 95,836,754 88,324,111Strip Mall 400.00 400.00 400.00 616,013 567,724
Regional Shopping Center 6,528.00 6,528.00 6528.00 11,445,574 10,548,355Industrial Park 5,722.20 1,904.85 558.45 11,638,783 10,726,419
Annual VMT
Condo/Townhouse 25,264.00 25,264.00 25264.00 72,136,384 66,481,613
4.2 Trip Summary Information
Average Daily Trip Rate Unmitigated MitigatedLand Use Weekday Saturday Sunday Annual VMT
0.0000 31,461.6606
31,461.6606
1.5400 0.0000 31,500.1594
36.0986 0.2436 36.3421 9.6632 0.2263 9.8895Unmitigated 7.3796 31.1249 86.1891 0.3389
0.0000 29,164.8643
29,164.8643
1.4415 0.0000 29,200.9030
33.2688 0.2270 33.4958 8.9057 0.2109 9.1166Mitigated 7.1348 29.9916 80.9837 0.3141
NBio- CO2 Total CO2 CH4 N2O CO2e
Category tons/yr MT/yr
Exhaust PM10
PM10 Total
Fugitive PM2.5
Exhaust PM2.5
PM2.5 Total
Bio- CO2ROG NOx CO SO2 Fugitive PM10
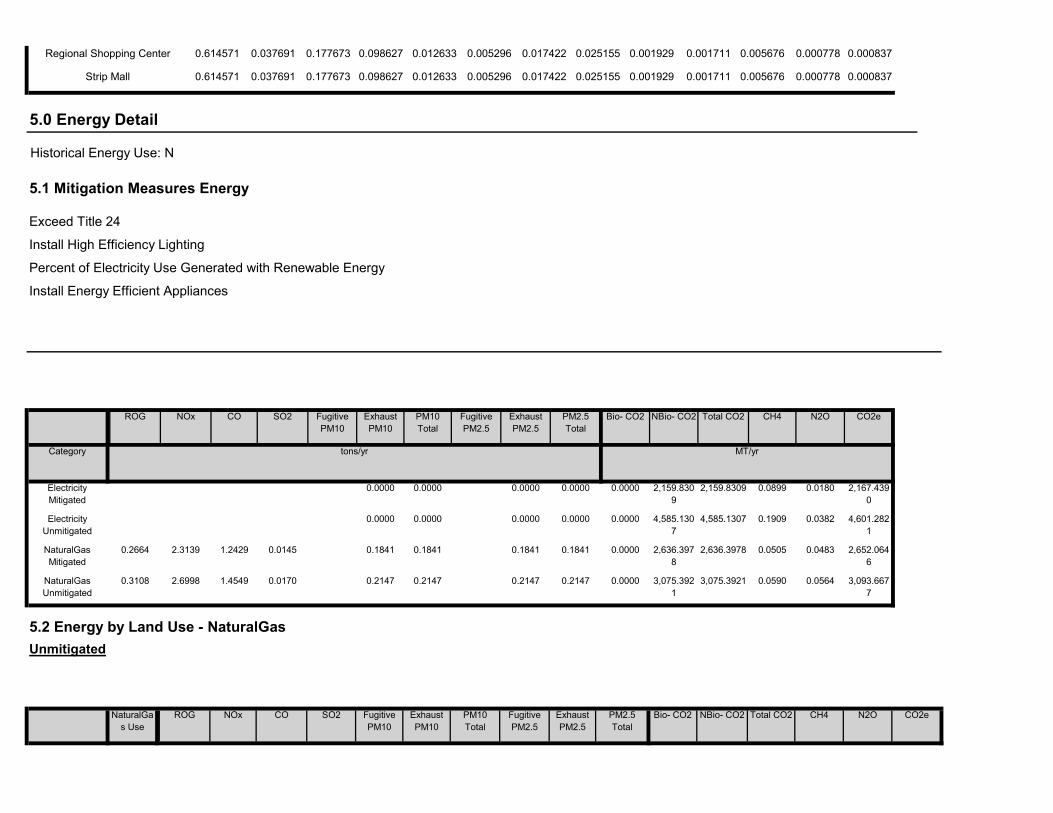
NBio- CO2 Total CO2 CH4 N2O CO2eExhaust PM10
PM10 Total
Fugitive PM2.5
Exhaust PM2.5
PM2.5 Total
Bio- CO2
5.2 Energy by Land Use - NaturalGasUnmitigated
NaturalGas Use
ROG NOx CO SO2 Fugitive PM10
0.0000 3,075.3921
3,075.3921 0.0590 0.0564 3,093.6677
0.2147 0.2147 0.2147 0.2147NaturalGas Unmitigated
0.3108 2.6998 1.4549 0.0170
0.0000 2,636.3978
2,636.3978 0.0505 0.0483 2,652.0646
0.1841 0.1841 0.1841 0.1841NaturalGas Mitigated
0.2664 2.3139 1.2429 0.0145
0.0000 4,585.1307
4,585.1307 0.1909 0.0382 4,601.2821
0.0000 0.0000 0.0000 0.0000Electricity Unmitigated
0.0000 2,159.8309
2,159.8309 0.0899 0.0180 2,167.4390
0.0000 0.0000 0.0000 0.0000Electricity Mitigated
NBio- CO2 Total CO2 CH4 N2O CO2e
Category tons/yr MT/yr
Exhaust PM10
PM10 Total
Fugitive PM2.5
Exhaust PM2.5
PM2.5 Total
Bio- CO2
Install High Efficiency Lighting
Percent of Electricity Use Generated with Renewable Energy
Install Energy Efficient Appliances
ROG NOx CO SO2 Fugitive PM10
0.000778 0.000837
5.0 Energy Detail
Historical Energy Use: N
5.1 Mitigation Measures Energy
Exceed Title 24
0.005296 0.017422 0.025155 0.001929 0.001711 0.005676Strip Mall 0.614571 0.037691 0.177673 0.098627 0.012633
0.025155 0.001929 0.001711 0.005676 0.000778 0.000837Regional Shopping Center 0.614571 0.037691 0.177673 0.098627 0.012633 0.005296 0.017422

Land Use kWh/yr ton
MT/yr
2,652.0646
5.3 Energy by Land Use - ElectricityUnmitigated
Electricity Use
Total CO2 CH4 N2O CO2e
0.1841 0.0000 2,636.3978 2,636.3978
0.0505 0.04830.0145 0.1841 0.1841 0.1841
1.0470 2.0000e-005
2.0000e-005
1.0532
Total 0.2664 2.3139 1.2429
7.0000e-005
7.0000e-005
7.0000e-005
0.0000 1.0470
7.1619
Strip Mall 19620 1.1000e-004
9.6000e-004
8.1000e-004
1.0000e-005
7.0000e-005
5.0000e-004
0.0000 7.1196 7.1196 1.4000e-004
1.3000e-004
4.0000e-005
5.0000e-004
5.0000e-004
5.0000e-004
670.1555 0.0128 0.0123 674.1379
Regional Shopping Center
133416 7.2000e-004
6.5400e-003
5.4900e-003
0.0468 0.0468 0.0468 0.0000 670.1555
1,969.7116
Industrial Park 1.25582e+007
0.0677 0.6156 0.5171 3.6900e-003
0.0468
0.1367 0.0000 1,958.0757 1,958.0757
0.0375 0.03590.0108 0.1367 0.1367 0.1367
Land Use kBTU/yr tons/yr MT/yr
Condo/Townhouse 3.6693e+007
0.1979 1.6908 0.7195
Bio- CO2 NBio- CO2 Total CO2 CH4 N2O CO2eFugitive PM10
Exhaust PM10
PM10 Total
Fugitive PM2.5
Exhaust PM2.5
PM2.5 Total
3,093.6676
Mitigated
NaturalGas Use
ROG NOx CO SO2
0.2147 0.0000 3,075.3921 3,075.3921
0.0589 0.05640.0170 0.2147 0.2147 0.2147
1.1633 2.0000e-005
2.0000e-005
1.1702
Total 0.3108 2.6998 1.4549
8.0000e-005
8.0000e-005
8.0000e-005
0.0000 1.1633
7.9577
Strip Mall 21800 1.2000e-004
1.0700e-003
9.0000e-004
1.0000e-005
8.0000e-005
5.5000e-004
0.0000 7.9107 7.9107 1.5000e-004
1.5000e-004
4.0000e-005
5.5000e-004
5.5000e-004
5.5000e-004
794.8299 0.0152 0.0146 799.5532
Regional Shopping Center
148240 8.0000e-004
7.2700e-003
6.1000e-003
0.0555 0.0555 0.0555 0.0000 794.8299
2,284.9866
Industrial Park 1.48946e+007
0.0803 0.7301 0.6133 4.3800e-003
0.0555
0.1586 0.0000 2,271.4882 2,271.4882
0.0435 0.04160.0125 0.1586 0.1586 0.1586Condo/Townhouse 4.25661e+007
0.2295 1.9614 0.8346
Land Use kBTU/yr tons/yr MT/yr

2,167.4391
6.0 Area Detail
6.1 Mitigation Measures Area
Use Electric Lawnmower
Use Electric Leafblower
Use Electric Chainsaw
Total 2,159.8309 0.0899 0.0180
65.6029
Strip Mall 58832.5 9.6136 4.0000e-004
8.0000e-005
9.6475
Regional Shopping Center
400061 65.3726 2.7200e-003
5.4000e-004
1,314.6403
Industrial Park 4.74166e+006
774.8190 0.0323 6.4500e-003
777.5483
Land Use kWh/yr ton
MT/yr
Condo/Townhouse 8.01697e+006
1,310.0257 0.0546 0.0109
4,601.2821
Mitigated
Electricity Use
Total CO2 CH4 N2O CO2e
Total 4,585.1307 0.1909 0.0382
141.8381
Strip Mall 127200 20.7853 8.7000e-004
1.7000e-004
20.8585
Regional Shopping Center
864960 141.3402 5.8900e-003
1.1800e-003
2,742.5497
Industrial Park 1.03428e+007
1,690.0823 0.0704 0.0141 1,696.0357
Condo/Townhouse 1.67247e+007
2,732.9229 0.1138 0.0228

Mitigated
0.0000 326.4824 326.4824 0.0422 5.2800e-003
329.11270.1501 0.1501 0.1501 0.1501Total 17.8383 0.5187 23.5399 2.8300e-003
0.0000 38.3178 38.3178 0.0367 0.0000 39.23580.1300 0.1300 0.1300 0.1300Landscaping 0.7041 0.2699 23.4340 1.2400e-003
0.0000 288.1646 288.1646 5.5200e-003
5.2800e-003
289.87700.0201 0.0201 0.0201 0.0201Hearth 0.0291 0.2488 0.1059 1.5900e-003
0.0000 0.0000 0.0000 0.0000 0.0000 0.00000.0000 0.0000 0.0000 0.0000Consumer Products
15.6259
0.0000 0.0000 0.0000 0.0000 0.0000 0.00000.0000 0.0000 0.0000 0.0000Architectural Coating
1.4792
NBio- CO2 Total CO2 CH4 N2O CO2e
SubCategory tons/yr MT/yr
Exhaust PM10
PM10 Total
Fugitive PM2.5
Exhaust PM2.5
PM2.5 Total
Bio- CO2
329.1127
6.2 Area by SubCategoryUnmitigated
ROG NOx CO SO2 Fugitive PM10
0.1501 0.0000 326.4824 326.4824 0.0422 5.2800e-003
2.8300e-003
0.1501 0.1501 0.1501
326.1371 326.1371 0.0417 5.2800e-003
328.7544
Unmitigated 17.8383 0.5187 23.5399
0.1491 0.1491 0.1491 0.1491 0.0000
Category tons/yr MT/yr
Mitigated 17.8284 0.5171 23.3711 2.8100e-003
Bio- CO2 NBio- CO2 Total CO2 CH4 N2O CO2eFugitive PM10
Exhaust PM10
PM10 Total
Fugitive PM2.5
Exhaust PM2.5
PM2.5 Total
ROG NOx CO SO2

Unmitigated 1,191.6471 12.7018 0.3078 1,600.9063
Category ton
MT/yr
Mitigated 986.9447 10.1629 0.2465 1,314.4706
Use Water Efficient Irrigation System
Total CO2 CH4 N2O CO2e
7.0 Water Detail
7.1 Mitigation Measures Water
Install Low Flow Bathroom Faucet
Install Low Flow Kitchen Faucet
Install Low Flow Toilet
Install Low Flow Shower
0.0000 326.1371 326.1371 0.0417 5.2800e-003
328.75440.1491 0.1491 0.1491 0.1491Total 17.8284 0.5171 23.3711 2.8200e-003
0.0000 37.9726 37.9726 0.0362 0.0000 38.87740.1290 0.1290 0.1290 0.1290Landscaping 0.6942 0.2682 23.2652 1.2300e-003
0.0000 288.1646 288.1646 5.5200e-003
5.2800e-003
289.87700.0201 0.0201 0.0201 0.0201Hearth 0.0291 0.2488 0.1059 1.5900e-003
0.0000 0.0000 0.0000 0.0000 0.0000 0.00000.0000 0.0000 0.0000 0.0000Consumer Products
15.6259
0.0000 0.0000 0.0000 0.0000 0.0000 0.00000.0000 0.0000 0.0000 0.0000Architectural Coating
1.4792
Total CO2 CH4 N2O CO2e
SubCategory tons/yr MT/yr
PM10 Total
Fugitive PM2.5
Exhaust PM2.5
PM2.5 Total
Bio- CO2 NBio- CO2ROG NOx CO SO2 Fugitive PM10
Exhaust PM10

1,314.4706
8.0 Waste Detail
Total 986.9447 10.1629 0.2465
19.3700
Strip Mall 0.59258 / 0.426299
2.2228 0.0194 4.7000e-004
2.8485
Regional Shopping Center
4.02955 / 2.89884
15.1148 0.1319 3.2200e-003
797.4277
Industrial Park 141.525 / 0 346.0246 4.6241 0.1114 494.8244
Land Use Mgal ton
MT/yr
Condo/Townhouse 164.605 / 121.803
623.5825 5.3875 0.1314
1,600.9063
Mitigated
Indoor/Outdoor Use
Total CO2 CH4 N2O CO2e
Total 1,191.6471 12.7018 0.3078
23.2353
Strip Mall 0.740725 / 0.453993
2.6353 0.0242 5.9000e-004
3.4170
Regional Shopping Center
5.03693 / 3.08715
17.9197 0.1648 4.0100e-003
955.7236
Industrial Park 176.906 / 0 432.5308 5.7802 0.1393 618.5305
Land Use Mgal ton
MT/yr
Condo/Townhouse 205.756 / 129.716
738.5613 6.7326 0.1639
7.2 Water by Land UseUnmitigated
Indoor/Outdoor Use
Total CO2 CH4 N2O CO2e

1,248.7950
Mitigated
Total 504.0631 29.7893 0.0000
35.9072
Strip Mall 10.5 2.1314 0.1260 0.0000 5.2805
Regional Shopping Center
71.4 14.4936 0.8565 0.0000
730.5550
Industrial Park 948.6 192.5572 11.3798 0.0000 477.0524
Land Use tons ton
MT/yr
Condo/Townhouse 1452.68 294.8809 17.4270 0.0000
8.2 Waste by Land UseUnmitigated
Waste Disposed
Total CO2 CH4 N2O CO2e
Unmitigated 504.0631 29.7893 0.0000 1,248.7950
ton
MT/yr
Mitigated 504.0631 29.7893 0.0000 1,248.7950
8.1 Mitigation Measures Waste
Category/Year
Total CO2 CH4 N2O CO2e

User Defined Equipment
Equipment Type Number
11.0 Vegetation
Load Factor Fuel Type
Boilers
Equipment Type Number Heat Input/Day Heat Input/Year Boiler Rating Fuel Type
Horse Power Load Factor Fuel Type
10.0 Stationary Equipment
Fire Pumps and Emergency Generators
Equipment Type Number Hours/Day Hours/Year Horse Power
1,248.7950
9.0 Operational Offroad
Equipment Type Number Hours/Day Days/Year
Total 504.0631 29.7893 0.0000
35.9072
Strip Mall 10.5 2.1314 0.1260 0.0000 5.2805
Regional Shopping Center
71.4 14.4936 0.8565 0.0000
730.5550
Industrial Park 948.6 192.5572 11.3798 0.0000 477.0524
Land Use tons ton
MT/yr
Condo/Townhouse 1452.68 294.8809 17.4270 0.0000
Waste Disposed
Total CO2 CH4 N2O CO2e

-827.1843Total -827.1843 0.0000 0.0000
-7.2930
Wetlands 0.83 / 0.3 0.0000 0.0000 0.0000 0.0000
Scrub 0.51 / 0 -7.2930 0.0000 0.0000
0.0000
Others 7.26 / 0 0.0000 0.0000 0.0000 0.0000
Others 2.97 / 0 0.0000 0.0000 0.0000
-812.7798
Grassland 1.65 / 0 -7.1115 0.0000 0.0000 -7.1115
Acres ton
MT
Grassland 239.91 / 51.33
-812.7798 0.0000 0.0000
11.1 Vegetation Land ChangeVegetation Type
Initial/Final Total CO2 CH4 N2O CO2e
Category ton
MT
Unmitigated -827.1843 0.0000 0.0000 -827.1843
Total CO2 CH4 N2O CO2e

tblAreaCoating Area_EF_Nonresidential_Interior 250 50
tblAreaMitigation UseLowVOCPaintNonresidentialExteriorValue
100 0
tblArchitecturalCoating EF_Parking 250.00 0.00
tblAreaCoating Area_EF_Nonresidential_Exterior 250 100
1.3 User Entered Comments & Non-Default Data
Vehicle Emission Factors -
Vehicle Emission Factors -
Vehicle Emission Factors -
Area Coating - Rule 67.0.1 coatings
Table Name Column Name Default Value New Value
CO2 Intensity (lb/MWhr)
360.25 CH4 Intensity (lb/MWhr)
0.015 N2O Intensity (lb/MWhr)
0.003
40
Climate Zone 13 Operational Year 2028
Utility Company San Diego Gas & Electric
1.2 Other Project Characteristics
Urbanization Urban Wind Speed (m/s) 2.6 Precipitation Freq (Days)
Regional Shopping Center 383.18 1000sqft 8.80 383,180.00 0
Floor Surface Area Population
Industrial Park 1,562.20 1000sqft 35.86 1,562,200.00 0
1.0 Project Characteristics
1.1 Land Usage
Land Uses Size Metric Lot Acreage
CalEEMod Version: CalEEMod.2016.3.1 Page 1 of 1 Date: 10/26/2016 11:08 AM
East Otay Mesa Existing Entitlement - San Diego Air Basin, Annual
East Otay Mesa Existing EntitlementSan Diego Air Basin, Annual

tblTripsAndVMT WorkerTripNumber 156.00 0.00
tblTripsAndVMT WorkerTripNumber 779.00 0.00
tblProjectCharacteristics N2OIntensityFactor 0.006 0.003
tblProjectCharacteristics OperationalYear 2018 2028
tblProjectCharacteristics CH4IntensityFactor 0.029 0.015
tblProjectCharacteristics CO2IntensityFactor 720.49 360.25
tblOffRoadEquipment UsageHours 7.00 8.00
tblOffRoadEquipment UsageHours 8.00 6.00
tblOffRoadEquipment UsageHours 8.00 1.00
tblOffRoadEquipment UsageHours 8.00 1.00
tblOffRoadEquipment UsageHours 8.00 7.00
tblOffRoadEquipment UsageHours 8.00 7.00
tblOffRoadEquipment UsageHours 7.00 4.00
tblOffRoadEquipment UsageHours 8.00 6.00
tblOffRoadEquipment OffRoadEquipmentUnitAmount 3.00 2.00
tblOffRoadEquipment OffRoadEquipmentUnitAmount 4.00 1.00
tblOffRoadEquipment OffRoadEquipmentUnitAmount 2.00 1.00
tblOffRoadEquipment OffRoadEquipmentUnitAmount 2.00 1.00
tblOffRoadEquipment OffRoadEquipmentUnitAmount 3.00 2.00
tblOffRoadEquipment OffRoadEquipmentUnitAmount 2.00 1.00
tblConstructionPhase NumDays 55.00 0.00
tblConstructionPhase NumDays 30.00 0.00
tblConstructionPhase NumDays 50.00 0.00
tblConstructionPhase NumDays 75.00 0.00
tblConstructionPhase NumDays 55.00 0.00
tblConstructionPhase NumDays 740.00 0.00
tblAreaMitigation UseLowVOCPaintResidentialExteriorValue
250 0
tblAreaMitigation UseLowVOCPaintResidentialInteriorValue
250 0
tblAreaMitigation UseLowVOCPaintNonresidentialInteriorValue
50 0
tblAreaMitigation UseLowVOCPaintParkingValue 250 0

598.5067 31,760.4539
32,358.9606
42.2576 0.3748 33,527.0748
28.0805 0.3162 28.3967 7.5168 0.3024 7.8192Total 14.8092 28.6663 71.7974 0.2771
123.6154 860.6297 984.2451 12.7323 0.3070 1,394.0267
0.0000 0.0000 0.0000 0.0000Water
474.8913 0.0000 474.8913 28.0653 0.0000 1,176.5230
0.0000 0.0000 0.0000 0.0000Waste
0.0000 24,844.5137
24,844.5137
1.2467 0.0000 24,875.6822
28.0805 0.1950 28.2755 7.5168 0.1811 7.6980Mobile 6.4709 27.0719 70.4403 0.2675
0.0000 6,055.2757
6,055.2757 0.2131 0.0678 6,080.8059
0.1212 0.1212 0.1212 0.1212Energy 0.1754 1.5943 1.3392 9.5700e-003
0.0000 0.0348 0.0348 9.0000e-005
0.0000 0.03706.0000e-005
6.0000e-005
6.0000e-005
6.0000e-005
Area 8.1629 1.6000e-004
0.0178 0.0000
Total CO2 CH4 N2O CO2e
Category tons/yr MT/yr
PM10 Total
Fugitive PM2.5
Exhaust PM2.5
PM2.5 Total
Bio- CO2 NBio- CO2
2.2 Overall OperationalUnmitigated Operational
ROG NOx CO SO2 Fugitive PM10
Exhaust PM10
2.0 Emissions Summary
tblVehicleTrips WD_TR 6.83 10.00
tblVehicleTrips WD_TR 42.70 50.00
tblVehicleTrips SU_TR 0.73 10.00
tblVehicleTrips SU_TR 25.24 50.00
tblVehicleTrips ST_TR 2.49 10.00
tblVehicleTrips ST_TR 49.97 50.00
tblTripsAndVMT WorkerTripNumber 23.00 18.00
tblTripsAndVMT WorkerTripNumber 13.00 5.00
tblTripsAndVMT WorkerTripNumber 18.00 10.00
tblTripsAndVMT WorkerTripNumber 23.00 10.00

Vegetation Land Change
-827.1843
Total -827.1843
2.3 VegetationVegetation
CO2e
Category ton
MT
43.80 6.15 6.85 39.41 16.37 7.917.84 4.08 7.80 7.84 3.96 7.69
NBio-CO2 Total CO2 CH4 N20 CO2e
Percent Reduction
1.29 3.08 5.64 6.96
Exhaust PM10
PM10 Total
Fugitive PM2.5
Exhaust PM2.5
PM2.5 Total
Bio- CO2ROG NOx CO SO2 Fugitive PM10
336.3379 29,806.0789
30,142.4169
25.6021 0.3134 30,875.8606
25.8792 0.3033 26.1826 6.9276 0.2904 7.2180Total 14.6187 27.7848 67.7479 0.2578
98.8923 692.8936 791.7859 10.1860 0.2456 1,119.6267
0.0000 0.0000 0.0000 0.0000Water
237.4456 0.0000 237.4456 14.0326 0.0000 588.26150.0000 0.0000 0.0000 0.0000Waste
0.0000 23,057.8753
23,057.8753
1.1702 0.0000 23,087.1300
25.8792 0.1821 26.0613 6.9276 0.1691 7.0967Mobile 6.2805 26.1903 66.3911 0.2482
0.0000 6,055.2757
6,055.2757 0.2131 0.0678 6,080.8059
0.1212 0.1212 0.1212 0.1212Energy 0.1754 1.5943 1.3392 9.5700e-003
0.0000 0.0343 0.0343 9.0000e-005
0.0000 0.03656.0000e-005
6.0000e-005
6.0000e-005
6.0000e-005
Area 8.1629 1.6000e-004
0.0176 0.0000
Total CO2 CH4 N2O CO2e
Category tons/yr MT/yr
PM10 Total
Fugitive PM2.5
Exhaust PM2.5
PM2.5 Total
Bio- CO2 NBio- CO2
Mitigated Operational
ROG NOx CO SO2 Fugitive PM10
Exhaust PM10

SBUS MHLHD2 MHD HHD OBUS UBUS MCYLand Use LDA LDT1 LDT2 MDV LHD1
64.70 19.00 54 35 11
4.4 Fleet Mix
28.00 13.00 79 19 2
Regional Shopping Center 9.50 7.30 7.30 16.30
H-S or C-C H-O or C-NW Primary Diverted Pass-by
Industrial Park 9.50 7.30 7.30 59.00
4.3 Trip Type Information
Miles Trip % Trip Purpose %
Land Use H-W or C-W H-S or C-C H-O or C-NW H-W or C-W
Total 34,781.00 34,781.00 34,781.00 74,549,769 68,705,812Regional Shopping Center 19,159.00 19,159.00 19159.00 33,591,567 30,958,324
Annual VMT
Industrial Park 15,622.00 15,622.00 15622.00 40,958,202 37,747,488
4.2 Trip Summary Information
Average Daily Trip Rate Unmitigated MitigatedLand Use Weekday Saturday Sunday Annual VMT
0.0000 24,844.5137
24,844.5137
1.2467 0.0000 24,875.6822
28.0805 0.1950 28.2755 7.5168 0.1811 7.6980Unmitigated 6.4709 27.0719 70.4403 0.2675
0.0000 23,057.8753
23,057.8753
1.1702 0.0000 23,087.1300
25.8792 0.1821 26.0613 6.9276 0.1691 7.0967Mitigated 6.2805 26.1903 66.3911 0.2482
NBio- CO2 Total CO2 CH4 N2O CO2e
Category tons/yr MT/yr
Exhaust PM10
PM10 Total
Fugitive PM2.5
Exhaust PM2.5
PM2.5 Total
Bio- CO2
4.0 Operational Detail - Mobile
4.1 Mitigation Measures Mobile
Increase Transit Accessibility
ROG NOx CO SO2 Fugitive PM10

45.8034 8.8000e-004
8.4000e-004
46.07563.2000e-003
3.2000e-003
3.2000e-003
0.0000 45.8034
1,699.8490
Regional Shopping Center
858323 4.6300e-003
0.0421 0.0353 2.5000e-004
3.2000e-003
0.1180 0.0000 1,689.8074 1,689.8074
0.0324 0.03109.3100e-003
0.1180 0.1180 0.1180Industrial Park 3.16658e+007
0.1708 1.5522 1.3039
NBio- CO2 Total CO2 CH4 N2O CO2e
Land Use kBTU/yr tons/yr MT/yr
Exhaust PM10
PM10 Total
Fugitive PM2.5
Exhaust PM2.5
PM2.5 Total
Bio- CO2
5.2 Energy by Land Use - NaturalGasUnmitigated
NaturalGas Use
ROG NOx CO SO2 Fugitive PM10
0.0000 1,735.6108
1,735.6108 0.0333 0.0318 1,745.9246
0.1212 0.1212 0.1212 0.1212NaturalGas Unmitigated
0.1754 1.5943 1.3392 9.5700e-003
0.0000 1,735.6108
1,735.6108 0.0333 0.0318 1,745.9246
0.1212 0.1212 0.1212 0.1212NaturalGas Mitigated
0.1754 1.5943 1.3392 9.5700e-003
0.0000 4,319.6650
4,319.6650 0.1799 0.0360 4,334.8812
0.0000 0.0000 0.0000 0.0000Electricity Unmitigated
0.0000 4,319.6650
4,319.6650 0.1799 0.0360 4,334.8812
0.0000 0.0000 0.0000 0.0000
CO2e
Category tons/yr MT/yr
Electricity Mitigated
PM2.5 Total
Bio- CO2 NBio- CO2 Total CO2 CH4 N2OSO2 Fugitive PM10
Exhaust PM10
PM10 Total
Fugitive PM2.5
Exhaust PM2.5
0.000778 0.000837
5.0 Energy Detail
Historical Energy Use: N
5.1 Mitigation Measures Energy
ROG NOx CO
0.005296 0.017422 0.025155 0.001929 0.001711 0.005676Regional Shopping Center 0.614571 0.037691 0.177673 0.098627 0.012633
0.025155 0.001929 0.001711 0.005676 0.000778 0.000837Industrial Park 0.614571 0.037691 0.177673 0.098627 0.012633 0.005296 0.017422

4,334.8812
Mitigated
Total 4,319.6650 0.1799 0.0360
3,524.9417
Regional Shopping Center
4.93919e+006
807.0965 0.0336 6.7200e-003
809.9396
Land Use kWh/yr ton
MT/yr
Industrial Park 2.14959e+007
3,512.5685 0.1463 0.0293
1,745.9246
5.3 Energy by Land Use - ElectricityUnmitigated
Electricity Use
Total CO2 CH4 N2O CO2e
0.1212 0.0000 1,735.6108 1,735.6108
0.0333 0.03189.5600e-003
0.1212 0.1212 0.1212
45.8034 8.8000e-004
8.4000e-004
46.0756
Total 0.1754 1.5943 1.3392
3.2000e-003
3.2000e-003
3.2000e-003
0.0000 45.8034
1,699.8490
Regional Shopping Center
858323 4.6300e-003
0.0421 0.0353 2.5000e-004
3.2000e-003
0.1180 0.0000 1,689.8074 1,689.8074
0.0324 0.03109.3100e-003
0.1180 0.1180 0.1180
Land Use kBTU/yr tons/yr MT/yr
Industrial Park 3.16658e+007
0.1708 1.5522 1.3039
Bio- CO2 NBio- CO2 Total CO2 CH4 N2O CO2eFugitive PM10
Exhaust PM10
PM10 Total
Fugitive PM2.5
Exhaust PM2.5
PM2.5 Total
1,745.9246
Mitigated
NaturalGas Use
ROG NOx CO SO2
0.1212 0.0000 1,735.6108 1,735.6108
0.0333 0.03189.5600e-003
0.1212 0.1212 0.1212Total 0.1754 1.5943 1.3392
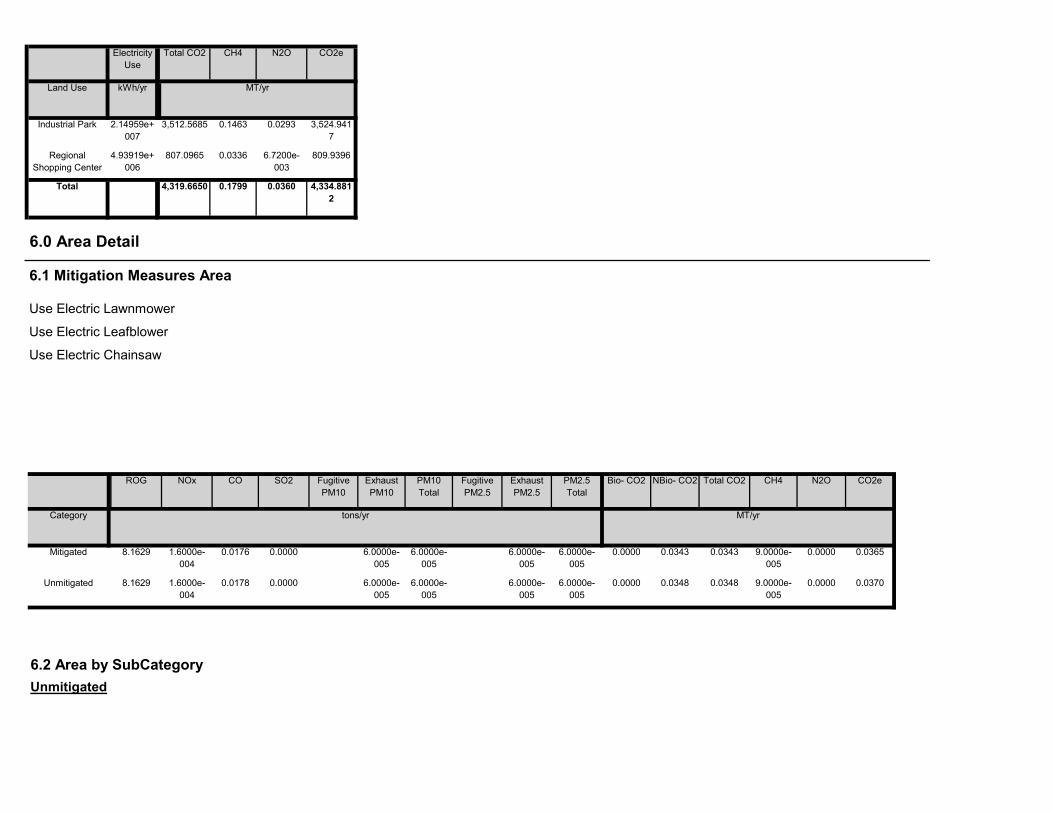
0.0370
6.2 Area by SubCategoryUnmitigated
6.0000e-005
0.0000 0.0348 0.0348 9.0000e-005
0.00000.0000 6.0000e-005
6.0000e-005
6.0000e-005
0.0343 0.0343 9.0000e-005
0.0000 0.0365
Unmitigated 8.1629 1.6000e-004
0.0178
6.0000e-005
6.0000e-005
6.0000e-005
6.0000e-005
0.0000
Category tons/yr MT/yr
Mitigated 8.1629 1.6000e-004
0.0176 0.0000
Bio- CO2 NBio- CO2 Total CO2 CH4 N2O CO2eFugitive PM10
Exhaust PM10
PM10 Total
Fugitive PM2.5
Exhaust PM2.5
PM2.5 Total
ROG NOx CO SO2
4,334.8812
6.0 Area Detail
6.1 Mitigation Measures Area
Use Electric Lawnmower
Use Electric Leafblower
Use Electric Chainsaw
Total 4,319.6650 0.1799 0.0360
3,524.9417
Regional Shopping Center
4.93919e+006
807.0965 0.0336 6.7200e-003
809.9396
Land Use kWh/yr ton
MT/yr
Industrial Park 2.14959e+007
3,512.5685 0.1463 0.0293
Electricity Use
Total CO2 CH4 N2O CO2e

Use Water Efficient Irrigation System
7.0 Water Detail
7.1 Mitigation Measures Water
Install Low Flow Bathroom Faucet
Install Low Flow Kitchen Faucet
Install Low Flow Toilet
Install Low Flow Shower
0.0000 0.0343 0.0343 9.0000e-005
0.0000 0.03656.0000e-005
6.0000e-005
6.0000e-005
6.0000e-005
Total 8.1628 1.6000e-004
0.0176 0.0000
0.0000 0.0343 0.0343 9.0000e-005
0.0000 0.03656.0000e-005
6.0000e-005
6.0000e-005
6.0000e-005
Landscaping 1.6100e-003
1.6000e-004
0.0176 0.0000
0.0000 0.0000 0.0000 0.0000 0.0000 0.00000.0000 0.0000 0.0000 0.0000Consumer Products
7.5977
0.0000 0.0000 0.0000 0.0000 0.0000 0.00000.0000 0.0000 0.0000 0.0000Architectural Coating
0.5636
Total CO2 CH4 N2O CO2e
SubCategory tons/yr MT/yr
PM10 Total
Fugitive PM2.5
Exhaust PM2.5
PM2.5 Total
Bio- CO2 NBio- CO2
Mitigated
ROG NOx CO SO2 Fugitive PM10
Exhaust PM10
0.0000 0.0348 0.0348 9.0000e-005
0.0000 0.03706.0000e-005
6.0000e-005
6.0000e-005
6.0000e-005
Total 8.1629 1.6000e-004
0.0178 0.0000
0.0000 0.0348 0.0348 9.0000e-005
0.0000 0.03706.0000e-005
6.0000e-005
6.0000e-005
6.0000e-005
Landscaping 1.6400e-003
1.6000e-004
0.0178 0.0000
0.0000 0.0000 0.0000 0.0000 0.0000 0.00000.0000 0.0000 0.0000 0.0000Consumer Products
7.5977
0.0000 0.0000 0.0000 0.0000 0.0000 0.00000.0000 0.0000 0.0000 0.0000Architectural Coating
0.5636
NBio- CO2 Total CO2 CH4 N2O CO2e
SubCategory tons/yr MT/yr
Exhaust PM10
PM10 Total
Fugitive PM2.5
Exhaust PM2.5
PM2.5 Total
Bio- CO2ROG NOx CO SO2 Fugitive PM10

Land Use Mgal ton
MT/yr
1,394.0267
Mitigated
Indoor/Outdoor Use
Total CO2 CH4 N2O CO2e
Total 984.2451 12.7323 0.3070
1,263.0958
Regional Shopping Center
28.3831 / 17.3961
100.9776 0.9287 0.0226 130.9309
Land Use Mgal ton
MT/yr
Industrial Park 361.259 / 0 883.2675 11.8036 0.2844
7.2 Water by Land UseUnmitigated
Indoor/Outdoor Use
Total CO2 CH4 N2O CO2e
Unmitigated 984.2451 12.7323 0.3070 1,394.0267
Category ton
MT/yr
Mitigated 791.7859 10.1860 0.2456 1,119.6267
Total CO2 CH4 N2O CO2e

974.1856
Regional Shopping Center
402.34 81.6714 4.8266 0.0000 202.3374
Land Use tons ton
MT/yr
Industrial Park 1937.13 393.2199 23.2386 0.0000
8.2 Waste by Land UseUnmitigated
Waste Disposed
Total CO2 CH4 N2O CO2e
Unmitigated 474.8913 28.0653 0.0000 1,176.5230
CO2e
ton
MT/yr
Mitigated 237.4456 14.0326 0.0000 588.2615
1,119.6267
8.0 Waste Detail
8.1 Mitigation Measures Waste
Institute Recycling and Composting Services
Category/Year
Total CO2 CH4 N2O
Total 791.7859 10.1860 0.2456
1,010.4766
Regional Shopping Center
22.7065 / 16.3349
85.1720 0.7431 0.0181 109.1501
Industrial Park 289.007 / 0 706.6140 9.4429 0.2275

User Defined Equipment
Equipment Type Number
11.0 Vegetation
Load Factor Fuel Type
Boilers
Equipment Type Number Heat Input/Day Heat Input/Year Boiler Rating Fuel Type
Horse Power Load Factor Fuel Type
10.0 Stationary Equipment
Fire Pumps and Emergency Generators
Equipment Type Number Hours/Day Hours/Year Horse Power
588.2615
9.0 Operational Offroad
Equipment Type Number Hours/Day Days/Year
Total 237.4456 14.0326 0.0000
487.0928
Regional Shopping Center
201.17 40.8357 2.4133 0.0000 101.1687
Land Use tons ton
MT/yr
Industrial Park 968.565 196.6099 11.6193 0.0000
1,176.5230
Mitigated
Waste Disposed
Total CO2 CH4 N2O CO2e
Total 474.8913 28.0653 0.0000

-827.1843Total -827.1843 0.0000 0.0000
-7.2930
Wetlands 0.83 / 0.3 0.0000 0.0000 0.0000 0.0000
Scrub 0.51 / 0 -7.2930 0.0000 0.0000
0.0000
Others 7.26 / 0 0.0000 0.0000 0.0000 0.0000
Others 2.97 / 0 0.0000 0.0000 0.0000
-812.7798
Grassland 1.65 / 0 -7.1115 0.0000 0.0000 -7.1115
Acres ton
MT
Grassland 239.91 / 51.33
-812.7798 0.0000 0.0000
11.1 Vegetation Land ChangeVegetation Type
Initial/Final Total CO2 CH4 N2O CO2e
Category ton
MT
Unmitigated -827.1843 0.0000 0.0000 -827.1843
Total CO2 CH4 N2O CO2e