eastern, new age beliefs widespread many … eastern, new age beliefs widespread many americans mix...
TRANSCRIPT

Self-identifiedProtestant
Believes inAstrology
AttendsCatholic Mass
Eastern, New Age Beliefs Widespread
Many AmericansMix Multiple FaithsPew Forum on Religion & Public Life
December 2009

1
Eastern, New Age Beliefs Widespread MANY AMERICANS MIX MULTIPLE FAITHS1 The religious beliefs and practices of Americans do not fit neatly into conventional categories. A new poll by the Pew Research Center’s Forum on Religion & Public Life finds that large numbers of Americans engage in multiple religious practices, mixing elements of diverse traditions. Many say they attend worship services of more than one faith or denomination -- even when they are not traveling or going to special events like weddings and funerals. Many also blend Christianity with Eastern or New Age beliefs such as reincarnation, astrology and the presence of spiritual energy in physical objects. And sizeable minorities of all major U.S. religious groups say they have experienced supernatural phenomena, such as being in touch with the dead or with ghosts. One-third of Americans (35%) say they regularly (9%) or occasionally (26%) attend religious services at more than one place, and most of these (24% of the public overall) indicate that they sometimes attend religious services of a faith different from their own. Aside from when they are traveling and special events like weddings and funerals, three-in-ten Protestants attend services outside their own denomination, and one-fifth of Catholics say they sometimes attend non-Catholic services. Among those who attend religious services at least once a week, nearly four-in-ten (39%) say they attend at multiple places and nearly three-in-ten (28%) go to services outside their own faith, according to the Pew Forum survey, which was conducted Aug. 11-27 among 4,013 adults reached on both landlines and cell phones. Attending services at more than one place and across multiple religious traditions is even more common among those who go to religious services on a monthly
Note: Circles on cover are not to scale.
Different Types of Religious Services
---------------Protestant--------------- All White White adults Total evang mainline Black Catholic % % % % % Attend only one place 37 44 54 36 40 42 Attend multiple places 35 39 37 31 57 40 Only of own faith 11 9 9 7 15 21 Different faiths 24 30 28 24 42 19 Seldom/Never attend/DK 28 17 9 34 3 18 100 100 100 100 100 100
How often attend other places? Regularly 9 8 6 6 12 9 Occasionally 26 31 31 25 45 30 Total attend multiple places 35 39 37 31 57 40
Sample size 2,003 1,099 465 402 135 437
Q281-Q282f.

2
or yearly basis, with nearly six-in-ten (59%) saying they attend at multiple places and four-in-ten attending services from outside their own faith at least sometimes. Religiously mixed marriages are common in the United States, and the survey finds that the link between being in a religiously mixed union and attendance at multiple types of services is a complex one. Overall, people in religiously mixed marriages attend worship services less often than people married to someone of the same faith. But among those who attend religious services at least yearly, those in religiously mixed marriages attend multiple types of services at a higher rate than people married to someone of the same religion. Though the U.S. is an overwhelmingly Christian country, significant minorities profess belief in a variety of Eastern or New Age beliefs. For instance, 24% of the public overall and 22% of Christians say they believe in reincarnation -- that people will be reborn in this world again and again. And similar numbers (25% of the public overall, 23% of Christians) believe in astrology. Nearly three-in-ten Americans say they have felt in touch with someone who has already died, almost one-in-five say they have seen or been in the presence of ghosts, and 15% have consulted a fortuneteller or a psychic. Nearly half of the public (49%) says they have had a religious or mystical experience, defined as a “moment of sudden religious insight or awakening.” This is similar to a survey conducted in 2006 but much higher than in surveys conducted in 1976 and 1994 and more than twice as high as a 1962 Gallup survey (22%). In fact, this year’s survey finds that religious and mystical experiences are more common today among those who are unaffiliated with any particular religion (30%) than they were in the 1960s among the public as whole (22%).
Supernatural Experiences and Beliefs
Total Christians % who have… % % Been in touch w/dead 29 29 Had ghostly experience 18 17 Consulted psychic 15 14
% believe in… Spiritual energy in trees, etc. 26 23 Astrology 25 23 Reincarnation 24 22 Yoga as spiritual practice 23 21 Evil eye (i.e., casting of curses) 16 17
Sample size 2,003 1,589
Q291a-Q292c.
Ever Had Religious or Mystical Experience?
49
22
3331
78
48
69 65
Yes No
1962 1976 1994 2009
Feb. 62 and Aug. 76 surveys by Gallup; Nov. 94 by Newsweek; Apr. 06 by Ipsos
Q290.

3
Attendance at Multiple Types of Religious Services Nearly three-quarters of Americans (72%) say they attend
religious services at least a few times a year, including 38% who say they attend at least once a week and 34% who attend once or twice a month or a few times a year. Roughly one-quarter says they seldom or never attend religious services (27%). These figures are roughly consistent with findings from recent years.
Of those who attend at least yearly, roughly half (37% of the
public overall) say they always attend services at the same place, while nearly as many (35%) say they regularly or occasionally attend religious services at different places, aside from when they are traveling and going to special events such as weddings and funerals. To estimate the number of Americans who attend multiple types of religious services, the survey followed up by asking people who attend religious services at different places about the types of services (e.g., Protestant, Catholic, Jewish, etc.) they attend. Overall, about one-in-four adults (24%) indicate that they attend services of at least one faith other than their own, and roughly one-in-ten (12%) say they participate in the services of two or more faiths in addition to their own.
Attendance at Religious Services
% Weekly or more 38 Monthly/yearly 34 Seldom/never 27 Don’t know 1 100
ATTEND. Figures may not sum to 100% due to rounding.
Attendance at Different Types of Religious Services
------------Protestants------------ ---Catholics--- All White White White Unaffil- adults Total evang mainline Black Total non-Hisp iated % % % % % % % % Attend only one place* 37 44 54 36 40 42 43 11 Attend multiple places 35 39 37 31 57 40 34 19 Only of own faith** 11 9 9 7 15 21 16 n/a Different faiths*** 24 30 28 24 42 19 18 n/a One other faith 12 15 15 11 18 13 12 n/a Two other faiths 8 10 9 8 14 5 5 n/a Three or more 4 4 3 5 9 1 1 n/a Seldom/Never attend/DK 28 17 9 34 3 18 23 70 100 100 100 100 100 100 100 100
Type of other service…^ Prot/Diff Prot churches n/a 26 24 22 40 18 16 12 Catholic Masses n/a 15 13 14 19 n/a n/a 8 Jewish synagogues n/a 4 3 4 8 5 5 3 Muslim mosques n/a 1 1 * 5 1 1 1 Other kinds of services n/a 3 3 3 7 2 3 3
Sample size 2,003 1,099 465 402 135 437 338 302
ATTEND, Q281-Q282f. *Includes those answering “Don’t know/Refused” in Q281. **Includes those answering all questions in the Q281a-f series negatively. ***Includes those answering at least one question in the Q281a-f series affirmatively. ^Based on total. Responses do not sum to the total attending “different faiths” because respondents could name more than one different faith in which they participate.

4
Three-in-ten Protestants say they attend multiple types of religious services, including those who attend services at Protestant denominations different than their own; 18% of Protestants indicate that they attend non-Protestant services.
More than four-in-ten black Protestants (42%) and roughly one-quarter of white
evangelical and mainline Protestants (28% and 24%, respectively) regularly or occasionally attend services at a faith other than their own. Among all three groups of Protestants, the most commonly cited type of services attended (other than services of one’s own faith) are those of other Protestant denominations (40% among black Protestants, 24% among white evangelicals and 22% among white mainline Protestants). However, significant numbers within all three Protestant traditions report sometimes attending Catholic Mass; this includes nearly one-in-five black Protestants (19%), 13% of white evangelicals and 14% of mainline Protestants. Fewer say they attend Jewish synagogues or Muslim mosques.
Roughly one-in-five Catholics say they attend services of at least one faith other than
Catholicism, with most of these (18% of Catholics overall and 16% of white Catholics) saying they attend Protestant services. About one-in-twenty Catholics report attending services at Jewish synagogues (5%) and 1% say they attend Muslim mosques.

5
Attending religious services at more than one place is most common among those who attend services only occasionally. Among those who attend services once or twice a month or a few times a year, fully six-in-ten (59%) attend services at more than one place, including four-in-ten who attend religious services of faiths other than their own. Among those who say they attend services on a weekly basis, fewer say they attend at more than one place (39%); still, more than a quarter of Americans who are regular, weekly attenders at religious services (28%) say they also attend services outside their own faith, not counting when they are traveling or special occasions like weddings and funerals. (Respondents who seldom or never attend religious services were not asked about where they attend.)
The survey finds a complex link between attending multiple types of religious services and being in religiously mixed marriages. The key distinction between those in religiously mixed versus religiously matched marriages is in the overall level of religious commitment, with those in religiously mixed marriages exhibiting lower levels of religious commitment, as measured by frequency of attendance at worship services. Among those in religiously mixed marriages, fully four-in-ten (43%) say they seldom or never attend religious services, twice as high as seen among those married to someone of the same faith (21%).
On the surface, people who are married to a spouse from a faith different than their own
are neither more nor less likely than married people overall to attend multiple types of religious services (25% among all of those in religiously mixed relationships, 24% among those in religiously matched marriages). However, among those who attend religious services at least
Attendance at Multiple Types of Religious Services
----------Marital status^---------- Worship attendance Spouse Spouse At least Monthly/ Not Total same different weekly yearly married married religion religion % % % % % % Attend only one place* 61 41 32 40 43 27 Attend multiple places 39 59 36 34 36 30 But only of own faith** 11 19 12 10 12 5 Different faiths*** 28 40 24 24 24 25 Seldom/never attend/DK -- -- 32 26 21 43 100 100 100 100 100 100
Sample size 825 653 784 1,219 953 266
ATTEND, Q281-Q282f. *Includes those answering “Don’t know/Refused” in Q281. **Includes those answering all questions in the Q281a-f series negatively. ***Includes those answering at least one question in the Q281a-f series affirmatively. ^Figures include respondents who say they are married and respondents who say they are living with a partner. “Spouse same religion” category includes affiliated respondents married to spouses of same faith and unaffiliated respondents married to unaffiliated spouses. “Spouse different religion” includes affiliated respondents married to unaffiliated spouses, and unaffiliated respondents married to affiliated spouses.

6
yearly, more than four-in-ten in mixed marriages attend services of faiths different than their own, compared with roughly three-in-ten of those married to someone of the same faith. Worship Venues
In addition to asking about the types of religious services that people attend, the survey also asked about the locations or venues in which these services are held. Most people who attend services at least yearly do so at a church or other house of worship. But a significant minority of Americans (11%) say they go to services at other locations, either instead of (3%) or in addition to (8%) services in a regular house of worship.
Roughly one-in-six white evangelicals attend religious services in a place other than a
church or house of worship (16%), as do 13% of black Protestants. Nearly one-in-ten white mainline Protestants say the same (9%), while the comparable figures among Catholics and the unaffiliated are 5% and 6%, respectively.
Homes are the most popular alternative venue to churches and other houses of worship.
About 7% of Americans say they attend religious services in someone’s home. Attending services in homes is somewhat more common among Protestants (9%) than among Catholics (4%).
Where Do You Attend Services?
------------Protestants------------ ---Catholics-- All White White Black White Unaffil- adults Total evang mainline Prot Total non-Hisp iated % % % % % % % % Attend at least yearly 72 83 91 66 97 82 77 30 Churches/Houses of worship 60 70 75 58 84 75 74 23 Other places 3 4 5 2 3 1 1 1 Both 8 9 10 6 10 4 3 5 Don’t know/Refused 1 * * * 1 2 * 1 Seldom/Never attend/DK 28 17 9 34 3 18 23 70 100 100 100 100 100 100 100 100
Total attending at… Houses 7 9 11 7 8 4 2 2 Schools 1 2 2 1 1 * * 0 Parks/Campgrounds 1 1 2 * 1 1 * * Restaurants 1 1 1 1 * 0 0 * Hotels 1 1 * 0 4 0 0 0 Other – buildings 2 2 2 3 1 1 * 1 Other – outdoors 1 1 1 * 2 * * 1 Other/Don’t know 1 1 * 1 1 0 0 *
Sample size 2,003 1,099 465 402 135 437 338 302
ATTEND, Q283-Q285.

7
Eastern or New Age Beliefs, “Evil Eye” Roughly one-quarter of adults express belief in tenets of certain Eastern religions; 24%
say they believe in reincarnation (that people will be reborn in this world again and again), and a similar number (23%) believe in yoga not just as exercise but as a spiritual practice. Similar numbers profess belief in elements of New Age spirituality, with 26% saying they believe in spiritual energy located in physical things such as mountains, trees or crystals, and 25% professing belief in astrology (that the position of the stars and planets can affect people’s lives). Fewer people (16%) believe in the “evil eye” or that certain people can cast curses or spells that cause bad things to happen to someone.
Compared with other religious traditions, white evangelical Protestants consistently
express lower levels of acceptance of both Eastern beliefs (reincarnation, yoga) and New Age beliefs (spiritual energy in physical things and astrology). For example, roughly one-in-ten white evangelicals believes in reincarnation, compared with 24% among mainline Protestants, 25% among both white Catholics and those unaffiliated with any religion, and 29% among black Protestants. Similarly, 13% of white evangelicals believe in astrology, compared with roughly one-quarter or more among other religious traditions. There are few differences among religious traditions in belief in the “evil eye,” though black Protestants stand out for high levels of belief on this question (32%).
Eastern or New Age Beliefs
Yes No DK % who believe in … % % % Reincarnation, that people will be reborn in this world again and again 24 69 6=100
Yoga not just as exercise but as a spiritual practice 23 70 7=100 Spiritual energy located in physical things like mountains, trees, crystals 26 69 5=100
Astrology, that the position of stars/planets can affect people’s lives 25 71 4=100 Evil eye, or that certain people can cast curses or spells that cause harm 16 81 2=100
Figures may not add to 100% because of rounding. Q291a-f.

8
Among Protestants, high levels of religious commitment are associated with lower levels of acceptance of Eastern or New Age beliefs. Among both evangelical and mainline Protestants, those who attend church weekly express much lower levels of belief in reincarnation, yoga, the existence of spiritual energy in physical things and astrology compared with those who attend religious services less often. Among Catholics, by contrast, frequency of church attendance is linked much less closely with these kinds of beliefs, although those who attend less often do express higher levels of belief in astrology compared with weekly attenders.
Hispanics are more likely than whites to believe in yoga, spiritual energy in physical
objects, astrology and the evil eye, and blacks are more likely than whites to believe in reincarnation and the evil eye. Older people (those over age 65) consistently express lower levels of acceptance of these kinds of beliefs compared with younger people. These beliefs are more common among Democrats and independents than Republicans and are more widely held by liberals and moderates than conservatives. The difference between liberals and conservatives is especially pronounced on the question of belief in yoga as a spiritual practice; nearly four-in-ten liberals express this belief (39%), compared with 15% of conservatives.
Beliefs of Demographic, Political and Religious Groups
------------------% who believe in…------------------ Reincar- Spiritual Astrol- Evil nation Yoga energy ogy eye N % % % % % Total 24 23 26 25 16 2,003
Male 21 19 24 21 15 862 Female 28 27 27 28 18 1,141
White 21 22 24 22 11 1,557 Black 34 21 20 29 29 160 Hispanic 29 33 37 35 36 149
18-29 26 31 31 30 18 270 30-49 25 26 28 26 19 593 50-64 26 20 25 23 16 597 65+ 18 12 17 18 10 511
College grad 17 25 20 18 11 747 Some college 23 24 28 22 11 512 HS or less 29 22 28 30 22 727
Republican 17 15 17 14 12 582 Independent 26 26 28 26 15 681 Democrat 30 31 30 31 19 628
Conservative 18 15 18 16 17 817 Moderate 27 25 29 30 15 662 Liberal 33 39 35 30 17 414
Protestant 20 18 20 21 16 1,099 White evang. 11 12 15 13 12 465 Attend weekly 5 7 10 8 11 315 Attend less often 20 21 22 23 12 147
White mainline 24 24 27 24 10 402 Attend weekly 12 15 14 15 8 103 Attend less often 28 26 31 27 10 296
Black Protestant 29 20 18 29 32 135
Catholic 28 27 29 29 17 437 White non-Hisp 25 24 24 25 12 338 Attend weekly 21 19 22 16 12 160 Attend less often 27 26 25 30 11 173
Unaffiliated 25 28 30 25 12 302 \
Q291a-f.

9
Ghosts, Fortunetellers, and Communicating With the Dead Roughly three-in-ten Americans (29%)
say they have felt in touch with someone who has died. Nearly one-in-five say they have been in the presence of a ghost (18%), while 15% say they have consulted a fortuneteller or a psychic.
The proportion of Americans who say they have interacted with a ghost has doubled over the past 13 years (9% in 1996 compared with 18% today). The number saying they have felt in touch with someone who has died has also grown considerably, from 18% in 1996 to 29% today. There has been no change, however, over the past 20 years in the proportion of Americans who have consulted a fortuneteller or psychic, with a steady minority of roughly one-in-seven continuing to say they have done so. Evangelical Protestants are the group least likely to say they have felt in touch with a dead person (20%). Members of other religious traditions are much more familiar with this type of phenomenon, with 37% of black Protestants, 35% of white Catholics, 31% of the unaffiliated and 29% of white mainline Protestants saying they have felt in touch with someone who has died. Differences between evangelicals and other religious traditions are smaller on the questions of ghostly experiences and consultations with fortunetellers.
Supernatural Experiences
% felt you were in touch with someone who has Jun Sep Aug already died 1990 1996 2009 Yes 17 18 29 No 82 81 69 Don’t know 1 1 2 100 100 100
% seen or been in the presence of a ghost Yes 9 9 18 No 90 90 80 Don’t know 1 2 2 100 100 100
% consulted a fortuneteller or psychic Yes 14 17 15 No 85 83 85 Don’t know 1 0 1 100 100 100
Sep. 1996 and June 1990 surveys conducted by Gallup.
Figures may not add to 100% because of rounding. Q292a-c.

10
Having been in touch with a dead person is more common among women than men (33% vs. 26%). Women are also twice as likely to have consulted a fortuneteller or psychic (20% vs. 10%). Blacks report more experience feeling in touch with the dead than whites or Hispanics (41%, 29% and 30%, respectively). But they resemble whites and Hispanics on other items, such as encounters with a ghost or consulting a fortuneteller.
Compared with those with a college degree, more Americans with a high school education or less report having felt in touch with a dead person (32% vs. 24%) and having seen a ghost (21% vs. 13%). However, Americans with less education are no more inclined to have consulted a fortuneteller than are Americans with a college education (13% vs. 17%). Conservatives and Republicans report fewer experiences than liberals or Democrats communicating with the dead, seeing ghosts and consulting fortunetellers or psychics.
Diverse Supernatural Beliefs and Experiences
In total, upwards of six-in-ten adults (65%) express belief in or report having experience with at least one of these diverse supernatural phenomena (belief in reincarnation, belief in spiritual energy located in physical things, belief in yoga as spiritual practice, belief in the “evil eye,” belief in astrology, having been in touch with the dead, consulting a psychic, or experiencing a ghostly encounter). This includes roughly one-quarter of the population (23%) who report having only one of these beliefs or experiences. More than four-in-ten people (43%) answer two or more of these items affirmatively, including 25% who answer two or three of these items affirmatively and nearly one-in-five (18%) who answer yes to four or more. Roughly one-third of the public (35%) answers no to all eight items.
Supernatural Experiences
In touch Fortune- w/dead Ghosts tellers N % % % Total 29 18 15 2,003
Male 26 16 10 862 Female 33 20 20 1,141
White 29 17 15 1,557 Black 41 20 13 160 Hispanic 30 20 15 149
18-29 28 20 11 270 30-49 31 18 17 593 50-64 32 21 16 597 65+ 27 13 12 511
College grad 24 13 17 747 Some college 30 18 16 512 HS or less 32 21 13 727
Republican 21 11 9 582 Independent 29 21 14 681 Democrat 36 21 22 628
Conservative 23 13 10 817 Moderate 32 22 18 662 Liberal 35 20 21 414
Protestant 26 17 13 1,099 White evang. 20 15 10 465 White mainline 29 18 13 402 Black Protestant 37 18 15 135 Catholic 34 17 17 437 White non-Hisp 35 16 19 338 Unaffiliated 31 19 15 302
Attend religious services… Weekly or more 25 11 11 825 Monthly/Yearly 34 22 19 653 Seldom/Never 28 23 15 501
Figures may not add to 100% because of rounding. Q292a-c.
11
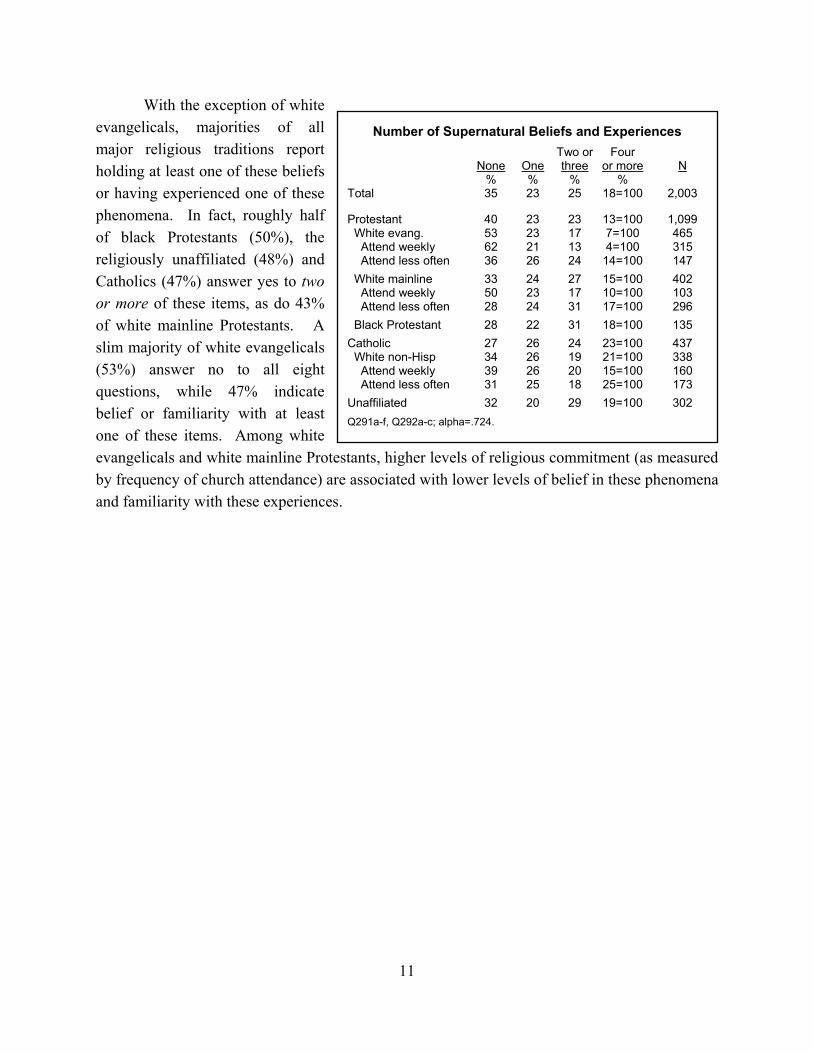
With the exception of white evangelicals, majorities of all major religious traditions report holding at least one of these beliefs or having experienced one of these phenomena. In fact, roughly half of black Protestants (50%), the religiously unaffiliated (48%) and Catholics (47%) answer yes to two or more of these items, as do 43% of white mainline Protestants. A slim majority of white evangelicals (53%) answer no to all eight questions, while 47% indicate belief or familiarity with at least one of these items. Among white evangelicals and white mainline Protestants, higher levels of religious commitment (as measured by frequency of church attendance) are associated with lower levels of belief in these phenomena and familiarity with these experiences.
Number of Supernatural Beliefs and Experiences
Two or Four None One three or more N % % % % Total 35 23 25 18=100 2,003
Protestant 40 23 23 13=100 1,099 White evang. 53 23 17 7=100 465 Attend weekly 62 21 13 4=100 315 Attend less often 36 26 24 14=100 147
White mainline 33 24 27 15=100 402 Attend weekly 50 23 17 10=100 103 Attend less often 28 24 31 17=100 296
Black Protestant 28 22 31 18=100 135
Catholic 27 26 24 23=100 437 White non-Hisp 34 26 19 21=100 338 Attend weekly 39 26 20 15=100 160 Attend less often 31 25 18 25=100 173
Unaffiliated 32 20 29 19=100 302
Q291a-f, Q292a-c; alpha=.724.

12
Religious and Mystical Experiences In response to a separate question, half of
Americans (49%) say they have had “a religious or mystical experience – that is, a moment of religious or spiritual awakening.” This is roughly the same as the number that said this in 2006 (47%), but it represents a sharp increase over the past four decades. In 1962, only 22% of Americans reported having had such an experience, which grew to about a third in 1976 (31%) and 1994 (33%). Since then, the number has continued to increase to roughly half of the public in this decade.
Differences among Protestants are striking. Strong majorities of white evangelicals (70%) and black Protestants (71%) say they have had religious or mystical experiences, compared with four-in-ten mainline Protestants (40%). Catholics resemble mainline Protestants, with 37% having had a religious or mystical experience. Among the unaffiliated, three-in-ten have had a religious or mystical experience. This is lower than nearly any other religious segment of the population but is still a higher proportion than among the general public in 1962 (22%). These kinds of experiences are particularly common among the “religious unaffiliated” (i.e., those who describe their religion as “nothing in particular” and say that religion is at least somewhat important in their lives), among whom 51% have had a religious or mystical experience. Among self-described atheists, agnostics and the “secular unaffiliated” (i.e., those who describe their religion as “nothing in particular” and say that religion is not important in their lives), roughly one-in-five (18%) say they have had this kind of experience.
Mystical or religious experiences are most common among people who regularly attend religious services. More than six-in-ten
Religious or Mystical Experience
Yes No DK N % % % % Total 49 48 4=100 2,003
White 47 51 3=100 1,557 Black 69 27 4=100 160 Hispanic 44 50 6=100 149
18-29 43 54 2=100 270 30-49 51 46 3=100 593 50-64 55 44 2=100 597 65+ 43 49 8=100 511
Republican 50 46 4=100 582 Independent 46 51 3=100 681 Democrat 50 47 3=100 628
Conservative 55 43 3=100 817 Moderate 43 55 3=100 662 Liberal 50 48 3=100 414
Protestant 60 36 4=100 1,099 White evang. 70 26 3=100 465 White mainline 40 55 4=100 402 Black Protestant 71 26 3=100 135 Catholic 37 60 3=100 437 White non-Hisp. 37 61 2=100 338 Unaffiliated 30 69 1=100 302
Attend religious services…. Weekly or more 61 34 5=100 825Monthly/Yearly 48 50 2=100 653Seldom/Never 33 65 2=100 501
Figures may not add to 100% due to rounding. Q290.
Ever Had Religious or Mystical Experience?
Feb Aug Nov Apr Aug 62 76 94 06 09 % % % % % Yes 22 31 33 47 49 No 78 69 65 51 48 Don’t know 0 0 2 2 4 100 100 100 100 100
Feb. 62 and Aug. 76 surveys by Gallup; Nov. 94 by Newsweek; Apr. 06 by Ipsos
Figures may not add to 100% due to rounding. Q290.

13
of those who attend weekly say they have had this kind of experience (61%), compared with half of those who attend monthly or yearly (48%) and just one-third of those who seldom or never attend religious services (33%).
Blacks are much more likely than whites or Hispanics (69%, 47% and 44%, respectively)
to report religious or mystical experiences. More than half (55%) of baby boomers (age 50-64) identify with such experiences, compared with fewer young adults and seniors (43% each).
There is little difference along party lines on this question. Roughly half of Republicans,
Democrats and independents say they have had a religious or mystical experience. More than half of conservatives (55%) claim to have had such experiences, similar to the number of liberals who have had these kinds of experiences (50%) and much higher than among moderates (43%).

14
ABOUT THE SURVEY
Results for this survey are based on telephone interviews conducted under the direction of Princeton Survey
Research Associates International among a nationwide sample of 4,013 adults, 18 years of age or older. Interviews were conducted in two waves, the first from August 11-17, 2009 (Survey A) and the second from August 20-27, 2009 (Survey B). In total, 3,012 respondents were interviewed on a landline telephone, and 1,001 were interviewed on a cell phone, including 347 who had no landline telephone. Interviews were conducted in English and Spanish. Both the landline and cell phone samples were provided by Survey Sampling International. For detailed information about our survey methodology, see http://people-press.org/methodology/.
The combined landline and cell phone sample is weighted using an iterative technique that matches gender, age, education, race/ethnicity, region, and population density to parameters from the March 2008 Census Bureau's Current Population Survey. The sample is also weighted to match current patterns of telephone status and relative usage of landline and cell phones (for those with both), based on extrapolations from the 2008 National Health Interview Survey. The weighting procedure also accounts for the fact that respondents with both landline and cell phones have a greater probability of being included in the sample.
The following table shows the error attributable to sampling that would be expected at the 95% level of
confidence for different groups in the survey. The topline survey results included at the end of this report clearly indicate whether each question in the survey was asked of the full sample, Survey A only or Survey B only. Most of the results analyzed in this report were asked in Survey B only.
Group Sample Size Plus or minus… Total sample 4,013 2.0 percentage points Survey A 2,010 2.5 percentage points Form 1 1,011 3.5 percentage points Form 2 999 3.5 percentage points Survey B 2,003 2.5 percentage points Form 1 1,034 3.5 percentage points Form 2 969 3.5 percentage points
In addition to sampling error, one should bear in mind that question wording and practical difficulties in
conducting surveys can introduce error or bias into the findings of opinion polls.

15
ABOUT THE PROJECTS This survey is a joint effort of the Pew Research Center for the People & the Press and the Pew Forum on Religion & Public Life. Both organizations are sponsored by the Pew Charitable Trusts and are projects of the Pew Research Center, a nonpartisan “fact tank” that provides information on the issues, attitudes and trends shaping America and the world. The Pew Research Center for the People & the Press is an independent opinion research group that studies attitudes toward the press, politics and public policy issues. The Center’s purpose is to serve as a forum for ideas on the media and public policy through public opinion research. In this role it serves as an important information resource for political leaders, journalists, scholars, and public interest organizations. All of the Center’s current survey results are made available free of charge.
The Pew Forum on Religion & Public Life seeks to promote a deeper understanding of issues at the intersection of religion and public affairs. It studies public opinion, demographics and other important aspects of religion and public life in the U.S. and around the world. It also provides a neutral venue for discussions of timely issues through roundtables and briefings. This report is a collaborative product based on the input and analysis of the following individuals: Pew Forum on Religion & Public Life Luis Lugo ..................Director
Alan Cooperman Sandra Stencel ..........Associate Directors
Gregory Smith ..........Senior Researcher
Allison Pond Neha Sahgal...............Research Associates
Scott Clement ...........Research Analyst
Michelle Ralston........Research Assistant
Diana Yoo..................Graphic Designer/Assistant Web Editor
Tracy Miller Hilary Ramp…….......Editors
John C. Green ............Senior Research Advisor
© Pew Research Center, 2009
Pew Research Center for the People & the Press Andrew Kohut ...... Director
Scott Keeter .......... Director of Survey Research
Carroll Doherty Michael Dimock ... Associate Directors
Michael Remez ..... Senior Writer
Robert Suls Shawn Neidorf Leah Melani Christian Jocelyn Kiley Alec Tyson ........... Research Associates
Jacob Poushter ...... Research Analyst

16
PEW RESEARCH CENTER FOR THE PEOPLE & THE PRESS AND PEW FORUM ON RELIGION & PUBLIC LIFE
2009 RELIGION & PUBLIC LIFE SURVEY FINAL TOPLINE
Survey A: August 11-17, 2009, N=2,010 Survey B: August 20-27, 2009, N=2,003
Combined N=4,013 NOTE: QUESTION NUMBERING IS NOT CONTINUOUS BECAUSE SOME ITEMS HAVE BEEN PREVIOUSLY RELEASED OR HELD FOR FUTURE RELEASE ASK ALL: RELIG What is your present religion, if any? Are you Protestant, Roman Catholic, Mormon, Orthodox such as
Greek or Russian Orthodox, Jewish, Muslim, Buddhist, Hindu, atheist, agnostic, something else, or nothing in particular?
[INTERVIEWER: IF R VOLUNTEERS “nothing in particular, none, no religion, etc.” BEFORE REACHING END OF LIST, PROMPT WITH: And would you say that’s atheist, agnostic, or just nothing in particular?]
IF SOMETHING ELSE, NOTHING IN PARTICULAR OR DK/REF (RELIG=11, 12, 99) ASK: CHR Do you think of yourself as a Christian or not?
40 Protestant (Baptist, Methodist, Non-denominational, Lutheran, Presbyterian, Pentecostal, Episcopalian, Reformed, Church of Christ, Jehovah’s Witness, etc.)
23 Roman Catholic (Catholic) 2 Mormon (Church of Jesus Christ of Latter-day Saints/LDS) * Orthodox (Greek, Russian, or some other orthodox church) 2 Jewish (Judaism) * Muslim (Islam) 1 Buddhist * Hindu 2 Atheist (do not believe in God) 3 Agnostic (not sure if there is a God) 2 Something else (SPECIFY) 12 Nothing in particular 11 Christian (VOL.) * Unitarian (Universalist) (VOL.) 2 Don't Know/Refused (VOL.) IF CHRISTIAN (RELIG=1-4, 13 OR ((RELIG=11 OR RELIG=99) AND CHR=1)): BORN Would you describe yourself as a "born again" or evangelical Christian, or not? BASED ON TOTAL 34 Yes, would 40 No, would not 4 Don't know/Refused (VOL.) 78% Christian

17
ASK ALL: ATTEND Aside from weddings and funerals, how often do you attend religious services... more than once a
week, once a week, once or twice a month, a few times a year, seldom, or never? NOTE: ATTEND FOR BOTH SURVEY A AND SURVEY B ARE PRESENTED HERE. More than Once Once or twice A few times (VOL.) once a week a week a month a year Seldom Never DK/Ref August 11-27, 2009 14 23 16 18 16 11 1 August, 2008 13 26 16 19 15 10 1 Aug, 2007 14 26 16 18 16 9 1 July, 2006 15 25 15 18 14 12 1 July, 2005 14 27 14 19 14 11 1 Aug, 2004 13 25 15 20 15 11 1 July, 2003 16 27 15 18 14 10 * March, 2003 15 24 15 21 15 9 1 March, 2002 15 25 17 18 15 9 1 Mid-Nov, 2001 16 26 14 17 16 10 1 March, 2001 17 26 17 17 15 7 1 Sept, 2000 (RVs) 17 28 16 17 13 8 1 June, 1997 12 26 17 20 15 10 * June, 1996 14 25 17 21 13 9 1 ASK SURVEY B IF ATTEND AT LEAST A FEW TIMES A YEAR (ATTEND=1-4): Q.281 Aside from when you’re traveling and special events like weddings and funerals, do you always attend
religious services at the same place, mostly attend at one place but occasionally go to different places, or do you go to different places on a regular basis?
BASED ON TOTAL SURVEY B 36 Always attend at the same place 26 Mostly attend at one place but occasionally go to different places 9 Go to different places on a regular basis 1 Don’t know/Refused (VOL.) (28) Attend religious services less than yearly/refused to say how often

18
ASK SURVEY B IF ATTEND AT MORE THAN ONE PLACE (Q.281=2,3): Q.282 And aside from weddings and funerals, do you ever [INSERT; RANDOMIZE]? Do you ever [INSERT
NEXT ITEM]? BASED ON TOTAL SURVEY B Don’t ---Multiple places--- attend Attend (VOL.) multiple less than Yes No DK/Ref places yearly ASK IF PROTESTANT/JUST CHRISTIAN (RELIG=1,13) [N=1099]: a. attend services at a Protestant denomination different than your own 24 13 2 44 17 ASK IF NOT PROTESTANT/JUST CHRISTIAN (RELIG≠1,13) [N=904]: b. attend services at a Protestant church 13 18 * 28 40 ASK IF NOT CATHOLIC (RELIG≠2) [N=1566]: c. attend Catholic mass 14 20 * 35 31 ASK IF NOT JEWISH (RELIG≠5) [N=1968]: d. attend services at a Jewish synagogue 4 31 * 37 28 ASK IF NOT MUSLIM (RELIG≠6) [N=1991]: e. attend services at a Muslim mosque 2 34 0 37 28 ASK ALL WHO ATTEND AT MORE THAN ONE PLACE (Q.281=2,3) [N=2003]: f. attend services of a religion different than yours that I haven’t mentioned (SPECIFY) 8 26 1 37 28 ASK SURVEY B IF ALWAYS AT THE SAME PLACE: (Q.281=1): Q.283 Are the religious services you attend held at a church or house of worship, or are they held at some other
location such as at a restaurant or a person’s home? ASK SURVEY B IF NOT ALWAYS AT THE SAME PLACE: (Q.281=2-9): Q.284 In general, are the religious services you attend held at houses of worship such as churches, synagogues or
mosques, are they held at other locations such as at restaurants or people’s homes, or do you attend services both in houses of worship and at other locations?
BASED ON TOTAL SURVEY B 60 At church(es)/house(es) of worship 3 At other location(s) 8 Both churches/houses of worship and other locations 1 Don’t know/Refused (VOL) (28) Attend religious services less than yearly

19
BASED ON TOTAL SURVEY B Q.285 IF ‘OTHER LOCATIONS’ (Q.283=2 OR Q.284=2) ASK: And what kind of place or
location is this? IF “BOTH” (Q.284=3) ASK: What kinds of places are these other locations? [RECORD VERBATIM RESPONSE] [INTERVIEWER NOTE: We are interested in the type of place R attends other than a church/house of worship, for example a restaurant, home, park or other location. We are not interested in a specific address or geographic place, such as a city. Please clarify for R as needed, such as “For example, is it a restaurant, or someone’s home, or a park, or what?”]
BASED ON TOTAL SURVEY B 7 Homes 1 Schools 1 Parks/campgrounds 1 Restaurants 1 Hotels 4 Other
ASK ALL SURVEY B: Q.290 Would you say that you have ever had a 'religious or mystical experience'-- that is, a moment of sudden
religious insight or awakening? Ipsos Newsweek ---Gallup--- April Nov Aug Feb 2006 1994 1976 1962 49 Yes 47 33 31 22 48 No 51 65 69 78 4 Don’t know/Refused (VOL.) 2 2 0 0 ASK ALL SURVEY B: Q.291 Which, if any, of the following do you believe in? Do you believe [INSERT; RANDOMIZE]? Do you
believe [INSERT NEXT ITEM]? Yes, No, don’t (VOL.) believe in believe DK/Ref a. in reincarnation, that people will be reborn in this world again and again 24 69 6 b. in spiritual energy located in physical things, such as mountains, trees or crystals 26 69 5 c. in yoga, not just as exercise, but as a spiritual practice 23 70 7 NO ITEM d. e. in the “evil eye” or that certain people can cast curses or spells that cause bad things to happen to someone 16 81 2 f. in astrology, or that the position of the stars and planets can affect people’s lives 25 71 4

20
ASK ALL SURVEY B: Q.292 Have you ever [INSERT; RANDOMIZE]? Have you ever [INSERT NEXT ITEM]? (VOL.) Yes No DK/Ref a. felt that you were in touch with someone who has already died August 20-27, 2009 29 69 2 September, 1996 Gallup 18 81 1 June, 1990 Gallup 17 82 1 b. consulted a fortune-teller or psychic August 20-27, 2009 15 85 1 September, 1996 Gallup 17 83 * June, 1990 Gallup 14 85 1 c. seen or been in the presence of a ghost August 20-27, 2009 18 80 2 September, 1996 Gallup 9 90 2 June, 1990 Gallup 9 90 1 ASK SURVEY B IF MARRIED OR PARTNERED (MARITAL=1,2) [N=1219]: SPREL And what is your [IF MARITAL=1: spouse’s/IF MARITAL=2: partner’s] religion, if any? Are they
Protestant, Roman Catholic, Mormon, Orthodox such as Greek or Russian Orthodox, Jewish, Muslim, Buddhist, Hindu, atheist, agnostic, something else, or nothing in particular?
[INTERVIEWER: IF R VOLUNTEERS “nothing in particular, none, no religion, etc.” BEFORE REACHING END OF LIST, PROMPT WITH: and would you say they are atheist, agnostic, or just nothing in particular?]
IF SOMETHING ELSE, OR DK (SPREL=11, 99), ASK: SPCHR And is that a Christian religion, or not? 43 Protestant (Baptist, Methodist, Non-denominational, Lutheran, Presbyterian, Pentecostal, Episcopalian, Reformed, Church of Christ, Jehovah’s Witness, etc.) 25 Roman Catholic (Catholic) 2 Mormon (Church of Jesus Christ of Latter-day Saints/LDS) * Orthodox (Greek, Russian, or some other orthodox church) 1 Jewish (Judaism) 1 Muslim (Islam) 1 Buddhist * Hindu 1 Atheist (do not believe in God) 2 Agnostic (not sure if there is a God) 1 Something else (SPECIFY) 10 Nothing in particular 10 Christian (VOL.) * Unitarian (Universalist) (VOL.) 2 Don't Know/Refused (VOL.)

21
ASK SURVEY B IF SPOUSE CHRISTIAN (SPREL=1-4, 13 OR SPCHR=1): SPBORN Would you describe your spouse as a "born again" or evangelical Christian, or not? 36 Yes, would 41 No, would not 3 Don't know/Refused (VOL.) (80) Total married to Christian