easy and hard ways to reach coverage closure
TRANSCRIPT
IBM Labs in Haifa © 2010 IBM Corporation
Easy and Hard Ways to Reach Coverage Closure
Avi Ziv Simulation-based Verification Technologies IBM Haifa research Lab
IBM Labs in Haifa
© 2010 IBM Corporation 2
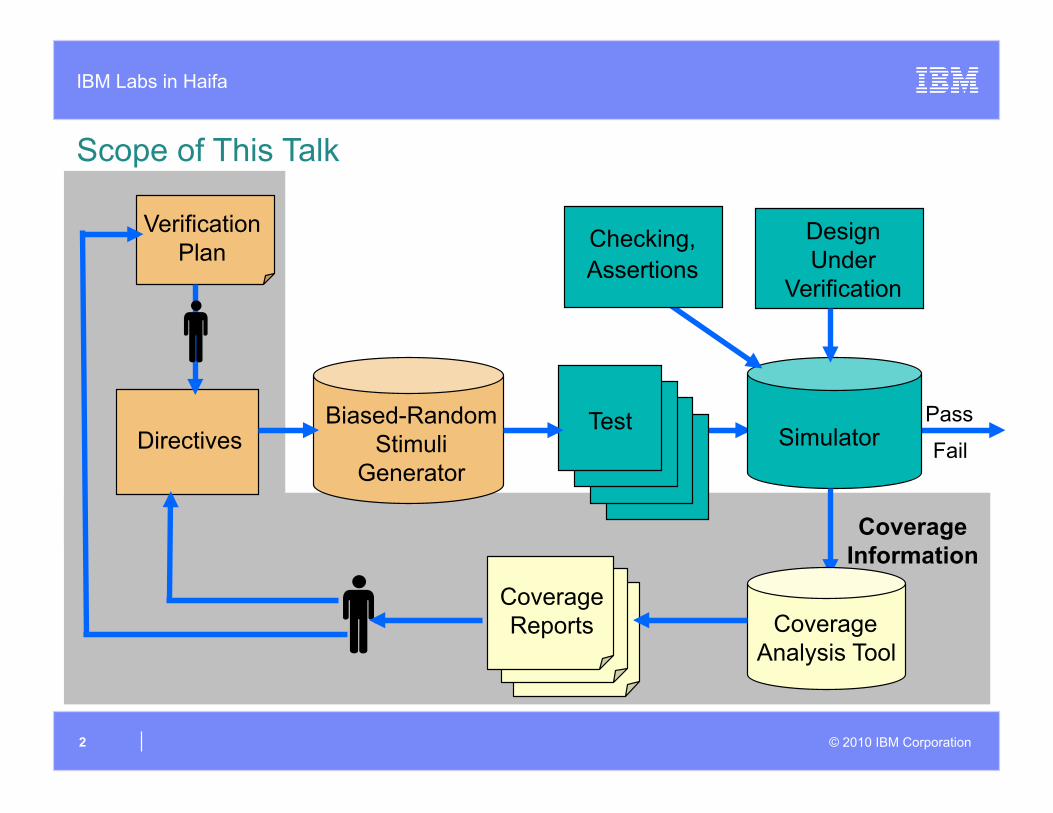
Scope of This Talk
Verification Plan
Biased-Random Stimuli
Generator Test
Test
Design Under
Verification
Fail
Pass Simulator Directives
Coverage Analysis Tool
Coverage Reports
Coverage Information
Checking, Assertions
IBM Labs in Haifa
© 2010 IBM Corporation 3
The Truth About Coverage Analysis
The main goals of the coverage process are: Monitor the quality of the verification process Identify unverified and lightly verified areas Help understanding of the verification process
This leads to conflicting goals Want to collect as much data as possible
So we do not miss important events User needs concise and informative reports
So we do not drown in too much detail Coverage analysis help to close the loop from coverage measurement
to the verification plan and verification environment adaptation
IBM Labs in Haifa
© 2010 IBM Corporation 4
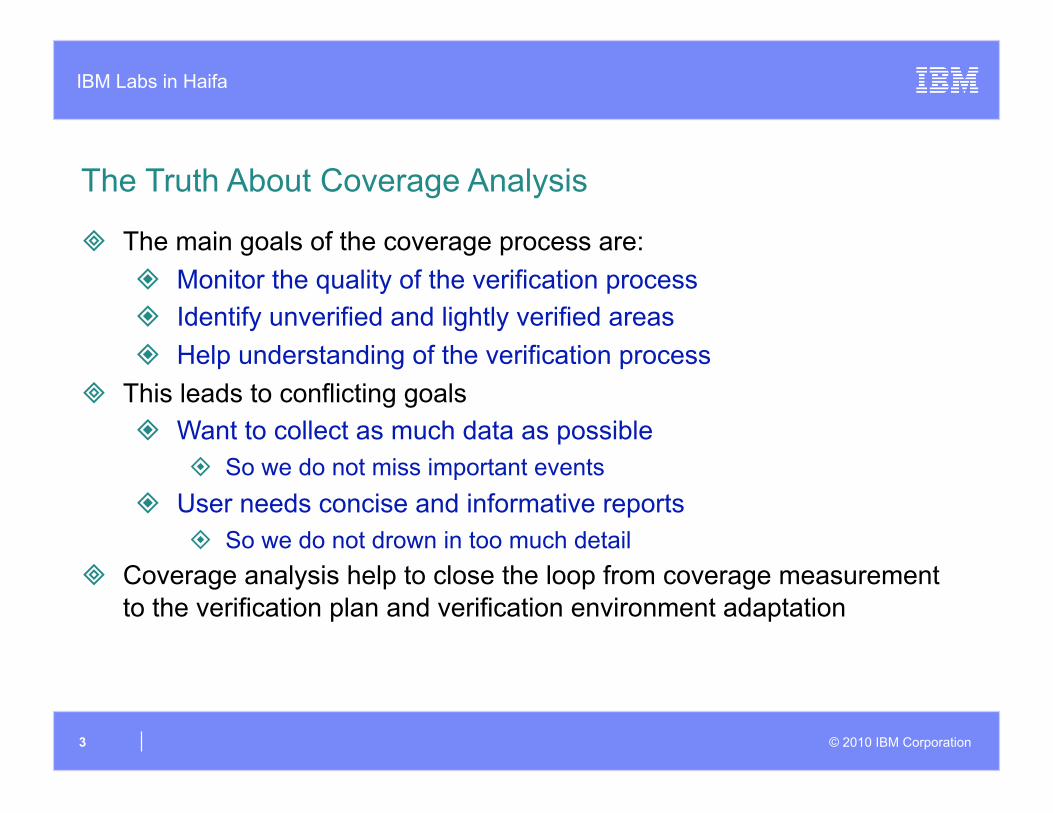
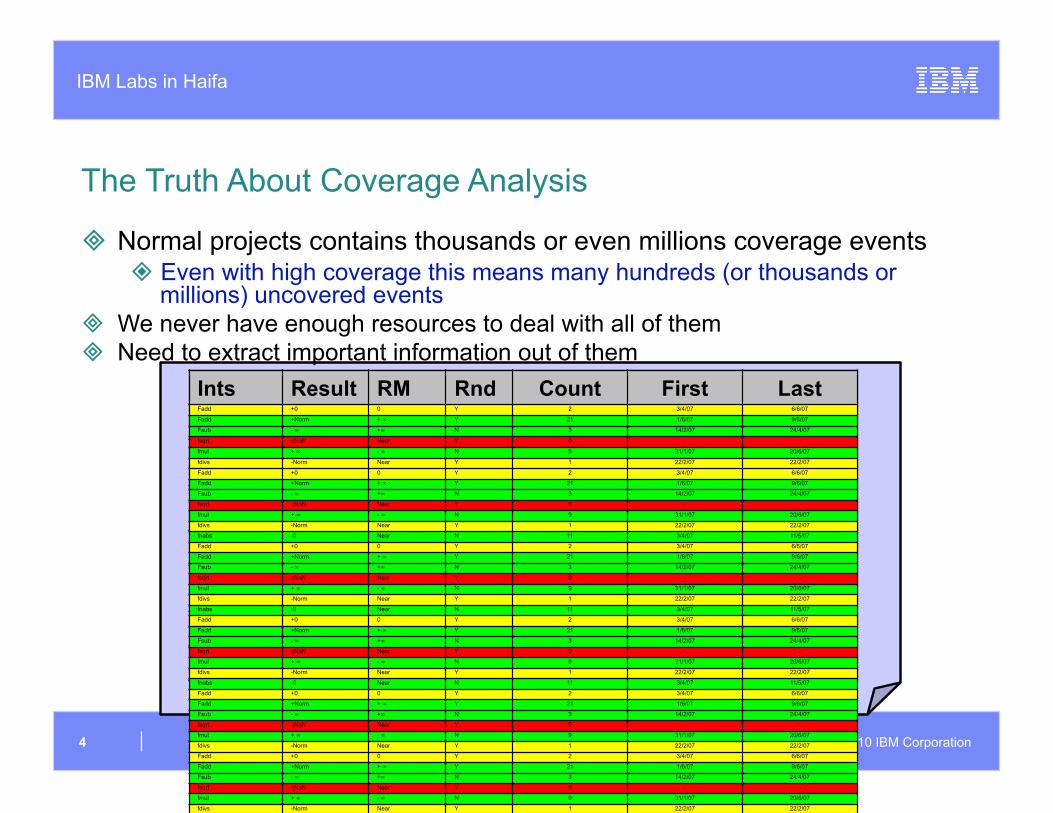
The Truth About Coverage Analysis
Normal projects contains thousands or even millions coverage events Even with high coverage this means many hundreds (or thousands or
millions) uncovered events We never have enough resources to deal with all of them Need to extract important information out of them
Last First Count Rnd RM Result Ints 6/6/07 3/4/07 2 Y 0 +0 fadd 9/6/07 1/6/07 21 Y + ∞ +Norm fadd
24/4/07 14/2/07 3 N +∞ - ∞ fsub
- - 0 Y Near qNaN fsqrt 20/6/07 31/1/07 9 N - ∞ + ∞ fmul
22/2/07 22/2/07 1 Y Near -Norm fdivs 11/5/07 3/4/07 11 N Near -0 fnabs
Last First Count Rnd RM Result Ints 6/6/07 3/4/07 2 Y 0 +0 Fadd
9/6/07 1/6/07 21 Y + ∞ +Norm Fadd
24/4/07 14/2/07 3 N +∞ - ∞ Fsub
- - 0 Y Near qNaN fsqrt
20/6/07 31/1/07 9 N - ∞ + ∞ fmul
22/2/07 22/2/07 1 Y Near -Norm fdivs
6/6/07 3/4/07 2 Y 0 +0 Fadd
9/6/07 1/6/07 21 Y + ∞ +Norm Fadd
24/4/07 14/2/07 3 N +∞ - ∞ Fsub
- - 0 Y Near qNaN fsqrt
20/6/07 31/1/07 9 N - ∞ + ∞ fmul
22/2/07 22/2/07 1 Y Near -Norm fdivs
11/5/07 3/4/07 11 N Near -0 fnabs
6/6/07 3/4/07 2 Y 0 +0 Fadd
9/6/07 1/6/07 21 Y + ∞ +Norm Fadd
24/4/07 14/2/07 3 N +∞ - ∞ Fsub
- - 0 Y Near qNaN fsqrt
20/6/07 31/1/07 9 N - ∞ + ∞ fmul
22/2/07 22/2/07 1 Y Near -Norm fdivs
11/5/07 3/4/07 11 N Near -0 fnabs
6/6/07 3/4/07 2 Y 0 +0 Fadd
9/6/07 1/6/07 21 Y + ∞ +Norm Fadd
24/4/07 14/2/07 3 N +∞ - ∞ Fsub
- - 0 Y Near qNaN fsqrt
20/6/07 31/1/07 9 N - ∞ + ∞ fmul
22/2/07 22/2/07 1 Y Near -Norm fdivs
11/5/07 3/4/07 11 N Near -0 fnabs
6/6/07 3/4/07 2 Y 0 +0 Fadd
9/6/07 1/6/07 21 Y + ∞ +Norm Fadd
24/4/07 14/2/07 3 N +∞ - ∞ Fsub
- - 0 Y Near qNaN fsqrt
20/6/07 31/1/07 9 N - ∞ + ∞ fmul
22/2/07 22/2/07 1 Y Near -Norm fdivs
6/6/07 3/4/07 2 Y 0 +0 Fadd
9/6/07 1/6/07 21 Y + ∞ +Norm Fadd
24/4/07 14/2/07 3 N +∞ - ∞ Fsub
- - 0 Y Near qNaN fsqrt
20/6/07 31/1/07 9 N - ∞ + ∞ fmul
22/2/07 22/2/07 1 Y Near -Norm fdivs
IBM Labs in Haifa
© 2010 IBM Corporation 5
(Too) Detailed Status Reports
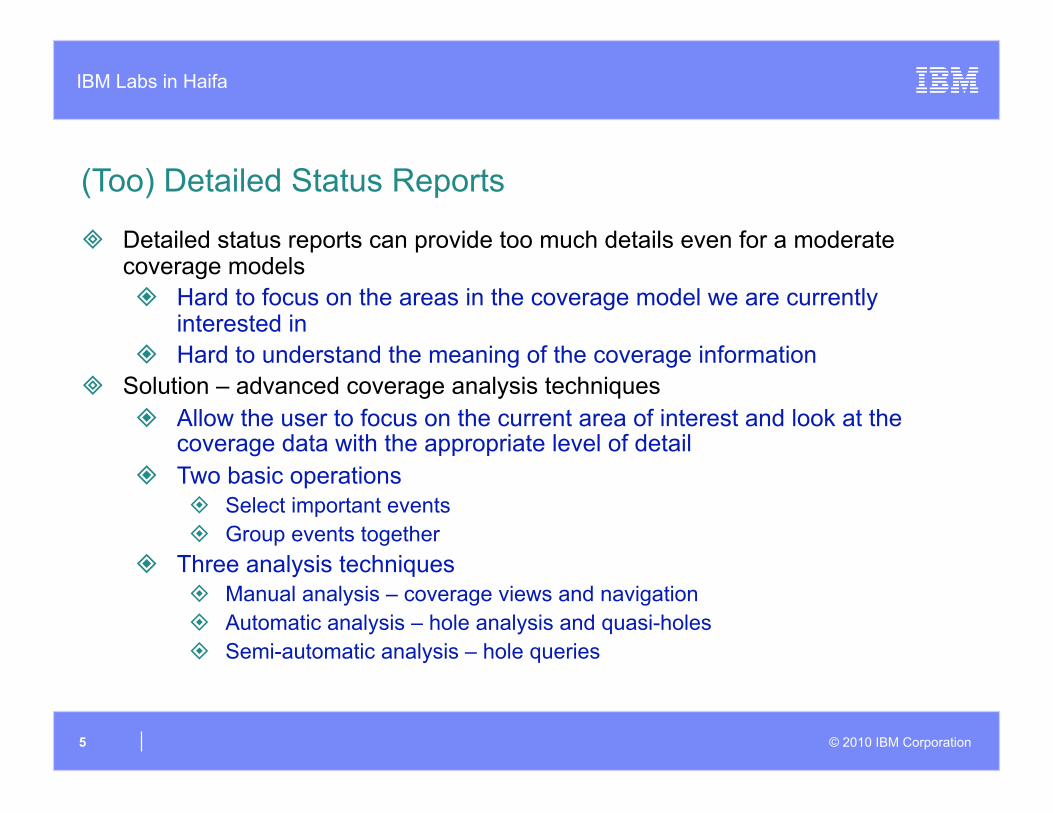
Detailed status reports can provide too much details even for a moderate coverage models Hard to focus on the areas in the coverage model we are currently
interested in Hard to understand the meaning of the coverage information
Solution – advanced coverage analysis techniques Allow the user to focus on the current area of interest and look at the
coverage data with the appropriate level of detail Two basic operations
Select important events Group events together
Three analysis techniques Manual analysis – coverage views and navigation Automatic analysis – hole analysis and quasi-holes Semi-automatic analysis – hole queries
IBM Labs in Haifa
© 2010 IBM Corporation 6
Manual Analysis
Goals Allow the user to focus on the current area of interest and look at
the coverage data with the appropriate level of detail Provide means for navigating between coverage reports to extract
the useful information
Solution – coverage views Dynamically define the events to look at and granularity of the
report
IBM Labs in Haifa
© 2010 IBM Corporation 7
Projection
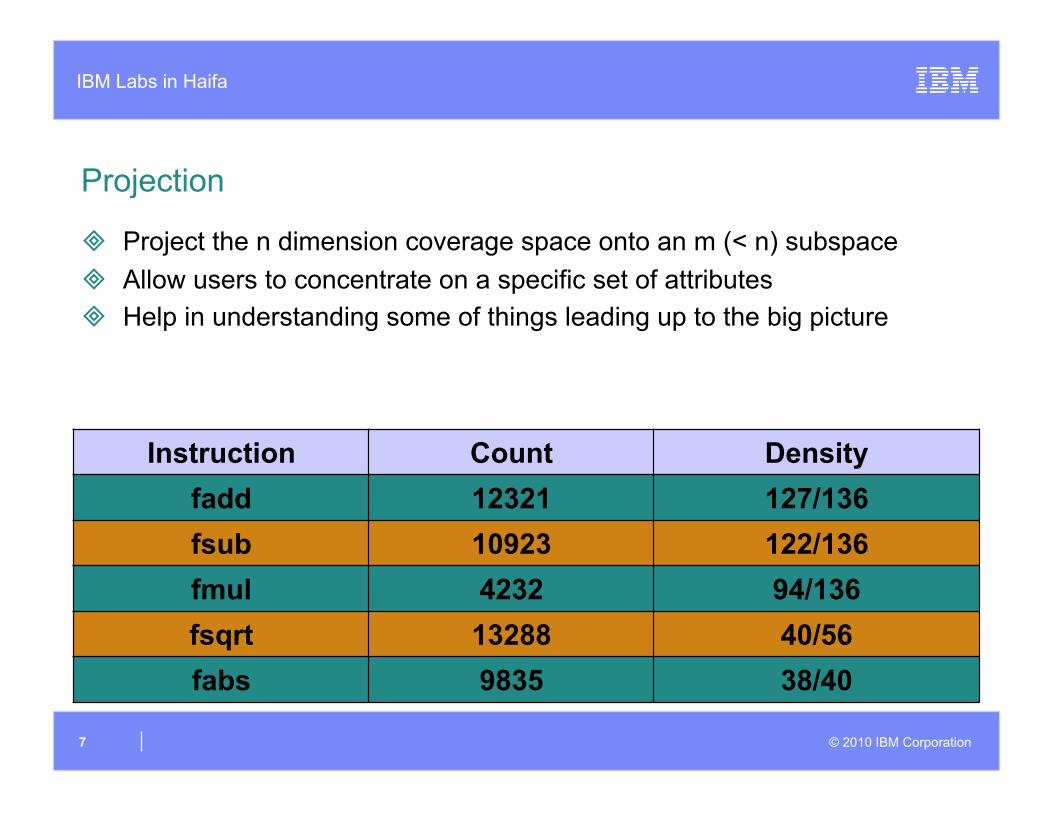
Project the n dimension coverage space onto an m (< n) subspace Allow users to concentrate on a specific set of attributes Help in understanding some of things leading up to the big picture
Instruction Count Density fadd 12321 127/136 fsub 10923 122/136 fmul 4232 94/136 fsqrt 13288 40/56 fabs 9835 38/40
IBM Labs in Haifa
© 2010 IBM Corporation 8
Automatic Coverage Analysis
Detailed status reports do no always reveal interesting information hidden in the coverage data You need to know where to look at You need to know which questions to ask the coverage tool
Specifically, it is hard to find large areas of uncovered events in the coverage model
IBM Labs in Haifa
© 2010 IBM Corporation 9
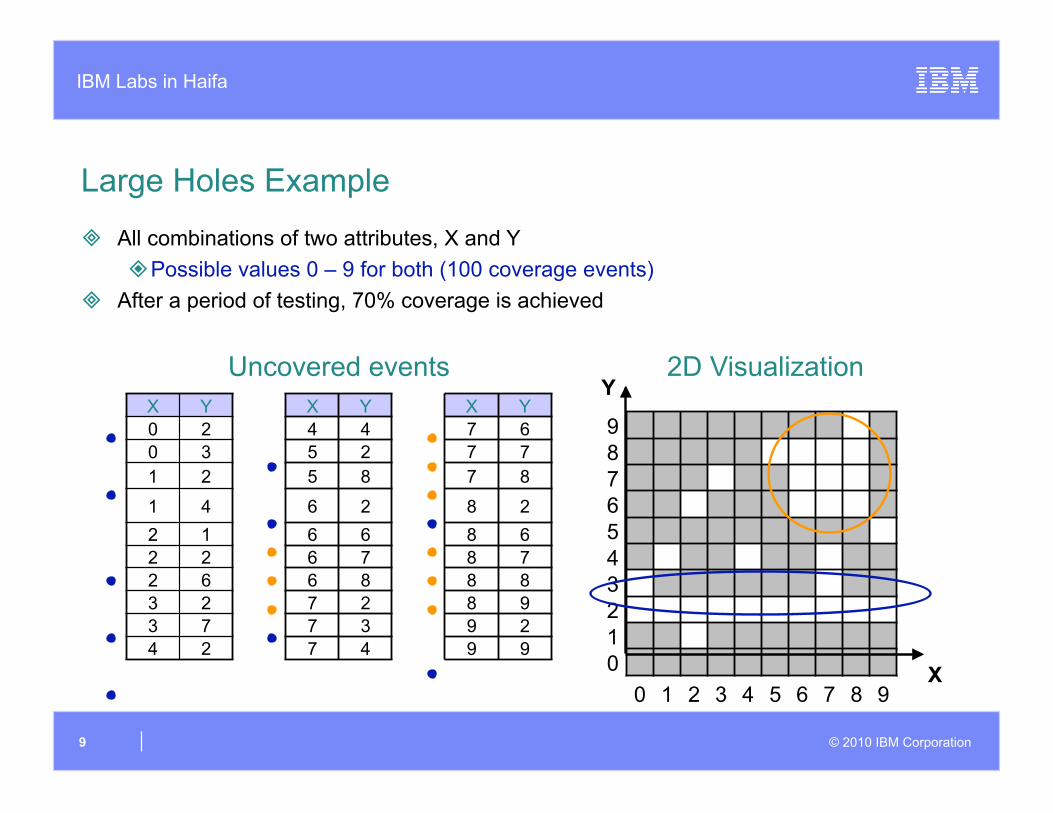
Large Holes Example
All combinations of two attributes, X and Y Possible values 0 – 9 for both (100 coverage events)
After a period of testing, 70% coverage is achieved
X Y X Y X Y 0 2 4 4 7 6 0 3 5 2 7 7 1 2 5 8 7 8
1 4 6 2 8 2 2 1 6 6 8 6 2 2 6 7 8 7 2 6 6 8 8 8 3 2 7 2 8 9 3 7 7 3 9 2 4 2 7 4 9 9
Uncovered events
9 8 7 6 5 4 3 2 1 0
0 1 2 3 4 5 6 7 8 9
Y
X
2D Visualization

IBM Labs in Haifa
© 2010 IBM Corporation 10
Finding Large Holes
2D visualization can be useful, but only in a limited number of cases Handling spaces with higher dimensionality is difficult Handling attributes with large number of values is difficult Handling unordered values is difficult
Finding non-trivial patterns is difficult Automatic techniques can overcome these
problems Try to find large areas in the coverage space
that are not covered Use basic techniques to combine sets of
uncovered events into large meaningful holes
9 8 7 6 5 4 3 2 1 0
0 1 2 3 4 5 6 7 8 9
IBM Labs in Haifa
© 2010 IBM Corporation 11
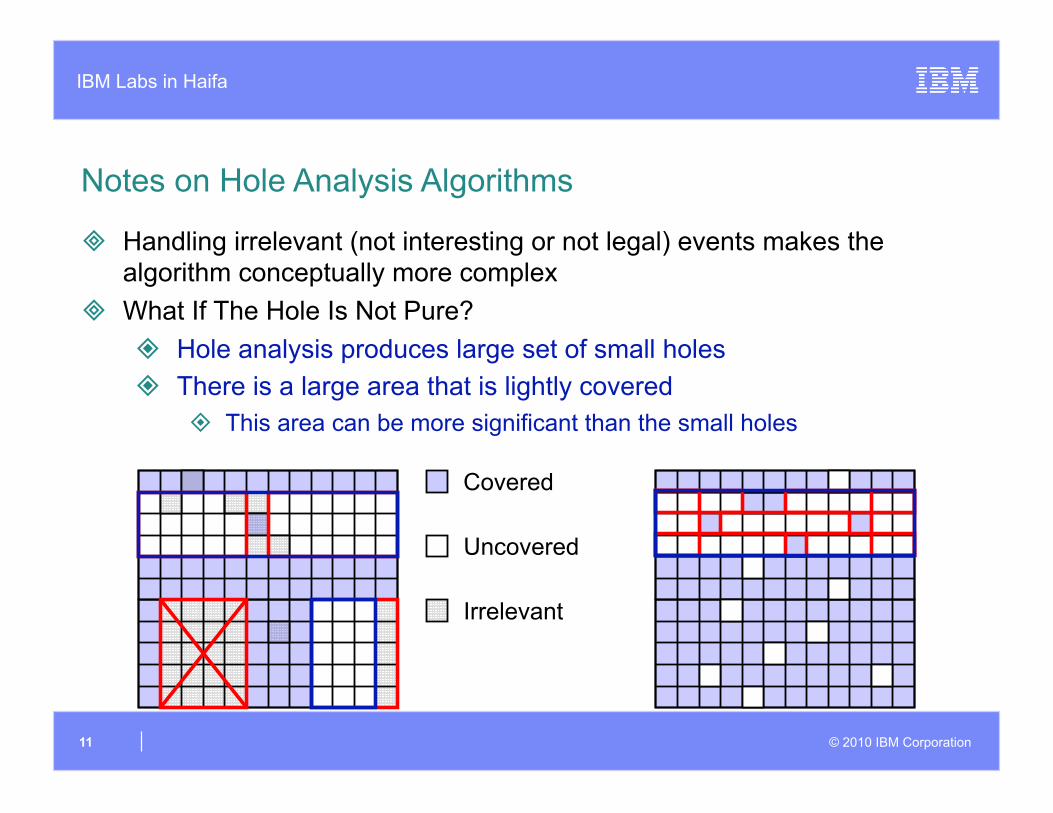
Covered
Uncovered
Irrelevant
Notes on Hole Analysis Algorithms
Handling irrelevant (not interesting or not legal) events makes the algorithm conceptually more complex
What If The Hole Is Not Pure? Hole analysis produces large set of small holes There is a large area that is lightly covered
This area can be more significant than the small holes
IBM Labs in Haifa
© 2010 IBM Corporation 12
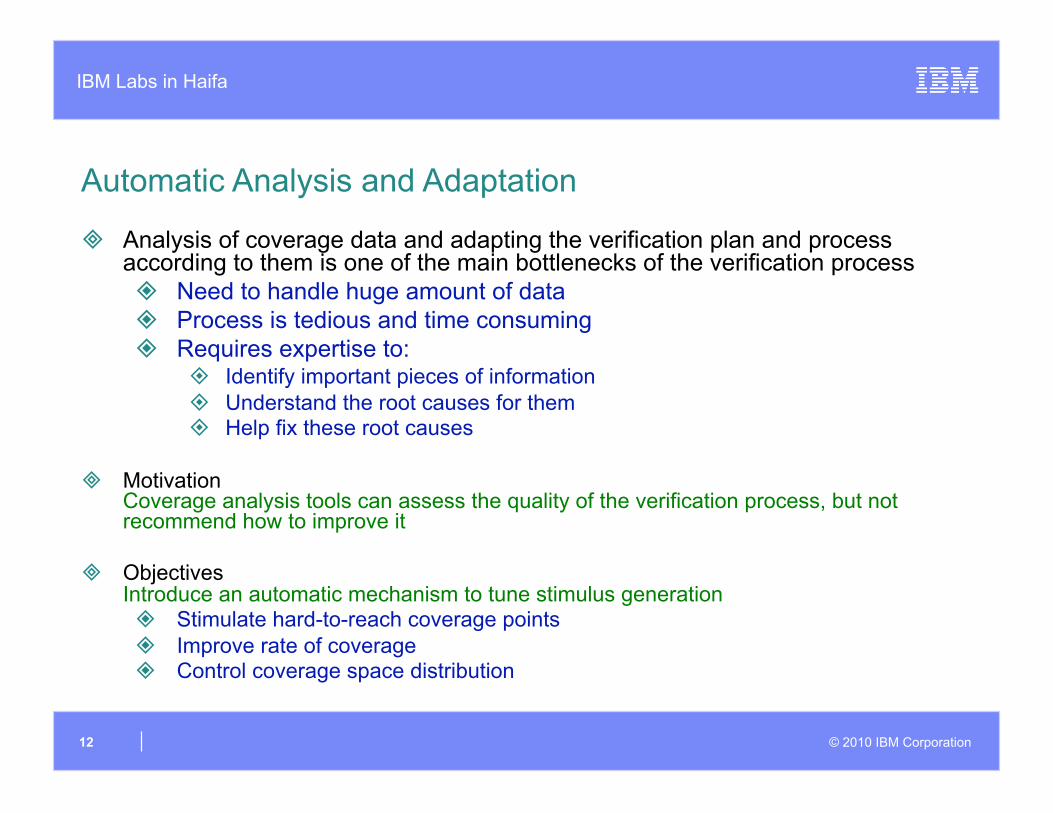
Automatic Analysis and Adaptation
Analysis of coverage data and adapting the verification plan and process according to them is one of the main bottlenecks of the verification process Need to handle huge amount of data Process is tedious and time consuming Requires expertise to:
Identify important pieces of information Understand the root causes for them Help fix these root causes
Motivation Coverage analysis tools can assess the quality of the verification process, but not recommend how to improve it
Objectives Introduce an automatic mechanism to tune stimulus generation Stimulate hard-to-reach coverage points Improve rate of coverage Control coverage space distribution
IBM Labs in Haifa
© 2010 IBM Corporation 13
Closing The Loop from Coverage to Stimuli
The problem: Given a coverage event that we want to hit, how to create a stimuli that reaches the requested event
In general, this is a very hard problem to solve because of the possible big distance between stimuli and coverage In terms of abstraction In terms of languages In terms of time
IBM Labs in Haifa
© 2010 IBM Corporation 14
How to Hit Uncovered Coverage Events
The manual approach Based on understanding of the DUV and its environment
Understand the target event and how to reach it Design the stimuli that reaches the event
Break the problem into smaller problems Solve each problem separately Combine solutions
Measure quality of solutions Iterate and improve until target reached
Automatic solution schemes basically follow the same approaches
IBM Labs in Haifa
© 2010 IBM Corporation 15
Model-based Coverage Directed Generation
The basic idea Create a model of the DUV and query it on how to reach the target
event
Model requirements Simple Accurate Supporting queries
An important and often difficult part of the solution is translation of the abstract test provided by the model into a concrete one
IBM Labs in Haifa
© 2010 IBM Corporation 16
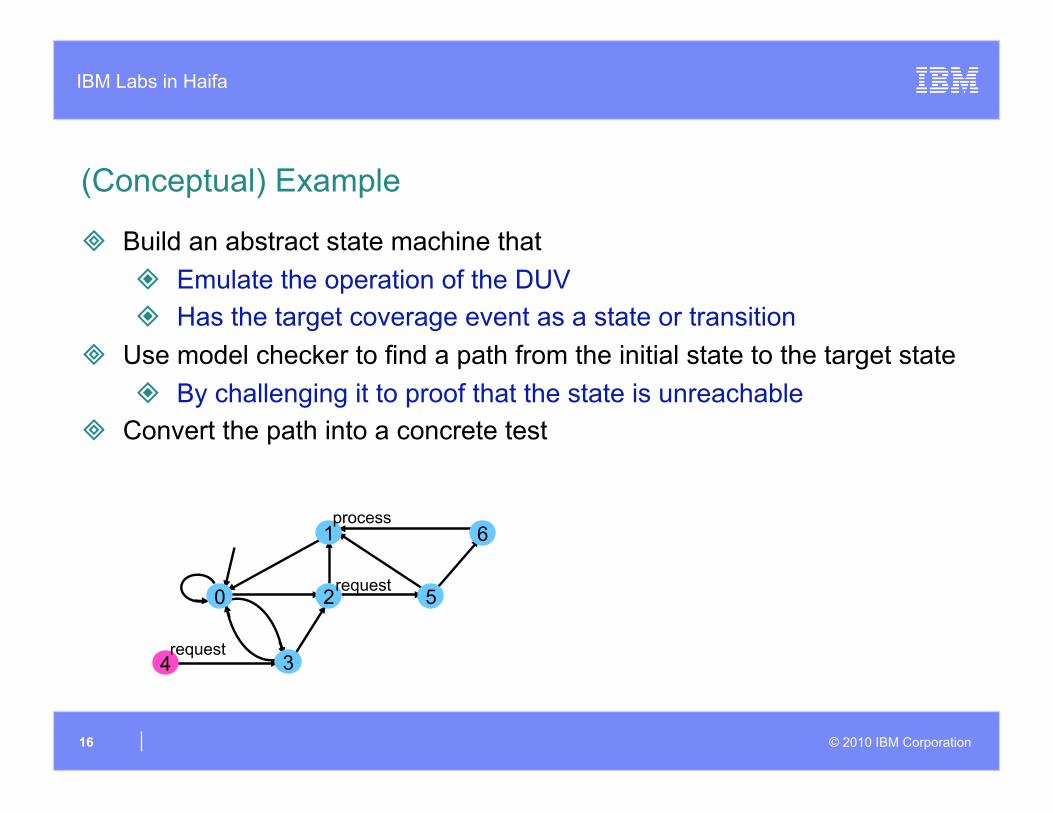
(Conceptual) Example
Build an abstract state machine that Emulate the operation of the DUV Has the target coverage event as a state or transition
Use model checker to find a path from the initial state to the target state By challenging it to proof that the state is unreachable
Convert the path into a concrete test
0
1
2 5
6
3 4
process
request
request
IBM Labs in Haifa
© 2010 IBM Corporation 17
Examples
Actually, I am not going to give specific examples There are many papers published with the same basic idea. They
present innovation in How to build the model How to traverse the model How to convert the abstract traversal to a concrete test
Most of this work is coming from academia and is working on small examples This approach is not adapted in industry
IBM Labs in Haifa
© 2010 IBM Corporation 18
The Model Is Everything
If the model is accurate this approach works very well It is (almost) guaranteed to generate tests that reach the target
events But small inaccuracies can lead to big degradation in performance Building and maintaining an accurate model can be a big problem
Endless number of end cases to take care of Constant changes to the DUV
IBM Labs in Haifa
© 2010 IBM Corporation 19
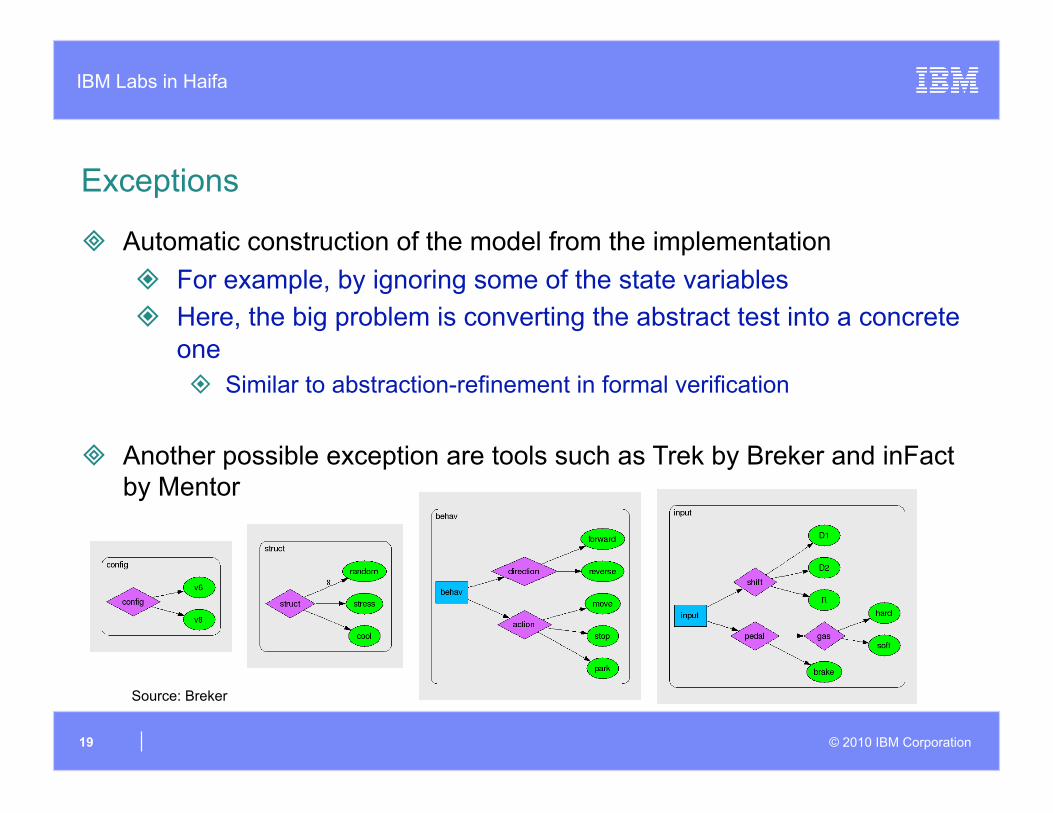
Exceptions
Automatic construction of the model from the implementation For example, by ignoring some of the state variables Here, the big problem is converting the abstract test into a concrete
one Similar to abstraction-refinement in formal verification
Another possible exception are tools such as Trek by Breker and inFact by Mentor
Source: Breker
IBM Labs in Haifa
© 2010 IBM Corporation 20
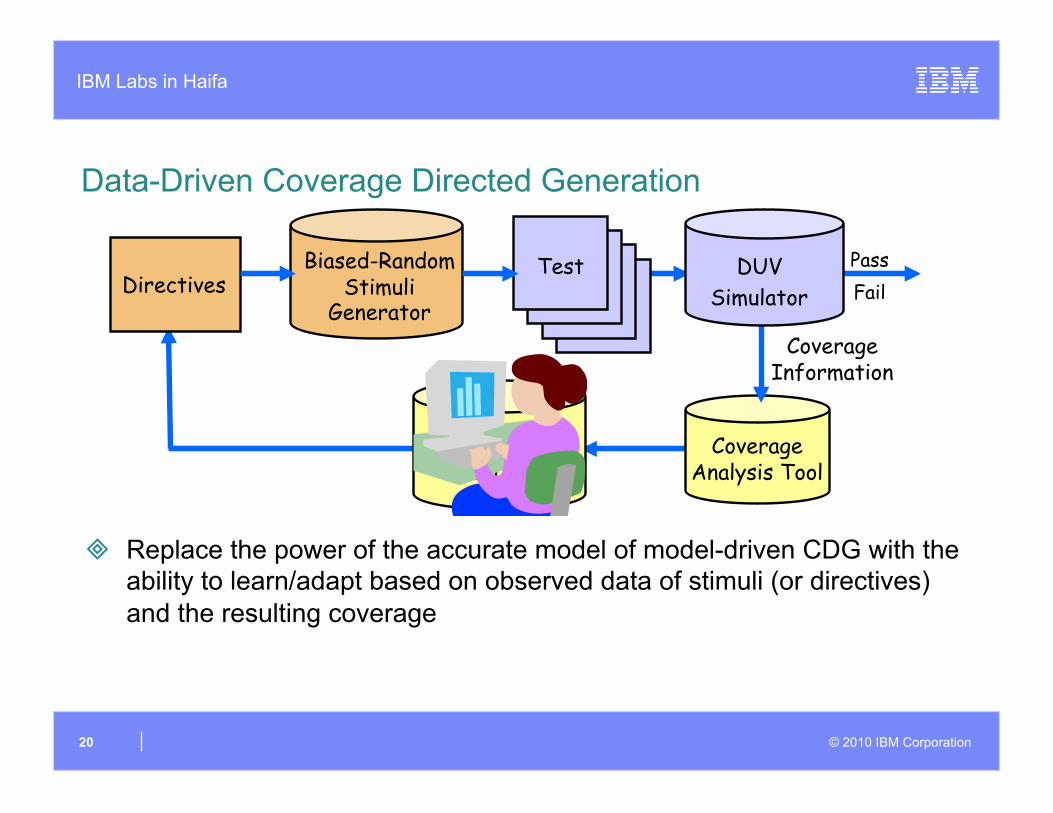
Data-Driven Coverage Directed Generation
Replace the power of the accurate model of model-driven CDG with the ability to learn/adapt based on observed data of stimuli (or directives) and the resulting coverage
Coverage Analysis Tool
Coverage Information
Biased-Random Stimuli
Generator Test Test
Fail Pass DUV
Simulator Directives
CDG Engine
IBM Labs in Haifa
© 2010 IBM Corporation 21
How Data-Driven CDG Works
The CDG engine is fed pairs of inputs (directives) and outputs (coverage data) These pairs are often called training data
The CDG engine “understands” the relations between inputs and outputs and can answer queries about the relations What directive can lead to a requested coverage event?
Two levels of understanding Memorizing Generalization
In CDG we are usually interested in pairs not seen in the training data Specifically, how to reach uncovered events
Generalization is the key to success
IBM Labs in Haifa
© 2010 IBM Corporation 22
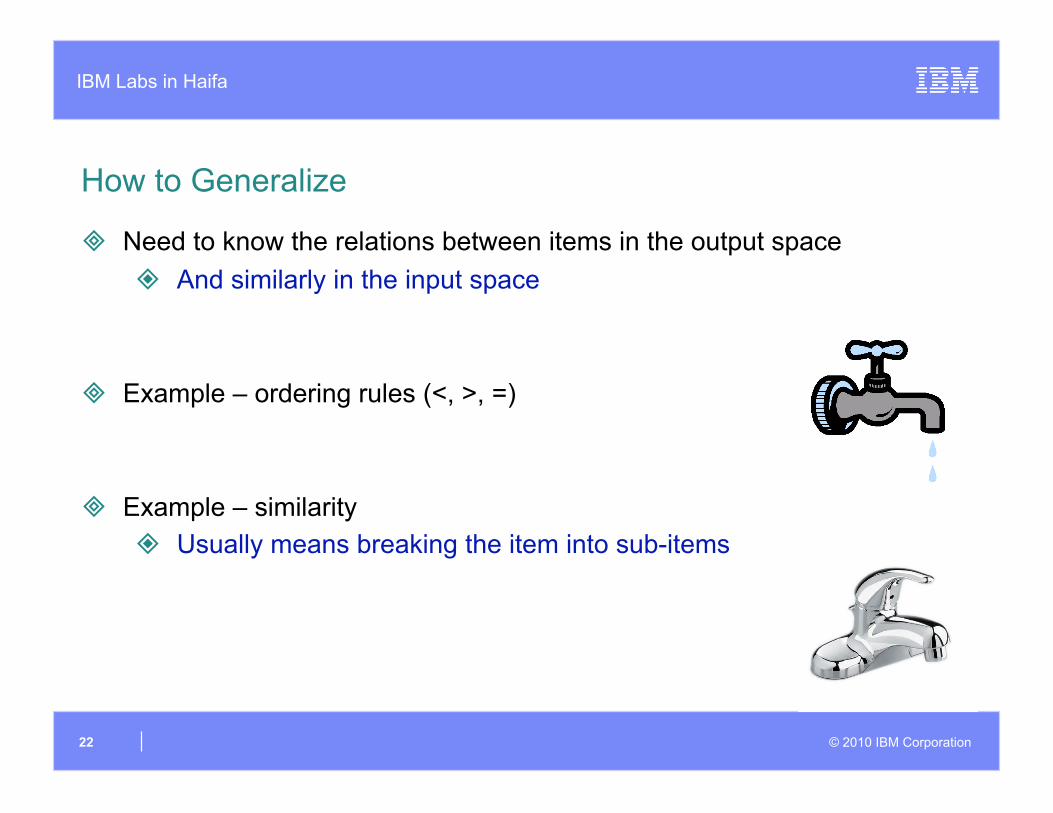
How to Generalize
Need to know the relations between items in the output space And similarly in the input space
Example – ordering rules (<, >, =)
Example – similarity Usually means breaking the item into sub-items
IBM Labs in Haifa
© 2010 IBM Corporation 23
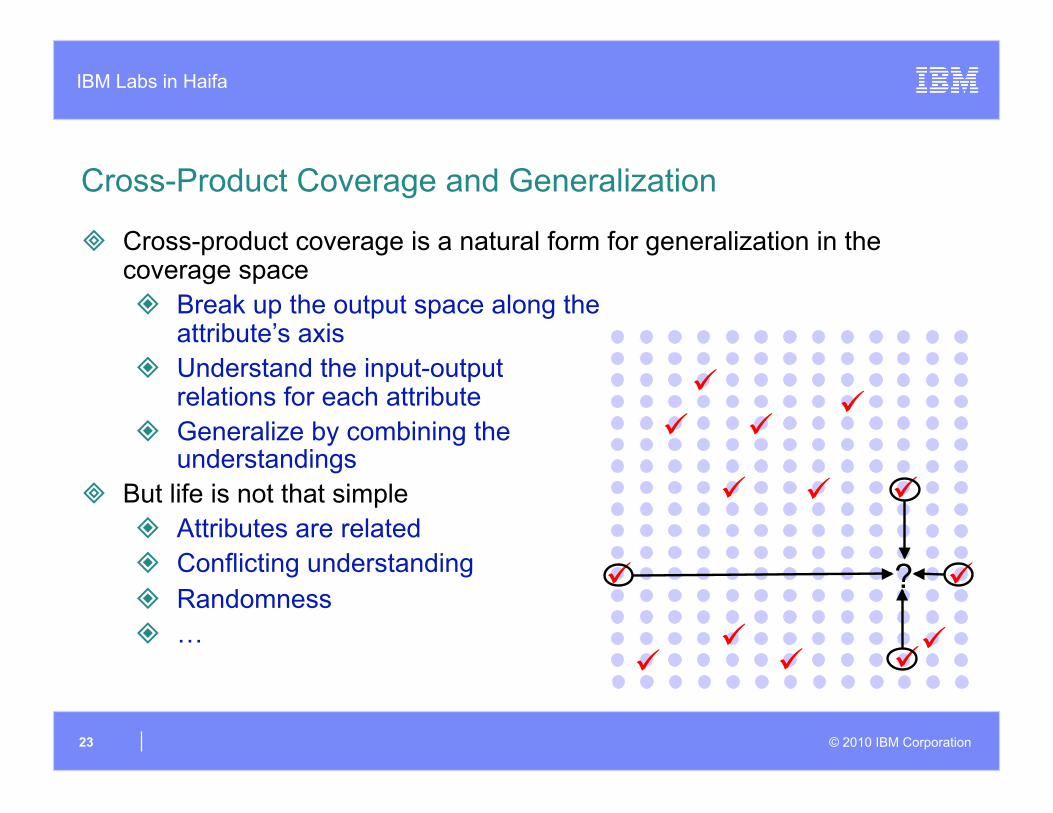
Cross-Product Coverage and Generalization
Cross-product coverage is a natural form for generalization in the coverage space Break up the output space along the
attribute’s axis Understand the input-output
relations for each attribute Generalize by combining the
understandings But life is not that simple
Attributes are related Conflicting understanding Randomness …
?
IBM Labs in Haifa
© 2010 IBM Corporation 24
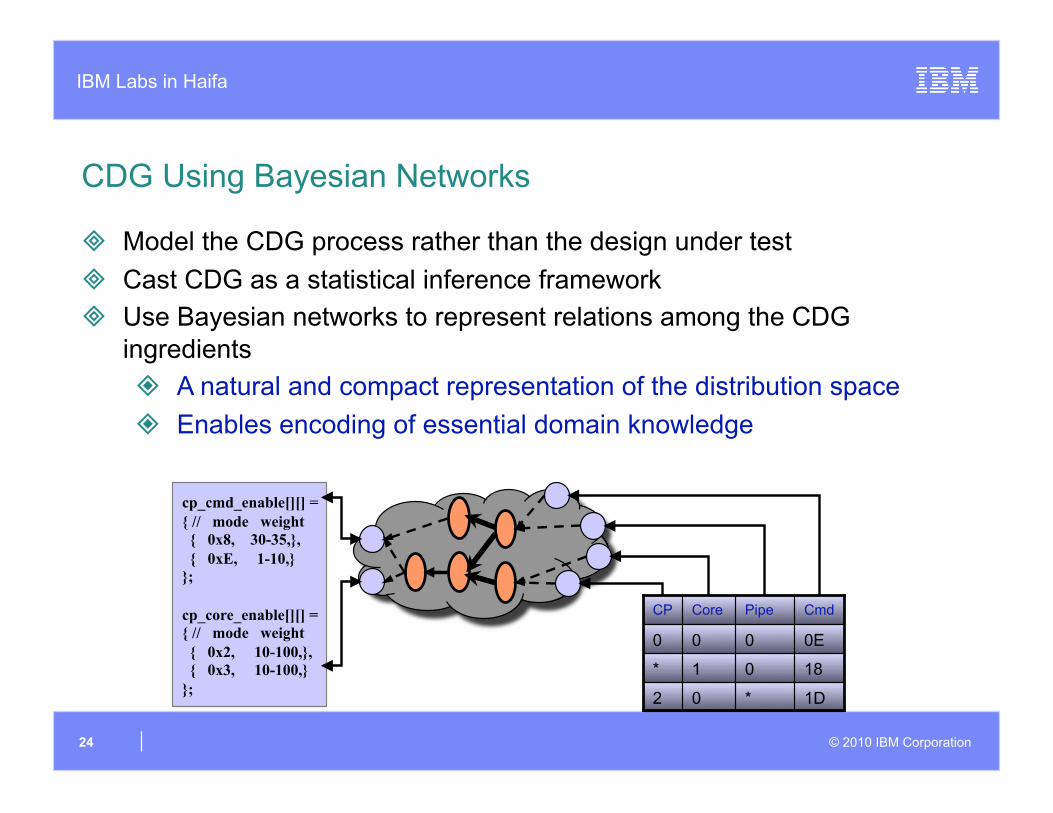
CDG Using Bayesian Networks
Model the CDG process rather than the design under test Cast CDG as a statistical inference framework Use Bayesian networks to represent relations among the CDG
ingredients A natural and compact representation of the distribution space Enables encoding of essential domain knowledge
1D * 0 2
18 0 1 *
0E 0 0 0
Cmd Pipe Core CP
cp_cmd_enable[][] = { // mode weight { 0x8, 30-35,}, { 0xE, 1-10,} };
cp_core_enable[][] = { // mode weight { 0x2, 10-100,}, { 0x3, 10-100,} };
IBM Labs in Haifa
© 2010 IBM Corporation 25
Family of Alarm
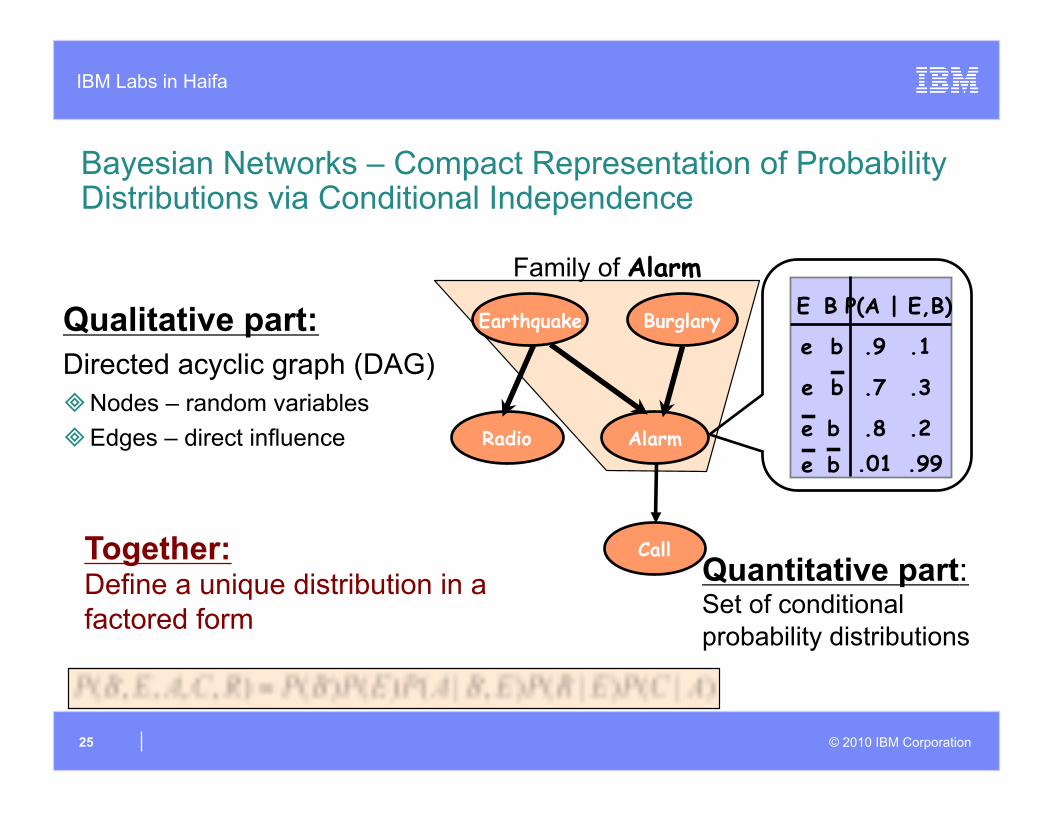
Bayesian Networks – Compact Representation of Probability Distributions via Conditional Independence
Qualitative part: Directed acyclic graph (DAG) Nodes – random variables Edges – direct influence
Quantitative part: Set of conditional probability distributions
Earthquake
Radio
Burglary
Alarm
Call Together: Define a unique distribution in a factored form
.9 .1 e
b e
.7 .3
.01 .99 .8 .2
b e
b b
e
B E P(A | E,B)
IBM Labs in Haifa
© 2010 IBM Corporation 26
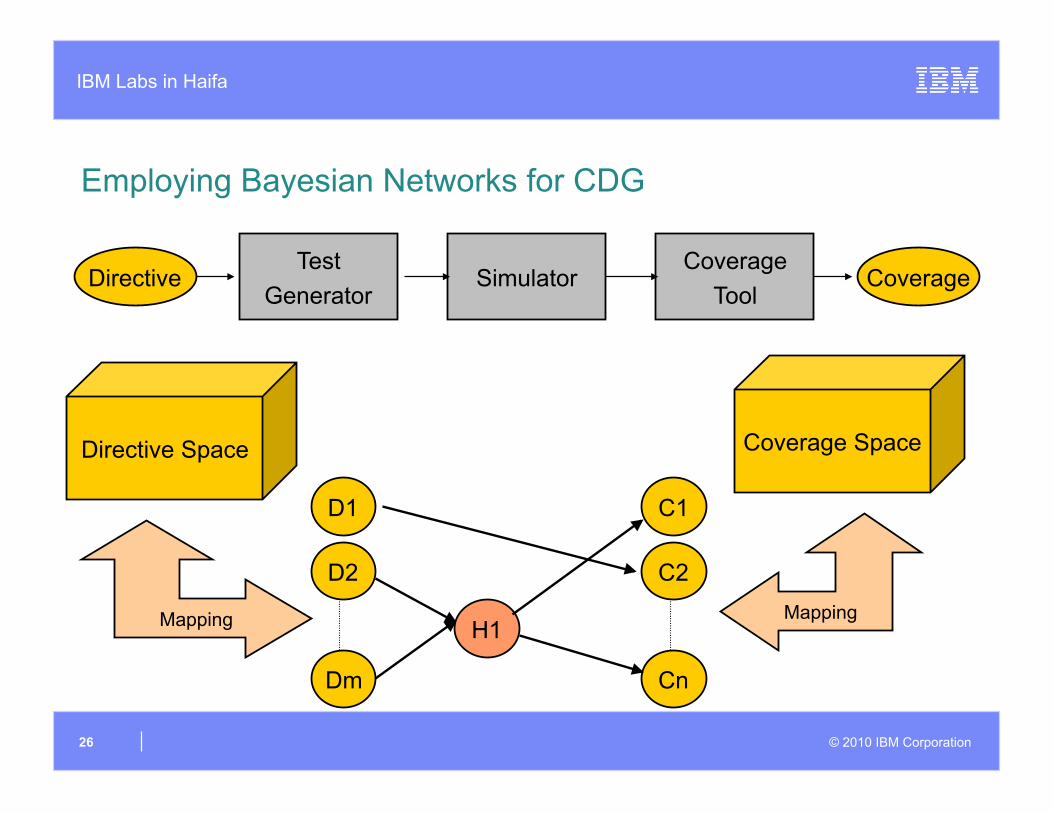
Employing Bayesian Networks for CDG
Dm
Test Generator
Simulator Coverage
Tool Directive Coverage
Coverage Space Directive Space
D1
D2
Cn
C1
C2
H1 Mapping Mapping
IBM Labs in Haifa
© 2010 IBM Corporation 27
Dm
D1
D2
Cn
C1
C2
H1
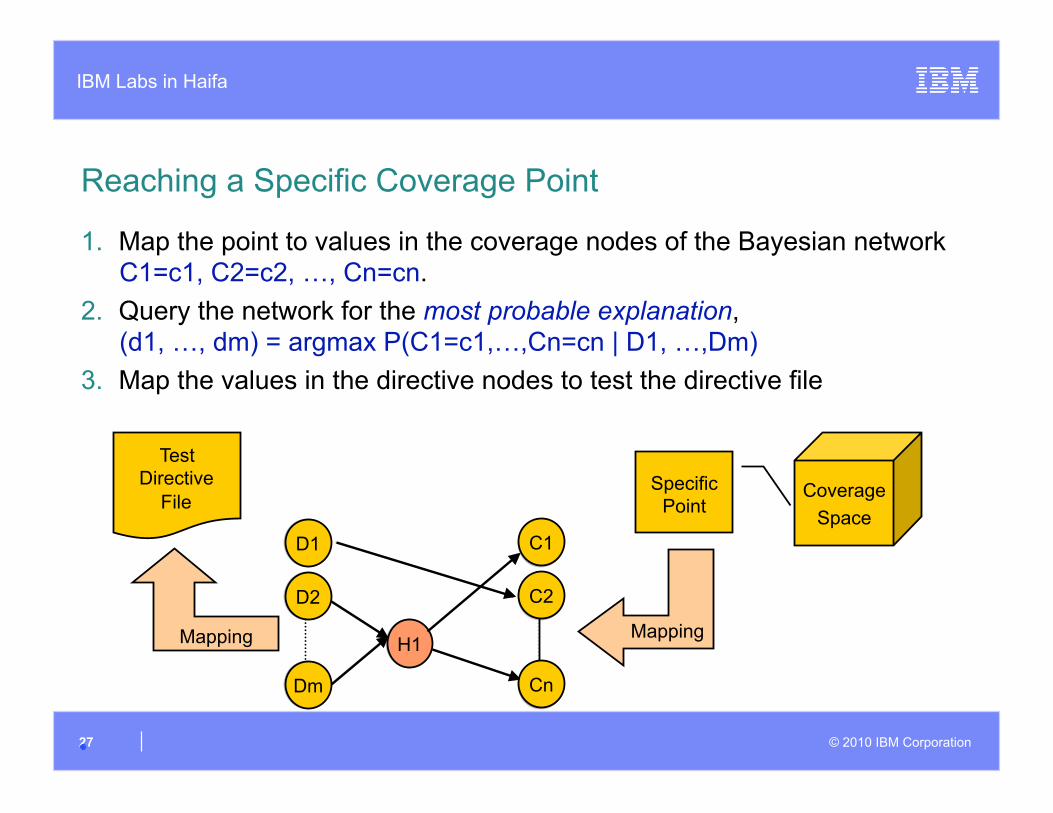
Reaching a Specific Coverage Point
1. Map the point to values in the coverage nodes of the Bayesian network C1=c1, C2=c2, …, Cn=cn.
2. Query the network for the most probable explanation, (d1, …, dm) = argmax P(C1=c1,…,Cn=cn | D1, …,Dm)
3. Map the values in the directive nodes to test the directive file
Coverage Space
Dm
D1
D2
H1
Cn
C1
C2
Mapping
Specific Point
Mapping
Test Directive
File
IBM Labs in Haifa
© 2010 IBM Corporation 28
Advantages and Disadvantages
There are other similar approaches For example, the use of Inductive Logic Programming (ILP) to learn
the relations between the stimuli and coverage (Hsueh and Eder) All of them are less dependent on the accuracy of the model But they do not guarantee to hit the target event
At best they improve the probability of doing so These approaches rely on some structure in the coverage model
As is, they cannot work on singular coverage events
IBM Labs in Haifa
© 2010 IBM Corporation 29
Back to The Shower
In model-based CDG, the model provides us an accurate solution But we depend on the accuracy of the model
In the data-driven approach we showed, we do not need an accurate model But all we get is improved probability of hitting the target
Yet another approach is to take existing attempts and iteratively improve them until the target is hit
Several such CDG systems exist based on Genetic algorithms Reward functions Path tracing
IBM Labs in Haifa
© 2010 IBM Corporation 30
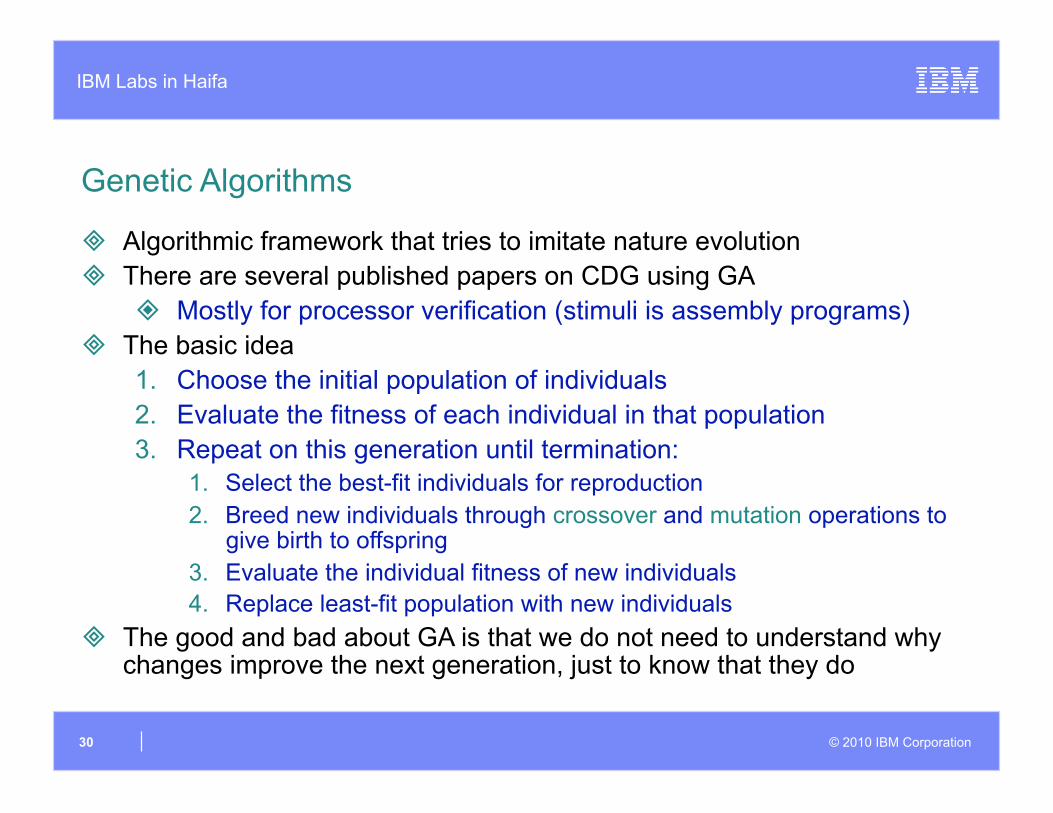
Genetic Algorithms
Algorithmic framework that tries to imitate nature evolution There are several published papers on CDG using GA
Mostly for processor verification (stimuli is assembly programs) The basic idea
1. Choose the initial population of individuals 2. Evaluate the fitness of each individual in that population 3. Repeat on this generation until termination:
1. Select the best-fit individuals for reproduction 2. Breed new individuals through crossover and mutation operations to
give birth to offspring 3. Evaluate the individual fitness of new individuals 4. Replace least-fit population with new individuals
The good and bad about GA is that we do not need to understand why changes improve the next generation, just to know that they do
IBM Labs in Haifa
© 2010 IBM Corporation 31
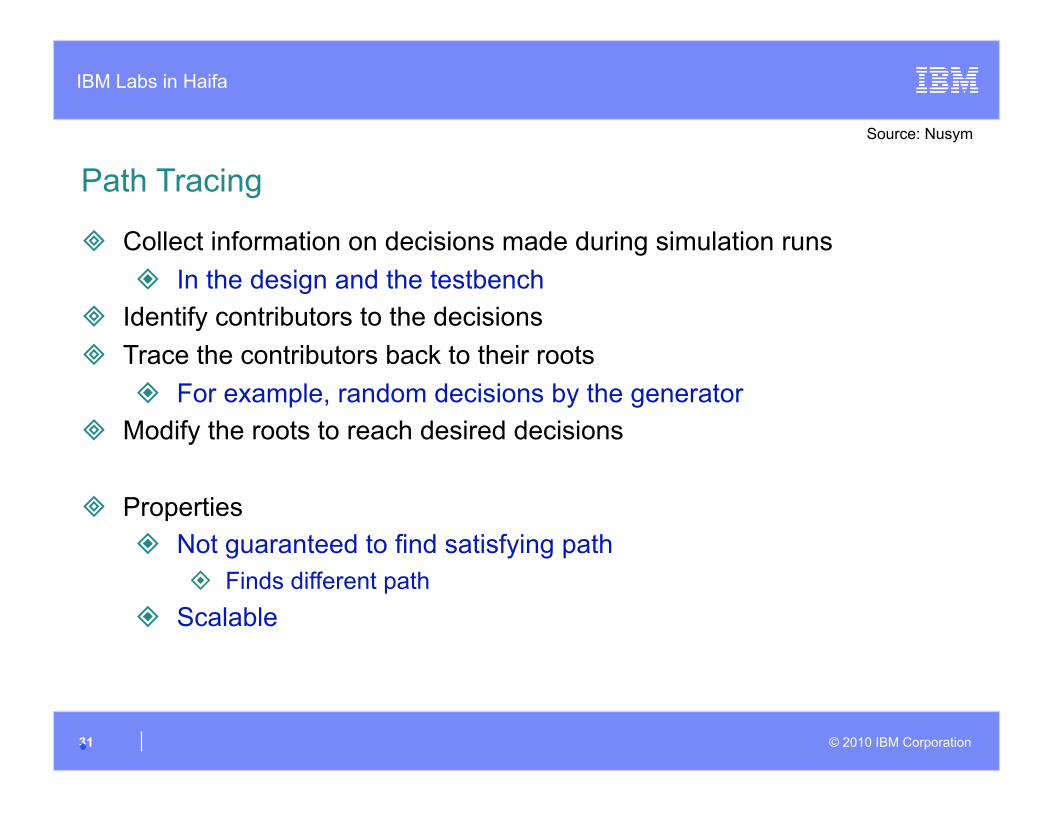
Path Tracing
Collect information on decisions made during simulation runs In the design and the testbench
Identify contributors to the decisions Trace the contributors back to their roots
For example, random decisions by the generator Modify the roots to reach desired decisions
Properties Not guaranteed to find satisfying path
Finds different path Scalable
Source: Nusym
IBM Labs in Haifa
© 2010 IBM Corporation 32
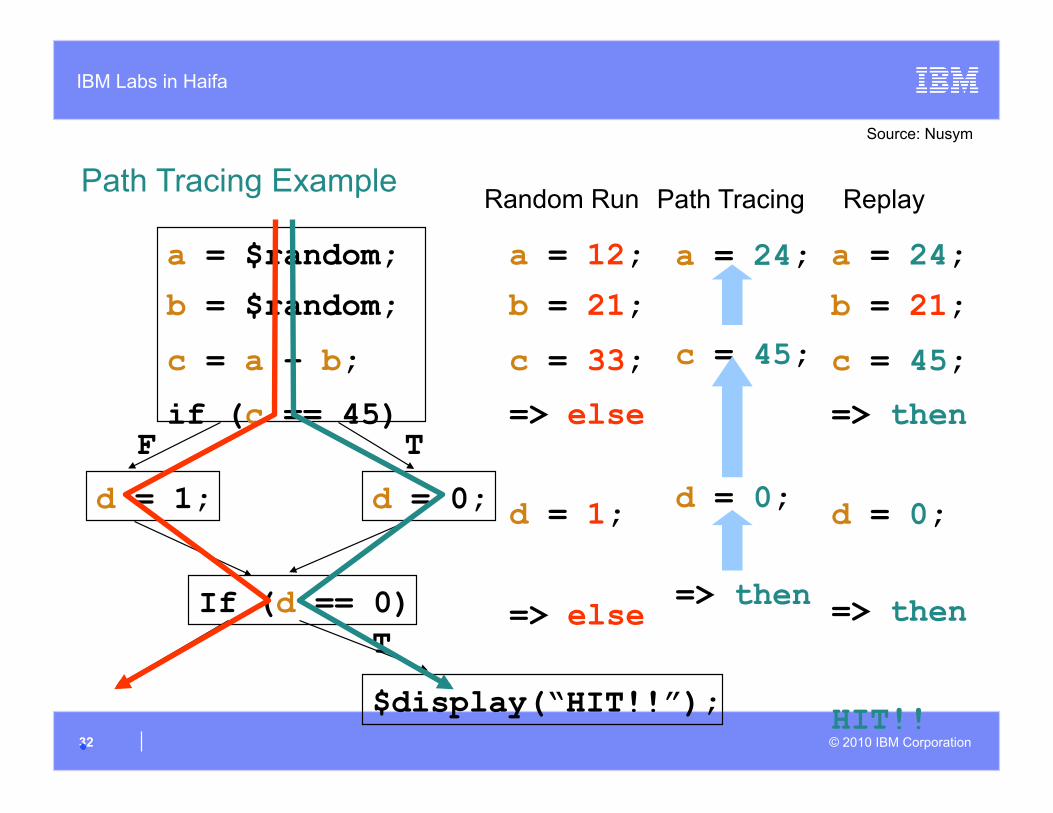
Path Tracing Example
a = $random;
b = $random;
c = a + b;
if (c == 45)
d = 1; d = 0;
If (d == 0)
$display(“HIT!!”);
F T
T
a = 12;
b = 21;
c = 33;
=> else
d = 1;
=> else
Random Run
a = 24;
b = 21;
c = 45;
=> then
d = 0;
=> then
HIT!!
Replay Path Tracing
a = 24;
c = 45;
d = 0;
=> then
Source: Nusym
IBM Labs in Haifa
© 2010 IBM Corporation 33
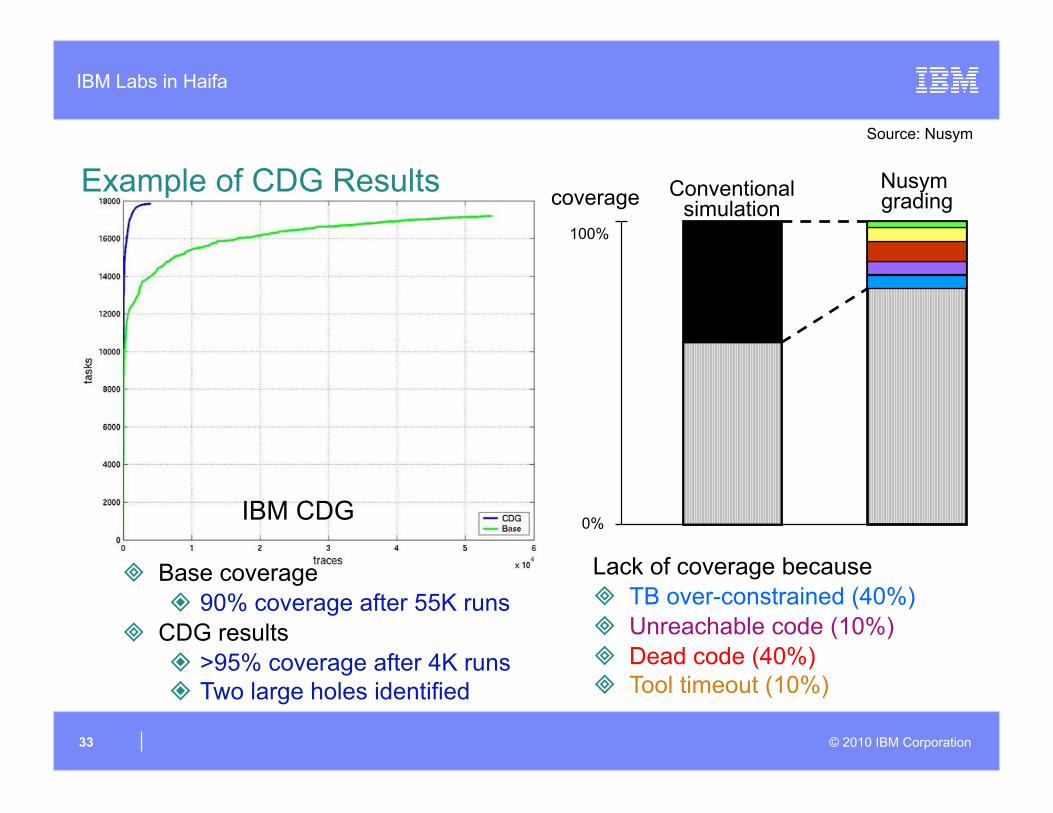
IBM CDG
Example of CDG Results
Base coverage 90% coverage after 55K runs
CDG results >95% coverage after 4K runs Two large holes identified
coverage 100%
0%
Conventional simulation
Nusym grading
Lack of coverage because TB over-constrained (40%) Unreachable code (10%) Dead code (40%) Tool timeout (10%)
Source: Nusym
IBM Labs in Haifa
© 2010 IBM Corporation 34
Summary
Getting to coverage closure is one of the most difficult and time consuming tasks verification engineers face
The task has two important aspects Extracting important information out of the ocean of data Act upon this information to fix issues in activation of the verification
environment E.g., hit uncovered events
Advanced techniques and automation can help in both aspects We are far away from having an end-to-end working solution
But we are making progress

IBM Labs in Haifa
© 2010 IBM Corporation 35