eating difficulties in children born late and moderately ... eating paper_ajcn... · 54 here we...
TRANSCRIPT
1
Eating difficulties in children born late and moderately preterm at 2 years of age:
a prospective population-based cohort study
Authors: Samantha Johnson, Ruth Matthews, Elizabeth S Draper, David J Field, Bradley N
Manktelow, Neil Marlow, Lucy K Smith, Elaine M Boyle.
Affiliations: Department of Health Sciences, University of Leicester, Leicester, UK (SJ, RM,
ESD, DJF, BNM, LKS, EMB); Department of Academic Neonatology, Institute for Women’s
Health, University College London, London, UK (NM).
Names for PubMed indexing: Johnson, Matthews, Draper, Field, Manktelow, Marlow,
Smith, Boyle.
Address correspondence and requests for reprints: Dr Samantha Johnson, Senior Research
Fellow, Department of Health Sciences, University of Leicester, 22-28 Princess Road West,
Leicester, LE1 6TP, UK. Tel: 0116 252 5798. Fax: 0116 252 3272. Email: [email protected].
Sources of support: This article presents independent research funded by the National
Institute for Health Research (NIHR) under its Programme Grants for Applied Research
(PGfAR) Programme (Grant Reference Number RP-PG-0407-10029). The views expressed
are those of the author(s) and not necessarily those of the NHS, the NIHR or the Department
of Health. Neil Marlow receives a proportion of funding from the Department of Health’s
NIHR Biomedical Research Centres funding scheme at UCLH/UCL.
Running title: Eating behaviour in late/moderate preterm infants.
Abbreviations: BITSEA Brief Infant and Toddler Social Emotional Assessment; LMPT Late
and moderately preterm (32-36 weeks gestation); NG Nasogastric; SES Socio-economic
Status; SGA Small for Gestational Age.

2
Clinical Trial Registration Ref: UKCRN ID 7441
3
3
Abstract 1
Background. Very preterm (<32 weeks gestation) infants are at increased risk for eating 2
difficulties compared with term-born peers. Little is known about the impact of late and 3
moderately preterm (LMPT; 32-36 weeks gestation) birth on eating difficulties in early 4
childhood. Objective. To assess the prevalence of eating difficulties in infants born LMPT at 5
two years corrected age and to explore the impact of neonatal and neurodevelopmental 6
factors. Design. A geographic population-based cohort of 1130 LMPT and 1255 term-born 7
controls was recruited at birth. The parents of 651 (59%) LMPT and 771 (62%) term-born 8
infants completed questionnaires at two years corrected age to assess neurodevelopmental 9
outcomes. Parents also completed a validated questionnaire to assess eating behaviours in 10
four domains: refusal/picky eating, oral motor problems, oral hypersensitivity and eating 11
behaviour problems. Infants with scores >90th percentile were classified with eating 12
difficulties in each domain. Neonatal data were collected at discharge and socio-demographic 13
information via maternal interview. Poisson regression was used to assess between-group 14
differences in eating difficulties and to explore associations with neonatal factors and 15
neurodevelopmental outcomes at two years of age. Results. In unadjusted analyses, LMPT 16
infants were at increased risk for refusal/picky eating (RR 1.53; 95% CI 1.03, 2.25) and oral 17
motor problems (RR 1.62; 95% CI 1.06. 2.47). Prolonged nasogastric feeding (RR 1.87; 95% 18
CI 1.07 to 3.25), behaviour problems (RR 2.95; 95% CI 1.93 to 4.52) and delayed social 19
competence (RR 2.28; 95% CI 1.49 to 3.48) were independently associated with eating 20
difficulties in multivariable analyses. After adjusting for these factors, there was no excess of 21
eating difficulties in LMPT infants. Conclusions. Infants born LMPT are at increased risk 22
for oral motor and picky eating problems at two years corrected age. However, these are 23
mediated by other neurobehavioral sequelae in this population. 24
25
4
4
INTRODUCTION 26
Infants born very preterm (<32 weeks gestation) are at high risk for oral feeding difficulties 27
during the neonatal period, including problems coordinating suck-swallow and swallow-28
respiration reflexes, neurological immaturity and readiness for oral feeding (1-3). Feeding 29
difficulties may persist throughout childhood manifesting in delayed feeding skill 30
development, food refusal, difficulties weaning, oral-motor dysfunction, oral hypersensitivity 31
and eating behaviour problems (4-7). Prolonged exposure to nasogastric (NG) tube feeding 32
and the provision of mechanical ventilation during neonatal care have both been associated 33
with feeding difficulties and oral sensitivity in very preterm survivors (5, 8, 9). Eating 34
difficulties in infancy and middle childhood have also been associated with 35
neurodevelopmental and behavioural sequelae, which are common following preterm 36
birth(10), small for gestational age (SGA) status, male sex and socio-economic adversity in 37
children born very preterm or with high neonatal risk (4, 7, 8, 11-13). 38
Much less is known about the development of eating difficulties in infants born late or 39
moderately preterm (LMPT; 32-36 weeks gestation). Although there is mounting evidence 40
that LMPT infants are at increased risk for health, neurodevelopmental and behavioural 41
sequelae compared with term-born peers(14, 15), there is a paucity of research relating to 42
eating behaviours in this population. In one study, 20 low-risk LMPT babies who received 43
NG feeds exhibited more oral sensitivity, facial defensiveness and delayed feeding 44
development than 10 term-born controls at 11-17 months corrected age; LMPT infants who 45
received more than three weeks of NG feeds had poorer feeding development than LMPT 46
infants who received less than two weeks (16). In two further studies, late preterm infants had 47
similar rates of parent-reported eating difficulties to very preterm infants over the first year of 48
life (17, 18). These results suggest that, compared with term-born infants, LMPT infants may 49
be at increased risk for eating difficulties in early childhood and that these may be associated 50

5
5
with prolonged NG feeding and neurodevelopmental or behavioural sequelae. However, there 51
have been no population-based studies of the prevalence of eating difficulties in LMPT 52
infants. 53
Here we report the results of a large prospective population-based cohort study of LMPT 54
infants compared with term-born controls. The aims of the study were to determine whether 55
(1) infants born LMPT are at higher risk of eating difficulties than term-born peers at two 56
years corrected age, (2) prolonged exposure to NG feeds and mechanical ventilation are 57
associated with the development of eating difficulties in LMPT infants, and (3) whether 58
eating difficulties in LMPT infants are mediated by neurodevelopmental sequelae. 59
60
METHOD 61
Participants 62
All babies born LMPT (32+0-36+6 weeks) to mothers resident in a geographically defined 63
region of the East Midlands of England from September 2009 through December 2010 were 64
invited to participate in the Late and Moderately Preterm Birth Study (LAMBS). This 65
comprised babies delivered at four large maternity centres, a midwifery-led birthing unit and 66
at home. A random sample of singleton babies born 37+0-42+6 weeks was also recruited 67
during the same time period and in the same geographical region to form a control group. 68
These were selected based on random sampling of dates and times of birth of babies in the 69
same area during the previous year from computerised records. Mothers of all multiples born 70
at term during the study period were also invited to participate given the high rate of multiple 71
births in the LMPT population. To examine the effects of preterm birth per se on eating 72
difficulties, infants with major structural or chromosomal congenital anomalies, including 73
cardiovascular malformations, and neurosensory impairment were excluded from the 74
analyses. 75
6
6
Procedure 76
Informed consent was obtained from mothers and information about mothers’ socio-77
demographic status was obtained via a semi-structured post-natal interview conducted by 78
research midwives. Obstetric and neonatal data were collected from mothers’ and infants’ 79
medical notes, respectively, at discharge from hospital. Infants were followed up at two years 80
corrected age via a parent questionnaire. This questionnaire was mailed to parents seven to 81
ten days before the child turned two years corrected age with instructions to mail the 82
completed questionnaire back to the study centre in a freepost envelope provided. Parents 83
were contacted by telephone when the child reached two years corrected age to remind them 84
to complete the questionnaire it if they had not yet responded. Parents who did not respond to 85
the postal questionnaire were also offered the option to complete it via a telephone interview 86
or electronically in order to maximise response rates. The study was approved by Derbyshire 87
National Health Service Research Ethics Committee (Ref: NHS REC 09/H0401/25) and was 88
registered on the UK Clinical Research Network Portfolio (Ref: UKCRN ID 7441). 89
90
Measures 91
At two years corrected age, parents were asked to complete a questionnaire comprising 92
measures to assess infants’ eating behaviour, cognitive development, behaviour and 93
emotional problems and neurosensory impairment. These were as follows: 94
1) A validated eating behaviour questionnaire(4) was used to assess the presence of eating 95
difficulties in the four domains of refusal/picky eating (e.g., poor appetite, food refusal, 96
selective eating), oral motor problems (e.g., problems biting, chewing or swallowing, gagging 97
or choking on food), oral hypersensitivity (e.g., aversion to being touched around the mouth 98
or having things put in the mouth) and eating behaviour problems (e.g., has tantrums or 99
makes a mess during meals) (see the online supplemental appendix for a copy of the 100
7
7
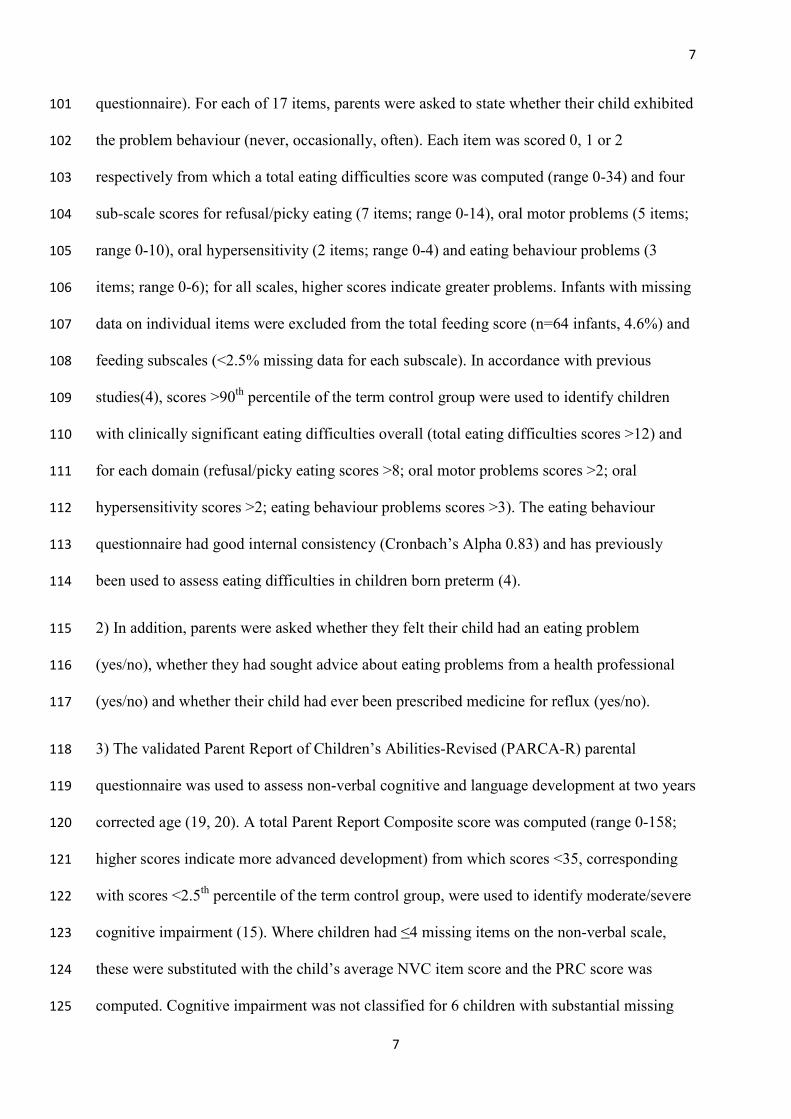
questionnaire). For each of 17 items, parents were asked to state whether their child exhibited 101
the problem behaviour (never, occasionally, often). Each item was scored 0, 1 or 2 102
respectively from which a total eating difficulties score was computed (range 0-34) and four 103
sub-scale scores for refusal/picky eating (7 items; range 0-14), oral motor problems (5 items; 104
range 0-10), oral hypersensitivity (2 items; range 0-4) and eating behaviour problems (3 105
items; range 0-6); for all scales, higher scores indicate greater problems. Infants with missing 106
data on individual items were excluded from the total feeding score (n=64 infants, 4.6%) and 107
feeding subscales (<2.5% missing data for each subscale). In accordance with previous 108
studies(4), scores >90th percentile of the term control group were used to identify children 109
with clinically significant eating difficulties overall (total eating difficulties scores >12) and 110
for each domain (refusal/picky eating scores >8; oral motor problems scores >2; oral 111
hypersensitivity scores >2; eating behaviour problems scores >3). The eating behaviour 112
questionnaire had good internal consistency (Cronbach’s Alpha 0.83) and has previously 113
been used to assess eating difficulties in children born preterm (4). 114
2) In addition, parents were asked whether they felt their child had an eating problem 115
(yes/no), whether they had sought advice about eating problems from a health professional 116
(yes/no) and whether their child had ever been prescribed medicine for reflux (yes/no). 117
3) The validated Parent Report of Children’s Abilities-Revised (PARCA-R) parental 118
questionnaire was used to assess non-verbal cognitive and language development at two years 119
corrected age (19, 20). A total Parent Report Composite score was computed (range 0-158; 120
higher scores indicate more advanced development) from which scores <35, corresponding 121
with scores <2.5th percentile of the term control group, were used to identify moderate/severe 122
cognitive impairment (15). Where children had ≤4 missing items on the non-verbal scale, 123
these were substituted with the child’s average NVC item score and the PRC score was 124
computed. Cognitive impairment was not classified for 6 children with substantial missing 125

8
8
PARCA-R data. For 20 non-English speaking children in whom the language section could 126
not be completed, scores <22 for non-verbal cognition alone, corresponding with non-verbal 127
cognition scores <2.5th percentile of the term control group, were used to classify cognitive 128
impairment (15). PARCA-R scores are strongly correlated with scores on the Bayley Scales 129
of Infant Development, and the questionnaire is widely used to assess neurodevelopmental 130
outcomes in preterm infants in epidemiological studies and randomised trials (19-23). 131
4) The Brief Infant Toddler Social Emotional Assessment (BITSEA) questionnaire was 132
completed by parents to assess behavioural and emotional outcomes at two years corrected 133
age (24). This comprises two scales to assess problem behaviours (internalising and 134
externalising problems, dysregulation, maladaptive and atypical behaviours) and socio-135
emotional competence (attention, compliance, mastery motivation, peer relations, empathy, 136
imitation/play skills and social relatedness) from which a total problem score (higher scores 137
indicate greater problems) and a total competence score (lower scores indicate lower 138
competence) was computed, respectively. Missing BITSEA items were scored 0 where there 139
were ≤5 missing items on the problem scale and ≤2 missing items on the competence scale. 140
Data from children with additional missing data were excluded (n=18). Children with 141
clinically significant behaviour problems and delayed social competence were identified 142
using the published norms in which cut-offs correspond with problem scores >25th percentile 143
and competence scores <15th percentile of the standardisation sample (24). The BITSEA has 144
excellent test-retest reliability, inter-rater reliability and predictive validity for psychiatric 145
disorders at school age (25). 146
5) Parents were asked whether their child had a diagnosis of cerebral palsy and to rate their 147
child’s vision, hearing and gross motor function using forced-choice items corresponding 148
with standard criteria for classifying health status at two years (26). Infants with one or more 149
of moderate/severe vision impairment (blind/vision uncorrected with aids), hearing 150
9
9
impairment (deaf/hearing uncorrected with aids) or gross motor impairment (non-151
ambulant/requires assistance to walk) were classified with neurosensory impairment (NSI). 152
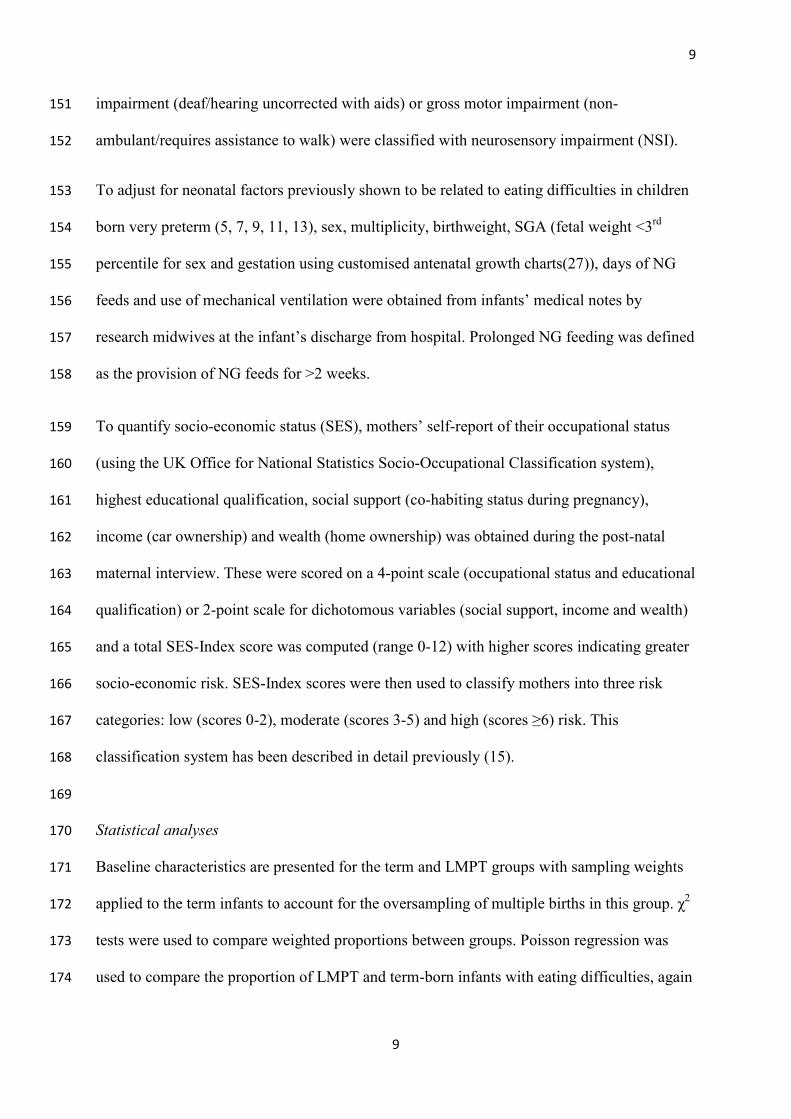
To adjust for neonatal factors previously shown to be related to eating difficulties in children 153
born very preterm (5, 7, 9, 11, 13), sex, multiplicity, birthweight, SGA (fetal weight <3rd 154
percentile for sex and gestation using customised antenatal growth charts(27)), days of NG 155
feeds and use of mechanical ventilation were obtained from infants’ medical notes by 156
research midwives at the infant’s discharge from hospital. Prolonged NG feeding was defined 157
as the provision of NG feeds for >2 weeks. 158
To quantify socio-economic status (SES), mothers’ self-report of their occupational status 159
(using the UK Office for National Statistics Socio-Occupational Classification system), 160
highest educational qualification, social support (co-habiting status during pregnancy), 161
income (car ownership) and wealth (home ownership) was obtained during the post-natal 162
maternal interview. These were scored on a 4-point scale (occupational status and educational 163
qualification) or 2-point scale for dichotomous variables (social support, income and wealth) 164
and a total SES-Index score was computed (range 0-12) with higher scores indicating greater 165
socio-economic risk. SES-Index scores were then used to classify mothers into three risk 166
categories: low (scores 0-2), moderate (scores 3-5) and high (scores ≥6) risk. This 167
classification system has been described in detail previously (15). 168
169
Statistical analyses 170
Baseline characteristics are presented for the term and LMPT groups with sampling weights 171
applied to the term infants to account for the oversampling of multiple births in this group. χ2 172
tests were used to compare weighted proportions between groups. Poisson regression was 173
used to compare the proportion of LMPT and term-born infants with eating difficulties, again 174
10
10
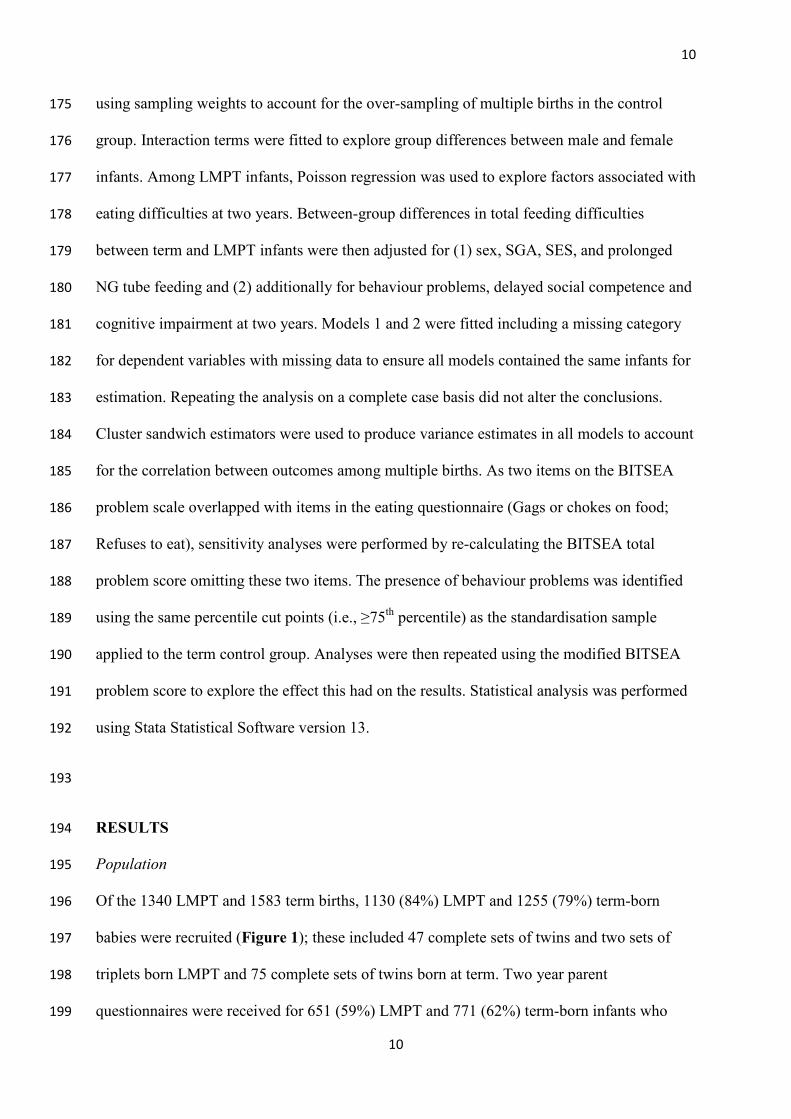
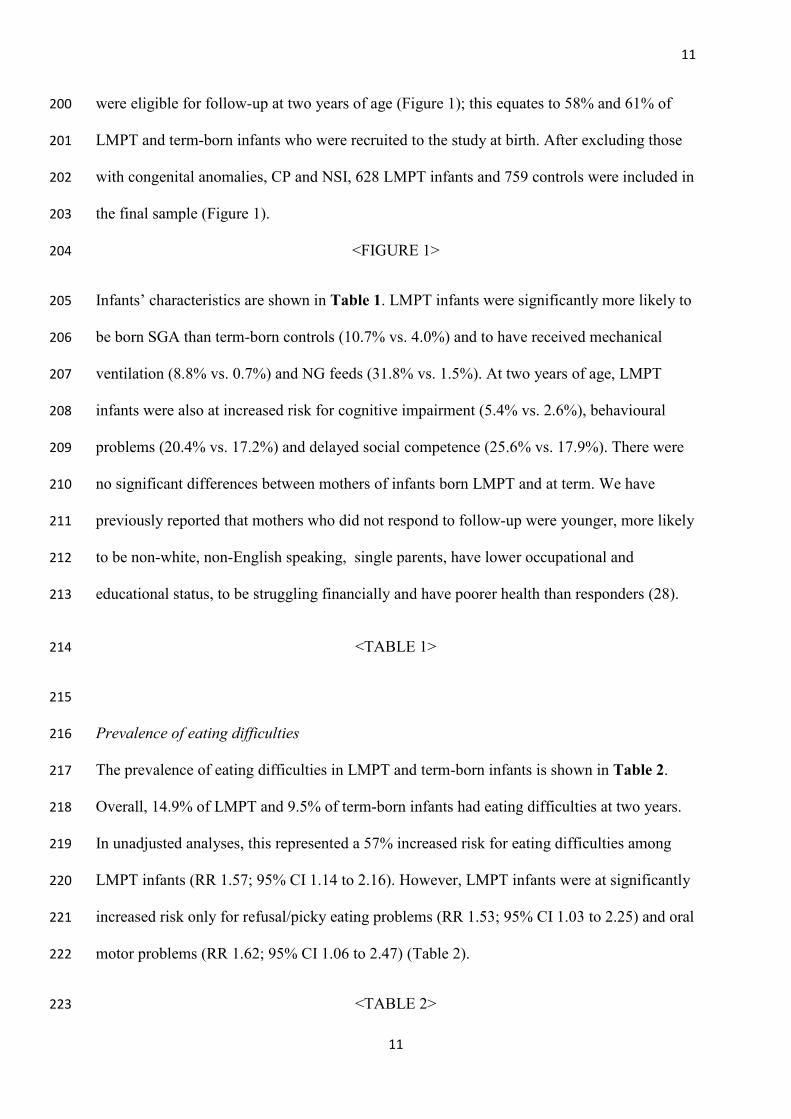
using sampling weights to account for the over-sampling of multiple births in the control 175
group. Interaction terms were fitted to explore group differences between male and female 176
infants. Among LMPT infants, Poisson regression was used to explore factors associated with 177
eating difficulties at two years. Between-group differences in total feeding difficulties 178
between term and LMPT infants were then adjusted for (1) sex, SGA, SES, and prolonged 179
NG tube feeding and (2) additionally for behaviour problems, delayed social competence and 180
cognitive impairment at two years. Models 1 and 2 were fitted including a missing category 181
for dependent variables with missing data to ensure all models contained the same infants for 182
estimation. Repeating the analysis on a complete case basis did not alter the conclusions. 183
Cluster sandwich estimators were used to produce variance estimates in all models to account 184
for the correlation between outcomes among multiple births. As two items on the BITSEA 185
problem scale overlapped with items in the eating questionnaire (Gags or chokes on food; 186
Refuses to eat), sensitivity analyses were performed by re-calculating the BITSEA total 187
problem score omitting these two items. The presence of behaviour problems was identified 188
using the same percentile cut points (i.e., ≥75th percentile) as the standardisation sample 189
applied to the term control group. Analyses were then repeated using the modified BITSEA 190
problem score to explore the effect this had on the results. Statistical analysis was performed 191
using Stata Statistical Software version 13. 192
193
RESULTS 194
Population 195
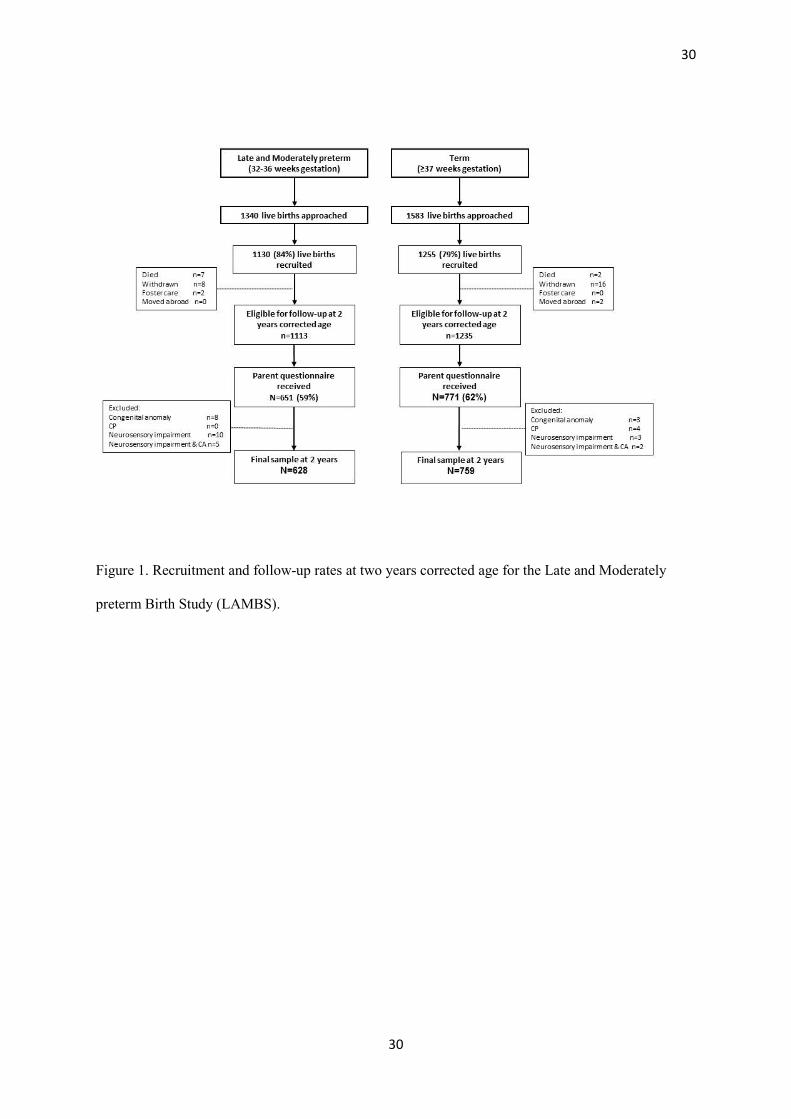
Of the 1340 LMPT and 1583 term births, 1130 (84%) LMPT and 1255 (79%) term-born 196
babies were recruited (Figure 1); these included 47 complete sets of twins and two sets of 197
triplets born LMPT and 75 complete sets of twins born at term. Two year parent 198
questionnaires were received for 651 (59%) LMPT and 771 (62%) term-born infants who 199
11
11
were eligible for follow-up at two years of age (Figure 1); this equates to 58% and 61% of 200
LMPT and term-born infants who were recruited to the study at birth. After excluding those 201
with congenital anomalies, CP and NSI, 628 LMPT infants and 759 controls were included in 202
the final sample (Figure 1). 203
<FIGURE 1> 204
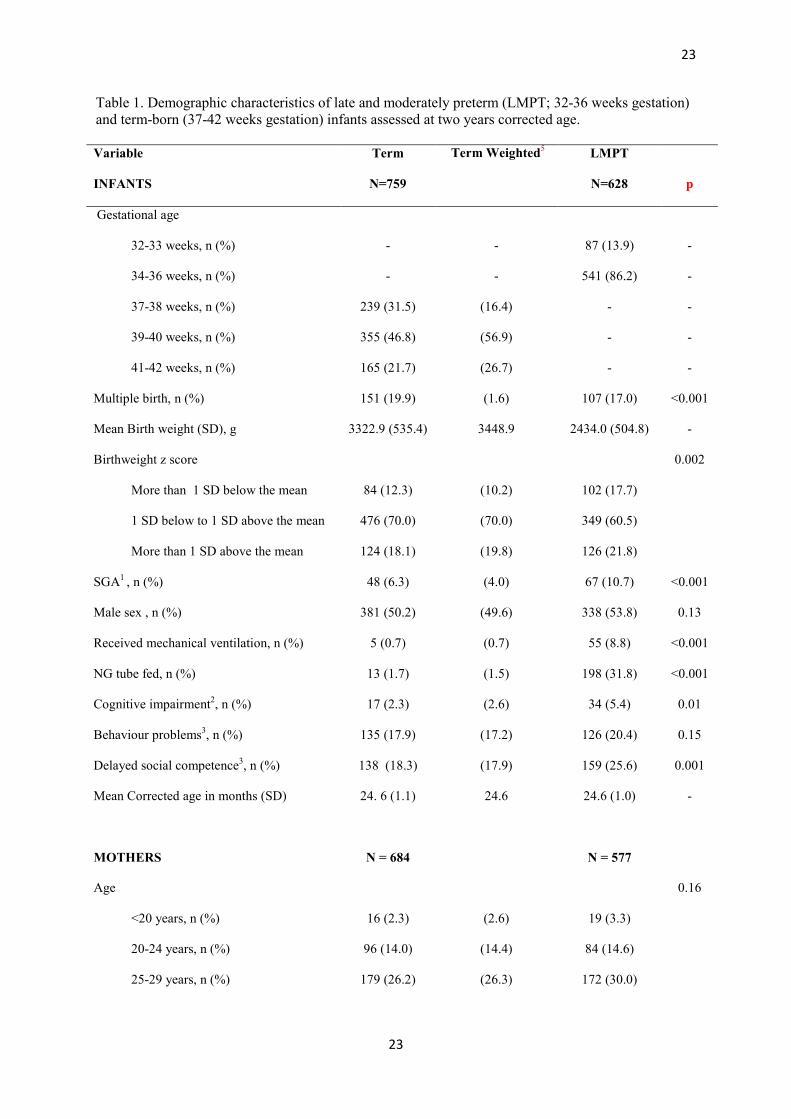
Infants’ characteristics are shown in Table 1. LMPT infants were significantly more likely to 205
be born SGA than term-born controls (10.7% vs. 4.0%) and to have received mechanical 206
ventilation (8.8% vs. 0.7%) and NG feeds (31.8% vs. 1.5%). At two years of age, LMPT 207
infants were also at increased risk for cognitive impairment (5.4% vs. 2.6%), behavioural 208
problems (20.4% vs. 17.2%) and delayed social competence (25.6% vs. 17.9%). There were 209
no significant differences between mothers of infants born LMPT and at term. We have 210
previously reported that mothers who did not respond to follow-up were younger, more likely 211
to be non-white, non-English speaking, single parents, have lower occupational and 212
educational status, to be struggling financially and have poorer health than responders (28). 213
<TABLE 1> 214
215
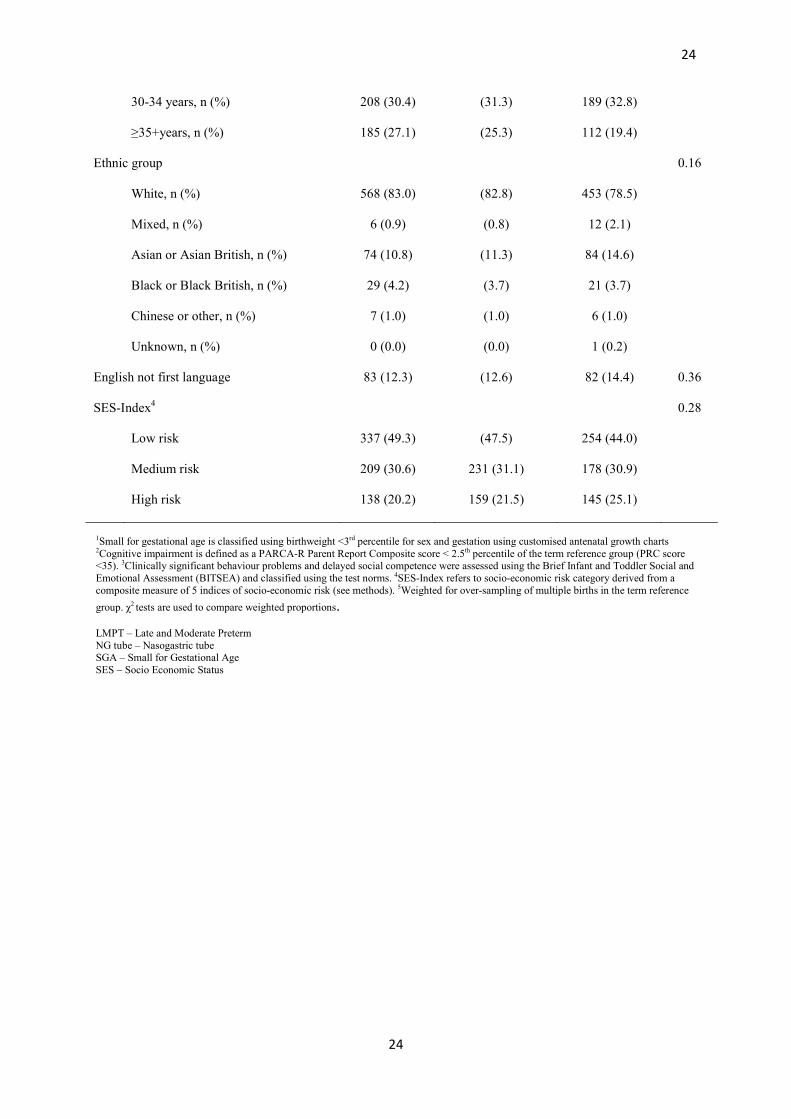
Prevalence of eating difficulties 216
The prevalence of eating difficulties in LMPT and term-born infants is shown in Table 2. 217
Overall, 14.9% of LMPT and 9.5% of term-born infants had eating difficulties at two years. 218
In unadjusted analyses, this represented a 57% increased risk for eating difficulties among 219
LMPT infants (RR 1.57; 95% CI 1.14 to 2.16). However, LMPT infants were at significantly 220
increased risk only for refusal/picky eating problems (RR 1.53; 95% CI 1.03 to 2.25) and oral 221
motor problems (RR 1.62; 95% CI 1.06 to 2.47) (Table 2). 222
<TABLE 2> 223

12
12
There were no significant differences between males and females for total feeding problems 224
(p=0.19), refusal/picky eating (p=0.12), oral motor problems (p=0.25), oral hypersensitivity 225
(0.26) and eating behaviour problems (p=0.41). Males born LMPT were at increased risk for 226
total eating difficulties (RR 1.87, 95% CI 1.22 to 2.87) and refusal/picky eating (RR 2.11, 227
95% CI: 1.18 to 3.77) compared with term-born males, (Table 2). These differences were not 228
observed in females. Conversely; females born LMPT were more likely to have oral motor 229
problems than term-born females (RR 2.35, 95% CI: 1.10 to 5.02). 230
There were no significant between-group differences in the proportion of parents who felt 231
that their child had an eating problem (Term 9.0% vs. LMPT 11.9%; RR 1.33; 95% CI 0.95 232
to 1.85) or who had sought advice about eating problems (Term 6.5% vs. LMPT 9.0%; RR 233
1.39; 95% CI 0.94 to 2.05). However, significantly more LMPT than term-born infants had 234
been prescribed medicine for reflux by two years of age (Term 8.7% vs. LMPT 16.8%; RR 235
1.94; 95% CI 1.40 to 2.67). 236
237
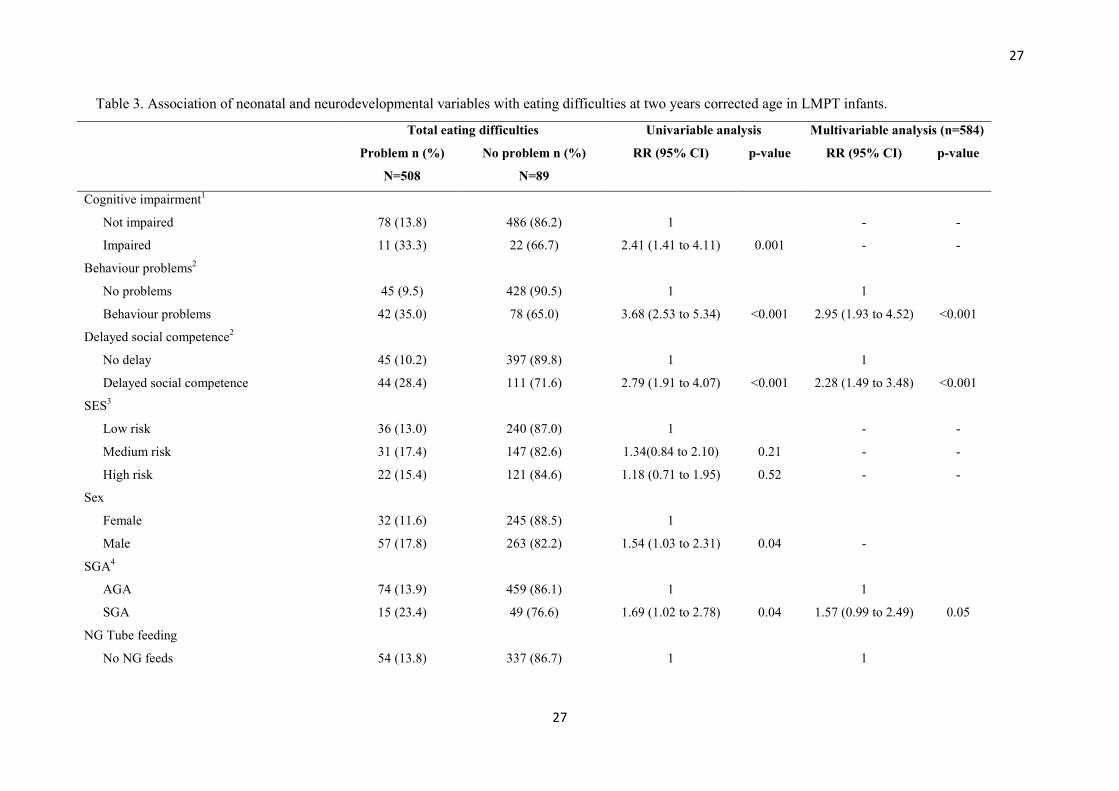
Association of neonatal and neurodevelopmental factors with eating difficulties in LMPT 238
infants 239
Results from regression analyses of factors identified a priori as potential associates of eating 240
difficulties in LMPT infants are shown in Table 3. On univariable analyses, cognitive 241
impairment, delayed social competence, male sex, SGA, and prolonged NG feeding 242
competence were all significantly associated with eating difficulties at two years (Table 3). In 243
contrast, mechanical ventilation and socio-economic risk factors were not significantly 244
associated with eating difficulties. On multivariable analyses including all these factors, >2 245
weeks NG feeds (RR 1.87; 95% CI 1.07 to 3.25), behaviour problems (RR 2.95; 95% CI 1.93 246
to 4.52) and delayed social competence (RR 2.28; 95% CI 1.49 to 3.48) were significant 247
independent risk factors for eating difficulties at two years corrected age. 248

13
13
<TABLE 3> 249
250
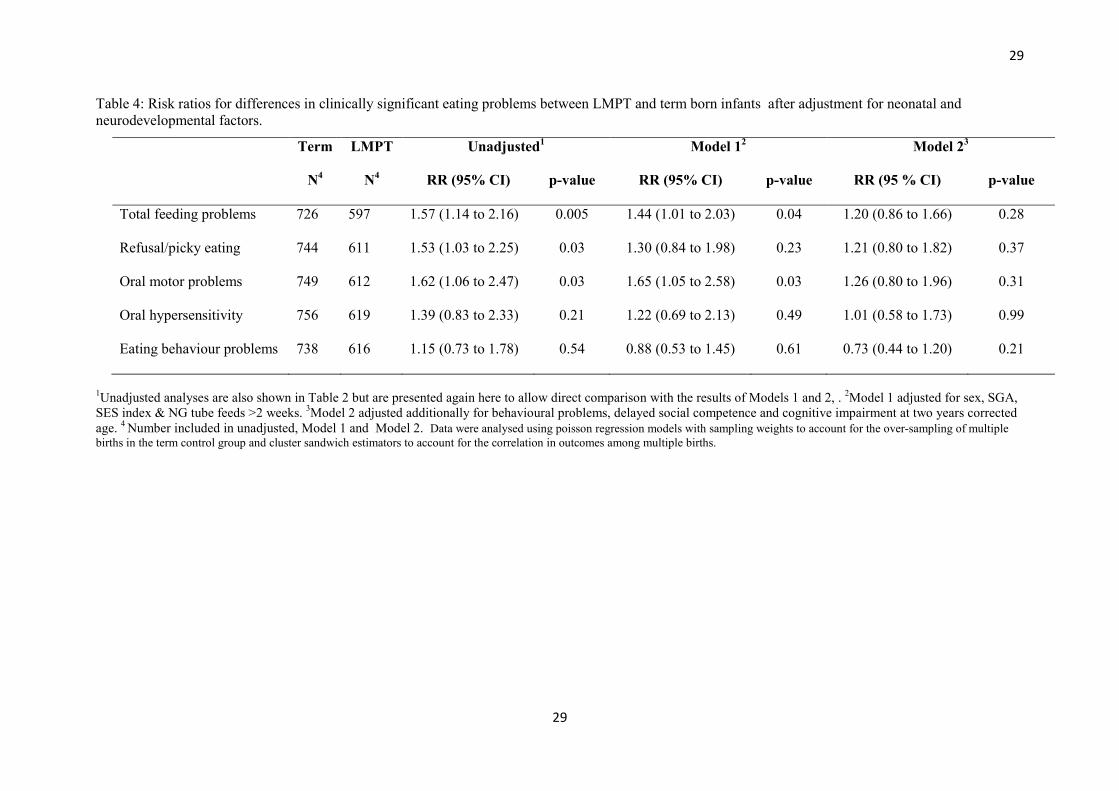
Are eating difficulties in LMPT infants mediated by neurodevelopmental sequelae? 251
To determine whether the increased risk for eating difficulties in LMPT infants could be 252
accounted for by neurodevelopmental sequelae, multivariable models were used to explore 253
between-group differences after adjustment for important neonatal or neurodevelopmental 254
factors (Table 4). After adjusting for sex, SES and >2 weeks NG feeding, the risk for 255
refusal/picky eating problems was no longer significant (Model 1). However, there was still a 256
increased risk for oral motor problems (RR 1.65; 95% CI 1.05 to 2.58) and total eating 257
difficulties (RR 1.44; 1.01 to 2.03) among LMPT infants. After further adjustment for 258
behaviour problems, delayed social competence and cognitive impairment at two years 259
(Model 2) the risk for both total eating difficulties and oral motor problems in LMPT infants 260
was no longer significant (Table 4). Repeating the analyses using the modified BITSEA 261
problem score excluding the two overlapping items did not change the results appreciably 262
and did not alter the conclusions. 263
<TABLE 4> 264
265
DISCUSSION 266
To our knowledge, this is the first study to explore the prevalence and associates of eating 267
difficulties in LMPT infants. Compared with their term-born peers, we observed that infants 268
born LMPT were at increased risk for oral motor problems, such as chewing, biting and 269
swallowing, and refusal/picky eating, such as selective eating, eating too little or too slowly 270
or having a poor appetite at two years corrected age. However, these difficulties were 271
14
14
mediated by neurodevelopmental sequelae and are thus unlikely to represent a specific 272
functional deficit following LMPT birth. 273
To date, there are few studies of eating behaviours in LMPT infants and none that have 274
explored the impact of birth at 32-36 weeks of gestation compared with birth at term. An 275
exploration of eating difficulties in early childhood is important for providing appropriate 276
parental counselling and anticipatory guidance about post-discharge care as feeding 277
difficulties in infancy show continuity to later life and may affect a child’s health, 278
development and growth (8, 18, 29). Here we observed that LMPT infants were at 1.6 times 279
increased risk for eating difficulties, particularly oral motor problems. However, these were 280
explained by the excess of neurodevelopmental and behavioural sequelae in this population. 281
In a previous study of six year old children born extremely preterm (< 26 weeks gestation) 282
using the same eating behaviour questionnaire, the greatest effect size was also observed for 283
oral motor problems compared with eating difficulties in other domains. However, in contrast 284
with the present study, neurodevelopmental factors only partly explained the relationship 285
between eating difficulties and extremely preterm birth (4). 286
In the LMPT population, the impact of eating difficulties should not be overlooked but it is 287
likely that these co-occur with other neurodevelopmental and behavioural morbidities. 288
Screening for eating difficulties during early childhood may therefore be useful in identifying 289
not just those in whom intervention to support feeding practices might be beneficial, but 290
those who may have other behavioural issues or developmental morbidity. These results also 291
point to a common underlying mechanism for oral motor problems and poor developmental 292
outcomes that may be associated with neurological immaturity. Indeed, studies have shown 293
that substantial brain maturation occurs during the third trimester of pregnancy. As such, 294
normal neurodevelopmental processes may be interrupted by LMPT preterm birth leaving 295
infants at risk for impairments in multiple developmental domains (30, 31). 296
15
15
NG feeding during the neonatal period was more common among LMPT (32%) than term-297
born infants (2%), as was mechanical ventilation (9% vs. 1%). In contrast with studies of 298
very preterm infants (<32 weeks gestation)(4, 8), mechanical ventilation was not associated 299
with the development of eating difficulties at two years of age, nor was exposure to NG feeds 300
per se. However, prolonged NG feeding (>2 weeks) was independently associated with later 301
eating difficulties and may partly explain the association between LMPT birth and oral motor 302
problems. The association of eating difficulties with prolonged NG feeding has previously 303
been noted in a small study of LMPT infants and supports the present findings (16). We also 304
found that LMPT infants were almost twice as likely as term-born infants to have been 305
prescribed medicine for reflux by two years corrected age, and this may contribute to the 306
excess of oral motor problems observed in the LMPT population. However, it not possible to 307
ascertain from our data whether this represents ongoing problems or prescription of anti-308
reflux medication during the neonatal period. 309
The strengths of this study lie in the collection of prospective geographical population-based 310
data on early childhood outcomes. This is also the first study to assess eating difficulties in 311
LMPT infants compared with term-born controls. However, we acknowledge that a response 312
rate of ~60% may have impacted on our findings. In particular, infants whose parents did not 313
respond to follow-up were at greater socio-economic risk and of poorer health. As these 314
factors are associated with adverse neurodevelopmental outcomes, we may have 315
underestimated the true prevalence of eating difficulties in the LMPT population. In addition, 316
we excluded children with CP and NSI to explore the effect of preterm birth per se, which 317
may underestimate the absolute prevalence of eating difficulties in this population. Outcome 318
data at two years were collected by parent report which was necessary given the size and 319
geographical dispersion of the cohort to be followed up. Although well validated parent 320
report measures were used to assess outcomes in all domains, we were unable to carry out 321

16
16
formal observations of eating behaviours or oral motor skills or to administer formal 322
assessments of infants’ cognitive and motor development. These data therefore represent 323
parents’ perceptions of their child’s language, cognitive development and eating behaviour at 324
two years of age rather than diagnoses obtained from clinical consultation or diagnostic tests. 325
Although the measures used in the present study have been shown to have good validity and 326
diagnostic accuracy, parent report questionnaires may result in over-referrals due to relatively 327
low positive predictive values. As such, future studies should seek to replicate these findings 328
using formal examiner administered developmental tests and observations by speech and 329
language therapists. In addition, it would be beneficial to explore early childhood eating 330
behaviours following LMPT birth in association with measures of growth which were not 331
available in this cohort. Longer term follow-up of this cohort will enable us to assess the 332
predictive validity of parent reported eating difficulties at two years for eating behaviours and 333
growth in middle childhood. 334
In summary, infants born LMPT were at increased risk for oral motor problems and picky 335
eating behaviours at two years of age compared with infants born at term. These were 336
explained by the excess of neurodevelopmental sequelae and behavioural sequelae in this 337
population. LMPT children who are exposed to prolonged NG feeding and those with poor 338
neurodevelopmental outcomes are at greatest risk of eating difficulties. Multi-domain 339
developmental screening may be beneficial in this population. 340
341

17
17
Acknowledgements
We thank the children and families who took part in the LAMBS Study. The authors have no
conflicts of interest to disclose. Authors’ contributions are as follows: SJ, ESD, DJF, BNM,
NM, LKS & EMB designed research; SJ & EM conducted research; RM, BNM & LKS
analysed data; SJ & RM wrote paper; SJ had primary responsibility for final content. All
authors read and approved the final manuscript.
18
18
References 1. Lau C, Smith EO, Schanler RJ. Coordination of suck-swallow and swallow
respiration in preterm infants. Acta Paediatr 2003;92(6):721-7.
2. Bertoncelli N, Cuomo G, Cattani S, Mazzi C, Pugliese M, Coccolini E, Zagni P,
Mordini B, Ferrari F. Oral feeding competences of healthy preterm infants: a review.
International journal of pediatrics 2012;2012:896257. doi: 10.1155/2012/896257.
3. Fucile S, McFarland DH, Gisel EG, Lau C. Oral and nonoral sensorimotor
interventions facilitate suck-swallow-respiration functions and their coordination in
preterm infants. Early Hum Dev 2012;88(6):345-50. doi:
10.1016/j.earlhumdev.2011.09.007.
4. Samara M, Johnson S, Lamberts K, Marlow N, Wolke D. Eating problems at age 6
years in a whole population sample of extremely preterm children. Dev Med Child
Neurol 2010;52(2):e16-22. doi: 10.1111/j.1469-8749.2009.03512.x.
5. Cerro N, Zeunert S, Simmer K, Daniels D. Eating behaviour of children 1.5-3.5 years
born preterm: Parent's perceptions. Journal of Paediatrics & Child Health 2002;38:72-
8.
6. den Boer SL, Schipper JA. Feeding and drinking skills in preterm and low birth
weight infants compared to full term infants at a corrected age of nine months. Early
Hum Dev 2013;89(6):445-7. doi: 10.1016/j.earlhumdev.2012.12.004.
7. Migraine A, Nicklaus S, Parnet P, Lange C, Monnery-Patris S, Des Robert C,
Darmaun D, Flamant C, Amarger V, Roze JC. Effect of preterm birth and birth weight
on eating behavior at 2 y of age. Am J Clin Nutr 2013;97(6):1270-7. doi:
10.3945/ajcn.112.051151.
8. Adams-Chapman I, Bann CM, Vaucher YE, Stoll BJ, Eunice Kennedy Shriver
National Institute of Child H, Human Development Neonatal Research N. Association

19
19
between feeding difficulties and language delay in preterm infants using Bayley
Scales of Infant Development-Third Edition. The Journal of pediatrics
2013;163(3):680-5 e1-3. doi: 10.1016/j.jpeds.2013.03.006.
9. Hawdon JM, Beauregard N, Slattery J, Kennedy G. Identification of neonates at risk
of developing feeding problems in infancy. Dev Med Child Neurol 2000;42(4):235-9.
10. Johnson S. Cognitive and behavioural outcomes following very preterm birth.
Seminars in fetal & neonatal medicine 2007;12(5):363-73.
11. Schmid G, Schreier A, Meyer R, Wolke D. Predictors of crying, feeding and sleeping
problems: a prospective study. Child Care Health Dev 2011;37(4):493-502. doi:
10.1111/j.1365-2214.2010.01201.x.
12. Pierrehumbert B, Nicole A, Muller-Nix C, Forcada-Guex M, Ansermet F. Parental
post-traumatic reactions after premature birth: implications for sleeping and eating
problems in the infant. Archives Of Disease In Childhood 2003;88(5):F400-F4.
13. Crapnell TL, Rogers CE, Neil JJ, Inder TE, Woodward LJ, Pineda RG. Factors
associated with feeding difficulties in the very preterm infant. Acta Paediatr
2013;102(12):e539-45. doi: 10.1111/apa.12393.
14. Kerstjens JM, Bocca-Tjeertes IF, de Winter AF, Reijneveld SA, Bos AF. Neonatal
morbidities and developmental delay in moderately preterm-born children. Pediatrics
2012;130(2):e265-72. doi: 10.1542/peds.2012-0079.
15. Johnson S, Evans TA, Draper ES, Field DJ, Manktelow BN, Marlow N, Matthews R,
Petrou S, Seaton SE, Smith LK, Boyle EM. Neurodevelopmental outcomes following
late and moderate prematurity: a population-based cohort study. Archives of disease
in childhood Fetal and neonatal edition 2015;100(4):F301-F8. doi:
10.1136/archdischild-2014-307684.
20
20
16. Dodrill P, McMahon S, Ward E, Weir K, Donovan T, Riddle B. Long-term oral
sensitivity and feeding skills of low-risk pre-term infants. Early Hum Dev
2004;76(1):23-37.
17. Kmita G, Urmanska W, Kiepura E, Polak K. Feeding behaivour problems in infants
born preterm: a psychological perspective. Preliminary report. Medycyna wieku
rozwojowego 2011;15(3):216-23.
18. DeMauro SB, Patel PR, Medoff-Cooper B, Posencheg M, Abbasi S. Postdischarge
feeding patterns in early- and late-preterm infants. Clinical pediatrics
2011;50(10):957-62. doi: 10.1177/0009922811409028.
19. Johnson S, Marlow N, Wolke D, Davidson L, Marston L, O’Hare A, Peacock J,
Schulte J. Validation of a parent report measure of cognitive development in very
preterm infants. Developmental Medicine and Child Neurology 2004;46:389-97.
20. Johnson S, Wolke D, Marlow N, Preterm Infant Parenting Study G. Developmental
assessment of preterm infants at 2 years: validity of parent reports. Dev Med Child
Neurol 2008;50(1):58-62. doi: 10.1111/j.1469-8749.2007.02010.x.
21. Martin AJ, Darlow BA, Salt A, Hague W, Sebastian L, McNeill N, Tarnow-Mordi W.
Performance of the Parent Report of Children's Abilities-Revised (PARCA-R) versus
the Bayley Scales of Infant Development III. Arch Dis Child 2013;98(12):955-8. doi:
10.1136/archdischild-2012-303288.
22. Group IC, Brocklehurst P, Farrell B, King A, Juszczak E, Darlow B, Haque K, Salt A,
Stenson B, Tarnow-Mordi W. . Treatment of neonatal sepsis with intravenous
immune globulin. N Engl J Med 2011;365(13):1201-11. doi:
10.1056/NEJMoa1100441.
23. Marlow N, Greenough A, Peacock JL, Marston L, Limb ES, Johnson AH, Calvert SA.
Randomised trial of high frequency oscillatory ventilation or conventional ventilation

21
21
in babies of gestational age 28 weeks or less: respiratory and neurological outcomes at
2 years. Archives of disease in childhood Fetal and neonatal edition 2006;91(5):F320-
6. doi: 10.1136/adc.2005.079632.
24. Briggs-Gowan MJ, Carter AS. BITSEA Brief Infant-Toddler Social and Emotional
Assessment. San Antonio, TX: Harcourt Assessment Inc, 2006.
25. Briggs-Gowan MJ, Carter AS, Irwin JR, Wachtel K, Cicchetti DV. The Brief Infant-
Toddler Social and Emotional Assessment: screening for social-emotional problems
and delays in competence. Journal of pediatric psychology 2004;29(2):143-55.
26. British Association of Perinatal Medicine. Report of a BAPM/RCPCH Working
Group: Classification of health status at 2 years as a perinatal outcome. London:
BAPM, 2008.
27. Gardosi J, Francis A. Internet: www.gestation.net (accessed 15/07/2013 2013).
28. Johnson S, Seaton SE, Manktelow BN, Smith LK, Field DF, Draper ES, Marlow N,
Boyle EM. Telephone interviews and online questionnaires can be used to improve
neurodevelopmental follow-up rates. BMC research notes 2014;7(1):219. doi:
10.1186/1756-0500-7-219.
29. Ashcroft J, Semmler C, Carnell S, van Jaarsveld CH, Wardle J. Continuity and
stability of eating behaviour traits in children. European journal of clinical nutrition
2008;62(8):985-90. doi: 10.1038/sj.ejcn.1602855.
30. Limperopoulos C, Soul JS, Gauvreau K, Huppi PS, Warfield SK, Bassan H,
Robertson RL, Volpe J, du Plessis AJ. Late gestation gerebellar growth is rapid and
impeded by premature birth. Pediatrics 2005;115:688-95.
31. Huppi PS, Warfield S, Kikinis R, Barnes PD, Zientara GP, Jolesz FA, Tsuji MK,
Volpe JJ. Quantitative magnetic resonance imaging of brain development in

22
22
premature and mature newborns. Annals of Neurology 1998;43(2):224-35. doi:
10.1002/ana.410430213.
23
23
Table 1. Demographic characteristics of late and moderately preterm (LMPT; 32-36 weeks gestation) and term-born (37-42 weeks gestation) infants assessed at two years corrected age. Variable Term Term Weighted5 LMPT
INFANTS N=759 N=628 p
Gestational age
32-33 weeks, n (%) - - 87 (13.9) -
34-36 weeks, n (%) - - 541 (86.2) -
37-38 weeks, n (%) 239 (31.5) (16.4) - -
39-40 weeks, n (%) 355 (46.8) (56.9) - -
41-42 weeks, n (%) 165 (21.7) (26.7) - -
Multiple birth, n (%) 151 (19.9) (1.6) 107 (17.0) <0.001
Mean Birth weight (SD), g 3322.9 (535.4) 3448.9 2434.0 (504.8) -
Birthweight z score 0.002
More than 1 SD below the mean 84 (12.3) (10.2) 102 (17.7)
1 SD below to 1 SD above the mean 476 (70.0) (70.0) 349 (60.5)
More than 1 SD above the mean 124 (18.1) (19.8) 126 (21.8)
SGA1 , n (%) 48 (6.3) (4.0) 67 (10.7) <0.001
Male sex , n (%) 381 (50.2) (49.6) 338 (53.8) 0.13
Received mechanical ventilation, n (%) 5 (0.7) (0.7) 55 (8.8) <0.001
NG tube fed, n (%) 13 (1.7) (1.5) 198 (31.8) <0.001
Cognitive impairment2, n (%) 17 (2.3) (2.6) 34 (5.4) 0.01
Behaviour problems3, n (%) 135 (17.9) (17.2) 126 (20.4) 0.15
Delayed social competence3, n (%) 138 (18.3) (17.9) 159 (25.6) 0.001
Mean Corrected age in months (SD) 24. 6 (1.1) 24.6 24.6 (1.0) -
MOTHERS N = 684 N = 577
Age 0.16
<20 years, n (%) 16 (2.3) (2.6) 19 (3.3)
20-24 years, n (%) 96 (14.0) (14.4) 84 (14.6)
25-29 years, n (%) 179 (26.2) (26.3) 172 (30.0)
24
24
30-34 years, n (%) 208 (30.4) (31.3) 189 (32.8)
≥35+years, n (%) 185 (27.1) (25.3) 112 (19.4)
Ethnic group 0.16
White, n (%) 568 (83.0) (82.8) 453 (78.5)
Mixed, n (%) 6 (0.9) (0.8) 12 (2.1)
Asian or Asian British, n (%) 74 (10.8) (11.3) 84 (14.6)
Black or Black British, n (%) 29 (4.2) (3.7) 21 (3.7)
Chinese or other, n (%) 7 (1.0) (1.0) 6 (1.0)
Unknown, n (%) 0 (0.0) (0.0) 1 (0.2)
English not first language 83 (12.3) (12.6) 82 (14.4) 0.36
SES-Index4 0.28
Low risk 337 (49.3) (47.5) 254 (44.0)
Medium risk 209 (30.6) 231 (31.1) 178 (30.9)
High risk 138 (20.2) 159 (21.5) 145 (25.1)
1Small for gestational age is classified using birthweight <3rd percentile for sex and gestation using customised antenatal growth charts 2Cognitive impairment is defined as a PARCA-R Parent Report Composite score < 2.5th percentile of the term reference group (PRC score <35). 3Clinically significant behaviour problems and delayed social competence were assessed using the Brief Infant and Toddler Social and Emotional Assessment (BITSEA) and classified using the test norms. 4SES-Index refers to socio-economic risk category derived from a composite measure of 5 indices of socio-economic risk (see methods). 5Weighted for over-sampling of multiple births in the term reference group. χ2 tests are used to compare weighted proportions. LMPT – Late and Moderate Preterm NG tube – Nasogastric tube SGA – Small for Gestational Age SES – Socio Economic Status

25
25
Table 2. Descriptive statistics for parent reported eating difficulties in late and moderately preterm (LMPT) and term-born infants and between-group differences in the prevalence of clinically significant problem in univariable (unadjusted) analyses. Eating difficulties Term
LMPT Proportion in the clinical range
(LMPT vs. Term)1
N Median
(IQR)
n (%)2 clinical
range
N Median
(IQR)
n (%)2 clinical
range
RR (95% CI)
p-value
Total eating difficulties 726 6 (3,9) 69 (9.5) 597 7 (4,10) 89 (14.9) 1.57 (1.14 to 2.16) 0.005
Males 362 6 (4,9) 36 (9.9) 320 7 (4,11) 57 (17.8) 1.87 (1.22 to 2.87) 0.004
Females 364 6 (3,9) 33 (9.5) 277 6 (4,10) 32 (11.6) 1.22 (0.75 to 1.97) 0.41
Refusal/picky eating 744 3 (1,6) 48 (6.5) 611 4 (2,6) 61 (10.0) 1.53 (1.03 to 2.25) 0.03
Males 370 3 (2,6) 20 (5.2) 330 4 (2,7) 36 (10.9) 2.11 (1.18 to 3.77) 0.01
Females 374 3 (1,6) 28 (7.9) 281 4 (1,6) 25 (9.0) 1.12 (0.65 to 1.91) 0.65
Oral motor problems 749 0 (0,1) 41 (5.4) 612 0 (0,1) 53 (8.7) 1.62 (1.06 to 2.47) 0.03
Males 374 0 (0,1) 28 (7.8) 328 0 (0,1) 33 (10.0) 1.29 (0.77 to 2.14) 0.32
Females 375 0 (0,1) 13 (3.0) 284 0 (0,1) 20 (6.9) 2.35 (1.10 to 5.02) 0.03
Oral hypersensitivity 756 0 (0,1) 32 (3.8) 619 0 (0,1) 33 (5.3) 1.39 (0.83 to 2.33) 0.21
Males 378 0 (0,1) 16 (4.0) 333 0 (0,1) 24 (7.2) 1.78 (0.91 to 3.48) 0.09
Females 378 0 (0,1) 16 (3.6) 286 0 (0,1) 9 (3.2) 0.87 (0.36 to 2.05) 0.74
Eating behaviour problems 738 2 (1,2) 45 (6.0) 616 2 (1,2) 42 (6.8) 1.15 (0.73 to 1.78) 0.54
Males 370 2 (1,2) 22 (5.8) 331 2 (1,3) 26 (7.9) 1.35 (0.74 to 2.44) 0.32
Females 368 2 (1,2) 23 (6.1) 285 2 (1,2) 16 (5.6) 0.93 (0.48 to 1.78) 0.82
26
26
1Unadjusted models, 2 Weighted for oversampling of multiple births in the term group, Data were analysed using poisson regression models with sampling weights to account for the over-sampling of multiple births in the term control group and cluster sandwich estimators to account for the correlation in outcomes among multiple births. There was no statistically significant difference in eating difficulty scores between males and females.
27
27
Table 3. Association of neonatal and neurodevelopmental variables with eating difficulties at two years corrected age in LMPT infants.
Total eating difficulties Univariable analysis Multivariable analysis (n=584)
Problem n (%)
N=508
No problem n (%)
N=89
RR (95% CI) p-value RR (95% CI) p-value
Cognitive impairment1
Not impaired 78 (13.8) 486 (86.2) 1 - -
Impaired 11 (33.3) 22 (66.7) 2.41 (1.41 to 4.11) 0.001 - -
Behaviour problems2
No problems 45 (9.5) 428 (90.5) 1 1
Behaviour problems 42 (35.0) 78 (65.0) 3.68 (2.53 to 5.34) <0.001 2.95 (1.93 to 4.52) <0.001
Delayed social competence2
No delay 45 (10.2) 397 (89.8) 1 1
Delayed social competence 44 (28.4) 111 (71.6) 2.79 (1.91 to 4.07) <0.001 2.28 (1.49 to 3.48) <0.001
SES3
Low risk 36 (13.0) 240 (87.0) 1 - -
Medium risk 31 (17.4) 147 (82.6) 1.34(0.84 to 2.10) 0.21 - -
High risk 22 (15.4) 121 (84.6) 1.18 (0.71 to 1.95) 0.52 - -
Sex
Female 32 (11.6) 245 (88.5) 1
Male 57 (17.8) 263 (82.2) 1.54 (1.03 to 2.31) 0.04 -
SGA4
AGA 74 (13.9) 459 (86.1) 1 1
SGA 15 (23.4) 49 (76.6) 1.69 (1.02 to 2.78) 0.04 1.57 (0.99 to 2.49) 0.05
NG Tube feeding
No NG feeds 54 (13.8) 337 (86.7) 1 1

28
28
<1 week NG feeds 8 (11.1) 64 (88.9) 0.80 (0.39 to 1.63) 0.54 0.75 (0.35 to 1.58) 0.45
1-2 weeks NG feeds 13 (16.7) 65 (83.3) 1.21 (0.68 to 2.13) 0.51 1.22 (0.70 to 2.11) 0.49
>2 weeks NG feeds 12 (26.1) 34 (73.9) 1.89 (1.08 to 3.30) 0.03 1.87 (1.07 to 3.25) 0.03
Ventilation
None/non-invasive respiratory support 79 (14.5) 466 (85.5) 1 - -
Mechanical ventilation 10 (19.2) 42 (80.8) 1.33 (0.73 to 2.41) 0.35 - - 1Cognitive impairment is defined as a PARCA-R Parent Report Composite score < 2.5th percentile of the term reference group (PRC score <35). 2Clinically significant behaviour problems and delayed social competence were assessed using the Brief Infant and Toddler Social and Emotional Assessment (BITSEA) and classified using the test norms. 3SES-Index refers to socio-economic risk category derived from a composite measure of 5 indices of socio-economic risk (see methods).4Small for gestational age is classified using birthweight <3rd percentile for sex and gestation using customised antenatal growth charts. Data were analysed using poisson regression models with cluster sandwich estimators to account for the correlation in outcomes among multiple births. Multivariable analysis includes behaviour problems, delayed social competence, SGA and NG tube feeding. N=584 in multivariable model AGA – Appropriate for Gestational Age NG Tube – Nasogastric tube SGA – Small for Gestational Age
29
29
Table 4: Risk ratios for differences in clinically significant eating problems between LMPT and term born infants after adjustment for neonatal and neurodevelopmental factors.
1Unadjusted analyses are also shown in Table 2 but are presented again here to allow direct comparison with the results of Models 1 and 2, . 2Model 1 adjusted for sex, SGA, SES index & NG tube feeds >2 weeks. 3Model 2 adjusted additionally for behavioural problems, delayed social competence and cognitive impairment at two years corrected age. 4 Number included in unadjusted, Model 1 and Model 2. Data were analysed using poisson regression models with sampling weights to account for the over-sampling of multiple births in the term control group and cluster sandwich estimators to account for the correlation in outcomes among multiple births.
Term LMPT Unadjusted1 Model 12 Model 23
N4 N4 RR (95% CI) p-value RR (95% CI) p-value RR (95 % CI) p-value
Total feeding problems 726 597 1.57 (1.14 to 2.16) 0.005 1.44 (1.01 to 2.03) 0.04 1.20 (0.86 to 1.66) 0.28
Refusal/picky eating 744 611 1.53 (1.03 to 2.25) 0.03 1.30 (0.84 to 1.98) 0.23 1.21 (0.80 to 1.82) 0.37
Oral motor problems 749 612 1.62 (1.06 to 2.47) 0.03 1.65 (1.05 to 2.58) 0.03 1.26 (0.80 to 1.96) 0.31
Oral hypersensitivity 756 619 1.39 (0.83 to 2.33) 0.21 1.22 (0.69 to 2.13) 0.49 1.01 (0.58 to 1.73) 0.99
Eating behaviour problems 738 616 1.15 (0.73 to 1.78) 0.54 0.88 (0.53 to 1.45) 0.61 0.73 (0.44 to 1.20) 0.21
30
30
Figure 1. Recruitment and follow-up rates at two years corrected age for the Late and Moderately
preterm Birth Study (LAMBS).

31
31
Appendix
Table. Parent completed eating behaviour questionnaire items for use at two years of age. All
items are forced choice responses (never=0, occasionally=1, often=2).
Sub-scale Item
Refusal/picky eating Spits out food
Has a poor appetite
Leaves most of the food offered
Is a slow eater
Eats too little
Is a picky eater
Refuses to eat
Oral motor problems Drools when drinking
Has problems biting biscuits
Has problems chewing meat/dried fruit
Has problems with swallowing
Gags or chokes on food
Oral hypersensitivity Does not like to have things put in his/her mouth
Does not like to be touched around the mouth
Eating behaviour problems Makes a mess
Has tantrums during meals
Eats too much