ecats advanced reporting (ar) module end user manual...sap business objects. this tool can pull both...
TRANSCRIPT

ECATS Advanced Reporting (AR) Module
End User Manual
Advanced Reporting Basics (AR 101)

1 Last Updated February 7, 2020
Table of Contents Overview: Advanced Reporting (AR) Module ................................................................................................. 2
Data Types ....................................................................................................................................................... 3
Navigating the Advanced Reporting System................................................................................................... 5
Building a Report ............................................................................................................................................. 6
Basic AR mechanics ..................................................................................................................................... 6
Create a query ............................................................................................................................................. 8
Results Objects ........................................................................................................................................ 8
Query Filters ............................................................................................................................................ 9
Sorting and grouping data in reports ........................................................................................................ 10
To sort data within a report: ................................................................................................................. 10
To group data within a report: .............................................................................................................. 10
Searching for Data Fields in the Query Panel ........................................................................................... 12
Helpful Tips ........................................................................................................................................... 12
Additional Report Functionality ................................................................................................................ 13
Including fields in the Displayed Data ................................................................................................... 13
Filtering Data ......................................................................................................................................... 13
Breaking the Data.................................................................................................................................. 14
Change Column Header Names ............................................................................................................ 15
Count Contents of a Column ................................................................................................................. 15
Formatting a Report .............................................................................................................................. 16
Saving Reports ........................................................................................................................................... 17
Scheduling Reports ................................................................................................................................... 18
(DPI Staff Only) Advanced Reporting at the Aggregate Level ....................................................................... 20

2 Last Updated February 7, 2020
Overview: Advanced Reporting (AR) Module
PCG complements ECATS with the ad-hoc reporting tool known as Advanced Reporting (AR), powered by SAP Business Objects. This tool can pull both Historical and current data, and contains fields from data tables within ECATS. Users are able to perform data analysis with AR by creating reports based on data they want to analyze, or by opening and running pre-existing documents/reports. The AR system allows users with appropriate access to run existing reports and to create and modify their own reports in order to address their specific needs. Depending on Usertype access, users with permission can analyze the data in reports by filtering, drilling down to reveal more details, displaying data in charts, or adding formulas. Users with permission can access the Advanced Reporting system to run reports that may be sorted and filtered based on any data that is tracked in the system, including student demographic information (school, grade, disability, etc.), user information, school system information and Historical IEP information such as IEP/Eligibility data, assessment information, accommodations information and Medicaid services data. Querying of the database and report generation allows for simultaneous multi-user access and processing. All available fields from the system are organized in folders and can be dragged into the output and filter sections of the window. The Advanced Reporting tool utilizes an easy-to-use graphical display, and reports are print-friendly, exportable and support drill-down capabilities. The AR solution is integrated into ECATS and allows users to create custom dashboards, reports, as well as produce customized queries and analyses.

3 Last Updated February 7, 2020
Data Types Current Workspace Data
• Current Workspace Data is the information currently displayed for a student.
• For example, if you were to visit the Special Education Services page for a student, the services listed there, as well as their duration and frequency, would be all considered ‘Current Workspace’ data.
• Current Workspace Data is subject to change each time a user updates information for a student in the system, whether or not that information has been included in a finalized document or event.
Historical Data
• Historical Data is the student’s information from current or previous Events. Historical Data may be different from what is currently displayed in a student’s record in the workspace, especially if a user has made changes to student information since a Document/Event was finalized. When an Event is generated (ie, when Eligibility is determined and finalized, when an IEP is finalized), the system essentially takes a snapshot of the current workspace data and stores that information in the Details page of the Event.
• A list of Events can be found on the Student History page. The Student History page dropdown is located under Student Info in the Student menu.
• If you click on the ‘Details’ button for an Event, you will be able to see the specific data points captured when that Event was created.
Comparing Current Workspace data to Historical Data
• Current Workspace will pull information that is currently displayed in a student’s record.

4 Last Updated February 7, 2020
o Best for: demographic data - School, Grade, Case Manager o Example: Pulling the School from Current Workspace will result in the school currently listed
on student’s Personal page, instead of the school listed at the time the specified Event (i.e., the IEP) was finalized.
• Historical Data will pull information from an Event, which captures a snapshot of data from the workspace at the time the specified Event was finalized. o Best for: pulling information from a finalized Event such as an IEP - Test and Class
Accommodations, Services o Example: Pulling the Participating Tests from Historical Data will result in the tests listed on the
student’s Currently Valid IEP (if that is the Event specified in the query), instead of the information currently in the workspace for a student.
• Important Notes: o If you use Historical Data in the Results Objects, you *must* have an Event in the query (i.e.,
Eligibility Determination, IEP, etc.) to determine which historical data point to return to the report.
o The Advanced Reporting database is refreshed on a nightly basis. New data entered in ECATS will not be available for reporting until the next day. As a result, any changes made to a student’s record will not be reflected in “Current Workspace” AR data until the following day.

5 Last Updated February 7, 2020
Navigating the Advanced Reporting System If you have the appropriate usertype with access to AR, you can access Advanced Reporting as a dropdown option under the ‘Reporting’ tab in the main menu of ECATS.
You can also access it from the Standard Reports section by clicking on the green ‘Start Advanced Reporting System’ button.
This should open a new tab in your browser. (Note: You will need to have Java installed on the computer you are using)
• The main screen is the Home tab. The Home tab includes widgets to display your Recently Viewed Documents, Recently Run Documents and any messages or alerts.
• The Documents tab contains any previously saved reports. o My Documents acts as your own personal reports drive. You can save reports here, but please
note that *only you* can access and view these reports. If you want to share the report with others in your LEA, you will need to save the report to the Public Folders (under Folders>Public Folders>ECATS Reports)

6 Last Updated February 7, 2020
o Folders is where you can find previously created reports under Public Folders>_ECATS Reports. Any reports created for your LEA will be saved here.
Building a Report
Basic AR mechanics Updating and editing an existing report: There are TWO possible ways to open an existing report to make changes. First, open the folder containing the report you wish to modify and identify the report. Then your options are:
Option 1: Right-click the report name and select “Modify”.
Option 2: Double click on the report name to open the report. Then, click “Design”.

7 Last Updated February 7, 2020
Creating a new report:
• Select the drop down menu from the “Applications” tab in the toolbar near the top right of the screen.
• Select “Web Intelligence”.
• Select the blank page symbol .
• Double-click “Universe” in order to select the data source.
• Select the available “Universe” and click ‘OK’.

8 Last Updated February 7, 2020
Create a query • To create a query: Select either “Historical” or “Current Workspace” data.
• Before diving in, you will first want to determine what question(s) you want the report to answer. Before building the report in the Advanced Reporting database, you need to consider the report elements.
Report Elements consist of:
• Results Objects – Results Objects are the data fields you will use to build your report (i.e., Student ID, Student Name, Case Manager, etc.). There are three types of Results Objects:
Data Elements – Filters – Counts –
• Query Filters – Query Filters help determine which data will appear in the report (i.e., only “Eligible” students at School X).
Results Objects To add Results Objects to your report, click and drag the field name to the Results Objects window or double-click on the Object to move it to the window:

9 Last Updated February 7, 2020
• Current Workspace Data Element examples: o Student ID (note: this is a best practice as it is unique identifier in the case that there is more
than one student with the same name) – from Current Workspace o Student first name – from Current Workspace o Student middle name – from Current Workspace o Student last name – from Current Workspace o School name – from Current Workspace o Grade – from Current Workspace
Query Filters
• Click and drag the data elements you wish to filter on to the Query window.
• Examples of query filters: o Include only Active students o Include only students with Currently Valid Eligibility Determination
Eligible (Current Workspace). Select “In List”, then “Yes” (to limit query to eligible students only)
o Include only students with a primary disability of SED on their Eligibility Determination
• To run the report, click the “Run Query” button at the top of the query builder.

10 Last Updated February 7, 2020
Sorting and grouping data in reports After running your report, click on the ‘Analysis’ tab.
To sort data within a report: o Click on a cell in the column (not the column heading) o Select the ‘A-Z Sort’ button, found within the ‘Display’ tab under the ‘Analysis’ tab.
o To add more sorts: Click in another column and select the ‘A-Z Sort’ button o To remove a sort: Select a column and click the highlighted ‘A-Z Sort’ button
To group data within a report: o Click on a cell in the column (but not the column heading) and then select the ‘Break’ button
(Before)

11 Last Updated February 7, 2020
(After)
o To remove a group, select a data element and unselect the Break button.
Note: this report
is now displaying
the list of
students by case
manager

12 Last Updated February 7, 2020
Searching for Data Fields in the Query Panel To quickly find specific data fields, search for them in the search box. See example of a “school code” search below. This field exists in both Historical and Current Workspace Data.
Folder names are labelled as intuitively as possible. For example, ‘Student Information’ is where all demographic elements are located (i.e., Student ID, Student Name, age, date of birth, etc.) and the ‘Schools’ folder contains all fields related to schools.
Helpful Tips • Eligibility Status is an example of a field you can pull from Historical Data or Current Workspace
o Historical - Event Information>Event Selector >Currently Value: Eligibility Determination (note: you could also select previous Events here too)
o Current Workspace – Student Events>Selector 1>Currently Valid: Eligibility Determination

13 Last Updated February 7, 2020
Additional Report Functionality Once you’ve created a report, there are ways that you can continue to modify it to meet your specific needs (i.e., filter, graph, etc.).
Including fields in the Displayed Data Each time a you add new Objects to an existing report and then hit “Run Query,” you will need to drag those new Results Objects from the “Available Objects” menu bar (on the left hand side of the AR window) into the table in the main AR window. New objects do not automatically populate in the report table, even when they are included in a report.
Filtering Data • This feature functions much like it does in Microsoft Excel.
• Simply right-click on the column you’d like to filter. This will open a menu to the right of the column where you will select the ‘Filter’ option.
• Select ‘Add Filter’.
• Note: You will use this same right-click action to remove any filters

14 Last Updated February 7, 2020
Breaking the Data
• ‘Breaking the Data’ means you can change the order of the columns. This can be applicable, for example, when you are filtering data.
• Drag over the desired column into the report where you’d like that column to be (i.e., moving the Primary Disability Abbreviation to the right of Grade Abbreviation)
• Highlight where the column previously was and right-click and delete it.

15 Last Updated February 7, 2020
Change Column Header Names
• If you click into the header box for a column, you might notice these are formulas. (ie, =NameOf([Grade Abbrev]))
• This formula can be removed, and the column re-named (ie, Gr). Note: Renaming a column will not affect the data listed in the column.
• The same can be accomplished by double-clicking on the column header itself.
Count Contents of a Column
• To count the number of students (or any data field) returned in your report, select the column. Go to the Analysis tab > Functions tab > Count

16 Last Updated February 7, 2020
• The ‘Count’ function will sum the identified field at the bottom of the table.
Formatting a Report
o Remove the report title by right clicking and selecting “Delete” o If desired, remove the header by right clicking and selecting “Hide” o Align report with the upper left corner. *Note: this will prevent extra columns from appearing
if you export this to Excel. To make this update Right click on the upper left hand corner of the table results Arrow over “align” Click “Relative Position”. For both the vertical and horizontal relative positions, set the value to: 0.0” Click “Ok”

17 Last Updated February 7, 2020
Saving Reports In order to maintain HIPAA compliance, Advanced Reporting logs users out after 20 minutes of inactivity. In order to preserve report work, it is important to save at a minimum of every 20 minutes.
• To save a report, select the floppy disk icon in the top left corner of the report window.
o In the dropdown menu, choose “Save as…” to save a new report in Advanced Reporting
Selecting “My Favorites” saves the report in a private folder. Other users cannot view, run, or modify this report.
Selecting “Public Folders” saves the report in folder that other LEA users can access. All users can view, run, or modify this report.
• In order to export the report as a PDF, Excel file, or text file, click the ‘Export’ dropdown. o This allows you to save reports to a local device. This is generally advised for reports that are
for upload or with more than 60,000 records as Excel 2003 has file limit of 60,000 rows.
o Export Document As – Select file type (PDF, Excel, CSV, Text)
o Report can be saved to your local computer, or opened straight from the application.

18 Last Updated February 7, 2020
o Open or Save the report. Please note that this step may look different depending on what
browser is used.
Scheduling Reports
• Select the report you wish to schedule from the Documents tab. o Right-click and select ‘Schedule’ on the drop-down menu.
o Select ‘Recurrence’ and identify the schedule. Options appear in the drop-down box and once selected, provide a brief description as well as any necessary prompt fields where users can enter dates and times to run the desired report.

19 Last Updated February 7, 2020
• Click ‘Schedule’ in the lower right hand corner.
• Once the report has been created and scheduled, the screen will display the following:
o The arrows point to the title of the report run and by whom.

20 Last Updated February 7, 2020
(DPI Staff Only) Advanced Reporting at the Aggregate Level Advanced Reporting at the Aggregate Level allows DPI staff to run customized reports and pull data from multiple LEAs, or even statewide. DPI staff can access AR at the Aggregate Level by selecting ‘Reports’ from the ‘Reporting’ drop-down at the Aggregate Level.
From the Reports page in the Aggregate, click on the green ‘Start Advanced Reporting System’ button to launch Advanced Reporting.
You will open and begin the creation of a new report in the same way that you would at the LEA level. You will the same familiar panels and Results Objects. Additionally, you will see a set of Results Objects specific to LEA Information.

21 Last Updated February 7, 2020
Using the Query Filter, you can add a query using LEA Information fields to select the LEA(s) you’d like to include in the report.
For example, you could run a report that limited the resulting information to students in a specific Region (ie, Region 4) by selecting only the LEAs in that Region.
22 Last Updated February 7, 2020
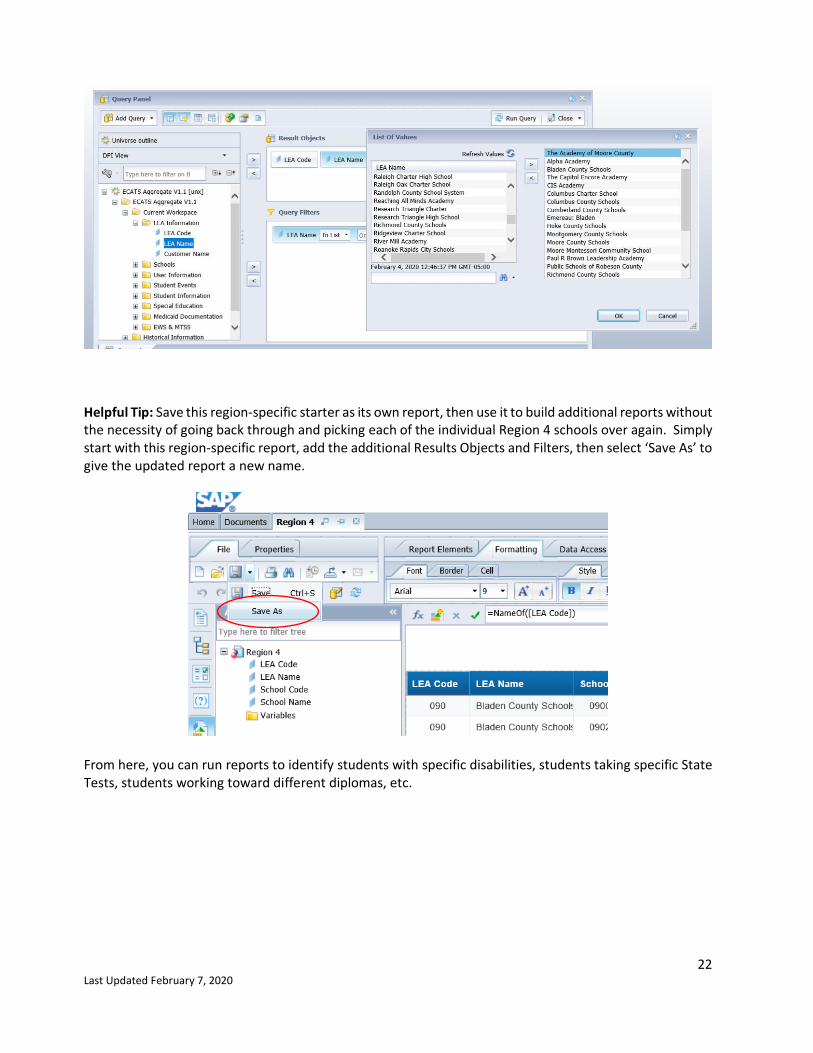
Helpful Tip: Save this region-specific starter as its own report, then use it to build additional reports without the necessity of going back through and picking each of the individual Region 4 schools over again. Simply start with this region-specific report, add the additional Results Objects and Filters, then select ‘Save As’ to give the updated report a new name.
From here, you can run reports to identify students with specific disabilities, students taking specific State Tests, students working toward different diplomas, etc.