ecb ch03 liver stiffness
DESCRIPTION
Estimation of liver stiffness using ultrasound wavesTRANSCRIPT
Estimation of liver stiffness 27.07.2010 11:47 1
EFSUMB – European Course Book Editor: Christoph F. Dietrich
Estimation of liver stiffness using ultrasound waves
Ioan Sporea (1), Mireen Friedrich-Rust (2), Odd Helge Gilja (3)
1. Department of Gastroenterology and Hepatology, University of Medicine and
Pharmacy, Timişoara, Romania 2. Department of Internal Medicine 1, J.-W.-Goethe-University Hospital, Frankfurt,
Germany 3. National Centre for Ultrasound in Gastroenterology, Department of Medicine,
Haukeland University Hospital, and Institute of Medicine, University of Bergen, Bergen, Norway

Estimation of liver stiffness 27.07.2010 11:47 2
Content
Content ....................................................................................................................................... 2 Introduction ................................................................................................................................ 2 Real-Time Elastography........................................................................................................... 11 Acoustic Radiation Force Impulse (ARFI) technology............................................................ 14 References ................................................................................................................................ 18
Introduction
In the evolution of chronic viral and non-viral hepatitis, liver fibrosis is a very important
factor associated with prognosis. Hence, a precise evaluation of the severity of fibrosis is
necessary in those patients, in order to perform a correct staging and, eventually, to take a
decision regarding the treatment.
Currently, liver biopsy seems to be the optimal method to evaluate changes in fibrosis over
time (1). Nevertheless, liver biopsy (LB) has its shortcomings: the intra- and interobserver
variability (2, 3), the sampling variability (as proven in a study by Ratziu et al) (4) and, last,
but not least, the fact that LB is an invasive method, with morbidity and mortality greater than
zero.
Considering all these facts, non invasive methods for the evaluation of liver fibrosis were
developed in the last few years, in order to reduce the number of LB. A real polemic
developed in the last years, regarding the best method to evaluate these patients, opposing the
liver biopsy (LB), still considered being the “gold standard” for hepatological evaluation (5),
to the non-invasive methods of assessment, recently developed. The difficulty in the
evaluation of non-invasive markers, is that liver biopsy is used as reference method. Taking
into account the limitations of liver biopsy, a perfect non-invasive method can not be
distinguished from an unacceptable fibrosis marker . Therefore a new reference marker is
needed. Studies using the endpoint liver related mortality are awaited to identify the best non-
invasive methods.
After 2000, the non-invasive tests predictors of fibrosis were evaluated mainly in C chronic
hepatitis, but many articles regarding the usefulness of these methods in other chronic
hepatopathies were published in the last years.
The underlying assumption using non-invasive methods is that liver disease progression is
associated with changes in tissue strain, that can be measured by elastography. In general

Estimation of liver stiffness 27.07.2010 11:47 3
terms, strain is a measure of tissue deformation due to an imposed force (stress) (7). It
represents the fractional change from the original or unstressed dimension (Lagrangian
strain), includes both lengthening, or expansion (positive strains) and shortening, or
compression (negative strains)(8).
The non-invasive methods for assessing the severity of fibrosis are: serum markers (the best
known is FibroTest-ActiTest – a biochemical test which uses 6 serum biomarkers, correlated
to the age and gender of the patient in a mathematical formula) (6, 9-11), and MRI
elastography (13, 14). Using ultrasound technology there are several methods that can be
applied to study strain and elasticity of the liver. Ophir et al developed ultrasonic methods for
quantitative imaging of strain and elastic modulus distributions in soft tissues (15, 16). This
method is based on external tissue compression with subsequent computation of the strain
profile along the transducer axis. The temporal derivative of strain, i.e., the strain rate, is a
measure of the rate of deformation. Strain Rate Imaging is a Doppler-based method that can
be used to measure strain of moving tissue (17-19), but it can also be applied for the liver by
inducing probe pressure.
Recently, in vivo quantitative mapping of liver viscoelasticity was also be performed using
the concept of supersonic shear wave imaging (20). This technique is based on the
combination of a radiation force induced in tissues by focused ultrasonic beams and a very
high frame rate (up to 5000 f/sec) ultrasound images capable of catching, in real time, the
transient propagation of resulting shear waves (21, 22). The local shear wave velocity is
recovered using a dedicated time-of-flight estimation technique and enables the 2-D
quantitative mapping of shear elasticity. This imaging modality can be performed using a
conventional ultrasound probe, during a standard intercostal ultrasonographic examination.
Three supersonic shear imaging (SSI) sequences are applied successively in the left, middle
and right parts of the 2-D ultrasonographic image. Resulting shear elasticity images in the
three regions are concatenated to provide the final image covering the entire region-of-
interest. The ability of the SSI technique to provide a quantitative and local estimation of liver
shear modulus with a millimetric resolution was proven in a pilot study in 15 healthy
volunteers (20). Liver moduli extracted from in vivo data, from healthy volunteers, were
consistent with those reported in the literature (Young's modulus ranging from 4 to 7.5 kPa).
Moreover, liver stiffness estimation using the SSI mode was fast (less than one second),
repeatable (5.7% standard deviation) and reproducible (6.7% standard deviation).
For clinical purposes, the following ultrasound methods has been most frequently applied to
estimate liver fibrosis: Transient Elastography (TE) (FibroScan) (12, 23, 24), Real-Time

Estimation of liver stiffness 27.07.2010 11:47 4
Tissue Elastography (HiRT-E, Hitachi) (25-29), Acoustic Radiation Force Impulse
(ARFI) (Siemens) (31-34)
Transient elastography (TE) is an ultrasound-based method, based on the principle of
Hooke’s law, which characterizes a material’s strain response to external stress (23). By using
an ultrasound transducer probe mounted on the axis of a vibrator, the transmission of low-
frequency vibrations from the right intercostal space creates an elastic shear wave that
propagates into the liver. A pulse-echo ultrasound acquisition is then used to detect the
velocity of wave propagation. This velocity is proportional to the tissue stiffness, with faster
wave progression occurring through stiffer material. Measurement of liver stiffness (LS) is
then performed and measured in kilopascals (kPa) (35) (values between 2.5 and 75 kPa).
Transient elastography is performed with FibroScan (Echosens, Paris, France).
Figure 1 The FibroScan device.
Estimation of liver stiffness 27.07.2010 11:47 5
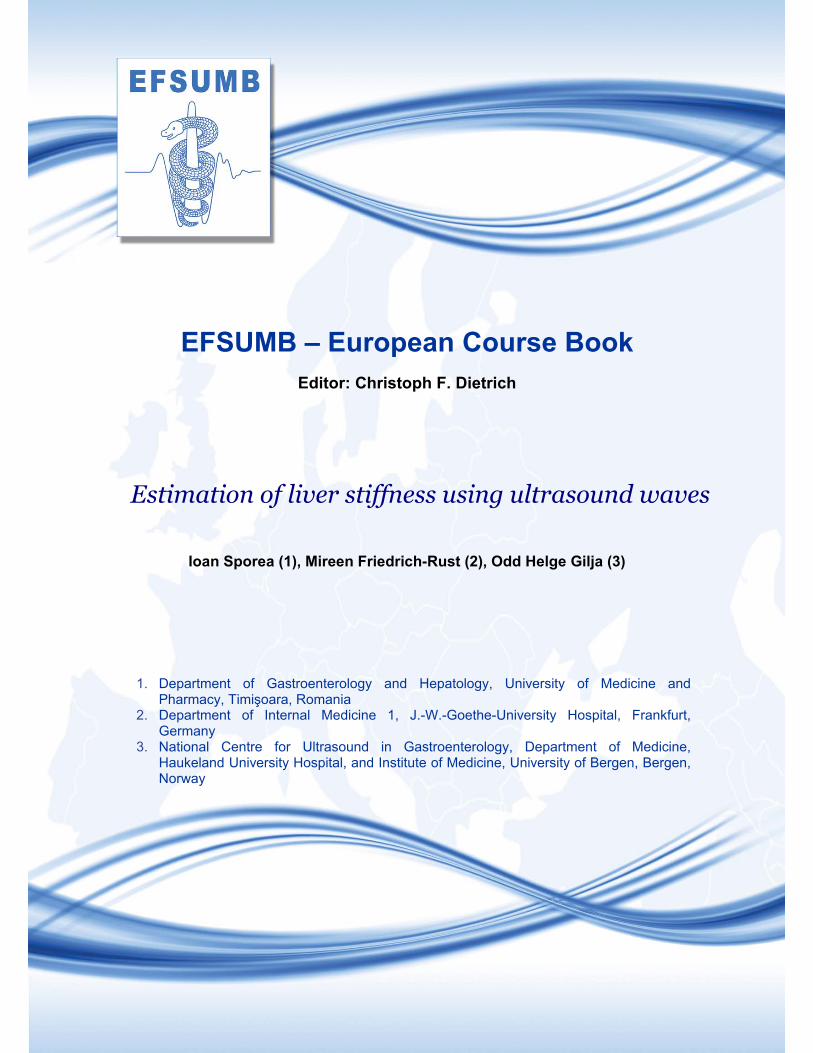
Figure 2 The FibroScan probe.
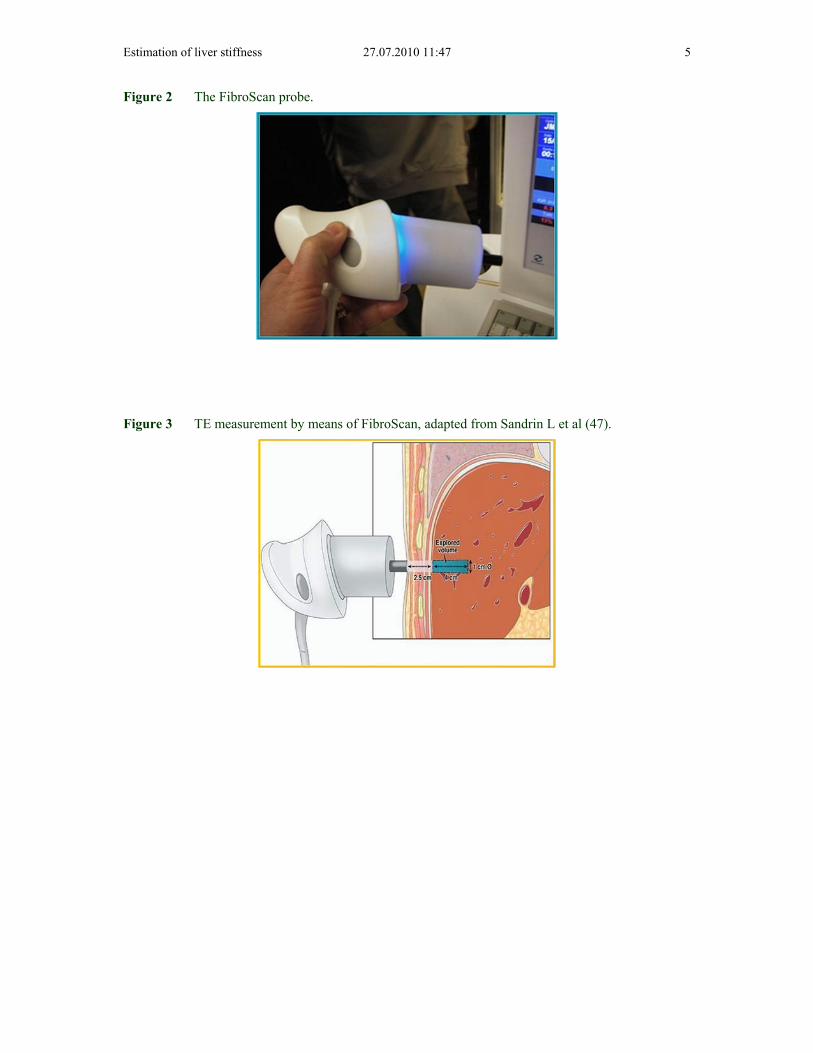
Figure 3 TE measurement by means of FibroScan, adapted from Sandrin L et al (47).
Estimation of liver stiffness 27.07.2010 11:47 6
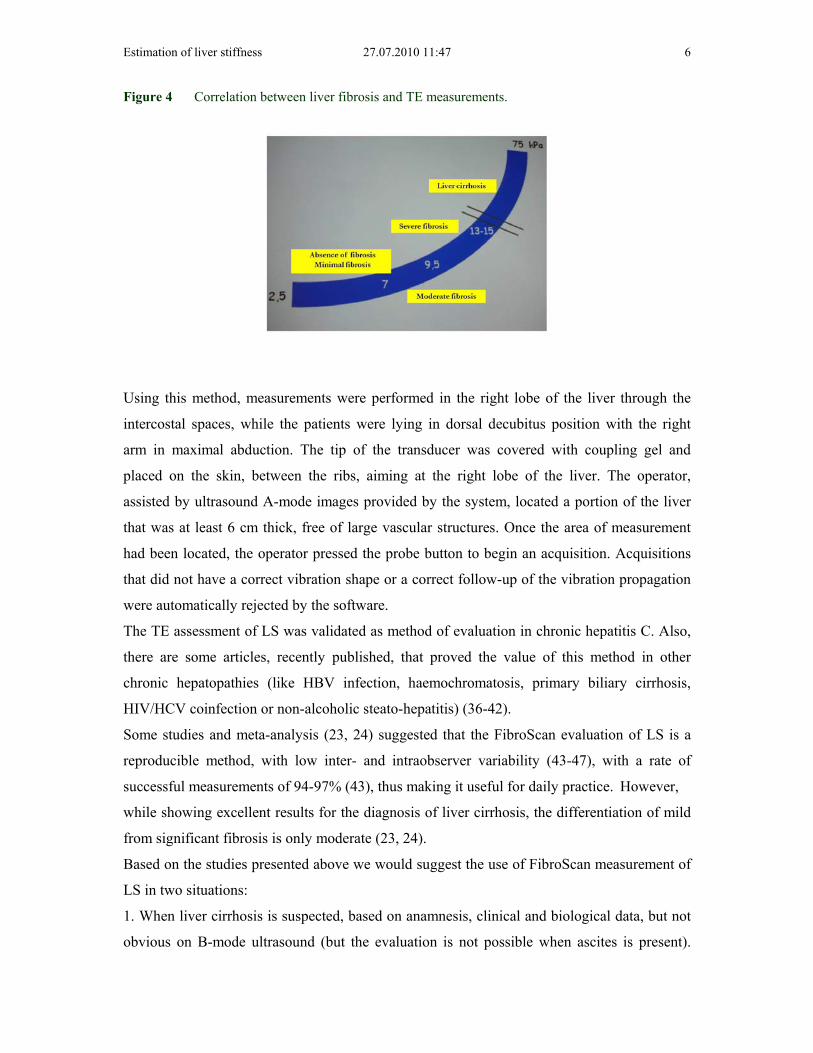
Figure 4 Correlation between liver fibrosis and TE measurements.
Using this method, measurements were performed in the right lobe of the liver through the
intercostal spaces, while the patients were lying in dorsal decubitus position with the right
arm in maximal abduction. The tip of the transducer was covered with coupling gel and
placed on the skin, between the ribs, aiming at the right lobe of the liver. The operator,
assisted by ultrasound A-mode images provided by the system, located a portion of the liver
that was at least 6 cm thick, free of large vascular structures. Once the area of measurement
had been located, the operator pressed the probe button to begin an acquisition. Acquisitions
that did not have a correct vibration shape or a correct follow-up of the vibration propagation
were automatically rejected by the software.
The TE assessment of LS was validated as method of evaluation in chronic hepatitis C. Also,
there are some articles, recently published, that proved the value of this method in other
chronic hepatopathies (like HBV infection, haemochromatosis, primary biliary cirrhosis,
HIV/HCV coinfection or non-alcoholic steato-hepatitis) (36-42).
Some studies and meta-analysis (23, 24) suggested that the FibroScan evaluation of LS is a
reproducible method, with low inter- and intraobserver variability (43-47), with a rate of
successful measurements of 94-97% (43), thus making it useful for daily practice. However,
while showing excellent results for the diagnosis of liver cirrhosis, the differentiation of mild
from significant fibrosis is only moderate (23, 24).
Based on the studies presented above we would suggest the use of FibroScan measurement of
LS in two situations:
1. When liver cirrhosis is suspected, based on anamnesis, clinical and biological data, but not
obvious on B-mode ultrasound (but the evaluation is not possible when ascites is present).

Estimation of liver stiffness 27.07.2010 11:47 7
The LS measurement by means of FibroScan is a reliable method for the diagnosis of
cirrhosis, with 87% sensitivity (95%CI: 84-90%), 91% specificity (95%CI: 89-92%), with
11.7 positive likelihood ratio (95%CI: 7.9-17.1) and 0.14 negative likelihood ratio (95%CI:
0.10-0.20), as shown in a meta-analysis performed by Talwalkar et al. (23). The advantage of
FibroScan evaluation of liver fibrosis, on other non-invasive methods, is that transient
elastography can also assess the severity of cirrhosis (values up to 75 kPa), as shown in some
studies which proposed cut-off values of LS that predict the presence of cirrhosis
complications (esophageal varices, variceal bleeding, vascular decompensation or
hepatocellular carcinoma) (48-53).
2. The second clinical application of LS measurement by means of TE is the evaluation of
patients with chronic C viral hepatitis. In viremic patients, if the LS is greater than 6.8–7.6
kPa (according to the results of several studies and meta-analysis) (23, 24, 35, 54-56), there is
a great probability of finding significant fibrosis on liver biopsy (F2-F4), thus the patient
needing antiviral therapy. Probably, in these cases, LB is not needed for treatment decision.
In a multicentre French study coordinated by Beaugrand (56), performed on 494 HCV
patients who were evaluated by means of percutaneous LB (with a significant fragment) and
valid FibroScan examination, a significant correlation was found (p<0.001) between the
severity of fibrosis and the values of LS measured by means of TE (r=0.57). This study tried
to establish cut-off values for the LS that could differentiate between various stages of
fibrosis. Thus, the cut-off value of 7.5 kPa differentiates F0-1 from F2-4 with 67% sensitivity,
87% specificity, 86% PPV and 68% NPV, with a diagnostic accuracy of 76%. Other studies
(35, 54-56) established cut-off values that differentiate F0-1 from F2-4 ranging from 6.8-7.3
kPa. As a practical approach, viremic patients with LS lower than 7 kPa should undergo LB in
order to discover the ones with significant fibrosis underestimated by FibroScan and who,
otherwise, would not receive antiviral therapy. This strategy is already used in France, a
country in which non-invasive evaluation of chronic C viral hepatitis is used more and more
frequently.
TE is not accurate enough to differentiate among contiguous stages of fibrosis (especially 0, 1
and 2), but is sensitive enough to differentiate between the absence and mild fibrosis from
significant fibrosis, essential for the decision regarding treatment. In the same time, in the
future we must find exactly if histological activity, steatosis or biological activity (ALT) have
an important role in the assessment of LS by means of FibroScan, as shown some recent
studies (57, 58).
Estimation of liver stiffness 27.07.2010 11:47 8
In a study performed in Romania (57) on 324 consecutive patients chronically infected with
hepatitis C virus, evaluated both by FibroScan and LB in the same session, the LS values
were strongly correlated with fibrosis (r=0.759, p<0.0005), but also with steatosis (r=0.255,
p<0.005), necroinflammatory activity (r=0.378, p<0.0005) and hepatic iron deposition
(r=0.143, p=0.03). The univariant regression analysis demonstrated that fibrosis (R2=0.610,
p<0.0005), activity (R2=0.145, p<0.0005) and steatosis (R2=0.037, p<0.002) were correlated
with LS. In multiple regression analysis, all three variable independently influenced LS:
fibrosis (p<0.0005), activity (p=0.039) and steatosis (p=0.025). The conclusions of this study
were that fibrosis is the main predictor of LS, but also that it is influenced by the disease
activity and steatosis.
In a study performed by Coco and co-workers (58), the value of LS was evaluated considering
the level of aminotransferases, proving that another factor than fibrosis, independently
associated with LS was ALT for patients with chronic hepatitis. The LS dynamics profiles
paralleled those of ALT, increasing 1.3 to 3 fold during ALT flares. This study showed that
the LS remained unchanged in patients with stable biochemical activity.
Considering all these data, we could use the FibroScan evaluation of LS in patients with
chronic HCV hepatitis for decisions regarding therapy. All these studies showed that, by
using cut-off values of 6.8–7.6 kPa, we could identify accurately enough the patients who
need to be treated (F≥2 METAVIR) versus those who should not be treated (F<2 METAVIR),
without performing a LB. Combining FibroScan with serum fibrosis markers can further
improve the diagnostic accuracy of non-invasive liver fibrosis measurement (35) and different
algorithms have been suggested.
3. The FibroScan can be used for individual follow-up of patients to detect a progression of
liver disease and possibly then initiate therapy.
Regarding the value of LS evaluated by means of TE in evaluating chronic hepatophaties of
other etiologies, several studies were performed in the last time, in order to identify
significant fibrosis in patients with HBV chronic hepatitis (39, 58), in HIV-HCV co-infection
(37, 40), in chronic cholestatic hepatopathies: primary biliary cirrhosis (PBC) and primary
sclerosing colangitis (PSC) (36) and in NASH (41, 42). In these studies, the area under the
ROC curve varied between 0.72 and 0.93, and the cut-off values for F≥2 ranged between 4
and 8.7 kPa (Table 1).

Estimation of liver stiffness 27.07.2010 11:47 9
Tabelle 1 Performance of LS for evaluating significant fibrosis in patients with chronic hepatopathies other than HCV (PPV = positive predictive value, NPV = negative predictive value).
Authors
Fraquelli
et al. (45)
Coco
et al.
(58)
Marcellin
et al. (39)
De
Ledinghen
et al. (37)
Vergara
et al. (40)
Corpechot
et al. (36)
Yoneda
et al. (42)
Etiology
Diverse HCV-
HBV
HBV HCV-HIV HCV-
HIV
PBC and
PSC
NAFLD
No. of
patients F≥
2
100 141 87 44 105 57 33
Proposed
cut-off (kPa)
7.9 8.3 7.2 4.5 7.2 7.3 6.6
Sensitivity
(%)
72 85.2 70 93.2 88 84 82.7
Specificity
(%)
84 90.7 83 17.9 66 87 81.3
NPV (%) 70 78.8 73 61 75 79 59.1
PPV (%) 82 93.8 80 65 88 91 93.5
AUROC 0.86 0.93 0.81 0.72 0.83 0.92 0.87
In order to asses the value of TE for predicting fibrosis, a first meta-analysis was performed
by Talwalkar and co-workers (23), based on nine in extenso published studies (7 of them
assessing the value of TE for predicting significant fibrosis). This meta-analysis confirmed the
value of LS for predicting significant fibrosis, with overall 70% sensitivity (95%CI: 67-73%),
84% specificity (95%CI: 80-88%) and AUROC=0.87.
A more recent meta-analysis performed by Friedrich-Rust (24) on 50 studies (15 extended
articles and 35 abstracts) also assessed the value of TE for the diagnosis of significant
fibrosis. Thus, the overall AUROC was 0.84 (95%CI: 0.82-0.86).
Both meta-analyses emphasized the heterogeneity of results (variations of the AUROC), if the
etiology of the liver disease (p<0.001) is taken into consideration.
In his meta-analysis, Talwalkar (23) has shown excellent performance of TE for the diagnosis
of liver cirrhosis (LC) with 87% sensitivity (95%CI: 84-90%), 91% specificity (95%CI: 89-
92%) and 0.14 negative likelihood ratio (95%CI: 0.1-0.2). Again, a certain heterogeneity due
to different etiologies has been mentioned, thus the LS cut-off values varied from 11 kPa in

Estimation of liver stiffness 27.07.2010 11:47 10
patients with chronic HBV hepatitis (27) up to 17.3 kPa in chronic cholestatic hepatophaties
(36) (Table 2).
Tabelle 2 Performance of TE for the diagnosis of LC considering the etiology (Se – sensitivity; Sp – specificity; NPV – negative predictive value; PPV – positive predictive value).
Author
Fraquelli
et al.(45)
Coco
et al.
(58)
Marcellin
et al. (39)
De
Ledinghen
et al. (37)
Vergara
et al. (40)
Corpechot
et al. [36]
Yoneda
et al. [42]
Etiology
Diverse HCV-
HBV
HBV HCV-HIV HCV-
HIV
PBC - CSP NAFLD
No of
patients
F=4
24 46 14 17 65 15 5
Cut-off
values
(kPa)
11.9 14 11.0 11.8 14.6 17.3 17.0
Se (%) 91 78 93 100 93 93 100
Sp (%) 89 98 87 92.7 88 95 98
NPV (%) 98 82 95 82 94 99 96
PPV (%) 53 98 38 100 86 78 64
AUROC 0.90 0.96 0.93 0.97 0.95 0.96 0.99
Another meta-analysis (31) included 38 studies reporting data regarding the AUROC in cases
with LC. The mean AUROC for the diagnosis of LC was 0.94 (95%CI: 0.93-0.95). It is worth
mentioning that no differences were found regarding the AUROC depending on the etiology
of cirrhosis.
So, which are the disadvantages of TE assessment of fibrosis by means of FibroScan:
impossibility to discriminate between the various contiguous degrees of fibrosis, false
overestimated results during ALT flares, high cost of the machine (approximately 80,000
Euros), and measurement failure in patients with ascites. In this moment, worldwide there are
more than 250 centers in which TE is performed.
Estimation of liver stiffness 27.07.2010 11:47 11
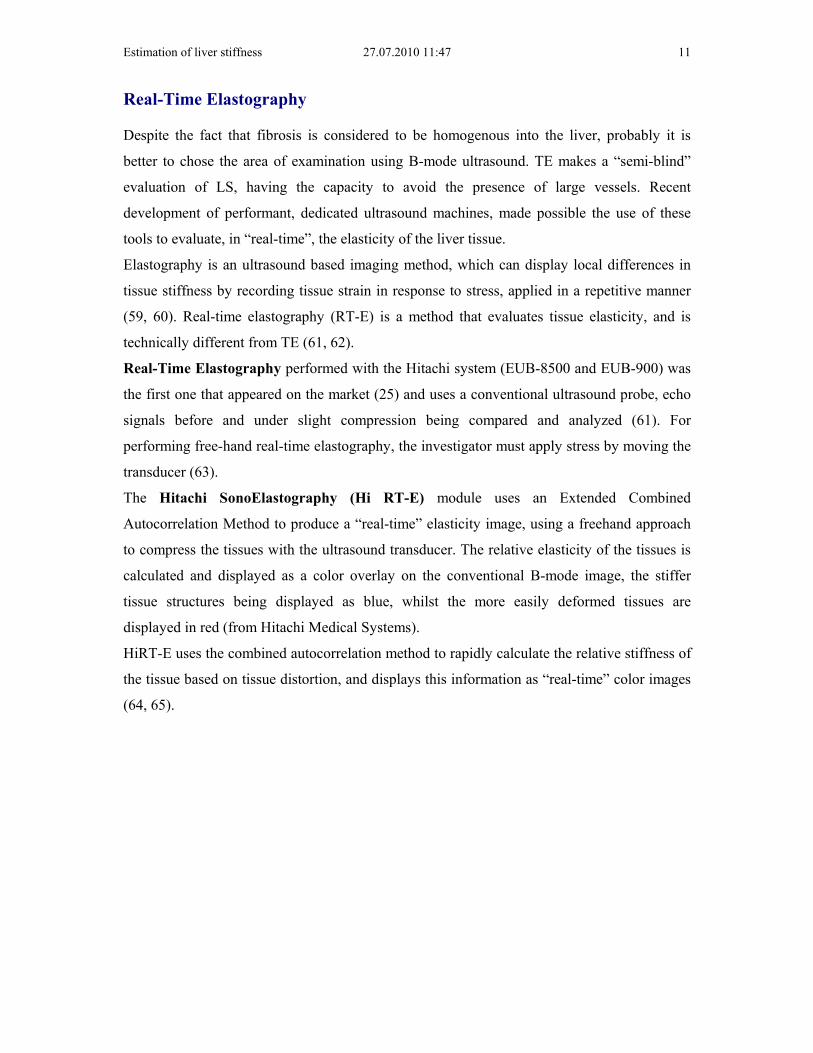
Real-Time Elastography
Despite the fact that fibrosis is considered to be homogenous into the liver, probably it is
better to chose the area of examination using B-mode ultrasound. TE makes a “semi-blind”
evaluation of LS, having the capacity to avoid the presence of large vessels. Recent
development of performant, dedicated ultrasound machines, made possible the use of these
tools to evaluate, in “real-time”, the elasticity of the liver tissue.
Elastography is an ultrasound based imaging method, which can display local differences in
tissue stiffness by recording tissue strain in response to stress, applied in a repetitive manner
(59, 60). Real-time elastography (RT-E) is a method that evaluates tissue elasticity, and is
technically different from TE (61, 62).
Real-Time Elastography performed with the Hitachi system (EUB-8500 and EUB-900) was
the first one that appeared on the market (25) and uses a conventional ultrasound probe, echo
signals before and under slight compression being compared and analyzed (61). For
performing free-hand real-time elastography, the investigator must apply stress by moving the
transducer (63).
The Hitachi SonoElastography (Hi RT-E) module uses an Extended Combined
Autocorrelation Method to produce a “real-time” elasticity image, using a freehand approach
to compress the tissues with the ultrasound transducer. The relative elasticity of the tissues is
calculated and displayed as a color overlay on the conventional B-mode image, the stiffer
tissue structures being displayed as blue, whilst the more easily deformed tissues are
displayed in red (from Hitachi Medical Systems).
HiRT-E uses the combined autocorrelation method to rapidly calculate the relative stiffness of
the tissue based on tissue distortion, and displays this information as “real-time” color images
(64, 65).
Estimation of liver stiffness 27.07.2010 11:47 12
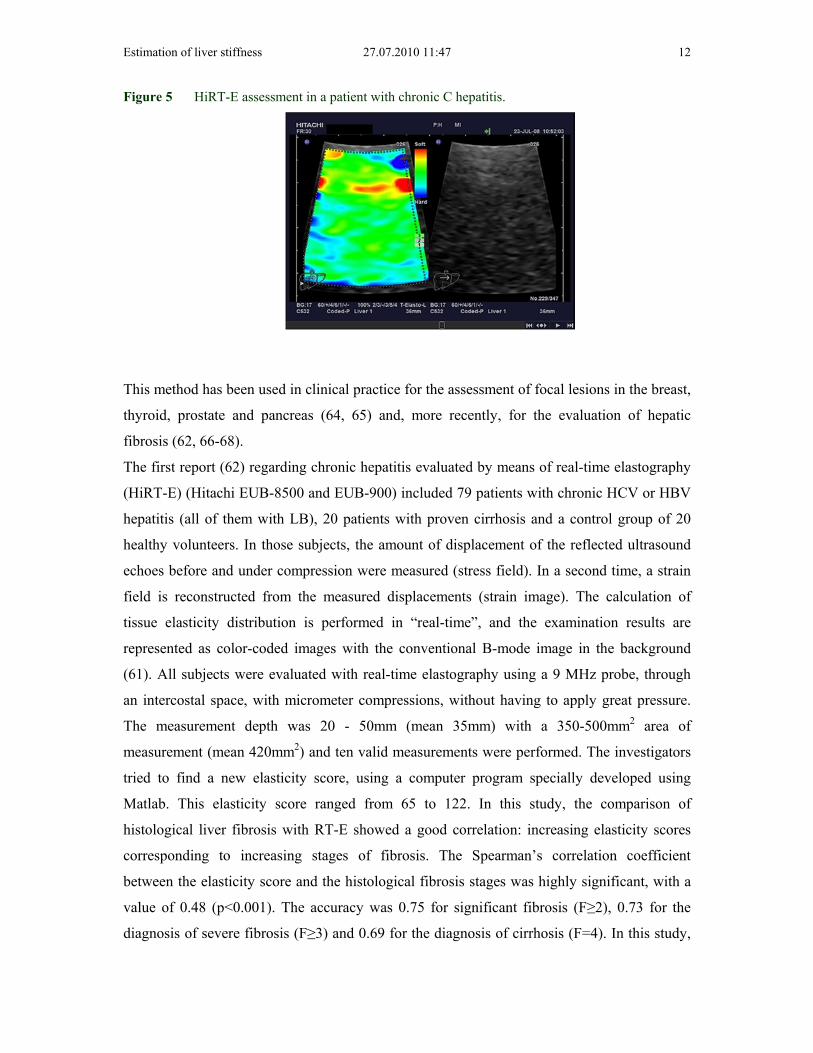
Figure 5 HiRT-E assessment in a patient with chronic C hepatitis.
This method has been used in clinical practice for the assessment of focal lesions in the breast,
thyroid, prostate and pancreas (64, 65) and, more recently, for the evaluation of hepatic
fibrosis (62, 66-68).
The first report (62) regarding chronic hepatitis evaluated by means of real-time elastography
(HiRT-E) (Hitachi EUB-8500 and EUB-900) included 79 patients with chronic HCV or HBV
hepatitis (all of them with LB), 20 patients with proven cirrhosis and a control group of 20
healthy volunteers. In those subjects, the amount of displacement of the reflected ultrasound
echoes before and under compression were measured (stress field). In a second time, a strain
field is reconstructed from the measured displacements (strain image). The calculation of
tissue elasticity distribution is performed in “real-time”, and the examination results are
represented as color-coded images with the conventional B-mode image in the background
(61). All subjects were evaluated with real-time elastography using a 9 MHz probe, through
an intercostal space, with micrometer compressions, without having to apply great pressure.
The measurement depth was 20 - 50mm (mean 35mm) with a 350-500mm2 area of
measurement (mean 420mm2) and ten valid measurements were performed. The investigators
tried to find a new elasticity score, using a computer program specially developed using
Matlab. This elasticity score ranged from 65 to 122. In this study, the comparison of
histological liver fibrosis with RT-E showed a good correlation: increasing elasticity scores
corresponding to increasing stages of fibrosis. The Spearman’s correlation coefficient
between the elasticity score and the histological fibrosis stages was highly significant, with a
value of 0.48 (p<0.001). The accuracy was 0.75 for significant fibrosis (F≥2), 0.73 for the
diagnosis of severe fibrosis (F≥3) and 0.69 for the diagnosis of cirrhosis (F=4). In this study,

Estimation of liver stiffness 27.07.2010 11:47 13
80% of patients with significant fibrosis (F≥2) could be correctly identified with RT-E and the
elasticity score was not influenced by the degree of the steatosis in the liver. The conclusion
of this study was that Hi Real-Time Elastography is a new and promising sonography-based
noninvasive method for the assessment of liver fibrosis in patients with chronic viral hepatitis.
In a study performed by Fujimoto et al (66) on 43 patients with chronic C hepatitis and
cirrhosis proven by means of LB, liver fibrosis assessment was also performed with a Hitachi
EUB-8500 ultrasound machine, using a linear probe (6-13 MHz), by applying slight manual
pressure while the subject briefly held the breath. The evaluation was blindly performed by
six reviewers, in each subject. In this study it was shown that the assessment of liver elasticity
score by RT-E may be influenced by the subjectivity of the evaluator, and that the accuracy
would improve if the evaluator becomes accustomed with the procedure. The conclusion of
this study is that RT-E satisfactorily reflects the degree of fibrosis.
In the study of Tatsumi and al (67), RT-E was performed in 119 patients with chronic liver
disease and LB (HCV in 102 patients, HBV in 3, and non-B, non-C in 20), and compared to
TE and serum fibrotic markers. A Hitachi EUB-8500 ultrasound machine with a linear probe
(6-13 MHz) was used. In this study, tissue elasticity was calculated using real-time tissue
elastography, in which numerical values from 0 to 255 (256 stepwise grading) were
determined according to color mapping, from blue (0) to red (255). In a second time, the
percentage of the blue area in a region of interest (ROI) was calculated. In this study, HiRT-E
showed a negative correlation with fibrotic stages and FibroScan findings, suggesting that
real-time tissue elastography is better than FibroScan, with fewer limitations. The authors
considered that another advantage of this method is the fact that the system is preinstalled on
ultrasound equipment and that HiRT-E is a novel and promising method to assess hepatic
fibrosis which could, maybe, replace LB in the future.
By using dynamic hue histogram analysis, other authors were able to quantify the liver
elasticity inside a defined ROI, located at the periphery of the right liver lobe (69). In this
study, the correlation between the mean elasticity values calculated by hue histogram analysis
on average images and the degree of histological fibrosis stage was statistically significant.
But, they strongly suggest that the elastography ROI should also include the tissues
surrounding the liver because this would probably increase the accuracy of the technique (70).
Another study (29) was unable to find a good correlation between HiRT-E and the liver
elasticity.
Very recently, the German group (68), which published the first study using Hi RT-E in liver
fibrosis (62), performed a validation study of their own elasticity score and of the elasticity
Estimation of liver stiffness 27.07.2010 11:47 14
score developed in Japan and compared the results of HI-RTE with TE. They evaluated a
cohort of 134 patients with chronic hepatitis histological evaluated (n=112) or proven liver
cirrhosis (n=20) and showed that HiRT-E, in its present form, cannot replace transient
elastography for noninvasive assessment of liver fibrosis.
So, considering these published studies, HiRT-E might be a promising method for the
evaluation of liver fibrosis in chronic hepatopathies, but new methods of color code
interpretation are needed in order to improve the accuracy.
Real-Time Elastography from Siemens, a very new method, uses a different technology
(30). The system enables qualitative visual and/or quantitative measurements of the
mechanical stiffness properties of the tissue. By eSie Touch™ elasticity imaging, high
resolution elastography images are obtained, applying gentle compression. A real-time
qualitative elastogram feedback assists the imagists in optimizing their acquisition technique.
On the other hand, Virtual Touch™ tissue imaging application implements Acoustic
Radiation Force Impulse (ARFI) technology for the evaluation of deep tissues, not
accessible to superficial compression elastography techniques. Using image-based
localization and a proprietary implementation of Acoustic Radiation Force Impulse (ARFI)
technology, shear wave speed may be quantified in a precise anatomical region, focused on a
region of interest, with a predefined size, provided by the system. Measurement value and
depth are also reported.
Another advantage is the fact that ARFI measurement can be performed with software
integrated into a conventional ultrasound machine, so that a screening ultrasound examination
and elastography examination, can be performed with the same machine, while with TE only
elastography can be performed.
Acoustic Radiation Force Impulse (ARFI) technology
ARFI imaging involves targeting an anatomic region, to be interrogated for elastic properties
with use of a region of-interest cursor, while performing real-time B-mode imaging. Tissue, in
the region of interest is mechanically excited, by using short-duration (262 µsec) acoustic
pulses, with a fixed transmit frequency of 2.67 MHz to generate localized tissue
displacements. The displacements result in shear-wave propagation away from the region of
excitation and are tracked by using US correlation-based methods (71). The shear-wave

Estimation of liver stiffness 27.07.2010 11:47 15
propagation velocity is proportional to the square root of tissue elasticity. Results are
expressed in meters per second (m/s).
Figure 6 ARFI measurement in a patient with liver cirrhosis.
In clinical scanning of the liver, it would be better that a scanning protocol to be followed-up
according to Siemens recommendations: if the right lobe is intercostally scanned with normal
breathing, the variance of measurement is low. It was observed that when the liver is scanned
more medially and the patient is asked to take and hold a deep breath, combined with varying
pressure applied with the probe against the liver to get a good image, there is more variability
in the result. It is not known why, but there are theories that by compressing the liver, the
stiffness may be increasing. Additionally, a breath hold will raise venous pressure, similar to
what occurs in heart failure, known to increase the liver stiffness.
Generally, the best and most consistent results will occur when the "normal" state of the liver
is measured. When scanning between the ribs (e.g. liver segment 8), no pressure is applied to
the liver and you just ask the patient to stop breathing for a moment (instead of deep
inspiration and breath hold).
In difficult patients, several measurement attempts are needed to “average” out the readings,
with different patient positions sometimes required (like putting the patient in left lateral
decubitus position to get better access to the liver, without excessive pushing or breath holds).
In some patients, it may not be possible to get reliable readings. The user manual
specification indicates a useable range of 0-3.2 m/s, with ±20% accuracy over the range. The
lower the velocity, as in normal liver, the lower the variance of the estimated velocity value.
The producer recommendations for best results are to:

Estimation of liver stiffness 27.07.2010 11:47 16
- Apply minimal scan pressure;
- Exclude data that varies significantly;
- Minimize breathing and avoid cardiac motion;
- Use the optimal window: intercostal right lobe (segment 8).
The factors that can affect measurement repeatability and reproducibility are:
- Excessive tissue motion (cardiac/breathing);
- Tissue attenuation;
- Poor scan window;
- Depth of ROI;
- Tissue stiffness;
- Local vessels/interfaces.
For clinical application with Virtual Touch Tissue Quantification scanning technique, the
optimal sample location is in the right lobe, away from motion and portal/hepatic vessels. The
left lobe should be avoided due to cardiac motion, as well as the subcostal approach and deep
inspiration.
There are some studies regarding the evaluation of liver fibrosis by means of ARFI, showing
encouraging results (30-34, 72).
In a study performed by Friedrich-Rust (30), in which ARFI was compared to LB and blood
markers in 86 patients with chronic hepatitis (B or C), Spearman correlation coefficients
between the histological fibrosis stage and ARFI, TE, FibroTest and APRI scores, indicated
significant correlations: 0.71, 0.73, 0.66 and 0.45 respectively (p<0.001). The diagnostic
accuracy of ARFI-imaging, TE and FibroTest were 0.82, 0.84, and 0.82, respectively, for the
diagnosis of significant fibrosis, and 0.91, 0.91, and 0.82, respectively, for the diagnosis of
liver cirrhosis.
In another study (72) that assessed the performance of ARFI evaluation in chronic
hepatopathies and healthy volunteers, 114 subjects were included: 38 healthy volunteers, 53
patients who had undergone LB and 23 previously diagnosed with LC). In each patient, in the
same day, LS measurement was performed by means of ARFI (by using a Siemens Acuson
S2000TM ultrasound system) and by means of TE (FibroScan). Fifteen ARFI measurements
were performed, 5 determinations in each of 3 positions: subcapsular, 1-2 cm and 2-3 cm
under the liver capsule, respectively (median value of 5 measurements in each position). This
study demonstrated a significant, direct correlation between ARFI and the severity of liver
fibrosis (p<0.001). The correlation between ARFI and the severity of liver fibrosis was

Estimation of liver stiffness 27.07.2010 11:47 17
rho=0.469 subcapsular, rho=0.675 and rho=0.714 respectively (p<0.001). The subcapsular
measured values of ARFI showed a poor correlation with fibrosis. The AUROC analysis,
regarding the whole group of patients (healthy volunteers, patients with LB and patients with
proven cirrhosis), showed that the best test for predicting significant fibrosis (F≥2 Metavir)
was TE, with AUROC 0.908, significantly larger than the AUROC’s for ARFI. If only ARFI
is considered, measurements made 1-2 and 2-3 cm under the liver capsule have the best
predictive value, with AUROC’s not significantly different from each other (0.767 and 0.731,
respectively, p=0.264). The optimal cut-off value for predicting significant fibrosis (at least
F2 Metavir) was obtained for ARFI measurements 2-3 cm under the liver capsule (1.26 m/s
with 0.74 sensitivity and 0.67 specificity). For measurements made 1-2 cm under the liver
capsule, the optimal cut-off value for significant fibrosis was 1.4 m/s with 0.70 sensitivity and
0.78 specificity. In this study, the cut-off values of TE and ARFI measurements for predicting the presence of
fibrosis (F>0) were: for TE - 5.65 kPa (AUROC-0.898) and for ARFI - 1.4 m/s for
measurements made 1-2 cm under the capsule (AUROC-0.747) and 1.26 m/s for
measurements made 2-3 cm under the capsule) (AUROC-0.721). The cut-off values of TE
and ARFI measurements for predicting cirrhosis (F=4 Metavir) were: for TE - 12.9 kPa
(AUROC-0.994) and for ARFI - 1.8 m/s for measurements made 1-2 cm under the capsule
(AUROC-0.929) and 1.78 m/s for measurements made 2-3 cm under the capsule (AUROC-
0.951). This study also demonstrated (two-way ANOVA test) that, even if there are different
values of ARFI measurements made 1-2 cm and 2-3 cm below the capsule, corresponding to
each stage of fibrosis, they are not statistically significant different from each other (p>0.05).
Also, according to this study, F0 could not be differentiated from F1, also F2 from F3, both in
1-2 cm and in 2-3 cm under the capsule measurements (p>0.05).
In the study performed by Lupsor and co-workers (33), 112 consecutive patients with chronic
hepatitis C were evaluated through histology (Metavir score), ARFI and TE. In this study,
ARFI was correlated with liver fibrosis (r=0.717, p<0.0001) and necroinflammatory activity
(r=0.328, p<0.014), but not with steatosis (r=0.122, p=0.321). In this study there was a
significant increase of ARFI values in parallel with the increase in fibrosis stage: 1.079±0.150
m/s (F0-F1), 1.504±0.895 m/s (F2), 1.520±0.575 m/s (F3), 2.552±0.782 m/s (F4), p<0.0001,
but there was a certain degree of overlap between the consecutive stages F1-F2 (p=0.072) and
F2-F3 (p=0.965). In this study the cut-off values (m/s) predictive for each fibrosis stage were:
1.19 (F≥1), 1.34 (F≥2), 1.61 (F≥3) and 2.00 (F4). Concerning the comparison between ARFI
Estimation of liver stiffness 27.07.2010 11:47 18
and TE, this study found that the AUROCs were: 0.709 vs. 0.902, p=0.006 (F≥1), 0.851 vs.
0.941, p=0.022 (F≥2), 0.869 vs. 0.926, p=0.153 (F≥3) and 0.911 vs. 0.945, p=0.331 (F4).
The last two studies that we presented (33, 72) showed that there is a strong correlation
between histological fibrosis and ARFI measurements, also that the best performances of this
method are in the prediction of severe fibrosis and cirrhosis and ARFI is not better than TE
for the evaluation of liver stiffness.
On the basis of the multiple published studies for the evaluation of liver stiffness with
ultrasound waves: Transient Elastography, Real-time Elastography and Acoustic Radiation
Force Impulse (ARFI) Elastography, we can conclude that in this moment, all these methods
are very promising non-invasive tools for the evaluation of liver fibrosis. Further clinical
studies and new technological developments can improve the results of these methods,
making them a solution that can replace LB in the future.
References
1. McHutchison J, Poynard T, Afdhal N for the International Fibrosis Group Meeting participants: Fibrosis as an End Point for Clinical Trials in Liver Disease: A Report of the International Fibrosis Group. Clinical Gastroenterology and Hepatology 2006; 4: 1214-1220
2. Regev A, Berho M, Jeffers LJ et al: Sampling error and intraobserver variation in liver biopsy in patients with chronic HCV infection. Am J Gastroenterol 2002; 97: 2614-2618
3. Persico M, Palmentieri B, Vecchione R et al: Diagnosis of chronic liver disease: reproducibily and validation of liver biopsy. Am J Gastroenterol 2002; 97: 491-492
4. Ratziu V, Charlotte F, Heurtier A, Gombert S, Giral P, Brucker E et al: Sampling Variability of Liver Biopsy in Nonalcoholic Fatty Liver Disease. Gastroenterology 2005; 128: 1898-1906
5. Gebo KA, Herlong HF, Torbenson MS et al: Role of liver biopsy in management of chronic hepatitis C: A systematic review. Hepatology 2002; 36: S161-S72
6. Rosenberg WM, Voelker M, Thiel R et al. For the European Liver Fibrosis Group: Serum markers detect the presence of liver fibrosis: a cohort study. Gastroenterology 2004; 127: 1704-13
7. Gregersen H, Gilja OH, Hausken T, Heimdal A, Gao C, Matre K, et al. Mechanical properties in the human gastric antrum using B-mode ultrasonography and antral distension. Am J Physiol Gastrointest Liver Physiol 2002 Aug;283(2):G368-G375.
8. Ahmed AB, Gilja OH, Gregersen H, Odegaard S, Matre K. In vitro strain measurement in the porcine antrum using ultrasound doppler strain rate imaging. Ultrasound Med Biol 2006 Apr;32(4):513-22.
9. Poynard T, Zoulim F, Ratziu V et al: Longitudinal assessment of histology surrogate markers (FibroTest-ActiTest) during Lamivudine therapy in patients with chronic hepatitis B infection. Am J Gastroenterol 2005; 100: 1970-80
10. Ratziu V, Massard J, Charlotte F et al; LIDO Study Group; CYTOL study group: Diagnostic value of biochemical markers (FibroTest-FibroSURE) for the prediction of
Estimation of liver stiffness 27.07.2010 11:47 19
liver fibrosis in patients with non-alcoholic fatty liver disease. BMC Gastroenterol. 2006 Feb 14; 6: 6
11. Lainé F, Bendavid C, Moirand R et al: Prediction of liver fibrosis in patients with features of the metabolic syndrome regardless of alcohol consumption. Hepatology 2004; 39: 1639-46
12. Rockey CD: Noninvasive Assessment of Liver Fibrosis and Portal Hypertension with Transient Elastography. Gastroenterology 2008; 134: 8-14
13. Huwart L, Sempoux C, Vicaut E et al: Magnetic Resonance Elastography for the Noninvasive Staging of Liver Fibrosis. Gastroenterology. 2008; 135: 32-40. Epub 2008 Apr 4.
14. Yin M, Talwalkar JA, Glaser KJ et al: Assessment of hepatic fibrosis with magnetic resonance elastography. Clin Gastroenterol Hepatol. 2007; 5(10): 1207-13.e2
15. Ophir J, Cespedes I, Ponnekanti H, Yazdi Y, Li X. Elastography: a quantitative method for imaging the elasticity of biological tissues. Ultrason Imaging 1991 Apr;13(2):111-34.
16. Ophir J, Garra B, Kallel F, Konofagou E, Krouskop T, Righetti R, et al. Elastographic imaging. Ultrasound Med Biol 2000 May;26 Suppl 1:S23-S29.
17. Matre K, Moen CA, Fannelop T, Dahle GO, Grong K. Multilayer radial systolic strain can identify subendocardial ischemia: An experimental tissue Doppler imaging study of the porcine left ventricular wall. European Journal of Echocardiography 2007 Dec;8(6):420-30.
18. Gilja OH, Heimdal A, Hausken T, Gregersen H, Matre K, Berstad A, et al. Strain during gastric contractions can be measured using Doppler Ultrasonography . Ultrasound Med Biol 2002;28(9):1457-65.
19. Heimdal A, Gilja OH. Strain Rate Imaging - A new tool for studying th GI tract. In: Odegaard S, Gilja OH, Gregersen H, editors. Basic and new aspects of gastrointestinal ultrasonography.Singapore: World Scientific; 2005. p. 243-63.
20. Muller M, Gennisson JL, Deffieux T, Tanter M, Fink M. Quantitative Viscoelasticity Mapping of Human Liver Using Supersonic Shear Imaging: Preliminary in Vivo Feasability Study. Ultrasound in Medicine and Biology 2009 Feb;35(2):219-29.
21. Bercoff J, Pernot M, Tanter M, Fink M. Monitoring thermally-induced lesions with supersonic shear imaging. Ultrason Imaging 2004 Apr;26(2):71-84.
22. Bercoff J, Tanter M, Fink M. Supersonic shear imaging: A new technique for soft tissue elasticity mapping. Ieee Transactions on Ultrasonics Ferroelectrics and Frequency Control 2004 Apr;51(4):396-409.
23. Talwalkar JA. Kurtz DM. Schoenleber SJ et al: Ultrasound-based transient elastography for the detection of hepatic fibrosis: systematic review and meta-analysis. Clin Gastroenterol Hepatol. 2007; 5: 1214-20.
24. Friedrich-Rust M, Ong MF, Martens S et al: Performance of transient elastography for the staging of liver fibrosis: a meta-analysis. Gastroenterology 2008; 134(4): 960-74
25. Friedrich-Rust M, Ong MF, Herrmann E et al: Real-time elastography for noninvasive assessment of liver fibrosis in chronic viral hepatitis. AJR Am J Roentgenol. 2007; 188: 758-64
26. Tatsumi C, Kudo M, Ueshima K et al: Noninvasive evaluation of hepatic fibrosis using serum fibrotic markers, transient elastography (FibroScan) and real-time tissue elastography. Intervirology. 2008; 51 Suppl 1: 27-33. Epub 2008 Jun 10
27. Havre RF, Elde E, Gilja OH et al: Freehand real-time elastography: impact of scanning parameters on image quality and in vitro intra-and interobserver validations. Ultrasound Med Biol. 2008; 34:1638-50. Epub 2008 Jun 4.
28. Fujimoto K, Kato M, Wada S et al: Non-invasive evaluation of Hepatic Fibrosis in patients with Chronic Hepatitis C using Elastography. Medix 2007. Suppl. 24-27

Estimation of liver stiffness 27.07.2010 11:47 20
29. Popescu A, Sporea I, Focsa M et al : Assessment of Liver Fibrosis by Real-time SonoElastography (Hitachi) as Compared to Liver Biopsy and Transient Elastography. Ultrasound in medicine and biology 2009; Suppl.8 (35):S152
30. Friedrich-Rust M, Wunder K, Kriener S et al: Liver Fibrosis in Viral Hepatitis. Noninvasive Assessment with Acoustic Radiation Force Impulse Imaging versus Transient Elastography. Radiology 2009,2 (252),595-604
31. Sporea I, Şirli R, Popescu A et al: Transient Elastography (FibroScan) as compared to RealTime-Elastography (Siemens) in patients with chronic hepatopathies. Gastroenterology 2009:136 (5); A-327
32. Sporea I, Sirli R, Popescu A et al: How Relevant is Real-time Elastography (Siemens) for the Evaluation of Liver Stiffness? Ultrasound in Medicine and Biology 2009; Suppl.8 (35):S53
33. Lupsor M, Badea R, Stefanescu H et al: Performance of a new elastographic method (ARFI technology) compared to unidimensional transient elastography in the noninvasive assessment of chronic hepatitis C. Preliminary results. J Gastrointest Liver Disease 2009;3(18):303-311
34. Takahashi H, Ono N, Eguchi Y, Eguchi T, Kitajima Y, Kawaguchi Y et al. Evaluation of acoustic radiation force impulse elastography for fibrosis staging of chronic liver disease: a pilot study. Liver Int. 2009 Oct 27. [Epub ahead of print]
35. CasteraL, Vergniol J, Foucher J et al: Prospective comparison of transient elastography, FibroTest, APRI, and liver biopsy for the assessment of fibrosis in chronic hepatitis C. Gastroenterology 2005; 128: 343-350
36. Corpechot C, El Naggar A, Poujol-Robert A et al: Assessment of biliary fibrosis by transient eleastography in patients with PBC and PSC. Hepatology 2006; 43: 1118–24.
37. De Ledinghen V, Douvin C, Kettaneh A, et al: Diagnosis of hepatic fibrosis and cirrhosis by transient elastography in HIV/hepatitic C virus-coinfected patients. J Acquir Immune Defic Syndr 2006; 41: 175–179.
38. Arena U, Vizzutti F, Abraldes JG et al: Reliability of transient elastography for the diagnosis of advanced fibrosis in chronic hepatitis C. Gut. 2008; 57[9]: 1288-93
39. Marcellin P, Ziol M, Bedossa P et al: Non-invasive assessment of liver fibrosis by stiffness measurement in patients with chronic hepatitis B. Liver Int. 2009; 29[2]: 242-7
40. Vergara S, Macias J, Rivero A et al: The use of transient elastometry for assessing liver fibrosis in patients with HIV and hepatitis C virus coinfection. Clin Infect Dis 2007; 45: 969–974
41. Kelleher T, MacFarlane C, de Ledinghen V et al: Risk factors and hepatic elastography (FibroScan) in the prediction of hepatic fibrosis in non-alcoholic steatohepatitis (abstract). Gastroenterology 2006; 130: A736.
42. Yoneda M, Fujita K, Inamori M, Nakajima A, Tamano M, Hiraishi H: Transient elastography in patients with non-alcoholic fatty liver disease (NAFLD). Gut 2007; 56: 1330–1331.
43. Konate A, Boursier J, et al. Liver stiffness measurement by transient elastography: predictive factors of accuracy, success and reproducibility. J Hepatol 2006; 44: S195
44. Fraquelli M, Rigamonti C et al. Reproducibility of transient elastography (TE) in assessing hepatic fibrosis in patients with chronic hepatitis. Gut 2007; 56; 968-973.
45. Fraquelli M, Rigamonti C, Casazza G et al: Reproducibility of transient elastography in the evaluation of liver fibrosis in patients with chronic evaluation of liver fibrosis in patients with chronic. Gut 2007; 56; 968-973
46. Castera L, Foucher J, Bernard PH et al: Prevalence and factors associated with liver stiffness measurement failure and unreliable results using fibroscan: a 5 year experience in 13369 examinations. J Hepatol: 2009; 50: S52
Estimation of liver stiffness 27.07.2010 11:47 21
47. Sandrin L, Fourquet B, Hasquenoph JM et al: Transient elastography: a new non-invasive method for assessment of hepatic fibrosis. Ultrasound Med Biol 2003; 29: 1705–1713
48. Castera L, Le Bail B, Roudot-Thoraval F et al: Early detection in routine clinical practice of cirrhosis and oesophageal varices in chronic hepatitis C: Comparison of transient elastography (FibroScan) with standard laboratory tests and non-invasive scores. J Hepatol 2009; 50: 59-68
49. Kazemi F, Kettaneh A, N’Kontchou G et al: Liver stiffness measurement selects patients with cirrhosis at risk of bearing large oesophageal varices. J Hepatol 2006; 45: 230–235.
50. Vizzutti F, Arena U, Romanelli RG et al. Liver stiffness measurement predicts severe portal hypertension in patients with HCV-related cirrhosis. Hepatology 2007; 45: 1290–1297
51. Carrion JA, Navasa M, Bosch J, Bruguera M, Gilabert R, Forns X. Transient elastography for diagnosis of advanced fibrosis and portal hypertension in patients with hepatitis C recurrence after liver transplantation. Liver Transpl 2006; 12: 1791–1798.
52. Bureau C, Metivier S, Peron JM et al: Prospective assessment of liver stiffness for the non-invasive prediction of portal hypertension. J Hepatol 2007; 46: S34.
53. Lemoine M, Katsahian S, Nahon P et al: Liver stiffness measurement is correlated with hepatic venous pressure gradient in patients with uncomplicated alcoholic and/or HCV related cirrhosis. Hepatology 2006; 44: 204A.
54. Sporea I, Şirli R, Deleanu A et al: Comparison of the liver stiffness measurement by transient elastography with the liver biopsy. World J Gastroenterol 2008; 14(42): 6513-6517
55. Ziol M, Handra-Luca A, Kettaneh A et al: Noninvasive assessment of liver fibrosis by measurement of stiffness in patients with chronic hepatitis C. Hepatology 2005;41: 48-54
56. Beaugrand M, Ziol M, Marcelin P et al: Liver stiffness cut off values in HCV patients: validation and comparison in an independent population. Hepatology 2006; 44(4), Suppl. 1: 269
57. Lupşor Monica, Badea R, Stefănescu H et al: Analysis of Histopathological Changes that Influence Liver Stiffness in Chronic Hepatitis C. Results from a Cohort of 324 patients. J Gastrointest Liver Dis 2008; 2:155-163
58. Coco B, Oliveri F, Maina AM et al: Transient elastography; a new surrogate marker of liver fibrosis influenced by major changes of transaminases. J Viral Hepat. 2007; 14:360-369
59. Orphir J, Alam SK, Garra B et al: Elastography: Ultrasonic estimation and imaging of elastic properties of tissues. Proc Inst Mech Eng 1999;213:203-233
60. Orphir J, Cespedes I, Ponnekanti H et al: Elastography: A quantitative method for imaging the elasticity of biological tissues. Ultrason Imaging 1991;13:111-134
61. Frey H: Real-time elastography: a new ultrasound procedure for reconstruction of tissue elasticity. Radiologe 2003; 43(10): 850-5
62. Friedrich-Rust M, Ong MF, Herrmann E et al: Real-time elastography for noninvasive assessment of liver fibrosis in chronic viral hepatitis. AJR Am J Roentgenol. 2007; 188: 758-64
63. Havre RF, Elde E, Gilja OH et al: Freehand Real-time Elastography: Impact of scanning parameters on image quality and in vitro intra- and interobserver validations. Ultrasound Med Biol 2008: 34 (10): 1638-1650
64. Shiina T et al: Real-time tissue elasticity imaging by the compound autocorrelation method. J Med Ultrasonics. 1999; 26: 57-66
65. Matsumura T et al: Development of Real-time tissue elastography in EUB-8500. J Med Ultrasonics. 2003; 26 (suppl)
Estimation of liver stiffness 27.07.2010 11:47 22
66. Fujimoto K, Wada S, Oshita M et al: Non-invasive evaluation of Hepatic Fibrosis in patients with Chronic Hepatitis C using Elastography. Medix 2007;10 (suppl.): 24-27
67. Tatsumi C, Kudo M, Ueshima K et al: Noninvasive Evaluation of Hepatic Fibrosis Using serum Fibrosis Markers, Transient Elastography (FibroScan) and Real_Time Tissue Elastography. Intervirology 2008;51 (suppl 1);27-33
68. Friedrich-Rust M, Schwarz A, Ong M et al : Real-Time Tissue Elastography Versus FibroScan for Noninvasive Assessment of Liver Fibrosis in Chronic Liver Disease. European J Ultrasound 2009;30:478-484
69. Gheonea DI al: The role of real-time elastography in the non-invasive assessment of fibrosis in diffuse hepatopathies. Euroson 2008,Timişoara,oral presentation
70. Sãftoiu A, Gheonea DI, Ciurea T: Hue histogram analysis of real-time elastography images for noninvasive assessment of liver fibrosis. AJR Am J Roentgenol. 2007;189:W232-3
71. Nightingale K, Soo MS, Nightingale R et al: Acoustic radiation force impulse imaging: in vivo demonstration of clinical feasibility. Ultrasound Med Biol 2002;28: 227–235
72. Sporea I, Şirli R, Deleanu A et al: Acoustic Radiation Force Impulse Elastography as compared to Transient Elastography and Liver Biopsy in patients with chronic hepatopathies. European J Ultrasound In press