ecb economic bulletin, issue 4 / 2020
TRANSCRIPT

Economic Bulletin
Issue 4 / 2020

ECB Economic Bulletin, Issue 4 / 2020 – Contents 1
Contents
Economic and monetary developments 2
1 Overview 2
1 External environment 7
2 Financial developments 15
3 Economic activity 21
4 Prices and costs 27
5 Money and credit 33
6 Fiscal developments 42
Boxes 46
1 Impact of the COVID-19 lockdown on trade in travel services 46
2 Coronavirus (COVID-19): market fear as implied by options prices 51
3 The COVID-19 pandemic and access to finance for small and medium-sized enterprises: evidence from survey data 56
4 Liquidity conditions and monetary policy operations in the period from 29 January to 5 May 2020 60
5 Regional labour market developments during the great financial crisis and subsequent recovery 67
6 Short-time work schemes and their effects on wages and disposable income 72
7 The COVID-19 crisis and its implications for fiscal policies 76
Articles 80
1 Citizens’ attitudes towards the ECB, the euro and Economic and Monetary Union 80
2 Access to finance for small and medium-sized enterprises since the financial crisis: evidence from survey data 104
Statistics S1

ECB Economic Bulletin, Issue 4 / 2020 – Economic and monetary developments Overview
2
Economic and monetary developments
1 Overview
At its monetary policy meeting on 4 June, the Governing Council decided to increase the envelope and extend the horizon for the pandemic emergency purchase programme (PEPP) and to reinvest its maturing principal payments, while continuing with the asset purchase programme (APP) and its reinvestments and keeping the key ECB interest rates unchanged. Incoming information confirms that the euro area economy is experiencing an unprecedented contraction. There has been an abrupt drop in economic activity as a result of the coronavirus (COVID-19) pandemic and the measures to contain it. Severe job and income losses and exceptionally elevated uncertainty about the economic outlook have led to a significant fall in consumer spending and investment. While survey data and real-time indicators for economic activity have shown some signs of a bottoming-out alongside the gradual easing of the containment measures, the improvement has so far been tepid compared with the speed at which the indicators plummeted in the preceding two months. The June 2020 Eurosystem staff macroeconomic projections for the euro area see growth declining at an unprecedented pace in the second quarter of this year, before rebounding again in the second half, crucially helped by the sizeable support from fiscal and monetary policy. Nonetheless, the projections entail a substantial downward revision to both the level of economic activity and the inflation outlook over the whole projection horizon, though the baseline is surrounded by an exceptional degree of uncertainty. While headline inflation is suppressed by lower energy prices, price pressures are expected to remain subdued on account of the sharp decline in real GDP and the associated significant increase in economic slack. Against this background, the Governing Council decided on a set of monetary policy measures to support the economy during its gradual reopening and to safeguard medium-term price stability.
Economic and monetary assessment at the time of the Governing Council meeting of 4 June 2020
The COVID-19 epidemic has caused a sharp deterioration in the global outlook, as embedded in the June 2020 Eurosystem staff macroeconomic projections. The COVID-19 pandemic has paralysed the global economy, with measures to contain the spread of the virus taken by governments across the globe being a driving factor behind the recent sharp decline in economic activity. Several countries have recently started easing containment measures, but this process is likely to be very gradual. Economic activity, especially in emerging market economies, has also been adversely affected by a sharp fall in commodity prices, tighter financial conditions and substantial capital outflows. Incoming data confirm that the economic fallout from containment measures will be sharp and deep. In view of these severe global disruptions, the June 2020 Eurosystem staff macroeconomic projections envisage that world real GDP

ECB Economic Bulletin, Issue 4 / 2020 – Economic and monetary developments Overview
3
(excluding the euro area) will contract by 4.0% this year. The pace of this contraction is faster and its magnitude greater than seen in the Great Recession. Following a sharp contraction in the first two quarters of 2020, global activity is projected to start to recover in the third quarter and to increase by 6.0% and 3.9% in 2021 and 2022, respectively. Global trade will be affected more severely, as logistics disruptions and closed borders amplify the impact of the fallout. Despite a sharp deterioration in the global outlook, as embedded in the June projections, risks to this outlook are still skewed to the downside. Most importantly, the impact of the pandemic may prove to be stronger and longer lasting than currently expected.
Although financial conditions in the euro area have loosened somewhat since the Governing Council’s meeting in March 2020, they have not returned to the levels seen before the global spread of COVID-19. Over the review period (12 March 2020 to 3 June 2020) the forward curve of the euro overnight index average (EONIA) shifted upwards. Its inversion at short maturities is still present, albeit less so than on 12 March, signalling that market participants’ expectations of further policy rate cuts have diminished and shifted further out into the future. Despite the monetary policy accommodation provided via the PEPP and other policy measures, long-term euro area sovereign bond yields increased over the review period. Prices of risky assets partly recovered from the losses incurred during February and March, mainly against the backdrop of an improvement in global risk sentiment and the perception that tail risks of an imminent global crisis have faded to some extent. In foreign exchange markets, the euro remained broadly stable in trade-weighted terms, with volatility in bilateral exchange rates reflecting uncertainty surrounding the COVID-19 pandemic.
Euro area real GDP decreased by 3.8%, quarter on quarter, in the first quarter of 2020, and incoming data point to a further significant contraction of real GDP in the second quarter. The latest economic indicators and survey results confirm a sharp contraction of the euro area economy and rapidly deteriorating labour market conditions. The coronavirus pandemic and the necessary containment measures have severely affected both the manufacturing and services sectors, taking a toll on the productive capacity of the euro area economy and on domestic demand. Most recent indicators suggest some bottoming-out of the downturn in May as parts of the economy gradually reopen. Accordingly, euro area activity is expected to rebound in the third quarter as the containment measures are eased further, supported by favourable financing conditions, an expansionary fiscal stance and a resumption in global activity, although the overall speed and scale of the rebound remains highly uncertain.
This assessment is also broadly reflected in the June 2020 Eurosystem staff macroeconomic projections for the euro area. In the baseline scenario of the projections, annual real GDP is expected to fall by 8.7% in 2020 and to rebound by 5.2% in 2021 and 3.3% in 2022. Compared with the March 2020 ECB staff macroeconomic projections, the outlook for real GDP growth has been revised substantially downwards by 9.5 percentage points in 2020 and revised upwards by 3.9 percentage points in 2021 and 1.9 percentage points in 2022. Given the exceptional uncertainty currently surrounding the outlook, the projections also include two
ECB Economic Bulletin, Issue 4 / 2020 – Economic and monetary developments Overview
4
alternative scenarios.1 In general, the extent of the contraction and the recovery will depend crucially on the duration and effectiveness of the containment measures, the success of policies to mitigate the adverse impact on incomes and employment, and the extent to which supply capacity and domestic demand are permanently affected. Overall, the Governing Council sees the balance of risks around the baseline projection tilted to the downside.
According to Eurostat’s flash estimate, euro area annual HICP inflation decreased to 0.1% in May, down from 0.3% in April, mainly on account of lower energy price inflation. On the basis of current and futures prices for oil, headline inflation is likely to decline somewhat further over the coming months and to remain subdued until the end of the year. Over the medium term, weaker demand will put downward pressure on inflation, which will be only partially offset by upward pressures related to supply constraints. Market-based indicators of longer-term inflation expectations have remained at depressed levels. While survey-based indicators of inflation expectations have declined over the short and medium term, longer-term expectations have been less affected.
This assessment is also reflected in the June 2020 Eurosystem staff macroeconomic projections for the euro area, which foresee annual HICP inflation in the baseline scenario at 0.3% in 2020, 0.8% in 2021 and 1.3% in 2022. Compared with the March 2020 ECB staff macroeconomic projections, the outlook for HICP inflation has been revised downwards by 0.8 percentage points in 2020, 0.6 percentage points in 2021 and 0.3 percentage points in 2022. Annual HICP inflation excluding energy and food is expected to be 0.8% in 2020, 0.7% in 2021 and 0.9% in 2022.
The COVID-19 pandemic caused a sharp acceleration in monetary dynamics, driven by acute liquidity needs of businesses to finance ongoing payments and strong preferences for money holdings for precautionary reasons among economic agents. Broad money (M3) growth increased to 8.3% in April 2020, from 7.5% in March. The strong money growth reflects bank credit creation, which is being driven to a large extent by the acute liquidity needs in the economy. Moreover, high economic uncertainty is triggering a shift towards money holdings for precautionary reasons. The narrow monetary aggregate M1, encompassing the most liquid forms of money, continues to be the main contributor to broad money growth. Developments in loans to the private sector continued to be shaped by the impact of the coronavirus on economic activity. The annual growth rate of loans to non-financial corporations rose further to 6.6% in April 2020, up from 5.5% in March, reflecting firms’ need to finance their ongoing expenditure and working capital in the context of rapidly declining revenues. At the same time, the annual growth rate of loans to households decreased to 3.0% in April, from 3.4% in March, amid consumption constraints due to the containment measures, declining confidence and a deteriorating labour market. The Governing Council’s policy measures, in particular the very favourable terms for the targeted longer-term refinancing operations (TLTRO III), should encourage banks to extend loans to all private sector entities. Together with the measures adopted by
1 See the “Eurosystem staff macroeconomic projections for the euro area, June 2020” published on the
ECB’s website on 4 June 2020.

ECB Economic Bulletin, Issue 4 / 2020 – Economic and monetary developments Overview
5
national governments and European institutions, the Governing Council’s measures support ongoing access to financing, including for those most affected by the ramifications of the coronavirus pandemic.
The COVID-19 pandemic is having a significant impact on fiscal policies in the euro area. Containment measures have also triggered unprecedented fiscal stimulus packages intended to cushion the economic fallout and to prepare for a swift recovery. As a result, the general government budget deficit in the euro area is projected to increase significantly in 2020, to 8.5% of GDP, compared with 0.6% in 2019. Although the deficit ratio is expected to shrink to 4.9% in 2021, it is still expected to stand at 3.8% of GDP in 2022. Overall the aggregate fiscal stance for the euro area is assessed to be strongly expansionary in 2020, but contractionary in 2021, as most support measures are expected to have been phased out by then. Notwithstanding the negative fiscal stance in 2021, the overall fiscal balance will remain substantially negative with fiscal instruments continuing to support the economic recovery, not least through automatic stabilisers. An ambitious and coordinated fiscal stance remains critical, in view of the sharp contraction in the euro area economy, although measures should be targeted and temporary. In this respect, both the €540 billion package of three safety nets endorsed by the European Council and the European Commission’s proposal for a recovery plan dedicated to supporting the regions and sectors most severely hit by the pandemic are strongly welcomed.
The monetary policy package
A combination of two main factors called for additional monetary policy action. First, the pandemic-related downward revision to the inflation outlook poses a threat to the Governing Council’s medium-term price stability mandate. Second, while conditions in financial markets have stabilised substantially since the PEPP announcement, financial conditions for the euro area as a whole remain significantly tighter today than in the pre-pandemic period, whereas the outlook for economic activity and inflation calls for easier financial conditions.
Against this background, on 4 June 2020, the Governing Council decided on a set of monetary policy measures to support the ongoing ample degree of monetary accommodation necessary for the robust convergence of inflation to levels that are below, but close to, 2% over the medium term, in line with its mandate.
1. The Governing Council decided to increase the envelope for the PEPP by €600 billion to a total of €1,350 billion. In response to the pandemic-related downward revision to inflation over the projection horizon, the PEPP expansion will further ease the general monetary policy stance, supporting funding conditions in the real economy, especially for businesses and households. The purchases will continue to be conducted in a flexible manner over time, across asset classes and among jurisdictions. This allows the Governing Council to effectively stave off risks to the smooth transmission of monetary policy.
2. The Governing Council decided to extend the horizon for net purchases under the PEPP to at least the end of June 2021. This broadly aligns the purchase

ECB Economic Bulletin, Issue 4 / 2020 – Economic and monetary developments Overview
6
horizon with the horizons of the other monetary policy measures taken in response to the pandemic, such as TLTRO III and the pandemic emergency longer-term refinancing operations (PELTROs). In any case, the ECB will conduct net asset purchases under the PEPP until the Governing Council judges that the coronavirus crisis phase is over.
3. The Governing Council decided to reinvest the maturing principal payments from securities purchased under the PEPP until at least the end of 2022. In any case, the future roll-off of the PEPP portfolio will be managed to avoid interference with the appropriate monetary policy stance. The reinvestments will help to avoid the risk of an unwarranted tightening of financial conditions while the economy is still recovering from the pandemic shock. At the same time, it is appropriate that the reinvestment strategy for the PEPP reflects its temporary nature and link to the pandemic emergency.
4. In addition, net purchases under the APP will continue at a monthly pace of €20 billion, together with the purchases under the additional €120 billion temporary envelope until the end of the year. The Governing Council continues to expect monthly net asset purchases under the APP to run for as long as necessary to reinforce the accommodative impact of the ECB’s policy rates, and to end shortly before the Governing Council starts raising the key ECB interest rates.
5. The Governing Council intends to continue reinvesting, in full, the principal payments from maturing securities purchased under the APP for an extended period of time past the date when it starts raising the key ECB interest rates, and in any case for as long as necessary to maintain favourable liquidity conditions and an ample degree of monetary accommodation.
6. Finally, the Governing Council decided to keep the key ECB interest rates unchanged. These are expected to remain at their present or lower levels until the inflation outlook robustly converges to a level sufficiently close to, but below, 2% within the projection horizon, and such convergence has been consistently reflected in underlying inflation dynamics.
Together with the substantial monetary policy stimulus already in place, the Governing Council’s decisions will support liquidity and funding conditions in the economy, help to sustain the flow of credit to households and firms, and contribute to maintaining favourable financing conditions for all sectors and jurisdictions, in order to underpin the recovery of the economy from the coronavirus fallout. At the same time, in the current rapidly evolving economic environment, the Governing Council remains fully committed to doing everything necessary within its mandate to support all citizens of the euro area through this extremely challenging time. This applies first and foremost to the Governing Council’s role in ensuring that its monetary policy is transmitted to all parts of the economy and to all jurisdictions in the pursuit of the ECB’s price stability mandate. The Governing Council, therefore, continues to stand ready to adjust all of its instruments, as appropriate, to ensure that inflation moves towards its aim in a sustained manner, in line with its commitment to symmetry.

ECB Economic Bulletin, Issue 4 / 2020 – Economic and monetary developments External environment
7
1 External environment
The coronavirus (COVID-19) pandemic has paralysed the global economy. Measures taken by governments across the globe to contain the spread of the virus imply a sharp decline in economic activity in the near term. While several countries have recently started easing containment measures, this process is likely to be very gradual. Economic activity, especially in emerging market economies (EMEs), is also being adversely affected by sharply lower commodity prices, tighter financial conditions and substantial capital outflows. Incoming data confirm that the economic fallout from the pandemic and containment measures will be heavy and far-reaching. In view of these severe global disruptions, the June 2020 Eurosystem staff macroeconomic projections envisage that world real GDP (excluding the euro area) will contract by 4.0% this year. The pace of this contraction is faster and its magnitude greater than seen in the Great Recession. Following a sharp contraction in the first two quarters of 2020, global activity is projected to start to recover in the third quarter. This profile implies that global activity is projected to increase by 6.0% and 3.9% in 2021 and 2022 respectively. Global trade will be affected more severely, as logistics disruptions and closed borders amplify the impact of the fallout. Moreover, trade is procyclical, responding to developments in economic activity, especially in downturns. Despite a sharp deterioration in the global outlook, as embedded in the June projections, risks to this outlook are still skewed to the downside. Most importantly, the impact of the pandemic may prove to be stronger and longer lasting than currently expected. Other risks relate, for instance, to an increased sensitivity of financial markets to news, structural changes in supply networks for production and the risk of a rise in trade protectionism.
Global economic activity and trade
The COVID-19 pandemic has paralysed the global economy. Measures taken by governments across the globe to contain the spread of the virus imply a sharp decline in economic activity in the near term. Such measures were introduced in China in late January, while other countries enacted them later as the virus spread globally. While several countries have recently started easing containment measures, this process is likely to be very gradual. Economic activity, especially in EMEs, is being adversely affected by sharply lower commodity prices, tighter financial conditions and substantial capital outflows. These severe global shocks hit the world economy at a time when signs of a stabilisation, following a period of lacklustre performance last year, had been increasingly evident. In particular, a nascent recovery in manufacturing activity and trade, led by large EMEs, had been under way at the turn of the year. Moreover, the favourable global financial conditions prevailing at that time, as well as a partial de-escalation of the trade conflict between the United States and China following the signing of the “phase one” trade agreement, had had the potential to reinforce the recovery before the pandemic struck.
Survey data confirm that the economic fallout from the pandemic and containment measures will be heavy and far-reaching. Looking at sectoral data from the Purchasing Managers’ Index (PMI) survey, three patterns emerge. First,

ECB Economic Bulletin, Issue 4 / 2020 – Economic and monetary developments External environment
8
output plummeted across sectors as stringent containment measures were put in place. Second, the impact on the services sector was greater than the impact on manufacturing. With containment policies suppressing supply and demand globally, output in both the manufacturing and services sectors has deteriorated much more rapidly than occurred during the Great Recession (see Chart 1). Third, as production resumes, output recovers from its depressed levels – as seen recently in China. However, for several reasons, this recovery is only partial. These reasons relate to restrictions that still remain in place for businesses that require close social interaction; behavioural changes by consumers amid worries about a second wave of infections; and high uncertainty hindering investment decisions which, in turn, lowers demand in the near term and weighs on productive capacity in the longer term. The global composite output PMI (excluding the euro area) recovered somewhat in May, supported by better results for both the manufacturing and services sectors. However, it remains deep in contractionary territory.
Chart 1 Global manufacturing and services output PMI (excluding the euro area)
(diffusion indices)
Sources: Markit and ECB calculations. Notes: The latest observations are for May 2020. The data cover the period from January 1999 to May 2020. The global financial crisis sample (yellow dots) denotes the period from December 2007 to June 2009. The COVID-19 pandemic sample (red dots) denotes the period from January 2020 to May 2020.
The more cautious behaviour of consumers is reflected in a sharp decline in global confidence indicators. Consumer confidence has deteriorated significantly in recent weeks, especially in advanced economies. In addition, the worsening labour market will lead consumers to adopt more cautious behaviour characterised by higher precautionary savings and lower consumption, particularly of durable goods.
Financial conditions tightened sharply, but some of this tightening has eased more recently. Initially, the tightening was swift and broad-based, affecting advanced economies and EMEs alike. In addition, EMEs have seen substantial financial outflows in both gross and net terms, although the latest data suggest that these outflows have moderated or even reversed in recent weeks. Despite these signs of a stabilisation, financial stress remains elevated, partly owing to an increase in the incidence of confirmed new cases of COVID-19 and deaths in EMEs. Notably, financial investors fled from EMEs indiscriminately in the initial phase of the crisis
20
30
40
50
60
70
20 30 40 50 60 70
March 2020
February 2020
April 2020
January 2020
Serv
ices
Manufacturing
Global financial crisisCOVID-19 pandemic
May 2020

ECB Economic Bulletin, Issue 4 / 2020 – Economic and monetary developments External environment
9
related to the pandemic, but differences in macroeconomic fundamentals and vulnerabilities across EMEs now seem to have become increasingly relevant for investment decisions.
Overall, financial conditions remain substantially tighter in both advanced economies and EMEs than before the pandemic struck. However, taking a longer-term perspective, they remain more favourable than in past global downturns, including the Great Recession and the recession that followed the bursting of the dot-com bubble in the early 2000s. In part, this may reflect the rapid and aggressive response of central banks around the world. Most notably, monetary policy interventions are likely to be the key factor behind the stabilisation in sovereign bond yields and term premia, despite the unprecedented level of global sovereign debt issuance necessitated by the pandemic. Uncertainty increased substantially and remains elevated. While it is still too early to judge what role elevated uncertainty has played in the current crisis, it is likely to weigh on the recovery prospects.
The June 2020 Eurosystem staff macroeconomic projections envisage that world real GDP (excluding the euro area) will decline by 4.0% this year. The pace of this contraction is faster and its magnitude much greater than seen in the Great Recession. Following a sharp contraction in the first two quarters of 2020, economic activity is projected to recover from the third quarter. As lockdowns are lifted, activity is projected to rebound initially, but the overall pace of the recovery is assumed to be gradual owing to social distancing measures kept in place and also owing to changing consumer behaviour. Looking further ahead, the June 2020 Eurosystem staff macroeconomic projections envisage that global activity will increase by 6.0% in 2021 and 3.9% in 2022. Compared with the March 2020 ECB staff macroeconomic projections, global growth has been revised significantly down for this year, while growth over the medium-term horizon is expected to be slightly stronger. These revisions also imply that the level of global output remains below the trajectory projected in the March 2020 ECB staff macroeconomic projections. For EMEs, the recovery is expected to be more subdued than those seen after previous downturns. This reflects the combination of negative shocks affecting EMEs at the current juncture, including the pandemic crisis, tight financial conditions, negative terms of trade shocks for commodity exporters, and substantial capital outflows.
In the United States, the pace of the contraction in economic activity is estimated to have accelerated in the second quarter of 2020. Real GDP declined by 5.0% on an annualised basis in the first quarter, according to the second estimate. This contraction was slightly larger than reported in the advance estimate. Higher frequency data suggest that the economic downturn deepened further in the second quarter, as strict containment measures were in place across the country in April. From late April US states started to gradually ease the containment measures, which should help to support a recovery in the second half of 2020. It will be led by a recovery in domestic demand backed by the strong economic policy support enacted to date. However, the recovery is projected to be gradual, as consumer confidence remains at depressed levels amid unprecedented job destruction recorded since late March. Employment decreased by more than 22 million jobs and the unemployment rate reached 14.7% in April. Annual headline consumer price inflation dropped sharply to

ECB Economic Bulletin, Issue 4 / 2020 – Economic and monetary developments External environment
10
0.3% in April, from 1.5% in the previous month. Excluding food and energy, annual inflation declined to 1.4% in April from 2.1% in March. Inflation is expected to decline this year, as the disinflationary effects of the demand shock outweigh inflationary effects stemming from supply disruptions, and is projected to gradually increase to stand closer to the Federal Reserve System’s 2% target towards the end of the projection horizon.
In China, the recovery is proceeding amid strong headwinds. These include weak external demand prospects in the near term, as evidenced by the sharp fall in export orders, and a gradual recovery in domestic demand. The latter reflects the remaining social distancing measures in place, as well as generally more cautious consumer behaviour. The monetary and policy stimulus enacted by the authorities will help to support economic activity. Looking ahead, activity is projected to recover over the projection horizon. However, this recovery is assumed to remain muted compared with the level of activity foreseen in the March projections.
In Japan, the economy has slipped into a technical recession. Activity declined in the fourth quarter of last year owing to a confluence of negative shocks, including a fall in domestic demand as a result of the consumption tax hike, production disruptions caused by powerful typhoons in October, and weak external demand. Subsequently, amid the COVID-19 outbreak, real GDP contracted further, declining by 0.9% in the first quarter of 2020. Authorities’ efforts to contain the virus weighed on domestic demand, especially private consumption of services and semi-durable goods. Notably, exports of services fell markedly, reflecting lower spending by inbound tourists owing to the travel restrictions imposed in reaction to the outbreak. The Japanese authorities stepped up policy support for the ailing economy. In April the Bank of Japan raised the limits on purchases of commercial paper and corporate bonds, eased access to corporate funding facilities and purchased short-term and longer-term government bonds. At its emergency meeting in May it decided to launch a new fund-provisioning measure for banks to support lending to small and medium-sized enterprises. In late May the Japanese government approved a second fiscal stimulus package that is broadly comparable in size to the one implemented in April 2020. These measures should provide further stimulus to the economy, which is projected to gradually recover from the second half of this year.
In the United Kingdom, the economic situation has deteriorated significantly. Real GDP fell by 2% in the first quarter of 2020, even though the economy was locked down for just the last ten days of March, while annual consumer price inflation fell to 0.8% in April, down sharply from 1.5% in the previous month. While the furlough scheme has helped to maintain employment, the labour market situation has deteriorated markedly. Experimental ONS data on benefit claimants – covering the unemployed, as well as those receiving in-work benefits – showed that by mid-April more than two million citizens were claiming some form of benefit. This is around one-third more than the number observed during the Great Recession. High frequency data signal a further marked deterioration in the second quarter, which implies a much more severe recession than occurred in the aftermath of the global financial crisis. The government has announced a phased reopening of the economy, which is expected to support a gradual recovery in the coming months.

ECB Economic Bulletin, Issue 4 / 2020 – Economic and monetary developments External environment
11
In central and eastern European countries, economic activity is expected to weaken substantially. A large number of countries in the region recorded negative growth in the first quarter of 2020, amid supply disruptions and weaker demand caused by containment measures. Looking ahead, a much deeper downturn is expected in the second quarter. This reflects the interplay of weaker domestic demand – as the containment measures remained in place throughout April – with weaker external demand, especially from the euro area countries.
Economic activity in large commodity-exporting countries is expected to fall precipitously. In Russia, the economy has been buffeted by recent energy market developments and by the COVID-19 pandemic, taking a toll on external demand. At the same time, there has been a steep rise in new domestic cases of infection, resulting in a tightening of measures to contain the spread of the virus. The production cuts agreed by OPEC+ to stabilise the global oil market, as well as lower commodity prices, are expected to dampen investment. In Brazil, economic activity deteriorated sharply owing to lockdowns, supply chain disruption, weaker external demand, significant capital outflows and a negative terms of trade shock reflecting falling commodity prices. Rising political tensions and the fact that the country is one of the worst-affected by the pandemic, may complicate the provision of effective policy support for the economy.
In Turkey, the pandemic gave rise to financing pressures, amid high external imbalances and financing needs. Activity remained robust until late March. Thereafter, sentiment started to erode rapidly, as containment measures were introduced and external demand contracted sharply. At the same time, foreign investors became increasingly risk-averse vis-à-vis EMEs and signs of financing pressures for Turkey appeared. The Turkish lira has weakened and central bank reserves have dropped sharply. A steep contraction in activity is expected in the first half of 2020, while the ensuing recovery is projected to be very gradual.
Global trade will be affected more severely than activity, as logistics disruptions and closed borders amplify the impact of falling demand. Moreover, the procyclical response of trade to developments in economic activity tends to intensify in downturns. The collapse in global merchandise trade is likely to be amplified by disruptions in regional and global value chains, as the significant share of trade in intermediate goods – accounting for around 40% of world trade – has important implications for the international transmission of demand and supply shocks. A sharp decline in trade is already visible in global merchandise imports, which contracted by 2.9% in the first quarter of 2020 (see Chart 2) – the largest quarterly drop since the Great Recession. At the same time, the pace of the decline in merchandise imports was broadly comparable across advanced economies and EMEs.

ECB Economic Bulletin, Issue 4 / 2020 – Economic and monetary developments External environment
12
Chart 2 Surveys and global trade in goods (excluding the euro area)
(left-hand scale: three-month-on-three-month percentage changes; right-hand scale: diffusion indices)
Sources: Markit, CPB Netherlands Bureau for Economic Policy Analysis and ECB calculations. Notes: The latest observations are for May 2020 for the PMI data and March 2020 for global merchandise imports. The indices and data refer to the global aggregate excluding the euro area.
Owing to the nature of the shock, services trade has been particularly hard hit. Incoming data on tourism and transportation, which together account for the bulk of global services trade, indicate an unprecedented decline. International tourist arrivals declined by more than 50% in March. Similarly, the volume of passengers on international flights has more than halved compared with the same period last year.
According to the June 2020 Eurosystem staff macroeconomic projections, global import growth (excluding the euro area) is expected to decline by 12.9% this year, before increasing by 8.0% and 4.3% in 2021 and 2022 respectively. Euro area foreign demand is projected to contract by 15.1% this year and to grow by 7.8% and 4.2% in 2021 and 2022 respectively. The pandemic has had a substantial impact on trade – world imports (excluding the euro area) are not projected to return to the levels recorded in the fourth quarter of 2019 until towards the end of the projection horizon. Euro area foreign demand remains below this level over the whole projection horizon.
The degree of uncertainty about the future course of the global economy remains unprecedented. It relates to the evolution of the pandemic and its impact on economic behaviour, as well as the associated containment measures and the success of the policy measures. To illustrate the range of possible impacts of the COVID-19 pandemic on the global economy, in the June 2020 Eurosystem staff macroeconomic projections the baseline projection is complemented by two scenarios – the mild and severe scenarios. These scenarios can be seen as providing an illustrative range around the baseline projection.2 The COVID-19 pandemic has also put in motion a number of developments which could weigh on the projected recovery of the global economy. They include, for instance, increased sensitivity of financial markets to news, or structural changes to supply networks for production. These risks,
2 For further details, see the box entitled “Alternative scenarios for the euro area economic outlook” in the
Eurosystem staff macroeconomic projections for the euro area, June 2020.
26
30
34
38
42
46
50
54
58
62
66
-6
-5
-4
-3
-2
-1
0
1
2
3
4
2013 2014 2015 2016 2017 2018 2019 2020
Global merchandise imports (left-hand scale)Average global merchandise imports, 1991-2019 (left-hand scale)Global PMI, manufacturing output (right-hand scale)Global PMI, new export orders (right-hand scale)
ECB Economic Bulletin, Issue 4 / 2020 – Economic and monetary developments External environment
13
in addition to other downside risks related to the Brexit negotiations and the risk of a rise in trade protectionism, remain relevant, although they are also likely conditional on the future course of the COVID-19 pandemic and the policy measures taken.
Global price developments
The sharp deterioration in global demand prospects has caused oil prices to fall dramatically. Brent crude oil prices have recently recovered somewhat to stand above USD 30 per barrel, having plunged below USD 20 per barrel in early April. The partial recovery in oil prices appears to be driven by hopes of a reversal of the sudden collapse in global oil demand associated with the pandemic, as China recovers and lockdowns in other countries are gradually eased. Oil prices have also been supported by the gradual response of oil supply as the OPEC+ agreement came into effect at the beginning of May and oil production in the United States and Canada declined owing to extensive shutdowns. Compared with the March 2020 ECB staff macroeconomic projections, the crude oil price assumptions in the June 2020 Eurosystem staff macroeconomic projections are 36.0%, 33.1% and 26.6% lower for 2020, 2021 and 2022. Since the cut-off date for the June projections, the price of crude oil has increased, with Brent crude standing at USD 38.3 per barrel on 3 June. Looking ahead, crude oil prices are likely to remain volatile. This is a reflection of the fact that the economic outlook remains highly uncertain and storage capacity utilisation is exceptionally high.
Global inflation is being dampened by a sharp decline in oil prices. Annual headline consumer price inflation in OECD countries slowed sharply to 0.9% in April, from 1.7% in March, driven by a sharp fall in oil prices and lower core inflation (see Chart 3). Following a collapse in crude oil prices associated with the pandemic, annual energy price inflation had already turned negative in March and the pace of this decline accelerated sharply to 10.8% in April, marking the biggest drop since September 2015. In contrast, annual food price inflation accelerated further to 6.4% in April, from 3.5% in the previous month. At the same time, annual core CPI inflation (excluding food and energy) decreased to 1.6% in April, from 2.1% in the previous month.
Looking ahead, global inflation will decrease amid lower oil prices and weaker demand. These factors outweigh any potential inflationary impact from lower supply caused by bottlenecks in production and logistics. Weak demand, a sharp deterioration in labour markets and greater slack are likely to weaken underlying inflation pressures globally. Lower oil prices explain much of the downward revision to euro area competitors’ export prices (in national currency) in 2020. As the price of crude oil is expected to gradually increase over the projection horizon, this impact will dissipate and euro area competitors’ export prices are projected to return to their long-term average towards the end of 2021.

ECB Economic Bulletin, Issue 4 / 2020 – Economic and monetary developments External environment
14
Chart 3 OECD consumer price inflation
(year-on-year percentage changes; percentage point contributions)
Sources: OECD and ECB calculations. Note: The latest observations are for April 2020.
-1.5
-1.0
-0.5
0.0
0.5
1.0
1.5
2.0
2.5
3.0
3.5
2013 2014 2015 2016 2017 2018 2019 2020
Energy contributionFood contributionContribution of all components except food and energy Inflation excluding food and energyInflation including all components

ECB Economic Bulletin, Issue 4 / 2020 – Economic and monetary developments Financial developments
15
2 Financial developments
Although financial conditions in the euro area have loosened somewhat since the Governing Council’s meeting in March 2020, they have not returned to the levels seen before the global spread of the coronavirus (COVID-19). Over the review period (12 March 2020 to 3 June 2020) the forward curve of the euro overnight index average (EONIA) shifted upwards. A slight inversion at short maturities is still present, albeit less so than on 12 March, and signals that market participants’ expectations of further policy rate cuts have diminished and shifted further into the future. Despite the monetary policy accommodation provided via the pandemic emergency purchase programme (PEPP) and other policy measures, long-term euro area sovereign bond yields increased over the review period owing to an increase in risk-free rates and a widening of sovereign spreads. Prices of risk assets partly recovered from the losses incurred during February and March, mainly against the backdrop of an improvement in global risk sentiment and the perception that tail risks of an imminent global crisis have faded to some extent. In foreign exchange markets, the euro remained broadly stable in trade-weighted terms, with volatility in bilateral exchange rates reflecting uncertainty around the COVID-19 pandemic.
The EONIA and the new benchmark euro short-term rate (€STR) averaged -45 and -54 basis points respectively over the review period.3 Excess liquidity increased by €398 billion in the period under review to around €2,163 billion.4 This change mainly reflects the introduction of the PEPP alongside the asset purchase programme (APP), as well as the take-up of targeted longer-term refinancing operations (TLTRO III) and LTRO bridge operations.
The short end of the EONIA forward curve shifted upwards over the review period, although the curve remains slightly inverted (see Chart 4). The short end of the curve flattened following the Governing Council meeting on 12 March, as markets postponed expectations of an imminent reduction in the deposit facility rate. Nevertheless, the inversion in the short end of the curve contrasts with the flat curve observed before the spread of the virus, which indicates that market participants continue to expect some further reductions in policy rates.
3 The methodology for computing the EONIA changed on 2 October 2019; it is now calculated as the €STR
plus a fixed spread of 8.5 basis points. See the box entitled “Goodbye EONIA, welcome €STR!”, Economic Bulletin, Issue 7, ECB, 2019.
4 For details on the period up to 5 May 2020, see the box entitled “Liquidity conditions and monetary policy operations in the period from 29 January to 5 May 2020” in this issue of the Economic Bulletin.

ECB Economic Bulletin, Issue 4 / 2020 – Economic and monetary developments Financial developments
16
Chart 4 EONIA forward rates
(percentages per annum)
Sources: Thomson Reuters and ECB calculations.
Despite the further monetary policy accommodation provided via the PEPP and other measures, long-term sovereign bond yields in the euro area increased over the review period (see Chart 5). The GDP-weighted euro area ten-year sovereign bond yield increased by 36 basis points to 0.24%. Sovereign yields were affected by the overall increase in risk-free rates over the review period. In addition, increases in sovereign spreads over risk-free rates also pushed up the ten-year GDP-weighted sovereign bond yield over the review period. In contrast to rising euro area sovereign bond yields, ten-year sovereign bond yields in the United States decreased to 0.75% (down 13 basis points) and remained stable in the United Kingdom at 0.28% (up 1 basis point).
-0.75
-0.50
-0.25
0.00
0.25
2019 2020 2021 2022 2023 2024 2025 2026 2027
Realised EONIAEONIA forward curve 3 June 2020EONIA forward curve 11 March 2020

ECB Economic Bulletin, Issue 4 / 2020 – Economic and monetary developments Financial developments
17
Chart 5 Ten-year sovereign bond yields
(percentages per annum)
Sources: Thomson Reuters and ECB calculations. Notes: Daily data. The vertical grey lines denote (from left to right) the March Governing Council meeting (12 March 2020), the PEPP announcement (18 March 2020), the German Federal Constitutional Court ruling (5 May 2020), the Franco-German proposal for a €500 billion European recovery fund (18 May 2020) and the European Commission proposal for a €750 billion “Next Generation EU” recovery instrument (27 May 2020). The latest observations are for 3 June 2020.
The spreads of euro area sovereign bonds relative to overnight index swap (OIS) rates narrowed following the announcement of the PEPP, but remain above the values observed at the time of the Governing Council meeting of 12 March (see Chart 6). The ten-year German, French, Italian, Spanish and Portuguese sovereign spreads increased by 20, 16, 14, 18 and 5 basis points to reach -0.12, 0.24, 1.78, 0.85 and 0.82 percentage points respectively. Consequently, the GDP-weighted euro area ten-year sovereign spread increased by 16 basis points to 0.47 percentage points. This overall increase is accompanied by some volatility. Sovereign rating actions such as the downgrade of Italy from BBB to BBB- by Fitch on 28 April, the German Federal Constitutional Court ruling regarding the public sector purchase programme and hesitant progress vis-à-vis the financing of a common fiscal response to the coronavirus contributed to a widening of most spreads. Most recently, sovereign spreads declined for France, Italy, Spain and Portugal against the backdrop of the Franco-German recovery fund proposal and the European Commission’s “Next Generation EU” proposal.
-1.0
-0.5
0.0
0.5
1.0
1.5
2.0
2.5
3.0
3.5
01/15 07/15 01/16 07/16 01/17 07/17 01/18 07/18 01/19 07/19 01/20
GDP-weighted euro area average United Kingdom United States Germany10-year euro area OIS
-1.0
-0.5
0.0
0.5
1.0
1.5
2.0
2.5
3.0
3.5
02/20 04/20 06/20

ECB Economic Bulletin, Issue 4 / 2020 – Economic and monetary developments Financial developments
18
Chart 6 Ten-year euro area sovereign bond spreads vis-à-vis the OIS rate
(percentage points)
Sources: Thomson Reuters and ECB calculations. Notes: The spread is calculated by subtracting the ten-year OIS rate from the ten-year sovereign bond yield. The vertical grey lines denote (from left to right) the March Governing Council meeting (12 March 2020), the PEPP announcement (18 March 2020), the German Federal Constitutional Court ruling (5 May 2020), the Franco-German proposal for a €500 billion European recovery fund (18 May 2020) and the European Commission proposal for a €750 billion “Next Generation EU” recovery instrument (27 May 2020). The latest observations are for 3 June 2020.
Equity price indices for euro area non-financial corporations (NFCs) increased, recouping a significant share of the losses registered in February and March (see Chart 7). Equity prices of euro area NFCs increased by 14% over the review period, supported by a recovery in risk sentiment and the perception that tail risks of an imminent global crisis have faded to some extent. The recovery in risk sentiment more than offset other factors which weighed on equity prices, such as a reduction in earnings growth expectations at all horizons.5 Globally, the rebound was strongest for US NFCs, with equity prices increasing by 16%. By contrast, bank equity prices in the euro area decreased by 5% over the review period, while they increased by 8% in the United States.
5 For more details, see the box entitled “Coronavirus (COVID-19): market fear as implied by options prices”
in this issue of the Economic Bulletin.
-1.0
-0.5
0.0
0.5
1.0
1.5
2.0
2.5
3.0
3.5
4.0
01/15 07/15 01/16 07/16 01/17 07/17 01/18 07/18 01/19 07/19 01/20
GDP-weighted euro area average GermanyFranceItalySpainPortugal
-1.0
-0.5
0.0
0.5
1.0
1.5
2.0
2.5
3.0
3.5
4.0
02/20 04/20 06/20

ECB Economic Bulletin, Issue 4 / 2020 – Economic and monetary developments Financial developments
19
Chart 7 Euro area and US equity price indices
(index: 1 January 2015 = 100)
Sources: Thomson Reuters and ECB calculations. Notes: The vertical grey line denotes the start of the review period on 12 March 2020. The latest observations are for 3 June 2020.
Euro area corporate bond spreads widened until mid-March but have since partly reverted following the adoption of the PEPP (see Chart 8). Spreads on investment-grade NFC bonds and financial sector bonds relative to the risk-free rate increased by 81 and 112 basis points, respectively, between the beginning of the review period and 24 March to reach an intra-period high of 185 and 239 basis points. Since then, corporate bond spreads have been slowly declining to reach 121 and 146 basis points. Overall, the widening largely reflects an increase in excess bond premia, but credit fundamentals, as measured by ratings and expected default frequencies, have also deteriorated.
Chart 8 Euro area corporate bond spreads
(basis points)
Sources: Markit iBoxx indices and ECB calculations. Notes: Spreads are calculated as asset swap spreads to the risk-free rate. The indices comprise bonds of different maturities (but at least one year remaining) with an investment-grade rating. The vertical grey line denotes the start of the review period on 12 March 2020. The latest observations are for 3 June 2020.
25
50
75
100
125
150
175
01/15 07/15 01/16 07/16 01/17 07/17 01/18 07/18 01/19 07/19 01/20
Euro area banksEuro area NFCs US banks US NFCs
0
50
100
150
200
250
01/15 07/15 01/16 07/16 01/17 07/17 01/18 07/18 01/19 07/19 01/20
Financial corporate bond spreadsNFC bond spreads

ECB Economic Bulletin, Issue 4 / 2020 – Economic and monetary developments Financial developments
20
In foreign exchange markets, the euro was broadly unchanged in trade-weighted terms (see Chart 9). The nominal effective exchange rate of the euro, as measured against the currencies of 38 of the euro area’s most important trading partners, appreciated by 0.4% over the review period. Regarding bilateral exchange rate developments, the euro appreciated against most major currencies, in particular the Japanese yen (by 4.0%) and the Swiss franc (by 2.3%). The euro also appreciated vis-à-vis the currencies of Brazil, Turkey and the majority of currencies of non-euro area EU Member States. These developments were partially offset by a slight depreciation against the US dollar (by 0.4%). The euro fell against the Russian rouble (by 8.4%) and the Swedish krona (by 4.0%), reversing to some extent an earlier strong appreciation following the uncertainty triggered by the COVID-19 pandemic.
Chart 9 Changes in the exchange rate of the euro vis-à-vis selected currencies
(percentage changes)
Source: ECB. Notes: EER-38 is the nominal effective exchange rate of the euro against the currencies of 38 of the euro area’s most important trading partners. A positive (negative) change corresponds to an appreciation (depreciation) of the euro. All changes have been calculated using the foreign exchange rates prevailing on 3 June 2020.
-10 -5 0 5 10 15 20 25 30 35
Croatian kunaIndian rupeeBrazilian realTaiwan dollarRomanian leuDanish krone
Hungarian forintIndonesian rupiahSouth Korean won
Turkish liraRussian roubleSwedish kronaCzech koruna
Polish zlotyJapanese yen
Swiss francPound sterling
US dollarChinese renminbi
EER-38
Since 12 March 2020Since 3 June 2019

ECB Economic Bulletin, Issue 4 / 2020 – Economic and monetary developments Economic activity
21
3 Economic activity
Euro area real GDP growth declined on an unprecedented scale in the first quarter of 2020, in a context of stringent lockdown measures implemented by euro area countries to contain the spread of the coronavirus (COVID-19). Although high-frequency indicators and the latest survey results have recently pointed to some modest improvements in levels of economic activity as countries have started to relax their lockdown measures, the severe impact on activity in April and May point to a further decline in the second quarter of 2020. Looking ahead, a rebound in euro area economic activity is expected in the second half of 2020, supported by favourable financing conditions, an expansionary fiscal stance and a resumption in global activity, although the overall speed and scale of the rebound remain highly uncertain. In the baseline scenario of the June 2020 Eurosystem staff macroeconomic projections for the euro area, annual real GDP is expected to fall by 8.7% in 2020 and to rebound by 5.2% in 2021 and by 3.3% in 2022. Compared with the March 2020 ECB staff macroeconomic projections, the outlook for real GDP growth has been revised substantially downwards by 9.5 percentage points in 2020 and revised upwards by 3.9 percentage points in 2021 and 1.9 percentage points in 2022.
Euro area activity saw an unprecedented fall in the first quarter of 2020, amid COVID-19 containment measures and the associated extreme uncertainty. Real GDP declined by a record 3.8%, in quarter-on-quarter terms, in the first quarter of 2020, in a context of stringent lockdown policies implemented by most euro area countries from mid-March onwards. The contraction caused by COVID-19 was heterogeneous across countries and sectors. Among the largest euro area economies, there were stronger declines in economic activity in France, Italy and Spain than in Germany and the Netherlands. Economic growth in euro area countries in the first quarter of 2020 was negatively correlated with the restrictiveness of social distancing measures and the lockdowns to contain the spread of COVID-19 (Chart 10). Overall, the impact of the lockdown measures translated into a marked contraction in euro area industrial production, which declined by an unprecedented 11.3%, month on month, in March 2020, and by 3.3% in quarter-on-quarter terms in the first quarter of 2020. Similarly, capacity utilisation dropped sharply by 11 percentage points to 69.7% in the manufacturing sector and by around 5 percentage points to 85.6% in the services sector, according to survey data for the first quarter of 2020.

ECB Economic Bulletin, Issue 4 / 2020 – Economic and monetary developments Economic activity
22
Chart 10 Real GDP and COVID-19 government response stringency in the first quarter of 2020
(quarter-on-quarter percentage changes and weighted stringency index)
Sources: Eurostat, Oxford COVID-19 Government Response Tracker and ECB calculations. Note: The daily index for each country is weighted by the number of days at different stringency levels in the first quarter of 2020. In this chart, the euro area represents a daily, GDP-weighted average of countries for which data are available.
Euro area labour markets have been severely affected by COVID-19 containment measures. Employment declined by 0.2% in the first quarter of 2020, following an increase of 0.3% in the fourth quarter of 2019. The muted decline in employment is mostly explained by policy measures6, such as the introduction of short-time work schemes and a complementary policy package aimed at preventing redundancies and supporting self-employed workers. Short-time work schemes limit increases in the number of unemployed workers while allowing for an increase in the flexibility of the labour market to face cyclical fluctuations. At the current juncture, this involves a substantial reduction in hours worked per person employed for a predetermined length of time.7 The decline in employment recorded during the first quarter of 2020 is therefore less than the decline in GDP, implying a marked 3.5% decline in labour productivity per person employed in the first quarter of 2020.
Recent short-term labour market indicators point to a sharp deterioration in the labour market, while the slight increase in the unemployment rate also reflects statistical issues linked to the lockdowns and the mitigating impact of the unprecedented policy measures to support employment. The euro area unemployment rate increased to 7.3% in April 2020, from 7.1% in March. The increase in the unemployment rate does not fully capture the adverse impact of the pandemic, as it reflects the impact of the COVID-19 containment policies on the labour market (with lockdowns implemented in various countries only by mid-March), the adoption of labour market policies to bolster employment and prevent permanent lay-offs, and statistical classification issues during the lockdown period. Recent survey outcomes provide a more timely indication of labour market developments and suggest that the labour market is now deep in contractionary territory. There was, however, a limited
6 For an assessment of the response of labour market variables to the great financial crisis from a regional
perspective, see the box entitled “Regional labour market developments during the great financial crisis and subsequent recovery” in this issue of the Economic Bulletin.
7 For more details, see the box entitled “Short-time work schemes and their effects on wages and disposable income” in this issue of the Economic Bulletin.
AT
BE
CY
DE
EE
ES
FI
FR IT
NL
PTSI
SK
EA
-6
-5
-4
-3
-2
-1
0
0 5 10 15 20 25 30
GD
P
Weighted stringency index

ECB Economic Bulletin, Issue 4 / 2020 – Economic and monetary developments Economic activity
23
rebound in May 2020, reflecting some initial easing of the lockdown measures during that month (Chart 11).
Chart 11 Euro area employment, PMI assessment of employment and unemployment
(quarter-on-quarter percentage changes; diffusion index; percentages of the labour force)
Sources: Eurostat, Markit and ECB calculations. Notes: The Purchasing Managers' Index (PMI) is expressed as a deviation from 50 divided by 10. The latest observations are for the first quarter of 2020 for employment, May 2020 for the PMI and April 2020 for the unemployment rate.
A large share of private consumption has collapsed since mid-March. Euro area retail trade declined by 11%, month on month, in March 2020. These data only partly reflect the drop in spending during the lockdowns, which were only introduced in mid-March in most euro area countries. Monthly retail sales in April dropped further by 12%, month on month, with an almost complete collapse in other expenditure categories such as cars and holidays. In May 2020 euro area consumer confidence started to bottom out as lockdowns were gradually relaxed. While the drop in household income has been limited, the saving ratio is likely to rise sharply.8 This reflects standard channels such as (countercyclical) precautionary savings and credit constraints, but there is some evidence that it is also driven by “forced savings”. Households whose income was unaffected started to accumulate significant bank deposits, as they were unable to buy non-essential goods and services.9 Accumulated savings could finance a strong rebound in non-essential consumption in the second half of 2020. However, this is highly dependent on the remaining uncertainty surrounding the health crisis and labour market conditions, which could lead to further precautionary savings.
Business investment is expected to have contracted in the first quarter of 2020 to a larger extent than GDP, and a further decline is expected in the second quarter. Faced with severe supply disruptions since mid-March owing to the outbreak of COVID-19 in Europe, the production of capital goods in the euro area fell by 6.4%, quarter on quarter, in the first quarter of 2020 and capacity utilisation also contracted.
8 See also the box entitled “Short-time work schemes and their effects on wages and disposable income”
in this issue of the Economic Bulletin. 9 See “L’impact de la crise du Covid-19 sur la situation financière des ménages et des entreprises”,
Banque de France, 2020.
7
8
9
10
11
12
13
-1.8
-1.4
-1.0
-0.6
-0.2
0.2
0.6
2013 2014 2015 2016 2017 2018 2019 2020
Employment (left-hand scale)PMI assessment of employment (left-hand scale)Unemployment rate (right-hand scale)

ECB Economic Bulletin, Issue 4 / 2020 – Economic and monetary developments Economic activity
24
Non-construction investment declined, in quarter-on-quarter terms, by 4.1% in Germany, 9.3% in France (referring to investment by non-financial corporations), 8.3% in Italy, 2.4% in Spain and 6.6% in the Netherlands. Furthermore, the latest euro area bank lending survey10 shows a large increase in euro area firms’ demand for loans and credit lines in the first quarter of 2020, as companies used bank financing to secure emergency liquidity to cover ongoing payments (e.g. rents and salaries) amid a collapse in revenues. At the same time, demand for loans for investment purposes declined strongly. Going forward, the sharp declines in confidence and production expectations and falls in order books and sales in the capital goods sector in April, together with prevailing elevated uncertainty, point to a pronounced contraction in investment in fixed capital in the second quarter.
Following a marked deterioration in the first quarter of 2020, euro area housing investment may experience an even larger contraction in the second quarter. Looking at the available country data for the first quarter, construction investment experienced major declines in France (-13.8%, quarter on quarter), Italy (-7.9%) and Spain (-9.6%), while it surprisingly improved in Germany (4.1%) and the Netherlands (5.6%). This evidence points to a major decline in euro area housing investment in the first quarter. As the survey-based Purchasing Managers’ Index (PMI) for residential construction output and the European Commission’s indicator for construction confidence plummeted in April, the deterioration in euro area housing markets may even intensify in the second quarter. On the supply side, construction activity has been limited, as lockdown measures have led to the closure of construction sites in several countries and the cost of materials has increased. On the demand side, this deterioration has been accompanied by a sharp decline in the European Commission’s indicator of intentions to spend on renovations as well as the demand for housing loans according to the euro area bank lending survey. This weakening demand has affected even those countries which have implemented the least stringent lockdown measures, such as Germany and the Netherlands.
The contraction in euro area trade is expected to have steepened in the second quarter of 2020. In the first quarter, intra-euro area trade in goods contracted more than extra-euro area trade as a result of the COVID-19 containment measures adopted by euro area countries. An unprecedented decline is expected for the second quarter of 2020, as suggested by the collapse of the new export orders index to 18.9 in April (compared with 49.5 at the beginning of 2020). The same leading indicator’s recovery to 28.7 in May points to early signs of a very gradual expansion thereafter. Euro area trade is particularly exposed to the COVID-19 shock owing to some specific features. First, Europe is an important tourist destination, accounting for 30% of global tourism receipts. Consequently, the region has been particularly affected by travel bans, restrictions on movement and lockdown measures. The implications are, of course, most severe in euro area countries where tourism accounts for a large share of GDP. Second, the extraordinary degree of uncertainty and the ensuing postponement of investment decisions have weighed in particular on trade in durables, a core component of euro area exports. Third, spillover and spillback effects via regional production networks transmit and magnify shocks across euro area
10 See also “The euro area bank lending survey – First quarter of 2020”, ECB, April 2020.
ECB Economic Bulletin, Issue 4 / 2020 – Economic and monetary developments Economic activity
25
economies, and may lead to a sharper contraction in intra-euro area flows than in total trade flows.
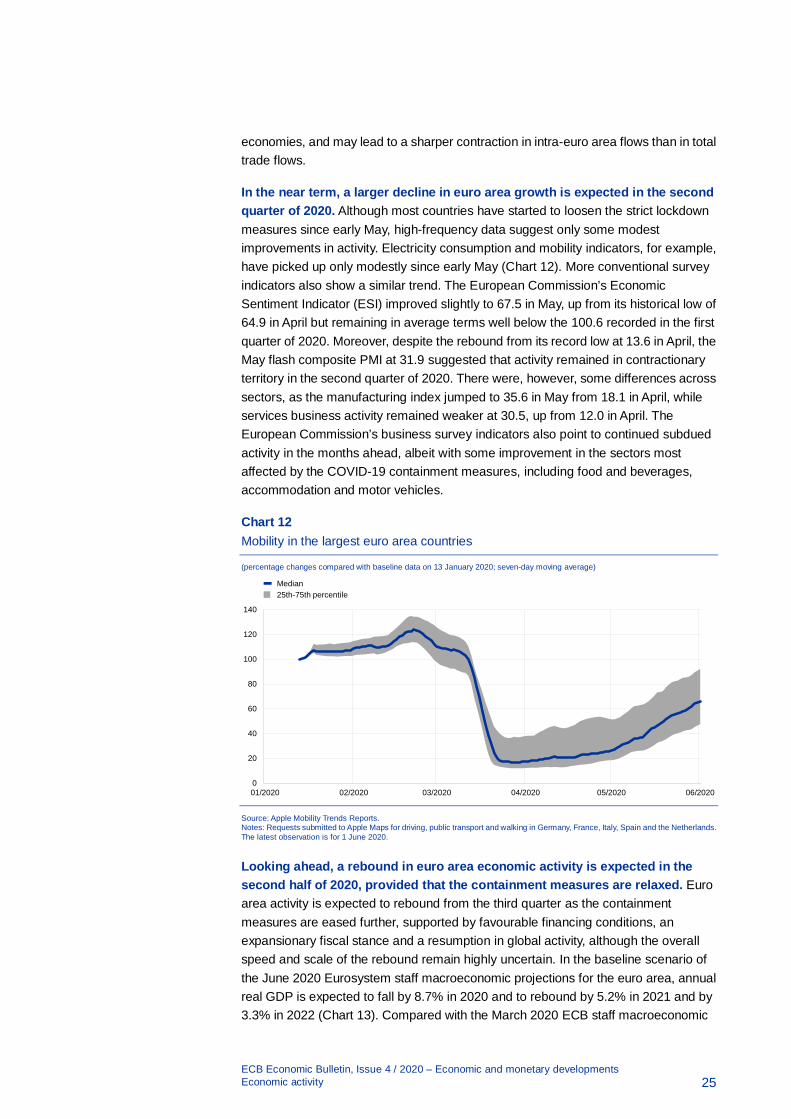
In the near term, a larger decline in euro area growth is expected in the second quarter of 2020. Although most countries have started to loosen the strict lockdown measures since early May, high-frequency data suggest only some modest improvements in activity. Electricity consumption and mobility indicators, for example, have picked up only modestly since early May (Chart 12). More conventional survey indicators also show a similar trend. The European Commission’s Economic Sentiment Indicator (ESI) improved slightly to 67.5 in May, up from its historical low of 64.9 in April but remaining in average terms well below the 100.6 recorded in the first quarter of 2020. Moreover, despite the rebound from its record low at 13.6 in April, the May flash composite PMI at 31.9 suggested that activity remained in contractionary territory in the second quarter of 2020. There were, however, some differences across sectors, as the manufacturing index jumped to 35.6 in May from 18.1 in April, while services business activity remained weaker at 30.5, up from 12.0 in April. The European Commission’s business survey indicators also point to continued subdued activity in the months ahead, albeit with some improvement in the sectors most affected by the COVID-19 containment measures, including food and beverages, accommodation and motor vehicles.
Chart 12 Mobility in the largest euro area countries
(percentage changes compared with baseline data on 13 January 2020; seven-day moving average)
Source: Apple Mobility Trends Reports. Notes: Requests submitted to Apple Maps for driving, public transport and walking in Germany, France, Italy, Spain and the Netherlands. The latest observation is for 1 June 2020.
Looking ahead, a rebound in euro area economic activity is expected in the second half of 2020, provided that the containment measures are relaxed. Euro area activity is expected to rebound from the third quarter as the containment measures are eased further, supported by favourable financing conditions, an expansionary fiscal stance and a resumption in global activity, although the overall speed and scale of the rebound remain highly uncertain. In the baseline scenario of the June 2020 Eurosystem staff macroeconomic projections for the euro area, annual real GDP is expected to fall by 8.7% in 2020 and to rebound by 5.2% in 2021 and by 3.3% in 2022 (Chart 13). Compared with the March 2020 ECB staff macroeconomic
0
20
40
60
80
100
120
140
01/2020 02/2020 03/2020 04/2020 05/2020 06/2020
Median25th-75th percentile

ECB Economic Bulletin, Issue 4 / 2020 – Economic and monetary developments Economic activity
26
projections, the outlook for real GDP growth has been revised substantially downwards by 9.5 percentage points in 2020 and revised upwards by 3.9 percentage points in 2021 and 1.9 percentage points in 2022. Nevertheless, elevated global uncertainty around the implementation of post-lockdown plans and the extent of the contraction and subsequent recovery will depend crucially on the duration and the effectiveness of the containment measures, the success of policies to mitigate the adverse impact on incomes and employment, and the extent to which supply capacity and domestic demand are permanently affected. In this context, two alternative scenarios illustrate the potential impact of the COVID-19 pandemic in addition to the Eurosystem staff baseline macroeconomic projections. Under the mild scenario, which assumes that the virus is successfully contained, annual real GDP would decline by 5.9% in 2020, before rebounding by 6.8% in 2021 and increasing by 2.2% in 2022. In the severe scenario, involving a strong resurgence of the pandemic and the implementation of further containment measures, annual real GDP would fall by 12.6% in 2020, rebound by 3.3% in 2021 and increase by 3.8% in 2022.11
Chart 13 Euro area real GDP (including projections)
(quarter-on-quarter percentage changes)
Sources: Eurostat and the article entitled “Eurosystem staff macroeconomic projections for the euro area, June 2020”, published on the ECB’s website on 4 June 2020.
11 See the box entitled “Alternative scenarios for the euro area economic outlook” in the article entitled
“Eurosystem staff macroeconomic projections for the euro area, June 2020”.
-15.00
-10.00
-5.00
0.00
5.00
10.00
2013 2014 2015 2016 2017 2018 2019 2020 2021 2022

ECB Economic Bulletin, Issue 4 / 2020 – Economic and monetary developments Prices and costs
27
4 Prices and costs
According to Eurostat’s flash estimate, euro area annual HICP inflation decreased to 0.1% in May 2020, from 0.3% in April. On the basis of current and futures prices for oil, headline inflation is likely to decline somewhat further over the coming months and remain subdued until the end of the year. Over the medium term, weaker demand will put downward pressure on inflation, which will be only partially offset by upward pressures related to supply constraints. This assessment is also broadly reflected in the June 2020 Eurosystem staff macroeconomic projections for the euro area, which foresee annual HICP inflation at 0.3% in 2020, 0.8% in 2021 and 1.3% in 2022. Compared with the March 2020 ECB staff macroeconomic projections, the outlook for HICP inflation has been revised down by 0.8, 0.6 and 0.3 percentage points respectively. Annual HICP inflation excluding energy and food is expected to be 0.8% in 2020, 0.7% in 2021 and 0.9% in 2022.
According to Eurostat’s flash estimate, HICP inflation continued to decrease in May. The decrease from 0.3% in April to 0.1% in May reflected mainly a decline in energy and unprocessed food price inflation, while HICP inflation excluding energy and food remained broadly unchanged. Falling energy price inflation remained the main driver of inflation dynamics, still reflecting the sharp drop in oil prices after the onset of the global coronavirus (COVID-19) pandemic. In contrast, food price inflation – in particular unprocessed food price inflation – has surged in the context of the various COVID-19 containment measures. In April it increased to 3.6% and, while it fell back somewhat, to 3.3% in May, it is still at a high level. According to Eurostat, there continued to be price data collection difficulties for some countries and some products, leading to a higher share of imputations than usual. However, this imputation share declined in May, compared with April: prices of around one-quarter of the underlying basket for the euro area HICP flash estimate were imputed owing to the COVID-19 crisis, compared with around one-third in April.12
12 See the Eurostat press release on the HICP flash estimate for May 2020 and Eurostat’s HICP
methodology.
ECB Economic Bulletin, Issue 4 / 2020 – Economic and monetary developments Prices and costs
28
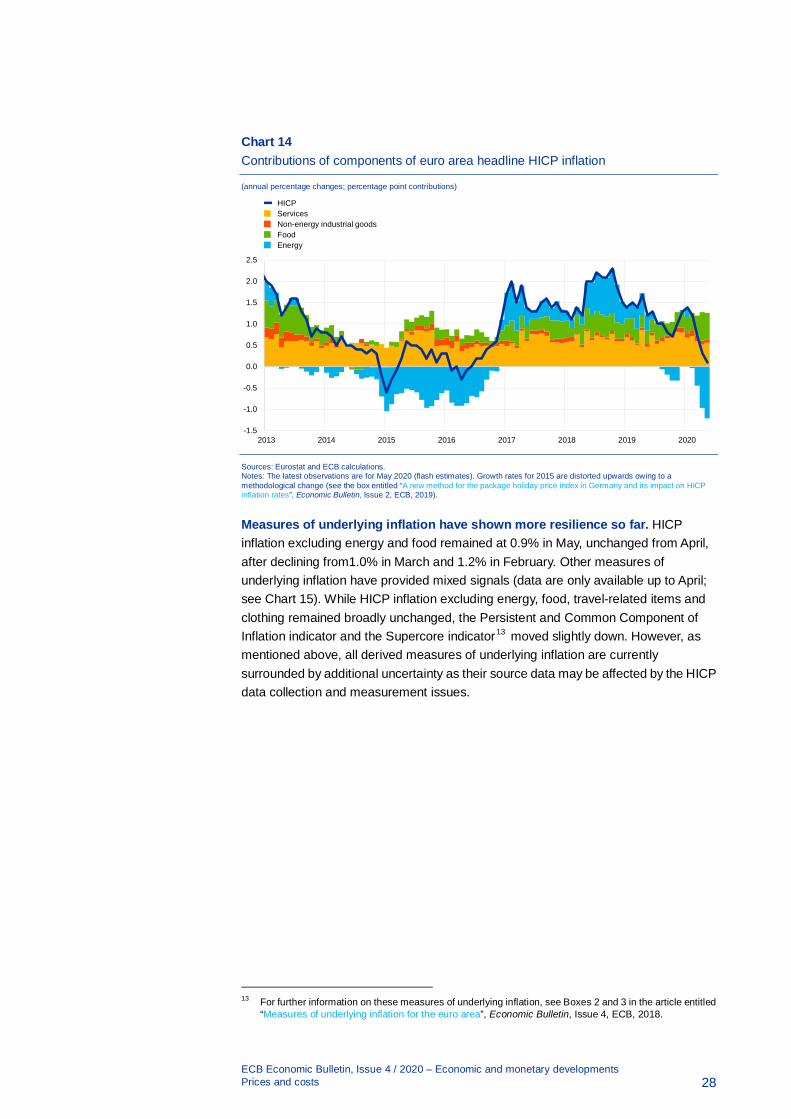
Chart 14 Contributions of components of euro area headline HICP inflation
(annual percentage changes; percentage point contributions)
Sources: Eurostat and ECB calculations. Notes: The latest observations are for May 2020 (flash estimates). Growth rates for 2015 are distorted upwards owing to a methodological change (see the box entitled “A new method for the package holiday price index in Germany and its impact on HICP inflation rates”, Economic Bulletin, Issue 2, ECB, 2019).
Measures of underlying inflation have shown more resilience so far. HICP inflation excluding energy and food remained at 0.9% in May, unchanged from April, after declining from1.0% in March and 1.2% in February. Other measures of underlying inflation have provided mixed signals (data are only available up to April; see Chart 15). While HICP inflation excluding energy, food, travel-related items and clothing remained broadly unchanged, the Persistent and Common Component of Inflation indicator and the Supercore indicator13 moved slightly down. However, as mentioned above, all derived measures of underlying inflation are currently surrounded by additional uncertainty as their source data may be affected by the HICP data collection and measurement issues.
13 For further information on these measures of underlying inflation, see Boxes 2 and 3 in the article entitled
“Measures of underlying inflation for the euro area”, Economic Bulletin, Issue 4, ECB, 2018.
-1.5
-1.0
-0.5
0.0
0.5
1.0
1.5
2.0
2.5
2013 2014 2015 2016 2017 2018 2019 2020
HICPServicesNon-energy industrial goods FoodEnergy

ECB Economic Bulletin, Issue 4 / 2020 – Economic and monetary developments Prices and costs
29
Chart 15 Measures of underlying inflation
(annual percentage changes)
Sources: Eurostat and ECB calculations. Notes: The latest observations are for May 2020 for the HICP excluding energy and food (flash estimate) and for April 2020 for all other measures. The range of measures of underlying inflation consists of the following: HICP excluding energy; HICP excluding energy and unprocessed food; HICP excluding energy and food; HICP excluding energy, food, travel-related items and clothing; the 10% trimmed mean of the HICP; the 30% trimmed mean of the HICP; and the weighted median of the HICP. Growth rates for the HICP excluding energy and food for 2015 are distorted upwards owing to a methodological change (see the box entitled “A new method for the package holiday price index in Germany and its impact on HICP inflation rates”, Economic Bulletin, Issue 2, ECB, 2019).
Pipeline price pressures for the HICP non-energy industrial goods component indicate some weakening at the later stages of the supply chain. Producer price inflation for domestic sales of non-food consumer goods, which is an indicator of price pressures at the later stages of the supply chain, fell further to 0.5%, year on year, in April, from 0.6% in March and 0.7% in February. The corresponding annual rate of import price inflation decreased to 0.1% in March, after 0.5% in the previous month, which may in part reflect some downward pressure from the recent appreciation of the euro effective exchange rate. Earlier in the domestic pricing chain, intermediate goods price inflation weakened sharply, reflecting the pass-through of lower oil prices as well as the effects of a stronger euro. For intermediate goods, producer price inflation declined to -2.7% in April, from -1.8% in March and -1.2% in February, while import price inflation fell sharply to -1.3% in March, after -0.1% in February.
Wage growth declined. Annual growth in compensation per employee stood at 1.7% in the fourth quarter of 2019, down from 2.1% in the third quarter (see Chart 16). Looking ahead, the impact on wage growth measures from labour market policies activated in response to the pandemic, such as short-time work schemes, will depend on how such schemes are treated in official statistics.14 Annual growth in negotiated wages in the euro area stood at 2.0% in the first quarter of 2020, slightly down from 2.1% in the fourth quarter of 2019. Negotiated wage growth may be holding up so far because it reflects agreements made in the past, while any changes in actual wage growth will show in corresponding wage drift.
14 For more information, see the box entitled “Short-time work schemes and their effects on wages and
disposable income” in this issue of the Economic Bulletin.
0.0
0.5
1.0
1.5
2.0
2.5
3.0
2013 2014 2015 2016 2017 2018 2019 2020
HICP excluding energy and foodHICP excluding energy, food, travel-related items and clothingSupercore
Range of measuresPCCI

ECB Economic Bulletin, Issue 4 / 2020 – Economic and monetary developments Prices and costs
30
Chart 16 Contributions of components of compensation per employee
(annual percentage changes; percentage point contributions)
Sources: Eurostat and ECB calculations. Note: The latest observations are for the first quarter of 2020 for negotiated wages and the fourth quarter of 2019 for the other components.
After falling to historical lows around mid-March, market-based indicators of longer-term inflation expectations recovered to stand slightly above the level prevailing at the beginning of the review period, thus remaining very subdued (see Chart 17). After reaching an all-time low of 0.72% on 23 March 2020, the five-year forward inflation-linked swap rate five years ahead recovered somewhat to stand at 1.02% on 3 June 2020. The option-implied (risk-neutral) probability of deflation occurring over the next five years spiked to unprecedented levels in March 2020. Despite some recent improvement, this measure remains around the highs observed in 2015-16. Part of the increase in this probability reflects the recent large decreases in the price of oil. At the same time, the forward profile of market-based indicators of inflation expectations continues to indicate a prolonged period of low inflation. According to the ECB Survey of Professional Forecasters for the second quarter of 2020, conducted in the first week of April 2020, as well as the latest releases from Consensus Economics and the Euro Zone Barometer, survey-based longer-term inflation expectations remained at or close to historically low levels in April.
-1.5
-1.0
-0.5
0.0
0.5
1.0
1.5
2.0
2.5
3.0
2013 2014 2015 2016 2017 2018 2019 2020
Compensation per employee growth Negotiated wages Social security contributions Wage drift

ECB Economic Bulletin, Issue 4 / 2020 – Economic and monetary developments Prices and costs
31
Chart 17 Market-based indicators of inflation expectations
(annual percentage changes)
Sources: Thomson Reuters and ECB calculations. Note: The latest observations are for 3 June 2020.
The June 2020 Eurosystem staff macroeconomic projections foresee a significantly weaker outlook for inflation over the projection horizon. The baseline projections expect headline HICP inflation to average 0.3% in 2020, 0.8% in 2021 and 1.3% in 2022. These represent downward revisions of 0.8, 0.6 and 0.3 percentage points respectively, compared with the March 2020 ECB staff macroeconomic projections (see Chart 18). In the short term, the recent collapse in oil prices implies a sharp drop in headline HICP inflation to levels around zero for the coming quarters, before base effects in the energy component cause a mechanical rebound in early 2021. HICP inflation excluding energy and food is also expected to decline over the short term but by less than headline inflation. Disinflationary effects are expected to be broad-based across the prices of services and goods as demand will remain weak. However, these effects are expected to be offset, in part, by cost pressures related to supply-side disruptions and shortages. Over the medium term, inflation is expected to increase as the oil price is assumed to pick up and as demand recovers. HICP inflation excluding energy and food is expected to decline to 0.8% on average in 2020 and to fall further to 0.7% in 2021, before increasing to 0.9% in 2022. Finally, given the high level of uncertainty, two alternative scenarios for inflation have been prepared by Eurosystem staff.15 Under the mild scenario, headline inflation would reach 1.7% by 2022 while, under the corresponding severe scenario, headline inflation would be 0.9% at the end of the projection horizon.
15 For more details, see the box entitled “Alternative scenarios for the euro area economic outlook” in the
article entitled “Eurosystem staff macroeconomic projections for the euro area, June 2020”, published on the ECB’s website on 4 June 2020.
0.0
0.5
1.0
1.5
2.0
2.5
3.0
2013 2014 2015 2016 2017 2018 2019 2020
One-year rate one year ahead One-year rate two years ahead One-year rate four years ahead One-year rate nine years ahead Five-year rate five years ahead

ECB Economic Bulletin, Issue 4 / 2020 – Economic and monetary developments Prices and costs
32
Chart 18 Euro area HICP inflation (including projections)
(annual percentage changes)
Sources: Eurostat and the article entitled “Eurosystem staff macroeconomic projections for the euro area, June 2020”, published on the ECB’s website on 4 June 2020. Notes: The latest observations are for the first quarter of 2020 (data) and the fourth quarter of 2022 (projection). The ranges shown around the central projections are based on the differences between actual outcomes and previous projections carried out over a number of years. The width of the ranges is twice the average absolute value of these differences. The method used for calculating the ranges, involving a correction for exceptional events, is documented in the “New procedure for constructing Eurosystem and ECB staff projection ranges”, ECB, December 2009. The cut-off date for data included in the projections was 25 May 2020.
-0.5
0.0
0.5
1.0
1.5
2.0
2.5
2013 2014 2015 2016 2017 2018 2019 2020 2021 2022

ECB Economic Bulletin, Issue 4 / 2020 – Economic and monetary developments Money and credit
33
5 Money and credit
The coronavirus (COVID-19) pandemic caused a sharp acceleration in monetary dynamics, driven by the acute liquidity needs of firms to finance ongoing payments and a strong preference for liquidity for precautionary reasons among economic agents owing to the great uncertainty surrounding the pandemic. Domestic credit was the main source of money creation, driven by loans to non-financial corporations (NFCs) and net purchases of government bonds by monetary financial institutions (MFIs). The timely and sizeable measures by monetary, fiscal and supervisory authorities supported the extension of bank credit on favourable terms to the euro area economy. This also buoyed euro area firms’ total external financing in the first quarter of 2020, while market-based financing was more modest, as the cost of market-based debt increased significantly in the first quarter. Bank lending rates reached historical lows, which kept firms’ overall cost of debt financing favourable.
Precautionary liquidity holdings and acute liquidity needs led to a strong acceleration in monetary dynamics. The annual growth rate of M3 surged further to 8.3% in April, from 7.5% in March, and was around 3 percentage points above the growth rate in February, i.e. before the wider spread of the COVID-19 pandemic in the euro area (see Chart 19). This increase was on account of large monthly flows in March (which saw the largest flows since the beginning of Stage Three of Economic and Monetary Union) and in April. Monetary dynamics were driven by a combination of factors, including liquidity needs of firms, a preference for holding liquidity for precautionary reasons in a period of great uncertainty, and the need among institutional investors for liquidity buffers to cope with possible redemptions. High money growth was also the result of sizeable support measures from monetary and fiscal policymakers and regulatory and supervisory authorities to ensure sufficient liquidity in the economy to deal with the COVID-19 pandemic. In this environment, the annual growth rate of the most liquid monetary aggregate, M1, which comprises overnight deposits and currency in circulation, reached 11.9% in April, after 10.4% in March, and was almost 4 percentage points higher than in February.
Overnight deposits remained the main contributor to money growth. The annual growth rate of overnight deposits increased to 12.5% in April, from 10.9% in March. The growth in deposits was mainly driven by deposit holdings of firms. This accumulation of deposits, which reflects a precautionary build-up of liquidity buffers given the great uncertainty surrounding the pandemic, was the result of substantial borrowing from banks, issuance of corporate bonds and, to some extent, direct liquidity support from governments. At the same time, there is heterogeneity in deposit holdings of firms across jurisdictions which may hint at differences in the extent to which the liquidity needs of firms have already materialised, partly related to differences in the timing of the spread of the pandemic across countries. Both financial intermediaries other than MFIs (which includes investment funds) and households also increased their deposit holdings, the former to build up their liquidity buffers in case of redemptions and the latter mainly for precautionary reasons, but also owing to more limited opportunities to consume during the lockdown period. The annual growth rate of currency in circulation increased further to 8.0% in April, up from 7.0% in March, reflecting the tendency to hoard cash in a period of great uncertainty.

ECB Economic Bulletin, Issue 4 / 2020 – Economic and monetary developments Money and credit
34
Marketable instruments (i.e. M3 minus M2) contributed negatively overall to monthly M3 dynamics in April. Following outflows from money market funds and an increase in holdings by non-monetary financial institutions (non-MFIs) of short-term debt securities issued by banks in March, these portfolio shifts were partly reversed in April.
Chart 19 M3, M1 and loans to the private sector
(annual percentage changes; adjusted for seasonal and calendar effects)
Source: ECB. Notes: Loans are adjusted for loan sales, securitisation and notional cash pooling. The latest observations are for April 2020.
Domestic credit to both the private and the public sector fuelled money creation. Following a marked rise in March, the annual growth rate of credit to the private sector increased somewhat further in April (see the blue portion of the bars in Chart 20) on account of sizeable loan growth to firms as well as a higher acquisition of corporate bonds, while negative flows in loans to non-MFIs partly offset the large lending flow to firms. In addition to credit to the private sector, the annual growth rate of credit from the banking sector (excluding the Eurosystem) to the public sector increased substantially in April (see the light green portion of the bars in Chart 20). In spite of the stepping-up of Eurosystem asset purchase programmes, in net terms euro area banks (excluding the Eurosystem) acquired large amounts of government bonds, mainly of domestic origin, partly reflecting the sizeable increase in net issuance of government debt to cope with the pandemic. In addition, monetary outflows from the euro area increased in April, owing to sales of euro area sovereign bonds by non-residents. The relatively moderate net external monetary flows are consistent with a combination of repatriation outflows for non-euro area residents and repatriation inflows for euro area residents, in line with the typical home bias of investors during periods of great uncertainty (see the yellow portion of the bars in Chart 20). In addition to the increase in credit to euro area governments from MFIs (excluding the Eurosystem), Eurosystem net purchases of government securities in the context of the ECB’s asset purchase programme (APP) and especially the pandemic emergency purchase programme (PEPP) contributed strongly to M3 growth (see the red portion of the bars in Chart 20), reflecting the large monetary policy support to stabilise financial markets and to alleviate risks to monetary policy transmission and the euro area macroeconomic outlook during the pandemic. Longer-term financial liabilities had a
-4
-2
0
2
4
6
8
10
12
14
2013 2014 2015 2016 2017 2018 2019 2020
M3M1Loans to the private sector

ECB Economic Bulletin, Issue 4 / 2020 – Economic and monetary developments Money and credit
35
broadly neutral impact on money growth (see the dark green portion of the bars in Chart 20).
Chart 20 M3 and its counterparts
(annual percentage changes; contributions in percentage points; adjusted for seasonal and calendar effects)
Source: ECB. Notes: Credit to the private sector includes MFI loans to the private sector and MFI holdings of debt securities issued by the euro area private non-MFI sector. As such, it also covers purchases by the Eurosystem of non-MFI debt securities under the corporate sector purchase programme. The latest observations are for April 2020.
The annual growth rate of loans to the private sector increased strongly between February and April 2020, owing to a decline in firms’ revenues and precautionary borrowing in the context of the COVID-19 pandemic. The annual growth rate of MFI loans to the private sector remained broadly stable at 4.9% in April, following a marked increase to 5.0% in March from 3.7% in February (see Chart 19). The growth was entirely driven by loans to firms, for which the annual growth rate rose further to 6.6% in April, from 5.5% in March and 3.0% in February (see Chart 21). The substantial strengthening of growth in loans to firms across most euro area countries reflected drawdowns of credit lines and substantial demand for new loans to cover ongoing payment obligations in a period of declining revenues during the COVID-19 lockdowns, as well as precautionary borrowing to bridge potential liquidity shortfalls. It also reflects the sizeable public measures, such as loan guarantees, to support firms’ liquidity and solvency over the coming months. Following strong demand for short-term loans in March, firms increased their demand for medium and long-term loans considerably in April as it became clear that the pandemic would last longer and given that public support schemes primarily cover loans up to a medium-term maturity. The surge in loan demand from firms was also reported by banks in the April 2020 euro area bank lending survey (BLS), where it was attributed mainly to financing needs for working capital, while financing needs for fixed investment declined. The timely and comprehensive policy measures supported the provision of lending on favourable terms in the first quarter of 2020. This is confirmed by the BLS results, according to which the net tightening of credit standards for loans to firms was contained in the first quarter of 2020 and small compared with the tightening during the financial and sovereign debt crises.
-6
-4
-2
0
2
4
6
8
10
2013 2014 2015 2016 2017 2018 2019 2020
M3 Net external monetary flowsGeneral government debt securities held by the EurosystemCredit to general government from MFIs excluding the EurosystemCredit to the private sectorInflows from longer-term financial liabilities and other counterparts

ECB Economic Bulletin, Issue 4 / 2020 – Economic and monetary developments Money and credit
36
The annual growth rate of loans to households moderated, reflecting great uncertainty surrounding the impact of the pandemic. In contrast to loans to firms, the annual growth rate of loans to households declined somewhat further to 3.0% in April from 3.4% in March. The moderation in household loan growth indicates uncertainty among households about the impact of the pandemic on their disposable income and employment prospects. While the annual growth rate of loans to households for house purchase remained broadly stable in April, at 3.9%, after 4.0% in March, the annual growth rate of consumer credit collapsed, to 1.3% in April, after 3.8% in March and 6.2% in February. This is in line with the unprecedented fall in consumer confidence and retail sales during the COVID-19 lockdown period. The weakening of household loan demand is also confirmed in the April 2020 BLS results.
In addition, there was considerable heterogeneity in loan growth to firms and households across euro area countries, reflecting, inter alia, cross-country differences in economic growth, in the availability of other funding sources, and in the levels of indebtedness of households and firms, although the pattern was broadly similar across large countries.
Chart 21 MFI loans in selected euro area countries
(annual percentage changes)
Source: ECB. Notes: Loans are adjusted for loan sales and securitisation; in the case of NFCs, loans are also adjusted for notional cash pooling. The cross-country dispersion is calculated on the basis of minimum and maximum values using a fixed sample of 12 euro area countries. The latest observations are for April 2020.
According to the May 2020 Survey on the Access to Finance of Enterprises in the euro area (SAFE), small and medium-sized enterprises (SMEs), which depend critically on banks for financing, reported a deterioration in the availability of loans, largely reflecting a worsened economic outlook in the six-month period to March 2020 (see Chart 22). The deterioration was widespread across countries. Negative developments were observed for SMEs across all of the main sectors, but in particular in the industry, services and trade sectors, while construction was less affected. For the first time since September 2014, SMEs signalled that the weakness
-15
-10
-5
0
5
10
15
20
2013 2014 2015 2016 2017 2018 2019 2020
Euro areaGermanyFranceItalySpainCross-country dispersion
a) MFI loans to NFCs
-9
-6
-3
0
3
6
9
12
2013 2014 2015 2016 2017 2018 2019 2020
b) MFI loans to households

ECB Economic Bulletin, Issue 4 / 2020 – Economic and monetary developments Money and credit
37
of their own outlook in terms of sales and profits was also weighing negatively on the availability of external funds, despite the increased willingness of banks to provide credit and net declines in bank interest rates (see the box entitled “The COVID-19 pandemic and access to finance for small and medium-sized enterprises: evidence from survey data” and the article entitled “Access to finance for small and medium-sized enterprises since the financial crisis: evidence from survey data” in this issue of the Economic Bulletin). The continued willingness to lend is consistent with the evidence from the BLS and new lending flows, which suggest that lending to SMEs remained robust, and no notable differences in lending to large companies were observed in the first quarter of 2020.
Chart 22 Factors affecting the availability of bank loans to SMEs
(net percentages)
Source: ECB (SAFE). Note: Data refer to SAFE rounds 3 (March-September 2010) to 22 (October 2019- March 2020).
The increase in banks’ debt funding costs remained contained, supported by monetary policy measures. The composite cost of debt financing for euro area banks, which had declined to very low levels in February 2020, increased in March in the context of the spread of the COVID-19 pandemic (see Chart 23). The increase was driven by upward pressure on bank bond yields in reaction to the rise in sovereign bond yields and varied considerably across jurisdictions. In addition, concerns about a negative impact of the pandemic on banks’ capital positions are weighing on banks’ market-based funding costs. While banks have strengthened their resilience substantially since the global financial crisis, the coronavirus pandemic will weigh on banks’ capital positions through lower asset valuations and the need for higher loan loss provisions.16 At the same time, the deterioration in banks’ debt funding costs remained contained overall. Deposit rates of euro area banks, which account for the bulk of bank funding, remained at a historical low in March 2020, thereby contributing to favourable bank debt funding conditions. Bank funding conditions are also
16 See Financial Stability Review, ECB, May 2020.
-75
-50
-25
0
25
50
10 14 19 10 14 19 10 14 19 10 14 19 10 14 19 10 14 19
General economicoutlook
Firm-specificoutlook
Firms' owncapital
Firms' credithistory
Willingness ofbanks to lend
Access to publicfinancial support
Euro areaGermanyFranceItalySpain

ECB Economic Bulletin, Issue 4 / 2020 – Economic and monetary developments Money and credit
38
benefiting from liquidity provision on very favourable terms via the third series of targeted longer-term refinancing operations (TLTRO III) as well as from the beneficial impact of the APP and PEPP on bond yields, including a decline in bond yields after the announcement of the PEPP on 18 March. This mitigates the risk of adverse amplification between the real and financial sectors during the pandemic.
Chart 23 Banks’ composite cost of debt financing
(composite cost of deposit and unsecured market-based debt financing; percentages per annum)
Sources: ECB, Markit iBoxx and ECB calculations. Notes: The composite cost of deposits is calculated as an average of new business rates on overnight deposits, deposits with an agreed maturity and deposits redeemable at notice, weighted by their corresponding outstanding amounts. The latest observations are for March 2020.
Bank lending rates for firms reached new historical lows, but some increase is likely going forward. Composite bank lending rates for loans to firms and for loans to households for house purchase reached new historical lows in March, at 1.46% and 1.39% respectively (see Chart 24). This development was widespread across euro area countries and reflects the lagged pass through of movements in market rates to bank lending rates. At the same time, given the increase in bank funding costs and the use of market reference rates for the pricing of bank loans, such as the euro interbank offered rate (EURIBOR), which increased over the reference period, some upward pressure on bank lending rates is likely in the coming months. In addition, the severe economic impact of the pandemic on firms’ revenues, households’ employment prospects and overall borrower creditworthiness is likely to put upward pressure on bank lending rates. The tightening impact of risk perceptions on banks’ credit terms and conditions, as reported by banks in the April 2020 BLS, already points in this direction. At the same time, liquidity support, for instance via tax deferrals and debt moratoria, loan guarantees and labour market support schemes, will stem some of the deterioration in borrowers’ creditworthiness during the crisis and exert a dampening effect on bank lending rates. The spread between bank lending rates on very small loans and large loans remained contained in March 2020. This supports the evidence above on new lending, which points to a broadly comparable impact so far of the COVID-19 pandemic on lending to SMEs and large firms, as captured by data on large and small loans.
0
1
2
3
2013 2014 2015 2016 2017 2018 2019 2020
Euro area GermanyFrance Italy Spain

ECB Economic Bulletin, Issue 4 / 2020 – Economic and monetary developments Money and credit
39
Chart 24 Composite bank lending rates in selected euro area countries
(percentages per annum; three-month moving averages)
Source: ECB. Notes: The indicator for the total cost of bank borrowing is calculated by aggregating short and long-term rates using a 24-month moving average of new business volumes. The cross-country standard deviation is calculated using a fixed sample of 12 euro area countries. The latest observations are for March 2020.
The annual flow of total external financing to euro area NFCs is estimated to have increased considerably in the first quarter of 2020 (see panel (a) of Chart 25). The increase was largely due to the exceptionally strong increase in bank lending to firms in March, supported by drawdowns of credit lines and public support schemes. Demand for bank lending was also supported by more favourable bank lending rates relative to the cost of market-based debt. The net issuance of debt securities by firms remained robust in the first quarter of 2020, in spite of the increase in spreads towards the end of the quarter, benefitting from the ECB’s asset purchase programmes (APP and PEPP), which include net purchases of corporate bonds. By contrast, net issuance of listed shares remained weak, dampened by the continued moderate level of mergers and acquisitions and an increase in the cost of equity from already elevated levels. Loans from non-banks (non-MFIs) remained negative in the fourth quarter of 2019 and the first quarter of 2020, pointing to a decline in annual terms in corporate bond issuance via firms’ financing conduits in other euro area countries (i.e. subsidiaries belonging to the non-MFI sector granting loans to their parent companies). Overall, total external financing flows were higher in the first quarter of 2020 than during the financial and sovereign debt crises. This is consistent with the more supportive bank credit and bond market conditions, bolstered by timely and sizeable measures by monetary, supervisory and fiscal authorities.
0.0
0.4
0.8
1.2
1.6
2.0
0
1
2
3
4
5
2011 2012 2013 2014 2015 2016 2017 2018 2019 2020
Euro areaGermanyFranceItalySpainCross-country standard deviation (right-hand scale)
a) Rates on loans to NFCs
0.0
0.4
0.8
1.2
1.6
2.0
0
1
2
3
4
5
2011 2012 2013 2014 2015 2016 2017 2018 2019 2020
b) Rates on loans to households for house purchase

ECB Economic Bulletin, Issue 4 / 2020 – Economic and monetary developments Money and credit
40
Chart 25 External financing of euro area NFCs
(annual flows in EUR billions – panel (a); percentages per annum – panel (b))
Sources: Eurostat, Dealogic, ECB, Merrill Lynch, Bloomberg, Thomson Reuters and ECB estimates. Notes: Panel (a): Net external financing is the sum of MFI loans, net issuance of debt securities, net issuance of listed shares and non-MFI loans. MFI loans are adjusted for sales, securitisation and cash pooling activities. Loans from non-MFIs include loans from other financial institutions and insurance corporations and pension funds net of securitised loans. The striped bar and light blue diamond show the nowcast for the first quarter of 2020. Panel (b): Overall cost of financing for NFCs calculated as a weighted average of the costs of bank borrowing, market-based debt and equity, based on their respective amounts outstanding. The dark blue diamond indicates the nowcast of the overall cost of financing for June 2020, assuming that bank lending rates remain unchanged at their March 2020 levels. The latest observations for panel (a) are for the fourth quarter of 2019 for euro area accounts data – estimates for the first quarter of 2020 are based on ECB balance sheet items (BSI) and securities (SEC) data and Dealogic. The latest observations for panel (b) are 2 June 2020 for the cost of market-based debt (daily data), 29 May for the cost of equity (weekly data) and March 2020 for the cost of lending (monthly data).
The cost of financing for NFCs increased in the first quarter of 2020, but is estimated to have declined since then (see panel (b) of Chart 25). In March 2020, owing to the high volatility in financial markets, the overall nominal cost of external financing for NFCs, comprising bank lending, debt issuance in the market and equity finance, stood at 5.7%, which was 95 basis points above its level in December 2019 and around 120 basis points higher than in April 2019, when the series was at its historical low. However, between March and the end of the reference period (2 June
-200
-100
0
100
200
300
400
2013 2014 2015 2016 2017 2018 2019 2020
MFI loans to NFCs (adjusted)Net issuance of debt securities by NFCsNet issuance of listed shares by NFCsLoans from non-MFIs to NFCs (excl. securitisations)Total
a) Net external financing of euro area NFCs based on selected instruments
0
2
4
6
8
10
12
2013 2014 2015 2016 2017 2018 2019 2020
Overall cost of financingCost of equityCost of market-based debtShort-term cost of lending indicatorLong-term cost of lending indicator
b) Nominal cost of external financing for euro area NFCs by component

ECB Economic Bulletin, Issue 4 / 2020 – Economic and monetary developments Money and credit
41
2020), the overall cost of financing is estimated to have declined by 50 basis points to 5.2%. This reflects a sizeable decline in the cost of equity, owing to lower risk premia, and a slight decrease in the cost of market-based debt.

ECB Economic Bulletin, Issue 4 / 2020 – Economic and monetary developments Fiscal developments 42
6 Fiscal developments
The coronavirus (COVID-19) pandemic is having a significant impact on fiscal policies in the euro area. The outbreak of the crisis led to an immediate increase in direct costs, in a bid to address the consequences for public health. However, from a macroeconomic perspective, much of the impact relates to the containment measures which are placing a severe economic burden on firms, workers and households. These measures have also triggered unprecedented fiscal stimulus packages intended to cushion the economic fallout and to prepare for a swift recovery. As a result, the general government budget deficit in the euro area is projected to increase significantly, to 8.5% of GDP in 2020, compared with 0.6% in 2019. Although the deficit ratio is expected to shrink to 4.9% in 2021, it is still expected to stand at 3.8% of GDP in 2022, as the drag will be longer to fully dissipate. The extensive fiscal measures in 2020 have led to a corresponding worsening of the cyclically adjusted primary balance, in addition to a negative cyclical component reflecting the deterioration in the macroeconomic situation. The subsequent improvement is expected to be led by the phasing out of the emergency measures and the corresponding strengthening of the cyclically adjusted primary balance, while the economic cycle improves more slowly. Euro area countries have also provided envelopes of loan guarantees amounting to almost 20% of GDP in order to bolster firms’ liquidity. While these guarantees will not necessarily affect deficits ex ante, they do constitute a significant contingent liability that could negatively affect deficits if they are called on. Reflecting the fiscal measures and the deteriorating economic situation, the euro area aggregate debt ratio is projected to rise steeply in 2020 and remain at an elevated level throughout 2022. An ambitious and coordinated fiscal stance remains critical, in view of the sharp contraction in the euro area economy, although measures should be targeted and temporary. In this respect, both the €540 billion package of three safety nets endorsed by the European Council and the European Commission’s proposal for a recovery plan dedicated to supporting the regions and sectors most severely hit by the pandemic are strongly welcomed.
In the June 2020 Eurosystem staff projections, the euro area general government budget balance is projected to decline strongly in 2020, but to partly recover in 2021 and 2022.17 Based on these projections, the general government deficit ratio for the euro area is expected to increase from a 0.6% of GDP in 2019 to 8.5% of GDP in 2020 and then to shrink to 4.9% and 3.8% in 2021 and 2022 respectively (see Chart 26).The decline in the budget balance in 2020 is attributable mainly to a deterioration in the cyclically adjusted primary balance on the back of economic support measures amounting to around 3.5% of GDP, of which the largest part is additional spending, particularly in the form of employment aid schemes, support measures to firms and households, and higher health spending. It is also the result of a large and negative cyclical component as the euro area economy slips into recession.18 The subsequent improvement is expected to be driven by a recovery in the cyclically adjusted primary balance, as most support measures are expected to
17 See the “Eurosystem staff macroeconomic projections for the euro area, June 2020” published on the ECB’s website on 4 June 2020.
18 It should be pointed out that there is an unusually high degree of uncertainty surrounding the decomposition of cycle and trend at the current juncture.

ECB Economic Bulletin, Issue 4 / 2020 – Economic and monetary developments Fiscal developments 43
have been phased out by the end of 2020, while the contribution from the economic cycle is expected to improve more gradually.
In addition to the fiscal support granted to their economies, euro area countries have provided sizeable loan guarantee envelopes to bolster firms’ liquidity. In total, these guarantees amount to around 20% of GDP for the euro area as a whole, but the size of the envelopes differs substantially across countries. The loan guarantees constitute contingent liabilities for governments and will lead to additional public spending in the amount that they are called on. However, at the current juncture it is very difficult to quantify what that amount will be in the medium and long term.
Chart 26 Budget balance and its components
(percentage of GDP)
Sources: ECB and June 2020 Eurosystem staff macroeconomic projections. Note: The data refer to the aggregate general government sector of the euro area.
According to the June 2020 Eurosystem staff projections, the euro area fiscal outlook for the period 2020-22 is projected to be much more adverse than in the March 2020 ECB staff projections. The euro area general government budget balance as a share of GDP has been revised down by 7.4 percentage points in 2020 and by 3.3 and 2.3 percentage points in 2021 and 2022 respectively. These revisions are attributable mainly to a lower primary balance and a weaker than expected cyclical component, while the interest expenditure component has been revised up, but only by a much smaller extent.
The aggregate fiscal stance for the euro area is assessed to be strongly accommodative in 2020, but contractionary in 2021 as most support measures are expected to have been phased out by then.19 The fiscal stance is estimated to have been mildly expansionary in 2019, but is expected to be highly accommodative
19 The fiscal stance reflects the direction and size of the stimulus from fiscal policies to the economy, beyond the automatic reaction of public finances to the business cycle. It is measured here as the change in the cyclically adjusted primary balance ratio net of government support to the financial sector. For more details on the concept of the euro area fiscal stance, see the article entitled “The euro area fiscal stance”, Economic Bulletin, Issue 4, ECB, 2016.
-9.0
-8.0
-7.0
-6.0
-5.0
-4.0
-3.0
-2.0
-1.0
0.0
1.0
2.0
2018 2019 2020 2021 2022
Cyclically adjusted primary balance (net of financial sector support)Cyclical component Interest payments Financial sector supportBudget balance

ECB Economic Bulletin, Issue 4 / 2020 – Economic and monetary developments Fiscal developments 44
at 4.8% of GDP in 2020. By contrast, in 2021 it is estimated to be contractionary at 2.9% of GDP, as most of the support measures put in place during the pandemic will have been phased out by then. Notwithstanding the negative fiscal stance in 2021, it should be pointed out that the overall fiscal balance will remain substantially negative with fiscal instruments continuing to support the economic recovery, not least through automatic stabilisers. In 2022 the fiscal stance is projected to be in a broadly balanced position.
As a result of the COVID-19 pandemic, the euro area aggregate public debt-to-GDP ratio is projected to surge to 101.3% of GDP in 2020, before declining very gradually. The increase in 2020, of 17.2 percentage points compared with 2019, is due mainly to a combination of high primary deficits and a very adverse interest-growth differential, but also to a significant deficit-debt adjustment which largely reflects measures related to the pandemic. In 2021 and 2022 declining, albeit still significant primary deficits will be more than offset by favourable contributions from improving interest-growth differentials as economic activity is projected to recover (see Chart 27). As a result, the debt-to-GDP ratio is expected to stand very close to 100% at the end of 2022, an upward revision of 17.3 percentage points compared with the March 2020 projections.
An ambitious and coordinated fiscal stance remains critical, in view of the sharp contraction in the euro area economy. Measures taken should, as much as possible, be targeted and temporary in nature in response to the pandemic emergency. The three safety nets endorsed by the European Council for workers, businesses and sovereigns, amounting to a package worth €540 billion, provide important funding support in this context. At the same time, further strong and timely efforts to prepare and support the recovery are needed. The European Commission’s proposal for a recovery plan dedicated to supporting the regions and sectors most severely hit by the pandemic, to strengthening the Single Market and to building a lasting and prosperous recovery, is therefore strongly welcomed.
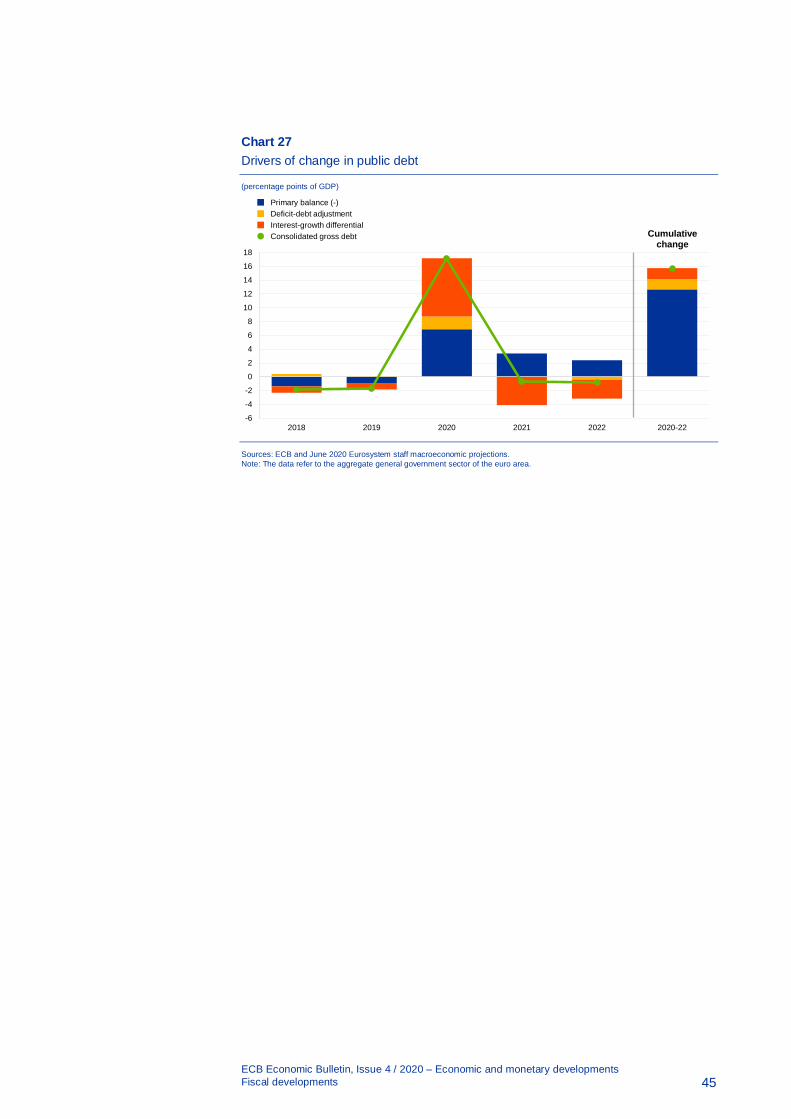
ECB Economic Bulletin, Issue 4 / 2020 – Economic and monetary developments Fiscal developments
45
Chart 27 Drivers of change in public debt
(percentage points of GDP)
Sources: ECB and June 2020 Eurosystem staff macroeconomic projections. Note: The data refer to the aggregate general government sector of the euro area.
-6
-4
-2
0
2
4
6
8
10
12
14
16
18
2018 2019 2020 2021 2022 2020-22
Primary balance (-)Deficit-debt adjustmentInterest-growth differentialConsolidated gross debt Cumulative
change

ECB Economic Bulletin, Issue 4 / 2020 – Boxes Impact of the COVID-19 lockdown on trade in travel services
46
Boxes
1 Impact of the COVID-19 lockdown on trade in travel services
Prepared by Tobias Schuler
The lockdown measures adopted to contain the coronavirus (COVID-19) pandemic are having a significant impact on euro area trade in services, in particular on travel and passenger transportation. Exports of services dropped by 10.6% and imports of services dropped by 3.3% in March 2020 compared to the previous year, according to the latest available balance of payments data. Among several heterogeneous sectors, those involving physical contact are severely affected. The Purchasing Managers’ Index for Europe20 suggests that tourism and leisure services and transport services are the sectors with the sharpest decline in activity in April 2020.
The global travel sector has experienced severe disruptions, for example as a result of travel restrictions and the closure of tourist attractions. More than 110 countries have stopped incoming travellers, and almost all countries have put in place restrictions of some kind. Some countries have adopted complete travel bans, while others have banned travel only from areas with a high number of infections. Tourism is heavily affected, especially international travel. Even after the severe lockdown measures have been lifted, the pandemic itself is triggering lasting effects on the sector through risk aversion and a change in preferences.
Travel and tourism as part of euro area trade in services
Tourism is travel for leisure or business and involves several stages and components, such as travel planning, transport, accommodation, food and shopping, local travel and tourist sites.21 International tourism enters a country’s balance of payments as exports and imports of travel and transportation services. According to Balance of Payments and International Investment Position Manual (BPM6), “[t]ravel covers primarily the goods and services acquired from an economy by travellers (…) during visits of less than one year in that economy” and excludes the international carriage of travellers, which is covered in passenger services under transportation.
20 See the press release published by Markit on 8 May 2020. 21 For definitions of the concepts of travel and tourism, see the sixth edition of the Balance of Payments and
International Investment Position Manual (BPM6) and the International Recommendations for Tourism Statistics by the United Nations World Tourism Organization (UNWTO). While travel (as defined in BPM6) and tourism (as defined by the UNWTO) largely overlap, the statistical concepts differ in two dimensions. First, “travel” includes purchases by short-term cross-border workers, which are not considered tourism expenditure. Second, tourism includes purchases of (international) passenger transport services, which fall under transport rather than travel services according to BPM6.

ECB Economic Bulletin, Issue 4 / 2020 – Boxes Impact of the COVID-19 lockdown on trade in travel services 47
Net trade in travel contributed €42 billion to the euro area surplus of €68 billion in the trade balance for services in 2019. Extra-euro area services exports amounted to €988 billion, of which €124 billion from trade in travel services, accounting for 17% of the total amount. The transport sector accounts for 16% and includes both freight and passenger transportation, with the latter accounting for 23% of exports and 15% of imports in 2019. Imports amounted to €920 billion, with transport (16%) and travel (13%) being the largest categories.
The euro area is exposed to trade in heavily affected service sectors, in which it recorded a surplus in 2019. The geographical breakdown of services trade balances (see Chart A) illustrates the categories for euro area in services by main trade partners. The euro area had an overall surplus in trade in travel services, which is particularly exposed as the sector is among the most affected. The United Kingdom, Switzerland and the United States accounted for the largest contributions to the trade in travel surplus in 2019. Other sectors such as insurance, pensions and financial services as well as telecommunication, computers and information services trade are less affected.22
Chart A Geographical breakdown of euro area service trade balance in 2019
(EUR billions)
Source: ECB. Notes: Other business services comprise research and development services, professional and management consulting services and technical, trade-related and other business services not included in the previous categories. Other services refer to manufacturing services on physical inputs owned by others, maintenance and repair services, construction, charges for the use of intellectual property, government goods and services, personal, cultural and recreational services and the category “services not allocated”.
22 The surplus in telecommunications, computers and information services was mainly with the United Kingdom, other EU Member States and other countries. By contrast, the euro area recorded a deficit in trade in other business services, mainly vis-à-vis offshore centres and the United States. The euro area is a net importer of “other services”, a category which includes charges for the use of intellectual property and which is largely affected by multinational enterprises’ internal transactions. For more details, see the article entitled “Multinational enterprises, financial centres and their implications for external imbalances: a euro area perspective”, Economic Bulletin, Issue 2, ECB, 2020.
-150
-100
-50
0
50
100
UnitedKingdom
Other EUMember States
United States China Switzerland Japan Offshorecentres
Other countries
TransportTravelInsurance, pensions and financial servicesTelecommunications, computers and information servicesOther business servicesOther servicesTotal

ECB Economic Bulletin, Issue 4 / 2020 – Boxes Impact of the COVID-19 lockdown on trade in travel services 48
The crisis in the passenger transportation sector
The airline industry faces strong headwinds, as global travel is severely affected by the COVID-19 containment measures. Air transportation, which accounts for by far the largest share of passenger transportation export and import values,23 is particularly affected. Major airports in the euro area (especially Paris, Amsterdam and Frankfurt) serve as a hub for international travel connections. Water, road and rail transportation are affected to a lesser extent.24
Flight capacity has been significantly reduced since the outbreak of COVID-19 (see Chart B). Globally, scheduled flight capacity25 has declined by 65%. In the United States and Japan, flight capacity has dropped by 72% and 48% respectively. In China, flight capacity fell by 71% and has since recovered to 20% below 2019 levels. In Italy, Spain, France and Germany, flight capacity plunged by more than 90% compared with the same period in 2019 (according to data released on 1 June 2020).
The collapse in flight capacity across regions is unprecedented in the history of aviation. Flight passenger revenues fell by approximately 15% following the terrorist attacks in September 2001 and required two to three years to completely recover in the United States and Europe.26 Following the SARS outbreak in 2002-03, passenger revenues declined by approximately two-thirds and did not recover until one year later.27 The fall in international airline activity as a result of COVID-19 is, however, much broader and deeper and is likely to have more lasting consequences for the industry than these previous episodes.
23 Based on International Trade in Services (ITS) statistics. 24 Cruise ship services, which have been heavily affected by the containment measures, are included in the
“travel” category in ITS statistics. 25 Global scheduled flight capacity includes both domestic and international flight capacity. Owing to travel
restrictions, international air travel is more severely affected than domestic air travel. 26 Assessment based on revenue passenger miles and kilometres, respectively, from the US Department of
Transportation and the Association of European Airlines. Revenue passenger miles and kilometres are calculated by multiplying the number of paying passengers by the distance travelled.
27 Assessment based on data provided by the International Air Transport Association and the International Civil Aviation Organization.

ECB Economic Bulletin, Issue 4 / 2020 – Boxes Impact of the COVID-19 lockdown on trade in travel services
49
Chart B Global scheduled flight capacity in 2020
(percentage changes compared with the same period in 2019)
Source: OAG Schedules Analyser. Notes: The data for each week are compared with the same week in 2019. The latest observation is for 1 June 2020.
The impact on the travel sector of individual euro area countries
Travel exports play an important role for several euro area countries (see Chart C). Travel exports are mainly accommodation and hospitality services provided to travellers. The largest exporters in terms of receipts are Spain, France, Italy and Germany, with more than half of their travel exports to countries outside the euro area. Austria, the Netherlands, Greece and Portugal are also major travel destinations in the euro area, with Austria and the Netherlands recording higher shares in intra-euro area exports. In relative terms, travel exports are also significant for Cyprus, Malta, Greece and Portugal.
-120
-100
-80
-60
-40
-20
0
20
13/01 27/01 10/02 24/02 09/03 23/03 06/04 20/04 04/05 18/05 01/06
GlobalGermanyFranceItalySpainUnited KingdomUnited StatesChina Japan

ECB Economic Bulletin, Issue 4 / 2020 – Boxes Impact of the COVID-19 lockdown on trade in travel services
50
Chart C Euro area countries’ travel exports and imports as a share of GDP in 2018
(percentage of GDP)
Sources: Eurostat and ECB staff calculations. Note: Exports and imports include intra- and extra-euro area trade.
The majority of euro area countries spend between 2% and 4% of GDP abroad, which is recorded as travel services imports. Germany is by far the largest importer of travel services in absolute terms. Belgium, Luxembourg and Cyprus are relatively large importers of travel services in relation to their GDP, given their interconnectedness with other neighbouring economies.
The euro area countries more exposed to the impact of the pandemic in terms of net exports of travel services are estimated to be Cyprus, Malta, Greece and Portugal. Spain, Austria, Luxembourg and Slovenia are also expected to eventually face a significant hit in terms of net travel exports. By contrast, Germany and Belgium are expected to benefit slightly in terms of net exports as they are major importers of travel services.
In countries which depend on travel and tourism, the COVID-19 pandemic is having a severe and lasting impact on the overall economy. Travel has direct benefits through commercial activities along its value chain (i.e. travel planning, transport, accommodation, food and shopping, local travel and tourist sites) as well as indirect benefits through the demand and growth that it creates in many other industries. The lockdown measures adopted to contain the pandemic and confidence effects are having significant impacts on firms and employees in the labour-intensive travel industry.
0
2
4
6
8
10
12
14
16
DE FR IT ES NL BE AT IE FI GR PT SK LU SI LT LV CY EE MT
ExportsImports

ECB Economic Bulletin, Issue 4 / 2020 – Boxes Coronavirus (COVID-19): market fear as implied by options prices
51
2 Coronavirus (COVID-19): market fear as implied by options prices
Prepared by Miguel Ampudia, Ursel Baumann and Fabio Fornari
Introduction
Stock markets around the world have tumbled since late February, when international investors began to worry about the spread of the coronavirus outside of China and its impact on the global economy. Although equity markets have partially recovered since then, the Euro Stoxx 50 lost 12.3% in the week ending on 28 February, its largest weekly percentage loss since the global financial crisis in 2008. The S&P 500 declined by more than 11% in an equally catastrophic week. Overall, equity markets in the euro area and the United States lost around 35% of their value between their peak on 19 February and their trough on 23 March.
Chart A Standard deviation of equity returns
(annualised percentages)
Sources: Authors’ calculations and Refinitiv. Notes: Model-based estimates of the standard deviation of daily equity returns for four indices: the Euro Stoxx 50, the S&P 500, the FTSE 100 and the Nikkei 225. Daily data. The latest observations are for 13 April 2020.
The decline in equity prices has led to a large spike in the variance of their returns. The standard deviation of daily equity returns of major indices in the euro area, the United States, the United Kingdom and Japan is at levels comparable to the peaks associated with the October 1987 stock market crash and the default of Lehman Brothers in September 2008 (see Chart A). Recent turbulence has clearly been global in nature, as shown by the substantial jump in the standard deviation across indices. This is also reflected in a sharp rise, to values close to unity, in the bilateral correlations of equity returns for the four main equity indices, which highlights the presence of a common factor among these returns. The resulting lack of diversification opportunities also amplifies the potential losses faced by international investors.
5
20
35
50
65
80
95
110
1987 1989 1991 1993 1995 1997 1999 2001 2003 2005 2007 2009 2011 2013 2015 2017 2019
Euro areaUnited StatesUnited KingdomJapan

ECB Economic Bulletin, Issue 4 / 2020 – Boxes Coronavirus (COVID-19): market fear as implied by options prices
52
The increased risk aversion that came on top of the heightened risks may have amplified the sell-off in equity markets and across a large range of assets more generally. Following the initial large sell-off in financial markets, an important question for policymakers when assessing the response to the crisis concerns the persistence of the impact of the restrictions related to the coronavirus on financial risk, financial conditions and, ultimately, on real economic activity. One of the main ways in which this shock has spread is via financial market linkages and, most notably, via the synchronous plunge in global stock markets. The sell-off may have been driven by an increase in the perceived amount of risk present in the markets, an increase in the reluctance of investors to take risks, or a combination of both. Knowing the main source of the decline in equity prices (and financial assets in general) may help policymakers understand its persistence and evaluate the policy response. The aim of this box is to assess the changes in the quantity and price of (tail) risks using an estimate of tail risk aversion based on the price of equity options.
Risk-neutral densities
The risk-neutral density of an equity price is the market’s estimate of the probability distribution for the future level of that equity price, adjusted for the presence of investors’ risk aversion. The risk-neutral density therefore reflects both the risk attitudes and price expectations of investors. Risk-neutral densities can be thought of as physical densities whose shape has been modified in order to give more prominence to those states of the world that are associated with particularly adverse outcomes and that, as such, result in lower marginal utility for investors.28 We derive the risk-neutral density of future returns from the daily prices of call and put options traded on the Euro Stoxx 50.29 On any given day, these options are available for more than one maturity, making it possible to estimate the risk-neutral density for the available range of maturities.
Fears of a market crash emerged in the early stages of the virus outbreak in Europe, but after the announcement of significant policy stimulus the expected upside potential for equity prices increased, even though market risks remained elevated. Chart B shows the Euro Stoxx 50 risk-neutral density for equity returns, backed out from options and spanning a horizon of up to one year, on three dates: (i) 21 February, just before the virus outbreak reached Europe in full force; (ii) a week later (28 February); and (iii) 20 March, after significant policy stimulus had been announced in the euro area and the United States. One can already observe a marked increase in the variance – as well as a fattening of the left tail – of the distribution in the
28 Such modification results in investors being risk-neutral in the sense that all future cash flows from any
asset can be discounted using risk-free rates. 29 See Breeden, D. and Litzenberger, R., “Prices of State-contingent Claims Implicit in Option Prices”, The
Journal of Business, Vol. 51, No 4, 1978, pp. 621-651, where the authors show that the second derivative of a call/put price function with respect to the strike price corresponds to the risk-neutral density function. For a detailed explanation of the method followed to perform the calculations, see Figlewski, S., “Estimating the Implied Risk-Neutral Density for the US Market Portfolio”, in Bollerslev, T., Russell, J. and Watson, M. (eds.), Volatility and Time Series Econometrics: Essays in Honor of Robert F. Engle, Oxford University Press, Oxford, United Kingdom, 2010.

ECB Economic Bulletin, Issue 4 / 2020 – Boxes Coronavirus (COVID-19): market fear as implied by options prices
53
week ending on 28 February, thus signalling increased fears of a market crash.30 By 20 March, after significant monetary and fiscal policy measures had been announced and equity markets had already fallen sharply, the lower tail of the risk-neutral density remained broadly unchanged, but the distribution became more skewed to the upside, suggesting an increase in the expected recovery of equity returns.31
Chart B Euro Stoxx 50 option-implied risk-neutral densities
For options with a horizon of approximately one year ahead (densities)
Sources: Authors’ calculations and Refinitiv. Note: Risk-neutral densities of future returns backed out from the daily prices of call and put options traded on the Euro Stoxx 50.
A tail risk aversion indicator
An indicator of investor risk preferences or risk aversion can be derived by comparing the risk-neutral density with an estimate of the physical density of equity returns. The risk-neutral and the physical densities are related to each other through the pricing kernel, which embeds investors’ risk preferences. The physical density represents investors’ best judgement about probabilities of future price developments. Expectations of physical densities cannot be determined from market prices, as market prices also embed the risk preferences of investors. Researchers have turned to statistical methods to estimate such densities.32 We use a daily
30 The large increase in variance, with investors pricing in a higher likelihood of both tails, overshadowed
the increase in skewness. 31 A similar picture emerges for equity returns backed out from options maturing at short horizons, i.e. with
a residual life of 10 to 20 days. 32 See, for example, Barone-Adesi, G., Engle, R.F. and Mancini, L., “A GARCH Option Pricing Model with
Filtered Historical Simulation”, The Review of Financial Studies, Vol. 21, No 3, 2008, pp. 1223-1258.
0.000
0.002
0.004
0.006
0.008
0.010
-0.50 -0.25 0.00 0.25 0.50
21 February 202028 February 202020 March 2020

ECB Economic Bulletin, Issue 4 / 2020 – Boxes Coronavirus (COVID-19): market fear as implied by options prices
54
multivariate generalised autoregressive conditional heteroscedasticity (GARCH) model to achieve this.33
The tail risk aversion indicator is constructed by comparing the left tails of the risk-neutral and physical distributions. Investors are risk-averse if they attach a higher risk-neutral probability to adverse events compared with the physical density. As tail risk-averse investors are willing to pay a premium to insure against the disutility associated with adverse outcomes, risk-neutral probabilities will overstate the corresponding physical probabilities for negative tail events. We look at the behaviour of the left tails of both the risk-neutral and the physical densities for equity returns over a three-month horizon. The index of aversion to negative tail risk of investors is calculated as the area to the left of the point on the risk-neutral density that corresponds to the lowest tenth percentile of the physical distribution of the returns (normalised by 0.1, i.e. the corresponding area on the physical density).34 A tail risk aversion index above one indicates that investors fear the materialisation of negative tail events and are therefore willing to insure against such an occurrence by paying more than would be justified by its historical likelihood.35 By contrast, an index value between zero and one could be considered as consistent with a situation in which appetite for risk is high.
33 GARCH models account for the volatility clustering commonly observed in financial assets’ returns
series, especially in periods of stress. At each date, we simulate a number of future paths of equity returns using this model, up to the maturity of the longest option traded that day in the market. From these returns, for a given maturity, we build their future physical density via kernel estimation. We estimate the expected physical density of equity returns by simulating their first and second moments using the full historical errors of the standardised residuals obtained by scaling the rates of change of an equity index with their conditional standard deviation based on the GARCH model. As this may overstate the variance of the errors in the presence of policy stimulus, an alternative would be to give more weight to errors recorded in the initial phase of the asset purchase programme in 2015 or to reduce the variance of the errors to mimic a decline in expected risks.
34 The procedure is as follows: (i) determine the return associated with the lowest tenth percentile in the physical distribution, (ii) look up this return in the risk neutral distribution and calculate the area to its left, and (iii) divide this area by 0.1 (which represents the area to the left of the tenth percentile in the physical distribution).
35 When the indicator is below one, investors are still willing to insure against the materialisation of negative tail events, but only at a lower price than that inferred from the historical likelihood. An indicator equal to one corresponds to a risk-neutral investor.

ECB Economic Bulletin, Issue 4 / 2020 – Boxes Coronavirus (COVID-19): market fear as implied by options prices
55
Chart C Euro Stoxx 50 tail risk aversion indicator and tail risk
For options with a horizon of 10 to 20 days ahead (index)
Sources: Authors’ calculations and Refinitiv. Notes: “APP” stands for asset purchase programme and “APP extension” refers to the ECB measures announced on 12 March 2020, “PEPP” stands for the pandemic emergency purchase programme announced on 18 March 2020, “QE” stands for quantitative easing and “VaR” stands for value at risk (tenth percentile). The latest observations are for 13 April 2020.
The estimated tail risk aversion increased measurably from the second half of February. In mid-March, coinciding with the introduction of policy measures on both sides of the Atlantic, it reversed its course and returned to early-February levels. Chart C depicts the estimated tail risk indicator, along with a measure of tail risk, defined as the (inverted) tenth percentile of the physical distribution of the Euro Stoxx 50 returns. Initially, as the coronavirus was largely contained to certain regions in China, markets appear to have been rather complacent in the sense that there was practically no increase in tail risk aversion. At the outbreak of the pandemic in Europe, however, investors’ willingness to take on risk declined measurably, as reflected in the increase in the tail risk aversion index as of 21 February – the start of the lockdown in some parts of the Italian region of Lombardy. Around mid-March, the price of left tail risk started to decline again, as a cascade of fiscal and monetary policy measures was announced on both sides of the Atlantic. By contrast, tail risk itself remained broadly stable until the beginning of March, started to rise significantly thereafter and remained elevated even after the introduction of policy stimulus. One interpretation of these developments is that the measures put into place by central banks and governments have been able to support investors’ risk appetite, thus curbing the initial rise in the price of risk and leading it back to the value prevailing around mid-February. This reduction in the price of risk took place despite the rise in the amount of risk and therefore contributed significantly to minimising the impact of the shock on financial markets.
0.1
0.1
0.2
0.2
0.3
0.3
0.4
0.3
0.5
0.8
1.0
1.3
1.5
1.8
01/02/2020 15/02/2020 29/02/2020 14/03/2020 28/03/2020 11/04/2020
Lockdown of LombardyECB APP extension
US state of emergency Fed extension of QE
ECB PEPP
Tail risk aversion (left-hand side)Tail risk (VaR-10%) (right-hand side, inverted)

ECB Economic Bulletin, Issue 4 / 2020 – Boxes The COVID-19 pandemic and access to finance for small and medium-sized enterprises: evidence from survey data
56
3 The COVID-19 pandemic and access to finance for small and medium-sized enterprises: evidence from survey data
Prepared by Katarzyna Bańkowska, Annalisa Ferrando and Juan Angel García
The outbreak of the coronavirus (COVID-19) pandemic has dramatically affected global economic activity. In an attempt to slow the spread of COVID-19 infections, governments around the world have introduced social-distancing measures and lockdowns and cancelled public events. Borders have been closed, even within Europe. In addition, uncertainty surrounding the future development of the pandemic and the disruption of supply chains may have contributed to amplifying the impact of the combined demand and supply shock. The business activity of many companies has been severely disrupted, leading to an unprecedented adverse impact on economic growth globally.
The latest Survey on the Access to Finance of Enterprises (SAFE) documents a deterioration in the business activity of small and medium-sized enterprises (SMEs) in the reporting period from October 2019 to March 2020.36 As the survey was conducted between 2 March and 8 April, firms were able to account for the impact of the ongoing crisis to some extent. However, the survey results with regard to the backward-looking questions may only show some partial effects of the crisis, as the reporting period had almost come to an end before the escalation of the crisis.
Looking backwards, euro area SMEs signalled a decline in turnover for the first time since the beginning of 2014. In net percentage terms,37 the reported change in turnover was -2% (down from 20% in the previous round) for the euro area as a whole (see Chart A). Notwithstanding some differences across countries, the deterioration was widespread. The sharpest declines were experienced in Italy, followed by Slovakia, Greece and Spain, while in Germany and France a much smaller percentage of SMEs indicated, on balance, an increase in turnover.
36 The 22nd SAFE round was conducted between 2 March and 8 April 2020 and covered the period from
October 2019 to March 2020. The total euro area sample size was 11,236 enterprises, of which 10,287 (92%) had fewer than 250 employees. For a more comprehensive overview of the latest results, see Survey on the Access to Finance of Enterprises, ECB, May 2020. In addition, the accompanying article entitled “Access to finance for small and medium-sized enterprises since the financial crisis: evidence from survey data” in this issue of the Economic Bulletin provides additional evidence of survey results over the last ten years.
37 Net terms or net percentages are defined as the difference between the percentage of enterprises reporting an increase for a given factor and the percentage reporting a decrease.

ECB Economic Bulletin, Issue 4 / 2020 – Boxes The COVID-19 pandemic and access to finance for small and medium-sized enterprises: evidence from survey data
57
Chart A Change in turnover and profit of SMEs across euro area countries
(over the preceding six months; net percentages of respondents)
Source: ECB and European Commission, SAFE. Notes: Base is all SMEs. Figures refer to rounds 15 (April-September 2016) to 22 (October 2019-March 2020) of the survey. The net percentage is the difference between the percentage of enterprises reporting an increase for a given factor and the percentage reporting a decrease.
SMEs’ profitability also weakened across countries and economic sectors. Amid deteriorating turnover, high labour (reported by 46% of firms in net terms) and other input costs (45%) took a toll on SMEs’ profits across the euro area (-15%, from -1%), despite accommodative financing conditions. The decline in profits was particularly strong among Greek, Spanish, Italian and Slovakian SMEs. At the sectoral level, industry appears to have been the worst hit by the deterioration in profits (-20%, from -7%), notably in Italy. In the trade sector, a net 19% of euro area SMEs also reported decreasing profits, with the percentage reaching 37% in Italy and 30% in Spain.
A weakening financial position and a deteriorating macroeconomic environment raised concerns about access to finance among SMEs. The deterioration in turnover and in profits among euro area SMEs was seen as an impediment to obtaining external finance (-18%, from 5%) for the first time since September 2014, particularly among Spanish, Italian and Portuguese SMEs. In addition, SMEs also perceived developments in the general economic outlook to have negatively affected access to finance (-30%, from -13%), a percentage not seen since March 2013. The deterioration was widespread across countries – particularly in Germany, Italy and Finland – and sectors, with industry at -31%, construction at -21%, services at -31%, and trade at -30%. Moreover, compared with larger companies, SMEs, and micro firms in particular, appeared to be more concerned about the adverse impact that their own sales and profit outlook would have on their access to external finance.
Firms’ expectations for access to finance in the near future shed more light on the severity of the COVID-19 crisis. The declaration of a pandemic by the World Health Organization (WHO) on 11 March and the subsequent intensification of confinement measures in the euro area largely coincided with the latest round of SAFE fieldwork. As a result, answers to backward-looking questions may only partially reflect the disruptions to business activity. However, the forward-looking component of
-60
-40
-20
0
20
40
60
'16 '19 '16 '19 '16 '19 '16 '19 '16 '19 '16 '19 '16 '19 '16 '19 '16 '19 '16 '19 '16 '19 '16 '19 '16 '19
BE DE IE GR ES FR IT NL AT PT SK FI Euroarea
ProfitTurnover

ECB Economic Bulletin, Issue 4 / 2020 – Boxes The COVID-19 pandemic and access to finance for small and medium-sized enterprises: evidence from survey data
58
the survey captured the ongoing and anticipated worsening of the economic conditions.
Focusing on the daily responses, expectations in the euro area started deteriorating rapidly shortly after the WHO declared a pandemic, which was followed by lockdowns and border controls across much of Europe. The reporting dates of firms surveyed during the fieldwork were used to analyse the change in firms’ expectations since the outbreak of the pandemic.38 On the day of the WHO announcement, 17% of firms, on average, were expecting a deterioration in the availability of bank loans and credit lines, with 20% expecting the same for trade credit (see Chart B). By the time the ECB pandemic emergency purchase programme (PEPP) was announced on 18 March, the respective percentages were already at 41% for bank loans, 43% for credit lines and 46% for trade credit.
Chart B Enterprises expecting a deterioration in the availability of external finance over the next six months during the fieldwork
(estimated percentages)
Source: ECB and European Commission, SAFE. Notes: Estimated percentages refer to time fixed effects of a weighted least squares logistic regression controlling for time and country fixed effects. The last three observations (6-8 April) refer to a sub-sample of countries (Germany, Greece, Spain, France and Slovakia) as the interviews in the remaining countries were concluded by 3 April.
The deterioration in the expected access to finance appeared to level off after the PEPP announcement, at least with regard to bank loans and credit lines. Although it is not possible to infer the direct impact of the PEPP announcement on firms’ expectations, there seems to have been some mitigation of their pessimistic view of banking products starting from that date. By contrast, the deterioration of expectations regarding trade credit availability continued for somewhat longer, mostly reflecting the strains in supply relationships with expected delays in obtaining payables due to the crisis.
Firms’ expectations about the availability of financing over the next six months recorded a very sharp deterioration compared with the positive trend recorded
38. These percentages reported in the chart are conditional on the single country effects to take into account
the different degrees of emergency across countries.
0
10
20
30
40
50
60
70
02/03/20 10/03/20 18/03/20 26/03/20 03/04/20
Bank loansTrade creditPEPP announcementCredit linesWHO pandemic

ECB Economic Bulletin, Issue 4 / 2020 – Boxes The COVID-19 pandemic and access to finance for small and medium-sized enterprises: evidence from survey data
59
since the end of the sovereign debt crisis (see Chart C). While worsening is evident for both internal and external financing sources, differences exist between the two.39
Chart C Change in expected availability of financing for euro area firms
(over the next six months; net percentages of respondents)
Source: ECB and European Commission, SAFE. Notes: Base is firms for which the respective instrument is relevant. Figures refer to rounds 1 (April-September 2009) to 22 (October 2019-March 2020) of the survey.
On internal financing sources, SMEs reported a substantial net decline in the expected availability of funds (-17%, from 12%). This is likely to reflect anticipated headwinds for economic activity, which has major implications for firms’ profitability. With the exception of the Netherlands, the deterioration is widespread across countries, with the highest percentages recorded in Portugal (-26%), France (-23%) and Italy (-21%). Overall, the deterioration in the availability of internal funds is more substantial than the lowest point indicated during the sovereign debt crisis (April to September 2012), when 9% of SMEs reported a decline.
Expected availability of external financing sources also registered a deterioration, although less than that of internal financing. Euro area SMEs reported net declines (-11%) for bank-related products, namely bank loans, credit lines and bank overdrafts. The relatively smaller deterioration compared to internal funds may reflect the positive effects of accommodative monetary policy measures and of the various government programmes that have been announced since the start of the pandemic. As for trade credit, SMEs on balance expect a significant reduction (-20%), which may point to the expected interruptions of regular business operations, in turn affecting relations between firms. The strongest declines in the expected availability of external financing were reported among SMEs from Spain, Italy, Portugal and Slovakia. The decline in future access to bank loans was still more limited than in 2012, when a net 15% of SMEs reported a deterioration in expected availability. For trade credit, however, the deterioration is already slightly more acute than in the previous crisis in 2012, when a net 17% expected a reduction.
39 Firms from the service sector appear to be the most pessimistic of all, possibly reflecting particularly
adverse effects of lockdown measures on them. Regarding the size of entities, micro firms are the most affected, according to the survey, with large firms reporting deterioration to a lesser extent.
-30
-20
-10
0
10
20
30
2009
2010
2011
2012
2013
2014
2015
2016
2017
2018
2019
2009
2010
2011
2012
2013
2014
2015
2016
2017
2018
2019
2009
2010
2011
2012
2013
2014
2015
2016
2017
2018
2019
2009
2010
2011
2012
2013
2014
2015
2016
2017
2018
2019
Internal funds Bank loans Credit lines or bank overdrafts Trade credit
SMEsLarge

ECB Economic Bulletin, Issue 4 / 2020 – Boxes Liquidity conditions and monetary policy operations in the period from 29 January to 5 May 2020 60
4 Liquidity conditions and monetary policy operations in the period from 29 January to 5 May 2020
Prepared by Svetla Daskalova and Marco Weißler
This box describes the ECB’s monetary policy operations during the first two reserve maintenance periods of 2020, which ran from 29 January to 5 May. As a response to the coronavirus (COVID-19) crisis and in view of heightened financial market volatility, the Eurosystem decided on a set of measures to ease funding conditions and liquidity availability across sectors and jurisdictions during the two maintenance periods under review.
As part of the COVID-19-related policy measures on the liquidity providing side, the Eurosystem announced amendments to the existing targeted longer-term refinancing operations (TLTRO III) and introduced a series of additional tender operations as well as a broad set of collateral easing measures for Eurosystem counterparties. On 12 March the easing of conditions for the TLTRO III and a new series of additional longer-term refinancing operations (additional LTROs) were introduced to provide immediate liquidity support to banks and to safeguard money market conditions. These measures aimed to serve as a backstop facility during the recent turbulence. The additional LTROs are conducted on a weekly basis and will mature on 24 June 2020, effectively bridging the period until the fourth TLTRO III operation is settled.40
On the asset purchase side, further to the temporary envelope of €120 billion of net asset purchases under the asset purchase programme (APP) agreed on 12 March, on 18 March the ECB announced a new pandemic emergency purchase programme (PEPP) with a volume of €750 billion to last at least until the end of 2020. These additional purchases are intended to counter the risks to the monetary policy transmission mechanism in the euro area stemming from the COVID-19 crisis. These purchases will be conducted in a flexible manner and can be expanded if the crisis phase extends past the end of the year.41
In order to further improve funding conditions in the global US dollar funding market, the Eurosystem, in coordination with the Federal Reserve, Bank of England, Bank of Japan, Bank of Canada and Swiss National Bank, enhanced the provision of US dollar liquidity via the existing US dollar swap lines. Furthermore, the ECB set up euro-providing swap lines with a number of EU central banks. The coordinated action enhancing the existing provision of US dollar liquidity was announced on 15 March, reducing the pricing of US dollar liquidity and introducing an additional US dollar operation with a maturity of 84 days. Furthermore, as of 20 March, the frequency of the seven-day US-dollar-providing operations was
40 Subsequently, on 30 April, additional recalibrations of the targeted longer-term refinancing operations (TLTRO III) and new pandemic emergency longer-term refinancing operations (PELTROs) were introduced to further support the real economy and smooth money market conditions. Both measures will only affect liquidity provision as of the third maintenance period of 2020.
41 In fact, the ECB Governing Council decided on 4 June to expand the size of the PEPP by €600 billion, and to extend the horizon until at least the end of June 2021.

ECB Economic Bulletin, Issue 4 / 2020 – Boxes Liquidity conditions and monetary policy operations in the period from 29 January to 5 May 2020 61
increased from weekly to daily. These measures helped to significantly ease funding conditions in the US dollar funding markets.
Liquidity needs
The average daily liquidity needs of the banking system, defined as the sum of net autonomous factors and reserve requirements, stood at €1,613.4 billion in the period under review (see the section of Table A entitled “Other liquidity-based information”). This was €107.7 billion higher than in the previous review period (i.e. the last two maintenance periods of 2019). Net autonomous factors increased by €106.3 billion to €1477.8 billion, while minimum reserve requirements increased by €1.4 billion to €135.7 billion.
The main drivers of liquidity in the first two maintenance periods of 2020 were increasing government deposits, demand for banknotes, asset purchases and the new series of additional LTROs. Liquidity absorption by autonomous factors increased by €106.3 billion, on average, mainly driven by an exceptional increase in government deposits of €101.7 billion due to prudent government cash management in view of COVID-19. Against the same background, a higher demand for banknotes contributed to further liquidity absorption of €27.7 billion, as the post-year-end seasonal decrease in banknote holdings during the first maintenance period was outweighed by the increase in the second maintenance period. The developments in autonomous factors on the asset side, however, with a net increase of €23.7 billion, had a mild counter effect. Net assets denominated in euro decreased by €51.9 billion, whereas net foreign assets increased by €75.6 billion and partially compensated for the liquidity absorption by government deposits and banknotes. The dynamics on the asset side during the second maintenance period were mainly a result of the higher demand in the US-dollar-providing operations, with a total outstanding amount of €142 billion by the end of the second maintenance period of 2020.

ECB Economic Bulletin, Issue 4 / 2020 – Boxes Liquidity conditions and monetary policy operations in the period from 29 January to 5 May 2020 62
Table A Eurosystem liquidity conditions
Liabilities (averages; EUR billions)
Current review period: 29 January 2020 to 5 May 2020
Previous review period:
30 October 2019 to 28 January 2020
First and second maintenance
periods
First maintenance period:
29 January to 17 March
Second maintenance
period: 18 March to 5 May
Seventh and eighth
maintenance periods
Autonomous liquidity factors 2,510.3 (+130.0) 2,421.8 (+46.9) 2,598.7 (+176.9) 2,380.2 (-0.4)
Banknotes in circulation 1,299.5 (+27.7) 1,277.1 (-5.1) 1,321.9 (+44.7) 1,271.8 (+20.0)
Government deposits 321.5 (+101.7) 268.6 (+56.7) 374.4 (+105.8) 219.8 (-62.7)
Other autonomous factors1 889.3 (+0.6) 876.1 (-4.8) 902.5 (+26.3) 888.7 (+42.3)
Current accounts above minimum reserve requirements
1,595.6 (+85.5) 1,506.7 (+17.5) 1,684.5 (+177.8) 1,510.1 (+284.9)
Minimum reserve requirements 135.7 (+1.4) 135.7 (+1.2) 135.7 (+0.1) 134.3 (+1.7)
Deposit facility 258.2 (+1.8) 244.6 (-10.0) 271.8 (+27.2) 256.4 (-253.6)
Liquidity-absorbing fine-tuning operations 0.0 (+0.0) 0.0 (+0.0) 0.0 (+0.0) 0.0 (+0.0)
Source: ECB. Notes: All figures in the table are rounded to the nearest €0.1 billion. Figures in brackets denote the change from the previous review or maintenance period. 1) Computed as the sum of the revaluation accounts, other claims and liabilities of euro area residents, capital and reserves.
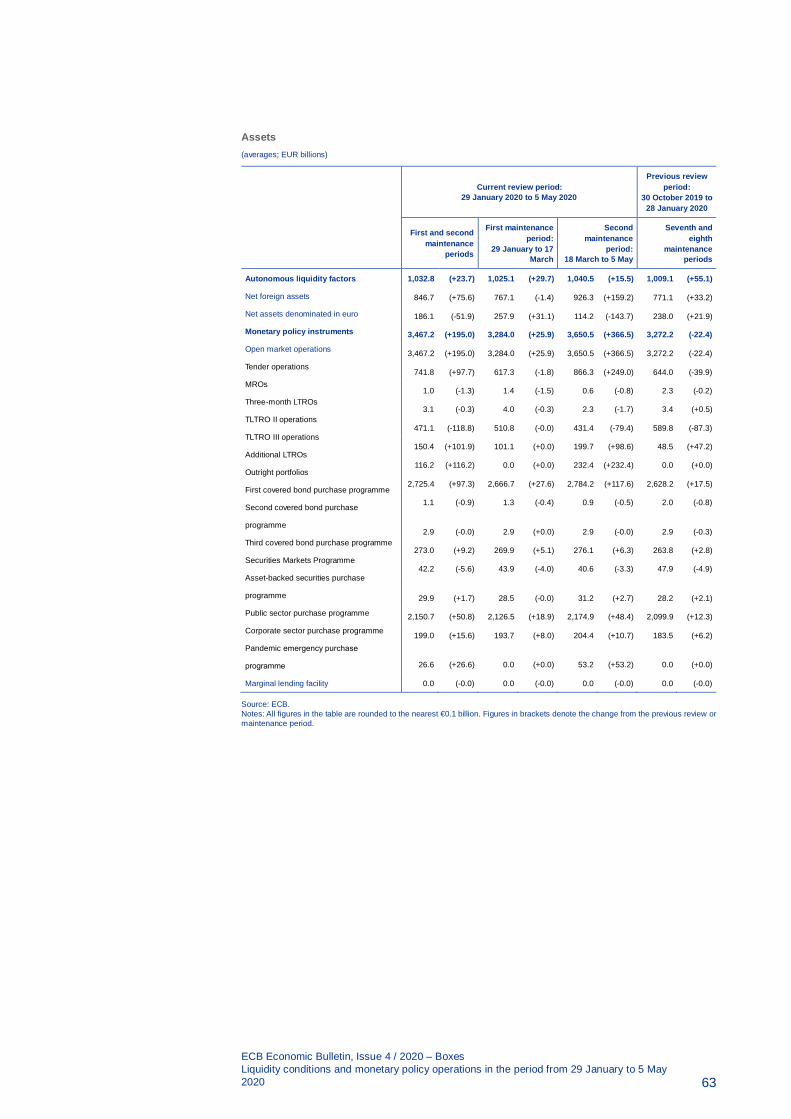
ECB Economic Bulletin, Issue 4 / 2020 – Boxes Liquidity conditions and monetary policy operations in the period from 29 January to 5 May 2020 63
Assets (averages; EUR billions)
Current review period: 29 January 2020 to 5 May 2020
Previous review period:
30 October 2019 to 28 January 2020
First and second maintenance
periods
First maintenance period:
29 January to 17 March
Second maintenance
period: 18 March to 5 May
Seventh and eighth
maintenance periods
1,032.8 (+23.7) 1,025.1 (+29.7) 1,040.5 (+15.5) 1,009.1 (+55.1)
846.7 (+75.6) 767.1 (-1.4) 926.3 (+159.2) 771.1 (+33.2)
186.1 (-51.9) 257.9 (+31.1) 114.2 (-143.7) 238.0 (+21.9)
3,467.2 (+195.0) 3,284.0 (+25.9) 3,650.5 (+366.5) 3,272.2 (-22.4)
3,467.2 (+195.0) 3,284.0 (+25.9) 3,650.5 (+366.5) 3,272.2 (-22.4)
741.8 (+97.7) 617.3 (-1.8) 866.3 (+249.0) 644.0 (-39.9)
1.0 (-1.3) 1.4 (-1.5) 0.6 (-0.8) 2.3 (-0.2)
3.1 (-0.3) 4.0 (-0.3) 2.3 (-1.7) 3.4 (+0.5)
471.1 (-118.8) 510.8 (-0.0) 431.4 (-79.4) 589.8 (-87.3)
150.4 (+101.9) 101.1 (+0.0) 199.7 (+98.6) 48.5 (+47.2)
116.2 (+116.2) 0.0 (+0.0) 232.4 (+232.4) 0.0 (+0.0)
2,725.4 (+97.3) 2,666.7 (+27.6) 2,784.2 (+117.6) 2,628.2 (+17.5)
1.1 (-0.9) 1.3 (-0.4) 0.9 (-0.5) 2.0 (-0.8)
2.9 (-0.0) 2.9 (+0.0) 2.9 (-0.0) 2.9 (-0.3)
273.0 (+9.2) 269.9 (+5.1) 276.1 (+6.3) 263.8 (+2.8)
42.2 (-5.6) 43.9 (-4.0) 40.6 (-3.3) 47.9 (-4.9)
29.9 (+1.7) 28.5 (-0.0) 31.2 (+2.7) 28.2 (+2.1)
2,150.7 (+50.8) 2,126.5 (+18.9) 2,174.9 (+48.4) 2,099.9 (+12.3)
199.0 (+15.6) 193.7 (+8.0) 204.4 (+10.7) 183.5 (+6.2)
26.6 (+26.6) 0.0 (+0.0) 53.2 (+53.2) 0.0 (+0.0)
Autonomous liquidity factors
Net foreign assets
Net assets denominated in euro
Monetary policy instruments
Open market operations
Tender operations
MROs
Three-month LTROs
TLTRO II operations
TLTRO III operations
Additional LTROs
Outright portfolios
First covered bond purchase programme
Second covered bond purchase
programme
Third covered bond purchase programme
Securities Markets Programme
Asset-backed securities purchase
programme
Public sector purchase programme
Corporate sector purchase programme
Pandemic emergency purchase
programme
Marginal lending facility 0.0 (-0.0) 0.0 (-0.0) 0.0 (-0.0) 0.0 (-0.0)
Source: ECB. Notes: All figures in the table are rounded to the nearest €0.1 billion. Figures in brackets denote the change from the previous review or maintenance period.

ECB Economic Bulletin, Issue 4 / 2020 – Boxes Liquidity conditions and monetary policy operations in the period from 29 January to 5 May 2020
64
Other liquidity-based information (averages; EUR billions)
Current review period: 29 January 2020 to 5 May 2020
Previous review period:
30 October 2019 to 28 January
2020
First and second maintenance
periods
First maintenance period:
29 January to 17 March
Second maintenance
period: 18 March to 5 May
Seventh and eighth
maintenance periods
Aggregate liquidity needs1 1,613.4 (+107.7) 1,532.6 (+18.3) 1,694.2 (+161.6) 1,505.7 (-53.7)
Net autonomous factors2 1,477.8 (+106.3) 1,397.0 (+17.2) 1,558.5 (+161.6) 1,371.4 (-55.4)
Excess liquidity3 1,853.8 (+87.3) 1,751.3 (+7.5) 1,956.3 (+205.0) 1,766.5 (+31.3)
Source: ECB. Notes: All figures in the table are rounded to the nearest €0.1 billion. Figures in brackets denote the change from the previous review or maintenance period. 1) Computed as the sum of net autonomous factors and minimum reserve requirements. 2) Computed as the difference between autonomous liquidity factors on the liability side and autonomous liquidity factors on the asset side. For the purpose of this table, items in course of settlement are also added to net autonomous factors. 3) Computed as the sum of current accounts above minimum reserve requirements and the recourse to the deposit facility minus the recourse to the marginal lending facility.
Interest rate developments (averages; percentages)
Current review period: 29 January 2020 to 5 May 2020
Previous review period:
30 October 2019 to 28 January
2020
First and second maintenance
periods
First maintenance period:
29 January to 17 March
Second maintenance
period: 18 March to 5 May
Seventh and eighth
maintenance periods
MRO 0.00 (+0.00) 0.00 (+0.00) 0.00 (+0.00) 0.00 (+0.00)
Marginal lending facility 0.25 (+0.00) 0.25 (+0.00) 0.25 (+0.00) 0.25 (+0.00)
Deposit facility -0.50 (+0.00) -0.50 (+0.00) -0.50 (+0.00) -0.50 (-0.05)
EONIA1 -0.451 (+0.00) -0.454 (-0.00) -0.449 (+0.01) -0.454 (-0.05)
€STR -0.536 (+0.00) -0.539 (+0.00) -0.533 (+0.01) -0.539 (-0.04)
Source: ECB. Notes: All figures in the table are rounded to the nearest €0.1 billion. Figures in brackets denote the change from the previous review or maintenance period. 1) Computed as the euro short-term rate (€STR) plus 8.5 basis points from 1 October 2019. Differences in the changes shown for the euro overnight index average (EONIA) and the €STR are due to rounding.
Liquidity provided through monetary policy instruments
The average amount of liquidity provided through open market operations – including both tender operations and monetary policy portfolios – increased by €195 billion to €3467.2 billion (see Chart A). The overall reported increase in excess liquidity in the first two maintenance periods of 2020 was driven in similar amounts by tender operations and the outright purchases of the Eurosystem. The main sources of this additional liquidity were the additional LTROs as well as asset purchases under the public sector purchase programme (PSPP) and the new PEPP.

ECB Economic Bulletin, Issue 4 / 2020 – Boxes Liquidity conditions and monetary policy operations in the period from 29 January to 5 May 2020
65
Chart A Evolution of liquidity provided through open market operations and excess liquidity
(EUR billions)
Source: ECB. Note: The latest observation is for 5 May 2020.
The average amount of liquidity provided through tender operations increased by €97.7 billion relative to the previous review period. While it remained almost unchanged in the first maintenance period of 2020 (-€1.8 billion), it increased by €249.0 billion in the second maintenance period. This was mainly driven by the uptake of €232.4 billion in the newly introduced LTROs. In addition, the TLTRO II repayments of €93 billion and TLTRO III uptake of €115 billion were settled on 25 March, leading to a net liquidity injection of on average €19.2 billion in the second maintenance period. Liquidity provision via the main refinancing operations (MROs) decreased by €1.3 billion relative to the previous review period. This is mostly due to the elevated MRO volumes during the previous maintenance period covering the year-end and is broadly in line with last year’s changes. The outstanding amount of three-month LTROs decreased slightly, by €0.3 billion.
At the same time, outright portfolios increased by €97.3 billion, from €2,628.2 billion to €2,725.4 billion, owing to the resumption of augmented net purchases under the APP following the agreed additional €120 billion envelope until end of 2020 and the start of the purchases under the new PEPP. Average holdings increased by €50.8 billion to €2,150.7 billion in the public sector purchase programme (PSPP) and by €15.6 billion to €199.0 billion in the corporate sector purchase programme (CSPP) – in line with announced purchase amounts. In addition, on 26 March the Eurosystem started its purchases under the new PEPP. By the end of the second maintenance period, the liquidity provision under the PEPP amounted to €53.2 billion on average over the maintenance period – equivalent to nearly €18 billion of weekly purchases.
Excess liquidity
Average excess liquidity increased by €87.3 billion, from €1,766.5 billion to €1,853.8 billion (see Chart A). This is a result of increasing liquidity provision via
0
500
1,000
1,500
2,000
2,500
3,000
3,500
4,000
07/15 01/16 07/16 01/17 07/17 01/18 07/18 01/19 07/19 01/20
Tender operationsOutright portfoliosExcess liquidity

ECB Economic Bulletin, Issue 4 / 2020 – Boxes Liquidity conditions and monetary policy operations in the period from 29 January to 5 May 2020
66
monetary policy operations including outright portfolios (€195.0 billion), while autonomous factors absorbed liquidity (€106.3 billion) in the euro area.
In addition, although the excess liquidity held in the Eurosystem’s deposit facility increased, its relative share declined further owing to the two-tier system for remunerating excess liquidity holdings. Since only balances held in financial institutions’ current accounts up to their maximum allowance are exempt from negative remuneration at the rate applicable to the deposit facility, financial institutions continue storing funds in their current accounts, which increased by €85.5 billion, rather than the deposit facility, which increased only marginally by €1.8 billion.
Interest rate developments
The €STR remained broadly unchanged during the first two maintenance periods. The ECB’s deposit facility rate as well as the main refinancing operations and marginal lending facility rates were left unchanged by the Governing Council during this period. Consequently, the €STR remained stable at a level of -53.6 basis points (+0.3 basis points compared with the previous review period). The EONIA, which as of October 2019 is calculated as the €STR plus a fixed spread, moved in parallel with the €STR.

ECB Economic Bulletin, Issue 4 / 2020 – Boxes Regional labour market developments during the great financial crisis and subsequent recovery
67
5 Regional labour market developments during the great financial crisis and subsequent recovery
Prepared by Vasco Botelho, Claudia Foroni and Lara Vivian
This box examines regional developments in labour input within the euro area from 2007, the peak in economic activity before the global financial crisis, until 2018. It uses the regional labour market indicators available from the Annual Regional Database of the European Commission (ARDECO).42 For the purposes of comparison, we divide regions into four distinct groups (or quartiles) according to the 2007 GDP per capita distribution in each country (see Figure A). These groups are fixed over time.
Figure A Euro area - Regional distribution of GDP per capita in 2007
Sources: ARDECO and ECB staff calculations. Note: Regions are grouped according to the 2007 GDP per capita distribution in each country.
42 The ARDECO dataset was created by the European Commission’s Directorate General for Regional and
Urban Policy and is currently maintained and updated by the Joint Research Centre. This box uses the data update of 7 April 2020 and focuses on non-outermost regions as identified by level 2 of the 2016 Nomenclature of Territorial Units for Statistics (NUTS2). The countries considered in the analysis are Belgium, Germany, Ireland, Greece, Spain, France, Italy, the Netherlands, Austria, Portugal and Finland. The figures reported for the euro area as a whole comprise the aggregation of the regions in these 11 euro area countries (euro area 11), which represent the euro area in 2007 with the exception of Luxembourg and Slovenia.
Bottom 25%25% to 50%50% to 75%Top 25%

ECB Economic Bulletin, Issue 4 / 2020 – Boxes Regional labour market developments during the great financial crisis and subsequent recovery
68
By 2018 total hours worked had recovered to their pre-crisis levels only in those regions at the top of the GDP per capita distribution, while in the remaining regions they still stood below their 2007 levels.43 The response of total hours worked was asymmetric over the 2007-18 period, with employment in regions in the bottom 25% showing stronger losses during the recession period than the gains recorded during the subsequent recovery (see Chart A).44 Between 2007 and 2018 total hours worked declined by 5.6% in the regions in the bottom quartile, while they increased by 3.2% in the top quartile regions. In the two middle quartiles, total hours worked show a similar profile to the euro area aggregate and by 2018 had returned to levels close to those observed in 2007. As a result, the share of total hours worked in the regions in the top quartile increased by 1.4 percentage points (from 38.7% in 2007 to 40.1% in 2018), while the share of the regions in the bottom quartile decreased by 1.2 percentage points (from 23.2% in 2007 to 22% in 2018).
Chart A Regional developments in total hours worked between 2007 and 2018
(y-axis: log growth rate with respect to the levels observed in 2007)
Sources: ARDECO and ECB staff calculations. Notes: Regions are grouped according to the 2007 GDP per capita distribution in each country. The figures for the euro area are aggregated using data from the 11 euro area countries listed in footnote 1.
The smaller decline in total hours worked in the richer regions during the downturn, as well as the relatively homogeneous developments across regions during the recovery, can be attributed to changes in the employment rate, to the decline in average hours worked during the recession period, and to regional differences in population growth during both periods consistent with labour migrating from poorer to richer regions. Chart B shows how the various factors
43 The results are not driven by the assignment of regions to the different quartiles of their within-country
GDP per capita distribution in 2007, as the results of the analysis described in this box still hold when regions are grouped by the euro area GDP per capita distribution in 2007, or when a single country is removed from the analysis.
44 During the contraction phase (2007-13), the average annual growth rate of total hours worked stood at -0.5% for the top 25% regions, -0.8% for the regions in the above median group, -1.1% for the regions below the median, and -1.8% for the regions in the bottom 25% group. For the euro area as a whole, the average annual decline in total hours worked between 2007 and 2013 stood at -0.97%. The pace of increase in total hours worked during the recovery period was faster in the regions in the top 25% group (1.2%) than in the remaining regions (around 1% per year).
-12
-10
-8
-6
-4
-2
0
2
4
2007 2008 2009 2010 2011 2012 2013 2014 2015 2016 2017 2018
Euro areaBottom 25%25% to 50%50% to 75%Top 25%
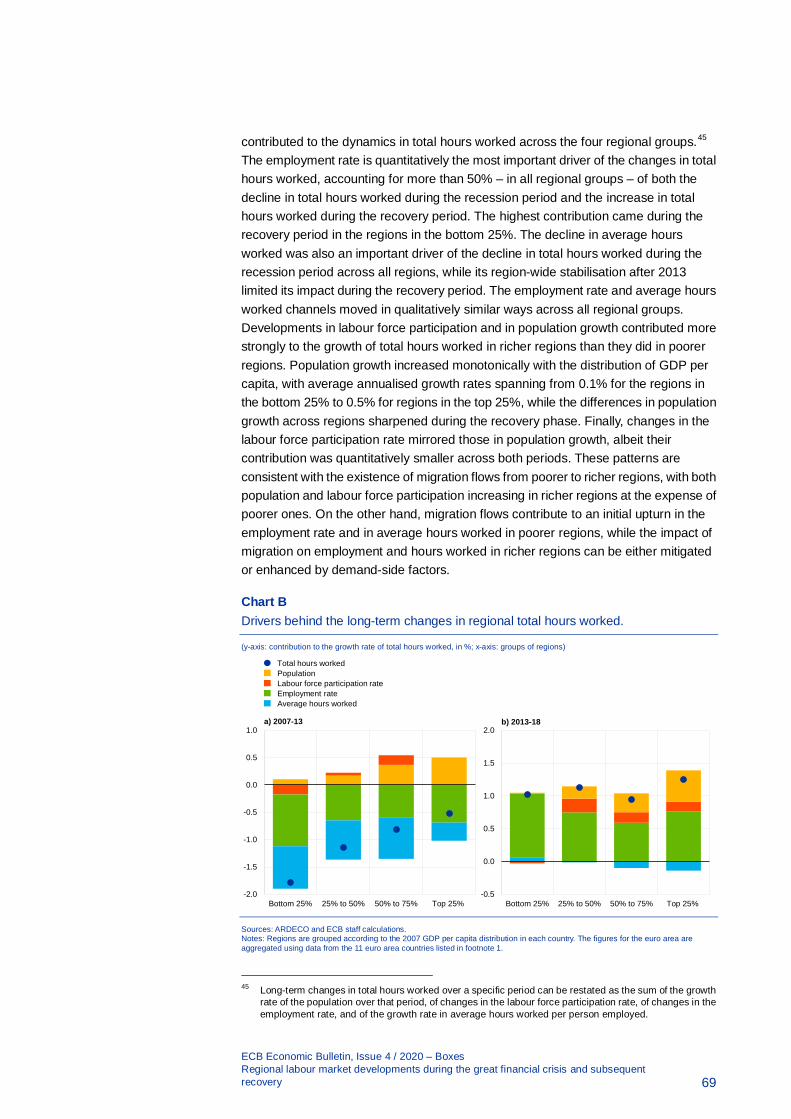
ECB Economic Bulletin, Issue 4 / 2020 – Boxes Regional labour market developments during the great financial crisis and subsequent recovery
69
contributed to the dynamics in total hours worked across the four regional groups.45 The employment rate is quantitatively the most important driver of the changes in total hours worked, accounting for more than 50% – in all regional groups – of both the decline in total hours worked during the recession period and the increase in total hours worked during the recovery period. The highest contribution came during the recovery period in the regions in the bottom 25%. The decline in average hours worked was also an important driver of the decline in total hours worked during the recession period across all regions, while its region-wide stabilisation after 2013 limited its impact during the recovery period. The employment rate and average hours worked channels moved in qualitatively similar ways across all regional groups. Developments in labour force participation and in population growth contributed more strongly to the growth of total hours worked in richer regions than they did in poorer regions. Population growth increased monotonically with the distribution of GDP per capita, with average annualised growth rates spanning from 0.1% for the regions in the bottom 25% to 0.5% for regions in the top 25%, while the differences in population growth across regions sharpened during the recovery phase. Finally, changes in the labour force participation rate mirrored those in population growth, albeit their contribution was quantitatively smaller across both periods. These patterns are consistent with the existence of migration flows from poorer to richer regions, with both population and labour force participation increasing in richer regions at the expense of poorer ones. On the other hand, migration flows contribute to an initial upturn in the employment rate and in average hours worked in poorer regions, while the impact of migration on employment and hours worked in richer regions can be either mitigated or enhanced by demand-side factors.
Chart B Drivers behind the long-term changes in regional total hours worked.
(y-axis: contribution to the growth rate of total hours worked, in %; x-axis: groups of regions)
Sources: ARDECO and ECB staff calculations. Notes: Regions are grouped according to the 2007 GDP per capita distribution in each country. The figures for the euro area are aggregated using data from the 11 euro area countries listed in footnote 1.
45 Long-term changes in total hours worked over a specific period can be restated as the sum of the growth
rate of the population over that period, of changes in the labour force participation rate, of changes in the employment rate, and of the growth rate in average hours worked per person employed.
-2.0
-1.5
-1.0
-0.5
0.0
0.5
1.0
Bottom 25% 25% to 50% 50% to 75% Top 25%
Total hours workedPopulationLabour force participation rateEmployment rateAverage hours worked
a) 2007-13
-0.5
0.0
0.5
1.0
1.5
2.0
Bottom 25% 25% to 50% 50% to 75% Top 25%
b) 2013-18

ECB Economic Bulletin, Issue 4 / 2020 – Boxes Regional labour market developments during the great financial crisis and subsequent recovery
70
The widening gap in the compensation of employees between regions is mostly driven by the regional dispersion of the long-term changes in total hours worked, with the growth rates of compensation per hour worked being broadly comparable across regions (see Table A). The share of compensation of employees in the regions in the top 25% increased by 0.7 percentage points between 2007 and 2018, from 45.2% in 2007 to 45.9% in 2018. In the regions in the bottom 25%, the share decreased by roughly 0.9 percentage points over the same period, from 18.1% in 2007 to 17.2% in 2018. However, the widening gap in compensation of employees across regions stems mostly from regional developments in labour input. The growth rate of compensation per hour worked is in fact comparable across regions, and during the contraction period was even lower for the regions in the richest 25% than for the remaining regions. This development may be explained by the fact that labour supply increased in rich regions as a result of migration flows both from poorer to richer regions and from outside the euro area. The similar rate of increase in compensation per hour worked across regions may be related to the strong increase in labour supply in richer regions and to the mitigation of the decline in average hours worked in the remaining regions during the contraction period. The developments in compensation per hour worked may also be related to the country and industrial composition of the groups of regions and, therefore, to the impact of labour market policies in place during the great financial crisis and subsequent recovery, such as short-time working schemes and wage-bargaining agreements.46
Table A Growth in total hours worked and in compensation of employees across the euro area
2007-2013 (yearly log growth rate, in %) 2013-2018 (yearly log growth rate, in %)
Compensation of employees
(total) Total hours
worked
Compensation per hour worked
(average)
Compensation of employees
(total) Total hours
worked
Compensation per hour worked
(average)
Total 0.47 -0.97 1.44 1.88 1.12 0.77
Top 25% 0.66 -0.51 1.17 1.98 1.25 0.73
Above median 0.72 -0.81 1.53 1.74 0.94 0.80
Below median 0.39 -1.14 1.53 2.02 1.13 0.88
Bottom 25% -0.24 -1.79 1.55 1.66 1.02 0.64
Sources: ARDECO and ECB staff calculations. Notes: Regions are grouped according to the 2007 GDP per capita distribution in each country. The figures for the euro area are aggregated using data from the 11 euro area countries listed in footnote 1.
Overall, the evolution of total hours worked in the euro area between 2007 and 2018 was very heterogeneous across regions, with richer regions being more insulated during the recession period and poorer regions not fully catching up during the recovery period. These differing patterns across regions can be attributed to changes in the employment rate, to the decline in average hours worked during the recession period, and to the stability of regional differences in population growth during both the recession and recovery periods. Migration from poorer to richer
46 Short-time working schemes may have influenced the increase in compensation per hour worked by
allowing for greater flexibility in the decline of average hours worked by employees during the contraction period while protecting workers’ pay during the same period. At the same time, national wage bargaining agreements may also partly explain the stronger wage per hour growth performance seen in the bottom two quartiles by comparison with regions in the top two quartiles.

ECB Economic Bulletin, Issue 4 / 2020 – Boxes Regional labour market developments during the great financial crisis and subsequent recovery
71
regions within the euro area is likely to be a driving force behind those trends, and may, in turn, have contributed to the increase in regional differences in compensation of employees between 2007 and 2018. Moreover, the gap between richer and poorer regions in the cumulative growth of total hours worked, employment and compensation of employees widened in a number of euro area countries between 2007 and 2018, in addition to the cross-country heterogeneity in labour market patterns. The heterogeneous impact on total hours worked, employment and compensation might also be related to the observed differences in the sectoral composition of the different regional groups, with the sectors experiencing the largest drop in employment and cumulative wages tending to be located in regions with a lower GDP per capita rate, while thriving industries are mainly based in richer regions.

ECB Economic Bulletin, Issue 4 / 2020 – Boxes Short-time work schemes and their effects on wages and disposable income
72
6 Short-time work schemes and their effects on wages and disposable income
Prepared by António Dias da Silva, Maarten Dossche, Ferdinand Dreher, Claudia Foroni and Gerrit Koester
Short-time work and temporary lay-offs are key instruments for cushioning the economic impact of the coronavirus (COVID-19) pandemic. Various euro area countries have implemented or revised their short-time work or temporary lay-off schemes47 in order to limit households’ loss of income and firms’ wage costs.48 These schemes also support the economic recovery: they preserve employment relationships so that the workers are available and the firms ready to resume activity once lockdown measures are lifted. There is substantial evidence that these support schemes considerably dampen employment losses in the euro area, compared to countries where such schemes are either scarce (e.g. the United States) or non-existent.49 Such schemes are designed to bridge temporary shortfalls in activity and demand and need to be balanced with the need for economic restructuring and employment reallocation within and across sectors.
This box estimates take-up rates and calculates wage replacement rates for the schemes in the five largest countries in the euro area. These economies account for more than 80% of the euro area-wide compensation of employees. Combining wage replacement rates with the number of participants makes it possible to calculate the impact of short-time work on household disposable income during the pandemic. Understanding the effects of current and planned short-time work and temporary lay-off schemes is important for developing macroeconomic projections. Therefore the impact of the schemes needs to be monitored as and when more information becomes available regarding actual take-ups.
The effects of short-time work schemes on income losses vary according to the reduction in working time. Chart A illustrates that an average employee covered by a short-time work scheme – e.g. in Germany50, Italy or Spain – is expected to face a loss in net take-home pay of around 25% when working 50% of their regular hours and of around 50% when working zero hours (abstracting from additional sector or firm-specific regulations). The maximum duration of schemes differs substantially across countries.
47 Changes to existing short-time work schemes have generally been focused on the faster processing of
applications, broader eligibility, the compensation of social security contributions, an extension to temporary agency workers, or a change in the duration of the scheme.
48 Following the spread of the coronavirus pandemic to Europe, the European Commission also proposed a Council Regulation creating an “instrument for temporary Support to mitigate Unemployment Risks in an Emergency” (SURE).
49 For a discussion on short-time work during the current crisis see, for example, Giupponi, G. and Landais, C. “Building effective short-time work schemes for the COVID-19 crisis”, VOX-EU, 1 April 2020; or Adams-Prassl, A., Boneva T., Golin M., and Rauh , C. “Inequality in the Impact of the Coronavirus Shock: Evidence from Real Time Surveys”, IZA Discussion Paper Series, No 13183, 2020.
50 In Germany, a special regulation is foreseen for 2020: from the fourth month of short-time work onwards, the share of lost income compensated for by the scheme rises to 70% for recipients without children experiencing a loss in working hours of at least 50%.

ECB Economic Bulletin, Issue 4 / 2020 – Boxes Short-time work schemes and their effects on wages and disposable income
73
Chart A Wage replacement rates for average wage earners
(percentage of net wages and salaries per employee for percentage of regular full-time hours worked)
Sources: ECB staff estimates based on national regulations and input from national central banks. Notes: The calculations show the net wage income of individual households without children in the first months of receiving the benefit.
“Min.” reflects the minimum reduction in working hours required to receive the benefit.
Depending on the design of national schemes, their effects on measures of compensation per employee and on compensation per hour can differ substantially between euro area countries. While in Germany and Spain benefits are paid directly to employees, in the Netherlands, France and Italy employers receive a subsidy to finance their payments to employees. In different countries such schemes may be reflected in statistics in different ways, depending on the classification decided upon by Eurostat. If the benefits are paid directly to employees and recorded as social transfers, while wages and salaries decrease in relation to the number of hours worked, these schemes may show as a strong downward shift in compensation per employee. By contrast, in countries where a scheme is based on a subsidy paid to employers, who continue to pay full salaries for a reduced number of hours worked, the schemes may imply a higher compensation per hour.
In all five of the largest euro area countries it is likely that a substantial share of employees is on short-time work or temporary lay-off. Preliminary estimates (Chart B) based on different sources suggest there may be about 10 million employees covered by these schemes in Germany (24% of employees) and about 12 million in France (47% of employees). The equivalent numbers are estimated to be 8.5 million in Italy (44% of employees), 3.9 million in Spain (23% of employees) and 1.7 million in the Netherlands (21% of employees). As official data for some of these countries have yet to be released these figures should be viewed with caution. Here they are used for illustrative purposes to gauge the income effects of the measures. Moreover, the figures are likely to be an upper bound, reflecting take-up rates during the time lockdown measures were in place. Additional government measures designed to support the self-employed are not analysed in this box.
0
10
20
30
40
50
60
70
80
90
100
(Min
.) 90 50 0
(Min
.) 90 50 0 50 0 50 0
(Min
.) 80 50 0
DE ES FR IT NL
SalarySupportLoss

ECB Economic Bulletin, Issue 4 / 2020 – Boxes Short-time work schemes and their effects on wages and disposable income
74
Chart B Estimates of the number of employees on short-time work/temporary lay-off
(left-hand scale: millions of employees; right-hand scale: percentage of employees)
Sources: ECB staff estimates based on information from the IAB (for Germany), Dares (for France), the INPS (for Italy), Factiva (for Spain) and the UWV (for the Netherlands). Note: Based on data collected up to mid-May 2020.
The precise impact of short-time work on households’ disposable income is as yet uncertain. Not only has the number of recipients been changing rapidly, but the precise reduction in the number of hours worked per recipient also remains unknown. To assess the importance of short-time work schemes for households’ disposable income, Chart C presents two illustrations showing a high impact period (applicable during the lockdowns) and a low impact period (with relatively less stringent containment measures applicable after the lockdowns) based on calculations for the five largest euro area countries. Overall, the characteristics of these two periods are in line with the medium scenario for euro area activity in the second quarter of 2020, with strict lockdowns ending in the course of May 2020.51
Short-time work benefits are significantly buffering the impact of COVID-19 on households’ disposable income. In the absence of short-time work benefits the drop in euro area households’ labour income from reduced hours worked could amount to -22% during the lockdowns (Chart C, high impact period).52 However, thanks to short-time work benefits the drop in net labour income should only amount to -7%, although significant differences between individuals and across countries need to be acknowledged. As labour income accounts for about two-thirds of household disposable income, short-time work schemes could be expected to provide a buffer of about 10% of household disposable income (i.e. abstracting from mixed income and property income). After the end of the lockdowns the low impact period illustrates that the loss in net labour income could diminish to -3%, while short-time work benefits rapidly diminish.
51 See the medium scenario discussed in the box entitled “Alternative scenarios for the impact of the
COVID-19 pandemic on economic activity in the euro area”, Economic Bulletin, Issue 3, ECB, 2020. 52 It is assumed that for each recipient working hours are reduced by 75% on average. This assumed
reduction in hours worked is, for example, higher than the actual reduction in hours worked for recipients of short-time work benefits in Germany during the financial crisis. However, it seems reasonable given the substantial reduction in hours worked in several sectors during the lockdown.
0
5
10
15
20
25
30
35
40
45
50
0
2
4
6
8
10
12
14
DE FR IT ES NL
Workers on short-time work schemes/temporary lay-offShare of total employees

ECB Economic Bulletin, Issue 4 / 2020 – Boxes Short-time work schemes and their effects on wages and disposable income
75
As short-time work schemes help to preserve jobs during the crisis, they also mitigate the rise in income uncertainty. Short-time work schemes do not only help households to preserve their income, they also help companies to preserve their cash flow. As a result, fewer jobs should be at risk until the economic recovery arrives. Reducing household income uncertainty is a further channel through which public policy can help to alleviate the adverse effects of the coronavirus pandemic on household spending.
Chart C Short-time work and labour income in the euro area
(percentage changes, percentage point contributions)
Sources: ECB staff estimates for the (five largest countries of the) euro area based on preliminary information on the number of short-time workers from the IAB (for Germany), Dares (for France), the INPS (for Italy), Factiva (for Spain) and the UWV (for the Netherlands). Notes: The high impact period uses the estimated number of employees on short-time work in Chart B and assumes a reduction of hours worked by on average 75% per recipient. The low impact period assumes only half of the number of affected employees in the high impact scenario. It assumes a smaller reduction of hours worked per recipient, by on average 60%.
-30
-20
-10
0
10
20
High impact period Low impact period
Total hours workedNet labour incomeLabour income (excl. short-time work)Short-time work benefits

ECB Economic Bulletin, Issue 4 / 2020 – Boxes The COVID-19 crisis and its implications for fiscal policies
76
7 The COVID-19 crisis and its implications for fiscal policies
Prepared by Stephan Haroutunian, Sebastian Hauptmeier and Nadine Leiner-Killinger
The coronavirus (COVID-19) pandemic has put unprecedented burdens on euro area countries’ economies and government finances, which will require a strong EU response in addition to action at national level. On 20 May the European Commission released its country-specific recommendations for economic and fiscal policies under the 2020 European Semester.53 On 27 May it released proposals for a recovery fund to support the recovery with future investment and structural reforms.54 This box examines how national fiscal policies are being coordinated under this year’s European Semester and explains that, in order to ensure an even recovery among euro area countries and to combat fragmentation, sizeable support will be required beyond that already provided at national level.
In response to the dramatic COVID-19 shock, all euro area countries implemented packages of fiscal measures. These packages consist of discretionary fiscal stimulus measures, state guarantees for loans to firms and other liquidity support measures. An important component of the discretionary measures relates to support for firms, in particular to preserve employment.55 Countries have also focused on health spending and measures aimed at supporting the unemployed and other vulnerable groups through various social transfers. On the revenue side, deferrals of tax and social security contributions are aimed mainly at providing liquidity support to households and companies. According to the European Commission’s Spring 2020 Economic Forecast, the discretionary fiscal measures amount to 3.25% of GDP at the aggregate euro area level. In addition, state guarantees for loans to firms and other liquidity support measures amount to around 20% of euro area GDP, according to governments’ budgetary plans as outlined in the stability programmes published at the end of April. 56 These plans, however, reveal large differences in the size of the packages adopted across countries, most notably in the amount of state guarantees provided. Such differences raise the risk of an uneven recovery in the euro area and fragmentation between euro area economies.
To facilitate a sufficient immediate response to the exceptional crisis, the ECOFIN Council on 23 March activated the Stability and Growth Pact’s general escape clause. In the event of a severe economic downturn for the euro area or the EU as a whole, and provided debt sustainability does not become endangered, the triggering of this clause allows countries to depart from the fiscal adjustment requirement that would usually apply under the EU’s fiscal rules.57 The ECOFIN
53 For details, see 2020 European Semester: Country Specific Recommendations / Commission
Recommendations. The recommendations were endorsed by the ECOFIN Council on 9 June. 54 For details, see “Europe's moment: Repair and prepare for the next generation”. 55 See also the box entitled “Short-time work schemes and their effects on wages and disposable income”
in this issue of the Economic Bulletin. 56 For more information, see 2020 European Semester: National Reform Programmes and
Stability/Convergence Programmes. 57 For details, see the Statement of EU ministers of finance on the Stability and Growth Pact in light of the
COVID-19 crisis of 23 March 2020.
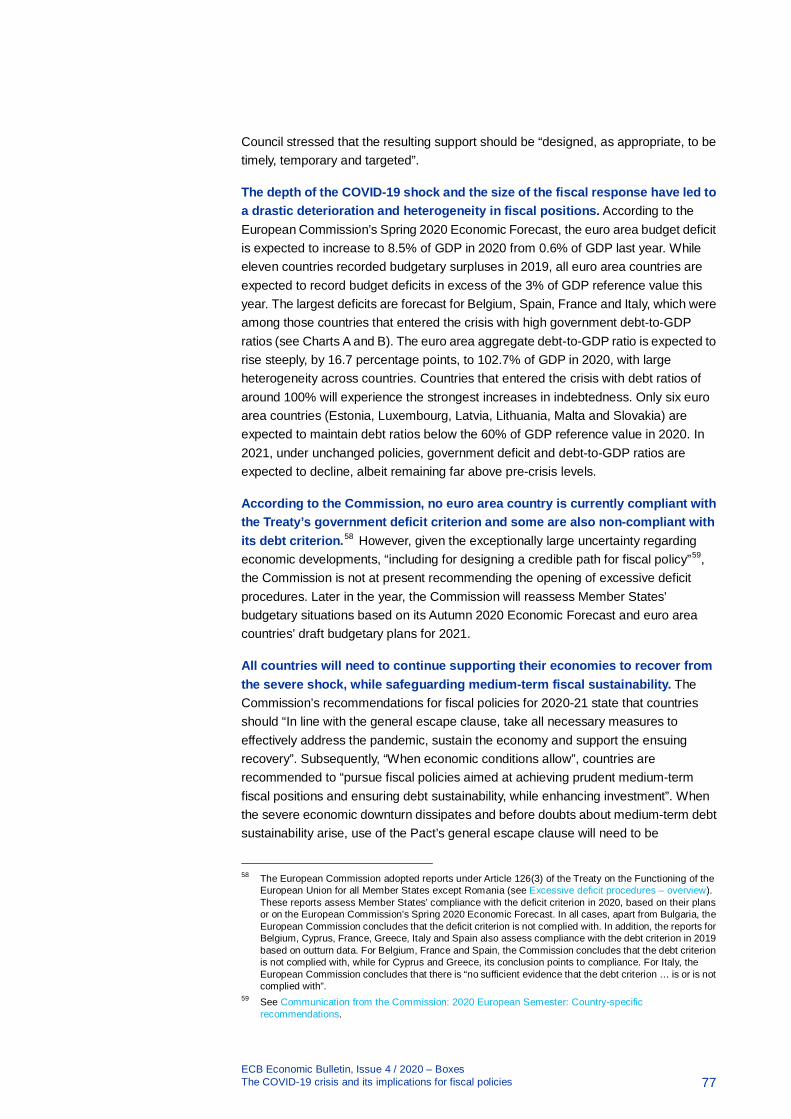
ECB Economic Bulletin, Issue 4 / 2020 – Boxes The COVID-19 crisis and its implications for fiscal policies
77
Council stressed that the resulting support should be “designed, as appropriate, to be timely, temporary and targeted”.
The depth of the COVID-19 shock and the size of the fiscal response have led to a drastic deterioration and heterogeneity in fiscal positions. According to the European Commission’s Spring 2020 Economic Forecast, the euro area budget deficit is expected to increase to 8.5% of GDP in 2020 from 0.6% of GDP last year. While eleven countries recorded budgetary surpluses in 2019, all euro area countries are expected to record budget deficits in excess of the 3% of GDP reference value this year. The largest deficits are forecast for Belgium, Spain, France and Italy, which were among those countries that entered the crisis with high government debt-to-GDP ratios (see Charts A and B). The euro area aggregate debt-to-GDP ratio is expected to rise steeply, by 16.7 percentage points, to 102.7% of GDP in 2020, with large heterogeneity across countries. Countries that entered the crisis with debt ratios of around 100% will experience the strongest increases in indebtedness. Only six euro area countries (Estonia, Luxembourg, Latvia, Lithuania, Malta and Slovakia) are expected to maintain debt ratios below the 60% of GDP reference value in 2020. In 2021, under unchanged policies, government deficit and debt-to-GDP ratios are expected to decline, albeit remaining far above pre-crisis levels.
According to the Commission, no euro area country is currently compliant with the Treaty’s government deficit criterion and some are also non-compliant with its debt criterion.58 However, given the exceptionally large uncertainty regarding economic developments, “including for designing a credible path for fiscal policy”59, the Commission is not at present recommending the opening of excessive deficit procedures. Later in the year, the Commission will reassess Member States’ budgetary situations based on its Autumn 2020 Economic Forecast and euro area countries’ draft budgetary plans for 2021.
All countries will need to continue supporting their economies to recover from the severe shock, while safeguarding medium-term fiscal sustainability. The Commission’s recommendations for fiscal policies for 2020-21 state that countries should “In line with the general escape clause, take all necessary measures to effectively address the pandemic, sustain the economy and support the ensuing recovery”. Subsequently, “When economic conditions allow”, countries are recommended to “pursue fiscal policies aimed at achieving prudent medium-term fiscal positions and ensuring debt sustainability, while enhancing investment”. When the severe economic downturn dissipates and before doubts about medium-term debt sustainability arise, use of the Pact’s general escape clause will need to be
58 The European Commission adopted reports under Article 126(3) of the Treaty on the Functioning of the
European Union for all Member States except Romania (see Excessive deficit procedures – overview). These reports assess Member States’ compliance with the deficit criterion in 2020, based on their plans or on the European Commission’s Spring 2020 Economic Forecast. In all cases, apart from Bulgaria, the European Commission concludes that the deficit criterion is not complied with. In addition, the reports for Belgium, Cyprus, France, Greece, Italy and Spain also assess compliance with the debt criterion in 2019 based on outturn data. For Belgium, France and Spain, the Commission concludes that the debt criterion is not complied with, while for Cyprus and Greece, its conclusion points to compliance. For Italy, the European Commission concludes that there is “no sufficient evidence that the debt criterion … is or is not complied with”.
59 See Communication from the Commission: 2020 European Semester: Country-specific recommendations.

ECB Economic Bulletin, Issue 4 / 2020 – Boxes The COVID-19 crisis and its implications for fiscal policies
78
discontinued. Fiscal policies will then need to resume the adjustments provided for in the Pact.
Chart A General government budget balances, 2019-2021
(percentages of GDP)
Sources: European Commission (AMECO database) and ECB calculations.
Chart B General government gross debt, 2019-2021
(percentages of GDP)
Sources: European Commission (AMECO database) and ECB calculations.
A strong European response is required to support the recovery and avoid economic fragmentation in the euro area, and first steps have been taken. Safety nets for workers, businesses and sovereigns have been put in place, amounting to a package worth up to €540 billion. First, a European instrument for temporary Support to mitigate Unemployment Risks in an Emergency (SURE) will provide loans to sovereigns and is expected to unlock funding for national short-time employment schemes as well as for some health-related expenditure for the duration of the emergency. Loans totalling up to €100 billion will be granted to Member States on favourable terms, building on the EU budget as much as possible and secured by
-12
-9
-6
-3
0
3
LU IE AT NL GR PT MT LT DE CY SI LV FI EE EA SK BE FR ES IT
Budget balance in 2020 Budget balance in 2021
Budget balance in 2019
0
20
40
60
80
100
120
140
160
180
200
EE LU LV LT MT SK NL IE FI DE AT SI EA BE ES CY FR PT IT GR
General government debt in 2020General government debt in 2021
General government debt in 2019

ECB Economic Bulletin, Issue 4 / 2020 – Boxes The COVID-19 crisis and its implications for fiscal policies
79
guarantees provided by Member States.60 Second, a €25 billion pan-European guarantee fund will be created to strengthen the activities of the European Investment Bank (EIB). This could support €200 billion of financing for companies, including through national development banks.61 Third, as a safeguard for euro area sovereigns, a Pandemic Crisis Support instrument was established, based on the European Stability Mechanism’s (ESM) existing precautionary credit line, the Enhanced Conditions Credit Line (ECCL). Access granted will be 2% of the respective Member State’s 2019 GDP, with an overall envelope of €240 billion. The sole requirement to access the credit line is that Member States requesting support “commit to use this credit line to support domestic financing of direct and indirect healthcare, cure and prevention related costs due to the COVID 19 crisis”.62
Nonetheless, further efforts to prepare and support the recovery at EU level are needed. On 27 May the European Commission presented its proposals for a recovery plan which includes a new €750 billion recovery instrument called “Next Generation EU”, embedded within a reinforced multiannual financial framework (MFF). Next Generation EU would consist of €500 billion in grants and €250 billion in loans to Member States, notably to support investment and structural reforms. Priority will be given to long-term strategic investments to support green and digital transition. Going forward, it is important that EU Member States reach a timely agreement on strong efforts to support their economies.
60 See Council Regulation (EU) 2020/672 of 19 May 2020 on the establishment of a European instrument
for temporary support to mitigate unemployment risks in an emergency (SURE) following the COVID-19 outbreak (OJ L 159, 20.5.2020, p. 1).
61 See “EIB Board approves €25 billion Pan-European Guarantee Fund in response to COVID-19 crisis”. 62 See “ESM Pandemic Crisis Support”.

ECB Economic Bulletin, Issue 4 / 2020 – Articles Citizens’ attitudes towards the ECB, the euro and Economic and Monetary Union
80
Articles
1 Citizens’ attitudes towards the ECB, the euro and Economic and Monetary Union
Prepared by Stephanie Bergbauer, Nils Hernborg, Jean-François Jamet, Eric Persson and Hanni Schölermann
Building on the literature on trust in institutions, the article looks at the state, evolution and sociodemographic breakdown of citizens’ trust in the ECB and support for the euro. Drawing on a novel typology of attitudes towards Economic and Monetary Union (EMU) and using microdata from Eurobarometer surveys since the introduction of the single currency, the analysis tracks the prevalence of supporters and sceptics of EMU over time and across euro area countries. It further explores the sociodemographic characteristics, economic perceptions and, more broadly, European sentiments within these groups. In this way, it provides insights into the factors shaping citizens’ attitudes towards the ECB, the euro and EMU, and helps identify possible avenues for enhancing trust. The analysis indicates that popular support for EMU – in particular, trust in the ECB – hinges to a large extent on citizens’ perceptions of their personal situation and the overall economic context, as well as their broader attitudes towards the European Union, while other sociodemographic indicators seem to be less relevant.
1 Introduction
The financial and sovereign debt crisis brought issues of economic and monetary integration to the forefront of European and national political debates. This article explores the impact of these developments on public opinion. To this end, it traces developments in citizens’ attitudes towards European Economic and Monetary Union (EMU) along two central dimensions: citizens’ support for the euro as the most tangible outcome of economic and monetary integration at the European level; and citizens’ trust in the European Central Bank (ECB) as the institution tasked with defining and implementing monetary policy for the euro area and safeguarding the stability of the single European currency.
While the euro and the ECB are closely linked at the institutional level, public opinion towards the two has followed divergent trends since the crisis. Citizens’ support for the euro remained stable at high levels even at the height of the crisis. By contrast, public trust in the ECB declined significantly during the crisis and has since been slow to recover. In autumn 2019 support for the euro among euro area citizens stood at 76%, following an almost continuous increase from spring 2016, while 18% of respondents in the euro area were opposed to the euro. By contrast, a total of 42% of euro area respondents expressed trust in the ECB, compared with 44% who said they

ECB Economic Bulletin, Issue 4 / 2020 – Articles Citizens’ attitudes towards the ECB, the euro and Economic and Monetary Union
81
did not trust the institution.63 As a result, net trust in the ECB remains in negative territory, while net support for the euro has been increasing steadily since 2013 and reached a record high in autumn 2019 (see Chart 1).
Chart 1 Net trust in the ECB and net support for the euro
Euro area, spring 1999 – autumn 2019 (percentage points)
Sources: Eurobarometer, own calculations. Notes: Net support for the euro is calculated as the share answering “for” minus the share answering “against” to the question “Please tell me whether you are for or against it: A European economic and monetary union with one single currency, the euro.” Net trust is calculated as the share of respondents giving the answer “Tend to trust” minus the share giving the answer “Tend not to trust” to the question “Please tell me if you tend to trust it or tend not to trust it?: The European Central Bank.” Respondents who answered “don't know” are excluded in both cases.
This article explores this divergence in citizens’ support for the euro and trust in the ECB in greater detail. Who are the citizens who support the common currency, but do not have confidence in the ECB? How do they differ from those citizens who support the euro and have trust in the ECB? To explore these questions, we introduce a fourfold typology of attitudes towards EMU based on different combinations of citizens’ views on the euro and the ECB. Drawing on survey data from the Eurobarometer, we analyse the prevalence of the different groups in the general public of the euro area from the inception of the common currency in 1999 to 2019.64 We explore variation at euro area EU Member State and regional levels, among different sociodemographic groups and based on citizens’ economic perceptions and socio-political orientations.
2 The relevance of public trust in the ECB and support for the euro
Public trust matters for central banks. Central banks rely on steering inflation expectations to fulfil their mandate. This requires a basic understanding of economic and financial matters, and a high level of trust among the public. A high level of trust in 63 European Commission, Autumn 2019 Standard Eurobarometer (EB 92) – Public opinion in the European
Union, First results (fieldwork conducted in October 2019), November 2019. 64 For data availability reasons, this analysis cannot assess potential changes in public opinion towards the
euro and the ECB in the context of the coronavirus (COVID-19) pandemic that started in early 2020.
-30
-20
-10
0
10
20
30
40
50
60
70
1999 2001 2003 2005 2007 2009 2011 2013 2015 2017 2019
Net trust in the ECBNet support for the euro

ECB Economic Bulletin, Issue 4 / 2020 – Articles Citizens’ attitudes towards the ECB, the euro and Economic and Monetary Union
82
the central bank’s ability to fulfil its mandate facilitates its task of anchoring inflation expectations, increasing the effectiveness of the central bank’s monetary policy measures. Conversely, a lack of public trust makes the central bank more vulnerable to political pressure, as politicians have greater incentive to make critical comments and could undermine its independence.65
Trust in the ECB is correlated with citizens’ understanding of its mandate and affects the formation of household inflation expectations. There is evidence that individuals’ inflation expectations are related to their knowledge of the ECB’s policy objective and their knowledge of how the ECB provides information about its monetary policymaking process.66 Research also suggests that trust in the ECB affects the formation of household inflation expectations,67 including when controlling for respondents’ knowledge of the ECB’s objectives and their level of financial literacy.68
Citizens’ support provides legitimacy to the project of EMU. Citizens’ support provides the necessary legitimacy for supranational governance in an area that is traditionally a core competence of the nation state, namely to conduct its own monetary policy. It is important that the public understands and accepts the ECB’s policies in order to reinforce its strong political independence. Moreover, while the sustainability of a currency is mostly taken for granted in the national context, it has been argued that, as a union of sovereign states, EMU must ultimately rely on a “sense of common purpose”69 that provides a political bond among members of the monetary union beyond standard economic arguments.70 These political bonds were even more important during the global financial crisis that started in 2008, when membership in the euro area was framed as creating winners and losers, and questions regarding the desirability of European economic integration became salient in national political debates and election campaigns.71
65 See Ehrmann, M. and Fratzscher, M., “Politics and Monetary Policy” , Review of Economics and
Statistics, Vol. 93, 2011, pp. 941-960; Ehrmann, M., Soudan, M. and Stracca, L., “Explaining European Union Citizens’ Trust in the European Central Bank in Normal and Crisis Times”, The Scandinavian Journal of Economics, Vol. 115, 2013, pp. 781-807.
66 See, for example, van der Cruijsen, C., Jansen, D.-J. and de Haan, J., “How Much Does the Public Know about the ECB's Monetary Policy? Evidence from a Survey of Dutch Households”, International Journal of Central Banking, Vol. 11, 2015, pp. 169-218; van der Cruijsen, C.A.B. and Eijffinger, S.C.W., “From actual to perceived transparency: The case of the European Central Bank”, Journal of Economic Psychology, Vol. 31, 2010, pp. 388-399.
67 See, for example, Mellina, S. and Schmidt, T., “The Role of Central Bank Knowledge and Trust for the Public's Inflation Expectations”, Deutsche Bundesbank Discussion Paper, No 32, 2018 or Baerg, N., Duell, D. and Lowe, W., “Central Bank Communication as Public Opinion: Experimental Evidence”, 2018, work in progress.
68 See Christelis, D., Georgarakos, D., Jappelli, T. and van Rooij, M., “Trust in the Central Bank and Inflation Expectation”, Working Paper Series, No 2375, ECB, Frankfurt am Main, February 2020.
69 De Grauwe, P., Economics of Monetary Union, 11th edition, Oxford University Press, 2016. 70 See Bergbauer, S., Jamet, J.-F., Schölermann, H., Stracca, L. and Stubenrauch, C., “Global Lessons
from Euroscepticism”, VoxEU, September 2019. 71 Cramme, O. and Hobolt, S.B., Democratic Politics in a European Union under Stress, Oxford University
Press, 2014.
ECB Economic Bulletin, Issue 4 / 2020 – Articles Citizens’ attitudes towards the ECB, the euro and Economic and Monetary Union
83
3 A puzzle with four pieces: a typology of attitudes towards EMU
Support for the euro can be conceptualised as a reflection of both satisfaction with the concrete output of the currency and support for the value of economic integration. Citizens’ perceptions of the euro are likely to represent both their concrete experiences with the currency in day-to-day life and a more diffuse support of the idea of a currency union and the value of economic and monetary integration that underpins the EMU regime. In effect, the euro is considered one of the most visible embodiments of the EU,72 and citizens’ support for the value of European integration is positively related to support for the euro.73
Trust in the ECB represents a form of institutional trust, reflecting a positive perception of the central bank and its specific policies. The most concrete output and obvious yardstick for assessing the ECB’s performance is the inflation rate as a measure of price stability, which is the ECB’s primary objective pursuant to the Treaty on the Functioning of the European Union (TFEU). However, in the course of the global financial crisis, the ECB was characterised in the mass media as one of the key actors in charge of addressing the economic crisis.74 Indeed, during the crisis, citizens became more aware of the ECB and more inclined to state an opinion on whether they trusted it .75 At the same time, since it is an EU institution, citizens are likely to evaluate the ECB as part of the overall EU framework, together with other institutions, such as the European Commission or the European Parliament. Thus, when asked whether they trust the ECB, citizens may not only take into account inflation developments, but also other macroeconomic developments and their overall perception of the EU.
Taken together, citizens’ views on the euro on the one hand and the ECB on the other shed light on their attitudes towards EMU. Citizens can hold consistently positive or negative views on both the euro and the ECB, but they can also diverge in their views on the single currency and the central bank. Figure 1 shows a cross-tabulation of support for the euro and trust in the ECB, which results in four groups of supporters and sceptics of EMU: the first group neither supports the euro nor trusts the ECB (EMU-sceptics); the second group supports the euro, but does not trust the ECB (ECB-sceptics); the third group does not support the euro, but trusts the
72 Indeed, in spring 2019 the euro was the second most-mentioned, meaning respondents associated it
with the EU, second only to freedom of movement. See European Commission, Spring 2019 Standard Eurobarometer (EB 91) – Public opinion in the European Union, (fieldwork conducted in June 2019).
73 See Bergbauer, S., Hernborg, N., Jamet, J.F. and Persson, E., “The reputation of the euro and the European Central Bank: interlinked or disconnected?”, Journal of European Public Policy, January 2020.
74 See, for example, findings in Picard, R.G, (ed.), The euro crisis in the media: Journalistic coverage of economic crisis and European institutions, London-New York: I.B. Tauris, 2015.
75 In effect, survey data from the Eurobarometer show a notable increase in public awareness about the ECB during the global financial crisis. The share of respondents who said they had “heard about” the ECB increased from 70% in 1999 to 85% in 2015, with most of that increase occurring during the crisis years. Similarly, the share of respondents who answered “don’t know” when asked whether they trusted the ECB declined from 31% in 1999 to 17% in 2015.

ECB Economic Bulletin, Issue 4 / 2020 – Articles Citizens’ attitudes towards the ECB, the euro and Economic and Monetary Union
84
ECB (euro-sceptics); and the fourth group supports the euro and trusts the ECB (EMU-supporters).76
Figure 1 Typology of attitudes towards EMU
Note: The fifth group, which includes respondents who answered “don’t know” to one or both of the questions, is not included in the overview.
Different combinations of attitudes towards EMU hold different implications for economic and monetary integration. Among these four groups, the first group, referred to as “EMU-sceptics,” appears to be the most critical to understand in that these citizens, lacking support for either the euro or the ECB, may be open to or actively support a reversal of economic and monetary integration, potentially undermining the smooth functioning of EMU. A significant prevalence of the second group, namely “ECB-sceptics” among euro area citizens may reduce acceptance of ECB actions; at the same time, the continued support in this group for the single currency indicates an outlook that is in principle pro-European. The third group, “euro-sceptics” is puzzling in that these citizens trust the ECB, but oppose a single currency; this may be explained by general scepticism towards policymaking at the EU level or attachment to national currencies that were superseded by the euro, coupled with high levels of trust in the functioning of institutions. The fourth group, “EMU-supporters,” provide the strongest support for the project of economic and monetary integration in that they favour the single currency and express trust in the ECB.
76 The typology draws on Bergbauer, S., Hernborg, N., Jamet, J.-F. and Persson, E., “The reputation of the
euro and the European Central Bank: interlinked or disconnected?”, Journal of European Public Policy, January 2020.
EMU-supporters
EMU-sceptics
euro-sceptics
ECB-sceptics
Support for EMU and the euro
Trus
t in
the
ECB
For Against
Tend to trust
Tend not to trust

ECB Economic Bulletin, Issue 4 / 2020 – Articles Citizens’ attitudes towards the ECB, the euro and Economic and Monetary Union
85
4 What we know about the different groups in the typology of attitudes to EMU
4.1 Measuring trust in the ECB and support for the euro
The empirical analysis of the prevalence of the different groups of supporters of EMU draws on survey data from the Eurobarometer. We use individual survey data from 40 waves of the bi-annual Standard Eurobarometer from 199977 to 2019. The analysis is restricted to respondents from Member States in the euro area. As a (repeated) cross-sectional survey, the Eurobarometer does not allow for panel analysis and cannot track intra-individual changes in attitudes over time. Nevertheless, it gives an insight into attitudes towards the euro and the ECB among euro area citizens over time and under changing political and macroeconomic conditions. While the Eurobarometer has been criticised for a number of methodological reasons, it remains one of the most widely used cross-national surveys and has become the main data source for comparative empirical research on public opinion in the EU and on the politics and sociology of European unification.
Support for the euro and trust in the ECB are operationalised using standard measures in the literature. To assess respondents’ support for the single currency, we use the question “What is your opinion on each of the following statements? Please tell me for each statement, whether you are for it or against it: A European economic and monetary union with one single currency, the euro.” To assess respondents’ support for the ECB, we use the question “Please tell me if you tend to trust or tend not to trust these European institutions: The European Central Bank.” Respondents replying “don’t know” to one or both of the questions are placed in a fifth group called “Other (don’t know)”, while those refusing to answer are omitted from the analysis.78 Depending on the survey wave, between 20-35% of respondents fall into this fifth category (see Chart 2) and, of these, roughly two-thirds reply “don’t know” to the question regarding trust in the ECB.
The design of the Eurobarometer questionnaire may affect response behaviour for the items regarding support for the euro and trust in the ECB. In particular, the indicator of trust in the ECB is part of a series of questions assessing respondents’ trust in different EU institutions, notably the European Commission and the European Parliament. This design may invite satisficing behaviour, whereby respondents do not sufficiently differentiate between items within the series because they lack distinct views on the individual institutions and/or may try to be consistent in their response behaviour, supporting or rejecting all statements in the series.79 Furthermore, the order of the questions in the questionnaire may affect response behaviour, as 77 Or the respective year a country joined the euro area. 78 The share of Eurobarometer respondents who refuse to answer either question is very small. There are
no data on respondents refusing to answer the question on trust in the ECB, and less than 1% of respondents are reported to have refused to answer the question on support for the euro in the Eurobarometer waves since 2018. We exclude these respondents from our analysis.
79 In Ehrmann, M., Soudan, M. and Stracca, L., “Explaining European Union Citizens’ Trust in the European Central Bank in Normal and Crisis Times”, The Scandinavian Journal of Economics, Vol. 115, 2013, pp. 781-807, two-thirds of respondents give the same reply for all EU institutions covered by the series of questions on institutional trust.

ECB Economic Bulletin, Issue 4 / 2020 – Articles Citizens’ attitudes towards the ECB, the euro and Economic and Monetary Union
86
questions asked earlier in the survey may affect response behaviour on later questions.
A comparison of findings from the Eurobarometer and other datasets lends external validity to the results. While we cannot exclude that questionnaire effects have an impact on the findings, a cross-validation of levels of trust in the ECB and support for the euro as measured by the Eurobarometer with evidence on citizens’ attitudes towards the single currency and the ECB from other EU-wide and national datasets shows that findings are broadly comparable across datasets. For example, the Autumn 2019 Standard Eurobarometer80 (fieldwork conducted in November 2019) found that 76% of respondents in the euro area were in favour of the single currency. In a Flash Eurobarometer81 from roughly the same period (fieldwork conducted in October 2019), 65% of respondents indicated that the euro was a good thing for their country and 76% thought it was a good thing for the EU. Both Standard and Flash Eurobarometer surveys have observed an upward trend in support for the euro since 2016. National surveys that occasionally field questions on trust in the ECB show similar levels of trust as those found based on Eurobarometer data.82
The subsequent sections assess support for EMU by means of univariate analysis. The changes in the make-up of the different groups in the typology are illustrated along different sociodemographic indicators. Aggregated data for the euro area are weighted to account for differences in population size between euro area countries applying the standard post-stratification weights provided for in the Eurobarometer survey data. This analysis can gauge simple correlations between the type of support for EMU and the individual sociodemographic indicators in question, and, through its time dimension, identify turning points and possible triggers of changes in support for EMU. However, the analysis neither controls for confounding variables, nor provides quantitative estimates of the strength of observed correlations, and it is also not able to establish causality.83
4.2 Support for EMU since the global financial crisis
In the euro area aggregate, EMU-supporters are the largest group, having recovered from the trough reached during the global financial crisis. Chart 2 80 European Commission, Autumn 2019 Standard Eurobarometer survey (EB 92) – Public opinion in the
European Union, First results, (fieldwork conducted in October 2019), November 2019. 81 European Commission, Flash Eurobarometer survey (EB 481) on the views and attitudes related to the
euro in the 19 euro area countries (fieldwork conducted in October 2019), November 2019. 82 See, for example, for Germany, findings in Hayo, B. and Neuenkirch, E., “The German public and its trust
in the ECB: The role of knowledge and information search”, Journal of International Money and Finance, Vol. 47, 2014, pp. 286-303; for the Netherlands, see van der Cruijsen, C.A.B. and Eijffinger, S.C.W., “From actual to perceived transparency: The case of the European Central Bank”, Journal of Economic Psychology, Vol. 31, 2010, pp. 388-399.
83 For recent multivariate analyses of support for the euro and trust in the ECB, see, for example, Bergbauer, S., Hernborg, N., Jamet, J.-F. and Persson, E., “The reputation of the euro and the European Central Bank: interlinked or disconnected?”, Journal of European Public Policy, January 2020); Hobolt, S. B. and Wratil, C., “Public opinion and the crisis: The dynamics of support for the euro”, Journal of European Public Policy, Vol. 22(2), 2015, pp. 238-256; Kaltenthaler, K., Anderson, C.J. and Miller, W.J., “Accountability and independent central banks: Europeans and distrust of the European Central Bank”, JCMS: Journal of Common Market Studies, Vol. 48, 2010, pp.1261-1281; Kuhn, T. and Stoeckel, F., “When European integration becomes costly: The euro crisis and public support for European economic governance”, Journal of European Public Policy, 21(4), pp. 624-641.
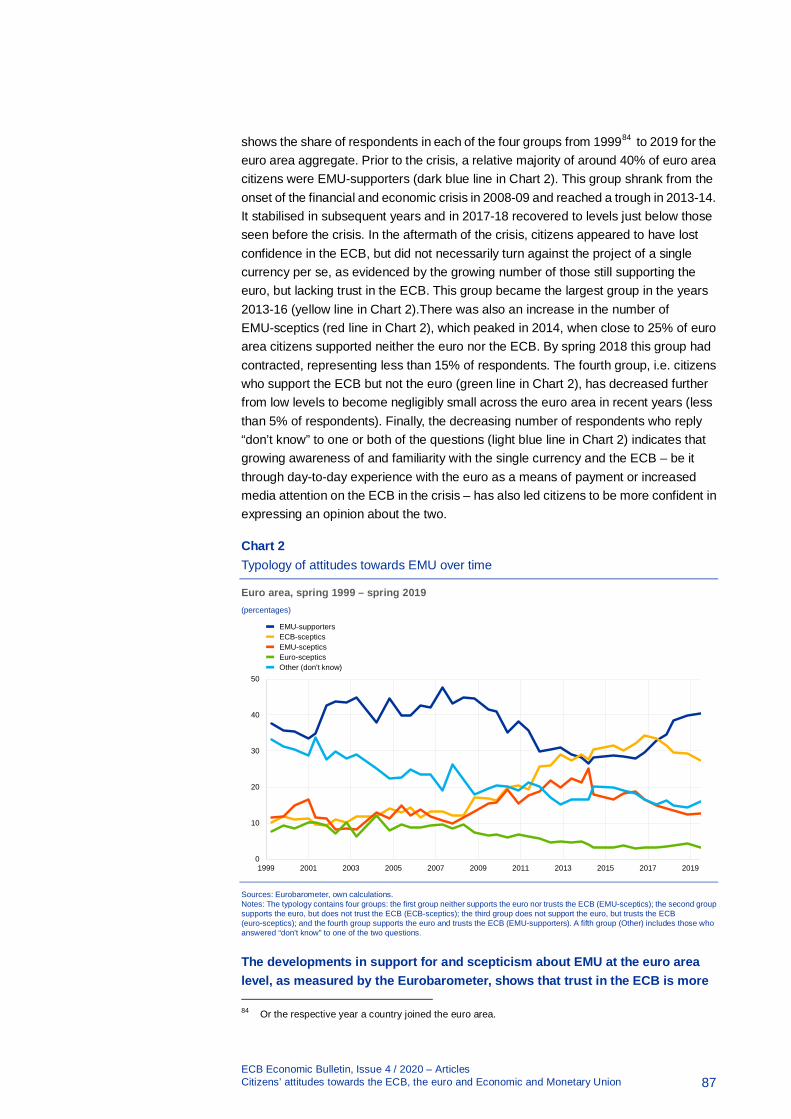
ECB Economic Bulletin, Issue 4 / 2020 – Articles Citizens’ attitudes towards the ECB, the euro and Economic and Monetary Union
87
shows the share of respondents in each of the four groups from 199984 to 2019 for the euro area aggregate. Prior to the crisis, a relative majority of around 40% of euro area citizens were EMU-supporters (dark blue line in Chart 2). This group shrank from the onset of the financial and economic crisis in 2008-09 and reached a trough in 2013-14. It stabilised in subsequent years and in 2017-18 recovered to levels just below those seen before the crisis. In the aftermath of the crisis, citizens appeared to have lost confidence in the ECB, but did not necessarily turn against the project of a single currency per se, as evidenced by the growing number of those still supporting the euro, but lacking trust in the ECB. This group became the largest group in the years 2013-16 (yellow line in Chart 2).There was also an increase in the number of EMU-sceptics (red line in Chart 2), which peaked in 2014, when close to 25% of euro area citizens supported neither the euro nor the ECB. By spring 2018 this group had contracted, representing less than 15% of respondents. The fourth group, i.e. citizens who support the ECB but not the euro (green line in Chart 2), has decreased further from low levels to become negligibly small across the euro area in recent years (less than 5% of respondents). Finally, the decreasing number of respondents who reply “don’t know” to one or both of the questions (light blue line in Chart 2) indicates that growing awareness of and familiarity with the single currency and the ECB – be it through day-to-day experience with the euro as a means of payment or increased media attention on the ECB in the crisis – has also led citizens to be more confident in expressing an opinion about the two.
Chart 2 Typology of attitudes towards EMU over time
Euro area, spring 1999 – spring 2019 (percentages)
Sources: Eurobarometer, own calculations. Notes: The typology contains four groups: the first group neither supports the euro nor trusts the ECB (EMU-sceptics); the second group supports the euro, but does not trust the ECB (ECB-sceptics); the third group does not support the euro, but trusts the ECB (euro-sceptics); and the fourth group supports the euro and trusts the ECB (EMU-supporters). A fifth group (Other) includes those who answered “don't know” to one of the two questions.
The developments in support for and scepticism about EMU at the euro area level, as measured by the Eurobarometer, shows that trust in the ECB is more 84 Or the respective year a country joined the euro area.
0
10
20
30
40
50
1999 2001 2003 2005 2007 2009 2011 2013 2015 2017 2019
EMU-supportersECB-scepticsEMU-scepticsEuro-scepticsOther (don't know)
ECB Economic Bulletin, Issue 4 / 2020 – Articles Citizens’ attitudes towards the ECB, the euro and Economic and Monetary Union
88
volatile than support for the euro. The relative decline in the size of the group of EMU-supporters over the period 2008-13 is mainly due to the concurrent decrease in trust in the ECB, as indicated by the growing number of ECB-sceptics over the same period (see Chart 2). These findings suggest that support for the euro is more resistant to negative experiences such as the crisis, while the decline in trust in the ECB during the economic downturn indicates a more performance-related orientation, in line with recent findings by other studies.85 At the same time, the growing share of euro area citizens that neither trust the ECB nor support the euro (EMU-sceptics) over the course of the crisis suggests that negative experiences during the crisis also negatively affected support for the EMU project more generally, possibly via dissatisfaction with the outputs of European economic governance. However, this trend seemed to stop and eventually reverse as the economy recovered. Owing to data availability, these trends do not reflect the potential impact of the coronavirus (COVID-19) pandemic that started in early 2020.
The decline in trust in the ECB is part of a broader decline in trust in public institutions in the aftermath of the global financial crisis. In effect, not only the ECB, but most national and supranational public institutions in Europe saw public trust decrease in the past decade, making the decline in trust in the ECB part of a wider trend. Currently the level of trust in the ECB seems to be at a neutral level, with roughly equal shares of respondents expressing trust or distrust in the ECB. Box 1 summarises developments in public trust in EU and national institutions since the global financial crisis.
Box 1 Developments in trust in public institutions since the global financial crisis
Prepared by Nils Hernborg and Hanni Schölermann
The decline in popular trust in the ECB over the past decade occurred in the context of a broader decline in trust in public institutions. Since the onset of the global financial crisis, there has been a decrease in trust in public institutions in Europe at both national and supranational level. In fact, this trend can be observed across most advanced economies. The decline in trust in the ECB seen over the past decade is thus not specific to the ECB. At the same time, attitude surveys indicate that popular trust in the ECB has declined more than trust in national and even other EU institutions. This box explores the developments in trust in the ECB relative to other institutions, with a view to teasing out common and distinct features of the decrease, as well as recent improvements in popular trust in the ECB.
Trust in EU and national institutions
In the decade running up to the global financial crisis, net trust among euro area citizens in the European Commission, the European Parliament and the ECB stood at robustly positive and roughly comparable levels, with the European Parliament enjoying a small lead (see Chart A). Net trust in these EU institutions was significantly higher than net trust in national governments or national parliaments by a margin of between 20 and 40 percentage points. Even before the crisis, net trust in national governments or parliaments already tended to be negative (i.e. with more survey
85 See Bergbauer, S., Hernborg, N., Jamet, J.F. and Persson, E., “The reputation of the euro and the
European Central Bank: interlinked or disconnected?”, Journal of European Public Policy, January 2020.
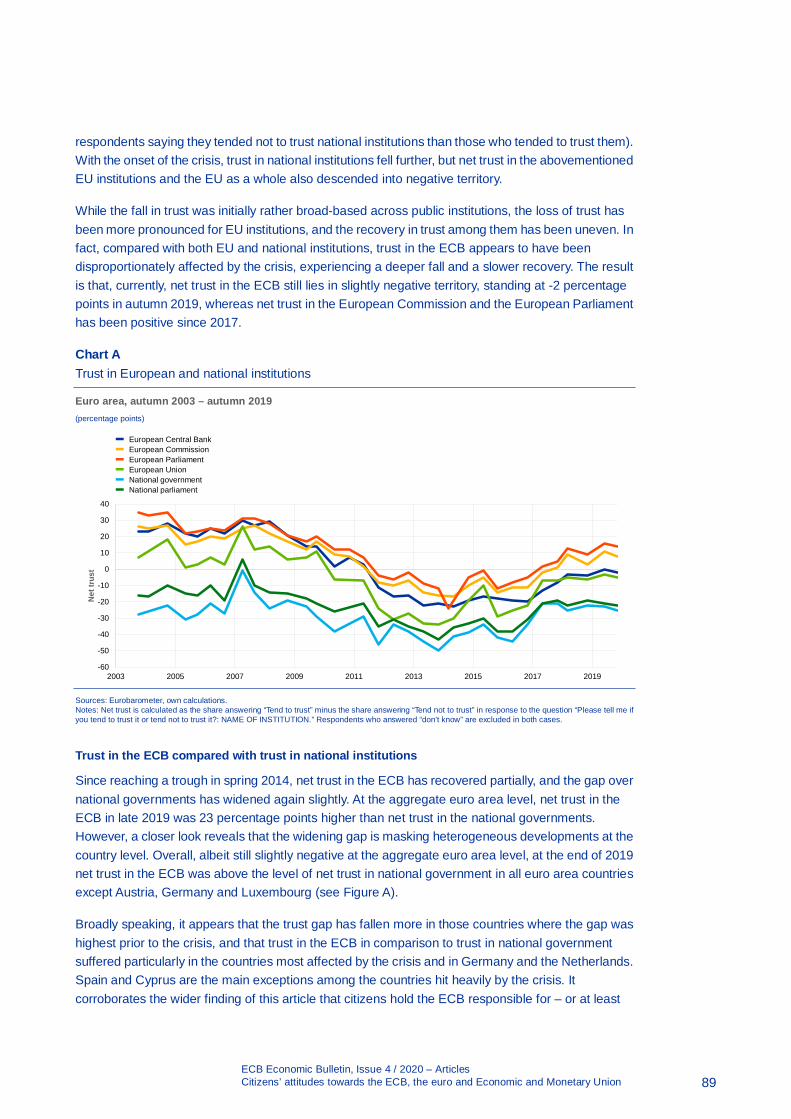
ECB Economic Bulletin, Issue 4 / 2020 – Articles Citizens’ attitudes towards the ECB, the euro and Economic and Monetary Union
89
respondents saying they tended not to trust national institutions than those who tended to trust them). With the onset of the crisis, trust in national institutions fell further, but net trust in the abovementioned EU institutions and the EU as a whole also descended into negative territory.
While the fall in trust was initially rather broad-based across public institutions, the loss of trust has been more pronounced for EU institutions, and the recovery in trust among them has been uneven. In fact, compared with both EU and national institutions, trust in the ECB appears to have been disproportionately affected by the crisis, experiencing a deeper fall and a slower recovery. The result is that, currently, net trust in the ECB still lies in slightly negative territory, standing at -2 percentage points in autumn 2019, whereas net trust in the European Commission and the European Parliament has been positive since 2017.
Chart A Trust in European and national institutions
Euro area, autumn 2003 – autumn 2019 (percentage points)
Sources: Eurobarometer, own calculations. Notes: Net trust is calculated as the share answering “Tend to trust” minus the share answering “Tend not to trust” in response to the question “Please tell me if you tend to trust it or tend not to trust it?: NAME OF INSTITUTION.” Respondents who answered “don't know” are excluded in both cases.
Trust in the ECB compared with trust in national institutions
Since reaching a trough in spring 2014, net trust in the ECB has recovered partially, and the gap over national governments has widened again slightly. At the aggregate euro area level, net trust in the ECB in late 2019 was 23 percentage points higher than net trust in the national governments. However, a closer look reveals that the widening gap is masking heterogeneous developments at the country level. Overall, albeit still slightly negative at the aggregate euro area level, at the end of 2019 net trust in the ECB was above the level of net trust in national government in all euro area countries except Austria, Germany and Luxembourg (see Figure A).
Broadly speaking, it appears that the trust gap has fallen more in those countries where the gap was highest prior to the crisis, and that trust in the ECB in comparison to trust in national government suffered particularly in the countries most affected by the crisis and in Germany and the Netherlands. Spain and Cyprus are the main exceptions among the countries hit heavily by the crisis. It corroborates the wider finding of this article that citizens hold the ECB responsible for – or at least
-60
-50
-40
-30
-20
-10
0
10
20
30
40
2003 2005 2007 2009 2011 2013 2015 2017 2019
Net
trus
t
European Central BankEuropean CommissionEuropean ParliamentEuropean UnionNational governmentNational parliament

ECB Economic Bulletin, Issue 4 / 2020 – Articles Citizens’ attitudes towards the ECB, the euro and Economic and Monetary Union
90
associate it with – the general economic situation at both national and European levels, as well as their own personal financial situation, more than they do national governments.
Figure A Gap between net trust in the ECB and net trust in the national government
Euro area countries, autumn 2019 (percentage points)
Sources: Eurobarometer, own calculations. Notes: Net trust is calculated as the share answering “Tend to trust” minus the share answering “Tend not to trust” to the question “Please tell me if you tend to trust it or tend not to trust it?: NAME OF INSTITUTION.” Respondents who answered “don't know” are excluded in both cases. The trust gap varies between -200 and 200, as net trust for each institution varies between -100 and 100.
4.3 Geographic correlates of support for EMU
Across Member States in the euro area, support for EMU has improved since the crisis. Looking at the developments in support for EMU by country, euro area countries fall roughly into two groups: those where support for EMU fell during the
LT LV SK BE ES IT EE IE MT FR FI PT CY SI GR NL AT DE LU
Trust gap (percentage points) 62 58 58 46 46 37 36 34 32 31 30 29 27 24 7 3 -1 -3 -11
5-year change (autumn 2014) +4 +12 +5 +20 +18 +2 +27 +5 +12 -11 -6 -21 +18 -28 -18 -17 -4 +19 -17
10-year change (autumn 2009) -24 -18 -12 -1 -3 -18 -7 -54 -18 -17 -26 -32 +10 -25 -9 -37 -17 -33 -5

ECB Economic Bulletin, Issue 4 / 2020 – Articles Citizens’ attitudes towards the ECB, the euro and Economic and Monetary Union
91
crisis but has since largely bounced back, and those that have seen robust support for EMU throughout the crisis years (see Chart 3).
Countries severely affected by the economic crisis experienced a dip in support for EMU. It is not surprising that the first pattern is found almost exclusively in countries that were severely affected by the economic crisis after 2008 and 2009, and is particularly strong in Ireland, Greece, Spain, Cyprus, Portugal and Slovenia. With the exception of Slovenia, all of these countries entered financial assistance programmes during the crisis. In these countries, typically the share of ECB-sceptics grew mainly during the crisis. The share of euro-sceptics also experienced a temporary spike, but has since returned to near pre-crisis levels.
Countries less affected by the crisis tend to show relatively stable support for EMU. By contrast, the second pattern of high and relatively stable support for EMU can be observed in countries that were less affected by the crisis, such as Belgium, Luxembourg, the Netherlands, Malta, Austria, Slovakia and Finland. In these countries, since the crisis the share of ECB-sceptics has typically grown moderately and at a steady pace from a very low level, trending slightly above the share of euro-sceptics. However, both scepticism towards the ECB and the euro remained minority attitudes throughout the crisis and afterwards.
Germany, France and Italy display idiosyncratic patterns of support for EMU. The three largest euro area countries – Germany, France and Italy – are important exceptions to the two patterns described above. They follow a common pattern of their own that is characterised by support for EMU that is also fairly stable but moderate. During the crisis, when there was a slight dip in support for EMU, ECB-sceptics (in the case of France and Germany) and EMU-sceptics (in the case of Italy) temporarily constituted the largest groups. The relative sizes of the groups have since reversed, but the share of ECB-sceptics in these countries has lingered above pre-crisis levels (and in France is on a par with the share of EMU-supporters).

ECB Economic Bulletin, Issue 4 / 2020 – Articles Citizens’ attitudes towards the ECB, the euro and Economic and Monetary Union
92
Chart 3 Typology of attitudes towards EMU by country
Euro area countries, spring 1999 – spring 2019 (percentages)
Sources: Eurobarometer, own calculations. Notes: The typology contains four groups: the first group neither supports the euro nor trusts the ECB (EMU-sceptics); the second group supports the euro, but does not trust the ECB (ECB-sceptics); the third group does not support the euro, but trusts the ECB (euro-sceptics); and the fourth group supports the euro and trusts the ECB (EMU-supporters). A fifth group (Other) includes those who answered “don't know” to one of the two questions.
There are also considerable differences in patterns of support for EMU within countries. Applying the typology of attitudes towards EMU at the regional level to identify the predominant group by region86 reveals that the geography of support for EMU varies significantly by country (see Figure 2).87 By showing only the predominant group in each region, which in some regions has only a very narrow lead over other groups, the map tends to overstate differences between regions. Nevertheless, it serves to illustrate that in some countries, one group in the typology dominates throughout, while other countries show strong regional differences. Among the countries with strikingly homogenous regional attitudes are Ireland, the Netherlands, Estonia, Latvia, Lithuania, Slovakia and Finland, where EMU-supporters are the predominant group throughout the country. Slovenia is similarly homogeneous, but is predominantly ECB-sceptic.
Countries with heterogeneous patterns of support for EMU at the sub-national level tend to see two predominant groups. In the cases of Belgium, Germany,
86 The definition of regions follows the European Nomenclature of Territorial Units for Statistics (NUTS),
using level 1 for the larger euro area EU Member States (Germany, France and Italy) and NUTS2 for the other euro area countries.
87 To ensure a sufficient number of observations by region, regional-level observations for each group in the typology of attitudes towards EMU are aggregated between autumn 2016 and spring 2019. This ensures at least 100 observations for most NUTS2 regions. However, in line with the developments in support for EMU since the crisis, which is marked by a growing share of EMU-supporters, this probably overstates the number of regions that are dominated by either EMU-sceptics or ECB-sceptics.
EMU-supportersECB-scepticsEMU-scepticsEuro-scepticsOther (don’t know)

ECB Economic Bulletin, Issue 4 / 2020 – Articles Citizens’ attitudes towards the ECB, the euro and Economic and Monetary Union
93
Spain, France and Portugal, there is a fairly even split between regions where EMU-supporters are in the majority and regions where ECB-sceptics are in the majority. Regions in Italy either have a majority of EMU-supporters or EMU-sceptics, and regions in Greece are either predominantly EMU-sceptic or ECB-sceptic. Austria falls somewhere in-between these patterns, being relatively homogeneous with EMU-supporters constituting the majority in most regions, but with one region predominantly EMU-sceptic and one predominantly ECB-sceptic.
Figure 2 Map of typology of attitudes towards EMU
Euro area NUTS regions, autumn 2016 – spring 2019 (group with the largest share of respondents in each NUTS region)
Source: Eurobarometer, own calculations. Notes: The typology contains four groups: the first group neither supports the euro nor trusts the ECB (EMU-sceptics); the second group supports the euro, but does not trust the ECB (ECB-sceptics); the third group does not support the euro, but trusts the ECB (euro- sceptics); and the fourth group supports the euro and trusts the ECB (EMU-supporters). A fifth group includes those who answered “don't know” to one of the two questions. The NUTS classification varies between NUTS 1 and NUTS 2 across Member States and depends on the granularity coded in the Eurobarometer survey.
4.4 Sociodemographic correlates of support for EMU
Different generations hold remarkably similar attitudes towards the euro and the ECB. Assessment of support for EMU across generations highlights that the different cohorts hold remarkably similar attitudes towards the euro and the ECB (see Chart 4). Within the different cohorts – the war generation born before 1946, the baby
EMU-supportersECB-scepticsEMU-scepticsEuro-scepticsOther (don’t know)

ECB Economic Bulletin, Issue 4 / 2020 – Articles Citizens’ attitudes towards the ECB, the euro and Economic and Monetary Union
94
boomers born up to 1964, generation X born up to 1980 and millennials born after 1980 – the relative sizes of the groups of different types of supporters of EMU have been consistently close to those within the entire population over the past two decades.
The war generation, i.e. the oldest cohort, has a higher share of respondents answering “don’t know” than the other three cohorts. Prior to the crisis, this cohort also accounted for a marginally, but consistently, lower share of EMU-supporters. Over the past few years, however, this cohort has counted slightly fewer EMU-sceptics and ECB-sceptics than younger cohorts. The high share of respondents answering “don’t know” seems to suggest that older people may find it more difficult than younger cohorts to form an opinion about recent steps in European integration, be it in the form of relatively new institutions such as the ECB or the single currency. A deeper analysis of the underlying data reveals that the war generation in particular tends to respond more frequently “don’t know” to the question on trust in the ECB, and that a similar pattern can also be found in their responses to questions regarding trust in other EU institutions. So rather than being specific to recent European integration or the ECB, it appears that older people’s attitudes towards EU institutions are less well defined than those of other cohorts.

ECB Economic Bulletin, Issue 4 / 2020 – Articles Citizens’ attitudes towards the ECB, the euro and Economic and Monetary Union
95
Chart 4 Typology of attitudes towards EMU by cohort
Euro area cohorts, spring 1999 – spring 2019 (percentages)
Sources: Eurobarometer, own calculations. Notes: The typology contains four groups: the first group neither supports the euro nor trusts the ECB (EMU-sceptics); the second group supports the euro, but does not trust the ECB (ECB-sceptics); the third group does not support the euro, but trusts the ECB (euro-sceptics); and the fourth group supports the euro and trusts the ECB (EMU-supporters). A fifth group (Other) includes those who answered “don't know” to one or both questions. The birth year is approximated by the year of the survey minus the exact age of the respondent.
Whether respondents fall into the group of EMU-supporters is associated with their level of education and occupational background, but differs little between genders. Support for EMU tends to increase with the number of years spent in education (see Chart 5). While about 30% of people who ended full-time education at age 15 or younger are EMU-supporters, around 40% of people who finished their education between the ages of 16 and 19 fall into that category, as do around 50% of those who were aged 20 or older when they completed their education. People without any full-time education display similar but more volatile attitudes than the first group. Across these educational groups, the share of ECB-sceptics has trended upwards over time.
This pattern is also reflected in support for EMU by occupation, with managers, students, other white-collar workers and self-employed persons falling predominantly in the group of EMU-supporters, followed by retirees, while manual workers, house
0
10
20
30
40
50
60
1999 2003 2007 2011 2015 2019
EMU-supportersECB-scepticsEMU-scepticsEuro-scepticsOther (don't know)
a) War generation (-1946)
1999 2003 2007 2011 2015 2019
b) Baby boomers (1946-64)
0
10
20
30
40
50
60
1999 2003 2007 2011 2015 2019
c) Generation X (1965-80)
1999 2003 2007 2011 2015 2019
d) Millenials (1981-)
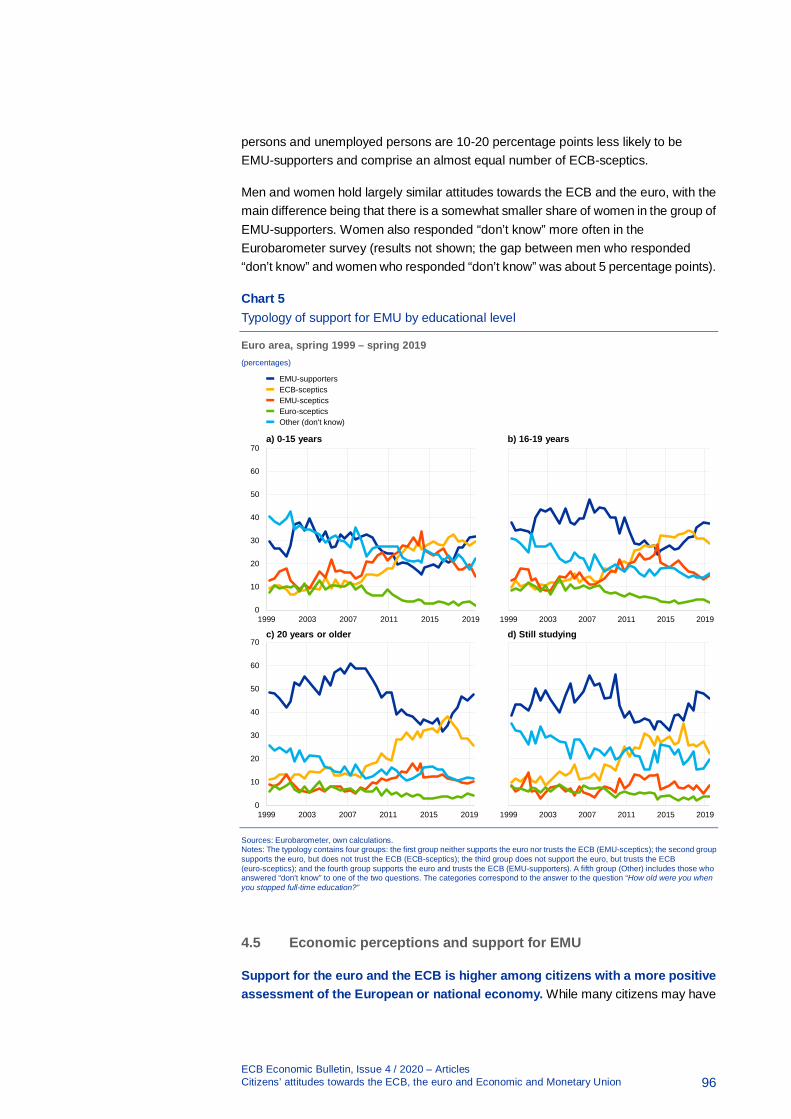
ECB Economic Bulletin, Issue 4 / 2020 – Articles Citizens’ attitudes towards the ECB, the euro and Economic and Monetary Union
96
persons and unemployed persons are 10-20 percentage points less likely to be EMU-supporters and comprise an almost equal number of ECB-sceptics.
Men and women hold largely similar attitudes towards the ECB and the euro, with the main difference being that there is a somewhat smaller share of women in the group of EMU-supporters. Women also responded “don’t know” more often in the Eurobarometer survey (results not shown; the gap between men who responded “don’t know” and women who responded “don’t know” was about 5 percentage points).
Chart 5 Typology of support for EMU by educational level
Euro area, spring 1999 – spring 2019 (percentages)
Sources: Eurobarometer, own calculations. Notes: The typology contains four groups: the first group neither supports the euro nor trusts the ECB (EMU-sceptics); the second group supports the euro, but does not trust the ECB (ECB-sceptics); the third group does not support the euro, but trusts the ECB (euro-sceptics); and the fourth group supports the euro and trusts the ECB (EMU-supporters). A fifth group (Other) includes those who answered “don't know” to one of the two questions. The categories correspond to the answer to the question “How old were you when you stopped full-time education?”
4.5 Economic perceptions and support for EMU
Support for the euro and the ECB is higher among citizens with a more positive assessment of the European or national economy. While many citizens may have
0
10
20
30
40
50
60
70
1999 2003 2007 2011 2015 2019
EMU-supportersECB-scepticsEMU-scepticsEuro-scepticsOther (don't know)
a) 0-15 years
1999 2003 2007 2011 2015 2019
b) 16-19 years
0
10
20
30
40
50
60
70
1999 2003 2007 2011 2015 2019
c) 20 years or older
1999 2003 2007 2011 2015 2019
d) Still studying

ECB Economic Bulletin, Issue 4 / 2020 – Articles Citizens’ attitudes towards the ECB, the euro and Economic and Monetary Union
97
limited knowledge of the ECB’s precise tasks and mandate,88 they can still be expected to be aware of the ECB’s general role in the macroeconomic environment and to draw on their assessment of the economic situation to form opinions on issues related to Economic and Monetary Union. Indeed, in all the years under analysis, EMU-supporters are the dominant group among those who see the European economy as being in a good or very good state (Chart 6). Nevertheless, irrespective of respondents’ assessment of the European economy, the group of EMU-supporters shrank in the aftermath of the crisis, with the steepest decline observed among those with negative views on the state of the European economy. In effect, in late 2019 EMU-sceptics dominated among those who believe the European economy to be in a very bad state. Those who believe the European economy to be in a rather bad state mostly seem to have little confidence in the ECB, with ECB-sceptics representing the largest group since 2011. Very similar patterns can be observed when decomposing support for EMU by respondents’ perceptions of the domestic economic situation (not shown).
88 See, for instance, Carvalho, C. and Nechio, F., “Do people understand monetary policy?”, Journal of
Monetary Economics, Vol. 66, 2014, pp. 108-123 or van der Cruijsen, C., Jansen, D.-J. and de Haan, J., “How Much Does the Public Know about the ECB's Monetary Policy? Evidence from a Survey of Dutch Households”, International Journal of Central Banking, Vol. 11, 2014, pp. 169-218.

ECB Economic Bulletin, Issue 4 / 2020 – Articles Citizens’ attitudes towards the ECB, the euro and Economic and Monetary Union
98
Chart 6 Typology of support for EMU by perception of the current situation of the European economy
Euro area, spring 2005 – spring 2019 (percentages)
Sources: Eurobarometer, own calculations. Notes: The typology contains four groups: the first group neither supports the euro nor trusts the ECB (EMU-sceptics); the second group supports the euro, but does not trust the ECB (ECB-sceptics); the third group does not support the euro, but trusts the ECB (euro-sceptics); and the fourth group supports the euro and trusts the ECB (EMU-supporters). A fifth group (other) includes those who answered “don't know” to one of the two questions. The categories correspond to the answer to the question “How would you judge the current situation in each of the following? The situation of the European economy.” Missing observations for autumn 2011 to autumn 2013.
Citizens who are satisfied with their financial situation tend to be more supportive of the euro and the ECB. For almost all years under analysis, EMU-supporters were the largest group among respondents who judge the current financial situation of their household to be good or very good. It should be noted, however, that the share of ECB-sceptics approached that of EMU-supporters in 2015-16 (see Chart 7). A reverse picture emerges among respondents who are very dissatisfied with their household’s financial situation: EMU-supporters represented just over 10% of respondents in this group in late 2019 in a further decline from the already low levels before the crisis. Among those respondents, EMU-sceptics were in the majority until recently, when ECB-sceptics became the largest group, with slightly more than 35% of respondents. The greatest movement between groups is observed among respondents who assess their household finances as “rather bad.” While EMU-supporters were in the majority prior to the crisis, their numbers dropped to a low
0
10
20
30
40
50
60
70
2005 2007 2009 2011 2013 2015 2017 2019
EMU-supportersECB-scepticsEMU-scepticsEuro-scepticsOther (don't know)
a) Very bad
2005 2007 2009 2011 2013 2015 2017 2019
b) Rather bad
0
10
20
30
40
50
60
70
2005 2007 2009 2011 2013 2015 2017 2019
c) Rather good
2005 2007 2009 2011 2013 2015 2017 2019
d) Very good

ECB Economic Bulletin, Issue 4 / 2020 – Articles Citizens’ attitudes towards the ECB, the euro and Economic and Monetary Union
99
of 20% in 2011 and 2015, while the number of those distrusting the ECB and those losing confidence in both the ECB and the euro increased in parallel. Since 2014 the euro regained support, while the ECB still has to recover trust. In 2019 ECB-sceptics thus remained in the majority, accounting for just over 30% of respondents.
A similar picture emerges if we assess the prevalence of different groups of sceptics and supporters of EMU by respondents’ ability to pay bills (not shown). While EMU-supporters are by far in the majority among respondents who do not experience any difficulties making ends meet, they remain the minority among those who face difficulties paying bills most of the time. More than 30% of respondents in this group now fall into the category of ECB-sceptics.
Chart 7 Typology of support for EMU by perception of the current situation of the household economy
Euro area, autumn 2008 – spring 2019 (percentages)
Sources: Eurobarometer, own calculations. Notes: The typology contains four groups: the first group neither supports the euro nor trusts the ECB (EMU-sceptics); the second group supports the euro, but does not trust the ECB (ECB-sceptics); the third group does not support the euro, but trusts the ECB (euro-sceptics); the fourth group supports the euro and trusts the ECB (EMU-supporters). A fifth group (Other) includes those who answered “don't know” to one of the two questions. The categories correspond to the answer to the question “How would you judge the current situation in each of the following? The financial situation of your household.” Missing observations for autumn 2011 to autumn 2013.
0
10
20
30
40
50
60
70
2008 2010 2012 2014 2016 2018
EMU-supportersECB-scepticsEMU-scepticsEuro-scepticsOther (don't know)
a) Very bad
2008 2010 2012 2014 2016 2018
b) Rather bad
0
10
20
30
40
50
60
70
2008 2010 2012 2014 2016 2018
c) Rather good
2008 2010 2012 2014 2016 2018
d) Very good

ECB Economic Bulletin, Issue 4 / 2020 – Articles Citizens’ attitudes towards the ECB, the euro and Economic and Monetary Union
100
4.6 European attitudes and political orientations
Citizens’ attitudes towards the EU are highly correlated with their views on the euro and the ECB. The euro and the ECB are part of the EU’s institutional framework and policymaking at the European level, so one would expect that attitudes towards them are shaped by citizens’ overall attitudes towards the European project. This is indeed supported by the data. Taking citizens’ image of the EU as an indicator of their general attitude towards the EU and matching it against the typology of attitudes to EMU, one finds that the largest share of citizens with a negative image of the EU also tend to be EMU-sceptics, while an overwhelming majority of those holding a positive image of the EU tend to be EMU-supporters (not shown).
Moreover, political interest seems moderately related to support for EMU. EMU-supporters are in the majority among respondents who show at least a slight interest in political affairs, with the share of EMU-supporters increasing somewhat in line with the degree of political interest (see Chart 8). By contrast, the share of EMU-sceptics declines with increasing political interest. Notably, scepticism towards the ECB appears to be similarly strong across all respondents irrespective of their degree of political interest.

ECB Economic Bulletin, Issue 4 / 2020 – Articles Citizens’ attitudes towards the ECB, the euro and Economic and Monetary Union
101
Chart 8 Typology of support for EMU by self-reported political interest
Euro area, spring 2010 – spring 2019 (percentages)
Sources: Eurobarometer, own calculations. Notes: The typology contains four groups: the first group neither supports the euro nor trusts the ECB (EMU-sceptics); the second group supports the euro, but does not trust the ECB (ECB-sceptics); the third group does not support the euro, but trusts the ECB (euro-sceptics); and the fourth group supports the euro and trusts the ECB (EMU-supporters). A fifth group (Other) includes those who answered “don't know” to one of the two questions. The categories correspond to an index of political interest that is constructed from the answers to the question “When you get together with friends or relatives, would you say you discuss frequently, occasionally or never about...? 1) National political matters; 2) European political matters; 3) Local political matters.”
5 Conclusion
Trust in the ECB and support for the euro have diverged in recent years. The share of the euro area population that supports the euro remained relatively steady throughout the economic and financial crisis starting in 2008-09 and by late 2019 had trended upwards to reach an all-time high. By contrast, the share of citizens trusting the ECB fell with the onset of the financial crisis and then recovered partially to a neutral level.
This disconnect can be further examined through the lens of the typology of attitudes towards EMU. Whereas EMU-supporters are found to represent the largest share of the euro area population and remained so during the crisis, the share of ECB-sceptics rose significantly during the crisis, while the share of EMU-sceptics also
0
10
20
30
40
50
2010 2012 2014 2016 2018
EMU-supportersECB-scepticsEMU-scepticsEuro-scepticsOther (don't know)
a) Not at all interested
2010 2012 2014 2016 2018
b) Slightly interested
0
10
20
30
40
50
2010 2012 2014 2016 2018
c) Moderately interested
2010 2012 2014 2016 2018
d) Strongly interested

ECB Economic Bulletin, Issue 4 / 2020 – Articles Citizens’ attitudes towards the ECB, the euro and Economic and Monetary Union
102
grew. By contrast, the percentage of euro-sceptics has remained relatively low. This illustrates rather powerfully that citizens distinguish between the euro and the ECB, and have different expectations of them. It also shows that the drivers of support for the ECB are distinct from the drivers of support for the euro. At the same time, the fall in trust in the ECB from very favourable pre-crisis levels has to be seen as part of a wider development of declining trust in public institutions in Europe in the aftermath of the global financial crisis.
A breakdown of support for EMU along sociodemographic lines sheds light on who tends to support EMU and who does not. Exploring types of support for EMU along different sociodemographic lines – notably geography, age and education, as well as respondents’ perceptions of the economic and financial situation and broader attitudes towards the EU – reveals which parts of the euro area population are more or less likely to support EMU. While the univariate form of this analysis neither estimates the strength of correlations nor controls for confounding factors, the patterns it reveals over time allow possible reasons for the disconnect between trust in the ECB and support for the euro to be deduced.
The analysis suggests that popular support for EMU – in particular, trust in the ECB – hinges to a large extent on citizens’ perceptions of their personal financial situation and the overall economic situation. Perceptions of the state of the national and European economies and individuals’ financial situation are highly correlated with support for EMU and, in particular, trust in the ECB. This finding is further corroborated by the geographic distribution of support for EMU, which reveals a considerably higher share of EMU-sceptics and ECB-sceptics in euro area countries that were more affected by the crisis. Similarly, support for EMU varies strongly with education and occupation, with more years in education and higher-skilled occupations – important determinants of one’s personal material situation – being associated with greater support for EMU, despite a recent uptick in the share of ECB-sceptics across different education levels.
By contrast, other sociodemographic indicators seem to be less relevant for support for EMU. There is no marked difference in patterns of support for EMU between genders or across age cohorts, with perhaps the minor exception of the war generation, which accounts for a smaller share of EMU-supporters overall, but a higher share of “don’ know” answers. Among the sociodemographic indicators considered, political interest appears most relevant, as support for the EMU appears to be somewhat greater among respondents who are more interested in politics.
While the high and steady level of support for the euro is good news for the single currency, the sensitivity of support for the ECB holds important lessons on how citizens view and assess the performance of the central bank. The findings lend support to the hypotheses that support for the ECB is strongly related to perceptions of economic outcomes, but also to cognitive factors and material interests related to education or occupation. While the analysis shows that trust in the ECB is vulnerable to economic outcomes – potentially including those beyond the ECB’s control – it also suggests that trust in the ECB can be improved by the institution providing information on its tasks and objectives, and by continuing to pursue its

ECB Economic Bulletin, Issue 4 / 2020 – Articles Citizens’ attitudes towards the ECB, the euro and Economic and Monetary Union
103
mandate of maintaining price stability, thereby safeguarding citizens’ purchasing power.
More inclusive communication and efforts to improve general understanding of the ECB’s mandate and tasks may help foster trust in the ECB. In particular, given the heterogeneity in support for the EMU and scepticism of the ECB observed between and within countries, as well as among different parts of the population, making communication more accessible to people with differing levels of education and prior knowledge, and also addressing the concrete concerns of citizens in different parts of the euro area – such as the ECB’s role in economic outcomes – can enhance trust in the ECB. The heterogeneity within countries highlights the need to reach out beyond capital cities. In addition, action to increase knowledge not just on personal finances, but also on how financial markets and central banks function, including the services they provide to citizens in their everyday lives, for example in the fields of payments or cash provision, may further improve citizens’ understanding of and trust in the ECB and its policies.
Enhanced communication efforts to foster trust in the ECB will be in its interest. Higher levels of trust in the central bank not only help steer inflation expectations and promote trust in the currency, thus supporting the effectiveness of monetary policy, but also preserve the central bank’s independence by shielding it from political pressures. In the context of EMU, having a more trusted and hence more effective central bank also encourages citizens to perceive European economic integration as successful and thus fosters greater popular support for significant economic and financial, as well as political, steps towards greater integration. In turn, such steps could further enhance the effectiveness of the ECB’s policy and improve the overall welfare of euro area citizens.

ECB Economic Bulletin, Issue 4 / 2020 – Articles Access to finance for small and medium-sized enterprises since the financial crisis: evidence from survey data
104
2 Access to finance for small and medium-sized enterprises since the financial crisis: evidence from survey data
Prepared by Katarzyna Bańkowska, Annalisa Ferrando and Juan Angel Garcia89
1 Introduction
The tightening of financial conditions as a result of the Global Financial Crisis (GFC) and the subsequent sovereign debt crisis in the euro area led to severe difficulties for small and medium-sized enterprises (SMEs) in accessing finance. The survey on the access to finance of enterprises (SAFE), which has been conducted on behalf of the ECB and the European Commission since 2009, reveals significant shifts in firms’ financing conditions since the start of the GFC.90 During the financial crisis and the subsequent euro area sovereign debt crisis, a substantial share of SMEs highlighted access to finance as one of the most pressing problems affecting their business activity. Moreover, firms across different countries and sectors faced the same issue.
Monetary policy measures, including non-standard ones, have contributed to improving access to finance for euro area non-financial corporations since the GFC. This article reviews the available evidence on the impact of some of the non-standard measures. These measures – particularly those related to bank financing, but also those related to some additional sources of financing for SMEs – are key to understanding the evolution of SMEs’ financing conditions over the last ten years.
While SMEs’ financing conditions have significantly improved over recent years, some important challenges remained even before the coronavirus (COVID-19) pandemic that started late in 2019. For example, SAFE results indicate that financing gaps – i.e. the difference between financial needs and the availability of external funding – remained for specific financing instruments, notably the market-based ones. Diversification across alternative financing instruments can make an important contribution to resilience against adverse financial and real shocks. Therefore, this article provides both a taxonomy of SMEs’ financing patterns based on a cluster analysis – before the onset of the pandemic crisis – and some evidence on the implications for firms’ investment decisions. For example, SMEs tend to be in the clusters where flexible short-term debt or long-term bank loans are the main financing instruments. Also, a combination of leasing/factoring and short-term loans was of particular importance for SMEs, compared with larger firms.
89. Gianmarco Rimoldi provided data support. 90 As a reference, in the survey conducted between 16 September and 25 October 2019, the sample size
for the euro area was 11,204 firms, of which 10,241 (91%) had fewer than 250 employees. For more detailed information on the survey, see: https://www.ecb.europa.eu/stats/ecb_surveys/safe/html/index.en.html. The survey contains a sample of large companies in order to better gauge possible financing conditions/constraints only affecting SMEs.

ECB Economic Bulletin, Issue 4 / 2020 – Articles Access to finance for small and medium-sized enterprises since the financial crisis: evidence from survey data
105
In the context of the coronavirus crisis, the emergence of new financing difficulties should stand out in relation to the current vintage of data and against the background of the pre-existing financing options for SMEs across the euro area. A companion box in this Economic Bulletin issue summarises the results of the last round of SAFE conducted during March and April 2020, and elaborates on the specific challenges posed by the coronavirus crisis for SMEs.
2 Access to finance and credit rationing over time
Starting in 2009, there have been three important phases in firms’ perceptions of their financing conditions. These phases have coincided with periods over which the monetary transmission mechanism was impaired to various degrees, negatively affecting SMEs’ financing conditions. Therefore, ECB measures taken to restore the transmission mechanism also had a positive impact on SMEs’ access to finance during those periods. The first phase covered the period from the launch of the survey in 2009, to September 2012, when the Outright Monetary Transactions (OMT) programme was announced. During this period, SMEs reported that access to finance ranked second, after finding customers, among the biggest obstacles to conducting business (see Chart 1).91 The second period, from the last quarter of 2012 to March 2016, was characterised by several unconventional monetary policy (UMP) measures, including the introduction of negative rates in June 2014, the start of the Targeted Longer-Term Refinancing Operations (TLTRO I) in September 2014 and the ECB’s asset purchase programme (APP) in March 2015. According to the survey, difficulty accessing finance, while remaining an important concern for firms, started to gradually become less acute during this period, and was outweighed by difficulties with finding skilled staff and experienced managers. The last period starts in spring 2016 and runs until September 2019, before the coronavirus pandemic. The same period witnessed the launching of the TLTRO II and TLTRO III, as well as the corporate sector purchase programme (CSPP). Since spring 2016, only about 8% of SMEs have reported access to external financing as their main concern, compared with nearly 20% in 2009.
The financing situation of euro area firms was particularly severe for SMEs, with some differences across sectors. The percentage of firms that perceived access to finance as their main problem was consistently higher for SMEs than for large companies over the whole period concerned (see Chart 1). Regarding sectors, until September 2012 it was particularly the construction sector that found access to finance to be a major concern, with 22% of construction SMEs reporting this, compared with 15% of SMEs from the services sector (see Chart 2). This may reflect, for example, greater scrutiny by financial institutions when lending to the construction sector following the GFC. In the last phase, however, little variation was evident across sectors in this regard. At the same time, the availability of skilled staff became the most pressing issue affecting the construction sector (29%), often related to the introduction of new technologies combined with an ageing workforce. Construction was affected to
91 SAFE contains a broad question to shed light on firms’, and in particular SMEs’, assessments of
problems affecting their business operations. Those concerns can be either on the demand side, such as finding customers, competition, regulation and the availability of skilled labour, or on the supply side, such as access to finance and production or labour costs.

ECB Economic Bulletin, Issue 4 / 2020 – Articles Access to finance for small and medium-sized enterprises since the financial crisis: evidence from survey data
106
a larger extent than, for instance, the trade sector (18%), which was least affected by this issue.
Chart 1 Most significant problems faced by euro area firms
(weighted percentages of respondents)
Source: ECB and European Commission survey on the access to finance of enterprises (SAFE). Notes: The first vertical grey line denotes the announcement of the OMT; the second vertical grey line denotes the start of the TLTRO I and the negative rate policy; and the third vertical grey line denotes the start of the TLTRO II and the CSPP. The latest observation is for the period April-September 2019.
Chart 2 Most significant problems faced by euro area SMEs across sectors
(weighted percentages of respondents)
Source: ECB and European Commission survey on the access to finance of enterprises (SAFE). The latest observation included is for the period April-September 2019.
Firms that were actively seeking external financing became less financially constrained over time. On the basis of the SAFE results, firms are considered financially constrained if any of the three following conditions apply: (i) they applied for a bank loan and had their application rejected; (ii) they received a loan offer but either the cost was too high or the quantity offered was too low; or (iii) they did not apply for a loan because they feared a rejection.92 During the 2009-12 period, about 15% of euro
92 The definition of financially constrained firms is available in Chart 20 of the SAFE report.
0
5
10
15
20
25
30
H1 H2 H1 H2 H1 H2 H1 H2 H1 H2 H1 H2 H1 H2 H1 H2 H1 H2 H1 H2 H1
2009 2010 2011 2012 2013 2014 2015 2016 2017 2018 2019
SMEs: access to financeLarge enterprises: access to financeSMEs: availability of skilled staff or experienced managersSMEs: finding customers
0
5
10
15
20
25
30
35
2009
-201
2H1
2012
H2-
2015
2016
-201
9
2009
-201
2H1
2012
H2-
2015
2016
-201
9
2009
-201
2H1
2012
H2-
2015
2016
-201
9
2009
-201
2H1
2012
H2-
2015
2016
-201
9
2009
-201
2H1
2012
H2-
2015
2016
-201
9
Construction Industry Services Trade All sectors
Access to financeAvailability of skilled staff

ECB Economic Bulletin, Issue 4 / 2020 – Articles Access to finance for small and medium-sized enterprises since the financial crisis: evidence from survey data
107
area SMEs that regarded bank loans as relevant to their funding were constrained in obtaining a bank loan. In the second phase (until around March 2016), that percentage declined to approximately 12% and it has stabilised at around 8% in recent years (see Chart 3).
The share of financially constrained firms varied by firm size, category and country. SMEs tended to more frequently report that they were financially constrained than large companies, although the percentages have declined over time (see Chart 3). Among SMEs, other characteristics that determine differences across firms are their ages and the degree of innovation. Small and young firms have particular difficulties in accessing external finance.93 This might be related to the fact that they are more likely to face a higher degree of asymmetric information and contracting problems.94 Mature SMEs (i.e. those in business for ten years or more) tended to be considerably less financially constrained than young ones (existing for less than 10 years). SMEs involved in innovative activities experienced greater obstacles to obtaining a bank loan than firms that were providing mostly traditional products and services. In general, financing innovation is often difficult for firms, given the additional uncertainty involved.95 Chart 3 provides some evidence that innovative SMEs were more financially constrained.
Chart 3 Financially constrained firms by age and size
(weighted percentages of respondents)
Source: ECB and European Commission survey on the access to finance of enterprises (SAFE). Notes: the first vertical grey line denotes the announcement of the OMT; the second vertical grey line denotes the start of the TLTRO I and the negative rate policy; and the third vertical grey line denotes the start of the TLTRO II and the CSPP. Information about innovative companies is not available in each round. The latest observation is for the period April-September 2019.
93 See Ferrando, A. and Mulier, K., “Firms’ Financing Constraints: Do Perceptions Match the Actual
Situation?”, Economic and Social Review, Vol. 46, No 1, Frankfurt am Main, 2015, pp. 87-117. 94 See, for example, Berger, A. N. and Udell, G. F., "A more complete conceptual framework for financing of
small and medium enterprises”, Policy Research Working Paper Series 3795, The World Bank, 2005; Rauh, J., “Investment and Financing Constraints: Evidence from the Funding of Corporate Pension Plans”, Journal of Finance, Vol. 61, No 1, 2006, pp. 33-71; Fee, C. E., Hadlock, C. J. and Pierce, J. R., “Investment, Financing Constraints, and Internal Capital Markets: Evidence from the Advertising Expenditures of Multinational Firms”, The Review of Financial Studies, Vol. 22, No 6, June 2009, pp. 2361-2392; and Hadlock, C. J. and Pierce, J. R., “New Evidence on Measuring Financial Constraints: Moving Beyond the KZ Index”, The Review of Financial Studies, Vol. 23, No 5, May 2010, pp. 1909-1940.
95 See Acharya, V. and Xu, Z., “Financial dependence and innovation: The case of public versus private firms”, Journal of Financial Economics, Vol. 124, No 2, 2017, pp. 223-243.
0
5
10
15
20
25
H1 H2 H1 H2 H1 H2 H1 H2 H1 H2 H1 H2 H1 H2 H1 H2 H1 H2 H1 H2 H1
2009 2010 2011 2012 2013 2014 2015 2016 2017 2018 2019
SMEsLarge enterprisesSMEs – youngSMEs – innovative

ECB Economic Bulletin, Issue 4 / 2020 – Articles Access to finance for small and medium-sized enterprises since the financial crisis: evidence from survey data
108
For large firms, it is not only the degree of financial constraint that is less serious compared with SMEs, but also the form of the constraint. Large companies more often reported being quantity constrained (i.e. banks offering a limited amount of the requested credit) than SMEs, while outright rejections were much smaller for large firms compared with SMEs (see Chart 4). Moreover, SMEs – particularly young and/or innovative firms – were more frequently discouraged from applying for loans. The percentage of discouraged firms remained relatively stable throughout the period considered, while the rejection rate clearly declined and reached lows of 2% for SMEs and 1% for large companies in 2019. Bank credit costs appeared negligible in determining financial constraints for all companies, reflecting the significant extent of monetary policy accommodation since 2009.
Chart 4 Components of financially constrained firms by age and size
(weighted percentages of respondents)
Source: ECB and European Commission survey on the access to finance of enterprises (SAFE). The latest observation included is for the period April-September 2019.
3 Effects of unconventional monetary policy
In response to the weak economic conditions prevailing in the euro area, several monetary policy stimulus measures have been introduced over recent years. These have included a series of unconventional monetary policy measures, with the aim of restoring the transmission mechanism of monetary policy and bringing inflation back to the ECB’s price stability objective in a sustained way. These measures worked through several different channels, with some of the measures proving particularly useful in mitigating banking sector problems, restoring bank lending dynamics and sustaining financing conditions in general.96 In particular:97
96 For a comprehensive assessment of the transmission channels of the ECB’s non-standard measures,
see Rostagno, M., Altavilla, C., Carboni, G., Lemke, W., Motto, R., Saint Guilhem, A. and Yiangou, J., “A tale of two decades: the ECB’s monetary policy at 20”, ECB Working Paper Series, No 2346, 2019. See also the box entitled “Impact of the ECB’s non-standard measures on financing conditions: taking stock of recent evidence”, ECB Economic Bulletin, Issue 2, ECB, Frankfurt am Main, 2017.
02468
1012141618
2009
-201
2H1
2012
H2-
2015
2016
-201
9
2009
-201
2H1
2012
H2-
2015
2016
-201
9
2009
-201
2H1
2012
H2-
2015
2016
-201
9
2009
-201
2H1
2012
H2-
2015
2016
-201
9
SMEs Large enterprises SMEs – young SMEs – innovative
Cost too highRejectedReceived limited amountDiscouraged

ECB Economic Bulletin, Issue 4 / 2020 – Articles Access to finance for small and medium-sized enterprises since the financial crisis: evidence from survey data
109
• The Outright Monetary Transactions (OMT) programme was launched in the summer of 2012. Once a programme is established by the European Stability Mechanism (ESM), the OMT programme enables the purchase of eligible sovereign bonds issued by euro area governments in order to address severe distortions in sovereign bond markets. While no purchase has yet been conducted under the OMT programme, its announcement helped to reduce the yields on sovereign bonds issued by fiscally-stressed countries immediately, sharply, and permanently.98 Furthermore, by alleviating pressure on euro area banks holding such bonds, the announcement of the OMT programme helped to sustain lending.
• Interest rates were lowered to negative territory in the summer of 2014, thus providing additional monetary stimulus.99 Also, the ECB has repeatedly communicated its intention to keep short-term interest rates low for an extended period of time, with such forward guidance reinforcing the signalling channel of policy rate cuts.
• The CSPP was first announced as part of a broader set of measures under the expanded APP in March 2016. It was launched in June 2016 to allow for large direct purchases of eligible (i.e. investment grade) bonds issued by companies based in the euro area.100 The programme was aimed at reducing debt-financing costs for large firms which could issue such bonds as an alternative financing source to bank loans, thereby freeing up more loan supply for smaller firms.101
• Several rounds of TLTROs were launched to further foster corporate lending. The amounts that credit institutions could borrow as part of these operations were linked to their eligible credit granted to euro area-resident non-financial corporations and households, excluding lending for house purchases, in all currencies. The first series of TLTROs (TLTRO I) was announced in June 2014 and implemented in September 2014. The second series (TLTRO II) was announced in March 2016 and implemented in June 2016. Finally, a third series of TLTROs (TLTRO III) was announced in March 2019 and implemented starting from September 2019.102
97 In this article, the focus is on analyses of UMP decisions based on the assessment of firms through SAFE
replies. For this reason, not all the UMP measures implemented are considered here, for example, the programmes for the purchases of asset-backed securities (ABS) or public assets (PSPP), although they had an impact on the financing conditions of euro area non-financial corporations.
98 Altavilla, C., Giannone, D., and Lenza, M., “The financial and macroeconomic effects of the OMT announcements”, International Journal of Central Banking, Vol. 12, No 3, 2001, pp. 29-57.
99 For a comprehensive assessment of the impact of negative rates, see the article “Negative rates and the transmission of monetary policy”, Economic Bulletin, Issue 3, 2020; and Altavilla, C., Burlon, L., Giannetti, M., and Holton, S., “Is there a zero lower bound? The effects of negative policy rates on banks and firms”, ECB Working Paper Series, No 2289, ECB, Frankfurt am Main, June 2019.
100 For an assessment of the impact of the CSPP, see the box entitled “The ECB’s corporate sector purchase programme: its implementation and impact”, Economic Bulletin, Issue 4, ECB, Frankfurt am Main, 2017.
101 Grosse-Rueschkamp, B., Steffen, S. and Streitz, D., “A Capital Structure Channel of Monetary Policy”, Journal of Financial Economics, Vol. 133, No 2, 2019, pp. 357-378.
102 See Rostagno, M. et al., op. cit.

ECB Economic Bulletin, Issue 4 / 2020 – Articles Access to finance for small and medium-sized enterprises since the financial crisis: evidence from survey data
110
All of these measures shaped euro area firms’ perceptions of the availability of external finance (see Charts 5 and 6).
Chart 5 Availability of external financing instruments for SMEs
(net percentages of respondents for which the respective instrument is relevant)
Source: ECB and European Commission survey on the access to finance of enterprises (SAFE). Notes: The first vertical grey line denotes the announcement of the OMT; the second vertical grey line denotes the start of the TLTRO I and the negative rate policy; and the third vertical grey line denotes the start of the TLTRO II and the CSPP. The latest observation is for the period April-September 2019.
Chart 6 Availability of external financing instruments for large firms
(net percentages for which the respective instrument is relevant)
Source: ECB and European Commission survey on the access to finance of enterprises. Notes: Net percentages are defined as the difference between the percentage of enterprises reporting that a given factor has increased and the percentage of those reporting that it has declined. The first vertical grey line denotes the announcement of the OMT; the second vertical grey line denotes the start of the TLTRO I and the negative rate policy; and the third denotes the start of the TLTRO II and the CSPP. The latest observation is for the period April-September 2019.
In the aftermath of the GFC, the sovereign debt crisis in some euro area countries posed additional challenges to SMEs’ access to finance. Since banks tend to hold large quantities of domestic sovereign bonds, banking sectors of stressed countries also came under pressure in financial markets, and their funding costs rose. Furthermore, the rationing of credit to SMEs intensified. Against this background, the
-20
-10
0
10
20
30
40
50
H1 H2 H1 H2 H1 H2 H1 H2 H1 H2 H1 H2 H1 H2 H1 H2 H1 H2 H1
2010 2011 2012 2013 2014 2015 2016 2017 2018 2019
EquityDebt securitiesBank loansTrade credit
-20
-10
0
10
20
30
40
50
H1 H2 H1 H2 H1 H2 H1 H2 H1 H2 H1 H2 H1 H2 H1 H2 H1 H2 H1
2010 2011 2012 2013 2014 2015 2016 2017 2018 2019
EquityDebt securitiesBank loansTrade credit

ECB Economic Bulletin, Issue 4 / 2020 – Articles Access to finance for small and medium-sized enterprises since the financial crisis: evidence from survey data
111
announcement of the OMT was specifically aimed at easing the financial market conditions in stressed countries and thereby indirectly improving access to finance in those countries.
The announcement of the OMT programme led to an improvement in credit access. Just before the OMT programme announcement, 18% of euro area SMEs and 10% of large enterprises were reporting a deterioration in the availability of bank loans in net terms (see Charts 6 and 7).103 The programme represented a turning point in firms’ perceptions, a conclusion that is confirmed by econometric analysis. Ferrando et al. showed that SMEs from vulnerable countries reported being less likely to be rationed or discouraged from applying for loans in the six months after the programme announcement.104
Despite the positive impact of the OMT and other UMP measures, developments in credit supply to non-financial corporations have diverged across the euro area since the European sovereign debt crisis (see Chart 7). Corbisiero and Faccia found that the rejections of non-financial corporations’ loan applications tended to be more frequent in countries more affected by the European sovereign debt crisis.105 These rejections were influenced by the health of bank balance sheets, in particular by the presence of non-performing loans (NPLs). This suggests that supply factors did play an important role in subdued credit in these countries. At relatively high levels of NPLs, banks tend to lend less, even to creditworthy firms.106 Such high levels of NPLs were mainly observed in vulnerable countries during the European sovereign debt crisis, implying that the balance sheet weakness of individual banks in vulnerable countries may have contributed to the weak credit dynamics observed. Taken together, the above-mentioned empirical evidence lends support to the success of the ECB’s UMP measures in improving the terms and conditions of bank credit to SMEs, consistent with the “bank lending view” of monetary policy transmission.107
103 Net percentages are defined as the difference between the percentage of enterprises reporting that a
given factor has increased and the percentage of those reporting that it has declined. 104 Ferrando, A., Popov, A. and Udell, G. F., “Do SMEs Benefit from Unconventional Monetary Policy and
How? Microevidence from the Eurozone”, Journal of Money, Credit and Banking, Vol. 51, No 4, 2019, pp. 896-928.
105 Corbisiero, G. and Faccia, D., “Firm or bank weakness? Access to finance since the European sovereign debt crisis”, ECB Working Paper Series, No 2361, ECB, Frankfurt am Main, 2020.
106 The study shows that the key findings are robust to alternative definitions of credit rejection and an alternative firm-bank matching criterion applied to those firms reporting multiple bank relationships, either matching firms with their first listed bank or to the healthiest bank among those listed. In addition, they are not driven by a larger concentration of distressed firms in the periphery countries. See also the July 2018 report of the Bank Lending Survey.
107 For additional evidence see Burlon, L., Dimou, M., Drahonsky, A.-C. and Köhler-Ulbrich, P., “What does the bank lending survey tell us about credit conditions for euro area firms?”, ECB Economic Bulletin, Issue 8, ECB, Frankfurt am Main, 2019.

ECB Economic Bulletin, Issue 4 / 2020 – Articles Access to finance for small and medium-sized enterprises since the financial crisis: evidence from survey data
112
Chart 7 Financially constrained SMEs in countries more affected by the debt crisis
(weighted percentages of respondents)
Source: ECB and European Commission survey on the access to finance of enterprises (SAFE). Notes: “Countries more affected by the debt crisis” refers to Ireland, Greece, Spain, Italy, Cyprus and Portugal. The first vertical grey line denotes the announcement of the OMT; the second vertical grey line denotes the start of the TLTRO I and the negative rate policy; and the third vertical grey line denotes the start of the TLTRO II and the CSPP. The latest observation is for the period April-September 2019.
Several studies show that the TLTROs led to significant improvements in various aspects of financing conditions for firms, for example by improving actual and expected loan availability or lowering interest expenses.108 Importantly, there was an improvement in bank credit availability for firms from countries more affected by the European sovereign debt crisis but also, and more strongly so, for those from the rest of the euro area. In addition, the improvements varied across different types of firms, with medium/large firms and mature firms benefiting most, as there is evidence that the impact of credit constraints on firms’ investment was greater for them.109
Access to other sources of finance beyond bank lending is also important for SMEs. While bank loans have been the main source of finance for euro area SMEs, the changes in financial market conditions and the difficulties faced by the banking sector since the GFC have highlighted that diversified sources of external finance are a key element of resilience to adverse financial and real economic shocks.110
Corporate bond purchases through the CSPP also contributed to an improvement in SMEs’ access to finance. Betz and De Santis showed that the CSPP strongly contributed to an increase in the size of the euro area corporate bond market, pushing banks to increase lending to smaller firms.111 Indeed, according to
108 See Afonso, A. and Sousa-Leite, J., “The Transmission of Unconventional Monetary Policy to Bank
Credit Supply: Evidence from the TLTRO”, REM Working Paper, No 65, 2019. 109 García-Posada Gómez, M., “Credit constraints, firm investment and employment: Evidence from survey
data”, Journal of Banking and Finance, Vol. 99, 2019, pp. 121-141. 110 De Fiore, F. and Uhlig, H., “Corporate Debt Structure and the Financial Crisis”, Journal of Money, Credit
and Banking, Vol. 47, No 8, 2015, pp. 1571-1598. 111 Betz, F. and De Santis, R., “ECB corporate QE and the loan supply to bank-dependent firms”, ECB
Working Paper Series, No 2314, ECB, Frankfurt am Main, 2019.
0
5
10
15
20
25
H1 H2 H1 H2 H1 H2 H1 H2 H1 H2 H1 H2 H1 H2 H1 H2 H1 H2 H1 H2 H1
2009 2010 2011 2012 2013 2014 2015 2016 2017 2018 2019
Countries more affected by the debt crisisOther countries

ECB Economic Bulletin, Issue 4 / 2020 – Articles Access to finance for small and medium-sized enterprises since the financial crisis: evidence from survey data
113
the SAFE replies, the increased availability of bank loans to SMEs during this period was accompanied by improvements in the issuance of debt securities by large enterprises (see Charts 5 and 6).
In addition to the transmission channels already discussed, UMP measures can have an impact on SMEs’ access to finance through their expectations of the future availability of finance. Ferrando et al. provide evidence for a “funding expectations channel” of monetary policy by looking at how SMEs’ decisions are affected by their expectations of future credit access.112 This “funding expectations channel” complemented the standard “bank lending channel”, under which monetary policy is transmitted to the real economy through changes in the level and composition of bank credit. The authors provide supporting evidence that three of the unconventional policies mentioned above, namely the announcements of the OMT, the negative rates and the CSPP, had a significant effect on expectations of future credit availability (see Chart 8). In particular, immediately after the policy announcements, expectations of future credit access improved relatively more for SMEs borrowing from banks that were expected to increase SME lending due to the policy measure.113 The authors also find evidence that SMEs’ investment and employment increased more at those firms expecting bank credit to improve in the future.
112 Ferrando, A., Popov, A. and Udell, G. F., (2020) “A Funding Expectations Channel of Monetary Policy”
ECB Working Paper Series, forthcoming. In another paper, Ferrando, A., Ganoulis, I. and Preuss, C., “Firms’ expectations on the availability of credit since the financial crisis”, Review of Behavioural Finance, 2020 look at the formation of expectations relating to the availability of bank finance among euro area SMEs. Firms seem to use a wider range of information at their disposal, e.g. on their sales and profits and the general economic environment. Importantly, SMEs seem to combine both backward and forward-looking elements, in some cases including important policy announcements, such as the OMT.
113 This may well be the result of several additional factors set in motion by the announcement of the measures. For example, in the case of negative interest rate policy, Altavilla et al. highlight another channel of pass-through of the monetary policy transmission mechanism, through which sound banks can pass negative rates on to their corporate depositors without experiencing a contraction in funding. Furthermore, they show that the negative interest rate policy provides further stimulus to the economy through firms’ asset rebalancing.

ECB Economic Bulletin, Issue 4 / 2020 – Articles Access to finance for small and medium-sized enterprises since the financial crisis: evidence from survey data
114
Chart 8 UMP announcements and SMEs’ expectations of bank loan availability
(net percentages of respondents for which bank loans are relevant)
Source: ECB and European Commission survey on the access to finance of enterprises (SAFE). Notes: Net percentages are defined as the difference between the percentage of enterprises reporting that a given factor has increased and the percentage of those reporting that it has declined. The first vertical grey line denotes the announcement of the OMT; the second vertical grey line denotes the announcement of the TLTRO I and the negative rate policy; the third denotes the announcement of the TLTRO II and the CSPP. The latest observation is for the period April-September 2019.
Overall, existing empirical evidence provides strong support for the positive impact of the UMP measures launched by the ECB over recent years to support the financing conditions of euro area firms, including SMEs. Importantly, the reported evidence suggests that the non-standard measures worked through different channels and that their impact varied somewhat across countries. In interpreting the results, it has to be kept in mind that isolating the effects of monetary policy is always challenging. Furthermore, in the case of the research reviewed in this section, the non-standard nature of the measures – for which a very limited number of episodes exists – further complicates the identification process.
4 Financing patterns and financial behaviour
Despite the improvement in financing conditions and the policy measures implemented so far, some structural challenges for SMEs’ access to finance remain. These challenges are mainly related to the fact that euro area firms still use a limited number of the available financing instruments. To analyse this structural feature, this section focuses on the period from April to September 2019. It represents a snapshot of the financing options chosen by euro area firms after the developments described in the previous section.
The financing options of euro area enterprises are limited to a few instruments, mostly related to the banking sector. Leasing and factoring for large companies and trade credit for SMEs are also important (see Chart 9). There are differences across firm sizes, though the relative importance of the funding sources remains the same overall. In particular, SMEs tend to make less use of external funds: at least one-third of them report that they have not used external sources of finance. For large
-20
-10
0
10
20
H1 H2 H1 H2 H1 H2 H1 H2 H1 H2 H1 H2 H1 H2 H1 H2 H1 H2 H1
2010 2011 2012 2013 2014 2015 2016 2017 2018 2019
AvailabilityExpectations

ECB Economic Bulletin, Issue 4 / 2020 – Articles Access to finance for small and medium-sized enterprises since the financial crisis: evidence from survey data
115
firms, the share is 20%. Irrespective of firm size, the use of market-based finance (i.e. debt or external equity) remains limited.
Chart 9 Use of financing sources for euro area firms
(weighted percentages over the period 2009-19)
Source: ECB and European Commission survey on the access to finance of enterprises (SAFE). Notes: Sources of finance that are relevant and that have been used in the past six months.
SMEs use a limited number of sources of finance. Chart 10 shows the distribution of the number of financing sources used by SMEs and by large enterprises. As predicted by the literature114, the data show the limited diversification of financing sources of SMEs in contrast to large enterprises. Many SMEs used only one type of finance (36%), whereas the respective percentage is lower for large enterprises (22%). When looking at firms using four or more financing sources, the percentage of large enterprises is almost twice as high as for SMEs.
114 See Berger, A. and Udell, G., “The Economics of Small Business Finance: The Roles of Private Equity
and Debt Markets in the Financial Growth Cycle”, Journal of Banking & Finance, Vol. 22, Nos 6-8, 1998, pp. 613-673; Cressy, R. and Olafsson, C., “European SME Financing: An Overview”, Small Business Economics, Vol. 9, No 2, 1997, pp. 87-96; Lawless, M., O’Connell, B. and O’Toole, C., “Financial structure and diversification of European firms”, Applied Economics, Vol. 47, No 23, 2015, pp. 2379-2398.
0 10 20 30 40 50 60
Retained earnings or sale of assets
Grants or subsidised loans
Bank overdrafts, credit lines or credit overdrafts
Bank loans (new or renewal)
Trade credit
Leasing, hire purchases or factoring
Equity and debt securities issued
Other funds (family or friends)
No external finance
Large enterprisesSMEs

ECB Economic Bulletin, Issue 4 / 2020 – Articles Access to finance for small and medium-sized enterprises since the financial crisis: evidence from survey data
116
Chart 10 Number of sources of finance used (by firm size)
(weighted percentages over the period 2009-19)
Source: ECB and European Commission survey on the access to finance of enterprises (SAFE). Note: The figure shows the frequency of the number of different sources of finance the firms used to finance their operations.
Firms of different sizes use different combinations of financial instruments. In order to establish a taxonomy of financing patterns, firms in the SAFE sample are grouped on the basis of their sources of finance using a “cluster analysis”. Box 1 reports on the results of such an analysis, based on the survey round for the period April-September 2019. The taxonomy provides a snapshot of the financing behaviour of euro area firms until the period just before the coronavirus crisis. While the approach is by its nature related to a specific period, the analysis of survey replies in alternative periods, for instance April-September 2012, shows that firms displayed broadly similar financing patterns.115 In the survey round for the period April-September 2019, each of the eight clusters contains around 7% to 10% of the total number of firms, except for the largest cluster, which contains firms that have not reported the use of external sources of finance (38%). The taxonomy presented in Table 1 confirms that large companies, as defined by the number of employees or turnover, are using more diverse sources of finance than SMEs, and are also more likely to be listed on the stock market or be part of a business group. A higher percentage of large firms belongs to the clusters with more financial instruments (mixed – market, mixed – family or friends and mixed – grants, see Box 1), particularly when considering the difference between firms with very high turnover (more than €50 million) and low turnover (less than €10 million). By contrast, SMEs tend to more often be in the clusters where flexible short-term debt or long-term bank loans are the main financing instruments. A combination of leasing/factoring and short-term loans was also of particular importance for SMEs (mainly leasing-factoring cluster).
115 As a signal that the taxonomy has changed slightly over time along with firms’ financing conditions, the
empirical analysis referring to 2012 points to seven instead of eight clusters, as it is not possible to group firms around the cluster with the extensive use of grants or subsidised loans.
0 10 20 30 40
1
2
3
4
5
6
7
8
Large enterprisesSMEs

ECB Economic Bulletin, Issue 4 / 2020 – Articles Access to finance for small and medium-sized enterprises since the financial crisis: evidence from survey data
117
Box 2 A taxonomy of financing patterns in the euro area: a cluster analysis approach
Prepared by A. Ferrando and K. Bańkowska
The empirical analysis used to identify financing patterns for euro area enterprises is based on a cluster analysis approach similar to the research carried out by Moritz et al. and Masiak et al.116 The cluster analysis groups firms according to their use of the nine financing instruments described in Chart 9 in such a way that the groups are both homogenous (small within-cluster variance) and very distinct from each other (large between-cluster variance). The empirical analysis is based on the round that covers the April to September 2019 period for a total of 10,732 firms that reported whether they have used internal or external finance for their business activity in the previous six months. Being solely based on one round, the taxonomy provides a snapshot of the financing behaviour of euro area firms.117
Table A presents the eight clusters obtained following the above-mentioned procedure. The different clusters are presented by starting with those that include several financing instruments, and moving towards clusters that use fewer financing options. Each cluster contains around 7% to 10% of the total number of firms, except the last cluster, which includes a large share of firms that have not reported the use of external sources of finance (38%).
Cluster 1 (mixed – market): Firms in this cluster use a broad range of instruments which combines the highest use of retained earnings and sales of assets (81%) with a high usage of short-term and long-term bank loans (58% and 34% respectively). In contrast to other clusters, firms in this group are the only ones to access market-based finance (26%). Leasing and factoring are also relatively important instruments (50%), followed by trade credit (40%).
Cluster 2 (mixed – family or friends): The main characteristic of this cluster is that all firms rely on funds from related companies or family and friends. In addition, firms in this group mostly use short-term bank loans (50%), together with leasing and factoring (39%).
Cluster 3 (mixed – grants): In this cluster, all firms use subsidised loans for their business activity, which they combine with banking products (58% short-term bank loans and 48% long-term bank loans) and leasing and factoring (41%).
Cluster 4 (mainly trade credit): These firms use only trade credit for their business activity, which they combine with short-term bank financing (54%) and, to a lesser extent, with long-term bank loans (26%). Leasing and factoring are also relatively important (38%).
Cluster 5 (mainly bank loans): This cluster is characterised by firms that use long-term loans together with short-term ones (55%). The other financing instrument used by firms in this cluster is leasing and factoring (37%).
116 Moritz, A., Block, J. H., and Heinz, A., “Financing Patterns of European SMEs: An Empirical Taxonomy”,
Venture Capital, Vol. 18, No 2, 2016, pp. 115-148; and Masiak, C., Moritz, A., and Lang, F., “Financing patterns of European SMEs revisited: an updated empirical taxonomy and determinants of SME financing clusters”, EIF research and market analysis working paper, No 40, 2017. Both papers are based on previous survey rounds (2013 and 2015) and refer only to SMEs.
117 Technically, the cluster procedure that has been chosen is the hierarchical one, using the Dice-similarity measure. The algorithm used to merge clusters at successive steps was the Ward clustering algorithm. Finally, the choice of the number of clusters was based on the combination of a visual inspection of the resulting dendogram with several criteria, called stopping rules, such as the variance ratio criterion (VRC) and the Duda-Hart indices. See Mooi, E., Sarstedt, M. and Mooi-Reci, I., “Market Research: The process, Data and Methods using Stata”, Springer Verlag, Berlin, 2018.
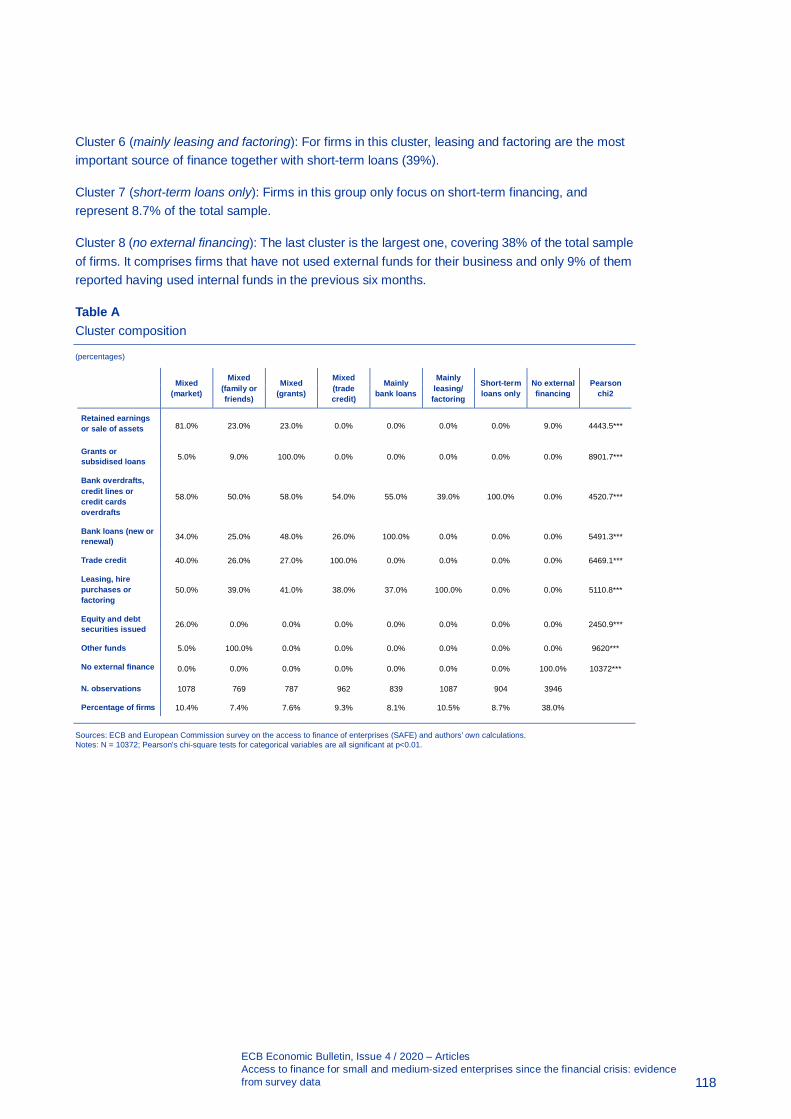
ECB Economic Bulletin, Issue 4 / 2020 – Articles Access to finance for small and medium-sized enterprises since the financial crisis: evidence from survey data
118
Cluster 6 (mainly leasing and factoring): For firms in this cluster, leasing and factoring are the most important source of finance together with short-term loans (39%).
Cluster 7 (short-term loans only): Firms in this group only focus on short-term financing, and represent 8.7% of the total sample.
Cluster 8 (no external financing): The last cluster is the largest one, covering 38% of the total sample of firms. It comprises firms that have not used external funds for their business and only 9% of them reported having used internal funds in the previous six months.
Table A Cluster composition
(percentages)
Sources: ECB and European Commission survey on the access to finance of enterprises (SAFE) and authors’ own calculations. Notes: N = 10372; Pearson’s chi-square tests for categorical variables are all significant at p<0.01.
Mixed (market)
Mixed (family or friends)
Mixed (grants)
Mixed (trade credit)
Mainly bank loans
Mainly leasing/
factoring
Short-term loans only
No external financing
Pearson chi2
Retained earnings or sale of assets 81.0% 23.0% 23.0% 0.0% 0.0% 0.0% 0.0% 9.0% 4443.5***
Grants or subsidised loans 5.0% 9.0% 100.0% 0.0% 0.0% 0.0% 0.0% 0.0% 8901.7***
Bank overdrafts, credit lines or credit cards overdrafts
58.0% 50.0% 58.0% 54.0% 55.0% 39.0% 100.0% 0.0% 4520.7***
Bank loans (new or renewal) 34.0% 25.0% 48.0% 26.0% 100.0% 0.0% 0.0% 0.0% 5491.3***
Trade credit 40.0% 26.0% 27.0% 100.0% 0.0% 0.0% 0.0% 0.0% 6469.1***
Leasing, hire purchases or factoring
50.0% 39.0% 41.0% 38.0% 37.0% 100.0% 0.0% 0.0% 5110.8***
Equity and debt securities issued 26.0% 0.0% 0.0% 0.0% 0.0% 0.0% 0.0% 0.0% 2450.9***
Other funds 5.0% 100.0% 0.0% 0.0% 0.0% 0.0% 0.0% 0.0% 9620***
No external finance 0.0% 0.0% 0.0% 0.0% 0.0% 0.0% 0.0% 100.0% 10372***
N. observations 1078 769 787 962 839 1087 904 3946
Percentage of firms 10.4% 7.4% 7.6% 9.3% 8.1% 10.5% 8.7% 38.0%
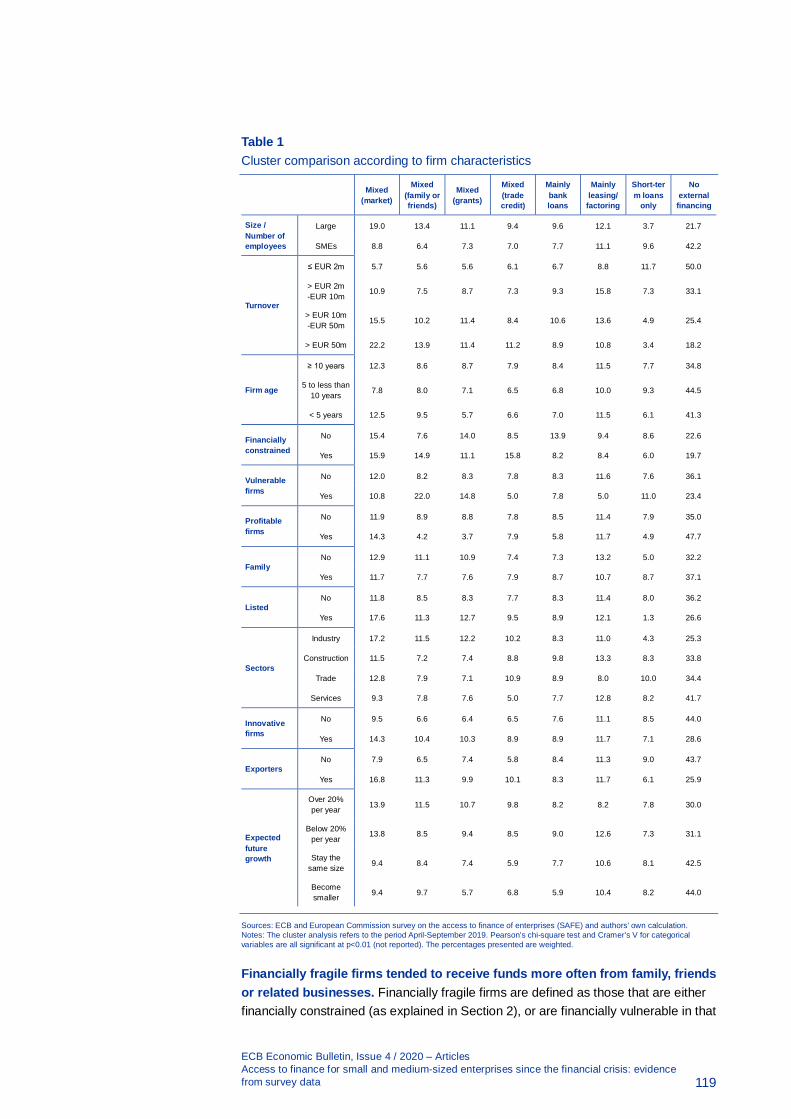
ECB Economic Bulletin, Issue 4 / 2020 – Articles Access to finance for small and medium-sized enterprises since the financial crisis: evidence from survey data
119
Table 1 Cluster comparison according to firm characteristics
Mixed (market)
Mixed (family or friends)
Mixed (grants)
Mixed (trade credit)
Mainly bank loans
Mainly leasing/
factoring
Short-term loans
only
No external
financing
Size / Number of employees
Large 19.0 13.4 11.1 9.4 9.6 12.1 3.7 21.7
SMEs 8.8 6.4 7.3 7.0 7.7 11.1 9.6 42.2
Turnover
≤ EUR 2m 5.7 5.6 5.6 6.1 6.7 8.8 11.7 50.0
> EUR 2m -EUR 10m
10.9 7.5 8.7 7.3 9.3 15.8 7.3 33.1
> EUR 10m -EUR 50m 15.5 10.2 11.4 8.4 10.6 13.6 4.9 25.4
> EUR 50m 22.2 13.9 11.4 11.2 8.9 10.8 3.4 18.2
Firm age
≥ 10 years 12.3 8.6 8.7 7.9 8.4 11.5 7.7 34.8
5 to less than 10 years 7.8 8.0 7.1 6.5 6.8 10.0 9.3 44.5
< 5 years 12.5 9.5 5.7 6.6 7.0 11.5 6.1 41.3
Financially constrained
No 15.4 7.6 14.0 8.5 13.9 9.4 8.6 22.6
Yes 15.9 14.9 11.1 15.8 8.2 8.4 6.0 19.7
Vulnerable firms
No 12.0 8.2 8.3 7.8 8.3 11.6 7.6 36.1
Yes 10.8 22.0 14.8 5.0 7.8 5.0 11.0 23.4
Profitable firms
No 11.9 8.9 8.8 7.8 8.5 11.4 7.9 35.0
Yes 14.3 4.2 3.7 7.9 5.8 11.7 4.9 47.7
Family No 12.9 11.1 10.9 7.4 7.3 13.2 5.0 32.2
Yes 11.7 7.7 7.6 7.9 8.7 10.7 8.7 37.1
Listed No 11.8 8.5 8.3 7.7 8.3 11.4 8.0 36.2
Yes 17.6 11.3 12.7 9.5 8.9 12.1 1.3 26.6
Sectors
Industry 17.2 11.5 12.2 10.2 8.3 11.0 4.3 25.3
Construction 11.5 7.2 7.4 8.8 9.8 13.3 8.3 33.8
Trade 12.8 7.9 7.1 10.9 8.9 8.0 10.0 34.4
Services 9.3 7.8 7.6 5.0 7.7 12.8 8.2 41.7
Innovative firms
No 9.5 6.6 6.4 6.5 7.6 11.1 8.5 44.0
Yes 14.3 10.4 10.3 8.9 8.9 11.7 7.1 28.6
Exporters No 7.9 6.5 7.4 5.8 8.4 11.3 9.0 43.7
Yes 16.8 11.3 9.9 10.1 8.3 11.7 6.1 25.9
Expected future growth
Over 20% per year 13.9 11.5 10.7 9.8 8.2 8.2 7.8 30.0
Below 20% per year
13.8 8.5 9.4 8.5 9.0 12.6 7.3 31.1
Stay the same size 9.4 8.4 7.4 5.9 7.7 10.6 8.1 42.5
Become smaller 9.4 9.7 5.7 6.8 5.9 10.4 8.2 44.0
Sources: ECB and European Commission survey on the access to finance of enterprises (SAFE) and authors’ own calculation. Notes: The cluster analysis refers to the period April-September 2019. Pearson’s chi-square test and Cramer’s V for categorical variables are all significant at p<0.01 (not reported). The percentages presented are weighted.
Financially fragile firms tended to receive funds more often from family, friends or related businesses. Financially fragile firms are defined as those that are either financially constrained (as explained in Section 2), or are financially vulnerable in that

ECB Economic Bulletin, Issue 4 / 2020 – Articles Access to finance for small and medium-sized enterprises since the financial crisis: evidence from survey data
120
they have difficulties serving their existing debt due to decreasing profits and turnover and increasing interest expenses.118 Such financially fragile firms tended to obtain funds more often from family or friends, or related businesses (mixed – family or friends cluster) or through trade credit (mixed – trade credit cluster, see Table 1). Beyond these financing sources, vulnerable firms were more likely to receive funds through grants or subsidised bank loans. By contrast, a high share of profitable firms was in the cluster “no external financing”, probably because they have high retained earnings. They were more often using a variety of financial instruments, including market-based ones (mixed – grants cluster). This is also the case for innovative firms and exporters. Bank loans – either short or long-term – remained an important source of finance for these three groups of firms.
Firms diversified their sources of finance according to the sector they belong to. Industrial firms were slightly more often in the cluster with more diversified financing options (mixed – market cluster). Industrial firms are on average larger and are more likely to be exporters. Overall, they are able to attract debt and long-term financing, given their ability to provide collateral to secure their debt. By contrast, firms in the construction sector rely more on asset-backed financing and short-term bank loans, as is the case in the cluster mainly leasing/factoring. Firms in the trade sector required more short-term debt and trade credit in their operations. The cluster analysis indicates that a relatively high percentage of them are grouped together in the cluster with more financing options. Finally, firms in the services sector are less likely to use external financing instruments compared with firms in the other industries, with many being in the cluster related to asset-backed financing (mixed – leasing/factoring).
Firms that are expecting to grow in the near future rely on several financing options. Firms that were expecting to grow in 2020 had higher financing needs. As the taxonomy shows, they made use of several financing instruments, being mostly grouped in the first three clusters of Table 1.
Financing gaps are more acute for firms using informal sources of finance. An important indicator derived from the SAFE dataset is the degree of financing gap, defined as the difference between the change in demand and in the availability of external financing. In the euro area, the financing gap has remained negative since 2014 for large companies and since 2015 for SMEs, meaning that the increase in needs for external financing was smaller than the improvement in access to external funds. In 2019, the weighted net percentages were quite similar between large firms and SMEs (-3% and -4% respectively). Chart 11 plots the financing gap across the different clusters. The financing gap is larger for the group of firms using mostly loans granted by family or friends, or by related businesses (mixed – family or friends). On average, these are companies that are financially vulnerable, with little capacity to generate internal funds. Many of them are financially constrained.
118 See footnote 8 in the SAFE report
https://www.ecb.europa.eu/stats/ecb_surveys/safe/html/ecb.safe201911~57720ae65f.en.html#toc3.
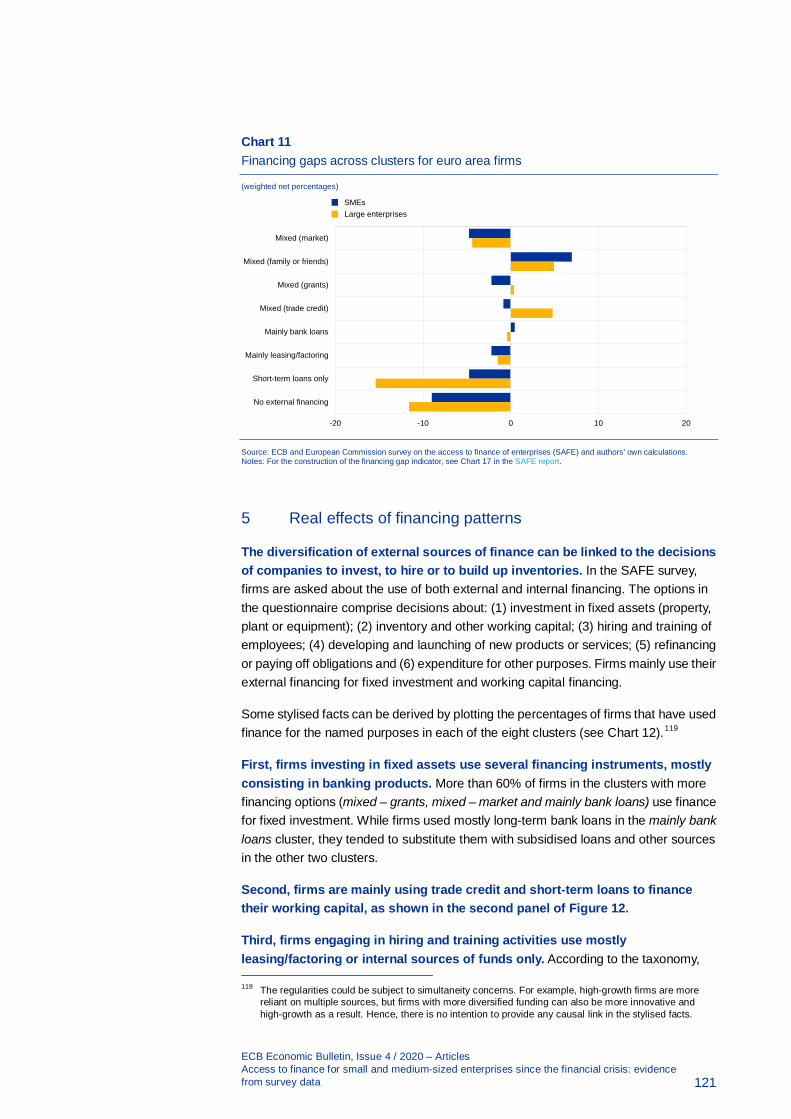
ECB Economic Bulletin, Issue 4 / 2020 – Articles Access to finance for small and medium-sized enterprises since the financial crisis: evidence from survey data
121
Chart 11 Financing gaps across clusters for euro area firms
(weighted net percentages)
Source: ECB and European Commission survey on the access to finance of enterprises (SAFE) and authors’ own calculations. Notes: For the construction of the financing gap indicator, see Chart 17 in the SAFE report.
5 Real effects of financing patterns
The diversification of external sources of finance can be linked to the decisions of companies to invest, to hire or to build up inventories. In the SAFE survey, firms are asked about the use of both external and internal financing. The options in the questionnaire comprise decisions about: (1) investment in fixed assets (property, plant or equipment); (2) inventory and other working capital; (3) hiring and training of employees; (4) developing and launching of new products or services; (5) refinancing or paying off obligations and (6) expenditure for other purposes. Firms mainly use their external financing for fixed investment and working capital financing.
Some stylised facts can be derived by plotting the percentages of firms that have used finance for the named purposes in each of the eight clusters (see Chart 12).119
First, firms investing in fixed assets use several financing instruments, mostly consisting in banking products. More than 60% of firms in the clusters with more financing options (mixed – grants, mixed – market and mainly bank loans) use finance for fixed investment. While firms used mostly long-term bank loans in the mainly bank loans cluster, they tended to substitute them with subsidised loans and other sources in the other two clusters.
Second, firms are mainly using trade credit and short-term loans to finance their working capital, as shown in the second panel of Figure 12.
Third, firms engaging in hiring and training activities use mostly leasing/factoring or internal sources of funds only. According to the taxonomy, 119 The regularities could be subject to simultaneity concerns. For example, high-growth firms are more
reliant on multiple sources, but firms with more diversified funding can also be more innovative and high-growth as a result. Hence, there is no intention to provide any causal link in the stylised facts.
-20 -10 0 10 20
Mixed (market)
Mixed (family or friends)
Mixed (grants)
Mixed (trade credit)
Mainly bank loans
Mainly leasing/factoring
Short-term loans only
No external financing
SMEsLarge enterprises

ECB Economic Bulletin, Issue 4 / 2020 – Articles Access to finance for small and medium-sized enterprises since the financial crisis: evidence from survey data
122
firms that decide to increase their headcount or their training link this decision to the leasing of fixed assets.
Fourth, firms developing and launching new products or services tend to use a variety of financing products. This is in line with the results presented in Table 1. Innovative companies are clustered around market-based products but also use other financing instruments.
Finally, firms reporting having used finance for refinancing or paying off obligations, or for other purposes, rely slightly more on funds from family or friends or related businesses. As observed in the previous section, these firms are financially constrained and encounter some difficulties in repaying their existing debt.
Chart 12 Purpose of financing as perceived by firms across financing clusters
(percentages)
Sources: ECB and European Commission survey on the access to finance of enterprises (SAFE) and authors’ own calculations.
A more formal approach that takes into consideration several other dimensions simultaneously confirms the stylised facts. To further investigate the link between financing options and firms’ decisions in the real economy, a logistic regression model is run.120 The set of dependent variables, which are dummies set to one if firms are using finance for the five specific purposes, are regressed against dummies for each cluster group and a set of variables that control for differences in firm size, age, industry and country. 120 There is a vast range of literature that has tried to establish a link between financing patterns and real
effects. For example, see: Lamont, O., “Cash flow and Investment: Evidence from Internal capital markets”, Journal of Finance, Vol. 52, No 1, 1997, pp. 83-109; Brown, J. R., Fazzari, S. M. and Petersen, B. C., “Financing Innovation and Growth: Cash Flow, External Equity, and the 1990s R&D Boom”, Journal of Finance, Vol. 64, No 1, 2009, pp. 151-185; Popov, A., “Credit constraints and investment in human capital: Training evidence from transition economies”, Journal of Financial Intermediation, Vol. 23, No 1, 2014, pp. 76-100; and Chodorow-Reich, G., “The Employment Effects of Credit Market Disruptions: Firm-Level Evidence from the 2008-09 Financial Crisis”, Quarterly Journal of Economics, Vol. 129, pp.1-59. Most of the literature describes correlations between the two, as is also demonstrated in this article.
0
20
40
60
80
Investment Working capital Hiring New products/Services
Refinancing Other use
Mixed (market)Mixed (family or friends)Mixed (grants)Mixed (trade credit)Mainly bank loansMainly leasing/factoringShort-term loans onlyNo external financing
ECB Economic Bulletin, Issue 4 / 2020 – Articles Access to finance for small and medium-sized enterprises since the financial crisis: evidence from survey data
123
Table 2 reports the effects of the diversification of external funds by clusters on the purposes for which firms used financing.121 Focusing on the highest marginal effects, the results show that firms using more grants or long-term bank loans (i.e. grouped in the mixed – grants cluster) are 27% more likely to have invested in fixed asset activities than those not using external finance, all the other characteristics being equal. Also, the probability of a firm investing in working capital is 26% higher for firms in the trade credit financing cluster. By contrast, the third column in Table 2 appears to indicate that external finance is not better than internal financing for firms hiring and training their employees. In fact, the marginal effect is even negative in some clusters. This is in line with previous findings demonstrating that bank finance displays a negative relationship to investment in intangible assets such as R&D, software, databases and IT networks, and training.122 Furthermore, the probability of developing new products or services is not related to the use of bank products, but it is higher for firms using grants or market-based finance in particular. In these cases, however, the marginal effects are relatively modest at around 7%. Finally, in the last two columns, the regression results confirm the stylised fact on the relative importance of informal finance for refinancing and other purposes.
121 The table reports the marginal effects over and above the cluster referring to firms with no external
financing. 122 See Covas, F., and Den Haan, W. J., “The role of debt and equity finance over the business cycle”, The
Economic Journal, Vol. 122, No 565, 2012, pp. 1262-1286; Grundy, B., and Verwijmeren, P., “The external financing of investment”, SSRN Electronic Journal, 2019; and Ferrando, A. and Preuss, C., “What finance for what investment? Survey-based evidence for European companies”, Economia Politica, Vol. 35, 2018, pp. 1015-1053.

ECB Economic Bulletin, Issue 4 / 2020 – Articles Access to finance for small and medium-sized enterprises since the financial crisis: evidence from survey data
124
Table 2 Purposes of financing and diversification of financing instruments
(marginal effects)
Variables Investment in fixed assets
Working capital Hiring New products/
Services Refinancing Other use
Mixed (market) 0.23*** 0.21*** -0.07*** 0.07*** 0.12*** 0.06***
(0.02) (0.03) (0.02) (0.02) (0.02) (0.02)
Mixed (family or friends)
0.16*** 0.18*** -0.08*** 0.06** 0.13*** 0.14***
(0.03) (0.03) (0.03) (0.03) (0.02) (0.03)
Mixed (grants) 0.27*** 0.10*** -0.12*** 0.07*** 0.12*** 0.09***
(0.03) (0.03) (0.02) (0.02) (0.03) (0.02)
Mixed (trade credit)
0.09*** 0.26*** -0.06** 0.05** 0.08*** 0.04**
(0.03) (0.03) (0.02) (0.02) (0.02) (0.02)
Mainly bank loans
0.27*** 0.12*** -0.13*** -0.01 0.08*** 0.04**
(0.03) (0.03) (0.03) (0.02) (0.02) (0.02)
Mainly leasing/ factoring
0.14*** 0.04* -0.02 0.05** 0.06*** 0.04**
(0.03) (0.02) (0.02) (0.02) (0.02) (0.02)
Short-term loans only
-0.01 0.20*** -0.07*** -0.01 0.11*** 0.04***
(0.03) (0.02) (0.02) (0.02) (0.02) (0.01)
Firm control variables
Yes Yes Yes Yes Yes Yes
Country and sectoral effects
Yes Yes Yes Yes Yes Yes
Observations 10,155 10,153 10,169 10,155 10,134 9,845
Pseudo R2 0.104 0.120 0.0663 0.0537 0.120 0.0505
Sources: ECB and European Commission survey on the access to finance of enterprises (SAFE) and authors’ own calculations. Notes: Logit regressions. In the analysis the omitted reference category is the no external financing cluster. Other reference categories are large and mature companies in the German manufacturing sector. All specifications use weights based on the number of employees to restore the proportions of the economic weight of each size class, economic activity and country. Standard errors in parentheses, *** p<0.01, ** p<0.05, * p<0.1.
6 Conclusions
Since the Global Financial Crisis, a series of unconventional monetary policy measures have contributed to easing SMEs’ access to finance. This article has described the evolution of firms’ assessments of their financing conditions throughout the period until the outbreak of the coronavirus crisis. In particular, firms in all euro area countries reported an overall decrease over time in their perceptions of being financially constrained.
Although it has gradually improved since the mid-2010s, challenges for SMEs’ access to finance remain, for example in terms of funding diversification. Taking stock of the overall development of firms’ financing conditions from 2009 onwards, this article analysed the funding options firms had at their disposal in mid-2019 through a cluster analysis approach. The resulting taxonomy highlights that the percentage of firms using market-based financial instruments to fund their business remained small. This is despite both the difficulties encountered with their traditional funding source (i.e. bank lending) during the crisis and the many subsequent efforts since 2015 to set

ECB Economic Bulletin, Issue 4 / 2020 – Articles Access to finance for small and medium-sized enterprises since the financial crisis: evidence from survey data
125
up a capital markets union (CMU) to facilitate SMEs’ fundraising. From the taxonomy, it emerges that firms that were exporters, more profitable, more innovative and that were planning to grow more in the future tended to diversify their financing instruments to a higher degree. However, these firms also tended to report higher financing gaps, namely the overall availability of external sources of finance being lower than their demand for them.
The analysis highlights some important effects of monetary policy decisions on SMEs’ access to finance over recent years.
• First, monetary policy measures predominantly aimed at supporting bank credit are crucial for SMEs in the light of their dependence on bank credit as the main source of external finance.
• Second, support for bank finance is particularly relevant for the funding of fixed investment by SMEs, which may play an important role in the transmission of monetary policy.
• Third, from a structural point of view, initiatives taken at the EU or national levels to support access to market-based instruments are of the utmost importance. A diversification in sources of finance would facilitate the activity and the expansion of innovative firms in particular, while also generally making SMEs more resilient in situations where the supply of credit tends to dry up.
The outbreak of the pandemic has given rise to new, more severe and immediate challenges for SMEs in terms of their access to financing. See Box 3 in this issue for additional information.

Statistics
S 1ECB Economic Bulletin, Issue 4 / 2020 - Statistics
Contents
1 External environment S 2
2 Financial developments S 3
3 Economic activity S 8
4 Prices and costs S 14
5 Money and credit S 18
6 Fiscal developments S 23
Further information
ECB statistics can be accessed from the Statistical Data Warehouse (SDW): http://sdw.ecb.europa.eu/
Data from the statistics section of the Economic Bulletin are available from the SDW: http://sdw.ecb.europa.eu/reports.do?node=1000004813
A comprehensive Statistics Bulletin can be found in the SDW: http://sdw.ecb.europa.eu/reports.do?node=1000004045
Methodological definitions can be found in the General Notes to the Statistics Bulletin: http://sdw.ecb.europa.eu/reports.do?node=10000023
Details on calculations can be found in the Technical Notes to the Statistics Bulletin: http://sdw.ecb.europa.eu/reports.do?node=10000022
Explanations of terms and abbreviations can be found in the ECB’s statistics glossary: http://www.ecb.europa.eu/home/glossary/html/glossa.en.html
Conventions used in the tables
- data do not exist/data are not applicable
. data are not yet available
... nil or negligible
(p) provisional
s.a. seasonally adjusted
n.s.a. non-seasonally adjusted

1 External environment
S 2ECB Economic Bulletin, Issue 4 / 2020 - Statistics
1.1 Main trading partners, GDP and CPI
GDP 1) CPI
(period-on-period percentage changes) (annual percentage changes)
G20 United United Japan China Memo item: OECD countries United United Japan China Memo item:States Kingdom euro area States Kingdom euro area 2)
Total excluding food (HICP) (HICP)and energy
1 2 3 4 5 6 7 8 9 10 11 12 13
2017 3.9 2.4 1.9 2.2 6.8 2.5 2.3 1.9 2.1 2.7 0.5 1.6 1.52018 3.7 2.9 1.3 0.3 6.6 1.9 2.6 2.1 2.4 2.5 1.0 2.1 1.82019 2.9 2.3 1.4 0.7 6.1 1.2 2.1 2.2 1.8 1.8 0.5 2.9 1.2
2019 Q2 0.7 0.5 -0.2 0.5 1.6 0.1 2.3 2.2 1.8 2.0 0.8 2.6 1.4 Q3 0.8 0.5 0.5 0.0 1.4 0.3 1.9 2.2 1.8 1.8 0.3 2.9 1.0 Q4 0.6 0.5 0.0 -1.9 1.5 0.1 1.9 2.1 2.0 1.4 0.5 4.3 1.0
2020 Q1 . -1.3 -2.0 -0.9 -9.8 -3.8 2.1 2.2 2.1 1.7 0.5 5.0 1.1
2019 Dec. - - - - - - 2.2 2.2 2.3 1.3 0.8 4.5 1.3
2020 Jan. - - - - - - 2.4 2.2 2.5 1.8 0.7 5.4 1.4 Feb. - - - - - - 2.3 2.2 2.3 1.7 0.4 5.2 1.2 Mar. - - - - - - 1.7 2.1 1.5 1.5 0.4 4.3 0.7 Apr. - - - - - - . . 0.3 0.8 0.1 3.3 0.3 May 3) - - - - - - . . . . . . 0.1
Sources: Eurostat (col. 3, 6, 10, 13); BIS (col. 9, 11, 12); OECD (col. 1, 2, 4, 5, 7, 8).1) Quarterly data seasonally adjusted; annual data unadjusted.2) Data refer to the changing composition of the euro area.3) The figure for the euro area is an estimate based on provisional national data, as well as on early information on energy prices.
1.2 Main trading partners, Purchasing Managers’ Index and world trade
Purchasing Managers’ Surveys (diffusion indices; s.a.) Merchandise
imports 1) Composite Purchasing Managers’ Index Global Purchasing Managers’ Index 2)
Global 2) United United Japan China Memo item: Manufacturing Services New export Global Advanced EmergingStates Kingdom euro area orders economies market
economies
1 2 3 4 5 6 7 8 9 10 11 12
2017 53.2 54.3 54.7 52.5 51.8 56.4 53.8 53.8 52.8 5.9 3.1 7.82018 53.4 55.0 53.3 52.1 52.3 54.6 53.1 53.8 50.8 4.4 3.1 5.22019 51.7 52.5 50.2 50.5 51.8 51.3 50.3 52.2 48.8 -0.5 0.3 -1.1
2019 Q2 51.5 51.8 50.5 50.8 51.6 51.8 50.4 51.9 49.5 -0.6 -1.4 -0.1 Q3 51.4 51.4 50.1 51.3 51.4 51.2 50.4 51.7 48.5 1.2 1.5 1.1 Q4 51.3 51.9 49.5 49.2 52.6 50.7 51.3 51.3 49.5 -0.8 -3.1 0.6
2020 Q1 46.1 47.9 47.4 44.4 42.0 44.2 46.7 45.9 46.0 -2.9 -3.1 -2.7
2019 Dec. 51.6 52.7 49.3 48.6 52.6 50.9 51.2 51.8 49.5 -0.8 -3.1 0.6
2020 Jan. 52.3 53.3 53.3 50.1 51.9 51.3 51.3 52.7 49.5 -1.5 -3.6 -0.1 Feb. 45.0 49.6 53.0 47.0 27.5 51.6 42.6 45.8 44.4 -2.0 -2.8 -1.5 Mar. 41.0 40.9 36.0 36.2 46.7 29.7 46.2 39.2 44.0 -2.9 -3.1 -2.7 Apr. 28.9 27.0 13.8 25.8 47.6 13.6 35.1 26.7 28.6 . . . May . . . 27.8 54.5 31.9 39.8 . 32.9 . . .
Sources: Markit (col. 1-9); CPB Netherlands Bureau for Economic Policy Analysis and ECB calculations (col. 10-12).1) Global and advanced economies exclude the euro area. Annual and quarterly data are period-on-period percentages; monthly data are 3-month-on-3-month percentages. All data
are seasonally adjusted.2) Excluding the euro area.

2 Financial developments
S 3ECB Economic Bulletin, Issue 4 / 2020 - Statistics
2.1 Money market interest rates(percentages per annum; period averages)
Euro area 1) United States Japan
Euro short-term Overnight 1-month 3-month 6-month 12-month 3-month 3-monthrate deposits deposits deposits deposits deposits deposits deposits
(€STR) 2) (EONIA) (EURIBOR) (EURIBOR) (EURIBOR) (EURIBOR) (LIBOR) (LIBOR)
1 2 3 4 5 6 7 8
2017 - -0.35 -0.37 -0.33 -0.26 -0.15 1.26 -0.022018 -0.45 -0.36 -0.37 -0.32 -0.27 -0.17 2.31 -0.052019 -0.48 -0.39 -0.40 -0.36 -0.30 -0.22 2.33 -0.08
2019 Nov. -0.54 -0.45 -0.45 -0.40 -0.34 -0.27 1.90 -0.10 Dec. -0.54 -0.46 -0.45 -0.39 -0.34 -0.26 1.91 -0.06
2020 Jan. -0.54 -0.45 -0.46 -0.39 -0.33 -0.25 1.82 -0.05 Feb. -0.54 -0.45 -0.47 -0.41 -0.36 -0.29 1.68 -0.07 Mar. -0.53 -0.45 -0.48 -0.42 -0.36 -0.27 1.10 -0.09 Apr. -0.54 -0.45 -0.43 -0.25 -0.19 -0.11 1.09 -0.01 May -0.54 -0.46 -0.46 -0.27 -0.14 -0.08 0.40 -0.03
Source: Refinitiv and ECB calculations.1) Data refer to the changing composition of the euro area, see the General Notes.2) The ECB published the euro short-term rate (€STR) for the first time on 2 October 2019, reflecting trading activity on 1 October 2019. Data on previous periods refer to the
pre-€STR, which was published for information purposes only and not intended for use as a benchmark or reference rate in any market transactions.
2.2 Yield curves(End of period; rates in percentages per annum; spreads in percentage points)
Spot rates Spreads Instantaneous forward rates
Euro area 1), 2) Euro area 1), 2) United States United Kingdom Euro area 1), 2)
3 months 1 year 2 years 5 years 10 years 10 years 10 years 10 years 1 year 2 years 5 years 10 years- 1 year - 1 year - 1 year
1 2 3 4 5 6 7 8 9 10 11 12
2017 -0.78 -0.74 -0.64 -0.17 0.52 1.26 0.67 0.83 -0.66 -0.39 0.66 1.562018 -0.80 -0.75 -0.66 -0.26 0.32 1.07 0.08 0.51 -0.67 -0.45 0.44 1.172019 -0.68 -0.66 -0.62 -0.45 -0.14 0.52 0.34 0.24 -0.62 -0.52 -0.13 0.41
2019 Nov. -0.61 -0.63 -0.65 -0.57 -0.30 0.34 0.18 0.04 -0.66 -0.65 -0.33 0.23 Dec. -0.68 -0.66 -0.62 -0.45 -0.14 0.52 0.34 0.24 -0.62 -0.52 -0.13 0.41
2020 Jan. -0.62 -0.65 -0.68 -0.64 -0.40 0.26 0.06 -0.11 -0.69 -0.71 -0.46 0.10 Feb. -0.68 -0.74 -0.79 -0.78 -0.57 0.16 0.13 -0.06 -0.80 -0.85 -0.64 -0.13 Mar. -0.70 -0.69 -0.71 -0.67 -0.41 0.28 0.49 0.22 -0.70 -0.73 -0.48 0.09 Apr. -0.54 -0.61 -0.71 -0.72 -0.46 0.16 0.47 0.16 -0.72 -0.85 -0.51 0.01 May -0.57 -0.60 -0.63 -0.61 -0.36 0.24 0.48 0.14 -0.64 -0.69 -0.42 0.12
Source: ECB calculations.1) Data refer to the changing composition of the euro area, see the General Notes.2) ECB calculations based on underlying data provided by Euro MTS Ltd and ratings provided by Fitch Ratings.
2.3 Stock market indices(index levels in points; period averages)
Dow Jones EURO STOXX indices United Japan
States Benchmark Main industry indices
Broad 50 Basic Consumer Consumer Oil and Financials Industrials Technology Utilities Telecoms Health care Standard Nikkeiindex materials services goods gas & Poor’s 225
500
1 2 3 4 5 6 7 8 9 10 11 12 13 14
2017 376.9 3,491.0 757.3 268.6 690.4 307.9 182.3 605.5 468.4 272.7 339.2 876.3 2,449.1 20,209.02018 375.5 3,386.6 766.3 264.9 697.3 336.0 173.1 629.5 502.5 278.8 292.9 800.5 2,746.2 22,310.72019 373.6 3,435.2 731.7 270.8 721.5 324.4 155.8 650.9 528.2 322.0 294.2 772.7 2,915.5 21,697.2
2019 Nov. 398.4 3,693.1 794.5 283.0 761.3 328.8 163.6 711.6 585.2 339.4 304.8 837.7 3,107.2 23,278.1 Dec. 400.9 3,715.3 799.3 290.0 755.9 322.8 165.1 716.0 598.5 341.8 295.3 862.5 3,178.9 23,660.4
2020 Jan. 406.9 3,758.2 791.2 295.5 758.6 324.6 166.1 728.8 624.6 362.0 291.6 886.8 3,278.4 23,642.9 Feb. 407.1 3,734.9 797.3 292.3 734.5 301.0 168.4 722.8 635.8 391.4 298.1 895.0 3,282.5 23,180.4 Mar. 308.5 2,824.2 622.6 233.6 578.8 210.5 116.1 519.9 500.5 315.7 242.6 731.2 2,652.4 18,974.0 Apr. 310.3 2,839.6 657.9 245.7 588.3 216.7 107.2 508.9 539.3 296.4 242.8 786.8 2,763.2 19,208.4 May 322.1 2,909.3 678.1 251.2 601.3 219.9 109.3 539.7 576.8 307.1 249.9 829.2 2,919.6 20,543.3
Source: Refinitiv.

2 Financial developments
S 4ECB Economic Bulletin, Issue 4 / 2020 - Statistics
2.4 MFI interest rates on loans to and deposits from households (new business) 1), 2) (Percentages per annum; period average, unless otherwise indicated)
Deposits Revolving Extended Loans for consumption Loans Loans for house purchase
loans credit to sole Over- Redeem- With and card By initial period APRC 3) proprietors By initial period APRC 3) Compositenight able an agreed overdrafts credit of rate fixation and of rate fixation cost-of-
at maturity of: unincor- borrowingnotice Floating Over porated Floating Over 1 Over 5 Over indicatorof up Up to Over rate and 1 partner- rate and and up and up 10to 3 2 2 up to year ships up to to 5 to 10 years
months years years 1 year 1 year years years
1 2 3 4 5 6 7 8 9 10 11 12 13 14 15 16
2019 Apr. 0.03 0.41 0.32 0.75 5.88 16.52 5.56 5.63 6.19 2.36 1.59 1.78 1.77 1.77 2.02 1.75 May 0.03 0.44 0.31 0.79 5.81 16.53 5.61 5.76 6.34 2.33 1.57 1.80 1.73 1.74 1.99 1.72 June 0.03 0.44 0.32 0.82 5.81 16.48 5.42 5.67 6.24 2.31 1.55 1.74 1.67 1.65 1.95 1.67 July 0.03 0.43 0.31 0.80 5.75 16.44 5.74 5.73 6.30 2.34 1.55 1.72 1.59 1.57 1.90 1.61 Aug. 0.03 0.43 0.28 0.78 5.75 16.45 6.15 5.75 6.35 2.25 1.51 1.69 1.54 1.50 1.84 1.56 Sep. 0.03 0.43 0.27 0.78 5.82 16.46 5.65 5.61 6.17 2.22 1.46 1.65 1.49 1.44 1.77 1.48 Oct. 0.03 0.42 0.24 0.83 5.70 16.48 5.88 5.55 6.19 2.26 1.45 1.59 1.44 1.39 1.74 1.44 Nov. 0.03 0.42 0.23 0.73 5.61 16.49 5.36 5.53 6.25 2.21 1.43 1.59 1.61 1.48 1.80 1.47 Dec. 0.03 0.42 0.22 0.80 5.58 16.55 5.44 5.28 5.89 2.09 1.46 1.58 1.43 1.39 1.75 1.41
2020 Jan. 0.02 0.42 0.27 0.73 5.62 16.63 5.63 5.69 6.24 2.21 1.46 1.52 1.43 1.40 1.72 1.43 Feb. 0.02 0.36 0.32 0.70 5.63 16.60 5.56 5.58 6.15 2.20 1.43 1.54 1.38 1.36 1.71 1.41 Mar. (p) 0.02 0.36 0.30 0.69 5.60 16.24 5.55 5.45 5.90 2.10 1.39 1.55 1.36 1.36 1.65 1.39
Source: ECB.1) Data refer to the changing composition of the euro area.2) Including non-profit institutions serving households.3) Annual percentage rate of charge (APRC).
2.5 MFI interest rates on loans to and deposits from non-financial corporations (new business) 1), 2) (Percentages per annum; period average, unless otherwise indicated)
Deposits Revolving Other loans by size and initial period of rate fixation Composite
loans and cost-of-Over- With an agreed overdrafts up to EUR 0.25 million over EUR 0.25 and up to 1 million over EUR 1 million borrowingnight maturity of: indicator
Floating Over Over Floating Over Over Floating Over OverUp to Over rate 3 months 1 year rate 3 months 1 year rate 3 months 1 year
2 years 2 years and up to and up to and up to and up to and up to and up to3 months 1 year 3 months 1 year 3 months 1 year
1 2 3 4 5 6 7 8 9 10 11 12 13 14
2019 Apr. 0.03 0.06 0.54 2.19 2.19 2.36 2.26 1.67 1.60 1.64 1.16 1.33 1.44 1.62 May 0.03 0.04 0.46 2.14 2.18 2.38 2.29 1.66 1.59 1.63 1.09 1.17 1.50 1.57 June 0.03 0.03 0.57 2.17 2.13 2.33 2.25 1.63 1.55 1.56 1.09 1.28 1.39 1.55 July 0.03 0.04 0.56 2.11 2.07 2.50 2.20 1.66 1.57 1.54 1.16 1.32 1.39 1.56 Aug. 0.03 -0.04 0.54 2.08 2.07 2.36 2.19 1.64 1.59 1.53 1.06 1.32 1.40 1.52 Sep. 0.03 -0.05 0.88 2.16 2.03 2.25 2.15 1.61 1.51 1.44 1.10 1.26 1.29 1.54 Oct. 0.02 -0.03 0.43 2.08 2.01 2.41 2.11 1.61 1.54 1.40 1.14 1.40 1.27 1.56 Nov. 0.02 -0.04 0.39 2.06 2.02 2.36 2.13 1.59 1.55 1.41 1.14 1.34 1.29 1.55 Dec. 0.01 0.00 0.42 2.09 2.00 2.28 2.08 1.58 1.54 1.39 1.26 1.21 1.37 1.55
2020 Jan. 0.01 -0.06 0.34 2.09 2.17 2.32 2.10 1.63 1.57 1.44 1.11 1.25 1.28 1.55 Feb. 0.00 -0.12 0.33 2.07 1.99 2.29 2.11 1.57 1.54 1.41 1.11 1.22 1.25 1.52 Mar. (p) 0.00 -0.08 0.25 2.00 1.90 2.17 1.98 1.58 1.53 1.50 1.15 1.10 1.19 1.46
Source: ECB.1) Data refer to the changing composition of the euro area.2) In accordance with the ESA 2010, in December 2014 holding companies of non-financial groups were reclassified from the non-financial corporations sector to the financial
corporations sector.

2 Financial developments
S 5ECB Economic Bulletin, Issue 4 / 2020 - Statistics
2.6 Debt securities issued by euro area residents, by sector of the issuer and initial maturity(EUR billions; transactions during the month and end-of-period outstanding amounts; nominal values)
Short-term
Outstanding amounts Gross issues 1)
Total MFIs Non-MFI corporations General government Total MFIs Non-MFI corporations General government
(including (including Euro- Financial Non- Central Other Euro- Financial Non- Central Other
system) corporations financial govern- general system) corporations financial govern- generalother than FVCs corporations ment govern- other than FVCs corporations ment govern-
MFIs ment MFIs ment
1 2 3 4 5 6 7 8 9 10 11 12 13 14
2017 1,240 519 155 . 70 438 57 367 167 54 . 37 79 312018 1,217 504 170 . 72 424 47 389 171 66 . 41 76 352019 1,277 550 175 . 84 406 61 415 177 80 . 47 73 38
2019 Oct. 1,356 579 178 . 106 424 69 425 184 69 . 52 75 45 Nov. 1,341 570 178 . 102 425 66 374 148 77 . 44 75 30 Dec. 1,277 550 175 . 84 406 61 318 113 88 . 37 45 35
2020 Jan. 1,363 597 172 . 99 422 73 499 208 77 . 56 100 57 Feb. 1,388 600 195 . 103 415 74 428 173 101 . 47 69 37 Mar. 1,383 546 198 . 104 450 86 401 111 78 . 47 103 61
Long-term
2017 15,353 3,560 3,059 . 1,223 6,866 643 247 66 73 . 18 83 72018 15,746 3,688 3,161 . 1,247 7,022 627 228 64 68 . 15 75 62019 16,311 3,818 3,396 . 1,321 7,151 626 247 69 74 . 20 78 7
2019 Oct. 16,219 3,801 3,325 . 1,316 7,153 623 274 61 98 . 24 85 6 Nov. 16,365 3,832 3,404 . 1,330 7,172 628 275 63 109 . 26 71 6 Dec. 16,311 3,818 3,396 . 1,321 7,151 626 164 58 66 . 14 24 2
2020 Jan. 16,403 3,855 3,411 . 1,324 7,188 625 316 118 63 . 16 110 10 Feb. 16,488 3,867 3,409 . 1,338 7,244 630 261 72 56 . 22 101 10 Mar. 16,506 3,845 3,413 . 1,336 7,276 636 236 57 53 . 16 91 19
Source: ECB.1) For the purpose of comparison, annual data refer to the average monthly figure over the year.
2.7 Growth rates and outstanding amounts of debt securities and listed shares(EUR billions; percentage changes)
Oustanding amount
Debt securities Listed shares
Total MFIs Non-MFI corporations General government Total MFIs Financial Non-
(including corporations financialEurosystem) Financial Non- Central Other other than corporations
corporations financial government general MFIsother than FVCs corporations government
MFIs
1 2 3 4 5 6 7 8 9 10 11
2017 16,593.3 4,079.8 3,214.7 . 1,293.4 7,304.7 700.8 7,963.3 612.5 1,258.3 6,092.62018 16,962.4 4,192.8 3,331.5 . 1,318.9 7,445.8 673.4 7,033.1 465.0 1,108.9 5,459.22019 17,588.1 4,368.5 3,570.8 . 1,405.2 7,557.2 686.4 8,604.3 546.0 1,410.7 6,647.6
2019 Oct. 17,575.0 4,380.2 3,502.9 . 1,421.8 7,577.4 692.8 8,265.6 508.2 1,369.0 6,388.3 Nov. 17,706.2 4,401.6 3,581.5 . 1,431.5 7,597.7 693.9 8,511.9 524.1 1,401.7 6,586.2 Dec. 17,588.1 4,368.5 3,570.8 . 1,405.2 7,557.2 686.4 8,604.3 546.0 1,410.7 6,647.6
2020 Jan. 17,766.0 4,452.4 3,582.6 . 1,423.9 7,609.8 697.3 8,487.1 525.3 1,391.5 6,570.4 Feb. 17,876.0 4,467.3 3,604.2 . 1,441.7 7,659.1 703.6 7,763.6 488.4 1,238.7 6,036.5 Mar. 17,888.4 4,390.8 3,610.4 . 1,439.7 7,725.9 721.7 6,451.8 333.9 975.0 5,143.0
Growth rate
2017 1.3 -0.5 0.1 . 6.0 2.2 0.4 1.0 6.1 2.8 0.22018 1.9 1.7 3.0 . 3.3 1.9 -4.3 0.7 0.3 2.4 0.42019 3.1 3.8 5.0 . 5.6 1.5 1.8 0.0 0.5 -0.1 0.0
2019 Oct. 2.9 3.9 4.0 . 5.2 1.5 1.3 -0.1 0.4 -0.1 -0.2 Nov. 3.0 3.8 4.8 . 6.3 1.3 1.6 -0.1 0.4 0.0 -0.2 Dec. 3.1 3.8 5.0 . 5.6 1.5 1.8 0.0 0.5 -0.1 0.0
2020 Jan. 3.1 4.1 4.8 . 5.7 1.4 2.0 0.0 0.5 -0.1 0.0 Feb. 3.2 3.6 5.3 . 6.0 1.5 2.4 0.0 0.5 -0.1 0.0 Mar. 2.8 1.7 4.8 . 4.4 2.1 3.5 0.0 0.1 -0.1 0.0
Source: ECB.

2 Financial developments
S 6ECB Economic Bulletin, Issue 4 / 2020 - Statistics
2.8 Effective exchange rates 1) (period averages; index: 1999 Q1=100)
EER-19 EER-38
Nominal Real CPI Real PPI Real GDP Real ULCM Real ULCT Nominal Real CPIdeflator
1 2 3 4 5 6 7 8
2017 96.6 91.4 91.9 86.0 79.9 90.3 112.0 90.02018 98.9 93.4 93.4 87.2 80.1 91.3 117.9 93.82019 97.3 91.2 91.8 85.7 78.6 88.8 116.7 91.5
2019 Q2 97.3 91.4 91.7 85.6 78.2 88.9 116.8 91.8 Q3 97.7 91.4 91.8 86.0 78.9 89.1 116.9 91.5 Q4 97.0 90.4 91.4 85.5 78.1 88.2 116.2 90.5
2020 Q1 96.7 89.7 91.2 . . . 116.6 90.2
2019 Dec. 96.7 90.1 91.4 - - - 116.0 90.2
2020 Jan. 96.2 89.3 91.0 - - - 115.5 89.4 Feb. 95.6 88.7 90.4 - - - 114.9 88.9 Mar. 98.1 91.0 92.3 - - - 119.3 92.1 Apr. 97.5 90.6 92.3 - - - 119.2 92.3 May 97.7 90.7 92.9 - - - 119.2 92.1
Percentage change versus previous month
2020 May 0.2 0.0 0.7 - - - 0.0 -0.2
Percentage change versus previous year
2020 May 0.3 -0.8 1.2 - - - 1.9 0.2
Source: ECB.1) For a definition of the trading partner groups and other information see the General Notes to the Statistics Bulletin.
2.9 Bilateral exchange rates(period averages; units of national currency per euro)
Chinese Croatian Czech Danish Hungarian Japanese Polish Pound Romanian Swedish Swiss USrenminbi kuna koruna krone forint yen zloty sterling leu krona franc Dollar
1 2 3 4 5 6 7 8 9 10 11 12
2017 7.629 7.464 26.326 7.439 309.193 126.711 4.257 0.877 4.5688 9.635 1.112 1.1302018 7.808 7.418 25.647 7.453 318.890 130.396 4.261 0.885 4.6540 10.258 1.155 1.1812019 7.735 7.418 25.670 7.466 325.297 122.006 4.298 0.878 4.7453 10.589 1.112 1.119
2019 Q2 7.672 7.418 25.686 7.467 322.973 123.471 4.282 0.875 4.7480 10.619 1.126 1.124 Q3 7.800 7.394 25.734 7.463 328.099 119.323 4.318 0.902 4.7314 10.662 1.096 1.112 Q4 7.801 7.439 25.577 7.471 331.933 120.323 4.287 0.861 4.7666 10.652 1.096 1.107
2020 Q1 7.696 7.490 25.631 7.472 339.137 120.097 4.324 0.862 4.7973 10.669 1.067 1.103
2019 Dec. 7.797 7.442 25.497 7.472 330.706 121.241 4.273 0.847 4.7779 10.483 1.093 1.111
2020 Jan. 7.683 7.443 25.216 7.473 334.380 121.363 4.251 0.849 4.7788 10.554 1.076 1.110 Feb. 7.630 7.454 25.051 7.471 337.171 120.026 4.277 0.841 4.7837 10.568 1.065 1.091 Mar. 7.768 7.571 26.575 7.470 345.682 118.897 4.441 0.895 4.8282 10.875 1.059 1.106 Apr. 7.686 7.593 27.262 7.462 356.688 116.970 4.544 0.875 4.8371 10.884 1.054 1.086 May 7.748 7.575 27.269 7.458 350.762 116.867 4.525 0.887 4.8371 10.597 1.057 1.090
Percentage change versus previous month
2020 May 0.8 -0.2 0.0 -0.1 -1.7 -0.1 -0.4 1.3 0.0 -2.6 0.3 0.4Percentage change versus previous year
2020 May 1.0 2.1 5.8 -0.1 7.9 -4.9 5.3 1.7 1.6 -1.3 -6.5 -2.5
Source: ECB.

2 Financial developments
S 7ECB Economic Bulletin, Issue 4 / 2020 - Statistics
2.10 Euro area balance of payments, financial account(EUR billions, unless otherwise indicated; outstanding amounts at end of period; transactions during period)
Outstanding amounts (international investment position)
Total 1) Direct Portfolio Net Other investment Reserve Memo:
investment investment financial assets Grossderivatives external
Assets Liabilities Net Assets Liabilities Assets Liabilities Assets Liabilities debt
1 2 3 4 5 6 7 8 9 10 11 12
2019 Q1 26,555.6 26,818.9 -263.3 11,090.1 9,070.3 9,137.7 11,200.9 -92.3 5,679.0 6,547.8 741.1 14,639.8 Q2 26,701.6 27,003.5 -301.9 10,941.0 9,050.9 9,242.1 11,374.0 -75.5 5,823.2 6,578.6 770.8 14,760.0 Q3 27,793.7 27,946.5 -152.8 11,333.5 9,364.6 9,630.7 11,849.2 -91.0 6,093.5 6,732.7 827.0 15,112.7 Q4 27,555.9 27,618.4 -62.6 11,207.0 9,322.3 9,905.8 11,943.5 -48.5 5,678.0 6,352.7 813.6 14,517.2
Outstanding amounts as a percentage of GDP
2019 Q4 231.4 232.0 -0.5 94.1 78.3 83.2 100.3 -0.4 47.7 53.4 6.8 121.9
Transactions
2019 Q2 187.0 189.1 -2.1 -86.4 4.4 52.1 103.8 32.8 185.8 81.0 2.8 - Q3 491.5 386.1 105.4 178.4 151.8 151.3 192.6 4.2 157.4 41.7 0.1 - Q4 -282.7 -365.5 82.8 -74.8 -46.1 140.1 9.7 -5.4 -340.0 -329.1 -2.5 -
2020 Q1 551.2 489.6 61.6 62.0 -8.0 -102.3 28.2 12.5 575.5 469.5 3.4 -
2019 Oct. 60.6 13.3 47.2 5.9 -36.0 55.3 21.6 6.4 -7.9 27.8 0.9 - Nov. 47.4 21.0 26.3 21.8 52.6 55.6 15.3 0.3 -26.4 -46.9 -3.9 - Dec. -390.6 -399.8 9.2 -102.4 -62.7 29.2 -27.2 -12.1 -305.7 -309.9 0.5 -
2020 Jan. 400.3 395.2 5.1 21.1 4.2 86.7 121.7 8.0 283.5 269.3 1.0 - Feb. 162.6 118.4 44.2 32.7 9.7 30.0 27.3 13.0 88.0 81.4 -1.1 - Mar. -11.7 -23.9 12.3 8.2 -21.9 -219.0 -120.8 -8.5 204.0 118.8 3.6 -
12-month cumulated transactions
2020 Mar. 947.1 699.3 247.7 79.2 102.0 241.2 334.2 44.1 578.7 263.1 3.9 -
12-month cumulated transactions as a percentage of GDP
2020 Mar. 8.0 5.9 2.1 0.7 0.9 2.0 2.8 0.4 4.9 2.2 0.0 -
Source: ECB.1) Net financial derivatives are included in total assets.

3 Economic activity
S 8ECB Economic Bulletin, Issue 4 / 2020 - Statistics
3.1 GDP and expenditure components(quarterly data seasonally adjusted; annual data unadjusted)
Current prices (EUR billions)
GDP
Total Domestic demand External balance 1)
Total Private Government Gross fixed capital formation Changes in Total Exports 1) Imports 1)
consumption consumption inventories 2)
Total Total Intellectualconstruction machinery property
products
1 2 3 4 5 6 7 8 9 10 11 12
2017 11,200.9 10,709.5 6,036.4 2,296.9 2,306.0 1,102.1 708.5 488.9 70.2 491.4 5,295.9 4,804.52018 11,561.5 11,062.7 6,207.6 2,363.3 2,408.1 1,175.6 743.8 481.8 83.7 498.8 5,547.7 5,048.92019 11,906.7 11,434.6 6,362.1 2,444.8 2,605.5 1,253.5 767.6 577.1 22.1 472.1 5,719.3 5,247.2
2019 Q1 2,950.9 2,819.8 1,575.6 603.3 628.2 310.5 190.7 125.2 12.6 131.1 1,422.8 1,291.7 Q2 2,967.9 2,866.8 1,589.4 609.0 658.0 307.0 189.9 159.3 10.4 101.1 1,426.7 1,325.6 Q3 2,987.2 2,851.8 1,596.7 613.8 641.9 315.1 192.5 132.4 -0.5 135.3 1,434.8 1,299.5 Q4 3,006.3 2,895.5 1,602.7 618.7 673.2 318.7 194.0 158.7 0.9 110.8 1,442.1 1,331.3
as a percentage of GDP
2019 100.0 96.0 53.4 20.5 21.9 10.5 6.4 4.8 0.2 4.0 - -
Chain-linked volumes (prices for the previous year)
quarter-on-quarter percentage changes
2019 Q2 0.1 1.4 0.2 0.4 5.0 -1.0 0.0 27.2 - - 0.0 2.7 Q3 0.3 -0.6 0.5 0.6 -3.8 1.2 0.0 -18.0 - - 0.6 -1.4 Q4 0.1 1.0 0.1 0.4 4.4 0.2 0.1 20.7 - - 0.3 2.2
2020 Q1 -3.8 . . . . . . . - - . .
annual percentage changes
2017 2.5 2.2 1.7 1.3 3.4 3.6 4.1 2.3 - - 5.5 5.02018 1.9 1.6 1.4 1.1 2.3 3.3 4.3 -2.7 - - 3.3 2.82019 1.2 1.8 1.3 1.7 5.7 3.2 1.8 18.1 - - 2.5 3.8
2019 Q2 1.2 2.5 1.2 1.4 8.2 2.1 1.9 33.2 - - 2.3 5.1 Q3 1.3 1.2 1.5 2.0 3.1 3.0 0.7 7.1 - - 2.7 2.6 Q4 1.0 1.8 1.2 1.8 6.4 2.0 0.8 25.5 - - 1.9 3.8
2020 Q1 -3.2 . . . . . . . - - . .
contributions to quarter-on-quarter percentage changes in GDP; percentage points
2019 Q2 0.1 1.3 0.1 0.1 1.1 -0.1 0.0 1.2 0.1 -1.1 - - Q3 0.3 -0.6 0.3 0.1 -0.8 0.1 0.0 -1.0 -0.2 0.9 - - Q4 0.1 0.9 0.1 0.1 0.9 0.0 0.0 0.9 -0.1 -0.8 - -
2020 Q1 -3.8 . . . . . . . . . - -
contributions to annual percentage changes in GDP; percentage points
2017 2.5 2.1 0.9 0.3 0.7 0.3 0.3 0.1 0.2 0.4 - - 2018 1.9 1.5 0.8 0.2 0.5 0.3 0.3 -0.1 0.0 0.4 - - 2019 1.2 1.7 0.7 0.3 1.2 0.3 0.1 0.7 -0.5 -0.5 - -
2019 Q2 1.2 2.3 0.6 0.3 1.7 0.2 0.1 1.4 -0.3 -1.2 - - Q3 1.3 1.1 0.8 0.4 0.6 0.3 0.0 0.3 -0.7 0.2 - - Q4 1.0 1.8 0.6 0.4 1.3 0.2 0.0 1.1 -0.6 -0.7 - -
2020 Q1 -3.2 . . . . . . . . . - -
Sources: Eurostat and ECB calculations.1) Exports and imports cover goods and services and include cross-border intra-euro area trade.2) Including acquisitions less disposals of valuables.
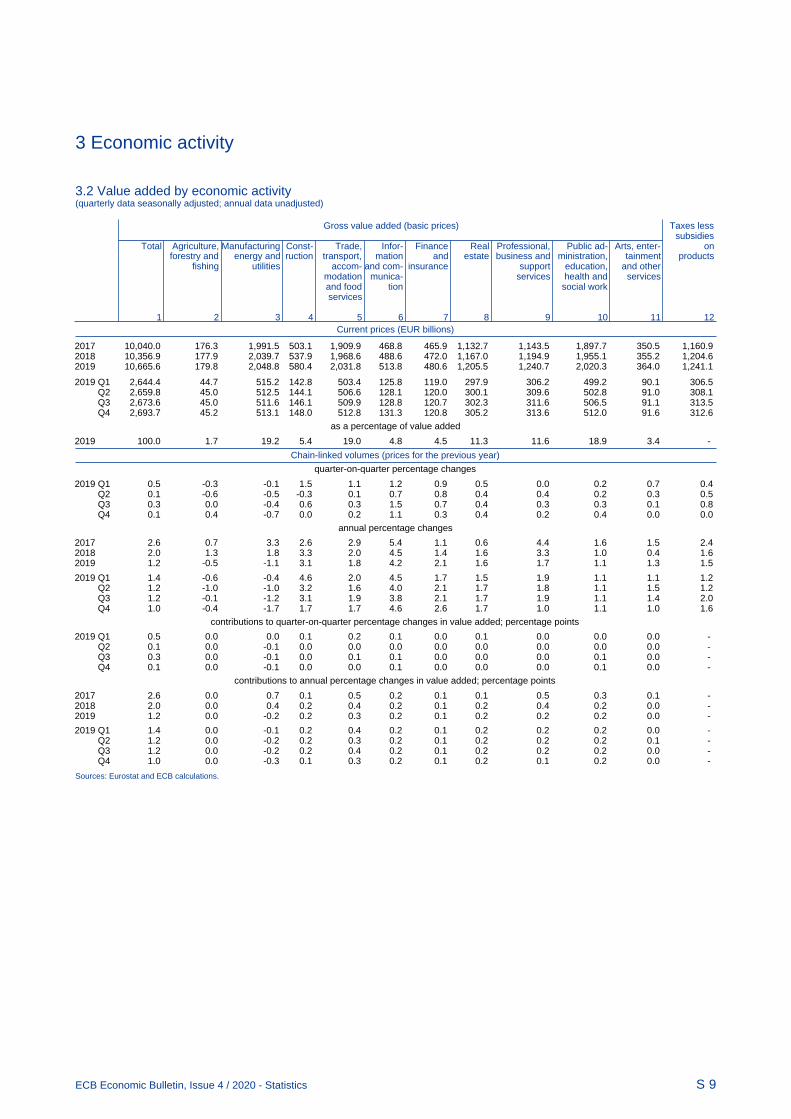
3 Economic activity
S 9ECB Economic Bulletin, Issue 4 / 2020 - Statistics
3.2 Value added by economic activity(quarterly data seasonally adjusted; annual data unadjusted)
Current prices (EUR billions)
Gross value added (basic prices) Taxes less
subsidiesTotal Agriculture, Manufacturing Const- Trade, Infor- Finance Real Professional, Public ad- Arts, enter- on
forestry and energy and ruction transport, mation and estate business and ministration, tainment productsfishing utilities accom- and com- insurance support education, and other
modation munica- services health and servicesand food tion social workservices
1 2 3 4 5 6 7 8 9 10 11 12
2017 10,040.0 176.3 1,991.5 503.1 1,909.9 468.8 465.9 1,132.7 1,143.5 1,897.7 350.5 1,160.92018 10,356.9 177.9 2,039.7 537.9 1,968.6 488.6 472.0 1,167.0 1,194.9 1,955.1 355.2 1,204.62019 10,665.6 179.8 2,048.8 580.4 2,031.8 513.8 480.6 1,205.5 1,240.7 2,020.3 364.0 1,241.1
2019 Q1 2,644.4 44.7 515.2 142.8 503.4 125.8 119.0 297.9 306.2 499.2 90.1 306.5 Q2 2,659.8 45.0 512.5 144.1 506.6 128.1 120.0 300.1 309.6 502.8 91.0 308.1 Q3 2,673.6 45.0 511.6 146.1 509.9 128.8 120.7 302.3 311.6 506.5 91.1 313.5 Q4 2,693.7 45.2 513.1 148.0 512.8 131.3 120.8 305.2 313.6 512.0 91.6 312.6
as a percentage of value added
2019 100.0 1.7 19.2 5.4 19.0 4.8 4.5 11.3 11.6 18.9 3.4 -
Chain-linked volumes (prices for the previous year)
quarter-on-quarter percentage changes
2019 Q1 0.5 -0.3 -0.1 1.5 1.1 1.2 0.9 0.5 0.0 0.2 0.7 0.4 Q2 0.1 -0.6 -0.5 -0.3 0.1 0.7 0.8 0.4 0.4 0.2 0.3 0.5 Q3 0.3 0.0 -0.4 0.6 0.3 1.5 0.7 0.4 0.3 0.3 0.1 0.8 Q4 0.1 0.4 -0.7 0.0 0.2 1.1 0.3 0.4 0.2 0.4 0.0 0.0
annual percentage changes
2017 2.6 0.7 3.3 2.6 2.9 5.4 1.1 0.6 4.4 1.6 1.5 2.42018 2.0 1.3 1.8 3.3 2.0 4.5 1.4 1.6 3.3 1.0 0.4 1.62019 1.2 -0.5 -1.1 3.1 1.8 4.2 2.1 1.6 1.7 1.1 1.3 1.5
2019 Q1 1.4 -0.6 -0.4 4.6 2.0 4.5 1.7 1.5 1.9 1.1 1.1 1.2 Q2 1.2 -1.0 -1.0 3.2 1.6 4.0 2.1 1.7 1.8 1.1 1.5 1.2 Q3 1.2 -0.1 -1.2 3.1 1.9 3.8 2.1 1.7 1.9 1.1 1.4 2.0 Q4 1.0 -0.4 -1.7 1.7 1.7 4.6 2.6 1.7 1.0 1.1 1.0 1.6
contributions to quarter-on-quarter percentage changes in value added; percentage points
2019 Q1 0.5 0.0 0.0 0.1 0.2 0.1 0.0 0.1 0.0 0.0 0.0 - Q2 0.1 0.0 -0.1 0.0 0.0 0.0 0.0 0.0 0.0 0.0 0.0 - Q3 0.3 0.0 -0.1 0.0 0.1 0.1 0.0 0.0 0.0 0.1 0.0 - Q4 0.1 0.0 -0.1 0.0 0.0 0.1 0.0 0.0 0.0 0.1 0.0 -
contributions to annual percentage changes in value added; percentage points
2017 2.6 0.0 0.7 0.1 0.5 0.2 0.1 0.1 0.5 0.3 0.1 - 2018 2.0 0.0 0.4 0.2 0.4 0.2 0.1 0.2 0.4 0.2 0.0 - 2019 1.2 0.0 -0.2 0.2 0.3 0.2 0.1 0.2 0.2 0.2 0.0 -
2019 Q1 1.4 0.0 -0.1 0.2 0.4 0.2 0.1 0.2 0.2 0.2 0.0 - Q2 1.2 0.0 -0.2 0.2 0.3 0.2 0.1 0.2 0.2 0.2 0.1 - Q3 1.2 0.0 -0.2 0.2 0.4 0.2 0.1 0.2 0.2 0.2 0.0 - Q4 1.0 0.0 -0.3 0.1 0.3 0.2 0.1 0.2 0.1 0.2 0.0 -
Sources: Eurostat and ECB calculations.

3 Economic activity
S 10ECB Economic Bulletin, Issue 4 / 2020 - Statistics
3.3 Employment 1)
(quarterly data seasonally adjusted; annual data unadjusted)
Persons employed
Total By employment By economic activity
status
Employ- Self- Agricul- Manufac- Con- Trade, Infor- Finance Real Professional, Public adminis- Arts,ees employed ture, turing, struc- transport, mation and estate business and tration, edu- entertainment
forestry energy tion accom- and insur- support cation, health and otherand and modation com- ance services and services
fishing utilities and food munica- social workservices tion
1 2 3 4 5 6 7 8 9 10 11 12 13
as a percentage of total persons employed
2017 100.0 85.6 14.4 3.2 14.6 6.0 24.9 2.8 2.5 1.0 13.8 24.3 6.92018 100.0 85.8 14.2 3.1 14.6 6.0 24.9 2.9 2.4 1.0 14.0 24.2 6.82019 100.0 86.0 14.0 3.0 14.6 6.1 24.9 2.9 2.4 1.0 14.0 24.3 6.8
annual percentage changes
2017 1.6 2.0 -0.7 -0.5 1.1 1.4 1.8 3.4 -1.5 1.8 3.7 1.1 1.02018 1.5 1.8 -0.2 -0.4 1.5 2.4 1.4 3.5 -0.9 1.8 2.8 1.3 0.42019 1.2 1.5 -0.2 -1.7 0.8 2.4 1.2 3.7 -0.3 1.3 1.4 1.4 0.7
2019 Q2 1.2 1.5 -0.1 -2.9 1.0 2.6 1.3 4.2 -0.6 1.7 1.2 1.5 0.7 Q3 1.1 1.4 -0.4 -1.9 0.7 2.2 1.0 3.6 -0.2 0.8 1.2 1.5 0.9 Q4 1.1 1.4 -0.5 -1.6 0.4 1.6 1.2 3.0 0.2 0.1 1.2 1.4 1.0
2020 Q1 0.5 . . . . . . . . . . . .
Hours worked
as a percentage of total hours worked
2017 100.0 80.7 19.3 4.3 15.1 6.7 25.8 3.0 2.5 1.0 13.6 21.8 6.22018 100.0 81.0 19.0 4.2 15.0 6.8 25.7 3.0 2.5 1.0 13.8 21.8 6.12019 100.0 81.3 18.7 4.1 14.9 6.8 25.7 3.1 2.4 1.0 13.8 21.9 6.1
annual percentage changes
2017 1.2 1.7 -1.1 -1.1 0.8 1.3 1.3 3.2 -2.0 1.5 3.5 0.5 0.42018 1.4 1.9 -0.3 0.4 1.3 2.7 1.1 3.2 -1.1 2.4 2.8 1.3 0.42019 1.1 1.4 -0.5 -1.4 0.5 2.2 1.0 2.7 -0.1 1.3 1.2 1.8 0.6
2019 Q1 1.7 2.0 0.4 0.3 1.3 4.0 1.6 3.4 0.0 1.7 1.8 1.9 0.5 Q2 0.9 1.3 -0.7 -3.0 0.4 2.6 0.8 2.8 -0.4 0.8 1.1 1.7 0.3 Q3 0.8 1.2 -0.9 -2.0 0.3 1.6 0.5 2.5 0.0 1.5 0.8 1.8 0.5 Q4 0.8 1.1 -0.7 -1.1 -0.2 0.5 0.8 2.0 0.0 0.8 0.8 1.6 1.0
Hours worked per person employed
annual percentage changes
2017 -0.4 -0.3 -0.4 -0.6 -0.3 -0.1 -0.5 -0.1 -0.5 -0.3 -0.2 -0.6 -0.52018 -0.1 0.1 -0.1 0.8 -0.2 0.3 -0.3 -0.3 -0.2 0.7 0.0 0.0 0.02019 -0.1 0.0 -0.3 0.3 -0.4 -0.2 -0.3 -1.0 0.2 0.0 -0.2 0.3 -0.1
2019 Q1 0.3 0.4 0.1 0.7 0.0 0.7 0.3 -0.7 0.4 -0.8 0.0 0.5 0.3 Q2 -0.3 -0.1 -0.6 -0.1 -0.6 0.0 -0.5 -1.4 0.2 -0.9 -0.1 0.2 -0.4 Q3 -0.3 -0.1 -0.5 -0.1 -0.4 -0.6 -0.5 -1.2 0.3 0.7 -0.5 0.3 -0.4 Q4 -0.3 -0.2 -0.2 0.5 -0.6 -1.0 -0.4 -1.0 -0.2 0.7 -0.3 0.2 -0.1
Sources: Eurostat and ECB calculations.1) Data for employment are based on the ESA 2010.

3 Economic activity
S 11ECB Economic Bulletin, Issue 4 / 2020 - Statistics
3.4 Labour force, unemployment and job vacancies(seasonally adjusted, unless otherwise indicated)
Labour Under- Unemployment 1) Job
force, employ- vacancymillions ment, Total Long-term By age By gender rate 3)
% of unemploy- labour Millions % of ment, Adult Youth Male Female
force labour % offorce labour Millions % of Millions % of Millions % of Millions % of % of total
force 2) labour labour labour labour postsforce force force force
1 2 3 4 5 6 7 8 9 10 11 12 13 14
% of total 100.0 81.8 18.3 52.2 47.8 in 2016
2017 161.860 4.1 14.585 9.0 4.4 11.946 8.1 2.640 18.6 7.556 8.7 7.029 9.4 1.92018 162.485 3.7 13.211 8.1 3.8 10.823 7.3 2.388 16.8 6.809 7.8 6.402 8.5 2.12019 163.297 3.5 12.268 7.5 3.3 10.030 6.7 2.238 15.6 6.291 7.2 5.977 7.9 2.3
2019 Q2 163.084 3.5 12.237 7.5 3.3 10.031 6.7 2.205 15.4 6.289 7.2 5.947 7.9 2.3 Q3 163.196 3.4 12.183 7.5 3.2 9.958 6.7 2.224 15.5 6.290 7.2 5.893 7.8 2.2 Q4 163.998 3.4 12.031 7.3 3.2 9.821 6.6 2.210 15.4 6.146 7.0 5.885 7.7 2.2
2020 Q1 . . 11.858 7.2 . 9.672 6.4 2.186 15.3 6.061 6.9 5.797 7.6 2.0
2019 Nov. - - 12.136 7.4 - 9.906 6.6 2.230 15.5 6.240 7.1 5.896 7.7 - Dec. - - 12.093 7.3 - 9.875 6.6 2.218 15.4 6.254 7.1 5.838 7.6 -
2020 Jan. - - 12.075 7.3 - 9.848 6.5 2.227 15.5 6.186 7.0 5.889 7.7 - Feb. - - 11.791 7.2 - 9.611 6.4 2.180 15.2 6.030 6.8 5.761 7.6 - Mar. - - 11.708 7.1 - 9.557 6.4 2.150 15.1 5.967 6.8 5.740 7.6 - Apr. - - 11.919 7.3 - 9.680 6.5 2.239 15.8 6.134 7.0 5.785 7.6 -
Sources: Eurostat and ECB calculations.1) Where annual and quarterly Labour Force Survey data have not yet been published, annual and quarterly data are derived as simple averages of the monthly data.2) Not seasonally adjusted.3) The job vacancy rate is equal to the number of job vacancies divided by the sum of the number of occupied posts and the number of job vacancies, expressed as a percentage.
3.5 Short-term business statistics
Industrial production Con- ECB indicator Retail sales New
struction on industrial passenger Total Main Industrial Groupings produc- new orders Total Food, Non-food Fuel car regis-
(excluding construction) tion beverages, trationstobacco
Manu- Inter- Capital Consumer Energyfacturing mediate goods goods
goods
1 2 3 4 5 6 7 8 9 10 11 12 13
% of total 100.0 88.7 32.1 34.5 21.8 11.6 100.0 100.0 100.0 40.4 52.5 7.1 100.0in 2015
annual percentage changes
2017 3.0 3.2 3.4 3.9 1.4 1.2 3.1 7.9 2.5 1.6 3.5 0.8 5.72018 0.7 1.0 0.6 1.1 1.4 -1.5 2.0 2.7 1.6 1.4 1.9 0.6 0.92019 -1.3 -1.3 -2.4 -1.9 1.4 -1.9 2.1 -4.3 2.3 0.8 3.6 0.8 1.8
2019 Q2 -1.3 -1.5 -2.3 -2.9 1.9 -0.2 2.3 -3.5 2.1 1.1 3.0 0.1 -0.7 Q3 -1.6 -1.6 -3.2 -1.2 0.3 -1.9 1.2 -4.7 2.7 0.8 4.3 1.3 0.6 Q4 -2.1 -2.1 -3.8 -2.9 2.0 -2.4 0.3 -5.8 2.0 0.5 3.5 -0.6 12.5
2020 Q1 -6.0 -5.9 -5.1 -9.9 -1.0 -5.7 -3.4 -5.6 -1.7 4.5 -5.7 -8.1 -27.3
2019 Nov. -1.3 -1.4 -2.9 -1.2 1.0 -1.5 1.3 -7.9 2.4 1.6 3.7 -1.4 10.0 Dec. -3.4 -3.6 -5.5 -4.9 1.8 -3.2 -2.3 -4.6 1.8 -0.4 3.9 -1.1 17.9
2020 Jan. -2.2 -1.4 -2.0 -2.0 0.5 -7.3 7.1 -1.4 2.3 1.0 3.2 -0.1 -5.8 Feb. -2.2 -2.0 -0.8 -4.3 0.7 -2.9 0.2 -1.4 2.5 3.7 2.2 -2.0 -6.3 Mar. -12.9 -13.5 -11.8 -21.5 -3.9 -6.7 -15.4 -13.9 -9.2 8.3 -21.7 -21.3 -60.3 Apr. . . . . . . . . . . . . -79.6
month-on-month percentage changes (s.a.)
2019 Nov. -0.5 -0.7 -0.5 0.2 -1.4 0.8 0.7 -0.4 0.9 0.5 1.3 -1.2 2.7 Dec. -1.6 -1.5 -1.5 -3.2 -0.4 -1.5 -1.5 -0.6 -1.0 -0.9 -1.1 -0.3 7.6
2020 Jan. 1.9 2.1 2.9 2.4 0.5 -1.0 4.0 2.3 0.8 0.8 0.9 2.0 -15.3 Feb. -0.1 0.0 1.0 -2.0 0.5 0.4 -0.5 -1.2 0.6 2.5 -0.4 -1.2 1.1 Mar. -11.3 -12.3 -11.0 -15.9 -4.0 -4.0 -14.1 -12.2 -11.2 5.0 -23.1 -20.8 -57.7 Apr. . . . . . . . . . . . . -44.9
Sources: Eurostat, ECB calculations, ECB experimental statistics (col. 8) and European Automobile Manufacturers Association (col. 13).
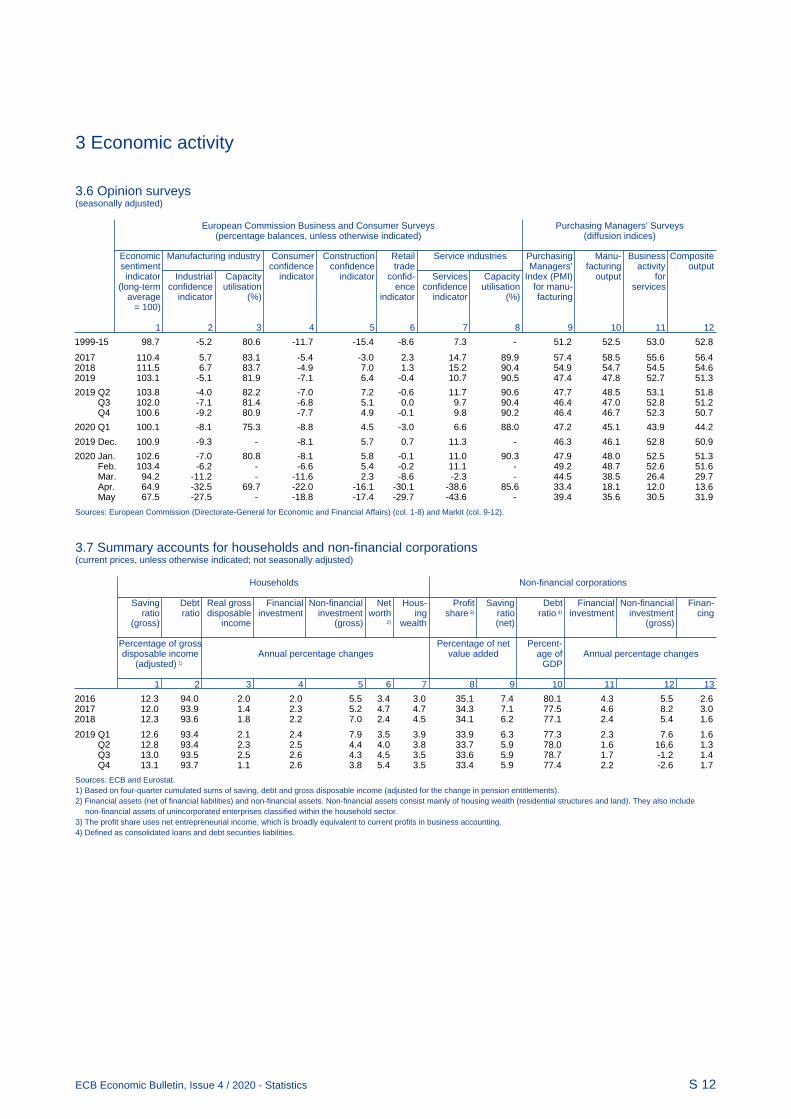
3 Economic activity
S 12ECB Economic Bulletin, Issue 4 / 2020 - Statistics
3.6 Opinion surveys(seasonally adjusted)
European Commission Business and Consumer Surveys Purchasing Managers’ Surveys
(percentage balances, unless otherwise indicated) (diffusion indices)
Economic Manufacturing industry Consumer Construction Retail Service industries Purchasing Manu- Business Compositesentiment confidence confidence trade Managers’ facturing activity outputindicator Industrial Capacity indicator indicator confid- Services Capacity Index (PMI) output for
(long-term confidence utilisation ence confidence utilisation for manu- servicesaverage indicator (%) indicator indicator (%) facturing
= 100)
1 2 3 4 5 6 7 8 9 10 11 12
1999-15 98.7 -5.2 80.6 -11.7 -15.4 -8.6 7.3 - 51.2 52.5 53.0 52.8
2017 110.4 5.7 83.1 -5.4 -3.0 2.3 14.7 89.9 57.4 58.5 55.6 56.42018 111.5 6.7 83.7 -4.9 7.0 1.3 15.2 90.4 54.9 54.7 54.5 54.62019 103.1 -5.1 81.9 -7.1 6.4 -0.4 10.7 90.5 47.4 47.8 52.7 51.3
2019 Q2 103.8 -4.0 82.2 -7.0 7.2 -0.6 11.7 90.6 47.7 48.5 53.1 51.8 Q3 102.0 -7.1 81.4 -6.8 5.1 0.0 9.7 90.4 46.4 47.0 52.8 51.2 Q4 100.6 -9.2 80.9 -7.7 4.9 -0.1 9.8 90.2 46.4 46.7 52.3 50.7
2020 Q1 100.1 -8.1 75.3 -8.8 4.5 -3.0 6.6 88.0 47.2 45.1 43.9 44.2
2019 Dec. 100.9 -9.3 - -8.1 5.7 0.7 11.3 - 46.3 46.1 52.8 50.9
2020 Jan. 102.6 -7.0 80.8 -8.1 5.8 -0.1 11.0 90.3 47.9 48.0 52.5 51.3 Feb. 103.4 -6.2 - -6.6 5.4 -0.2 11.1 - 49.2 48.7 52.6 51.6 Mar. 94.2 -11.2 - -11.6 2.3 -8.6 -2.3 - 44.5 38.5 26.4 29.7 Apr. 64.9 -32.5 69.7 -22.0 -16.1 -30.1 -38.6 85.6 33.4 18.1 12.0 13.6 May 67.5 -27.5 - -18.8 -17.4 -29.7 -43.6 - 39.4 35.6 30.5 31.9
Sources: European Commission (Directorate-General for Economic and Financial Affairs) (col. 1-8) and Markit (col. 9-12).
3.7 Summary accounts for households and non-financial corporations(current prices, unless otherwise indicated; not seasonally adjusted)
Households Non-financial corporations
Saving Debt Real gross Financial Non-financial Net Hous- Profit Saving Debt Financial Non-financial Finan-ratio ratio disposable investment investment worth ing share 3) ratio ratio 4) investment investment cing
(gross) income (gross) 2) wealth (net) (gross)
Percentage of gross Percentage of net Percent- disposable income Annual percentage changes value added age of Annual percentage changes
(adjusted) 1) GDP
1 2 3 4 5 6 7 8 9 10 11 12 13
2016 12.3 94.0 2.0 2.0 5.5 3.4 3.0 35.1 7.4 80.1 4.3 5.5 2.62017 12.0 93.9 1.4 2.3 5.2 4.7 4.7 34.3 7.1 77.5 4.6 8.2 3.02018 12.3 93.6 1.8 2.2 7.0 2.4 4.5 34.1 6.2 77.1 2.4 5.4 1.6
2019 Q1 12.6 93.4 2.1 2.4 7.9 3.5 3.9 33.9 6.3 77.3 2.3 7.6 1.6 Q2 12.8 93.4 2.3 2.5 4.4 4.0 3.8 33.7 5.9 78.0 1.6 16.6 1.3 Q3 13.0 93.5 2.5 2.6 4.3 4.5 3.5 33.6 5.9 78.7 1.7 -1.2 1.4 Q4 13.1 93.7 1.1 2.6 3.8 5.4 3.5 33.4 5.9 77.4 2.2 -2.6 1.7
Sources: ECB and Eurostat.1) Based on four-quarter cumulated sums of saving, debt and gross disposable income (adjusted for the change in pension entitlements).2) Financial assets (net of financial liabilities) and non-financial assets. Non-financial assets consist mainly of housing wealth (residential structures and land). They also include
non-financial assets of unincorporated enterprises classified within the household sector.3) The profit share uses net entrepreneurial income, which is broadly equivalent to current profits in business accounting. 4) Defined as consolidated loans and debt securities liabilities.
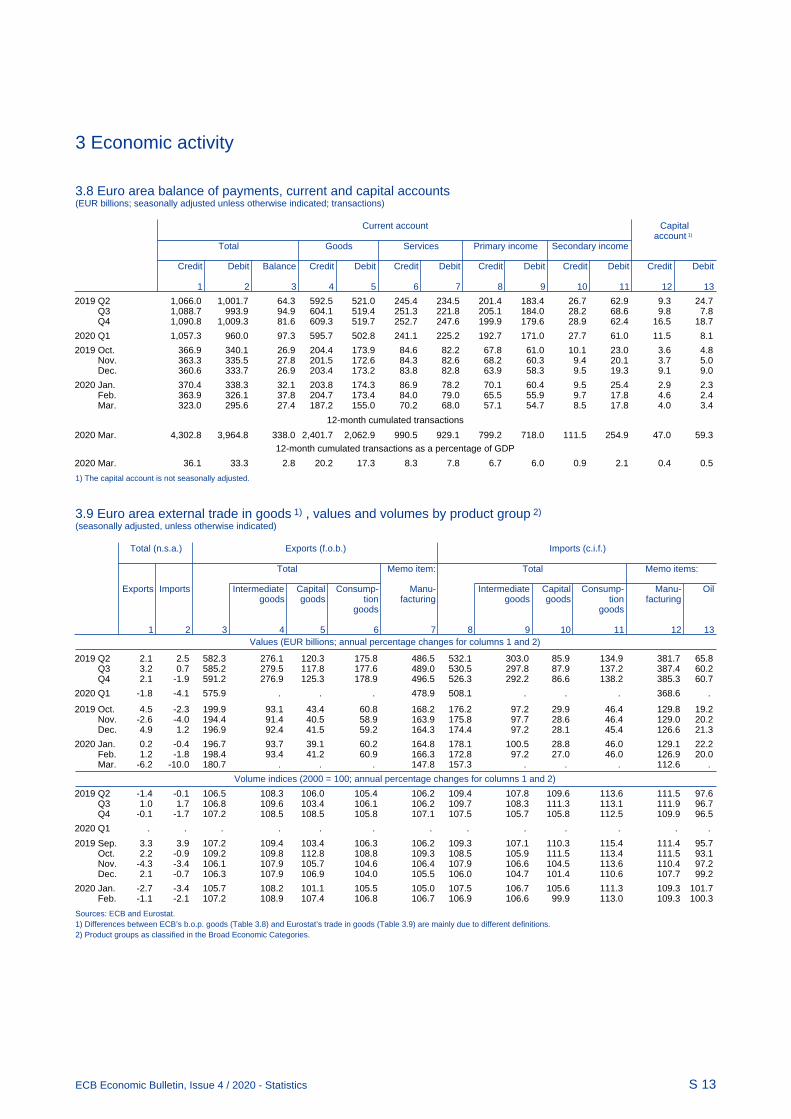
3 Economic activity
S 13ECB Economic Bulletin, Issue 4 / 2020 - Statistics
3.8 Euro area balance of payments, current and capital accounts(EUR billions; seasonally adjusted unless otherwise indicated; transactions)
Current account Capital
account 1) Total Goods Services Primary income Secondary income
Credit Debit Balance Credit Debit Credit Debit Credit Debit Credit Debit Credit Debit
1 2 3 4 5 6 7 8 9 10 11 12 13
2019 Q2 1,066.0 1,001.7 64.3 592.5 521.0 245.4 234.5 201.4 183.4 26.7 62.9 9.3 24.7 Q3 1,088.7 993.9 94.9 604.1 519.4 251.3 221.8 205.1 184.0 28.2 68.6 9.8 7.8 Q4 1,090.8 1,009.3 81.6 609.3 519.7 252.7 247.6 199.9 179.6 28.9 62.4 16.5 18.7
2020 Q1 1,057.3 960.0 97.3 595.7 502.8 241.1 225.2 192.7 171.0 27.7 61.0 11.5 8.1
2019 Oct. 366.9 340.1 26.9 204.4 173.9 84.6 82.2 67.8 61.0 10.1 23.0 3.6 4.8 Nov. 363.3 335.5 27.8 201.5 172.6 84.3 82.6 68.2 60.3 9.4 20.1 3.7 5.0 Dec. 360.6 333.7 26.9 203.4 173.2 83.8 82.8 63.9 58.3 9.5 19.3 9.1 9.0
2020 Jan. 370.4 338.3 32.1 203.8 174.3 86.9 78.2 70.1 60.4 9.5 25.4 2.9 2.3 Feb. 363.9 326.1 37.8 204.7 173.4 84.0 79.0 65.5 55.9 9.7 17.8 4.6 2.4 Mar. 323.0 295.6 27.4 187.2 155.0 70.2 68.0 57.1 54.7 8.5 17.8 4.0 3.4
12-month cumulated transactions
2020 Mar. 4,302.8 3,964.8 338.0 2,401.7 2,062.9 990.5 929.1 799.2 718.0 111.5 254.9 47.0 59.3
12-month cumulated transactions as a percentage of GDP
2020 Mar. 36.1 33.3 2.8 20.2 17.3 8.3 7.8 6.7 6.0 0.9 2.1 0.4 0.5
1) The capital account is not seasonally adjusted.
3.9 Euro area external trade in goods 1) , values and volumes by product group 2) (seasonally adjusted, unless otherwise indicated)
Values (EUR billions; annual percentage changes for columns 1 and 2)
Total (n.s.a.) Exports (f.o.b.) Imports (c.i.f.)
Total Memo item: Total Memo items:
Exports Imports Intermediate Capital Consump- Manu- Intermediate Capital Consump- Manu- Oilgoods goods tion facturing goods goods tion facturing
goods goods
1 2 3 4 5 6 7 8 9 10 11 12 13
2019 Q2 2.1 2.5 582.3 276.1 120.3 175.8 486.5 532.1 303.0 85.9 134.9 381.7 65.8 Q3 3.2 0.7 585.2 279.5 117.8 177.6 489.0 530.5 297.8 87.9 137.2 387.4 60.2 Q4 2.1 -1.9 591.2 276.9 125.3 178.9 496.5 526.3 292.2 86.6 138.2 385.3 60.7
2020 Q1 -1.8 -4.1 575.9 . . . 478.9 508.1 . . . 368.6 .
2019 Oct. 4.5 -2.3 199.9 93.1 43.4 60.8 168.2 176.2 97.2 29.9 46.4 129.8 19.2 Nov. -2.6 -4.0 194.4 91.4 40.5 58.9 163.9 175.8 97.7 28.6 46.4 129.0 20.2 Dec. 4.9 1.2 196.9 92.4 41.5 59.2 164.3 174.4 97.2 28.1 45.4 126.6 21.3
2020 Jan. 0.2 -0.4 196.7 93.7 39.1 60.2 164.8 178.1 100.5 28.8 46.0 129.1 22.2 Feb. 1.2 -1.8 198.4 93.4 41.2 60.9 166.3 172.8 97.2 27.0 46.0 126.9 20.0 Mar. -6.2 -10.0 180.7 . . . 147.8 157.3 . . . 112.6 .
Volume indices (2000 = 100; annual percentage changes for columns 1 and 2)
2019 Q2 -1.4 -0.1 106.5 108.3 106.0 105.4 106.2 109.4 107.8 109.6 113.6 111.5 97.6 Q3 1.0 1.7 106.8 109.6 103.4 106.1 106.2 109.7 108.3 111.3 113.1 111.9 96.7 Q4 -0.1 -1.7 107.2 108.5 108.5 105.8 107.1 107.5 105.7 105.8 112.5 109.9 96.5
2020 Q1 . . . . . . . . . . . . .
2019 Sep. 3.3 3.9 107.2 109.4 103.4 106.3 106.2 109.3 107.1 110.3 115.4 111.4 95.7 Oct. 2.2 -0.9 109.2 109.8 112.8 108.8 109.3 108.5 105.9 111.5 113.4 111.5 93.1 Nov. -4.3 -3.4 106.1 107.9 105.7 104.6 106.4 107.9 106.6 104.5 113.6 110.4 97.2 Dec. 2.1 -0.7 106.3 107.9 106.9 104.0 105.5 106.0 104.7 101.4 110.6 107.7 99.2
2020 Jan. -2.7 -3.4 105.7 108.2 101.1 105.5 105.0 107.5 106.7 105.6 111.3 109.3 101.7 Feb. -1.1 -2.1 107.2 108.9 107.4 106.8 106.7 106.9 106.6 99.9 113.0 109.3 100.3
Sources: ECB and Eurostat.1) Differences between ECB’s b.o.p. goods (Table 3.8) and Eurostat’s trade in goods (Table 3.9) are mainly due to different definitions.2) Product groups as classified in the Broad Economic Categories.

4 Prices and costs
S 14ECB Economic Bulletin, Issue 4 / 2020 - Statistics
4.1 Harmonised Index of Consumer Prices 1)
(annual percentage changes, unless otherwise indicated)
Total Total (s.a.; percentage change vis-à-vis previous period) 2)
Administered pricesIndex: Total Goods Services Total Processed Unpro- Non-energy Energy Services2015 food cessed industrial (n.s.a.) Total HICP Admini-
= 100 Total food goods excluding steredexcluding administered pricesfood and prices
energy
1 2 3 4 5 6 7 8 9 10 11 12 13
% of total 100.0 100.0 70.9 55.5 44.5 100.0 14.5 4.5 26.4 10.1 44.5 87.0 13.0in 2019
2017 101.8 1.5 1.0 1.6 1.4 - - - - - - 1.6 1.02018 103.6 1.8 1.0 2.0 1.5 - - - - - - 1.7 2.12019 104.8 1.2 1.0 1.0 1.5 - - - - - - 1.1 1.9
2019 Q2 105.3 1.4 1.1 1.3 1.5 0.5 0.5 -0.1 0.1 1.6 0.7 1.3 2.4 Q3 105.1 1.0 0.9 0.7 1.3 0.2 0.5 1.3 0.1 -1.5 0.3 0.9 1.6 Q4 105.3 1.0 1.2 0.4 1.7 0.3 0.4 0.3 0.1 0.2 0.4 1.0 1.2
2020 Q1 104.7 1.1 1.1 0.8 1.5 0.1 0.7 1.3 0.2 -1.3 0.1 1.2 0.8
2019 Dec. 105.4 1.3 1.3 1.0 1.8 0.1 0.1 0.4 0.1 0.1 0.1 1.3 1.3
2020 Jan. 104.4 1.4 1.1 1.2 1.5 0.1 0.3 0.3 0.0 0.8 -0.1 1.5 0.8 Feb. 104.6 1.2 1.2 0.9 1.6 0.0 0.2 1.0 0.1 -1.6 0.2 1.3 0.8 Mar. 105.1 0.7 1.0 0.3 1.3 -0.3 0.3 0.0 0.0 -3.3 0.0 0.8 0.7 Apr. 105.4 0.3 0.9 -0.4 1.2 -0.2 0.3 3.8 -0.2 -4.8 0.3 0.3 0.6 May 3) 105.3 0.1 0.9 . 1.3 -0.2 0.2 -0.6 0.0 -1.7 0.0 . .
Goods Services
Food (including alcoholic Industrial goods Housing Transport Communi- Recreation Miscel- beverages and tobacco) cation and laneous
personalTotal Processed Unpro- Total Non-energy Energy Rents care
food cessed industrialfood goods
14 15 16 17 18 19 20 21 22 23 24 25
% of total 19.0 14.5 4.5 36.5 26.4 10.1 11.0 6.5 7.2 2.6 15.3 8.4in 2019
2017 1.8 1.5 2.4 1.5 0.3 4.9 1.3 1.2 2.1 -1.1 2.1 0.82018 2.2 2.1 2.3 1.9 0.3 6.4 1.2 1.2 1.5 -0.1 2.0 1.42019 1.8 1.9 1.4 0.5 0.3 1.1 1.4 1.3 2.0 -0.7 1.7 1.5
2019 Q2 1.5 1.8 0.6 1.2 0.3 3.6 1.3 1.3 2.1 -1.2 2.0 1.5 Q3 1.8 1.9 1.6 0.0 0.3 -0.7 1.5 1.5 2.2 -0.8 1.1 1.5 Q4 1.8 1.9 1.6 -0.3 0.4 -2.1 1.5 1.5 2.4 -0.2 2.0 1.5
2020 Q1 2.2 2.0 2.8 0.0 0.5 -1.0 1.6 1.4 1.7 0.0 1.6 1.5
2019 Dec. 2.0 2.0 2.1 0.4 0.5 0.2 1.6 1.5 2.5 -0.1 2.1 1.5
2020 Jan. 2.1 2.0 2.3 0.8 0.3 1.9 1.6 1.5 2.0 -0.2 1.5 1.5 Feb. 2.1 2.0 2.6 0.3 0.5 -0.3 1.5 1.4 2.0 0.0 1.8 1.5 Mar. 2.4 2.1 3.6 -0.9 0.5 -4.5 1.5 1.4 1.2 0.1 1.4 1.5 Apr. 3.6 2.3 7.6 -2.4 0.3 -9.7 1.4 1.3 0.7 -0.4 1.3 1.5 May 3) 3.3 2.4 6.5 . 0.2 -12.0 . . . . . .
Sources: Eurostat and ECB calculations.1) Data refer to the changing composition of the euro area.2) In May 2016 the ECB started publishing enhanced seasonally adjusted HICP series for the euro area, following a review of the seasonal adjustment approach as described
in Box 1, Economic Bulletin, Issue 3, ECB, 2016 (https://www.ecb.europa.eu/pub/pdf/ecbu/eb201603.en.pdf).3) Estimate based on provisional national data, as well as on early information on energy prices.

4 Prices and costs
S 15ECB Economic Bulletin, Issue 4 / 2020 - Statistics
4.2 Industry, construction and property prices(annual percentage changes, unless otherwise indicated)
Industrial producer prices excluding construction 1) Con- Residential Experimental
struction property indicator ofTotal Total Industry excluding construction and energy Energy 2) prices 3) commercial
(index: property2015 = 100) Manu- Total Intermediate Capital Consumer goods prices 3)
facturing goods goodsTotal Food, Non-
beverages foodand tobacco
1 2 3 4 5 6 7 8 9 10 11 12 13
% of total 100.0 100.0 77.3 72.1 28.9 20.7 22.5 16.5 5.9 27.9 in 2015
2017 100.8 3.0 3.0 2.1 3.2 0.9 1.9 2.9 0.2 5.6 2.0 4.3 4.72018 104.0 3.2 2.4 1.5 2.6 1.0 0.4 0.2 0.6 8.1 2.5 4.8 4.12019 104.7 0.7 0.6 0.7 0.1 1.5 1.0 1.1 0.8 -0.1 1.9 4.0 4.9
2019 Q2 104.8 1.6 1.0 1.0 0.7 1.5 1.0 0.9 0.9 3.0 2.2 4.2 5.8 Q3 104.2 -0.6 0.0 0.5 -0.4 1.5 1.0 1.2 0.8 -4.3 1.1 3.9 4.7 Q4 104.4 -1.2 0.0 0.4 -1.2 1.4 1.7 2.4 0.7 -5.9 1.7 4.1 4.7
2020 Q1 103.8 -1.5 0.0 0.4 -1.4 1.1 2.3 3.3 0.6 -7.3 . . .
2019 Nov. 104.5 -1.3 -0.2 0.3 -1.4 1.4 1.7 2.3 0.7 -6.0 - - - Dec. 104.5 -0.6 0.9 0.5 -1.1 1.5 2.0 2.9 0.7 -3.8 - - -
2020 Jan. 104.8 -0.6 1.1 0.5 -1.1 1.3 2.2 3.2 0.6 -4.1 - - - Feb. 104.1 -1.3 0.3 0.5 -1.2 1.2 2.3 3.3 0.7 -6.7 - - - Mar. 102.5 -2.8 -1.4 0.2 -1.9 1.0 2.3 3.4 0.6 -11.2 - - - Apr. 100.4 -4.5 -3.1 -0.3 -2.7 1.0 1.7 2.5 0.5 -16.5 - - -
Sources: Eurostat, ECB calculations, and ECB calculations based on MSCI data and national sources (col. 13).1) Domestic sales only.2) Input prices for residential buildings.3) Experimental data based on non-harmonised sources (see https://www.ecb.europa.eu/stats/ecb_statistics/governance_and_quality_framework/html/experimental-data.en.html
for further details).
4.3 Commodity prices and GDP deflators(annual percentage changes, unless otherwise indicated)
GDP deflators Oil prices Non-energy commodity prices (EUR)
(EUR per Total Total Domestic demand Exports 1) Imports 1) barrel) Import-weighted 2) Use-weighted 2) (s.a.;
index: Total Private Govern- Gross Total Food Non-food Total Food Non-food2015 consump- ment fixed
= 100) tion consump- capitaltion formation
1 2 3 4 5 6 7 8 9 10 11 12 13 14 15
% of total 100.0 45.4 54.6 100.0 50.4 49.6
2017 101.8 1.0 1.4 1.3 1.4 1.7 1.9 2.8 48.1 5.8 -3.5 16.6 6.7 -1.6 17.82018 103.1 1.3 1.7 1.4 1.8 2.0 1.4 2.3 60.4 -0.7 -5.8 4.3 -0.1 -5.3 5.72019 104.9 1.7 1.5 1.2 1.7 2.3 0.6 0.1 57.2 1.7 3.8 -0.1 2.6 7.5 -2.3
2019 Q2 104.7 1.7 1.7 1.6 1.8 2.1 1.0 0.9 61.0 -1.8 -0.7 -2.8 -0.1 4.7 -4.9 Q3 105.1 1.7 1.3 1.1 1.7 2.2 0.1 -1.1 55.7 1.8 3.7 0.2 1.7 6.5 -3.1 Q4 105.6 1.8 1.3 1.0 1.6 2.3 0.2 -0.8 56.5 3.9 9.1 -0.6 5.2 13.9 -3.6
2020 Q1 . . . . . . . . 45.9 1.9 7.6 -3.1 1.4 7.5 -4.9
2019 Dec. - - - - - - - - 59.3 6.6 11.6 2.2 7.0 14.7 -1.1
2020 Jan. - - - - - - - - 57.3 7.0 10.9 3.5 6.8 12.6 0.7 Feb. - - - - - - - - 50.5 2.1 8.0 -3.0 2.0 8.7 -4.9 Mar. - - - - - - - - 29.7 -3.2 3.9 -9.4 -4.3 1.4 -10.4 Apr. - - - - - - - - 21.5 -4.3 4.6 -12.1 -7.2 -1.8 -13.0 May - - - - - - - - 28.4 -1.2 5.9 -7.5 -3.4 1.5 -8.7
Sources: Eurostat, ECB calculations and Bloomberg (col. 9).1) Deflators for exports and imports refer to goods and services and include cross-border trade within the euro area.2) Import-weighted: weighted according to 2009-11 average import structure; use-weighted: weighted according to 2009-11 average domestic demand structure.

4 Prices and costs
S 16ECB Economic Bulletin, Issue 4 / 2020 - Statistics
4.4 Price-related opinion surveys(seasonally adjusted)
European Commission Business and Consumer Surveys Purchasing Managers’ Surveys
(percentage balances) (diffusion indices)
Selling price expectations Consumer Input prices Prices charged (for next three months) price trends
over pastManu- Retail trade Services Construction 12 months Manu- Services Manu- Services
facturing facturing facturing
1 2 3 4 5 6 7 8 9
1999-15 4.3 - - -4.5 32.3 56.7 56.3 - 49.7
2017 9.3 5.2 7.1 2.8 12.9 64.6 56.3 55.1 51.62018 11.6 7.5 9.5 12.5 20.6 65.4 57.9 56.1 52.72019 4.3 7.2 9.0 7.4 18.3 48.8 57.1 50.4 52.4
2019 Q2 4.8 7.2 9.2 6.6 19.8 50.6 57.1 51.2 52.3 Q3 1.9 6.6 8.4 4.9 17.9 46.4 56.5 48.9 52.0 Q4 1.4 6.9 7.9 5.9 14.7 44.2 56.9 48.6 52.0
2020 Q1 2.0 6.6 7.4 4.9 13.3 45.6 54.7 48.0 49.7
2019 Dec. 2.1 7.9 8.4 6.4 14.1 45.0 56.7 48.9 51.8
2020 Jan. 2.9 8.6 10.4 6.8 14.9 45.6 57.6 48.6 51.8 Feb. 3.5 7.4 9.1 5.9 14.3 47.1 56.8 48.1 52.1 Mar. -0.3 3.9 2.8 1.9 10.6 44.2 49.7 47.2 45.3 Apr. -7.5 -8.0 -9.9 -12.9 5.9 44.6 44.5 45.8 40.2 May -8.6 -3.1 -8.7 -11.3 12.6 43.0 47.7 45.8 43.3
Sources: European Commission (Directorate-General for Economic and Financial Affairs) and Markit.
4.5 Labour cost indices(annual percentage changes, unless otherwise indicated)
Total Total By component For selected economic activities Memo item:
(index: Indicator of2016 = 100) Wages and Employers’ social Business economy Mainly non-business negotiated
salaries contributions economy wages 1)
1 2 3 4 5 6 7
% of total 100.0 100.0 75.3 24.7 69.0 31.0 in 2018
2017 101.8 1.8 1.7 1.8 1.8 1.7 1.52018 104.2 2.3 2.3 2.5 2.4 2.1 2.12019 106.9 2.6 2.6 2.5 2.5 2.7 2.3
2019 Q2 110.9 2.8 2.8 2.9 2.7 3.1 2.0 Q3 103.5 2.6 2.7 2.7 2.7 2.5 2.6 Q4 113.2 2.4 2.3 2.4 2.3 2.6 2.1
2020 Q1 . . . . . . 2.0
Sources: Eurostat and ECB calculations.1) Experimental data based on non-harmonised sources (see https://www.ecb.europa.eu/stats/ecb_statistics/governance_and_quality_framework/html/experimental-data.en.html
for further details).

4 Prices and costs
S 17ECB Economic Bulletin, Issue 4 / 2020 - Statistics
4.6 Unit labour costs, compensation per labour input and labour productivity(annual percentage changes, unless otherwise indicated; quarterly data seasonally adjusted; annual data unadjusted)
Unit labour costs
Total Total By economic activity
(index:2015 Agriculture, Manu- Con- Trade, Information Finance Real Professional, Public ad- Arts, enter-
=100) forestry facturing, struction transport, and commu- and estate business and ministration, tainmentand fishing energy and accom- nication insurance support education, and other
utilities modation and services health and servicesfood services social work
1 2 3 4 5 6 7 8 9 10 11 12
2017 106.2 0.7 -0.2 -0.6 0.8 0.4 0.0 -1.4 3.4 1.7 1.4 1.12018 108.1 1.8 0.1 1.7 1.0 1.7 1.6 -0.7 3.4 2.2 2.3 2.52019 110.3 2.0 0.6 3.5 1.3 1.7 1.2 -1.1 2.7 1.6 2.7 1.9
2019 Q1 109.4 2.3 1.6 3.6 1.1 2.0 1.7 -0.7 5.1 1.8 2.6 1.6 Q2 110.0 2.1 -0.1 3.2 1.7 2.0 1.5 -0.9 3.2 1.7 2.6 2.3 Q3 110.6 1.9 -0.7 4.0 1.1 1.4 1.6 -1.2 2.3 1.3 2.6 1.7 Q4 110.9 1.8 1.5 3.0 1.5 1.2 -0.2 -1.3 0.2 1.7 2.8 2.2
Compensation per employee
2017 111.3 1.7 1.1 1.5 1.9 1.5 2.0 1.2 2.2 2.5 1.8 1.62018 113.8 2.2 1.8 1.9 1.9 2.4 2.6 1.6 3.2 2.7 2.0 2.62019 116.1 2.0 1.8 1.5 2.1 2.2 1.6 1.3 3.0 1.9 2.3 2.5
2019 Q1 115.4 2.3 1.5 1.9 2.4 2.7 2.0 1.4 4.0 1.9 2.3 2.5 Q2 115.9 2.1 1.8 1.1 2.2 2.3 1.4 1.8 3.2 2.4 2.2 3.1 Q3 116.7 2.1 1.2 2.0 2.0 2.3 1.8 1.1 3.2 1.9 2.3 2.1 Q4 116.8 1.7 2.8 0.8 1.6 1.6 1.3 1.1 1.8 1.5 2.6 2.2
Labour productivity per person employed
2017 104.8 0.9 1.3 2.1 1.1 1.0 2.0 2.7 -1.1 0.7 0.4 0.52018 105.2 0.4 1.7 0.3 0.8 0.6 1.0 2.4 -0.2 0.5 -0.3 0.02019 105.3 0.0 1.2 -1.9 0.7 0.6 0.4 2.4 0.4 0.3 -0.3 0.5
2019 Q2 105.3 0.0 1.9 -2.0 0.6 0.3 -0.1 2.7 -0.1 0.6 -0.4 0.8 Q3 105.5 0.2 1.8 -1.9 0.9 0.9 0.2 2.3 0.9 0.7 -0.3 0.4 Q4 105.3 -0.1 1.2 -2.2 0.1 0.5 1.5 2.4 1.6 -0.2 -0.3 0.0
2020 Q1 101.6 -3.6 . . . . . . . . . .
Compensation per hour worked
2017 113.3 2.0 1.3 1.8 1.9 1.8 2.0 1.8 2.1 2.3 2.4 2.12018 115.8 2.1 1.3 2.1 1.4 2.4 2.7 1.9 2.4 2.7 1.9 2.22019 118.1 2.1 1.4 1.9 2.3 2.3 2.6 0.9 2.8 2.1 1.9 2.7
2019 Q1 116.7 1.9 -0.4 2.0 1.7 2.2 2.6 0.9 4.2 1.9 1.7 2.2 Q2 117.4 2.2 2.4 1.8 2.4 2.4 2.5 1.4 3.4 2.5 1.9 3.6 Q3 118.2 2.3 1.4 2.5 2.6 2.6 2.8 0.7 2.3 2.3 1.8 2.5 Q4 118.5 1.9 2.1 1.4 2.7 1.8 2.6 1.1 1.4 1.9 2.2 2.3
Hourly labour productivity
2017 107.2 1.4 1.8 2.5 1.2 1.6 2.1 3.2 -0.9 0.9 1.0 1.02018 107.7 0.5 0.8 0.5 0.6 0.9 1.3 2.6 -0.8 0.5 -0.3 0.02019 107.8 0.2 0.9 -1.5 0.9 0.8 1.5 2.2 0.4 0.5 -0.7 0.7
2019 Q1 107.4 -0.3 -0.9 -1.6 0.6 0.4 1.1 1.7 -0.2 0.1 -0.8 0.6 Q2 107.5 0.3 2.0 -1.4 0.6 0.8 1.2 2.5 0.8 0.8 -0.6 1.2 Q3 107.7 0.5 2.0 -1.5 1.5 1.4 1.4 2.0 0.2 1.1 -0.7 0.8 Q4 107.6 0.2 0.7 -1.6 1.2 0.9 2.5 2.6 0.9 0.1 -0.5 0.1
Sources: Eurostat and ECB calculations.

5 Money and credit
S 18ECB Economic Bulletin, Issue 4 / 2020 - Statistics
5.1 Monetary aggregates 1) (EUR billions and annual growth rates; seasonally adjusted; outstanding amounts and growth rates at end of period; transactions during period)
Outstanding amounts
M3
M2 M3-M2
M1 M2-M1
Currency Overnight Deposits Deposits Repos Money Debtin deposits with an redeemable market securities
circulation agreed at notice fund withmaturity of up to shares a maturityof up to 3 months of up to2 years 2 years
1 2 3 4 5 6 7 8 9 10 11 12
2017 1,112.0 6,638.1 7,750.1 1,196.6 2,261.8 3,458.3 11,208.5 74.4 512.0 72.6 659.1 11,867.52018 1,163.3 7,114.7 8,278.1 1,124.9 2,299.0 3,423.9 11,702.0 74.3 524.0 71.5 669.8 12,371.82019 1,219.6 7,724.2 8,943.8 1,069.5 2,363.8 3,433.4 12,377.1 78.5 531.6 7.9 618.0 12,995.2
2019 Q2 1,189.0 7,415.4 8,604.4 1,111.1 2,338.5 3,449.6 12,054.0 74.5 523.9 37.6 636.0 12,690.0 Q3 1,204.1 7,605.6 8,809.6 1,110.0 2,354.8 3,464.7 12,274.4 74.5 546.3 19.1 640.0 12,914.4 Q4 1,219.6 7,724.2 8,943.8 1,069.5 2,363.8 3,433.4 12,377.1 78.5 531.6 7.9 618.0 12,995.2
2020 Q1 1,261.8 8,075.3 9,337.1 1,077.9 2,361.4 3,439.4 12,776.4 109.9 533.5 58.4 701.9 13,478.3
2019 Nov. 1,216.9 7,715.8 8,932.6 1,081.4 2,359.5 3,440.9 12,373.5 73.4 530.6 26.0 630.0 13,003.5 Dec. 1,219.6 7,724.2 8,943.8 1,069.5 2,363.8 3,433.4 12,377.1 78.5 531.6 7.9 618.0 12,995.2
2020 Jan. 1,228.3 7,743.6 8,971.9 1,062.9 2,362.3 3,425.2 12,397.1 75.8 548.3 24.1 648.2 13,045.2 Feb. 1,236.2 7,826.7 9,062.8 1,065.0 2,359.7 3,424.8 12,487.6 84.9 551.3 25.9 662.1 13,149.7 Mar. 1,261.8 8,075.3 9,337.1 1,077.9 2,361.4 3,439.4 12,776.4 109.9 533.5 58.4 701.9 13,478.3 Apr. (p) 1,276.8 8,231.0 9,507.8 1,071.4 2,376.7 3,448.1 12,956.0 94.6 542.8 45.2 682.6 13,638.6
Transactions
2017 36.0 592.6 628.6 -109.5 34.5 -74.9 553.7 6.5 -10.8 -18.5 -22.7 530.92018 50.3 465.1 515.4 -74.0 45.2 -28.9 486.6 -0.9 12.3 -3.3 8.1 494.72019 56.3 603.1 659.4 -60.0 62.8 2.7 662.1 4.1 -1.8 -57.6 -55.3 606.8
2019 Q2 9.7 143.0 152.8 -4.4 20.3 15.9 168.6 0.4 3.2 -2.4 1.3 169.9 Q3 15.1 181.2 196.3 -4.6 14.8 10.2 206.5 -0.6 21.1 -18.1 2.5 209.0 Q4 15.6 122.8 138.4 -38.0 8.1 -29.9 108.4 4.5 -16.0 -9.5 -21.1 87.4
2020 Q1 42.1 346.6 388.7 6.5 -2.5 4.0 392.7 31.1 2.0 48.6 81.6 474.4
2019 Nov. 7.4 40.3 47.7 -14.0 0.2 -13.8 33.9 -6.5 1.4 -1.4 -6.5 27.4 Dec. 2.8 12.9 15.7 -9.9 4.8 -5.1 10.7 5.5 -0.2 -18.1 -12.8 -2.1
2020 Jan. 8.7 15.4 24.0 -8.3 -1.6 -9.9 14.1 -3.0 16.6 16.6 30.2 44.3 Feb. 7.9 81.9 89.7 1.6 -2.6 -0.9 88.8 9.0 3.0 1.2 13.3 102.1 Mar. 25.6 249.3 274.9 13.2 1.7 14.9 289.8 25.0 -17.6 30.7 38.1 327.9 Apr. (p) 15.1 152.7 167.8 -7.7 15.3 7.5 175.3 -15.7 9.4 -13.0 -19.3 156.0
Growth rates
2017 3.3 9.8 8.8 -8.3 1.6 -2.1 5.2 9.5 -2.1 -21.1 -3.3 4.72018 4.5 7.0 6.6 -6.2 2.0 -0.8 4.3 -1.3 2.4 -4.7 1.2 4.22019 4.8 8.5 8.0 -5.3 2.7 0.1 5.7 5.4 -0.4 -86.7 -8.2 4.9
2019 Q2 4.7 7.7 7.2 -6.1 3.0 -0.1 5.0 1.1 1.1 -38.3 -2.8 4.6 Q3 4.7 8.5 7.9 -2.6 3.0 1.1 5.9 3.0 8.7 -65.4 1.1 5.7 Q4 4.8 8.5 8.0 -5.3 2.7 0.1 5.7 5.4 -0.4 -86.7 -8.2 4.9
2020 Q1 7.0 10.9 10.4 -3.6 1.8 0.0 7.4 47.5 2.0 56.7 10.1 7.5
2019 Nov. 5.0 8.8 8.3 -4.7 2.7 0.3 5.9 -1.1 4.1 -47.4 -1.1 5.6 Dec. 4.8 8.5 8.0 -5.3 2.7 0.1 5.7 5.4 -0.4 -86.7 -8.2 4.9
2020 Jan. 5.2 8.3 7.9 -5.7 2.4 -0.2 5.5 0.7 5.1 -53.0 -0.8 5.2 Feb. 5.4 8.6 8.1 -5.6 2.0 -0.4 5.6 17.6 6.0 -47.6 2.5 5.5 Mar. 7.0 10.9 10.4 -3.6 1.8 0.0 7.4 47.5 2.0 56.7 10.1 7.5 Apr. (p) 8.0 12.5 11.9 -5.2 2.1 -0.3 8.4 27.8 3.1 22.0 6.7 8.3
Source: ECB.1) Data refer to the changing composition of the euro area.

5 Money and credit
S 19ECB Economic Bulletin, Issue 4 / 2020 - Statistics
5.2 Deposits in M3 1) (EUR billions and annual growth rates; seasonally adjusted; outstanding amounts and growth rates at end of period; transactions during period)
Outstanding amounts
Non-financial corporations 2) Households 3) Financial Insurance Other
corpor- corpor- generalTotal Overnight With an Redeem- Repos Total Overnight With an Redeem- Repos ations ations govern-
agreed able agreed able other than and ment 4)
maturity at notice maturity at notice MFIs and pensionof up to of up to of up to of up to ICPFs 2) funds2 years 3 months 2 years 3 months
1 2 3 4 5 6 7 8 9 10 11 12 13
2017 2,240.3 1,797.4 285.0 149.1 8.8 6,317.6 3,702.8 562.1 2,051.9 0.8 991.1 206.6 415.32018 2,331.4 1,898.7 277.3 147.8 7.6 6,644.9 4,035.9 517.6 2,090.1 1.4 998.2 202.9 435.52019 2,476.2 2,062.7 256.9 150.1 6.5 7,040.7 4,395.5 492.5 2,151.8 0.9 1,036.9 214.4 467.8
2019 Q2 2,406.1 1,983.7 265.3 150.0 7.1 6,846.9 4,207.9 509.7 2,127.6 1.7 1,009.5 216.6 460.4 Q3 2,450.9 2,031.3 262.2 151.4 5.9 6,964.9 4,318.1 504.5 2,141.3 1.0 1,042.3 221.3 465.5 Q4 2,476.2 2,062.7 256.9 150.1 6.5 7,040.7 4,395.5 492.5 2,151.8 0.9 1,036.9 214.4 467.8
2020 Q1 2,609.4 2,190.9 263.2 147.5 7.7 7,161.4 4,530.5 472.0 2,158.3 0.6 1,152.1 226.4 475.3
2019 Nov. 2,482.0 2,073.5 251.5 151.4 5.6 7,026.7 4,382.6 497.2 2,145.2 1.7 1,022.2 226.8 472.4 Dec. 2,476.2 2,062.7 256.9 150.1 6.5 7,040.7 4,395.5 492.5 2,151.8 0.9 1,036.9 214.4 467.8
2020 Jan. 2,475.0 2,063.6 256.8 150.5 4.1 7,061.1 4,421.5 487.3 2,151.4 0.8 1,023.6 217.7 467.2 Feb. 2,507.0 2,097.6 253.7 150.3 5.4 7,086.6 4,452.7 482.5 2,150.6 0.8 1,051.7 215.3 475.7 Mar. 2,609.4 2,190.9 263.2 147.5 7.7 7,161.4 4,530.5 472.0 2,158.3 0.6 1,152.1 226.4 475.3 Apr. (p) 2,714.4 2,277.0 284.5 146.6 6.3 7,242.0 4,596.7 467.1 2,177.3 0.8 1,121.0 230.3 466.0
Transactions
2017 180.7 182.4 -1.9 -0.8 0.9 254.7 304.7 -82.1 33.6 -1.5 54.9 7.2 26.72018 93.1 105.3 -9.7 -1.1 -1.4 326.5 324.8 -45.0 46.1 0.5 0.5 -3.9 19.12019 146.1 163.7 -18.8 1.8 -0.5 394.4 358.3 -25.7 62.3 -0.5 29.1 10.2 30.1
2019 Q2 29.7 30.7 -4.3 2.2 1.1 94.1 82.2 -5.1 16.7 0.3 31.6 4.0 -0.2 Q3 40.7 43.9 -2.9 1.0 -1.3 116.9 109.6 -6.0 13.9 -0.6 25.1 3.8 4.4 Q4 28.8 34.6 -4.3 -2.2 0.7 76.7 76.9 -11.5 11.5 -0.2 -3.0 -6.9 1.8
2020 Q1 130.6 126.4 5.6 -2.5 1.2 119.5 134.2 -20.9 6.4 -0.3 112.4 11.7 7.4
2019 Nov. 7.4 19.3 -9.1 -0.5 -2.4 31.1 33.0 -3.6 1.7 0.0 -28.3 3.8 6.0 Dec. -2.8 -8.8 6.3 -1.4 1.0 15.5 13.5 -4.2 7.1 -0.8 17.4 -12.1 -4.6
2020 Jan. -3.5 -0.7 -0.8 0.4 -2.4 19.5 25.5 -5.6 -0.4 0.0 -16.0 3.0 -0.7 Feb. 31.3 33.6 -3.3 -0.2 1.3 25.2 30.9 -4.9 -0.8 0.0 27.5 -2.5 8.5 Mar. 102.7 93.5 9.7 -2.7 2.3 74.9 77.8 -10.4 7.7 -0.2 100.9 11.1 -0.4 Apr. (p) 103.5 85.1 20.8 -1.0 -1.4 80.2 65.9 -5.0 19.0 0.2 -33.6 3.7 -9.3
Growth rates
2017 8.6 11.2 -0.7 -0.5 11.5 4.2 9.0 -12.7 1.7 -65.1 5.8 3.6 6.92018 4.2 5.9 -3.5 -0.7 -16.5 5.2 8.8 -8.0 2.3 67.7 0.0 -1.9 4.62019 6.3 8.6 -6.8 1.2 -6.8 5.9 8.9 -5.0 3.0 -36.8 2.9 5.0 6.9
2019 Q2 5.8 7.6 -4.6 2.5 12.2 5.8 8.6 -4.9 3.1 72.0 -1.0 -1.3 7.6 Q3 6.4 8.0 -2.6 2.8 -11.8 6.3 9.3 -4.1 3.1 -10.1 3.6 4.3 6.6 Q4 6.3 8.6 -6.8 1.2 -6.8 5.9 8.9 -5.0 3.0 -36.8 2.9 5.0 6.9
2020 Q1 9.7 12.1 -2.2 -1.0 24.8 6.0 9.8 -8.4 2.3 -56.7 16.9 5.9 2.9
2019 Nov. 7.0 9.8 -8.4 2.1 -24.6 6.3 9.4 -4.2 2.9 30.5 1.2 8.5 6.0 Dec. 6.3 8.6 -6.8 1.2 -6.8 5.9 8.9 -5.0 3.0 -36.8 2.9 5.0 6.9
2020 Jan. 6.1 8.2 -5.3 1.2 -41.1 5.7 8.7 -6.0 2.7 -43.6 3.2 5.0 5.2 Feb. 6.5 9.0 -7.6 1.2 -13.8 5.4 8.6 -6.8 2.3 -46.9 7.1 3.1 4.6 Mar. 9.7 12.1 -2.2 -1.0 24.8 6.0 9.8 -8.4 2.3 -56.7 16.9 5.9 2.9 Apr. (p) 13.7 16.1 5.5 -2.2 -11.6 6.7 10.6 -9.1 2.9 -48.2 12.3 8.1 1.3
Source: ECB.1) Data refer to the changing composition of the euro area.2) In accordance with the ESA 2010, in December 2014 holding companies of non-financial groups were reclassified from the non-financial corporations sector to the financial
corporations sector. These entities are included in MFI balance sheet statistics with financial corporations other than MFIs and insurance corporations and pension funds (ICPFs).3) Including non-profit institutions serving households.4) Refers to the general government sector excluding central government.

5 Money and credit
S 20ECB Economic Bulletin, Issue 4 / 2020 - Statistics
5.3 Credit to euro area residents 1) (EUR billions and annual growth rates; seasonally adjusted; outstanding amounts and growth rates at end of period; transactions during period)
Outstanding amounts
Credit to general government Credit to other euro area residents
Total Loans Debt Total Loans Debt Equity and
securities securities non-money Total To non- To house- To financial To insurance market fund
financial holds 4) corporations corporations investmentAdjusted corpor- other than and pension fund shares
loans 2) ations 3) MFIs and fundsICPFs 3)
1 2 3 4 5 6 7 8 9 10 11 12
2017 4,617.2 1,032.3 3,571.0 13,114.0 10,870.5 11,165.8 4,323.4 5,600.3 838.0 108.7 1,440.4 803.22018 4,676.7 1,006.2 3,659.0 13,415.9 11,122.4 11,482.8 4,402.3 5,742.1 851.2 126.8 1,517.9 775.62019 4,652.6 984.5 3,656.3 13,865.6 11,452.2 11,838.5 4,472.5 5,930.9 896.1 152.6 1,560.5 852.9
2019 Q2 4,640.2 1,000.7 3,627.9 13,640.4 11,290.6 11,667.0 4,462.4 5,825.8 870.3 132.1 1,546.6 803.2 Q3 4,696.5 999.8 3,685.1 13,776.5 11,394.4 11,764.2 4,488.5 5,876.3 883.5 146.2 1,570.6 811.5 Q4 4,652.6 984.5 3,656.3 13,865.6 11,452.2 11,838.5 4,472.5 5,930.9 896.1 152.6 1,560.5 852.9
2020 Q1 4,774.9 1,006.9 3,756.2 14,047.3 11,688.4 12,063.7 4,601.8 5,966.6 958.5 161.5 1,558.7 800.3
2019 Nov. 4,639.2 1,000.9 3,626.5 13,854.2 11,439.1 11,808.0 4,492.2 5,912.9 888.2 145.8 1,570.8 844.3 Dec. 4,652.6 984.5 3,656.3 13,865.6 11,452.2 11,838.5 4,472.5 5,930.9 896.1 152.6 1,560.5 852.9
2020 Jan. 4,670.2 994.2 3,664.2 13,912.8 11,511.9 11,874.9 4,483.9 5,961.1 913.4 153.5 1,547.1 853.8 Feb. 4,672.0 993.0 3,667.2 13,942.6 11,531.4 11,897.5 4,488.9 5,983.3 909.1 150.1 1,565.8 845.4 Mar. 4,774.9 1,006.9 3,756.2 14,047.3 11,688.4 12,063.7 4,601.8 5,966.6 958.5 161.5 1,558.7 800.3 Apr. (p) 4,962.6 1,015.5 3,935.3 14,124.7 11,728.0 12,103.8 4,671.0 5,960.8 939.4 156.8 1,610.8 785.9
Transactions
2017 287.5 -43.7 330.6 363.2 274.2 316.4 84.9 173.2 19.7 -3.5 63.6 25.42018 90.3 -28.4 118.7 374.8 307.3 382.1 123.6 166.3 -0.4 17.8 88.1 -20.62019 -88.3 -23.5 -65.2 453.0 378.7 426.0 115.0 199.9 42.5 21.2 30.5 43.8
2019 Q2 -49.5 -1.6 -48.2 123.8 105.6 126.5 51.7 38.8 16.6 -1.5 17.4 0.8 Q3 -2.6 -0.9 -1.7 129.7 102.3 104.5 27.2 52.0 9.2 13.9 20.7 6.6 Q4 -5.2 -15.6 10.2 90.2 78.5 104.6 2.8 60.1 9.1 6.5 -7.8 19.5
2020 Q1 133.8 21.8 112.0 229.5 247.9 240.3 135.6 41.8 61.6 8.8 15.4 -33.8
2019 Nov. -9.6 -0.9 -8.9 33.8 15.6 21.8 -4.0 18.6 -5.9 6.9 9.2 9.1 Dec. 21.8 -17.1 38.9 22.6 25.9 47.5 -11.5 21.1 9.5 6.8 -8.4 5.0
2020 Jan. -9.1 9.6 -18.7 44.8 57.9 35.3 10.5 30.5 15.9 0.8 -14.1 1.0 Feb. 6.7 -1.5 8.2 40.7 20.9 26.1 6.5 22.9 -5.0 -3.4 20.6 -0.9 Mar. 136.2 13.8 122.5 144.0 169.1 178.9 118.6 -11.6 50.7 11.4 8.9 -34.0 Apr. (p) 194.4 8.2 186.0 69.2 38.0 37.9 71.5 -5.4 -23.3 -4.7 47.5 -16.3
Growth rates
2017 6.6 -4.1 10.2 2.8 2.6 2.9 2.0 3.2 2.4 -3.2 4.6 3.22018 2.0 -2.8 3.4 2.9 2.8 3.4 2.9 3.0 -0.1 16.4 6.1 -2.62019 -1.9 -2.3 -1.8 3.4 3.4 3.7 2.6 3.5 5.0 16.2 2.0 5.6
2019 Q2 -0.2 -2.0 0.3 3.0 3.2 3.5 3.3 3.2 1.7 5.9 3.1 1.3 Q3 -1.1 -0.5 -1.3 3.2 3.2 3.6 2.9 3.2 3.5 14.4 3.3 2.6 Q4 -1.9 -2.3 -1.8 3.4 3.4 3.7 2.6 3.5 5.0 16.2 2.0 5.6
2020 Q1 1.6 0.4 1.9 4.2 4.8 5.0 4.9 3.3 11.2 20.7 3.0 -0.8
2019 Nov. -1.4 -0.3 -1.7 3.2 3.2 3.6 2.6 3.3 3.6 16.2 2.9 4.2 Dec. -1.9 -2.3 -1.8 3.4 3.4 3.7 2.6 3.5 5.0 16.2 2.0 5.6
2020 Jan. -1.9 -1.3 -2.1 3.4 3.5 3.7 2.6 3.7 4.9 16.7 1.1 5.7 Feb. -2.0 -1.0 -2.2 3.4 3.5 3.7 2.4 3.9 5.0 14.8 2.0 4.1 Mar. 1.6 0.4 1.9 4.2 4.8 5.0 4.9 3.3 11.2 20.7 3.0 -0.8 Apr. (p) 6.2 1.5 7.5 4.4 4.7 4.9 6.0 3.0 7.5 21.1 6.4 -3.6
Source: ECB.1) Data refer to the changing composition of the euro area.2) Adjusted for loan sales and securitisation (resulting in derecognition from the MFI statistical balance sheet) as well as for positions arising from notional cash pooling services
provided by MFIs.3) In accordance with the ESA 2010, in December 2014 holding companies of non-financial groups were reclassified from the non-financial corporations sector to the financial
corporations sector. These entities are included in MFI balance sheet statistics with financial corporations other than MFIs and insurance corporations and pension funds (ICPFs).4) Including non-profit institutions serving households.

5 Money and credit
S 21ECB Economic Bulletin, Issue 4 / 2020 - Statistics
5.4 MFI loans to euro area non-financial corporations and households 1) (EUR billions and annual growth rates; seasonally adjusted; outstanding amounts and growth rates at end of period; transactions during period)
Outstanding amounts
Non-financial corporations 2) Households 3)
Total Up to 1 year Over 1 Over 5 years Total Loans for Loans for Other loans
and up to consumption houseAdjusted 5 years Adjusted purchase
loans 4) loans 4)
1 2 3 4 5 6 7 8 9 10
2017 4,323.4 4,358.7 986.2 821.2 2,516.1 5,600.3 5,867.4 654.8 4,216.4 729.02018 4,402.3 4,487.6 993.0 843.7 2,565.6 5,742.1 6,025.2 682.6 4,356.8 702.72019 4,472.5 4,575.5 970.7 877.0 2,624.8 5,930.9 6,224.3 719.8 4,524.2 686.9
2019 Q2 4,462.4 4,554.2 977.6 867.2 2,617.6 5,825.8 6,115.2 703.6 4,426.6 695.6 Q3 4,488.5 4,581.9 982.0 873.5 2,633.0 5,876.3 6,165.7 711.2 4,473.5 691.6 Q4 4,472.5 4,575.5 970.7 877.0 2,624.8 5,930.9 6,224.3 719.8 4,524.2 686.9
2020 Q1 4,601.8 4,703.7 1,002.2 915.8 2,683.8 5,966.6 6,254.2 715.5 4,566.5 684.5
2019 Nov. 4,492.2 4,588.1 972.4 883.1 2,636.7 5,912.9 6,201.6 716.4 4,506.6 690.0 Dec. 4,472.5 4,575.5 970.7 877.0 2,624.8 5,930.9 6,224.3 719.8 4,524.2 686.9
2020 Jan. 4,483.9 4,582.1 965.3 877.1 2,641.5 5,961.1 6,243.4 724.3 4,549.6 687.2 Feb. 4,488.9 4,586.3 957.4 880.0 2,651.5 5,983.3 6,264.7 728.4 4,567.3 687.6 Mar. 4,601.8 4,703.7 1,002.2 915.8 2,683.8 5,966.6 6,254.2 715.5 4,566.5 684.5 Apr. (p) 4,671.0 4,775.4 986.5 962.7 2,721.8 5,960.8 6,247.0 701.4 4,573.6 685.8
Transactions
2017 84.9 134.8 0.6 39.1 45.2 173.2 165.6 45.0 134.0 -5.92018 123.6 175.7 18.6 32.7 72.3 166.3 188.6 41.3 134.3 -9.32019 115.0 144.7 -11.7 43.1 83.6 199.9 217.2 40.7 168.7 -9.4
2019 Q2 51.7 55.7 1.3 19.3 31.1 38.8 49.9 11.5 28.7 -1.4 Q3 27.2 34.0 3.6 6.3 17.3 52.0 54.9 8.4 46.5 -2.9 Q4 2.8 21.7 -5.3 7.5 0.5 60.1 63.7 9.4 53.7 -2.9
2020 Q1 135.6 135.2 28.9 43.4 63.3 41.8 37.6 -2.9 45.9 -1.1
2019 Nov. -4.0 2.9 -10.2 6.4 -0.2 18.6 20.2 3.8 13.5 1.2 Dec. -11.5 2.0 2.0 -4.2 -9.4 21.1 23.2 3.3 19.6 -1.8
2020 Jan. 10.5 6.3 -11.0 3.2 18.4 30.5 19.6 4.5 24.9 1.1 Feb. 6.5 7.5 -8.0 4.2 10.3 22.9 22.3 4.5 17.5 0.9 Mar. 118.6 121.4 47.9 36.1 34.6 -11.6 -4.3 -11.9 3.5 -3.1 Apr. (p) 71.5 72.7 -15.6 46.6 40.4 -5.4 -6.2 -13.9 7.1 1.4
Growth rates
2017 2.0 3.2 0.1 5.0 1.8 3.2 2.9 7.3 3.3 -0.82018 2.9 4.1 1.9 4.0 2.9 3.0 3.2 6.4 3.2 -1.32019 2.6 3.2 -1.2 5.1 3.3 3.5 3.6 6.0 3.9 -1.3
2019 Q2 3.3 3.9 0.2 5.6 3.8 3.2 3.3 6.5 3.4 -1.2 Q3 2.9 3.6 -0.8 5.1 3.6 3.2 3.4 6.0 3.5 -1.6 Q4 2.6 3.2 -1.2 5.1 3.3 3.5 3.6 6.0 3.9 -1.3
2020 Q1 4.9 5.5 2.9 9.1 4.3 3.3 3.4 3.8 4.0 -1.2
2019 Nov. 2.6 3.4 -1.0 4.7 3.3 3.3 3.5 5.8 3.7 -1.5 Dec. 2.6 3.2 -1.2 5.1 3.3 3.5 3.6 6.0 3.9 -1.3
2020 Jan. 2.6 3.2 -1.3 5.1 3.3 3.7 3.7 6.0 4.1 -1.2 Feb. 2.4 3.0 -2.1 5.0 3.2 3.9 3.7 6.2 4.3 -1.0 Mar. 4.9 5.5 2.9 9.1 4.3 3.3 3.4 3.8 4.0 -1.2 Apr. (p) 6.0 6.6 0.9 13.7 5.4 3.0 3.0 1.3 3.9 -0.9
Source: ECB.1) Data refer to the changing composition of the euro area.2) In accordance with the ESA 2010, in December 2014 holding companies of non-financial groups were reclassified from the non-financial corporations sector to the financial
corporations sector. These entities are included in MFI balance sheet statistics with financial corporations other than MFIs and insurance corporations and pension funds (ICPFs).3) Including non-profit institutions serving households.4) Adjusted for loan sales and securitisation (resulting in derecognition from the MFI statistical balance sheet) as well as for positions arising from notional cash pooling services
provided by MFIs.

5 Money and credit
S 22ECB Economic Bulletin, Issue 4 / 2020 - Statistics
5.5 Counterparts to M3 other than credit to euro area residents 1) (EUR billions and annual growth rates; seasonally adjusted; outstanding amounts and growth rates at end of period; transactions during period)
Outstanding amounts
MFI liabilities MFI assets
Central Longer-term financial liabilities vis-à-vis other euro area residents Net external Other
government assets holdings 2) Total Deposits Deposits Debt Capital Total
with an redeemable securities and reservesagreed at notice with a Repos Reverse
maturity of over maturity with central repos toof over 3 months of over counter- central2 years 2 years parties 3) counter-
parties 3)
1 2 3 4 5 6 7 8 9 10
2017 342.7 6,771.1 1,967.5 59.8 2,017.5 2,726.2 933.7 316.3 143.5 92.52018 379.3 6,818.7 1,940.7 56.1 2,099.1 2,722.8 1,033.7 443.4 187.0 194.92019 350.3 7,062.0 1,946.5 50.1 2,156.1 2,909.3 1,460.4 428.9 178.9 187.2
2019 Q2 373.7 6,985.0 1,956.9 57.5 2,135.4 2,835.2 1,318.6 449.5 191.5 207.8 Q3 388.0 7,101.1 1,948.1 57.2 2,162.2 2,933.6 1,484.9 445.6 184.2 198.1 Q4 350.3 7,062.0 1,946.5 50.1 2,156.1 2,909.3 1,460.4 428.9 178.9 187.2
2020 Q1 413.3 7,036.8 1,935.1 47.2 2,121.9 2,932.6 1,571.7 534.5 183.7 196.2
2019 Nov. 369.1 7,078.6 1,951.8 52.6 2,162.7 2,911.5 1,491.5 466.4 211.8 224.8 Dec. 350.3 7,062.0 1,946.5 50.1 2,156.1 2,909.3 1,460.4 428.9 178.9 187.2
2020 Jan. 372.2 7,115.6 1,948.9 48.8 2,165.9 2,952.0 1,542.8 407.2 171.1 182.3 Feb. 417.2 7,130.6 1,942.5 48.2 2,162.5 2,977.5 1,613.6 469.2 177.9 191.2 Mar. 413.3 7,036.8 1,935.1 47.2 2,121.9 2,932.6 1,571.7 534.5 183.7 196.2 Apr. (p) 521.1 7,059.2 1,930.5 46.1 2,124.9 2,957.7 1,566.5 565.1 187.6 203.3
Transactions
2017 39.0 -73.4 -83.5 -6.6 -71.1 87.8 -96.1 -58.2 -61.2 -28.52018 40.5 51.2 -37.8 -4.9 16.0 77.9 89.0 32.3 16.2 23.62019 -28.2 107.3 -5.3 -3.0 27.5 88.1 310.7 10.4 -2.7 -2.5
2019 Q2 3.8 45.8 22.0 1.6 -0.6 22.7 99.9 45.3 -6.9 -4.5 Q3 14.6 12.7 -14.6 -1.0 4.8 23.6 93.5 15.8 6.9 7.4 Q4 -37.5 4.7 -1.4 -3.3 -14.3 23.7 -0.4 -30.0 -5.3 -10.9
2020 Q1 63.2 -50.3 -9.3 -2.9 -44.9 6.9 71.3 52.6 4.7 9.1
2019 Nov. -11.3 17.4 1.2 -0.6 1.7 15.1 -16.8 26.1 -9.7 -11.3 Dec. -18.9 -4.3 -5.6 -1.3 3.0 -0.5 -30.9 -38.8 -32.8 -37.7
2020 Jan. 22.1 -7.3 -2.7 -1.3 2.6 -5.9 42.6 -19.2 -7.8 -4.9 Feb. 45.0 0.5 -6.8 -0.6 -5.0 12.8 58.1 42.1 6.8 9.0 Mar. -3.9 -43.6 0.1 -1.0 -42.6 -0.1 -29.5 29.7 5.8 5.0 Apr. (p) 107.9 -19.5 -5.4 -1.0 -2.1 -11.0 -62.4 43.2 4.0 7.0
Growth rates
2017 12.6 -1.1 -4.0 -9.6 -3.4 3.4 - - -29.8 -23.52018 11.8 0.8 -1.9 -8.1 0.8 2.9 - - 8.1 7.72019 -7.4 1.6 -0.3 -5.4 1.3 3.2 - - -1.5 -1.5
2019 Q2 12.6 2.2 -0.4 -1.3 3.1 3.4 - - 5.1 6.7 Q3 -3.2 1.8 -0.3 -0.7 2.2 3.1 - - 6.9 11.0 Q4 -7.4 1.6 -0.3 -5.4 1.3 3.2 - - -1.5 -1.5
2020 Q1 12.0 0.2 -0.2 -10.6 -2.5 2.7 - - -0.3 0.4
2019 Nov. -4.4 1.8 0.2 -2.6 1.2 3.3 - - 11.1 12.8 Dec. -7.4 1.6 -0.3 -5.4 1.3 3.2 - - -1.5 -1.5
2020 Jan. -1.3 1.2 -0.1 -7.3 0.6 2.7 - - -11.5 -10.3 Feb. 4.3 0.9 -0.3 -8.5 -0.7 3.0 - - -7.6 -6.9 Mar. 12.0 0.2 -0.2 -10.6 -2.5 2.7 - - -0.3 0.4 Apr. (p) 42.3 0.0 -0.4 -12.9 -2.2 2.0 - - -6.6 -4.9
Source: ECB.1) Data refer to the changing composition of the euro area.2) Comprises central government holdings of deposits with the MFI sector and of securities issued by the MFI sector.3) Not adjusted for seasonal effects.

6 Fiscal developments
S 23ECB Economic Bulletin, Issue 4 / 2020 - Statistics
6.1 Deficit/surplus(as a percentage of GDP; flows during one-year period)
Deficit (-)/surplus (+) Memo item:
PrimaryTotal Central State Local Social deficit (-)/
government government government security surplus (+)funds
1 2 3 4 5 6
2016 -1.5 -1.7 0.0 0.2 0.1 0.72017 -1.0 -1.4 0.1 0.2 0.1 1.02018 -0.5 -1.0 0.1 0.2 0.3 1.42019 -0.6 -1.0 0.1 0.0 0.2 1.0
2019 Q1 -0.6 . . . . 1.2 Q2 -0.7 . . . . 1.1 Q3 -0.8 . . . . 0.9 Q4 -0.6 . . . . 1.0
Sources: ECB for annual data; Eurostat for quarterly data.
6.2 Revenue and expenditure(as a percentage of GDP; flows during one-year period)
Revenue Expenditure
Total Current revenue Capital Total Current expenditure Capital
revenue expenditureDirect Indirect Net social Compen- Intermediate Interest Socialtaxes taxes contributions sation of consumption benefits
employees
1 2 3 4 5 6 7 8 9 10 11 12 13
2016 46.2 45.7 12.6 13.0 15.3 0.5 47.7 44.1 10.0 5.3 2.1 22.7 3.62017 46.2 45.8 12.8 13.0 15.2 0.4 47.2 43.4 9.9 5.3 1.9 22.5 3.82018 46.5 46.0 13.0 13.0 15.2 0.5 47.0 43.3 9.9 5.3 1.8 22.3 3.72019 46.5 46.0 13.0 13.1 15.1 0.5 47.1 43.4 9.9 5.3 1.6 22.5 3.7
2019 Q1 46.5 46.0 12.9 13.1 15.2 0.5 47.0 43.3 9.9 5.3 1.8 22.4 3.7 Q2 46.5 46.0 12.9 13.1 15.1 0.5 47.2 43.4 9.9 5.3 1.8 22.4 3.7 Q3 46.4 45.9 12.9 13.1 15.1 0.5 47.2 43.5 9.9 5.3 1.7 22.5 3.8 Q4 46.5 46.0 13.0 13.1 15.1 0.5 47.1 43.4 9.9 5.3 1.6 22.6 3.7
Sources: ECB for annual data; Eurostat for quarterly data.
6.3 Government debt-to-GDP ratio(as a percentage of GDP; outstanding amounts at end of period)
Total 1) Financial instrument Holder Original maturity Residual maturity Currency
Currency Loans Debt Resident creditors Non-resident Up to Over Up to Over 1 Over Euro or Other
and securities creditors 1 year 1 year 1 year and up to 5 years participating curren-deposits MFIs 5 years currencies cies
1 2 3 4 5 6 7 8 9 10 11 12 13 14
2016 90.0 3.3 15.7 71.0 47.5 30.9 42.5 9.4 80.7 17.9 29.8 42.3 87.9 2.12017 87.8 3.2 14.6 70.0 48.3 32.2 39.5 8.6 79.1 16.4 29.0 42.3 86.0 1.82018 85.8 3.1 13.8 68.9 48.1 32.5 37.8 8.0 77.8 16.0 28.4 41.3 84.4 1.52019 84.1 3.0 13.1 68.0 45.5 30.7 38.6 7.7 76.4 15.7 28.0 40.4 82.8 1.3
2019 Q1 86.5 3.1 13.6 69.7 . . . . . . . . . . Q2 86.3 3.1 13.5 69.7 . . . . . . . . . . Q3 86.0 3.2 13.3 69.4 . . . . . . . . . . Q4 84.2 3.0 13.1 68.1 . . . . . . . . . .
Sources: ECB for annual data; Eurostat for quarterly data.1) A slight difference (0.1 percentage points of GDP) exists between the government debt-to-GDP ratio for 2019 and for the fourth quarter of 2019. This is explained by a differencebetween annual GDP and the four-quarter moving sum of GDP.
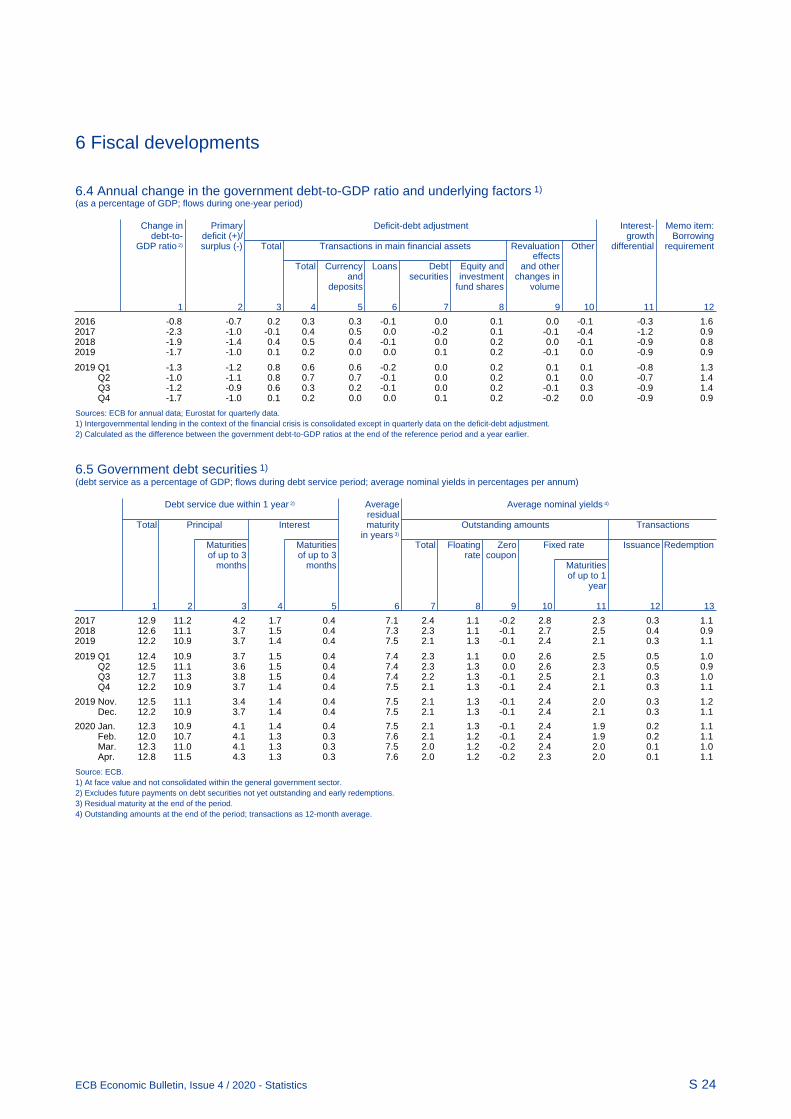
6 Fiscal developments
S 24ECB Economic Bulletin, Issue 4 / 2020 - Statistics
6.4 Annual change in the government debt-to-GDP ratio and underlying factors 1) (as a percentage of GDP; flows during one-year period)
Change in Primary Deficit-debt adjustment Interest- Memo item:
debt-to- deficit (+)/ growth BorrowingGDP ratio 2) surplus (-) Total Transactions in main financial assets Revaluation Other differential requirement
effectsTotal Currency Loans Debt Equity and and other
and securities investment changes indeposits fund shares volume
1 2 3 4 5 6 7 8 9 10 11 12
2016 -0.8 -0.7 0.2 0.3 0.3 -0.1 0.0 0.1 0.0 -0.1 -0.3 1.62017 -2.3 -1.0 -0.1 0.4 0.5 0.0 -0.2 0.1 -0.1 -0.4 -1.2 0.92018 -1.9 -1.4 0.4 0.5 0.4 -0.1 0.0 0.2 0.0 -0.1 -0.9 0.82019 -1.7 -1.0 0.1 0.2 0.0 0.0 0.1 0.2 -0.1 0.0 -0.9 0.9
2019 Q1 -1.3 -1.2 0.8 0.6 0.6 -0.2 0.0 0.2 0.1 0.1 -0.8 1.3 Q2 -1.0 -1.1 0.8 0.7 0.7 -0.1 0.0 0.2 0.1 0.0 -0.7 1.4 Q3 -1.2 -0.9 0.6 0.3 0.2 -0.1 0.0 0.2 -0.1 0.3 -0.9 1.4 Q4 -1.7 -1.0 0.1 0.2 0.0 0.0 0.1 0.2 -0.2 0.0 -0.9 0.9
Sources: ECB for annual data; Eurostat for quarterly data.1) Intergovernmental lending in the context of the financial crisis is consolidated except in quarterly data on the deficit-debt adjustment.2) Calculated as the difference between the government debt-to-GDP ratios at the end of the reference period and a year earlier.
6.5 Government debt securities 1) (debt service as a percentage of GDP; flows during debt service period; average nominal yields in percentages per annum)
Debt service due within 1 year 2) Average Average nominal yields 4)
residual Total Principal Interest maturity Outstanding amounts Transactions
in years 3) Maturities Maturities Total Floating Zero Fixed rate Issuance Redemptionof up to 3 of up to 3 rate coupon
months months Maturitiesof up to 1
year
1 2 3 4 5 6 7 8 9 10 11 12 13
2017 12.9 11.2 4.2 1.7 0.4 7.1 2.4 1.1 -0.2 2.8 2.3 0.3 1.12018 12.6 11.1 3.7 1.5 0.4 7.3 2.3 1.1 -0.1 2.7 2.5 0.4 0.92019 12.2 10.9 3.7 1.4 0.4 7.5 2.1 1.3 -0.1 2.4 2.1 0.3 1.1
2019 Q1 12.4 10.9 3.7 1.5 0.4 7.4 2.3 1.1 0.0 2.6 2.5 0.5 1.0 Q2 12.5 11.1 3.6 1.5 0.4 7.4 2.3 1.3 0.0 2.6 2.3 0.5 0.9 Q3 12.7 11.3 3.8 1.5 0.4 7.4 2.2 1.3 -0.1 2.5 2.1 0.3 1.0 Q4 12.2 10.9 3.7 1.4 0.4 7.5 2.1 1.3 -0.1 2.4 2.1 0.3 1.1
2019 Nov. 12.5 11.1 3.4 1.4 0.4 7.5 2.1 1.3 -0.1 2.4 2.0 0.3 1.2 Dec. 12.2 10.9 3.7 1.4 0.4 7.5 2.1 1.3 -0.1 2.4 2.1 0.3 1.1
2020 Jan. 12.3 10.9 4.1 1.4 0.4 7.5 2.1 1.3 -0.1 2.4 1.9 0.2 1.1 Feb. 12.0 10.7 4.1 1.3 0.3 7.6 2.1 1.2 -0.1 2.4 1.9 0.2 1.1 Mar. 12.3 11.0 4.1 1.3 0.3 7.5 2.0 1.2 -0.2 2.4 2.0 0.1 1.0 Apr. 12.8 11.5 4.3 1.3 0.3 7.6 2.0 1.2 -0.2 2.3 2.0 0.1 1.1
Source: ECB.1) At face value and not consolidated within the general government sector.2) Excludes future payments on debt securities not yet outstanding and early redemptions.3) Residual maturity at the end of the period.4) Outstanding amounts at the end of the period; transactions as 12-month average.

6 Fiscal developments
S 25ECB Economic Bulletin, Issue 4 / 2020 - Statistics
6.6 Fiscal developments in euro area countries(as a percentage of GDP; flows during one-year period and outstanding amounts at end of period)
Government deficit (-)/surplus (+)
Belgium Germany Estonia Ireland Greece Spain France 1) Italy Cyprus
1 2 3 4 5 6 7 8 9
2016 -2.4 1.2 -0.5 -0.7 0.5 -4.3 -3.6 -2.4 0.32017 -0.7 1.2 -0.8 -0.3 0.7 -3.0 -2.9 -2.4 2.02018 -0.8 1.9 -0.6 0.1 1.0 -2.5 -2.3 -2.2 -3.72019 -1.9 1.4 -0.3 0.4 1.5 -2.8 -3.0 -1.6 1.7
2019 Q1 -1.1 1.8 -0.9 0.0 0.4 -2.5 -2.7 -2.2 -5.1 Q2 -1.6 1.7 -0.9 0.4 0.6 -2.8 -3.0 -2.2 -4.9 Q3 -1.8 1.5 -1.0 0.5 0.6 -2.7 -3.3 -2.0 2.2 Q4 -1.9 1.4 -0.3 0.4 1.5 -2.8 -3.0 -1.6 1.7
Government debt
2016 104.9 69.2 10.2 73.8 178.5 99.2 98.0 134.8 103.42017 101.7 65.3 9.3 67.7 176.2 98.6 98.3 134.1 93.92018 99.8 61.9 8.4 63.5 181.2 97.6 98.1 134.8 100.62019 98.6 59.8 8.4 58.8 176.6 95.5 98.1 134.8 95.5
2019 Q1 103.1 61.7 7.8 65.3 182.0 98.6 99.6 136.4 103.1 Q2 102.3 61.1 9.1 63.9 179.5 98.6 99.6 137.8 107.0 Q3 102.1 61.1 9.0 62.5 178.1 97.5 100.4 137.1 97.8 Q4 98.6 59.8 8.4 58.8 176.6 95.5 98.4 134.8 95.5
Government deficit (-)/surplus (+)
Latvia Lithuania Luxembourg Malta Netherlands Austria Portugal Slovenia Slovakia Finland
10 11 12 13 14 15 16 17 18 19
2016 0.2 0.2 1.8 1.0 0.0 -1.5 -1.9 -1.9 -2.5 -1.72017 -0.8 0.5 1.3 3.3 1.3 -0.8 -3.0 0.0 -1.0 -0.72018 -0.8 0.6 3.1 1.9 1.4 0.2 -0.4 0.7 -1.0 -0.92019 -0.2 0.3 2.2 0.5 1.7 0.7 0.2 0.5 -1.3 -1.1
2019 Q1 -0.9 0.2 3.8 1.6 1.5 -0.1 -0.2 0.5 -1.0 -1.1 Q2 -1.4 0.0 3.9 1.1 1.5 0.3 0.1 0.5 -1.0 -1.3 Q3 -1.1 -0.3 3.0 0.5 1.3 0.3 -0.1 0.6 -1.1 -2.0 Q4 -0.2 0.3 2.2 0.5 1.7 0.7 0.2 0.5 -1.3 -1.1
Government debt
2016 40.9 39.7 20.1 55.5 61.9 82.9 131.5 78.7 52.0 63.22017 39.3 39.1 22.3 50.3 56.9 78.3 126.1 74.1 51.3 61.32018 37.2 33.8 21.0 45.6 52.4 74.0 122.0 70.4 49.4 59.62019 36.9 36.3 22.1 43.1 48.6 70.4 117.7 66.1 48.0 59.4
2019 Q1 38.6 33.8 20.7 46.3 50.8 72.7 123.4 68.1 49.3 59.5 Q2 37.5 35.9 20.3 45.7 50.9 71.8 120.8 67.7 48.6 61.5 Q3 37.1 35.7 20.0 43.4 49.2 71.1 120.2 68.1 48.4 60.2 Q4 36.9 36.3 22.1 43.1 48.6 70.4 117.7 66.1 48.0 59.4
Source: Eurostat.1) A slight difference (0.3 percentage points of GDP) exists between the government debt-to-GDP ratio for 2019 and for the fourth quarter of 2019. This is explained by a differencebetween annual GDP and the four-quarter moving sum of GDP.

© European Central Bank, 2020
Postal address 60640 Frankfurt am Main, Germany Telephone +49 69 1344 0 Website www.ecb.europa.eu
All rights reserved. Reproduction for educational and non-commercial purposes is permitted provided that the source is acknowledged.
This Bulletin was produced under the responsibility of the Executive Board of the ECB. Translations are prepared and published by the national central banks.
The cut-off date for the statistics included in this issue was 3 June 2020.
For specific terminology please refer to the ECB glossary (available in English only).
PDF ISSN 2363-3417, QB-BP-20-004-EN-N HTML ISSN 2363-3417, QB-BP-20-004-EN-Q