echnical note d.3 ater resources and environment · environment department ... for information on...
TRANSCRIPT
Environment DepartmentThe World Bank1818 H Street, N.W.Washington, D.C. 20433, U.S.A.www.worldbank.orgFor information on these publications contact theESSD Advisory Service at [email protected] call 202.522.3773
The World Bank
Water Resources and EnvironmentTechnical Note D.3
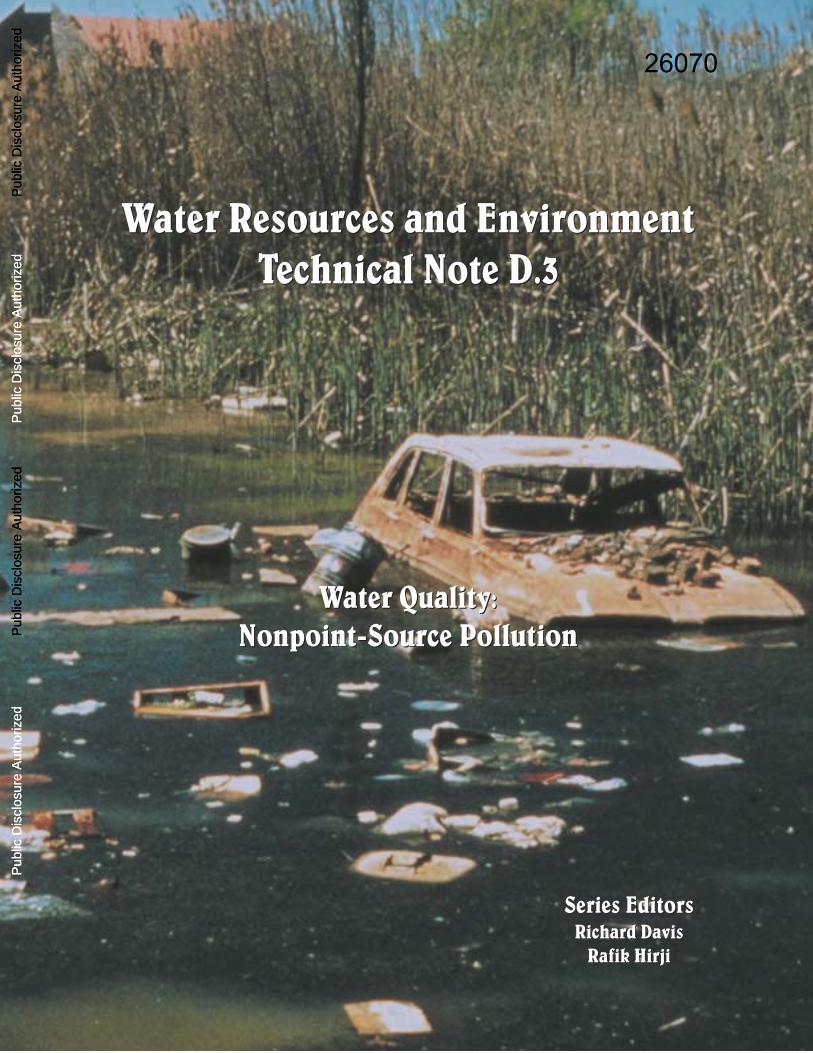
Water Quality:Nonpoint-Source Pollution
Water Resources and EnvironmentTechnical Note D.3
Water Quality:Nonpoint-Source Pollution
Series EditorsRichard Davis
Rafik Hirji
Series EditorsRichard Davis
Rafik Hirji
26070
Pub
lic D
iscl
osur
e A
utho
rized
Pub
lic D
iscl
osur
e A
utho
rized
Pub
lic D
iscl
osur
e A
utho
rized
Pub
lic D
iscl
osur
e A
utho
rized
Pub
lic D
iscl
osur
e A
utho
rized
Pub
lic D
iscl
osur
e A
utho
rized
Pub
lic D
iscl
osur
e A
utho
rized
Pub
lic D
iscl
osur
e A
utho
rized

The World BankWashington, D.C.
WATER RESOURCES
AND ENVIRONMENTTECHNICAL NOTE D.3
Water Quality:Nonpoint-Source Pollution
SERIES EDITORS
RICHARD DAVIS, RAFIK HIRJI

2
A. Environmental Issues and LessonsNote A.1 Environmental Aspects of Water Resources ManagementNote A.2 Water Resources Management Policy Implementation: Early Lessons
B. Institutional and Regulatory IssuesNote B.1 Strategic Environmental Assessment: A Watershed ApproachNote B.2 Water Resources Management: Regulatory DimensionsNote B.3 Regulations for Private Sector Utilities
C. Environmental Flow AssessmentNote C.1 Environmental Flows: Concepts and MethodsNote C.2 Environmental Flows: Case StudiesNote C.3 Environmental Flows: Flood FlowsNote C.4 Environmental Flows: Social Issues
D. Water Quality ManagementNote D.1 Water Quality: Assessment and ProtectionNote D.2 Water Quality: Wastewater TreatmentNote D.3 Water Quality: Nonpoint-Source Pollution
E. Irrigation and DrainageNote E.1 Irrigation and Drainage: DevelopmentNote E.2 Irrigation and Drainage: Rehabilitation
F. Water Conservation and Demand ManagementNote F.1 Water Conservation: Urban UtilitiesNote F.2 Water Conservation: IrrigationNote F.3 Wastewater Reuse
G. Waterbody ManagementNote G.1 Groundwater ManagementNote G.2 Lake ManagementNote G.3 Wetlands ManagementNote G.4 Management of Aquatic Plants
H. Selected topicsNote H.1 Interbasin TransfersNote H.2 DesalinationNote H.3 Climate Variability and Climate Change
Water Resources and Environment Technical Notes
Copyright © 2003
The International Bank for Reconstruction and Development/THE WORLD BANK
1818 H Street, N.W., Washington, D.C. 20433, U.S.A.
All rights reserved.
Manufactured in the United States of America
First printing March 2003
3
AuthorGary Wolff
Technical AdviserStephen Lintner
EditorRobert Livernash
Production StaffCover Design: Cathe Fadel
Design and Production:The Word Express, Inc.
NotesUnless otherwise stated,all dollars = U.S. dollars.All tons are metric tons.
Cover photo byWorld Bank
Urban river pollution
This series also is available on theWorld Bank website
(www.worldbank.org).
CONTENTSForeword 5
Acknowledgments 7
Introduction 9
Causes and Effects of Nonpoint Source Pollution 10Sediments from erosion of agricultural lands, forestryoperations, and new urban developments and nutri-ents and agrochemicals from agricultural activi-ties can all impose significant costs on downstreamusers. Lakes, reservoirs, wetlands, rivers, and pro-ductive near-shore areas can all be affected,thereby reducing the services they provide to de-pendent communities.
The Essentials of NPS Management 12The most cost-effective interventions are usually thosethat invest in widespread changes in behavior andthe decentralized investments to support thosechanges.
Monitoring and Assessing NPS Pollution 15Nonpoint source pollutants move in very complicatedways from their sources into receiving waters and, with-out modeling, it is very difficult to assess the benefitsof various interventions. Biological monitoring comple-ments rather than replaces chemical monitoring.
An Intergrated Approach to NPS Pollution Control 19An integrated approach to NPS pollution control in-cludes specific interventions and programmatic ac-tivities.
Conclusion 26
Further Information 27

4
WATER RESOURCES AND ENVIRONMENT • TECHNICAL NOTE D.3
Boxes1. NPS pollution in Lake Victoria 102. The cost of soil erosion in Zimbabwe 123. Integrated pest management to reduce pesticide
use in rice production 134. The US National Strategy for pollution management from animal
feeding operations 145. Monitoring nitrogen 166. Monitoring programs in Poland and Georgia 207. Public awareness campaigns 238. Ecological restoration as an outcome of NPS pollution control 249. A constructed wetland that cleanses urban runoff 25
Tables1. Source control best management practices for agricultural NPS pollution 2 12. Incentive policies that have been used to control NPS pollution 23

5
WATER QUALITY: NONPOINT-SOURCE POLLUTION
FOREWORD
The environmentally sustainable development andmanagement of water resources is a critical andcomplex issue for both rich and poor countries. Itis technically challenging and often entails difficulttrade-offs among social, economic, and political con-siderations. Typically, the environment is treatedas a marginal issue when it is actually key to sus-tainable water management.
According to the World Bank’s recently approvedWater Resources Sector Strategy, “the environmentis a special ‘water-using sector’ in that most envi-ronmental concerns are a central part of overallwater resources management, and not just a partof a distinct water-using sector” (World Bank 2003:28). Being integral to overall water resources man-agement, the environment is “voiceless” when otherwater using sectors have distinct voices. As a con-sequence, representatives of these other water us-ing sectors need to be fully aware of the importanceof environmental aspects of water resources man-agement for the development of their sectoral in-terests.
For us in the World Bank, water resources man-agement—including the development of surface andgroundwater resources for urban, rural, agriculture,energy, mining, and industrial uses, as well as theprotection of surface and groundwater sources, pol-lution control, watershed management, control ofwater weeds, and restoration of degraded ecosys-tems such as lakes and wetlands—is an importantelement of our lending, supporting one of the es-sential building blocks for sustaining livelihoods andfor social and economic development in general.Prior to 1993, environmental considerations of suchinvestments were addressed reactively and prima-rily through the Bank’s safeguard policies. The 1993Water Resources Management Policy Paper broad-ened the development focus to include the protec-tion and management of water resources in anenvironmentally sustainable, socially acceptable,and economically efficient manner as an emerging
priority in Bank lending. Many lessons have beenlearned, and these have contributed to changingattitudes and practices in World Bank operations.
Water resources management is also a critical de-velopment issue because of its many links to pov-erty reduction, including health, agriculturalproductivity, industrial and energy development,and sustainable growth in downstream communi-ties. But strategies to reduce poverty should not leadto further degradation of water resources␣ or eco-logical services. Finding a balance between theseobjectives is an important aspect of the Bank’s in-terest in sustainable development. The 2001 Envi-ronment Strategy underscores the linkages amongwater resources management, environmentalsustainability, and poverty, and shows how the 2003Water Resources Sector Strategy’s call for usingwater as a vehicle for increasing growth and re-ducing poverty can be carried out in a socially andenvironmentally responsible manner.
Over the past few decades, many nations have beensubjected to the ravages of either droughts or floods.Unsustainable land and water use practices havecontributed to the degradation of the water resourcesbase and are undermining the primary investmentsin water supply, energy and irrigation infrastruc-ture, often also contributing to loss of biodiversity.In response, new policy and institutional reformsare being developed to ensure responsible and sus-tainable practices are put in place, and new predic-tive and forecasting techniques are being developedthat can help to reduce the impacts and managethe consequences of such events. The Environmentand Water Resources Sector Strategies make it clearthat water must be treated as a resource that spansmultiple uses in a river basin, particularly to main-tain sufficient flows of sufficient quality at the ap-propriate times to offset upstream abstraction andpollution and sustain the downstream social, eco-logical, and hydrological functions of watershedsand wetlands.

6
WATER RESOURCES AND ENVIRONMENT • TECHNICAL NOTE D.3
With the support of the Government of the Nether-lands, the Environment Department has preparedan initial series of Water Resources and Environ-ment Technical Notes to improve the knowledgebase about applying environmental managementprinciples to water resources management. TheTechnical Note series supports the implementationof the World Bank 1993 Water Resources Manage-ment Policy, 2001 Environment Strategy, and 2003Water Resources Sector Strategy, as well as theimplementation of the Bank’s safeguard policies.The Notes are also consistent with the MillenniumDevelopment Goal objectives related to environmen-tal sustainability of water resources.
The Notes are intended for use by those withoutspecific training in water resources managementsuch as technical specialists, policymakers andmanagers working on water sector related invest-ments within the Bank; practitioners from bilateral,multilateral, and nongovernmental organizations;and public and private sector specialists interestedin environmentally sustainable water resourcesmanagement. These people may have been trainedas environmental, municipal, water resources, ir-rigation, power, or mining engineers; or as econo-mists, lawyers, sociologists, natural resourcesspecialists, urban planners, environmental planners,or ecologists.
The Notes are in eight categories: environmentalissues and lessons; institutional and regulatory is-sues; environmental flow assessment; water qual-ity management; irrigation and drainage; waterconservation (demand management); waterbodymanagement; and selected topics. The series maybe expanded in the future to include other relevantcategories or topics. Not all topics will be of inter-est to all specialists. Some will find the review ofpast environmental practices in the water sectoruseful for learning and improving their perfor-mance; others may find their suggestions for fur-ther, more detailed information to be valuable; whilestill others will find them useful as a reference onemerging topics such as environmental flow assess-ment, environmental regulations for private waterutilities, inter-basin water transfers and climatevariability and climate change. The latter topics arelikely to be of increasing importance as the WorldBank implements its environment and water re-sources sector strategies and supports the next gen-eration of water resources and environmental policyand institutional reforms.
Kristalina GeorgievaDirector
Environment Department

7
WATER QUALITY: NONPOINT-SOURCE POLLUTION
ACKNOWLEDGMENTS
The Bank is deeply grateful to the Government ofthe Netherlands for financing the production of thisTechnical Note.
This Note was drafted by Gary Wolff of the PacificInstitute for Studies in Development, Environment,and Security, building on an earlier draft by Ran-
dom Dubois of the United Nations Food and Agri-culture Organization.
Within the Bank, David Hanrahan and ManuelMarino reviewed the draft and provided helpfulcomments.
9
WATER QUALITY: NONPOINT-SOURCE POLLUTION
INTRODUCTION
sediments, nutrient losses, and agrochemicals—onwater users, especially the poor.
Three of the Notes deal with water quality. Techni-cal Note D.1 discusses general concepts on waterquality and integrated water resources management,the objectives of water quality assessment, and theiterative steps in water quality assessment and pro-tection. Technical Note D.2 focuses on point sourcesof pollution, particularly discharges from wastewa-ter treatment plant. This Note, D.3, looks at diffusesources of water pollution, including the causes andeffects of nonpoint source pollution; successful ap-proaches to managing NPS; physio-chemical andbiological techniques for monitoring NPS; and theintegration of policy-level and local-level actionsneeded to tackle NPS. Of these, community involve-ment is critical because of the difficulty of identify-ing and impossibility of monitoring the myriadsources that, by definition, constitute NPS.
Water quality problems can arise from the dischargeof pollutants from both point sources—specific pointsof discharge of high-pollutant concentration suchas sewers—and nonpoint, diffuse sources—low-con-centration sources covering a large area. Point-source discharges from sewers, wastewatertreatment plants, and factories are visible and canbe chemically characterized relatively easily. His-torically, they have been the focus of efforts to con-trol surface water pollution in both developed anddeveloping countries. However, substantial loads ofpollutants can also enter water bodies from diffuse,or nonpoint sources (NPS). Runoff from agriculturalactivities is a typical NPS pollution source, since itcan occur throughout the agricultural portions of awatershed rather than from a small number of well-defined points. This form of pollution is much lessvisible and much more difficult to characterize, andhas not been subjected to the same level of man-agement as point-source pollution.
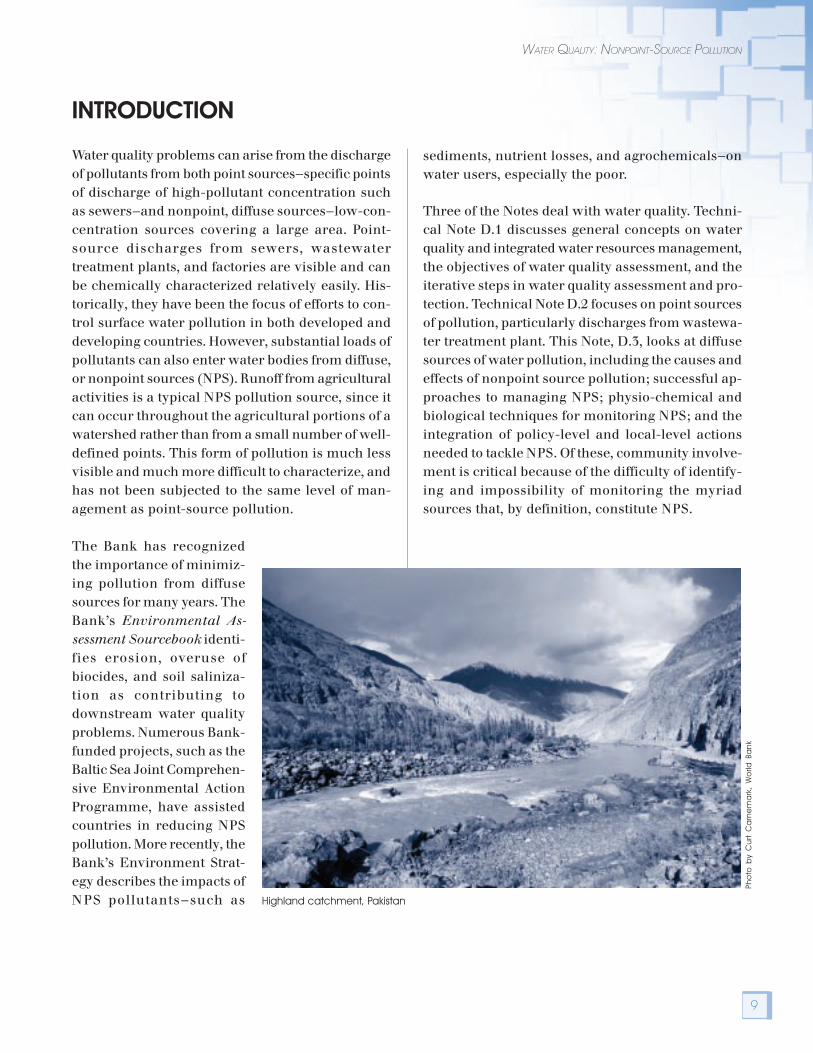
The Bank has recognizedthe importance of minimiz-ing pollution from diffusesources for many years. TheBank’s Environmental As-sessment Sourcebook identi-fies erosion, overuse ofbiocides, and soil saliniza-tion as contributing todownstream water qualityproblems. Numerous Bank-funded projects, such as theBaltic Sea Joint Comprehen-sive Environmental ActionProgramme, have assistedcountries in reducing NPSpollution. More recently, theBank’s Environment Strat-egy describes the impacts ofNPS pollutants—such as Highland catchment, Pakistan
Pho
to b
y C
urt
Ca
rne
ma
rk,
Wo
rld B
ank

10
WATER RESOURCES AND ENVIRONMENT • TECHNICAL NOTE D.3
BOX 1.NPS POLLUTION IN LAKE VICTORIA
Lake Victoria is bordered by Kenya, Uganda, and Tanzania. It is an important source of food and water, as wellas transport and irrigation, for the estimated 25 million people living around its shores. The lake provides one ofthe major export commodities, the Nile perch fishery, for the riparian countries. Eutrophication has beenworsening since the 1960s, to the point where about 25 percent of the lake’s volume is now unavailable tomost fish species, including the Nile perch, because of low oxygen levels.
The extent of eutrophication is controlled by the amount of phosphorus entering the lake. The phosphoruscomes primarily from NPSs, particularly atmospheric deposition (estimated 25,000 tons per year) and rivers(about 5,700 tons per year). The riverine input is particularly significant in enclosed areas such as Winam Gulf. Pointsources, such as sewage treatment plants, contribute relatively minor amounts in comparison, even though theseplants are poorly maintained and, in some cases, do not operate at all. The large atmospheric input of phosphorus isunusual and is a consequence of the large surface area of the lake and the prevalence of dust and smoke from pooragricultural practices in the region.
Although the origins of the atmospheric phosphorus are uncertain, it is likely that agricultural practices thatmaintain ground cover (to prevent dust storms) and avoid burning crop stubble and grasslands will reduce thissource of nutrient input. Riverine NPS nutrient inputs are primarily the result of erosion of agricultural lands,many of which have been converted from forests and are highly susceptible to soil loss.
CAUSES AND EFFECTS OF NONPOINT SOURCE POLLUTION
NPS pollution is more difficult to control than pointsources for two reasons. First, the sources, by defi-nition, occur over large areas at low concentrations,and so are very difficult to identify and quantify.Secondly, they often involve large numbers of prop-erty owners who can be difficult to reach efficiently.Even when there is only one or a small number ofproperty owners involved—for example, when sedi-ments are originating from a newly logged forest—it can be difficult to manage the problem becauseof its surface extent.
There are a number of NPS pollutants. Sedimentscan originate from any activity that disturbs thesoil surface, such as construction, agricultural ac-tivities such as tilling, or forestry operations. Nu-trients, salts, and pathogens from farms, and heavymetals and acid drainage from mining projects, areother contaminants coming from diffuse sourcesin rural areas. Other sources of NPS pollution haveoccurred only since the industrial revolution. Theseinclude pesticides and other agrochemicals in run-off from farms; oil, grease, metals, and chemicalsfrom urban areas; and deposition of airbornepollutants released from cars, factories, and other
atmospheric sources. In areas with many on-sitesanitation facilities (such as septic tanks or pit la-trines), nonpoint pollution may result from leach-ing or overflow, especially during rainstorms.
Although NPS pollutant concentrations tend to bemuch lower than those from point sources (for ex-ample, sewers or other “end-of-pipe” discharges),the environmental impacts of NPS pollution canbe as large or larger than those from point sources.This is because the source areas are often so ex-tensive that large quantities (loads) of pollutantsreach water bodies, despite the low source con-centrations (Box 1). When point-source dischargesare relatively well-controlled, NPS becomes themajor contributor to water pollution. The U.S.Environmental Protection Agency, for example,reports that more than half the remaining waterquality problems in the United States are from NPSpollution now that effluent discharges have beencontrolled.
NPS pollution can still be a major contributor towater pollution even when point sources are notwell-controlled. For example, eutrophication due to

11
WATER QUALITY: NONPOINT-SOURCE POLLUTION
excess nutrient loads carried by the Danube Riveris widely recognized as the most serious problemfacing the Danube River and the Black Sea. Thenorthwestern shelf of the Black Sea is severely de-graded by eutrophication. A study by the Black SeaEnvironmental Program (BSEP) found that morethan half of the nutrient load into the Danube Rivercome from agricultural diffuse sources, while about25 percent is from households and 12 percent fromindustrial sources. These numbers are typical ofmany eastern European countries.
Although this Note is applicable to any of thesesources, it will focus particularly on NPS pollutionfrom agriculture because of the importance of thissource in many regions of the world.
CONSEQUENCES OF NONPOINTSOURCE POLLUTION
NPS pollution from a wide range of land use op-erations can impose significant costs on users ofrivers, lakes, estuaries and near-shore areas, andgroundwater.
Wetlands and productive nearshore areas can be-come blanketed in silt from erosion of agriculturallands, forestry operations, and new urban develop-ments, thereby reducing the services—such as foodand fiber—they provide to dependent communities.These costs are often borne disproportionately bythe poor. The lifespan of reservoirs and the outputfrom hydropower plants can be severely reducedbecause of siltation, and pumping equipment canbe damaged from abrasion. For example, the highsuspended sediment load in Kenya’s Athi River,largely due to upstream land clearance, caused se-rious problems to the water supply intake forMombasa, resulting in the eventual abandonmentof the Mombasa Water Supply intake. The SabakiRiver Waterworks, constructed in the late 1970s tosupply Mombasa, required the inclusion of exten-sive primary settling basins before the conventionalsedimentation clarifiers, which cost over $1 million.
Nutrients, washed off cropland, forestland, andpoorly drained urban areas not only represent a
loss for landowners, but can cause eutrophicationand excessive plant growth—algal blooms or nui-sance exotic plants such as Salvinia—when physi-cal conditions are suitable in downstream waterbodies (see Note G.4). Phosphorus is often the nu-trient that controls the extent of freshwater algalblooms; it is usually attached to sediment particlesoriginating from diffuse sources. Sediment-boundphosphorus is released more slowly into the waterthan is phosphorus from point sources such as sew-age treatment plants, which typically contain ahigher proportion of organic phosphorus and dis-solved orthophosphorus. Consequently, diffuse-source phosphorus can support algal blooms forextended periods.
There are a number of studies that estimate thecosts of erosion and soil loss. An example from Zim-babwe illustrates the cost of just the nutrient losscomponent of soil erosion to landowners (Box 2).Nutrient loss also imposes significant costs ondownstream communities. An Australian study hasestimated the cost of downstream eutrophicationfrom nutrients, mostly originating from NPSpollution, at between $90 million and $120 millionper year.
Surface flows and groundwater inflows can carrysalts into streams when groundwater tables riseafter land is cleared for agriculture. This occursin regions where there are naturally high salt con-centrations because of old marine deposits ordepositions from prevailing oceanic winds. Theseincreases in riverine salinity impose significantcosts on downstream irrigation and urban waterusers, as well as affecting the ecology of the riv-ers and lakes. For example, increasing drylandand riverine salinity is now accepted as the greatestenvironmental problem facing Australia; some2.6 million hectares are currently affected by dry-land salinity at a cost of more than $250 million ayear to agriculture–without including the costs im-posed on downstream and environmental waterusers.
Groundwater is more often contaminated from NPSpollution than from point sources. For example,

12
WATER RESOURCES AND ENVIRONMENT • TECHNICAL NOTE D.3
nearly half of China’s groundwater has been im-paired by NPS pollutants from agricultural sources.Another recent study found that 16 percent of on-farm wells in Poland had levels of nitrate in excessof recommended drinking water levels. Nitrates ingroundwater can cause severe health problems ininfants– the so-called “blue-baby” syndrome.
While the above examples illustrate the costs of spe-cific forms of pollution, there is relatively little re-search on the total economic costs of environmentaldegradation caused by NPS pollution. One attemptto account for all aspects of the cost of soil erosionestimated that the worldwide off-farm costs of soilerosion are about $150 billion annually.
THE ESSENTIALS OF NPS MANAGEMENT
The most successful interventions to control NPSpollution have been preventive, although pollutedrunoff can sometimes be treated in, for example,natural and constructed wetlands (see Note G.3). Themost cost-effective interventions are usually thosethat invest in widespread changes in behavior andthe decentralized investments to support thosechanges, rather than centralized infrastructure.
Three lessons have emerged from Bank experiencewith NPS pollution. Successful initiatives require:n A partnership approachn Long-term commitmentsn An integrated approach
PARTNERSHIP APPROACH
The traditional “command and control” approachis increasingly being replaced with one that requiresa greater level of industry involvement for the regu-lation of point-source pollution (see Note D.2). How-ever, command and control has never been effectivefor NPS pollution. NPS pollution is much more dif-ficult to attribute to an individual source (for ex-ample, one farmer), making both monitoring andenforcement of discharge standards nearly impos-sible. Even when NPS pollution clearly originatesfrom a single landowner, such as a large forestryenterprise, it can still be difficult to control because
BOX 2.THE COST OF SOIL EROSION IN ZIMBABWE
In the mid-1980s, a study assessed the cost of soil erosion to the Zimbabwean economy. The study concen-trated on the issue of nutrient depletion, and monetized it by estimating the replacement costs of the lostnutrients. Data were compiled from experimental plots to determine the quantitative relationships betweensoil losses and losses of nitrogen, phosphorus, and organic carbon. These relationships were extrapolated tothe dominant farming systems in the country, allowing the losses to be estimated at the national level. Finally,the cost of nutrient losses was computed by calculating the equivalent cost of fertilizers and soil amendmentsneeded to replace the nutrients.
The highest erosion rates were found in arable and communal grazing lands. On average, 1.6 million tons ofnitrogen, 0.24 million tons of phosphorus, and 15.6 million tons of organic matter were estimated to be lostannually. The financial cost based on mineral fertilizer replacement was $1.5 billion per year, which was morethan 16 percent of Zimbabwe’s agricultural production and equivalent to 3 percent of national GDP.
A more complete measure of economic cost would account for physical damage to farms from the erosion,as well as downstream and off-site damages. These include loss in irrigation or flood control capacity due tosediment; expenses to remove sediment from river beds, lakes, and reservoirs by dredging; and damage tofisheries, tourism, recreation, and habitat downstream.
Source: Norse, D., and R. Saigal. 1993.”National economic cost of soil erosion in Zimbabwe,” in Environmental Economics and NaturalResources Management in Developing Countries. Washington, D.C.: CIDIE/ World Bank.

13
WATER QUALITY: NONPOINT-SOURCE POLLUTION
of its areal extent. Consequently, the most success-ful and cost-effective programs encourage landusersto take responsibility for the NPS pollution theygenerate and to adopt improved management tech-niques. This requires the traditional regulation-monitoring-enforcement model to be replaced withan approach that treats all users of land as stake-holders in a partnership engaged in sustainable landuse.
Under this approach, farmers and other landusersreceive education, technical support, and financialassistance in their efforts to conserve soils, protectwater resources, and maintain habitats. Environ-mental investments become part of a strategy thatpromotes equitable development and creation ofnonfarm employment opportunities.
Local implementation is critical in this approach.Those who are most closely associated with landand water resources are best positioned to guide
interventions knowledgeably, and to assure long-term results through their commitment. Even moreimportantly, effective implementation requiresownership of programs by those directly involvedin agriculture or other land uses. This ownershipcan only be achieved through local landusers’ mean-ingful participation in identification, design, andimplementation of environmental managementplans. Government agencies and development or-ganizations need to adopt participatory approaches,requiring in many cases significant changes in cur-rent planning systems, methods of project reviewand approval, and training programs. Box 3 pre-sents two success stories.
LONG-TERM COMMITMENT
Behavioral change is usually slow. The motivationfor people to change develops gradually throughmany information channels. Even when the typesof changes are understood, the particular changes
BOX 3.INTEGRATED PEST MANAGEMENT TO REDUCE PESTICIDE USE IN RICE PRODUCTION
Integrated pest management (IPM) is a collection of techniques to control agricultural pests, including the useof pesticides when appropriate. IPM replaces some pesticide use by bio-control agents and physical interven-tions, and so reduces the NPS pollution of waterbodies by pesticides. IPM is knowledge-intensive, and requiresextensive collaboration among farmers within a region, as well as among farmers, research institutions, andgovernmental entities.
An Indonesian national IPM policy was announced in 1986 because extensive areas of rice production wereinfested with the brown planthopper (Nilaparvata lugens), which could not be controlled by conventional means.The IPM program included bans on some insecticides, reduction of subsidies for pesticides, and strengthening ofresearch and extension institutions. By mid-1992, about 1,000 pest observers, 3,000 extension staff, and at least150,000 farmers had been trained to observe and understand the local ecology of the planthopper and its naturalenemies and to follow simple threshold rules for action. During 1987-90, the volume of pesticides used on rice fellby more than 50 percent, while yields increased about 15 percent. Farmers’ net profits were estimated at $18 per-IPM-trained farmer per year, achieved with an average investment per farmer of about $4. The federal governmentbenefited from a $120 million-per-year reduction in pesticide subsidies, and downstream water users benefitedfrom reduced pesticide loading in streams and rivers.
In Bangladesh in 1992, the NOPEST project tested eight IPM management techniques in two rice growing districts.Farmers participating in NOPEST cut pesticide use by 75 percent, while increasing yields by about 10 percent, eventhough all the IPM strategies were not effective. A subsequent program named INTERFISH was designed to reach22,500 farming households. Participatory learning was emphasized in both NOPEST and INTERFISH. In 1994,INTERFISH boosted yields by an average of 7 percent, while reducing the cost of pesticides.
Sources: Schillhorn van Veen, Tjaart W., Douglas A. Forno, Steen Joffe, Dina L. Umali-Deninger, and Sanjiva Cooke. 1997. Integrated pestmanagement. Environmentally sustainable development studies and monographs series no. 13. Washington: the World Bank.
Srivastava, Jitendra P., Nigel J.H. Smith, Douglas A. Forno. 1999. Integrating biodiversity in agricultural intensification. Washington: the WorldBank.
14
WATER RESOURCES AND ENVIRONMENT • TECHNICAL NOTE D.3
BOX 4.THE U.S. NATIONAL STRATEGY FOR POLLUTION MANAGEMENT FROM ANIMAL FEEDING OPERATIONS
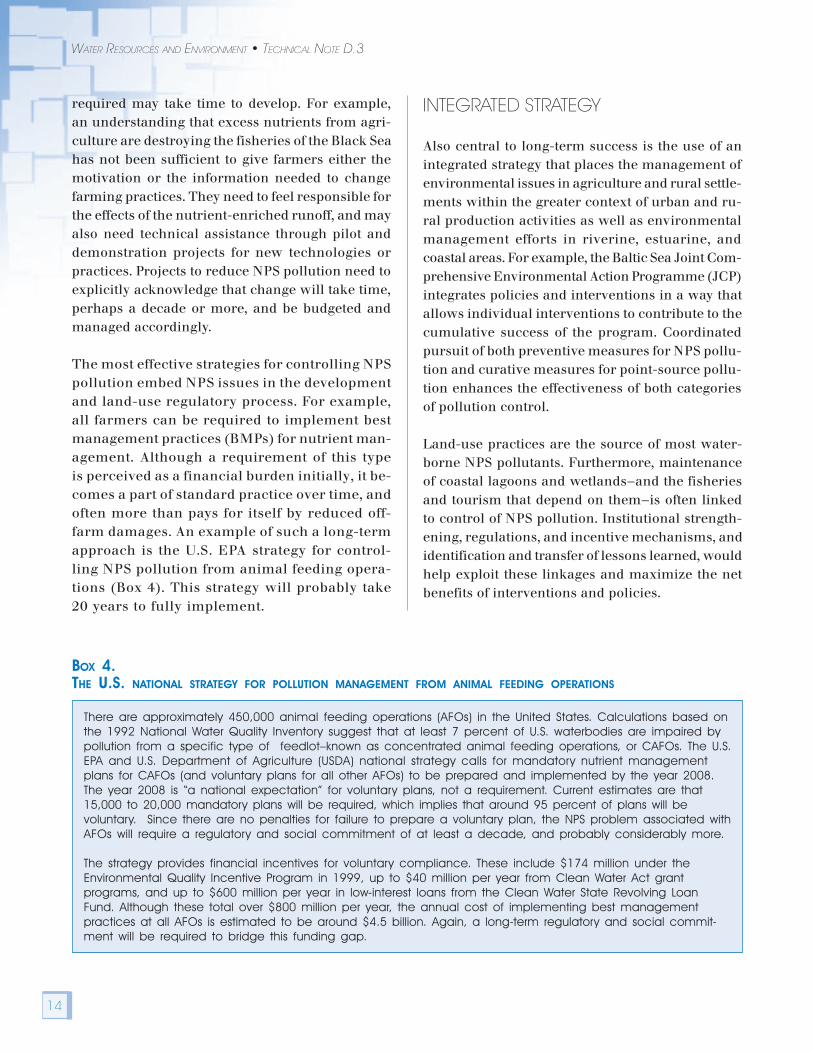
There are approximately 450,000 animal feeding operations (AFOs) in the United States. Calculations based onthe 1992 National Water Quality Inventory suggest that at least 7 percent of U.S. waterbodies are impaired bypollution from a specific type of feedlot–known as concentrated animal feeding operations, or CAFOs. The U.S.EPA and U.S. Department of Agriculture (USDA) national strategy calls for mandatory nutrient managementplans for CAFOs (and voluntary plans for all other AFOs) to be prepared and implemented by the year 2008.The year 2008 is “a national expectation” for voluntary plans, not a requirement. Current estimates are that15,000 to 20,000 mandatory plans will be required, which implies that around 95 percent of plans will bevoluntary. Since there are no penalties for failure to prepare a voluntary plan, the NPS problem associated withAFOs will require a regulatory and social commitment of at least a decade, and probably considerably more.
The strategy provides financial incentives for voluntary compliance. These include $174 million under theEnvironmental Quality Incentive Program in 1999, up to $40 million per year from Clean Water Act grantprograms, and up to $600 million per year in low-interest loans from the Clean Water State Revolving LoanFund. Although these total over $800 million per year, the annual cost of implementing best managementpractices at all AFOs is estimated to be around $4.5 billion. Again, a long-term regulatory and social commit-ment will be required to bridge this funding gap.
required may take time to develop. For example,an understanding that excess nutrients from agri-culture are destroying the fisheries of the Black Seahas not been sufficient to give farmers either themotivation or the information needed to changefarming practices. They need to feel responsible forthe effects of the nutrient-enriched runoff, and mayalso need technical assistance through pilot anddemonstration projects for new technologies orpractices. Projects to reduce NPS pollution need toexplicitly acknowledge that change will take time,perhaps a decade or more, and be budgeted andmanaged accordingly.
The most effective strategies for controlling NPSpollution embed NPS issues in the developmentand land-use regulatory process. For example,all farmers can be required to implement bestmanagement practices (BMPs) for nutrient man-agement. Although a requirement of this typeis perceived as a financial burden initially, it be-comes a part of standard practice over time, andoften more than pays for itself by reduced off-farm damages. An example of such a long-termapproach is the U.S. EPA strategy for control-ling NPS pollution from animal feeding opera-tions (Box 4). This strategy will probably take20 years to fully implement.
INTEGRATED STRATEGY
Also central to long-term success is the use of anintegrated strategy that places the management ofenvironmental issues in agriculture and rural settle-ments within the greater context of urban and ru-ral production activities as well as environmentalmanagement efforts in riverine, estuarine, andcoastal areas. For example, the Baltic Sea Joint Com-prehensive Environmental Action Programme (JCP)integrates policies and interventions in a way thatallows individual interventions to contribute to thecumulative success of the program. Coordinatedpursuit of both preventive measures for NPS pollu-tion and curative measures for point-source pollu-tion enhances the effectiveness of both categoriesof pollution control.
Land-use practices are the source of most water-borne NPS pollutants. Furthermore, maintenanceof coastal lagoons and wetlands—and the fisheriesand tourism that depend on them—is often linkedto control of NPS pollution. Institutional strength-ening, regulations, and incentive mechanisms, andidentification and transfer of lessons learned, wouldhelp exploit these linkages and maximize the netbenefits of interventions and policies.
15
WATER QUALITY: NONPOINT-SOURCE POLLUTION
MONITORING AND ASSESSING NPS POLLUTION
AMBIENT AND RUNOFF WATER QUALITYOBJECTIVES
Because NPS pollutants originate across large ar-eas, monitoring or assessing their impacts can beprohibitively expensive. In some instances, such asregional studies that establish a baseline, this ex-pense is justified. Periodic, comprehensive waterquality assessments are essential for long-term plan-ning and understanding of how water quality ischanging as human uses of land and water resourceschange. Nonetheless, there are many instances inwhich considerably less expensive efforts are ap-propriate.
Beneficial uses of a waterbody range from withdraw-als for drinking and other domestic purposes, usefor fishing and other food collection, to transporta-tion purposes, to in-situ uses such as wildlife habi-tat or protection of biodiversity. NPS pollution canimpair any of these beneficial uses. Actual or po-tential downstream beneficial uses strongly influ-ence the selection of ambient water qualityobjectives, as well as water quality objectives forrunoff. The process of establishing ambient waterquality objectives for different uses is discussed inNote D.1.
MODELING NPS POLLUTANTTRANSPORT
Pollutant transport modeling is a useful tool for link-ing ambient water quality objectives with the choiceof technical interventions and policies for control-ling runoff. Nonpoint-source pollutants move in very
complicated ways from their sources through bothsurface and sub-surface pathways into receivingwaters. The pollutants can undergo chemicalchanges en route and, without modeling, it is verydifficult to assess the benefits of various interven-tions.
For example, a BMP might involve modifying theseasonal timing of manure application to fields inorder to reduce nutrient leaching during heavyrains. A model that simulates leaching, using ac-tual rainfall, soil type, and topography can showthe soil types for which this BMP works well. Sucha model is designed for field-scale application. Awatershed-scale model can be used to find outwhether the BMP will have watershed-scale ben-efits sufficient to justify education, training, anddemonstration projects that are targeted at less thanhalf the farm area in the basin.
PHYSICAL AND CHEMICALMONITORING
Monitoring before and after policies are adopted orinterventions occur is obviously necessary to de-termine whether policies or actions are successful.Note D.1 describes the establishment of a monitor-ing program and the standards for the most com-mon pollutants—here we discuss just the issuesrelevant to NPS pollutants.
In some cases, physical or chemical testing of run-off or ambient water quality is sufficient to identifya problem and to monitor progress toward solvingit. For example, runoff may mostly exit a large farmin a few drainage ditches. If so, it is possible to di-
context within which they make decisions is diffi-cult and often ineffective. These subsidies can oftenbe shown to be economically inefficient if the widerenvironmental context (including downstream us-ers dependent on good quality water) is included inthe decisions.
Agricultural policies have often overlooked theselinks. For example, subsidies for irrigation water, fer-tilizers, pesticides, land-clearing for cattle, and otheractivities have been direct contributors to NPS pol-lution from agriculture. Attempts to change farmerbehavior without changing the distorted economic
16
WATER RESOURCES AND ENVIRONMENT • TECHNICAL NOTE D.3
rectly evaluate different tillage practices for theirimpact on soil erosion, or different fertilizer appli-cation rates on nitrogen and phosphorus loads inrunoff. Some of the water quality parameters thatcan be readily measured with physical or chemicalmonitoring are described below.
Nutrients. Nitrogen and phosphorus are sometimesreferred to as macro-nutrients, since plants suchas water weeds and nuisance algae use them inrelatively large quantities. Nitrogen can take manydifferent chemical forms in water, so there are avariety of measurements and reporting formats fornitrogen. They are described in Box 5.
Phosphorus occurs in natural water almost solelyas phosphates (PO4 ions). Orthophosphates are ap-plied to agricultural land or urban landscapes asfertilizers; phosphates are present in laundering andcleaning detergents; and organically bound phos-phates are released by biological processes such asdegradation of organic materials or conversion oforthophosphates by living creatures. Improperlymanaged manure is a significant source of organicphosphorus in some rural areas with high livestockdensities. Total phosphorus (TP) is a measure ofthe weight of phosphorus present in all forms ofphosphorus in a water sample and is commonlymonitored because of the relative simplicity of thelaboratory procedures. However, like nitrogen, the
most appropriate form of phosphorus to monitordepends on the beneficial use of the waterbody. Ifalgal blooms are a concern, then bio-available phos-phorus (filterable reactive phosphorus, or FRP) isa more relevant measure than TP, since a consid-erable portion of the phosphorus may not be readilyavailable to algal growth.
Other nutrients are also essential for plant growth,but usually in much smaller quantities than nitro-gen or phosphorus. They are usually not monitoredbecause of the costs involved, unless there is goodreason to believe they may be controlling plantgrowth.
Silt and sediment. Sediment loads in water can bedetermined through two tests. A settleable solidstest measures the solids that will naturally be de-posited when water velocity is low. Settleable sol-ids are important because they are the fraction oftotal sediments that reduce the available space ina reservoir, flood control channels, or drainageditches. They can also destroy the habitat of bot-tom-dwelling (benthic) organisms. However, thefinest fraction of the sediment load will not settleeven when surface waters become still. These finesediments are measured as total suspended sol-ids (TSS). TSS and, depending on turbulence,sometimes settleable solids, are important to quan-tify because they determine the loss of water clar-
BOX 5.MONITORING NITROGEN
Nitrogen takes numerous forms in water. Ammonia, organic nitrogen, nitrites, and nitrates are the most commonforms. High ammonia (NH3) concentrations can be toxic to aquatic species, but dissolved ammonia willeventually volatilize or oxidize if the waterbody is well mixed. Organic nitrogen includes the many nitrogencompounds present in human and animal wastes. Total Kjeldahl nitrogen (TKN) is the sum of ammonia nitrogenand organic nitrogen.
Nitrite (NO2) and nitrate (NO3) nitrogen are the two oxidized forms of nitrogen. Nitrites oxidize to nitrates rela-tively quickly in most waters. Ammonia and organic nitrogen are also oxidized to nitrates when bacteria arepresent that can metabolize these substances. Total nitrogen (TN) is the sum of TKN, nitrite nitrogen, and nitratenitrogen. Because of the simplicity of its measurement, TN is often used as a summary measure for monitoringpurposes.
The choice of which form of nitrogen to monitor depends on the beneficial use and characteristics of thewaterbody. For example, monitoring groundwater for nitrates in order to avoid nitrate poisoning (methemoglo-benemia, or “blue-baby syndrome”) may be misleading if dissolved oxygen is very low in the groundwater.Monitoring TN may be a more appropriate procedure, since this shows the potential for NO2 to form.

17
WATER QUALITY: NONPOINT-SOURCE POLLUTION
ity (turbidity) and hencethe ability of light to pen-etrate into the water col-umn and support plantgrowth. Benthic algaeand many submergedaquatic plants cannot es-tablish in turbid waters(see Note G.4).
Salts. Naturally occurringfreshwaters contain dis-solved salts. Improper ir-rigation practices can leadto salt buildup in soils, which may be removed bysubsequent drainage projects (see Notes E.1 andE.2). Salts may also be leached by rainfall from soilsafter the vegetative cover is removed—as a result ofclearcutting of forests or excavation—and watertables rise.
Salinity is one of the simplest pollutants to mea-sure. Total salt concentration can be measured bysimple electrical conductivity (EC) tests in the field,or by total dissolved solids (TDS) analysis in thelaboratory.
Bioaccumulative substances (persistent organic pol-lutants). Organochlorine-based pesticides like DDTand DDE and other bio-accumulative substanceslike PCBs are of particular concern because theyaccumulate in the fatty tissues of living organisms,and become more concentrated in those tissues asthey go up the food chain. For example, autopsiesof dead Beluga whales that washed up on the shoreof the St. Lawrence River in Canada revealed highconcentrations of the pesticide Mirex. Careful re-search showed that Mirex was not used in the feed-ing area of the whales, but had accumulated 600miles away in the tissues of migrating eels that wereeaten by the whales.
Sometimes these compounds are referred to as per-sistent organic pollutants (POPs). The twelve thatare most troublesome (the “dirty dozen”) are, withsome repetition:n Pesticides: aldrin, dieldrin, chlordane,
toxaphene, DDT, endrin, mirex, heptachlor
n Industrial chemicals:polychlorinatedbiphenols (PCBs),hexachlorobenzene
n Byproducts of incin-eration: dioxins,furans, PCBs,hexachlorobenzene,toxaphene.
All can enter waterbodiesas NPSs, since incinera-tion byproducts are oftendeposited on land or ab-
sorbed by water droplets in the air. When a land-based source exists, such as pesticides from a farm,these substances can sometimes be detected in run-off waters relatively near that source. As they movedownstream in a watershed they often fall belowthe analytical detection limits in water, even thoughthese detection limits are very low (typically, partsper trillion).
For some compounds, however, even concentrationsnear or below the detection limits are believed to beharmful. For example, the worm fumigant, ethyl-ene dibromide (EDB), once widely used in agricul-ture, is banned in the United States. The State ofCalifornia Department of Health Services has issuedan “action level” for it in water sources of 50 nano-grams per liter (50 parts per trillion), which is be-low the detection limit in some instances.Consequently, failure to find these substances in run-off does not indicate that it is not present or not harm-ful. In these cases, chemical monitoring cannotassess whether a potential problem exists and bio-logical monitoring should be used, as discussedbelow.
There are other reasons for using biological moni-toring. There are over 10,000 organochlorine com-pounds in commercial use today, and it is not feasibleto analyze water samples for all of them. In addi-tion, impacts on living organisms from these com-pounds are very complex, particularly when thereare multiple compounds present. Even if chemicalanalysis identifies which compounds are present,their impact is often impossible to assess from chemi-
Siltation of gauging station, Pangani River, Tanzania
Pho
to b
y R.
Hirj
i, W
orld
Ba
nk

18
WATER RESOURCES AND ENVIRONMENT • TECHNICAL NOTE D.3
cal characterization alone. In these cases, biologi-cal monitoring provides a more useful approach.
Other organic compounds. Other classes of organiccompounds that can enter waterbodies from NPSsinclude chlorinated phenoxy acid herbicides (e.g.,2,4-D and silvex), polyaromatic hydrocarbons(PAHs), petroleum hydrocarbons, phenols, and oiland grease. Ambient water quality objectives existfor some of these classes of compounds (for example,total phenols) or individual compounds, and somelaboratory tests for these parameters are inexpen-sive (for example, total phenols or oil and grease).As with organochlorines, however, water qualityobjectives do not exist for most synthetic organiccompounds because their impacts on living thingsare not well understood. Unless a particular syn-thetic compound is (or has been) used extensivelyin an area, chemical monitoring of synthetic organicsmay be unnecessary, especially since a long-termcommitment is required to solve most NPS pollu-tion problems. Again, biological monitoring may beappropriate.
Heavy metals. Ambient water quality objectives havebeen established for heavy metals for a number ofbeneficial uses in developed countries. Water qual-ity objectives may exist to protect against acute andchronic toxicity, or just acute toxicity. Acute toxic-ity causes death of the affected organisms in a shortperiod of time. Chronic toxicity, however, may re-duce reproductive success or individual rates ofgrowth, or cause mutations or cancers that reducenormal lifespan. Biological monitoring for acute tox-icity is much simpler and less expensive than moni-toring for chronic toxicity.
BIOLOGICAL MONITORING
Monitoring the effects of pollutants on aquatic or-ganisms has both advantages and disadvantagesover chemical monitoring. Biological monitoringcomplements rather than replaces chemical moni-toring, as discussed in Note D.1.
Biological monitoring can be undertaken in threeways. First, water can be tested for the presence of
pathogens by measuring biological organisms thatare indicative of pollution sources that may con-tain pathogens. Second, selected living organismscan be tested for acute toxicity under laboratoryconditions. Third, selected living organisms canbe tested for chronic toxicity under laboratory con-ditions.
Monitoring for pathogens with indicator organisms.There is no single procedure that can be used toidentify all waterborne pathogens. Because mostpathogens are enteric (i.e. they live in the intestinaltracts of warm-blooded creatures), measurementof escheveria coli (e-coli) as an indicator of fecal con-tamination has become the most widely used testin this category. Some enteric pathogens, however,may be present even when e-coli concentrations arelow. Protozoa such as Giardia lamblia, Entamoebahystolica, and Cryptosporum, for example, repro-duce through cysts that can survive in conditionswhere e-coli cannot. There are also bacterial patho-gens that are not enteric, such as those in theLegionellacea family, that are widespread in theaquatic environment and cause pneumonia-likeoutbreaks. Pathogen monitoring must be based onthe predominant types of waterborne pathogen-re-lated illnesses in each region.
Monitoring for acute toxicity. Acute toxicity is evi-dent in indicator organisms in relatively short timeperiods, usually less than 4 days. Acute toxicity testsare usually reported as the lethal concentration (LC)required to kill 50 percent of the exposed organ-isms in a specified time of observation (e.g., 96-hourLC50). A wide variety of organisms may be tested,but the most commonly used organisms in acutetoxicity testing are fish. A wide variety of freshwa-ter and marine or estuarine fish have been used,depending on the particular receiving water of con-cern. The test species should represent an impor-tant economic resource in the receiving water, oran important ecological link in the healthy func-tioning of the aquatic ecosystem to be protected.
Monitoring for chronic toxicity. Chronic toxicity isnot as apparent as acute toxicity. Nonetheless,chronic toxicity may cause changes in appetite,
19
WATER QUALITY: NONPOINT-SOURCE POLLUTION
growth, metabolism of food, or reproductive behav-ior in fairly short periods of time for microscopicorganisms. As with acute toxicity tests, test organ-isms should be selected because of their economicimportance (for example, clams) or their ecologi-cal significance in the aquatic ecosystem to be pro-tected. For example, growth rates and populationdensities of the ciliated protozoa Tetrahymena py-
riformis can reveal chronic toxic effects within a96-hour period. Ciliated protozoa occur in fresh-water, salt marshes, and estuaries worldwide, andare important regenerators of nitrogen and phos-phorus deposited in sediments. Consequently, a re-duction in their growth rate from NPS toxicity canhave important implications for eutrophication andthe general health of a marsh.
AN INTEGRATED APPROACH TO NPS POLLUTION CONTROL
An integrated approach to NPS pollution controlincludes specific interventions and programmaticactivities. Source-control interventions prevent orreduce the production of NPS pollution; on-site treat-ment reduces off-site NPS pollution; and commu-nity-scale action controls NPS pollution before itbecomes great enough to cause significant economicor environmental problems. For example, soil ero-sion can be reduced by plowing around the con-tours of the land rather than down- and up-slope;by filter strips between the plowed area and drain-age channels on each farm; or by wetlands that trapsoil particles in runoff from a group of farms.
Programmatic activities are categorized in this sec-tion based on the scheme developed by the BalticSea Joint Comprehensive Environmental ActionProgramme. There are two major groups of activi-ties and 14 subgroups that provide structure for anoverall program, but are not all required for allprojects. Source control, on-site treatment, and off-site treatment interventions are discussed withinthe subgroups for which they are most relevant.
POLICY AND FINANCIAL MEASURES
Increase regional capacity and establish regionalobjectives. Where a particular watershed crosses ju-risdictional boundaries, it is important to develop aregional approach to managing NPS pollution fromthe watershed. In the Baltic Sea example, an im-portant step was preparation of an Annex on Agri-culture to the Helsinki Convention. The Annex is amechanism by which regional objectives for NPS
management can be defined; general guidance atthe national level can be provided; local implemen-tation can be mandated; and specific policy link-ages can be specified between agriculture and themanagement of coastal lagoons and wetlands. An-other example of regional objective-setting and im-provements to regional institutional capacity is thecreation of the Chesapeake Bay Foundation (a non-governmental organization) in the United States asa coordinator and leader of NPS pollution controlefforts for the Chesapeake Bay, which receives runofffrom a number of states.
Establish environmental indicators and monitoringpractices. As described in the last section, there aremany potential NPS pollutants, many possible moni-toring locations, and many chemical or biologicalapproaches to monitoring pollution. Developmentof an effective and efficient monitoring program isa significant technical and policy task (see Note D.1).Effective monitoring, however, is not limited to tech-nical measurements; it includes measures ofprogress in establishing a regional framework foraddressing NPS problems, and measures of com-munity involvement and satisfaction with policiesthat were mandated or recommended as best man-agement practices. The monitoring programs forrecent NPS pollution control projects in Poland andGeorgia are described in Box 6.
Mandate community participation. Many govern-mental organizations responsible for implementa-tion of regional objectives are more comfortable withand have traditionally used technocratic, top-down
20
WATER RESOURCES AND ENVIRONMENT • TECHNICAL NOTE D.3
BOX 6.MONITORING PROGRAMS IN POLAND AND GEORGIA
The Bank-sponsored Rural Environmental Protection project in Poland aims to significantly increase environ-mentally responsible agricultural practices in that country. Poland accounts for nearly half the catchment ofthe Baltic Sea; hence, nitrogen releases from agriculture are of local, national, and regional significance. At thelocal level, 16 percent of samples taken from farm wells contained nitrate concentrations in excess of recom-mended levels. Improper storage of animal wastes appears to be the main reason for nitrogen releases fromPolish agriculture. Improved storage facilities will be monitored for possible leakage via groundwater wellsadjacent to the storage facilities. Other monitoring tools include a social assessment survey of beneficiariesand other stakeholders, and a financial and economic study to assess the fiscal impacts on farmers fromadopting environmentally responsible practices.
The Bank-sponsored Agricultural Research Extension and Training project in Georgia builds on the Polishexperience. Primary components of the project are adaptive research and technology dissemination; finan-cial support for agricultural practices that reduce NPS pollution; reform of the agricultural research system; anda pilot environmental pollution control program. Indicators to be monitored include a network of ambientwater quality measurement sites; the number of farmers and farmed areas that adopt improved techniques;changes in awareness of environmental issues among farmers; the satisfaction rate of farmers; the number ofspecialists trained in design and maintenance of biogas units; and the number and type of educationalmaterials disseminated on environmentally sustainable practices.
Source: Project Appraisal Document, Rural Environmental Protection project (P06802), Poland November, 1999; Project Appraisal Docu-ment, Agricultural Research, Training and Extension project, (P08204) Georgia. January, 2000.
approaches. However, one of the lessons from Bankexperience has been that NPS projects, especiallythose in rural communities, require communityparticipation to be successful. To give these com-munities some standing in discussions about NPSmanagement, it is important to provide a govern-mental mandate, such as an official policy requir-ing their involvement.
Develop community-based approaches. Mandatedcommunity participation is a policy that provides
an opportunity for the views of citizens to be takeninto account. While providing a basis for involve-ment, it does not provide the support for commu-nity organization and participation. Communities,particularly if they have a history of powerlessness,need active encouragement to organize into userassociations or other locally governed entities thattake ownership of the NPS problem. The borrow-ing country may need to provide expert assistanceto communities, training in the use of data and otherinformation, and financial support to representa-tives who need to spend time attending meetings.However, the benefits of free, active involvementcan be considerable.
Develop codes of good practice (best managementpractices). Development of codes of good practiceor best management practices are prescriptions fordesirable management activities that are known,from either previous experience or scientific inves-tigation, to reduce the loss of pollutants from NPSsto waterways. They allow landusers to participatein control of NPS pollution without extensive wa-ter quality sampling or monitoring. For example,rice-wheat farmers on the Indo-Gangetic Plain ofIndia have reduced fertilizer use by basing appli-cation rates on soil samples analyzed for soil nutri-
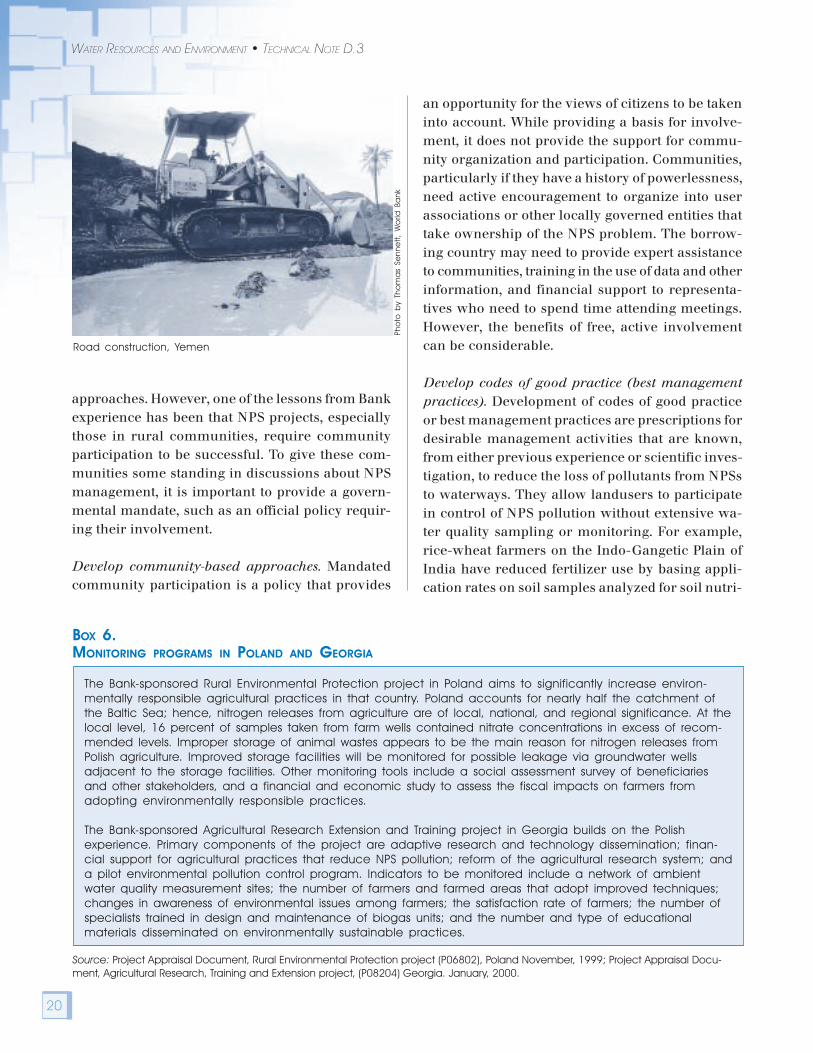
Road construction, Yemen
Pho
to b
y Th
om
as
Senn
ett,
Wo
rld B
ank
21
WATER QUALITY: NONPOINT-SOURCE POLLUTION
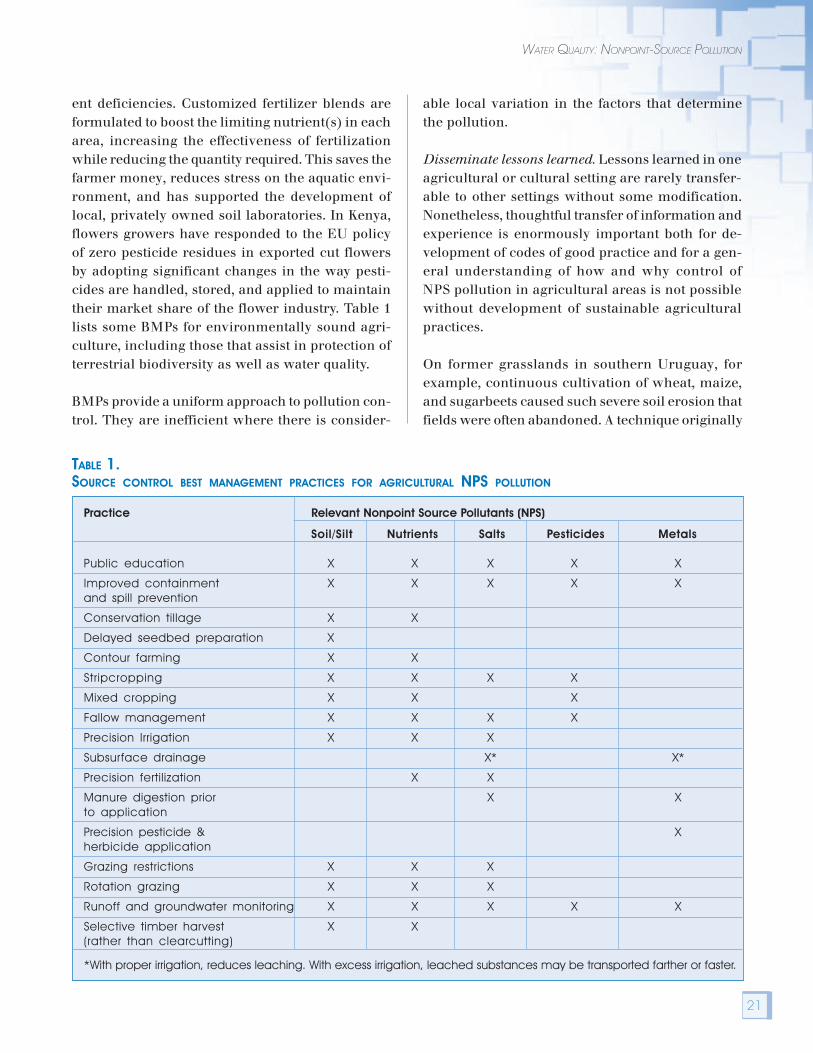
ent deficiencies. Customized fertilizer blends areformulated to boost the limiting nutrient(s) in eacharea, increasing the effectiveness of fertilizationwhile reducing the quantity required. This saves thefarmer money, reduces stress on the aquatic envi-ronment, and has supported the development oflocal, privately owned soil laboratories. In Kenya,flowers growers have responded to the EU policyof zero pesticide residues in exported cut flowersby adopting significant changes in the way pesti-cides are handled, stored, and applied to maintaintheir market share of the flower industry. Table 1lists some BMPs for environmentally sound agri-culture, including those that assist in protection ofterrestrial biodiversity as well as water quality.
BMPs provide a uniform approach to pollution con-trol. They are inefficient where there is consider-
able local variation in the factors that determinethe pollution.
Disseminate lessons learned. Lessons learned in oneagricultural or cultural setting are rarely transfer-able to other settings without some modification.Nonetheless, thoughtful transfer of information andexperience is enormously important both for de-velopment of codes of good practice and for a gen-eral understanding of how and why control ofNPS pollution in agricultural areas is not possiblewithout development of sustainable agriculturalpractices.
On former grasslands in southern Uruguay, forexample, continuous cultivation of wheat, maize,and sugarbeets caused such severe soil erosion thatfields were often abandoned. A technique originally
TABLE 1.SOURCE CONTROL BEST MANAGEMENT PRACTICES FOR AGRICULTURAL NPS POLLUTION
Practice Relevant Nonpoint Source Pollutants (NPS)
Soil/Silt Nutrients Salts Pesticides Metals
Public education X X X X X
Improved containment X X X X Xand spill prevention
Conservation tillage X X
Delayed seedbed preparation X
Contour farming X X
Stripcropping X X X X
Mixed cropping X X X
Fallow management X X X X
Precision Irrigation X X X
Subsurface drainage X* X*
Precision fertilization X X
Manure digestion prior X Xto application
Precision pesticide & Xherbicide application
Grazing restrictions X X X
Rotation grazing X X X
Runoff and groundwater monitoring X X X X X
Selective timber harvest X X(rather than clearcutting)
*With proper irrigation, reduces leaching. With excess irrigation, leached substances may be transported farther or faster.

22
WATER RESOURCES AND ENVIRONMENT • TECHNICAL NOTE D.3
developed in New Zealand—sowing with severalspecies of legumes and adding phosphate fertilizer–restored the land. Farmers mixed an inoculum ofnitrogen-fixing Rhizobium bacteria with the legumeseeds. Subsequently, dung-eating beetles, earth-worms, and other creatures that recycle nutrientseffectively were added to restored pastures. Soil-related NPS problems also were reduced by imple-menting grazing and cereal crop rotation practices.
Adopt the use of targeted incentives. The traditionalregulatory approach requires a person or businessto behave in a way that a government agency thinksis best for society. An incentive approach uses fi-nancial rewards to complement, not replace, thecompliance approach. In the United States, for ex-ample, an experimental program in the state of Illi-nois exempts farmers from property tax on landwithin 100 feet of creeks that are left in a naturalcondition. These lands serve as buffer zones betweenintensive agriculture and aquatic and riparian habi-tat, trapping pollutants and filtering runoff waterbefore it enters the creek. Farmers with large con-fined animal facilities, however, are still requiredto prepare nutrient management plans (see Box 4)under U.S. EPA regulations. Thus, the property taxincentive for buffer zones is only one componentof a more comprehensive approach that includes aregulatory component.
These incentives need to be “targeted” for two rea-sons. First, poorly targeted incentives may be inef-fective, or even perverse. The U.S. tax credit forinstallation of wind generators in the 1970s is an of-ten-cited example. Because the credit was for instal-lation, not operation, many wind generators wereinstalled but failed to operate for more than a fewyears. The desired outcome–production of electric-ity from the wind–was not targeted specificallyenough, diminishing the effectiveness of the incen-tive. Second, government cannot afford to pay for allenvironmental investments. Incentive policies shouldbe chosen deliberately to create goodwill and moti-vate people and businesses to participate in creatingsustainable land-use practices. The target of the in-centive is not just a pollutant or a behavior, but peoplewho will appreciate being rewarded for their efforts.
Environmental fees, charges, or taxes are also in-centive policies. The U.S. state of Iowa, for example,imposes a charge on all pesticides purchased inIowa, and uses revenue to support farmer educa-tion and training, agricultural research, demon-stration projects, and other activities related to lowpesticide use. Farmers have a financial incentiveto both use less pesticides and take advantage ofthe knowledge and information services providedby the state. Some other incentive policies that havebeen used to control NPS pollution are listed inTable 2.
FIELD-LEVEL ACTIVITIES
Public awareness and environmental education. Publicawareness activities increase understanding of therelationship between day-to-day actions and NPSpollution. Two examples from the Clean WaterProgram (an urban NPS pollution control program)in Alameda County, California are presented inBox 7.
Environmental education centers located adjacentto wetlands, rivers, and other natural features en-hance public awareness of the feature. Even whena staffed or enclosed center is not affordable, rela-tively simple and inexpensive educational signagecan be important. Both economic theory and prac-tical experience demonstrate that people value natu-ral features more when they find them interesting,or when they understand the long-term benefitsarising from the features.
For example, the Bank-sponsored project in Poland(Box 6) provides environmental education for se-lected farmers about the downstream impacts offarm practices, but equally importantly includeseducation on specific environmentally sound farmpractices. Effective environmental education—forexample, through field activities—increases the ca-pacity of participants to make wise choices thatbalance economic, environmental, and other con-siderations. The Bank-sponsored project in Geor-gia (Box 6) also includes public awareness andenvironmental education activities.

23
WATER QUALITY: NONPOINT-SOURCE POLLUTION
Establish networks of demonstration sites. There is nosubstitute for seeing best management practices be-ing carried out by a peer. Demonstration sites clarifydetails that can’t be explained in writing and showskeptics how systems actually work in practice.
Demonstrations can take place at different geo-graphic scales. They can be small-scale and widely
distributed so that many people have access to them.This scale of demonstration is useful after interven-tions have been proven to work under local physi-cal and cultural conditions. Demonstration sites canalso be full-scale working facilities (or villages) thathave adopted or experimented with innovative tech-niques earlier than most others, such as a farmoperated with best management practices. It is de-
TABLE 2.INCENTIVE POLICIES THAT HAVE BEEN USED TO CONTROL NPS POLLUTION
Incentive Type Recipient or Payer Example Locations
Property tax exemptions for filterstrips and buffer zones Landowner Illinois
Accelerated depreciation Investor Sixteen of the OECD Countries*
Low-interest loans Farmer United States
Grants Farmers, local government United States
Manure charges Farmer The Netherlands
Impervious surface charges Landowner Arcata, California;Olympia, Washington
Pesticide charges Farmer Iowa, Denmark, Finland,Norway, and Sweden
Fertilizer charges Farmer Norway, Sweden
*Accelerated depreciation allowed for specified types of environmental investments; investments in nonpoint source control may notqualify in some, or many, countries.
BOX 7.PUBLIC AWARENESS CAMPAIGNS
The Clean Water Program in Alameda County, California, is a consortium of 14 cities, 2 flood control districts,and the county government. The program’s purpose is to reduce urban NPS pollution entering the San Fran-cisco Bay and tributary creeks within the county. The public awareness component of the program has foundthat the most effective techniques create an unforgettable link in people’s minds between a polluting actionand something they value.
For example, surveys indicated that many people did not know that untreated stormwater runoff in theirneighborhoods enters the bay. In response to this finding, a message was spray-painted on the curb adjacentto every storm drain inlet in the county over several years (as part of routine maintenance). The message read:“Do not dump. Drains to Bay.” Simultaneously, advertisements were placed on public transit showing fish andother creatures being force-fed motor oil through a funnel, or with plastic litter stuck in their mouths, with simplemessages reminding people that storm drains are directly connected to creeks and the bay. The combinationof visual “shocks” and unavoidable and simple information near the point of pollution has significantly in-creased public awareness.
24
WATER RESOURCES AND ENVIRONMENT • TECHNICAL NOTE D.3
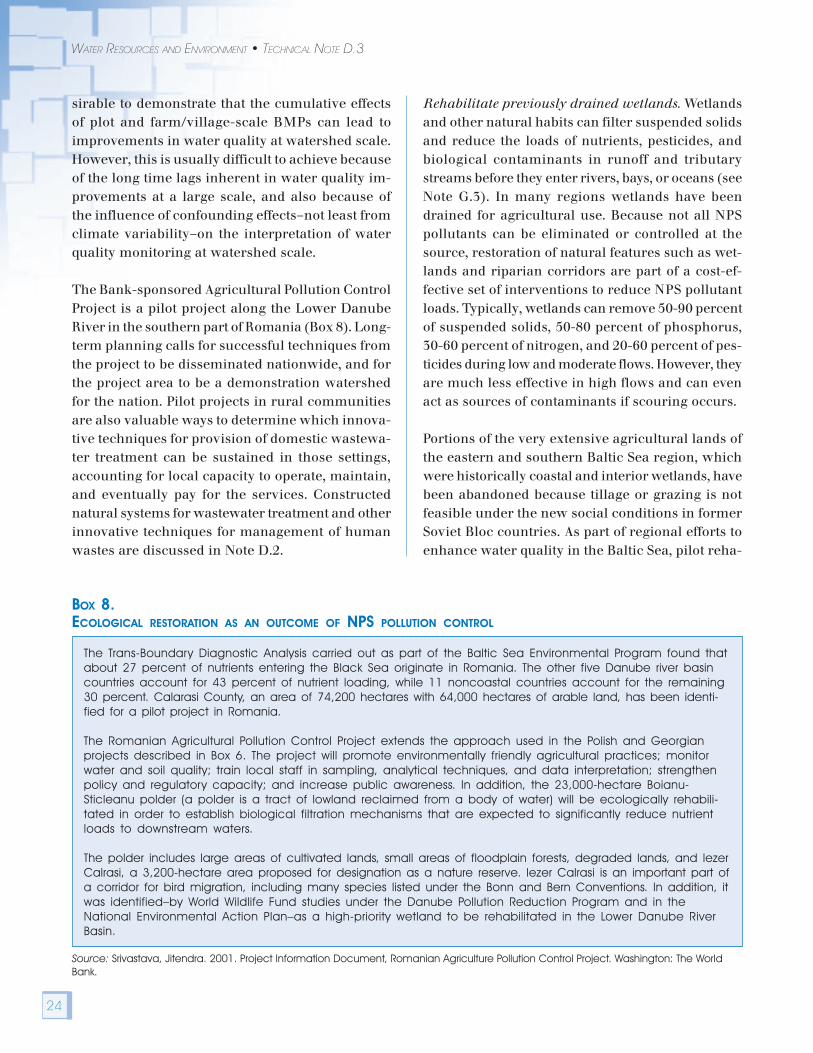
BOX 8.ECOLOGICAL RESTORATION AS AN OUTCOME OF NPS POLLUTION CONTROL
The Trans-Boundary Diagnostic Analysis carried out as part of the Baltic Sea Environmental Program found thatabout 27 percent of nutrients entering the Black Sea originate in Romania. The other five Danube river basincountries account for 43 percent of nutrient loading, while 11 noncoastal countries account for the remaining30 percent. Calarasi County, an area of 74,200 hectares with 64,000 hectares of arable land, has been identi-fied for a pilot project in Romania.
The Romanian Agricultural Pollution Control Project extends the approach used in the Polish and Georgianprojects described in Box 6. The project will promote environmentally friendly agricultural practices; monitorwater and soil quality; train local staff in sampling, analytical techniques, and data interpretation; strengthenpolicy and regulatory capacity; and increase public awareness. In addition, the 23,000-hectare Boianu-Sticleanu polder (a polder is a tract of lowland reclaimed from a body of water) will be ecologically rehabili-tated in order to establish biological filtration mechanisms that are expected to significantly reduce nutrientloads to downstream waters.
The polder includes large areas of cultivated lands, small areas of floodplain forests, degraded lands, and IezerCalrasi, a 3,200-hectare area proposed for designation as a nature reserve. Iezer Calrasi is an important part ofa corridor for bird migration, including many species listed under the Bonn and Bern Conventions. In addition, itwas identified–by World Wildlife Fund studies under the Danube Pollution Reduction Program and in theNational Environmental Action Plan–as a high-priority wetland to be rehabilitated in the Lower Danube RiverBasin.
Source: Srivastava, Jitendra. 2001. Project Information Document, Romanian Agriculture Pollution Control Project. Washington: The WorldBank.
sirable to demonstrate that the cumulative effectsof plot and farm/village-scale BMPs can lead toimprovements in water quality at watershed scale.However, this is usually difficult to achieve becauseof the long time lags inherent in water quality im-provements at a large scale, and also because ofthe influence of confounding effects–not least fromclimate variability–on the interpretation of waterquality monitoring at watershed scale.
The Bank-sponsored Agricultural Pollution ControlProject is a pilot project along the Lower DanubeRiver in the southern part of Romania (Box 8). Long-term planning calls for successful techniques fromthe project to be disseminated nationwide, and forthe project area to be a demonstration watershedfor the nation. Pilot projects in rural communitiesare also valuable ways to determine which innova-tive techniques for provision of domestic wastewa-ter treatment can be sustained in those settings,accounting for local capacity to operate, maintain,and eventually pay for the services. Constructednatural systems for wastewater treatment and otherinnovative techniques for management of humanwastes are discussed in Note D.2.
Rehabilitate previously drained wetlands. Wetlandsand other natural habits can filter suspended solidsand reduce the loads of nutrients, pesticides, andbiological contaminants in runoff and tributarystreams before they enter rivers, bays, or oceans (seeNote G.3). In many regions wetlands have beendrained for agricultural use. Because not all NPSpollutants can be eliminated or controlled at thesource, restoration of natural features such as wet-lands and riparian corridors are part of a cost-ef-fective set of interventions to reduce NPS pollutantloads. Typically, wetlands can remove 50-90 percentof suspended solids, 50-80 percent of phosphorus,30-60 percent of nitrogen, and 20-60 percent of pes-ticides during low and moderate flows. However, theyare much less effective in high flows and can evenact as sources of contaminants if scouring occurs.
Portions of the very extensive agricultural lands ofthe eastern and southern Baltic Sea region, whichwere historically coastal and interior wetlands, havebeen abandoned because tillage or grazing is notfeasible under the new social conditions in formerSoviet Bloc countries. As part of regional efforts toenhance water quality in the Baltic Sea, pilot reha-

25
WATER QUALITY: NONPOINT-SOURCE POLLUTION
bilitation projects are being discussed for some ofthese areas for flood control and water quality man-agement, nature conservation, and recreationalpurposes. Similarly, the Romanian AgriculturalPollution Control Project described in Box 8 includesrehabilitation of the Boianu-Sticleanu polder, a re-claimed floodplain near the Black Sea that is partof the target area for improved on-farm manage-ment techniques.
Install physical facilities. Implementation of BMPsmay require installation of physical facilities. Re-cent publications that present design criteria andother technical data for a wide range of NPS inter-ventions in urban and rural areas are noted in theFurther Information section.
Infrastructure is sometimes needed to supportsource control BMPs, such as those listed in Table1. Although this infrastructure can be described inprinciple, it needs to be designed for local condi-tions and determined in the field to be both cost-effective and environmentally effective. For example,the construction of on-farm holding pits for manurein Poland required high-quality, concrete lined pitsat a cost of approximately $7,000 each. This quality
of construction is necessary to protect groundwa-ter because Polish soils tend to be sandy. In heavyclay soils, however, less expensive holding pits areadequate; for example, a much less expensive (about$1,000) holding pit design has been proposed foruse in Georgia.
Common on-site treatment facilities for NPS pollu-tion are small detention or infiltration basins; fil-tration in sand beds, grass swales, vegetative strips;and buffer strips between source areas and receiv-ing waters. Off-site treatment of NPS pollutants canuse any of the techniques that are used on-site aswell as restored or constructed natural systems (Box9). Both on and off-site treatment systems oftenmimic natural processes. The primary exception isdetention basins (usually for silt removal) integratedwith flood control channels.
Energy and materials recovery from wastes. Onemeans of preventing NPS pollution in rural areasis to apply sewage sludge to fields based on an un-derstanding of their composition and impacts.Although there have been concerns about heavymetals and other industrial pollutants in sewagesludge, most sewage sludges can be made suitable
BOX 9.A CONSTRUCTED WETLAND THAT CLEANSES URBAN RUNOFF
Another component of the Clean Water Program in Alameda County, California (see Box 7) is a 55-acre freshwatermarsh that was designed to remove pollution from urban runoff before it reaches San Francisco Bay. Water from a 4.6square-mile area drains into the marsh. A Gross Pollutant Trap (GPT) collects large pieces of trash behind a series ofweirs before they can reach the main body of the marsh.
Water then flows into one of two ponds. The first is a five-acre, six-foot-deep lagoon with a central island. Incomingwater mixes with marsh water containing bacteria and other microorganisms that remove pollutants. The large surfacearea of this system provides wind exposure, which contributes to increased mixing and more effective chemical andbiological processes. The second pond is a four-acre section of shallow water averaging three feet in depth andcovered in aquatic plants. The plants take up nutrients through their roots. Bacteria in the pond sediments break downbiological matter and mediate the removal of nitrogen to the atmosphere. Sediments are trapped in the plant rootsalong with attached nutrients and other pollutants such as agrochemicals. Water from both ponds then flows through achannel before being released to a natural marsh that borders the Bay. The large surface area of this channel allowssun, soil, bacteria, and plants to provide a final removal of pollutants before discharge.
Fish and plant tissue, sediments in the marsh, and water exiting the marsh have been tested for a wide range ofchemical constituents. These tests showed that suspended solids and nutrients were removed by the marsh, and thaturban toxicants had been removed. The marsh itself remains a healthy and viable ecosystem, despite the fact thaturban runoff has been flowing through the system since the early 1980s.
Source: Countywide Clean Water Program, 1998 http://www.cleanwaterprogram.com/indexFlash.htm.

26
WATER RESOURCES AND ENVIRONMENT • TECHNICAL NOTE D.3
CONCLUSION
Nonpoint-source (diffuse) pollution differs in manyrespects from point-source pollution. The latter isusually the result of industrial processes or domes-tic activities that take place in relatively small, in-door-source areas. Conventional, centralized treat-ment of the wastewater discharge stream from suchsources is a reasonable approach to environmentalprotection, although pollution prevention should alsobe practiced. In contrast, preventing pollution fromreaching waterways through both source reductionand interception is the most reasonable approachfor most nonpoint-source pollution. Decentralizedtreatment may be justified on occasion.
Bank experience indicates that success in manag-ing NPS pollution involves partnerships, long-term
commitments, and integration and linkages withsectors and activities other than just those that pro-duce NPS pollution. Reducing and controllingnonpoint source pollution from farming, for ex-ample, may require that conventional farming prac-tices be replaced with new practices such as bufferstrips along streams or that a levy is introduced todiscourage pesticide use. Dramatic changes in farm-ing practices, however, are not possible withoutchanges in other sectors of society–for example,food and water policies and practices. Such wide-spread social change is possible, but achieving itwill require partnerships and long-term commit-ments among the many stakeholders in a countryor region.
for application to agricultural or grazing land bycontrolling the ingress of industrial pollutants intourban wastewater (see Note D.2). Sludges that sat-isfy the U.S. standards are suitable for land appli-cation in temperate climates.
Digestion of manure prior to land application bio-logically stabilizes the manure, reducing the po-tential for nutrient losses to waterways. The energyproduced during the microbial decomposition canalso be tapped for local use. Although this form ofenergy production cannot compete against cur-
rent market prices for energy in developed coun-tries, it can still be viable in developing countrieswhere centralized power sources are not available.In fact, inclusion of off-farm environmental ben-efits often shows that digestion has greater eco-nomic benefits than costs. Financial incentives thatreflect these off-farm benefits may be warrantedwhen nutrient pollution is severe. The Georgianproject presented in Box 6 includes on-farm dem-onstration of the use of manure digestion to pro-vide biogas for cooking and other domesticpurposes.

27
WATER QUALITY: NONPOINT-SOURCE POLLUTION
FURTHER INFORMATION
The following references provides information oncosting water quality management:
Russell C.S., W.J. Vaughan, C.D. Clark, D.J. Rodriguez,and A.H. Darling. 2001. Investing in WaterQuality: Measuring Benefits, Costs and Risks.Washington, D.C.: Inter-American DevelopmentBank.
Norse, D., and R. Saigal. 1993. “National economic costof soil erosion in Zimbabwe,” in EnvironmentalEconomics and Natural Resources Managementin Developing Countries. Washington, D.C.:CIDIE/ World Bank.
The following references provide information onpractices that reduce NPS pollution:
Food and Agriculture Organization of the United Nations(FAO). 1993. Prevention of water pollution byagriculture and related activities. Water reportNo. 1. Rome: FAO.
Novotny, V. and H. Olem. 1993. Water Quality: Preven-tion, Identification and Management of DiffusePollution. New York: John Wiley & Sons.
Stukenberg, J. R., S. Carr, L. W. Jacobs, and S. Bohm. 1993.Document long-term experience of biosolids landapplication programs. Alexandria, Virginia: Wa-ter Environment Research Foundation.
Srivastava, J. P., N. J. H. Smith, D. A. Forno. 1999. Inte-grating biodiversity in agricultural intensification.Washington: World Bank.
Schillhorn van Veen, T. W., D. A. Forno, S. Joffe, D. L.Umali-Deninger, and S. Cooke. 1997. Integratedpest management. Environmentally sustainabledevelopment studies and monographs series no.13. Washington: World Bank.
NPS pollution can be treated via wetlands and en-gineering solutions as described in:
Water Environment Federation (WEF). 1998. Urban run-off quality management. Manual of practice 23.Arlington, Virginia: WEF.
Water Environment Federation (WEF). 1999. Evaluatingthe use of constructed wetlands in urban areas.Arlington, Virginia: WEF.