echocardiography making sense
DESCRIPTION
ecocardiografie in practicaTRANSCRIPT

MAKING SENSE of
ECHOCARDIOGRAPHY

This page intentionally left blank

MAKING SENSE of
ECHOCARDIOGRAPHYA HANDS-ON GUIDE
Andrew R. HoughtonMA(Oxon) DM FRCP(Lond) FRCP(Glasg)Consultant CardiologistGrantham and District HospitalGrantham, UKandVisiting Fellow, University of Lincoln,Lincoln, UK

First published in Great Britain in 2009 byHodder Arnold, an imprint of Hodder Education,an Hachette UK company, 338 Euston Road, London NW1 3BH
http://www.hoddereducation.com
© 2009 Andrew R Houghton
All rights reserved. Apart from any use permitted under UK copyright law, thispublication may only be reproduced, stored or transmitted, in any form, or by anymeans with prior permission in writing of the publishers or in the case ofreprographic production in accordance with the terms of licences issued by theCopyright Licensing Agency. In the United Kingdom such licences are issued by theCopyright licensing Agency: Saffron House, 6-10 Kirby Street, London EC1N 8TS.
Whilst the advice and information in this book are believed to be true and accurateat the date of going to press, neither the author[s] nor the publisher can accept anylegal responsibility or liability for any errors or omissions that may be made. Inparticular, (but without limiting the generality of the preceding disclaimer) everyeffort has been made to check drug dosages; however it is still possible that errorshave been missed. Furthermore, dosage schedules are constantly being revised andnew side-effects recognized. For these reasons the reader is strongly urged toconsult the drug companies’ printed instructions before administering any of thedrugs recommended in this book.
British Library Cataloguing in Publication DataA catalogue record for this book is available from the British Library
Library of Congress Cataloging-in-Publication DataA catalog record for this book is available from the Library of Congress
ISBN-13 978 0 340 950 043
1 2 3 4 5 6 7 8 9 10
Commissioning Editor: Philip ShawProject Editor: Amy MulickProduction Controller: Karen TateCover Design: Helen Townson and Laura De Grasse
Typeset in 10/11 Chaparra MM250LT by Macmillan Publishing Solutions, Chennai, IndiaPrinted and bound in India
What do you think about this book? Or any other Hodder Arnold title?Please visit our website: www.hoddereducation.com

This book is dedicated to the memory of Paul Michael Houghton(1952–2002).
Foreword viiiPreface xAcknowledgements xiAbbreviations xii
PART 1: ESSENTIAL PRINCIPLES1 History of echocardiography 32 Cardiac anatomy and physiology 63 Physics and instrumentation 164 Doppler physics 315 Service provision 44
PART 2: CARDIAC IMAGING TECHNIQUES6 The transthoracic echo study 517 The transoesophageal echo study 728 The stress echo study 819 Advanced echo techniques 93
10 Alternative cardiac imaging techniques 102
PART 3: CLINICAL CASES11 The left heart and its function 11112 Coronary artery disease and regional left
ventricular function 14113 The aortic valve 14914 The mitral valve 16815 The right heart 19116 Heart valve repair and replacement 222
vi
Contents
vii
17 Endocarditis 23418 The cardiomyopathies 24319 The pericardium 25820 The aorta 27021 Cardiac masses 28222 Congenital heart disease 29323 Common echo requests 312
Appendix 1 Echo resources 323Appendix 2 Help with the next edition 327Index 329
FIGURE AND VIDEO LIBRARYThis book has a companion website available at: www.hodderplus.com/msecho
The website contains downloadable figures and video versions of many ofthe figures in this book, as well as supplementary clips providing furtherexamples.
To access the video clips included on the website, please register on thewebsite using the following access details:
Serial number: 892js92kd9dk

viii
Foreword
Echocardiography underpins much of contemporary cardiology practice; far more echocardiograms are performed than coronary angiograms,myocardial perfusion studies or cardiac MR scans. Their unique simplicityand mobility lend themselves to emergency imaging in coronary care units,accident and emergency departments and cardiac catheterization laboratories,but contemporary echocardiography involves much more than rapid 2-dimensional imaging of the cardiac chambers and a quick look for valvepathology. Technology is evolving rapidly and the development oftechniques such as harmonic imaging, tissue Doppler, speckle tracking andreal time 3-dimensional imaging have expanded the role of echo to includesophisticated analysis of myocardial mechanics, the assessment of complexvalvular pathology and guidance for the placement of intracardiac devicesand other interventions.
With improved image quality has come an improved ability to quantifyabnormalities. Gone are the days when the assessment of left ventricularfunction was limited to an eyeball estimate of ejection fraction. Measurementof left ventricular volumes and estimation of left atrial pressures are nowperformed routinely. Valvular stenosis and regurgitation may be quantifiedin the majority of patients and decisions made about reparability of valvesor suitability for percutaneous interventions. Quantification demandsrigorous standardization of technique and the adoption of accepted normaland pathological ranges. Making Sense of Echocardiography incorporates thereference ranges adopted by the British Society of Echocardiography andprovides practical examples of how qualitative and quantitative data can becombined in an echo report.
The expanding role of echocardiography has provided new challenges forthe echocardiographer. It has always been a subject requiring both soundtheoretical knowledge and extensive practical experience, but this is evenmore the case as echo imaging becomes ever more sophisticated. More

ix
theoretical concepts need to be grasped and more techniques practiced.Echocardiographers need to understand which techniques to employ in agiven clinical situation and how to interpret the resulting data to providemeaningful information for a clinician who cannot interpret the imagesthemselves. This requires the ability to synthesize complex and sometimesconflicting information. Few echocardiographers are experts in allmodalities and even the most experienced require occasional recourse to areference text.
Most echocardiography books are either basic practical guides to scanningand reporting or lengthy and detailed reference texts. Excellent examples ofboth are mentioned in Appendix 1. Making Sense of Echocardiography differsin that it sets out to provide both a practical guide to routine scanning andsufficient detail to function as a first line reference text for the moreexperienced echocardiographer. Dr Houghton has succeeded in writing abook that fulfils these aims with clarity and simplicity and one that deservesa place in every echo reporting room.
Dr Simon RayPresident, British Society of Echocardiography
2009
x
Preface
Echocardiography is one of the most useful cardiac investigations – it issafe, painless, non-invasive, relatively inexpensive and provides keydiagnostic information across a wide range of conditions. It does, however,require a high level of knowledge and experience – sonographers need agood understanding of ultrasound physics, anatomy, physiology and clinicalcardiology, and need to undertake a substantial number of echo studies inorder to attain (and maintain) their skills.
The aim of Making Sense of Echocardiography is to provide the echo traineewith a comprehensive yet readable introduction to echo, and to providemore experienced sonographers with an accessible handbook for referencewhen required. The approach to echo studies taken in this book is based onthe guidelines published by national echo societies, in particular the BritishSociety of Echocardiography (BSE), and I am particularly grateful to the BSEand the British Heart Foundation for their permission to use theirrecommended reference ranges throughout the book.
A good knowledge of clinical cardiology is important to appreciate the keyfeatures that need to be assessed in a particular echo study – for instance,knowing the indications for valve surgery makes it easier to know whatinformation the referring clinician will want to see in an echo report on anabnormal valve. For this reason, the clinical aspects of disease managementare interwoven with the information on how to perform echo studiesthroughout this book.
I am grateful to everyone who has taken the time to comment on draftcopies of the text and to all those who have provided echo images for thisbook. Finally, I would like to thank all of the staff at Hodder Arnold whohave contributed to the success of the Making Sense . . . series of books.
Andrew R. Houghton
2009

xi
Acknowledgements
I would like to thank everyone who provided suggestions and constructivecriticism while I prepared Making Sense of Echocardiography. I am particularlygrateful to Stephanie Baker, Lawrence Green, Daniel Law and Cara Mercerfor their invaluable help in the preparation of this book and for theircomments on draft copies of the text.
I would also like to thank the following for assisting me in acquiring theimages that illustrate this book:Mookhter Ajij Lisa McAdamDenise Archer Jane RobinsonHannah Clark Nimit ShahNigel Dewey Upul WijayawardhanaJeffrey Khoo Bernadette WilliamsonDiane Lunn
I am indebted to the British Society of Echocardiography (BSE) and theBritish Heart Foundation (BHF) for their permission to quote theirrecommended echo reference ranges which, where applicable, form thebasis of the reference ranges used in this book. Further details of theBSE/BHF reference ranges can be found at the end of the book (see ‘Echoresources’).
I am also grateful to Philips for allowing me to reproduce echo images fromits clinical image collection, and to the BMJ Publishing Group and toElsevier for permission to reproduce images from their journals.
I would also like to thank my wife, Kathryn Ann Houghton, for her supportand patience during the preparation of this book.
Finally, I would also like to express my gratitude to everyone at HodderArnold for their guidance and support.

2-D two-dimensional
3-D three-dimensional
A peak A-wave velocity
ACE angiotensin-converting enzyme
Adur duration of atrial reversal in pulmonary vein flow
Adur duration of A wave in left ventricular inflow
AF atrial fibrillation
Am atrial contraction velocity on tissue Doppler imaging of mitral annulus (also known as A�)
Ao aorta
AR aortic regurgitation
ARVC arrhythmogenic right ventricular cardiomyopathy
AS aortic stenosis
ASD atrial septal defect
ASE American Society of Echocardiography
AV aortic valve or atrioventricular
BSA body surface area
BCS British Cardiovascular Society
BHF British Heart Foundation
BSE British Society of Echocardiography
CI cardiac index
CO cardiac output
CRT cardiac resynchronization therapy
CSA cross-sectional area
CW continuous wave (Doppler)
xii
Abbreviations
xiii
Cx circumflex (coronary) artery
DCM dilated cardiomyopathy
E peak E-wave velocity
EAE European Association of Echocardiography
ECG electrocardiogram
EF ejection fraction
Em early myocardial velocity on tissue Doppler imaging of mitral annulus (also known as E�)
EDV end-diastolic volume
ESC European Society of Cardiology
ESV end-systolic volume
ET ejection time
FS fractional shortening
HCM hypertrophic cardiomyopathy
HFPEF heart failure with preserved ejection fraction
HFREF heart failure with reduced ejection fraction
HID half-intensity depth
HOCM hypertrophic obstructive cardiomyopathy
HR heart rate
ICD implantable cardioverter defibrillator
ICT isovolumic contraction time
INR international normalized ratio
IRT or IVRT isovolumic relaxation time
IV intravenous
IVC inferior vena cava
IVNC isolated ventricular non-compaction
IVS interventricular septum
IVSd interventricular septal wall dimension – diastole
IVSs interventricular septal wall dimension – systole
JVP jugular venous pressure
LA left atrium
LAA left atrial appendage

xiv
LAD left anterior descending (coronary artery)
LCA left coronary artery
LCC left coronary cusp
LLPV left lower pulmonary vein
LMS left main stem
LUPV left upper pulmonary vein
LV left ventricle
LVEDV left ventricular end-diastolic volume
LVEF left ventricular ejection fraction
LVESV left ventricular end-systolic volume
LVH left ventricular hypertrophy
LVIDd left ventricular internal dimension – diastole
LVIDs left ventricular internal dimension – systole
LVOT left ventricular outflow tract
LVPW left ventricular posterior wall
LVPWd left ventricular posterior wall dimension – diastole
LVPWs left ventricular posterior wall dimension – systole
MI mechanical index or myocardial infarction
MR mitral regurgitation
MS mitral stenosis
MV mitral valve
NCC non-coronary cusp
NSTEMI non-ST elevation myocardial infarction
OM obtuse marginal (coronary artery)
P1⁄2T pressure half-time
Pmax peak pressure
Pmean mean pressure
PA pulmonary artery
PADP pulmonary artery diastolic pressure
PASP pulmonary artery systolic pressure
PBMV percutaneous balloon mitral valvuloplasty
PDA persistent ductus arteriosus or posterior descending artery
xv
PFO patent foramen ovale
PG pressure gradient
PISA proximal isovelocity surface area
PR pulmonary regurgitation
PRF pulse repetition frequency
PS pulmonary stenosis
PV pulmonary valve or pulmonary vein
PVa peak atrial reversal (‘A’ wave) velocity in pulmonary vein
PVD peak diastolic (‘D’ wave) velocity in pulmonary vein
PVS peak systolic (‘S’ wave) velocity in pulmonary vein
PW pulsed-wave (Doppler)
RA right atrium
RAP right atrial pressure
RCA right coronary artery
RF regurgitant fraction
RLPV right lower pulmonary vein
RUPV right upper pulmonary vein
RVDP right ventricular diastolic pressure
RVSP right ventricular systolic pressure
RV regurgitant volume or right ventricle
RVOT right ventricular outflow tract
SD stroke distance
SV stroke volume
STEMI ST elevation myocardial infarction
SVC superior vena cava
SVI stroke volume index
TAVI transcatheter aortic valve implantation
TDI tissue Doppler imaging
TGC time-gain compensation
TIA transient ischaemic attack
TOE transoesophageal echo
ToF tetralogy of Fallot
xvi
TR tricuspid regurgitation
TS tricuspid stenosis
TTE transthoracic echo
Vmax peak velocity
Vmean mean velocity
VSD ventricular septal defect
VTI velocity time integral
WHO World Health Organization

Essential Principles
1PART

This page intentionally left blank
3
History ofechocardiography
The first application of diagnostic ultrasound in medicine was in the late1930s, when Karl Dussik, an Austrian psychiatrist and neurologist, becameinterested in the potential use of ultrasound for brain imaging. Ultrasoundwas already in use at that time, by mariners for underwater imaging and alsoby engineers for flaw detection in metals. The piezoelectric effect wasalready well known, having been discovered more than half a centuryearlier, and the concept of using a piezoelectric crystal both to transmit andreceive ultrasound was described in 1917.
Dussik’s brain imaging technique was different to today’s ultrasound, inthat it was based on the transmission of ultrasound waves through an object,rather than detecting waves reflected from an object. His technique, which,he called hyperphonography, involved placing a transmitter on one side ofthe head and a receiver on the other, and using this apparatus he was able toproduce images of the ventricles of the brain. Echotransmission was alsothe first ultrasound technique used for cardiac imaging, by the Germanphysiologist Wolf-Dieter Keidel, in order to make measurements of theheart and thorax.
Echoreflection was first used by Inge Edler and Carl Hellmuth Hertz inSweden. One weekend in 1953 they borrowed an industrial device, used todetect flaws in metals by the Kockum shipyard in Malmö, to conduct theirwork on human subjects. By a fortunate coincidence the frequency of theecho transducer happened to be one that was suitable for cardiac imaging.The image of the heart they produced was known as an A-mode scan and
1
was thought to show the posterior wall of the left ventricle (LV). They weresoon granted an ultrasound machine of their own and began to produce M-mode scans, with which they were able to examine the mitral valve andalso detect atrial thrombus, myxoma and pericardial effusion.
Nonetheless, it was not until the early 1960s that the potential value ofcardiac ultrasound became more widely recognized. The first dedicatedcardiac ultrasound machine, developed by Jack Reed and Claude Joyner,appeared at this time and the term ‘echocardiography’ was coined for thefirst time.
Real-time 2-D echo followed in the 1960s, spurred on by advances inelectronics, and by the early 1970s mechanical transducers were availablethat could produce 2-D images by steering the transducer back and forth,sweeping the ultrasound beam across the heart. Phased-array transducerssoon followed, in which the mechanical beam-steering mechanism wasreplaced by solid-state electronics.
The 1970s also saw rapid developments in the use of Doppler techniquesand by the early 1980s colour Doppler imaging was becoming a commonfeature of echo studies. During the 1980s, the technique of transoesophagealecho started to enter clinical practice, initially with monoplane probes butlater with biplane probes, multiplane probes and, more recently, the use of3-D transoesophageal imaging.
The 1990s saw a gradual change in archiving methods, with a move awayfrom recording studies on videotape towards more versatile digitally basedarchiving. There were also refinements in the quality of echo, with theintroduction of harmonic imaging and the growing use of echo contrastagents to enhance endocardial border definition. Tissue Doppler imagingentered mainstream practice towards the end of the 1990s, adding a newmodality that has proven particularly valuable in the assessment of LVdiastolic function.
Continuing technological advances are making echo more widely accessible,with small and highly portable echo machines now available thatnevertheless offer a wide range of imaging modalities. The growing use ofecho has reinforced the need for professional regulation, and the past fewyears have seen the publication of many key national and internationalguidelines that set clear quality standards for the performance of echo in thetwenty-first century.
PART
1: E
SSEN
TIA
L PR
INC
IPLE
S
4

His
tory
of e
choc
ard
iog
rap
hy
5
FURTHER READING
An excellent and detailed overview of the history of medicalultrasound can be accessed at: www.ob-ultrasound.net/history.html
Coman IM. Christian Andreas Doppler – the man and his legacy.Eur J Echocardiogr 2005; 6: 7–10.
Edler I, Hertz CH. The use of ultrasonic reflectoscope for thecontinuous recording of the movement of heart walls. KunglFysiografiska Sällskapets i Lund Förhandlingar 1954; 24: 40–58.
Fraser AG. Inge Edler and the origins of clinical echocardiography.Eur J Echocardiogr 2001; 2: 3–5.
Roelandt JRTC. Seeing the invisible: A short history of cardiacultrasound. Eur J Echocardiogr 2000; 1: 8–11.
6
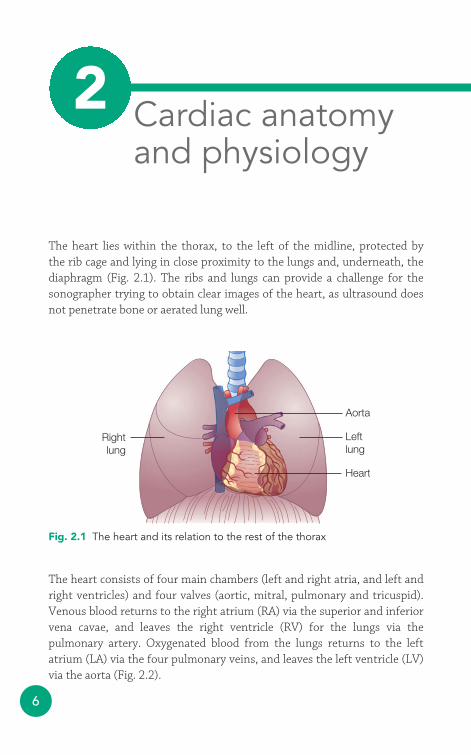
The heart lies within the thorax, to the left of the midline, protected by the rib cage and lying in close proximity to the lungs and, underneath, thediaphragm (Fig. 2.1). The ribs and lungs can provide a challenge for thesonographer trying to obtain clear images of the heart, as ultrasound doesnot penetrate bone or aerated lung well.
Aorta
Leftlung
Rightlung
Heart
Fig. 2.1 The heart and its relation to the rest of the thorax
Cardiac anatomyand physiology
2
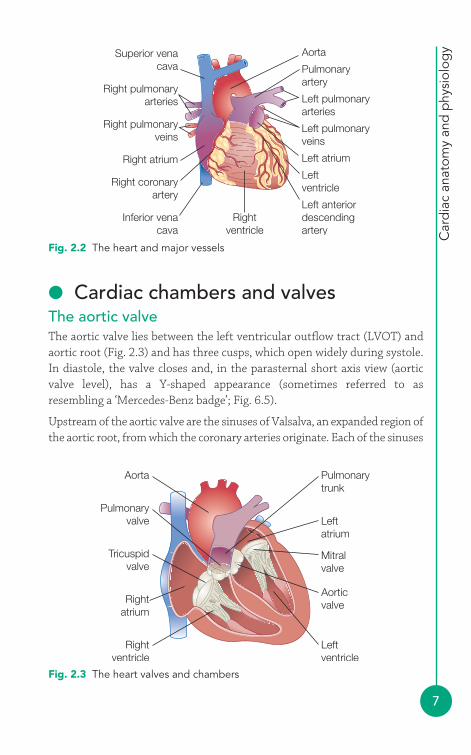
The heart consists of four main chambers (left and right atria, and left andright ventricles) and four valves (aortic, mitral, pulmonary and tricuspid).Venous blood returns to the right atrium (RA) via the superior and inferiorvena cavae, and leaves the right ventricle (RV) for the lungs via thepulmonary artery. Oxygenated blood from the lungs returns to the leftatrium (LA) via the four pulmonary veins, and leaves the left ventricle (LV)via the aorta (Fig. 2.2).
Car
dia
c an
atom
y an
d p
hysi
olog
y
7
● Cardiac chambers and valvesThe aortic valveThe aortic valve lies between the left ventricular outflow tract (LVOT) andaortic root (Fig. 2.3) and has three cusps, which open widely during systole.In diastole, the valve closes and, in the parasternal short axis view (aorticvalve level), has a Y-shaped appearance (sometimes referred to asresembling a ‘Mercedes-Benz badge’; Fig. 6.5).
Upstream of the aortic valve are the sinuses of Valsalva, an expanded region ofthe aortic root, from which the coronary arteries originate. Each of the sinuses
AortaSuperior venacava Pulmonary
artery
Left pulmonaryarteries
Right pulmonaryarteries
Right pulmonaryveins
Left pulmonaryveins
Left atriumRight atrium
Right coronaryartery
Rightventricle
Inferior venacava
Left anteriordescendingartery
Leftventricle
Fig. 2.2 The heart and major vessels
Pulmonarytrunk
Pulmonaryvalve
Tricuspidvalve
Aorta
Leftatrium
Rightatrium
Mitralvalve
Leftventricle
Rightventricle
Aorticvalve
Fig. 2.3 The heart valves and chambers
PART
1: E
SSEN
TIA
L PR
INC
IPLE
S
8
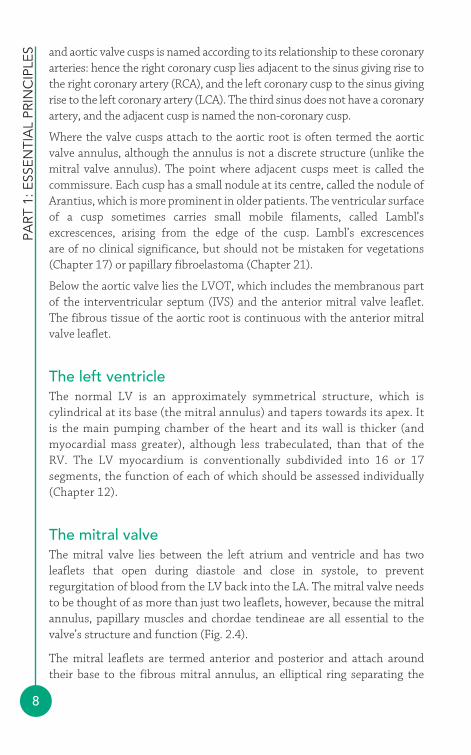
and aortic valve cusps is named according to its relationship to these coronaryarteries: hence the right coronary cusp lies adjacent to the sinus giving rise tothe right coronary artery (RCA), and the left coronary cusp to the sinus givingrise to the left coronary artery (LCA). The third sinus does not have a coronaryartery, and the adjacent cusp is named the non-coronary cusp.
Where the valve cusps attach to the aortic root is often termed the aorticvalve annulus, although the annulus is not a discrete structure (unlike themitral valve annulus). The point where adjacent cusps meet is called thecommissure. Each cusp has a small nodule at its centre, called the nodule ofArantius, which is more prominent in older patients. The ventricular surfaceof a cusp sometimes carries small mobile filaments, called Lambl’sexcrescences, arising from the edge of the cusp. Lambl’s excrescences are of no clinical significance, but should not be mistaken for vegetations (Chapter 17) or papillary fibroelastoma (Chapter 21).
Below the aortic valve lies the LVOT, which includes the membranous partof the interventricular septum (IVS) and the anterior mitral valve leaflet.The fibrous tissue of the aortic root is continuous with the anterior mitralvalve leaflet.
The left ventricleThe normal LV is an approximately symmetrical structure, which is cylindrical at its base (the mitral annulus) and tapers towards its apex. Itis the main pumping chamber of the heart and its wall is thicker (andmyocardial mass greater), although less trabeculated, than that of theRV. The LV myocardium is conventionally subdivided into 16 or 17segments, the function of each of which should be assessed individually(Chapter 12).
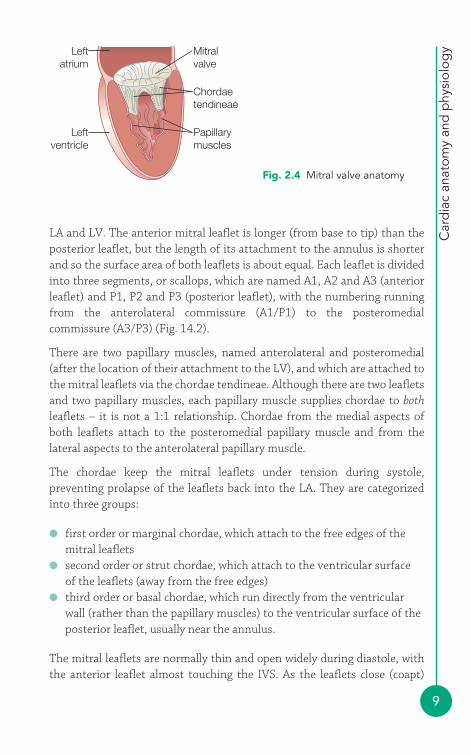
The mitral valveThe mitral valve lies between the left atrium and ventricle and has twoleaflets that open during diastole and close in systole, to preventregurgitation of blood from the LV back into the LA. The mitral valve needsto be thought of as more than just two leaflets, however, because the mitralannulus, papillary muscles and chordae tendineae are all essential to thevalve’s structure and function (Fig. 2.4).
The mitral leaflets are termed anterior and posterior and attach aroundtheir base to the fibrous mitral annulus, an elliptical ring separating the
Car
dia
c an
atom
y an
d p
hysi
olog
y
9
LA and LV. The anterior mitral leaflet is longer (from base to tip) than theposterior leaflet, but the length of its attachment to the annulus is shorterand so the surface area of both leaflets is about equal. Each leaflet is dividedinto three segments, or scallops, which are named A1, A2 and A3 (anteriorleaflet) and P1, P2 and P3 (posterior leaflet), with the numbering runningfrom the anterolateral commissure (A1/P1) to the posteromedialcommissure (A3/P3) (Fig. 14.2).
There are two papillary muscles, named anterolateral and posteromedial(after the location of their attachment to the LV), and which are attached tothe mitral leaflets via the chordae tendineae. Although there are two leafletsand two papillary muscles, each papillary muscle supplies chordae to bothleaflets – it is not a 1:1 relationship. Chordae from the medial aspects ofboth leaflets attach to the posteromedial papillary muscle and from thelateral aspects to the anterolateral papillary muscle.
The chordae keep the mitral leaflets under tension during systole,preventing prolapse of the leaflets back into the LA. They are categorizedinto three groups:
● first order or marginal chordae, which attach to the free edges of themitral leaflets
● second order or strut chordae, which attach to the ventricular surface of the leaflets (away from the free edges)
● third order or basal chordae, which run directly from the ventricularwall (rather than the papillary muscles) to the ventricular surface of theposterior leaflet, usually near the annulus.
The mitral leaflets are normally thin and open widely during diastole, withthe anterior leaflet almost touching the IVS. As the leaflets close (coapt)
Mitralvalve
Leftatrium
Leftventricle
Chordaetendineae
Papillarymuscles
Fig. 2.4 Mitral valve anatomy
PART
1: E
SSEN
TIA
L PR
INC
IPLE
S
10
they overlap at their tips by several millimetres (apposition). A reduceddegree of apposition results in poor coaptation and can cause mitralregurgitation.
The left atriumThe LA is situated at the back of the heart, in front of the oesophagus (and it istherefore the chamber immediately adjacent to the probe in the mid-oesophageal transoesophageal echo view). The LA is a relatively smooth-walledstructure, but does have an appendage which can act as a focus for thrombusformation. It is entered by four pulmonary veins carrying oxygenated bloodfrom the lungs – two from the right lung and two from the left.
The LA is not just a passive conduit between the pulmonary veins and theLV, but contracts during atrial systole (immediately after the onset of the P wave) to provide additional diastolic filling of the LV (the ‘atrial kick’). Thisis particularly important when diastolic filling is impaired, in the presence ofelevated LV filling pressures.
The LA is separated from the RA by the interatrial septum, but there can bea communication between the two in the form of a patent foramen ovale oratrial septal defect (ASD) (Chapter 22).
The pulmonary valveThe pulmonary valve lies between the right ventricular outflow tract(RVOT) and pulmonary artery, opening during systole to allow blood to passfrom the ventricle into the pulmonary circulation, and closing in diastole toprevent regurgitation (a small amount of ‘physiological’ pulmonaryregurgitation is normal). The valve itself is structurally similar to the aorticvalve, having three cusps (called anterior, left and right).
The right ventricleThe RV is more complex to assess by echo than the left, forming a crescent-shaped structure around the LV. It is more heavily trabeculated, butthinner-walled than the LV, and contains a moderator band that stretchesbetween the free wall and the septum. The RVOT is not trabeculated andleads to the pulmonary valve. The RV acts as the pumping chamber fordeoxygenated blood returning from the body en route to the lungs.
Car
dia
c an
atom
y an
d p
hysi
olog
y
11
The tricuspid valveThe tricuspid valve lies between the RA and RV, opening during diastole toallow blood to pass from the atrium to the ventricle, and closing in systoleto prevent regurgitation (although a small amount of ‘physiological’tricuspid regurgitation is commonly seen in normal individuals).
As its name suggests, the tricuspid valve has three cusps – in order ofdecreasing size, these are called the anterior, posterior and septal cusps.There are also three papillary muscles, which, in a similar way to the mitralvalve, are attached to the cusps via chordae tendineae. The orifice area ofthe tricuspid valve is greater than that of the mitral valve, normally�7.0 cm2.
The right atriumThe RA receives blood returning to the heart via the superior and inferiorvena cavae. It also receives blood draining from the myocardium via thecoronary sinus, which enters the RA posteriorly, just superior to thetricuspid valve. The coronary sinus is often visible on echo, particularlywhen it is dilated (Fig. 21.4).
The Eustachian valve, an embryological remnant, may be seen in the RAnear the junction with the inferior vena cava.
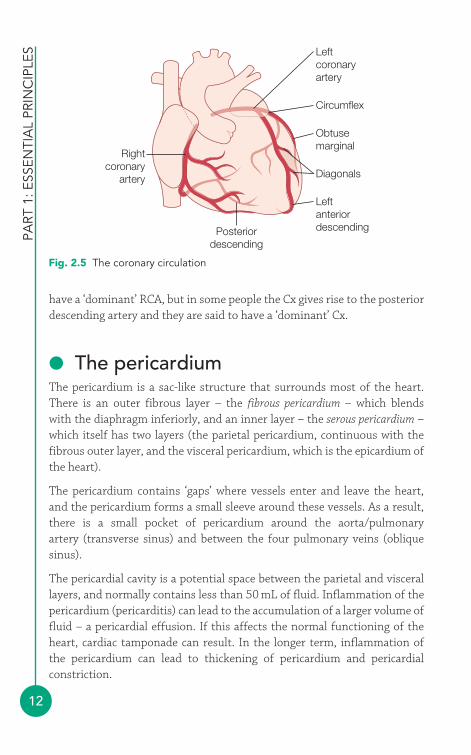
● The coronary arteriesThe coronary circulation normally arises as two separate vessels from thesinuses of Valsalva – the LCA from the left coronary sinus, and the RCAfrom the right coronary sinus (Fig. 2.5).
The initial portion of the LCA is the left main stem, which soon divides intothe left anterior descending (LAD) and circumflex (Cx) arteries. The LADartery runs down the anterior interventricular groove giving rise to diagonalbranches, which course towards the lateral wall of the LV, and septalperforators that supply the IVS. The Cx artery runs in the leftatrioventricular groove, giving rise to obtuse marginal branches whichextend across the lateral surface of the LV.
The RCA runs in the right atrioventricular groove, and in most people givesrise to the posterior descending artery which runs down the posteriorinterventricular groove. This defines ‘dominance’ – most people therefore
PART
1: E
SSEN
TIA
L PR
INC
IPLE
S
12
have a ‘dominant’ RCA, but in some people the Cx gives rise to the posteriordescending artery and they are said to have a ‘dominant’ Cx.
● The pericardiumThe pericardium is a sac-like structure that surrounds most of the heart.There is an outer fibrous layer – the fibrous pericardium – which blends with the diaphragm inferiorly, and an inner layer – the serous pericardium –which itself has two layers (the parietal pericardium, continuous with thefibrous outer layer, and the visceral pericardium, which is the epicardium ofthe heart).
The pericardium contains ‘gaps’ where vessels enter and leave the heart, and the pericardium forms a small sleeve around these vessels. As a result,there is a small pocket of pericardium around the aorta/pulmonary artery (transverse sinus) and between the four pulmonary veins (oblique sinus).
The pericardial cavity is a potential space between the parietal and viscerallayers, and normally contains less than 50 mL of fluid. Inflammation of thepericardium (pericarditis) can lead to the accumulation of a larger volume offluid – a pericardial effusion. If this affects the normal functioning of theheart, cardiac tamponade can result. In the longer term, inflammation ofthe pericardium can lead to thickening of pericardium and pericardialconstriction.
Leftcoronaryartery
Circumflex
Obtusemarginal
Diagonals
LeftanteriordescendingPosterior
descending
Rightcoronary
artery
Fig. 2.5 The coronary circulation
Car
dia
c an
atom
y an
d p
hysi
olog
y
13
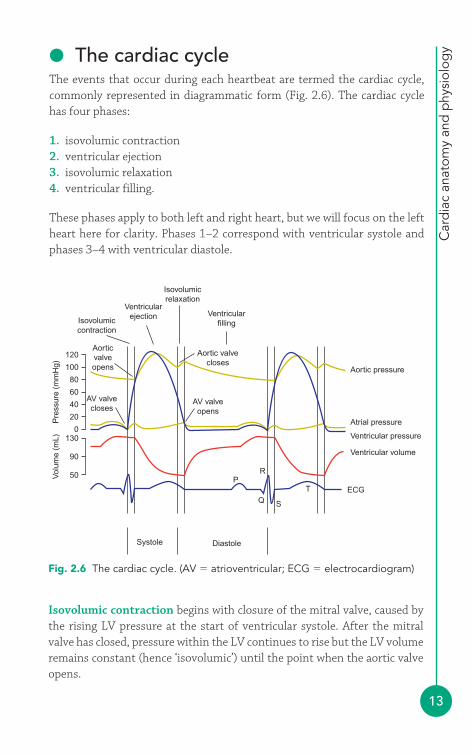
● The cardiac cycleThe events that occur during each heartbeat are termed the cardiac cycle,commonly represented in diagrammatic form (Fig. 2.6). The cardiac cyclehas four phases:
1. isovolumic contraction2. ventricular ejection3. isovolumic relaxation4. ventricular filling.
These phases apply to both left and right heart, but we will focus on the leftheart here for clarity. Phases 1–2 correspond with ventricular systole andphases 3–4 with ventricular diastole.
Aortic pressure
Atrial pressure
Ventricular pressure
Ventricular volume
ECG
Aortic valvecloses
Isovolumicrelaxation
Ventricularfilling
AV valveopens
AV valvecloses
Ventricularejection
T
RP
Q S
Isovolumiccontraction
Aorticvalveopens
Systole Diastole
120
130
90
50
100
80
60
40
20
0
Pre
ssur
e (m
mH
g)V
olum
e (m
L)
Fig. 2.6 The cardiac cycle. (AV � atrioventricular; ECG � electrocardiogram)
Isovolumic contraction begins with closure of the mitral valve, caused bythe rising LV pressure at the start of ventricular systole. After the mitralvalve has closed, pressure within the LV continues to rise but the LV volumeremains constant (hence ‘isovolumic’) until the point when the aortic valveopens.
PART
1: E
SSEN
TIA
L PR
INC
IPLE
S
14
Ventricular ejection commences when the aortic valve opens and blood isejected from the LV into the aorta. The LV volume falls during the ejectionphase, as blood is expelled from the LV, but pressure continues to rise untilit peaks and then starts to fall.
Isovolumic relaxation commences with closure of the aortic valve.Pressure within the LV falls during this phase (but volume remainsconstant), until the LV pressure falls below LA pressure. At this point, thepressure difference between LA and LV causes the mitral valve to open andisovolumic relaxation ends.
Ventricular filling begins as the mitral valve opens and blood flows intothe LV from the LA. This phase ends when the mitral valve closes at thestart of ventricular systole. Towards the end of the ventricular filling phase,atrial systole (contraction) occurs, coinciding with the P wave on the ECG,and this augments ventricular filling.
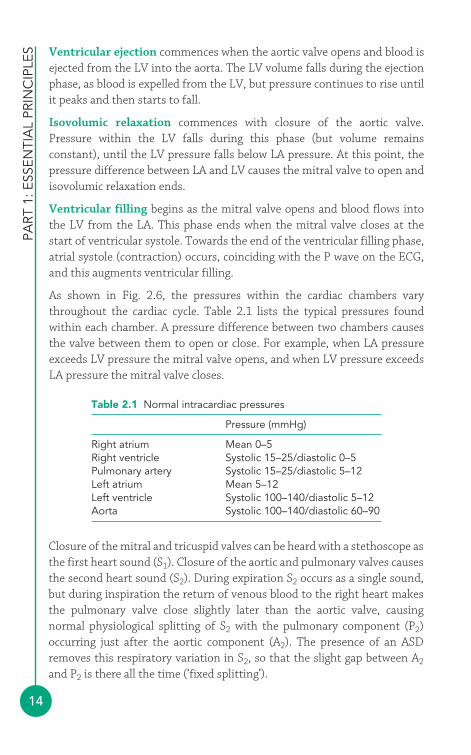
As shown in Fig. 2.6, the pressures within the cardiac chambers varythroughout the cardiac cycle. Table 2.1 lists the typical pressures foundwithin each chamber. A pressure difference between two chambers causesthe valve between them to open or close. For example, when LA pressureexceeds LV pressure the mitral valve opens, and when LV pressure exceedsLA pressure the mitral valve closes.
Table 2.1 Normal intracardiac pressures
Pressure (mmHg)
Right atrium Mean 0–5Right ventricle Systolic 15–25/diastolic 0–5Pulmonary artery Systolic 15–25/diastolic 5–12Left atrium Mean 5–12Left ventricle Systolic 100–140/diastolic 5–12Aorta Systolic 100–140/diastolic 60–90
Closure of the mitral and tricuspid valves can be heard with a stethoscope asthe first heart sound (S1). Closure of the aortic and pulmonary valves causesthe second heart sound (S2). During expiration S2 occurs as a single sound,but during inspiration the return of venous blood to the right heart makesthe pulmonary valve close slightly later than the aortic valve, causingnormal physiological splitting of S2 with the pulmonary component (P2)occurring just after the aortic component (A2). The presence of an ASDremoves this respiratory variation in S2, so that the slight gap between A2
and P2 is there all the time (‘fixed splitting’).
Car
dia
c an
atom
y an
d p
hysi
olog
y
15
FURTHER READING
Anderson RH, Ho SY, Brecker SJ. Anatomic basis of cross-sectional echocardiography. Heart 2001; 85: 716–20.
Anderson RH, Webb S, Brown NA et al. Development of theheart: (2) Septation of the atriums and ventricles. Heart 2003;89: 949–58.
Anderson RH, Webb S, Brown NA et al. Development of theheart: (3) Formation of the ventricular outflow tracts, arterialvalves, and intrapericardial arterial trunks. Heart 2003; 89:1110–18.
Moorman A, Webb S, Brown NA et al. Development of the heart:(1) Formation of the cardiac chambers and arterial trunks. Heart2003; 89: 806–14.
16
Echocardiography uses ultrasound to examine the structure and function ofthe heart. A firm understanding of the physics of ultrasound gives thesonographer:
● an understanding of the capabilities and limitations of their echomachine
● the confidence to adjust the machine’s controls to optimize the images.
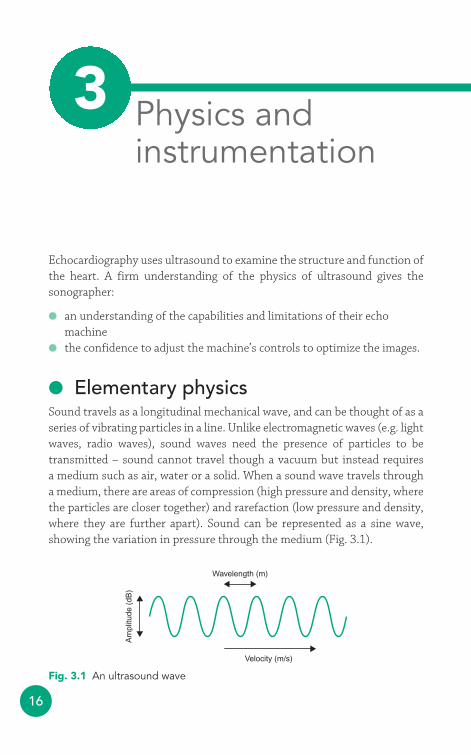
● Elementary physicsSound travels as a longitudinal mechanical wave, and can be thought of as aseries of vibrating particles in a line. Unlike electromagnetic waves (e.g. lightwaves, radio waves), sound waves need the presence of particles to betransmitted – sound cannot travel though a vacuum but instead requires a medium such as air, water or a solid. When a sound wave travels througha medium, there are areas of compression (high pressure and density, wherethe particles are closer together) and rarefaction (low pressure and density,where they are further apart). Sound can be represented as a sine wave,showing the variation in pressure through the medium (Fig. 3.1).
Wavelength (m)
Velocity (m/s)
Am
plitu
de (
dB)
Fig. 3.1 An ultrasound wave
Physics andinstrumentation4
3

Phys
ics
and
inst
rum
enta
tion
17
The amplitude of a sound wave indicates its strength, measured as thedifference between the peak pressure in the medium and the averagepressure. The unit of measurement is decibels (dB), using a logarithmic scalesuch that a difference of 6 dB represents a doubling in amplitude. Amplitudecan be adjusted by the sonographer by changing the echo machine’s poweroutput (transmit power).
The wavelength of a sound wave is the distance between two successivewaves – we normally measure this between the peak (or trough) of one waveand the identical point on the next wave. Wavelength is measured inappropriate units of length, such as metres (m) or millimetres (mm).
The frequency of a sound wave is the number of wave cycles (or oscillations)per second, and this is measured in Hertz (Hz). A sound wave with 100oscillations per second has a frequency of 100 Hz. For high frequencies, theunits of kiloHertz (kHz � 103Hz) or MegaHertz (MHz � 106 Hz) can be used.
Audible sound lies in the frequency range 20 Hz to 20 000 Hz (20 kHz).Sound with a frequency below 20 Hz is called infrasound, and sound with afrequency greater than 20 kHz is called ultrasound. Ultrasound used forechocardiography usually lies in the frequency range 1.5–7 MHz.
The propagation velocity of a sound wave refers to the speed at which thewave propagates through the medium. This varies from one medium toanother, depending both on the density and the stiffness of the medium.Propagation velocities for different body tissues are listed in Table 3.1. Theaverage propagation velocity for the heart (and for soft tissues in general) is1540 m/s.
Table 3.1 Propagation velocities in various body tissues
Medium Speed (m/s)
Air 330Fat 1450Soft tissue (average) 1540Blood 1570Muscle 1580Bone 3500
Wavelength, frequency and velocity are linked by the following equation:
Propagation velocity � frequency � wavelength
PART
1: E
SSEN
TIA
L PR
INC
IPLE
S
18
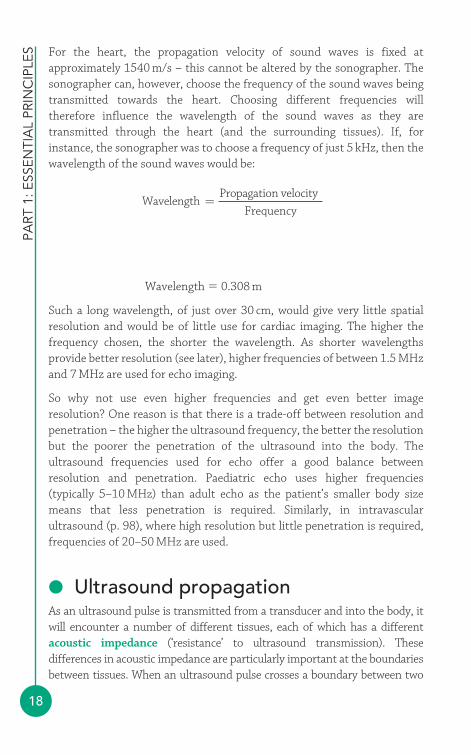
For the heart, the propagation velocity of sound waves is fixed atapproximately 1540 m/s – this cannot be altered by the sonographer. Thesonographer can, however, choose the frequency of the sound waves beingtransmitted towards the heart. Choosing different frequencies willtherefore influence the wavelength of the sound waves as they aretransmitted through the heart (and the surrounding tissues). If, forinstance, the sonographer was to choose a frequency of just 5 kHz, then thewavelength of the sound waves would be:
Wavelength � 0.308 m
Such a long wavelength, of just over 30 cm, would give very little spatialresolution and would be of little use for cardiac imaging. The higher thefrequency chosen, the shorter the wavelength. As shorter wavelengthsprovide better resolution (see later), higher frequencies of between 1.5 MHzand 7 MHz are used for echo imaging.
So why not use even higher frequencies and get even better imageresolution? One reason is that there is a trade-off between resolution andpenetration – the higher the ultrasound frequency, the better the resolutionbut the poorer the penetration of the ultrasound into the body. Theultrasound frequencies used for echo offer a good balance betweenresolution and penetration. Paediatric echo uses higher frequencies(typically 5–10 MHz) than adult echo as the patient’s smaller body sizemeans that less penetration is required. Similarly, in intravascularultrasound (p. 98), where high resolution but little penetration is required,frequencies of 20–50 MHz are used.
● Ultrasound propagationAs an ultrasound pulse is transmitted from a transducer and into the body, itwill encounter a number of different tissues, each of which has a differentacoustic impedance (‘resistance’ to ultrasound transmission). Thesedifferences in acoustic impedance are particularly important at the boundariesbetween tissues. When an ultrasound pulse crosses a boundary between two
Wavelength =1540m/s
5000Hz
WavelengthPropagation velocity
Frequency=
Phys
ics
and
inst
rum
enta
tion
19
tissues with very different acoustic impedances, a large proportion of theenergy within the pulse will be reflected back towards the transducer.
This effect is most marked at the boundary between the air and the skin,where almost all of the ultrasound energy will be reflected back to thetransducer and less than 1 per cent will enter the body. This would be amajor drawback to performing medical ultrasound, so to get around thisproblem sonographers use gel to bridge the gap between the transducer andthe skin. By excluding the air between the transducer and the skin, the gelreduces the impedance mismatch and allows much more of the ultrasoundenergy to enter the body. Similarly, echo can be challenging in patients withhyperinflated lungs (e.g. emphysema), where views of the heart can beobscured by air-filled lung tissue causing a large impedance mismatch.
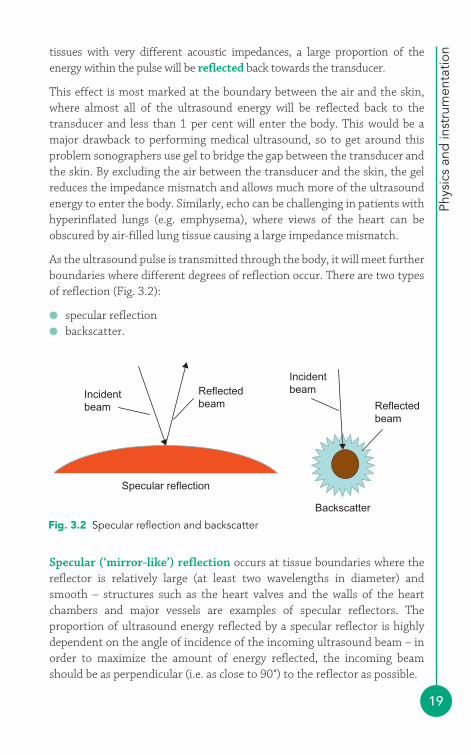
As the ultrasound pulse is transmitted through the body, it will meet furtherboundaries where different degrees of reflection occur. There are two typesof reflection (Fig. 3.2):
● specular reflection● backscatter.
Incidentbeam
Reflectedbeam
Incidentbeam
Reflectedbeam
Backscatter
Specular reflection
Fig. 3.2 Specular reflection and backscatter
Specular (‘mirror-like’) reflection occurs at tissue boundaries where thereflector is relatively large (at least two wavelengths in diameter) andsmooth – structures such as the heart valves and the walls of the heartchambers and major vessels are examples of specular reflectors. Theproportion of ultrasound energy reflected by a specular reflector is highlydependent on the angle of incidence of the incoming ultrasound beam – inorder to maximize the amount of energy reflected, the incoming beamshould be as perpendicular (i.e. as close to 90°) to the reflector as possible.
PART
1: E
SSEN
TIA
L PR
INC
IPLE
S
20
Backscatter occurs with small and/or rough-surfaced structures, where thereflected ultrasound will scatter in many different directions. The returningsignal will be weaker than from a specular reflector, but will not bedependent on the angle of the incident (incoming) ultrasound beam. Anexample of a scatter reflector is the tissue within the myocardium. Redblood cells also cause scatter, and as this scatter is equal in all directions theyare referred to as a special group known as Rayleigh scatterers.
As an ultrasound pulse travels through tissue, it will gradually lose energy, aprocess known as attenuation. Attenuation results from reflection andbackscatter, and also from the absorption of energy by the tissuesthemselves (where the sound energy is converted into heat). This loss ofenergy can be quantified in decibels, and in soft tissues a change of –3 dBequates to a fall in signal intensity of 50 per cent. The half-intensity depth(HID) is the depth (in cm) in soft tissue in which the intensity of theultrasound is reduced by 50 per cent, and depends upon the frequency (f) ofthe ultrasound emitted by the transducer, measured in MHz:
Thus the ultrasound emitted by a 4 MHz transducer would lose 50 per centof its intensity after travelling through just 6/4 � 1.5 cm of soft tissue.Attenuation is therefore greater at higher frequencies.
Refraction is the change in direction of an ultrasound pulse as it passesacross a boundary between two tissues (or materials) of different acousticimpedance. Although refraction can be useful (for instance, refraction isused to focus the ultrasound beam with an acoustic lens) it can also be asource of artefact (p. 27).
● Ultrasound transducersIn transthoracic echo, ultrasound is generated by a transducer (commonlycalled a probe) which is held on the patient’s chest. For other imagingtechniques (e.g. transoesophageal echo (TOE), intravascular ultrasound),the transducer may be passed into the oesophagus or even into the heartitself. The transducer is both a transmitter and a receiver – it transmitsultrasound into the chest, and also detects the return of the reflectedultrasound back to the probe.
HID (soft tissue)6
f=
Phys
ics
and
inst
rum
enta
tion
21
Ultrasound transducers work using the piezoelectric effect. Piezoelectriccrystals change shape when an electrical voltage is applied, and so analternating voltage can make them oscillate rapidly, thereby generatingultrasound. In addition, if the crystals are themselves caused to oscillate bya returning ultrasound wave, they generate an electrical voltage which can bedetected as a signal. Thus the crystals both generate and detect ultrasound.
Contemporary phased-array transducers consist of an array ofpiezoelectric elements (typically 128 for a 2-D echo probe, several thousandfor a 3-D probe). The ultrasound beam can be ‘steered’ and focusedelectronically by altering the timing of activation (or ‘phasing’) of theindividual elements. Older mechanical transducers used a motor within thetransducer to move the piezoelectric elements but had limited Dopplercapabilities, and were prone to mechanical failure.
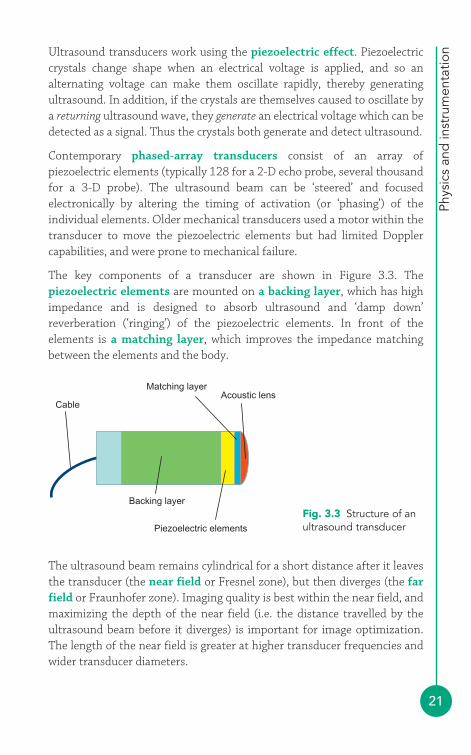
The key components of a transducer are shown in Figure 3.3. Thepiezoelectric elements are mounted on a backing layer, which has highimpedance and is designed to absorb ultrasound and ‘damp down’reverberation (‘ringing’) of the piezoelectric elements. In front of theelements is a matching layer, which improves the impedance matchingbetween the elements and the body.
CableAcoustic lens
Matching layer
Piezoelectric elements
Backing layerFig. 3.3 Structure of anultrasound transducer
The ultrasound beam remains cylindrical for a short distance after it leavesthe transducer (the near field or Fresnel zone), but then diverges (the farfield or Fraunhofer zone). Imaging quality is best within the near field, andmaximizing the depth of the near field (i.e. the distance travelled by theultrasound beam before it diverges) is important for image optimization.The length of the near field is greater at higher transducer frequencies andwider transducer diameters.
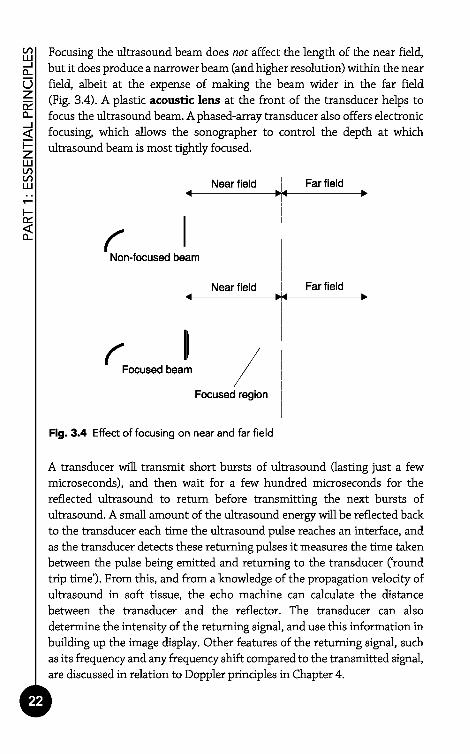
Focusing the ultrasound beam does not affect the length of the near field,but it does produce a narrower beam (and higher resolution) within the nearfield, albeit at the expense of making the beam wider in the far field(Fig. 3.4). A plastic acoustic lens at the front of the transducer helps tofocus the ultrasound beam. A phased-array transducer also offers electronicfocusing, which allows the sonographer to control the depth at whichultrasound beam is most tightly focused.
Fig. 3.4 Effect of focusing on near and far field
A transducer will transmit short bursts of ultrasound Qasting just a fewmicroseconds), and then wait for a few hundred microseconds for thereflected ultrasound to return before transmitting the next bursts ofultrasound. A small amount of the ultrasound energy will be reflected backto the transducer each time the ultrasound pulse reaches an interface, andas the transducer detects these returning pulses it measures the time takenbetween the pulse being emitted and returning to the transducer ('roundtrip time'). From this, and from a knowledge of the propagation velocity ofultrasound in soft tissue, the echo machine can calculate the distancebetween the transducer and the reflector. The transducer can alsodetermine the intensity of the returning signal, and use this information inbuilding up the image display. Other features of the returning signal, suchas its frequency and any frequency shift compared to the transmitted signal,are discussed in relation to Doppler principles in Chapter 4.
PA
RT
1:
ES
SE
NT
IAL
PR
INC
IPLE
S
Phys
ics
and
inst
rum
enta
tion
23
● Imaging modalitiesThe earliest echo modality was amplitude mode (A-mode) imaging, whichsimply plotted the amplitude of the reflected ultrasound (as a ‘spike’ with acertain amplitude) versus the distance of the reflected signal from thetransducer. Brightness mode (B-mode) imaging was similar in principle, butrather than plotting the returning signals as a row of spikes of varying sizes,it represented the amplitude of the returning signal by the brightness of a dot. A-mode and B-mode imaging have been superseded by M-mode and2-D imaging.
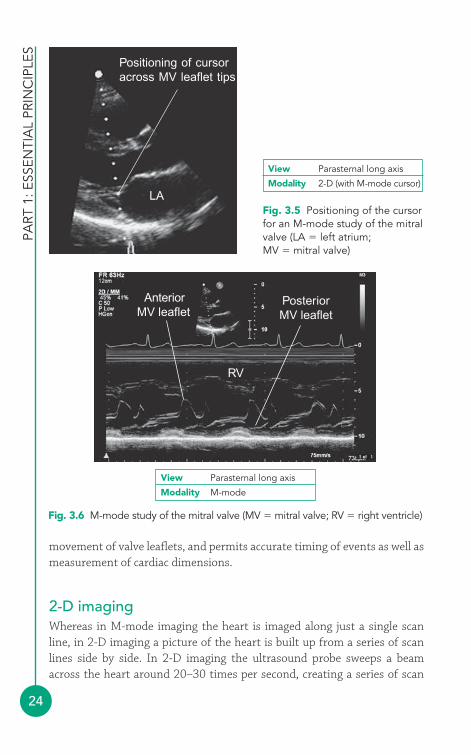
M-mode imagingM-mode (or motion-mode) imaging records motion along a single ‘line ofsight’, selected by careful positioning of the on-screen cursor across a regionof interest (Fig. 3.5). Once the cursor is in place, activation of M-modeimaging produces a scrolling display of movement (along the vertical y axis),as it occurs along the cursor line, plotted against time (along the horizontal x axis). A typical M-mode trace for a normal mitral valve is shown in Figure 3.6.
The very narrow field of view of M-mode imaging – essentially a single scanline, represented by the on-screen cursor – means that a very high pulserepetition frequency can be used, giving a sampling rate of around 1800times per second. This is very useful in visualizing rapid motion, such as the
SECOND HARMONIC IMAGING
The reflected echo signal that returns to the transducer contains notjust ultrasound at the original (fundamental) frequency of thetransmitted signal, but also harmonics (multiples of the originalfrequency). These harmonics originate mainly from the centralportion of the beam and also from deeper structures. Secondharmonic imaging filters the returning signal to remove thefundamental frequency and build up an image using the secondharmonic components of the signal. In so doing, the imageresolution improves (because of the higher frequency), particularlyfor far field structures. Disadvantages of second harmonic imagingare that it requires a higher power output, and it does slightly alterthe appearance of myocardial texture and also the apparentthickness of structures such as valve leaflets compared withfundamental imaging.
i
PART
1: E
SSEN
TIA
L PR
INC
IPLE
S
24
movement of valve leaflets, and permits accurate timing of events as well asmeasurement of cardiac dimensions.
2-D imagingWhereas in M-mode imaging the heart is imaged along just a single scanline, in 2-D imaging a picture of the heart is built up from a series of scanlines side by side. In 2-D imaging the ultrasound probe sweeps a beamacross the heart around 20–30 times per second, creating a series of scan
Positioning of cursoracross MV leaflet tips
LAFig. 3.5 Positioning of the cursorfor an M-mode study of the mitralvalve (LA � left atrium;MV � mitral valve)
View Parasternal long axis
Modality 2-D (with M-mode cursor)
AnteriorMV leaflet
PosteriorMV leaflet
RV
Fig. 3.6 M-mode study of the mitral valve (MV � mitral valve; RV � right ventricle)
View Parasternal long axis
Modality M-mode
Phys
ics
and
inst
rum
enta
tion
25
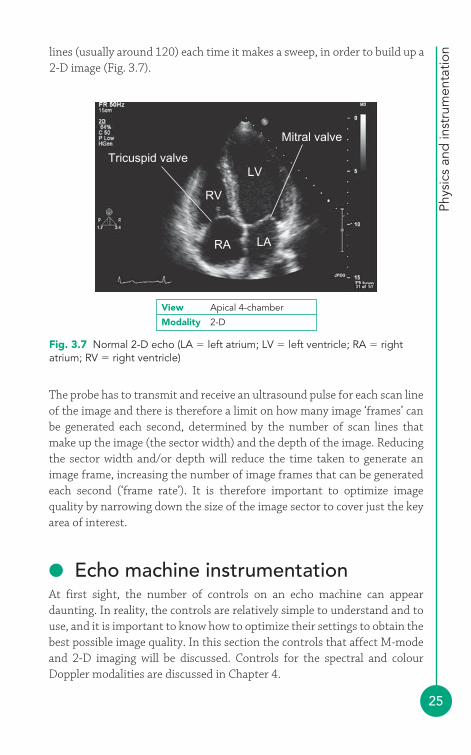
lines (usually around 120) each time it makes a sweep, in order to build up a2-D image (Fig. 3.7).
Fig. 3.7 Normal 2-D echo (LA � left atrium; LV � left ventricle; RA � rightatrium; RV � right ventricle)
View Apical 4-chamber
Modality 2-D
Tricuspid valve
Mitral valve
RV
LV
LARA
The probe has to transmit and receive an ultrasound pulse for each scan lineof the image and there is therefore a limit on how many image ‘frames’ canbe generated each second, determined by the number of scan lines thatmake up the image (the sector width) and the depth of the image. Reducingthe sector width and/or depth will reduce the time taken to generate animage frame, increasing the number of image frames that can be generatedeach second (‘frame rate’). It is therefore important to optimize imagequality by narrowing down the size of the image sector to cover just the keyarea of interest.
● Echo machine instrumentationAt first sight, the number of controls on an echo machine can appeardaunting. In reality, the controls are relatively simple to understand and touse, and it is important to know how to optimize their settings to obtain thebest possible image quality. In this section the controls that affect M-modeand 2-D imaging will be discussed. Controls for the spectral and colourDoppler modalities are discussed in Chapter 4.
PART
1: E
SSEN
TIA
L PR
INC
IPLE
S
26
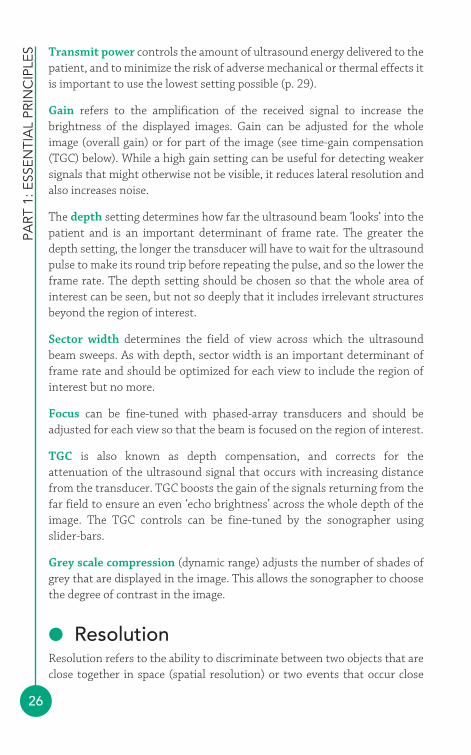
Transmit power controls the amount of ultrasound energy delivered to thepatient, and to minimize the risk of adverse mechanical or thermal effects itis important to use the lowest setting possible (p. 29).
Gain refers to the amplification of the received signal to increase thebrightness of the displayed images. Gain can be adjusted for the wholeimage (overall gain) or for part of the image (see time-gain compensation(TGC) below). While a high gain setting can be useful for detecting weakersignals that might otherwise not be visible, it reduces lateral resolution andalso increases noise.
The depth setting determines how far the ultrasound beam ‘looks’ into thepatient and is an important determinant of frame rate. The greater thedepth setting, the longer the transducer will have to wait for the ultrasoundpulse to make its round trip before repeating the pulse, and so the lower theframe rate. The depth setting should be chosen so that the whole area ofinterest can be seen, but not so deeply that it includes irrelevant structuresbeyond the region of interest.
Sector width determines the field of view across which the ultrasoundbeam sweeps. As with depth, sector width is an important determinant offrame rate and should be optimized for each view to include the region ofinterest but no more.
Focus can be fine-tuned with phased-array transducers and should beadjusted for each view so that the beam is focused on the region of interest.
TGC is also known as depth compensation, and corrects for theattenuation of the ultrasound signal that occurs with increasing distancefrom the transducer. TGC boosts the gain of the signals returning from thefar field to ensure an even ‘echo brightness’ across the whole depth of theimage. The TGC controls can be fine-tuned by the sonographer usingslider-bars.
Grey scale compression (dynamic range) adjusts the number of shades ofgrey that are displayed in the image. This allows the sonographer to choosethe degree of contrast in the image.
● ResolutionResolution refers to the ability to discriminate between two objects that areclose together in space (spatial resolution) or two events that occur close
Phys
ics
and
inst
rum
enta
tion
27
together in time (temporal resolution). Spatial resolution has twocomponents:
● axial resolution● lateral resolution.
Axial resolution relates to objects that lie along the axis of the ultrasoundbeam, and is mainly determined by transducer frequency (higherfrequency � better axial resolution) and pulse length (shorter pulselength � better axial resolution). Axial resolution is typically around 3 mm.
Lateral resolution, also known as azimuthal resolution, relates to objectsthat lie side by side, perpendicular to the ultrasound beam, and variesaccording to how far the objects lie from the transducer. The narrower thebeam, the better the lateral resolution. The width of the beam can beoptimized by focusing it on the region of interest (see Fig. 3.4, p. 22). Lateral resolution is also affected by gain settings – the higher the gain, theworse the lateral resolution. Lateral resolution is typically around 1 mm.
Temporal resolution, or frame rate, is important in trying to distinguishevents that occur close together in time. Frame rate depends upon the timetaken to collect all the data required to create one image, which in turndepends upon the sector width and depth. M-mode imaging offers very highsampling rates, typically 1800 times per second, because of the very narrowfield of view (see above). 2-D echo has a much slower frame rate, typically20–30 frames per second, because of the much greater amount ofultrasound data that must be collected to create a single frame.
● Imaging artefactsImaging artefacts occur when ‘structures’ and/or distortions are seen on theecho image that are not actually present in the heart (or, at least, not at theapparent location), or when structures that are present seem to be absent onthe image.
Acoustic shadowing occurs when a highly echo-reflective structure (e.g. amechanical valve prosthesis) blocks ultrasound from penetrating anyfurther, causing echo drop-out in the far field. This can pose a particularproblem when assessing the structure and function of prosthetic valves.
Reverberation occurs when ultrasound rebounds several times betweentwo strong specular reflectors before returning to the transducer. The time
PART
1: E
SSEN
TIA
L PR
INC
IPLE
S
28
spent ‘rebounding’ delays the return of the signal to the transducer, and sothe processing software misinterprets the returning signal as havingoriginated further away that it really has. This leads to ‘ghost’ imagesoccurring in the far field, which can be recognized because they move intandem with the structure that caused the reverberation.
Beam width artefact arises because the ultrasound beam has a finite width(especially in the far field) and the machine is unable to discriminatewhether a returning echo signal has arisen from the centre of the beamand/or the edge. Strong reflectors at the edge of the beam are thereforedisplayed by the echo machine as though they arise from the centre of thebeam, ‘smearing’ the displayed echo. Beam width artefact can be reduced byfocusing the ultrasound beam to minimize its diameter.
Side lobe artefact is similar in its mechanism to beam width artefact, butarises from unwanted but unavoidable ‘side lobe’ beams (which areadditional beams surrounding the main ultrasound beam). Signalsreturning from the side lobe beams are interpreted by the echo machine ashaving arisen from the central beam, and can be displayed some distanceaway from the true location of the structure in question.
● Display and recording methodsThe returning echo signal at the transducer undergoes a series of initialprocessing steps which include amplification, TGC and filtering. The videosignal is then sent to a scan converter, which converts the signal into a‘rectangular’ format suitable for display. The resulting data undergo furtherprocessing (‘post-processing’) and can then be stored in a digital formatand/or can undergo digital-to-analogue conversion to create a video signalfor display on a monitor (and/or archiving onto videotape). This processoccurs so rapidly that the acquired data can be displayed on a monitoralmost in ‘real time’.
Storage of echo studies can be on videotape, which is relatively inexpensive,although it rapidly becomes cumbersome to store (and to review) studies whenlarge numbers are archived in this way. Digital archiving is now more commonlyused, with storage on hard drives or optical disks. This makes accessing studieseasier and allows greater flexibility in image processing after the study has beencompleted. However, the quantity of digital data generated by an echo study canbe considerable, so high-volume storage media (and ‘lossless’ data compressiontechniques) are required if large numbers of studies are to be archived.
Phys
ics
and
inst
rum
enta
tion
29
● Safety of ultrasoundUltrasound involves the delivery of external energy to body tissues and so itis important to consider the potential adverse biological effects that thiscould entail. The intensity of exposure to ultrasound is expressed as powerper unit of area (watts/cm2) expressed as the maximum intensity within theultrasound beam (the spatial peak) averaged over the duration of exposure(temporal average), the spatial peak temporal average (SPTA). There aretwo main biological effects of exposure to ultrasound energy: thermal(heating) and mechanical (e.g. cavitation).
Thermal effects are caused by conversion of the mechanical energy of theultrasound into heat energy as it passes though the tissues. The amount ofheating is hard to predict but relates to several factors including transducerfrequency, transmit power, focus and depth. Thermal effects are mostrelevant to TOE where the probe may remain stationary in the oesophagusfor long periods, particularly during intraoperative studies. Heat may begenerated not just by the ultrasound but also directly by the probe itself. Itis prudent to keep imaging time to a minimum and to ensure that the TOEprobe is repositioned regularly, and to monitor the temperature of theprobe.
Mechanical effects include cavitation, in which gas bubbles are created asultrasound passes through the tissues. It is not thought to be a problemduring standard transthoracic studies, but is important when bubblecontrast agents are used as it can cause resonance and even disruption ofthe bubbles (p. 95). Mechanical effects of ultrasound can also be measuredby mechanical index (MI), which is the peak negative (rarefactional)pressure divided by the square root of the transducer frequency. An MI of�1 is considered safe.
Although echo has an excellent safety record, it is nevertheless prudent tominimize risk by:
● only performing echo for appropriate clinical indications● keeping the power output as low as possible● keeping the exposure time to a minimum.
M-mode and 2-D echo have the lowest ultrasound intensity, and pulsed-wave Doppler has the highest intensity (with colour Doppler having anintermediate value).
FURTHER READING
PART
1: E
SSEN
TIA
L PR
INC
IPLE
S
30
Ensuring safety also requires an awareness of more general hazards such as:
● risk of electrical shock from damaged or poorly maintained equipment● risk of injury from trips and falls, particularly when transferring onto
the examination couch● risk of infection from inadequate infection control measures.
Echo departments should have appropriate risk assessment tools andprotocols in place to minimize risks to patients and staff.
Adeyemi B. British Society of Echocardiography Distance LearningModule 14: Physics of transducers for imaging and Doppler.Accessible from the BSE website (www.bsecho.org).
Monaghan MJ. Second harmonic imaging: a new tune for an oldfiddle? Heart 2000; 83: 131–2.
Reynolds T. Ultrasound Physics: A Registry Exam PreparationGuide. School of Cardiac Ultrasound, Arizona Heart InstituteFoundation, Phoenix, 1996.
31
Echo can be used to examine not just the heart’s anatomical structure butalso the flow of blood through the heart. This in turn provides valuableinformation about valvular function, intracardiac shunts and so forth. Thestudy of the heart’s fluid dynamics is made possible by the Dopplerprinciple, discussed in this chapter. As well as allowing the assessment ofblood flow, the Doppler principle has also, more recently, been applied tothe study of myocardial function (tissue Doppler imaging).
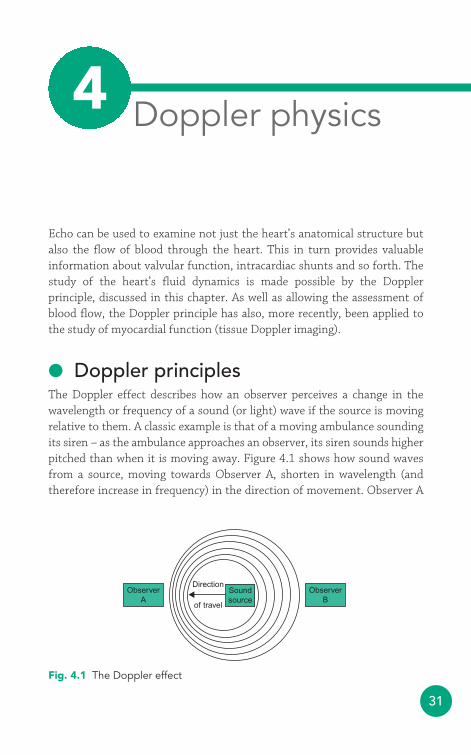
● Doppler principlesThe Doppler effect describes how an observer perceives a change in thewavelength or frequency of a sound (or light) wave if the source is movingrelative to them. A classic example is that of a moving ambulance soundingits siren – as the ambulance approaches an observer, its siren sounds higherpitched than when it is moving away. Figure 4.1 shows how sound wavesfrom a source, moving towards Observer A, shorten in wavelength (andtherefore increase in frequency) in the direction of movement. Observer A
Direction
of travel
Soundsource
ObserverB
ObserverA
Fig. 4.1 The Doppler effect
Doppler physics4
PART
1: E
SSEN
TIA
L PR
INC
IPLE
S
32
would therefore hear a higher pitch, and observer B a lower pitch, than if thesource was stationary.
The same phenomenon occurs with ultrasound waves when they are reflectedfrom moving red blood cells. The frequency of the returning ultrasound isincreased if the red blood cells are moving towards the ultrasound transducer,or decreased if they are moving away. This change in frequency between thetransmitted and returning ultrasound signal is the Doppler shift, from whichthe velocity (V) of the red blood cells can be calculated:
where c is the speed of sound in blood, fd is the Doppler shift in frequencybetween transmitted and returning signals, ft is the frequency of thetransmitted signal, and θ is the angle between the ultrasound beam andthe direction of blood flow.
It follows from this equation that a large angle between the direction ofblood flow and the ultrasound beam will lead to an underestimation of flowvelocity, and this is particularly marked for angles �20°. For this reason,when undertaking echo Doppler studies it is important to align theultrasound beam with the direction of blood flow as closely as possible.
● Spectral DopplerWhen the ultrasound beam returns to the transducer, the difference infrequency between the transmitted and returning beams is compared tocalculate the Doppler shift. This is a complex process as the returning signalcontains a spectrum of frequencies, and a mathematical technique called afast Fourier transform is used to undertake the necessary spectral analysis.
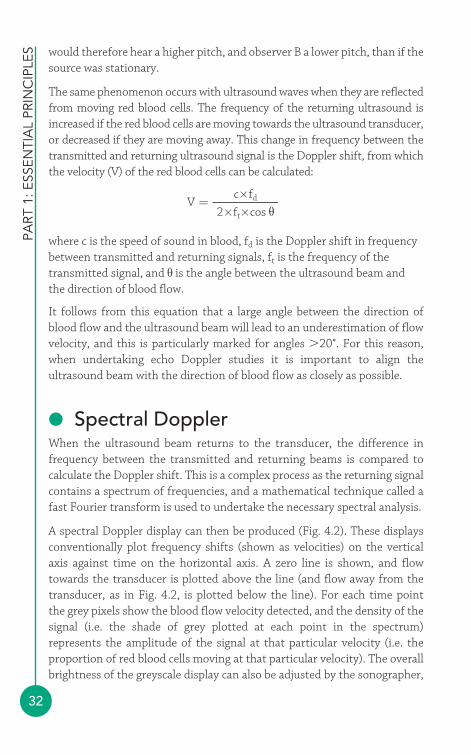
A spectral Doppler display can then be produced (Fig. 4.2). These displaysconventionally plot frequency shifts (shown as velocities) on the verticalaxis against time on the horizontal axis. A zero line is shown, and flowtowards the transducer is plotted above the line (and flow away from thetransducer, as in Fig. 4.2, is plotted below the line). For each time point the grey pixels show the blood flow velocity detected, and the density of thesignal (i.e. the shade of grey plotted at each point in the spectrum)represents the amplitude of the signal at that particular velocity (i.e. theproportion of red blood cells moving at that particular velocity). The overallbrightness of the greyscale display can also be adjusted by the sonographer,
Vc×fd
2×ft×cos θ=
Dop
ple
r p
hysi
cs
33
Spectral (CW and PW) Doppler controls on an echo machine include:
Transmit power, which controls the amount of ultrasound energydelivered to the patient.
Gain, which amplifies the received signal to increase the brightness of thedisplayed spectral trace. High gain settings amplify weaker signals thatmight otherwise not be visible, but increase noise.
Baseline shift, which shifts the ‘zero point’ of the display up or down.
Velocity range, which alters the vertical velocity scale to a higher or lowerrange.
The frequency range seen with Doppler shift (�10 to �10 kHz) falls withinthe audible range of the human ear, so it is possible to listen to blood flowvia the loudspeaker on the echo machine, adjusting the volume asappropriate, and to use the audible ‘quality’ of the sound to guide fineadjustments in the alignment of the ultrasound beam with the blood flow,in order to obtain the best possible signal.
Velocity
Mitralregurgitation
Time
Fig. 4.2 Spectral Doppler display(showing mitral regurgitation)
using the Doppler gain setting. Such spectral displays form the basis ofcontinuous wave (CW) and pulsed-wave (PW) Doppler techniques (seebelow).
PART
1: E
SSEN
TIA
L PR
INC
IPLE
S
34
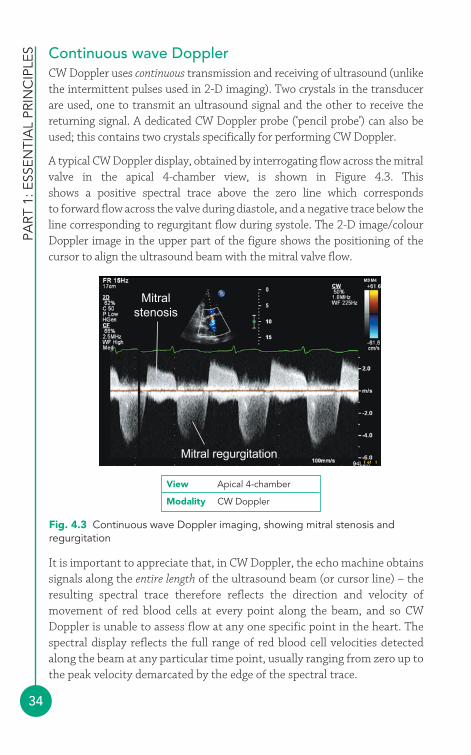
Continuous wave DopplerCW Doppler uses continuous transmission and receiving of ultrasound (unlikethe intermittent pulses used in 2-D imaging). Two crystals in the transducerare used, one to transmit an ultrasound signal and the other to receive thereturning signal. A dedicated CW Doppler probe (‘pencil probe’) can also beused; this contains two crystals specifically for performing CW Doppler.
A typical CW Doppler display, obtained by interrogating flow across the mitralvalve in the apical 4-chamber view, is shown in Figure 4.3. This shows a positive spectral trace above the zero line which corresponds to forward flow across the valve during diastole, and a negative trace below theline corresponding to regurgitant flow during systole. The 2-D image/colourDoppler image in the upper part of the figure shows the positioning of thecursor to align the ultrasound beam with the mitral valve flow.
Mitral regurgitation
Mitralstenosis
Fig. 4.3 Continuous wave Doppler imaging, showing mitral stenosis andregurgitation
View Apical 4-chamber
Modality CW Doppler
It is important to appreciate that, in CW Doppler, the echo machine obtainssignals along the entire length of the ultrasound beam (or cursor line) – theresulting spectral trace therefore reflects the direction and velocity ofmovement of red blood cells at every point along the beam, and so CWDoppler is unable to assess flow at any one specific point in the heart. Thespectral display reflects the full range of red blood cell velocities detectedalong the beam at any particular time point, usually ranging from zero up tothe peak velocity demarcated by the edge of the spectral trace.
Dop
ple
r p
hysi
cs
35
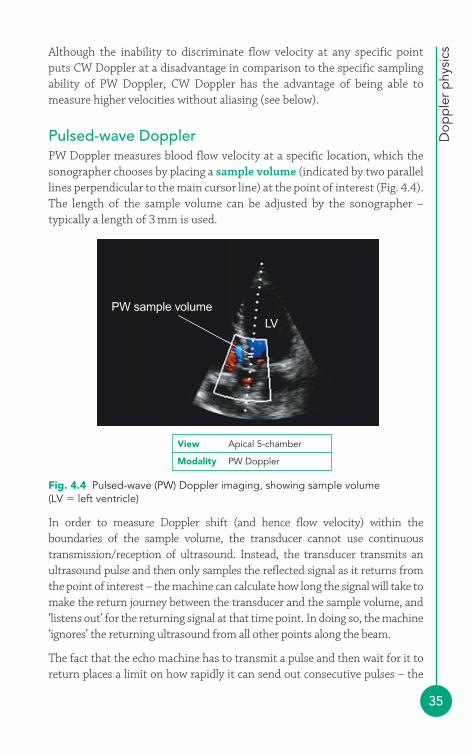
In order to measure Doppler shift (and hence flow velocity) within theboundaries of the sample volume, the transducer cannot use continuoustransmission/reception of ultrasound. Instead, the transducer transmits anultrasound pulse and then only samples the reflected signal as it returns fromthe point of interest – the machine can calculate how long the signal will take tomake the return journey between the transducer and the sample volume, and‘listens out’ for the returning signal at that time point. In doing so, the machine‘ignores’ the returning ultrasound from all other points along the beam.
The fact that the echo machine has to transmit a pulse and then wait for it toreturn places a limit on how rapidly it can send out consecutive pulses – the
PW sample volumeLV
Fig. 4.4 Pulsed-wave (PW) Doppler imaging, showing sample volume(LV � left ventricle)
View Apical 5-chamber
Modality PW Doppler
Although the inability to discriminate flow velocity at any specific pointputs CW Doppler at a disadvantage in comparison to the specific samplingability of PW Doppler, CW Doppler has the advantage of being able tomeasure higher velocities without aliasing (see below).
Pulsed-wave DopplerPW Doppler measures blood flow velocity at a specific location, which thesonographer chooses by placing a sample volume (indicated by two parallellines perpendicular to the main cursor line) at the point of interest (Fig. 4.4).The length of the sample volume can be adjusted by the sonographer –typically a length of 3 mm is used.
PART
1: E
SSEN
TIA
L PR
INC
IPLE
S
36
pulse repetition frequency (PRF). The further away the sample volume isfrom the transducer, the longer the ‘round trip time’ of the ultrasound pulseand so the lower the PRF. This gives rise to the phenomenon known asaliasing, which is one of the main limitations to the usefulness of PW Doppler.
ALIASING
The concept of aliasing is traditionally explained in terms of a moviefilm of a rotating spoked wheel. If the wheel is rotating 30 times persecond, and the film is running at 30 frames per second, then everytime the wheel is captured (or ‘sampled’) on a movie frame it willhave made one full rotation and will have returned to the sameorientation. When the film is played back, the wheel will look asthough it is stationary. In order to capture the rotation of the wheelthe movie frame rate (or ‘sampling rate’) needs to be higher – withregard to sampling ultrasound, in order to unambiguously measurewavelength a waveform must be sampled at least twice in eachcycle (Nyquist’s theorem). This places an upper limit on theDoppler shift that can be measured using PW Doppler (Nyquistlimit), which equals half the PRF. Once the blood velocity exceedsthis limit, the spectral trace will appear with the top of the waveform‘missing’ (in fact, transposed to the opposite side of the baseline).Shifting the baseline can help reduce the problem of aliasing tosome extent, but the phenomenon nevertheless places a significantlimitation on the maximum velocity that can be assessed with PWDoppler. Aliasing can also be reduced by:
● adjusting the Doppler velocity scale (as far as possible)● sampling at the lowest possible distance from the transducer● decreasing the transmitted frequency● increasing the angle of incidence.
Ultimately it may prove necessary to switch to CW Dopplerinstead, where possible. One further alternative is to use high-PRFPW Doppler, in which a higher PRF is used, which means thatsampling now occurs at two or more distinct sites along theultrasound beam but a higher velocity can be measured beforealiasing occurs. Careful placement of the sample volumes so thatone lies in the region of interest and all the others lie in low-velocity regions means that high-PRF PW Doppler can sometimesbe a useful way round the aliasing problem.
i
Dop
ple
r p
hysi
cs
37
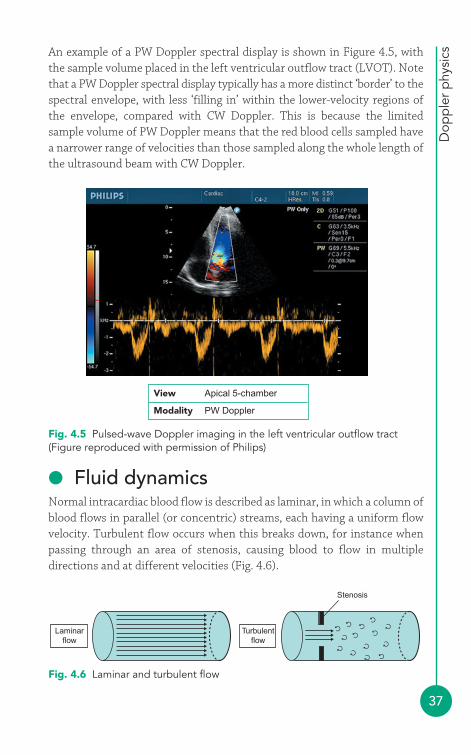
An example of a PW Doppler spectral display is shown in Figure 4.5, withthe sample volume placed in the left ventricular outflow tract (LVOT). Notethat a PW Doppler spectral display typically has a more distinct ‘border’ to thespectral envelope, with less ‘filling in’ within the lower-velocity regions ofthe envelope, compared with CW Doppler. This is because the limitedsample volume of PW Doppler means that the red blood cells sampled havea narrower range of velocities than those sampled along the whole length ofthe ultrasound beam with CW Doppler.
Fig. 4.5 Pulsed-wave Doppler imaging in the left ventricular outflow tract(Figure reproduced with permission of Philips)
Laminarflow
Turbulentflow
Stenosis
Fig. 4.6 Laminar and turbulent flow
View Apical 5-chamber
Modality PW Doppler
● Fluid dynamicsNormal intracardiac blood flow is described as laminar, in which a column ofblood flows in parallel (or concentric) streams, each having a uniform flowvelocity. Turbulent flow occurs when this breaks down, for instance whenpassing through an area of stenosis, causing blood to flow in multipledirections and at different velocities (Fig. 4.6).
PART
1: E
SSEN
TIA
L PR
INC
IPLE
S
38
PART
1: E
SSEN
TIA
L PR
INC
IPLE
S
The point at which laminar flow along a vessel becomes turbulent isdescribed by the Reynolds equation, in which turbulent flow is more likelywhen blood with high density and low viscosity flows at high velocitythrough a wide-calibre vessel.
Blood flow is pulsatile, increasing (and then decreasing) in velocity withtime during each cardiac cycle. A number of velocity measurements can bemade from a spectral Doppler display. The outermost edge of the spectraltrace represents the peak velocity at any particular time point. Thebrightest portion of the spectral display represents the velocity of themajority of the red blood cells (modal velocity). The average velocity of the red blood cells is expressed as the mean velocity.
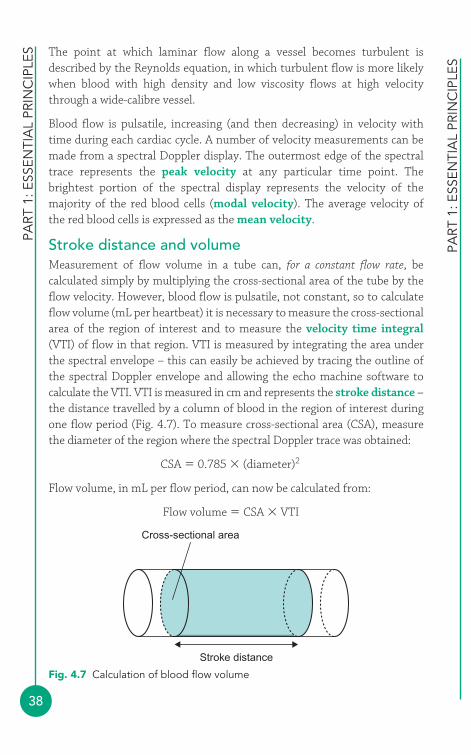
Stroke distance and volumeMeasurement of flow volume in a tube can, for a constant flow rate, becalculated simply by multiplying the cross-sectional area of the tube by theflow velocity. However, blood flow is pulsatile, not constant, so to calculateflow volume (mL per heartbeat) it is necessary to measure the cross-sectionalarea of the region of interest and to measure the velocity time integral(VTI) of flow in that region. VTI is measured by integrating the area underthe spectral envelope – this can easily be achieved by tracing the outline ofthe spectral Doppler envelope and allowing the echo machine software tocalculate the VTI. VTI is measured in cm and represents the stroke distance –the distance travelled by a column of blood in the region of interest duringone flow period (Fig. 4.7). To measure cross-sectional area (CSA), measurethe diameter of the region where the spectral Doppler trace was obtained:
CSA � 0.785 � (diameter)2
Flow volume, in mL per flow period, can now be calculated from:
Flow volume � CSA � VTI
Cross-sectional area
Stroke distance
Fig. 4.7 Calculation of blood flow volume
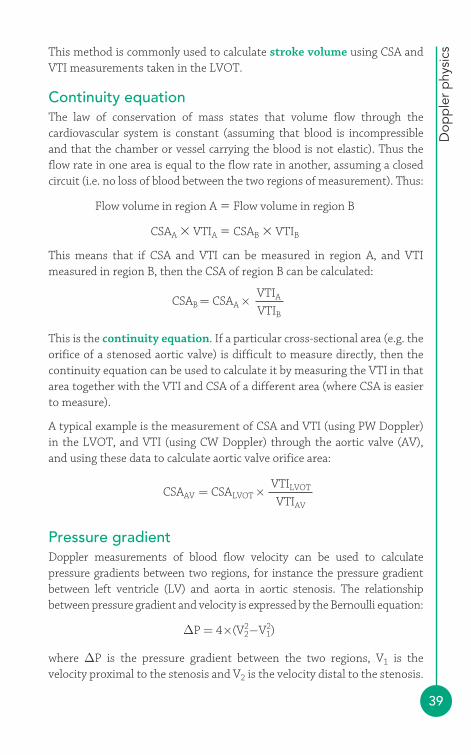
Dop
ple
r p
hysi
cs
39
This method is commonly used to calculate stroke volume using CSA andVTI measurements taken in the LVOT.
Continuity equationThe law of conservation of mass states that volume flow through thecardiovascular system is constant (assuming that blood is incompressibleand that the chamber or vessel carrying the blood is not elastic). Thus theflow rate in one area is equal to the flow rate in another, assuming a closedcircuit (i.e. no loss of blood between the two regions of measurement). Thus:
Flow volume in region A � Flow volume in region B
CSAA � VTIA � CSAB � VTIB
This means that if CSA and VTI can be measured in region A, and VTImeasured in region B, then the CSA of region B can be calculated:
This is the continuity equation. If a particular cross-sectional area (e.g. theorifice of a stenosed aortic valve) is difficult to measure directly, then thecontinuity equation can be used to calculate it by measuring the VTI in thatarea together with the VTI and CSA of a different area (where CSA is easierto measure).
A typical example is the measurement of CSA and VTI (using PW Doppler)in the LVOT, and VTI (using CW Doppler) through the aortic valve (AV),and using these data to calculate aortic valve orifice area:
Pressure gradientDoppler measurements of blood flow velocity can be used to calculatepressure gradients between two regions, for instance the pressure gradientbetween left ventricle (LV) and aorta in aortic stenosis. The relationshipbetween pressure gradient and velocity is expressed by the Bernoulli equation:
where ΔP is the pressure gradient between the two regions, V1 is thevelocity proximal to the stenosis and V2 is the velocity distal to the stenosis.
ΔP = 4×(V22−V1
2)
CSAAV = CSALVOT ×VTILVOT
VTIAV
CSAB = CSAA ×VTIA
VTIB
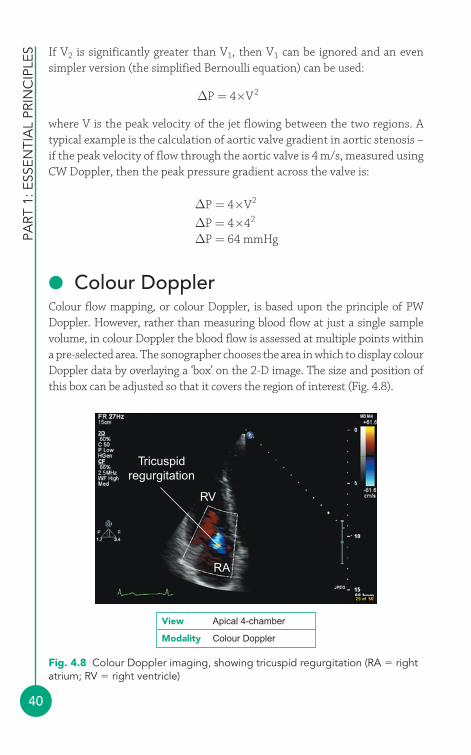
PART
1: E
SSEN
TIA
L PR
INC
IPLE
S
40
If V2 is significantly greater than V1, then V1 can be ignored and an evensimpler version (the simplified Bernoulli equation) can be used:
where V is the peak velocity of the jet flowing between the two regions. Atypical example is the calculation of aortic valve gradient in aortic stenosis –if the peak velocity of flow through the aortic valve is 4 m/s, measured usingCW Doppler, then the peak pressure gradient across the valve is:
● Colour DopplerColour flow mapping, or colour Doppler, is based upon the principle of PWDoppler. However, rather than measuring blood flow at just a single samplevolume, in colour Doppler the blood flow is assessed at multiple points withina pre-selected area. The sonographer chooses the area in which to display colourDoppler data by overlaying a ‘box’ on the 2-D image. The size and position ofthis box can be adjusted so that it covers the region of interest (Fig. 4.8).
ΔP = 4×V2
ΔP = 4×42
ΔP = 64 mmHg
ΔP = 4×V2
RA
RV
Tricuspidregurgitation
Fig. 4.8 Colour Doppler imaging, showing tricuspid regurgitation (RA � rightatrium; RV � right ventricle)
View Apical 4-chamber
Modality Colour Doppler
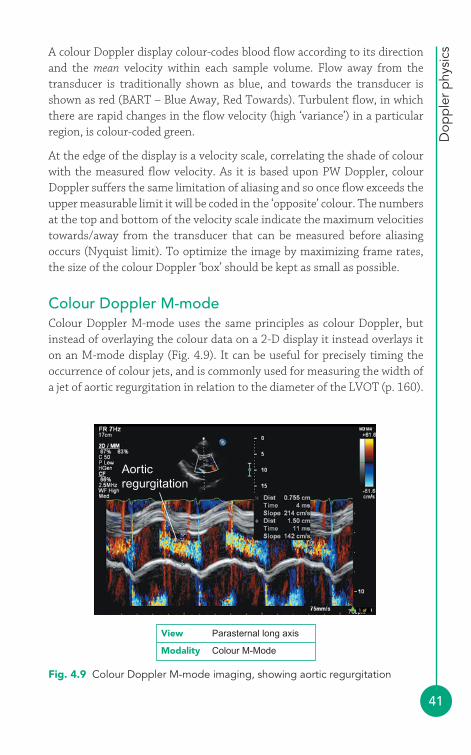
Dop
ple
r p
hysi
cs
41
A colour Doppler display colour-codes blood flow according to its directionand the mean velocity within each sample volume. Flow away from thetransducer is traditionally shown as blue, and towards the transducer isshown as red (BART – Blue Away, Red Towards). Turbulent flow, in whichthere are rapid changes in the flow velocity (high ‘variance’) in a particularregion, is colour-coded green.
At the edge of the display is a velocity scale, correlating the shade of colourwith the measured flow velocity. As it is based upon PW Doppler, colourDoppler suffers the same limitation of aliasing and so once flow exceeds theupper measurable limit it will be coded in the ‘opposite’ colour. The numbersat the top and bottom of the velocity scale indicate the maximum velocitiestowards/away from the transducer that can be measured before aliasingoccurs (Nyquist limit). To optimize the image by maximizing frame rates,the size of the colour Doppler ‘box’ should be kept as small as possible.
Colour Doppler M-modeColour Doppler M-mode uses the same principles as colour Doppler, butinstead of overlaying the colour data on a 2-D display it instead overlays iton an M-mode display (Fig. 4.9). It can be useful for precisely timing theoccurrence of colour jets, and is commonly used for measuring the width ofa jet of aortic regurgitation in relation to the diameter of the LVOT (p. 160).
Aorticregurgitation
Fig. 4.9 Colour Doppler M-mode imaging, showing aortic regurgitation
View Parasternal long axis
Modality Colour M-Mode
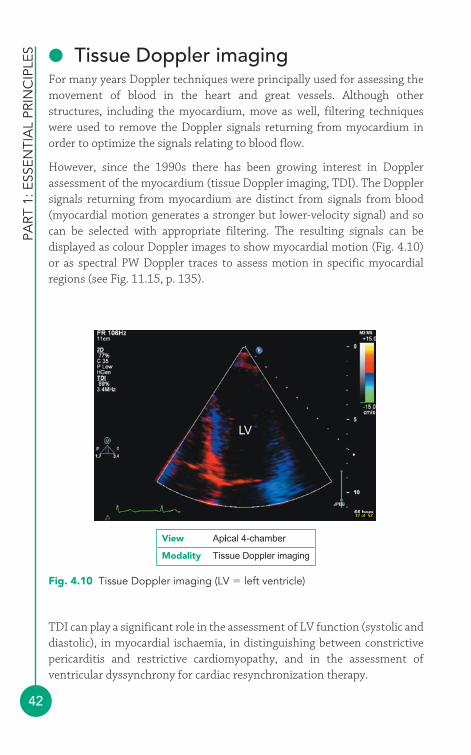
PART
1: E
SSEN
TIA
L PR
INC
IPLE
S
42
● Tissue Doppler imagingFor many years Doppler techniques were principally used for assessing themovement of blood in the heart and great vessels. Although otherstructures, including the myocardium, move as well, filtering techniqueswere used to remove the Doppler signals returning from myocardium inorder to optimize the signals relating to blood flow.
However, since the 1990s there has been growing interest in Dopplerassessment of the myocardium (tissue Doppler imaging, TDI). The Dopplersignals returning from myocardium are distinct from signals from blood(myocardial motion generates a stronger but lower-velocity signal) and socan be selected with appropriate filtering. The resulting signals can bedisplayed as colour Doppler images to show myocardial motion (Fig. 4.10)or as spectral PW Doppler traces to assess motion in specific myocardialregions (see Fig. 11.15, p. 135).
LV
Fig. 4.10 Tissue Doppler imaging (LV � left ventricle)
TDI can play a significant role in the assessment of LV function (systolic anddiastolic), in myocardial ischaemia, in distinguishing between constrictivepericarditis and restrictive cardiomyopathy, and in the assessment ofventricular dyssynchrony for cardiac resynchronization therapy.
View Apical 4-chamber
Modality Tissue Doppler imaging

Dop
ple
r p
hysi
cs
43
FURTHER READING
Adeyemi B. British Society of Echocardiography Distance LearningModule 14: Physics of transducers for imaging and Doppler.Available at: www.bsecho.org.
Reynolds T. Ultrasound Physics: A Registry Exam PreparationGuide. Phoenix: School of Cardiac Ultrasound, Arizona HeartInstitute Foundation, 1996.
Van de Veire NR, De Sutter J Bax JJ, et al. Technologicaladvances in tissue Doppler imaging echocardiography. Heart2008; 94: 1065–74.

44
In addition to the technicalities of performing and reporting an echo study,there are wider issues to consider in relation to providing an echo service.This chapter looks at service provision in terms of the departmental andstaffing issues involved, and also examines the question of quality control.
● Departmental issuesThe British Society of Echocardiography (BSE) sets out standards fordepartmental accreditation in the UK, which include (but are not limited to)the following:
● An echo department should have both a technical head and a clinicalhead.
● The department should have agreed indications and minimum standardsfor echo studies and a system for the review of uncertain studies.
● Studies should be triaged according to urgency and systems should bein place to alert clinicians to important abnormalities.
● Studies should be reported on the day they are performed and shouldbe archived for future reference.
● A database of echo reports should be maintained.● Echo rooms should be of adequate size (at least 20 m2 if used for
inpatient studies).● Equipment maintenance must be carried out regularly, with echo
machines being replaced (or having a major upgrade) at least every 5 years.
● A period of 30–40 min should be allowed for routine studies and up to1 h for complex studies.
Service provision45

Serv
ice
pro
visi
on
45
● A patient information leaflet should be available.● Chaperones should be available.
● Staffing issuesTraining and accreditationEcho trainees should have at least one (and ideally two) protected half-daytutorial sessions each week and have access to appropriate training materials(books, CD-ROMs, internet access) and echo meetings. Sonographers whoundertake and report echo studies unsupervised should have appropriateaccreditation.
Undertaking a recognised accreditation programme provides the sonographerwith a structured means of attaining a minimum standard in echo. Althoughgaining accreditation does not in itself guarantee competence, it nonethelessprovides a foundation on which to build one’s knowledge and skills. Theprocess of learning about echo does not end with accreditation, but mustcontinue to develop with continuing professional education and ongoingexperience in performing echo studies, and by seeking reaccreditation atregular intervals.
Several national societies provide accreditation programmes. The BSE offersaccreditation in:
● adult transthoracic echo (TTE)● transoesophageal echo (TOE)● community echo.
The European Association of Echocardiography (EAE) offers accreditation in:
● adult TTE● adult TOE● congenital heart disease echo.
Further details can be obtained from the relevant society’s website (BSE: www.bsecho.org; EAE: www.escardio.org/COMMUNITIES/EAE).
Workforce requirementsIn 1995 the Cardiac Workforce Committee of the British Cardiac Society(now the British Cardiovascular Society) published a report on cardiac
PART
1: E
SSEN
TIA
L PR
INC
IPLE
S
46
workforce requirements in the UK. With regard to echo, the report foundthat the annual requirement for echo studies was as follows:
● TTE 42 800–47 700 per million population● stress echo 6000 per million population● TOE 2000 per million population.
In terms of staffing levels, the report’s authors calculated that therequirements were as follows:
● sonographers (full-time equivalent) 28–40 per million population● consultants specialising in echo 10.3–13 per million population.
Echo departments need to pay careful attention to health and safety,particularly with regard to musculoskeletal and eye problems, liaising withlocal occupational health and risk management departments as appropriate.Sonographers should not perform more than 2000 echo studies per year.
● Quality controlIt should be the aim of every sonographer, and every echo department, toprovide a high-quality echo service. This chapter has already covered the keystaffing and departmental issues that have to be addressed in order to laythe foundations of a high-quality service, However, ensuring that all thefoundations are in place is only half the story – it’s also essential to monitorwhether the echo service is performing as well as it should with an ongoingaudit programme.
Audit is one of the cornerstones of clinical governance, the process by whichhealthcare organizations are accountable for continually improving thequality and safety of their services. Clinical governance is described ashaving seven key foundations or ‘pillars’, all of which have some relevance torunning an echo service:
● audit● risk management● clinical effectiveness and research● education and training● patient and public involvement● staffing and staff management● clinical information.
FURTHER READING
Serv
ice
pro
visi
on
47
Audit is a systematic way of assessing the quality of healthcare and is oftendescribed in terms of an ‘audit cycle’. The cycle begins with the selection ofa topic or ‘question’ to be looked at: with regard to echo, an example mightbe whether a department’s echo reports meet agreed reporting criteria.Next, an appropriate ‘gold standard’ must be chosen, against which thedepartment’s performance will be compared (e.g. national standards on theminimum dataset for an echo report). A method of collecting the data isthen chosen, and then the necessary data are collected and analysed. Theresults are then presented and discussed, comparing the department’sperformance against the agreed standard. Any deficiencies should beidentified (while at the same time recognizing areas of good performance),and a mechanism agreed by which improvements can be made. Any changesshould then be implemented and, after an appropriate timescale, the auditcycle should be repeated to see whether the changes have led to theexpected improvements.
The BSE has several useful documents on its website relating toservice provision (www.bsecho.org). These include:
● What is an Echocardiogram?● Clinical Indications for Echocardiography● Recommendations for Standard Adult Transthoracic
Echocardiography● A Minimum Dataset for a Standard Adult Transthoracic
Echocardiogram● Cardiac Workforce Requirements in the UK● Community Echo Services and Guidance on Commissioning
Echo Services● Chaperones and Echocardiography

This page intentionally left blank

Cardiac ImagingTechniques
1
PART
2PART

This page intentionally left blank
51
● Indications for transthoracic echoThe versatility of transthoracic echo (TTE) means that it can play a useful rolein a diverse range of clinical situations. The British Society of Echocardiography(BSE) has published guidance on the appropriate indications for TTE on itswebsite (see Further Reading). The American College of Cardiology has alsoproduced guidance (jointly with a number of other societies). The two setsof guidelines are broadly similar and describe echo as being an appropriateinvestigation in the assessment of patients with:
● symptoms, signs or previous tests that indicate possible structuralheart disease
● heart murmurs when associated with symptoms or when structuralheart disease is suspected, and the follow-up of those with knownsignificant valvular stenosis or regurgitation
● prosthetic valves (except asymptomatic patients with mechanical valvesor those in whom no further intervention would be undertaken)
● suspected or proven infective endocarditis● known or suspected ischaemic heart disease (e.g. diagnostic stress echo,
assessment following myocardial infarction)● known or suspected cardiomyopathy● suspected pericarditis or pericardial effusion, and follow-up of patients
with known moderate or large pericardial effusions (or small effusionsif there has been a clinical change)
● suspected or possible cardiac masses (and follow-up of patientsfollowing surgical excision of a cardiac mass)
● pulmonary disease (with cardiac involvement)● pulmonary hypertension
The transthoracicecho study4
6
● thromboembolism● neurological disorders (with cardiac involvement)● arrhythmias (with suspected/possible structural heart disease)● syncope (with suspected/possible structural heart disease)● hypertension (if left ventricular hypertrophy (LVH)/dysfunction or
aortic coarctation are suspected)● aortic disease (e.g. monitoring of aortic root dimensions in Marfan
syndrome)● known or suspected congenital heart disease.
It is essential that echo requests contain adequate clinical data both to judgethe appropriateness of the request and also to allow the sonographer toplace the echo findings into an appropriate clinical context (see the box‘Sensitivity, specificity and Bayesian analysis’). Echo requests shouldtherefore carry appropriate clinical details and must contain informationabout known cardiac diagnoses or previous cardiac interventions/surgery(e.g. prosthetic valves). Clinicians requesting echo studies should beencouraged to include specific questions with their request (e.g. ‘Does thispatient have pulmonary hypertension?’), as this provides a clear focus forthe echo study and ensures that the sonographer can address the specificconcerns of the clinician.
PART
2: C
ARD
IAC
IMA
GIN
G T
ECH
NIQ
UES
52
SENSITIVITY, SPECIFICITY AND BAYESIAN ANALYSIS
A perfect diagnostic test would always detect an abnormalitywhen present (‘true positive’) or rule out an abnormality whenabsent (‘true negative’). However, as with virtually every clinicaltest, echo has its limitations and can sometimes produce anerroneous result. Detecting an abnormality when in fact none ispresent is called a ‘false positive’, and missing an abnormality thatis present is a ‘false negative’. The terms sensitivity and specificityare often used to describe the accuracy of a test:
● Sensitivity is the degree to which a test will identify all those whohave a particular disease – if 100 people with disease ‘X’ undergoa test with 90 per cent sensitivity, the test will detect the diseasein 90 of them (but will produce a false negative in 10)
● Specificity is the degree to which a test will identify all thosewithout a particular disease – if 100 people without disease ‘X’undergo a test with 90 per cent specificity, the test will benormal in 90 of them (but will produce a false positive in 10).
i
Tran
stho
raci
c ec
ho s
tud
y
53
Triage of inpatient echo requestsEcho should be performed immediately if acute cardiac tamponade issuspected following an interventional procedure or if a patient presentswith massive pulmonary embolism and echo is likely to help in decidingwhether to administer thrombolysis.
Urgent echo (within 24 hours, or even sooner depending on the clinicalsituation) is required for patients who are unstable with infective endocarditis,who have a new murmur following recent myocardial infarction, who arepersistently hypotensive (and not responding to treatment) for unknownreasons, have suspected pericardial effusion/bleeding/tamponade or havesuspected aortic dissection.
Other inpatient echo requests can be performed more routinely, but shouldnevertheless be undertaken on an inpatient basis as soon as practicable. Ifcircumstances do not permit this, the request should be discussed with thereferring clinician to see if the study can be deferred and performed on anoutpatient basis once the patient is discharged from hospital.
● Patient preparationPatients attending for an echo study may feel anxious, not only about havingthe test itself but also about any abnormalities that it may reveal. To help
The number of people who receive false positive/negative resultsis determined not only by the sensitivity and specificity of the test,but also by the population prevalence of the disease in question.Screening a large number of normal individuals for a rare diseaseusing a test with imperfect specificity will produce a relativelylarge number of false positive results.
The technique of Bayesian analysis takes this into account byconsidering how likely it is that the patient has the disease inquestion (the pretest probability) in order to predict how likely it is that a positive or negative test result is genuinely positive ornegative. In general terms, a positive test result for disease ‘X’ ismore likely to be a true positive if the patient already had a highprobability of having disease ‘X’ before the test was done – it istherefore important to know a patient’s full clinical details beforeperforming a test such as an echo in order to judge the likelysignificance of any abnormalities that you find.
PART
2: C
ARD
IAC
IMA
GIN
G T
ECH
NIQ
UES
54
reduce anxiety the test should be described to patients in clear and reassuringterms – patients should have an explanation of why they are having an echo,whether any special preparation is needed before they attend, what happensduring the scan and how long it will take. Patients should be reassured thathaving an echo is safe and painless. Patients can eat and drink normally beforeattending for a standard TTE, and they can take their medication as usual.
It is good practice to offer patients an information leaflet before they attend(and to make available large print/Braille and translated versions asappropriate). The patient information leaflet and/or appointment letter canalso invite the patient to bring a friend or relative if they wish to havesomeone accompany them during the echo. If a friend or relative does notaccompany the patient when they attend, the patient should be offered a chaperone in line with hospital policy.
Once the patient is in the echo room and you have checked that theyunderstand the test that is about to be performed, you should ask them toundress to the waist for the echo study. Female patients should always beoffered a gown to wear during the echo (even if the sonographer is female).Ask the patient to sit on the echo couch and recline at 45°, rolling on to theirleft side. The patient should then raise their left arm and place their lefthand behind their head. Be sure to check if the patient has any physicallimitations that may make it difficult or uncomfortable for them to adoptthis position. If so, you may need to adapt the patient’s position until theyare comfortable. Sonographers who prefer to scan left-handed will also needto adapt the patient’s positioning accordingly.
When the patient is in a comfortable position, apply the ECG electrodes andensure that a clear ECG tracing is visible on the screen of the echo machine.You may need to adjust the electrodes and/or the ECG gain setting to obtaina good trace. Ensure that the correct patient identification and clinical detailsare entered into the echo machine, and then perform and report the study asdescribed in the sections that follow. At the end of the study, explain to thepatient that you will be writing a report which will be sent to the referringclinician. Patients may ask you what the study has shown, but you should notdiscuss the study findings at this stage and it is usually better to redirectpersistent requests for information to the referring clinician.
● Standard windows and viewsThere are five TTE windows (Fig. 6.1), each providing one or more views ofthe heart. Windows and views listed in brackets are optional and can be
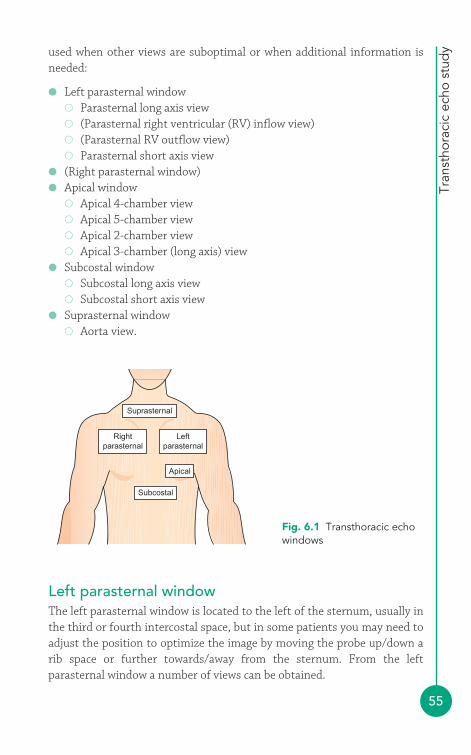
Tran
stho
raci
c ec
ho s
tud
y
55
used when other views are suboptimal or when additional information isneeded:
● Left parasternal window� Parasternal long axis view� (Parasternal right ventricular (RV) inflow view)� (Parasternal RV outflow view)� Parasternal short axis view
● (Right parasternal window)● Apical window
� Apical 4-chamber view� Apical 5-chamber view� Apical 2-chamber view� Apical 3-chamber (long axis) view
● Subcostal window� Subcostal long axis view� Subcostal short axis view
● Suprasternal window� Aorta view.
Apical
Subcostal
Rightparasternal
Suprasternal
Leftparasternal
Fig. 6.1 Transthoracic echowindows
Left parasternal windowThe left parasternal window is located to the left of the sternum, usually inthe third or fourth intercostal space, but in some patients you may need toadjust the position to optimize the image by moving the probe up/down arib space or further towards/away from the sternum. From the leftparasternal window a number of views can be obtained.
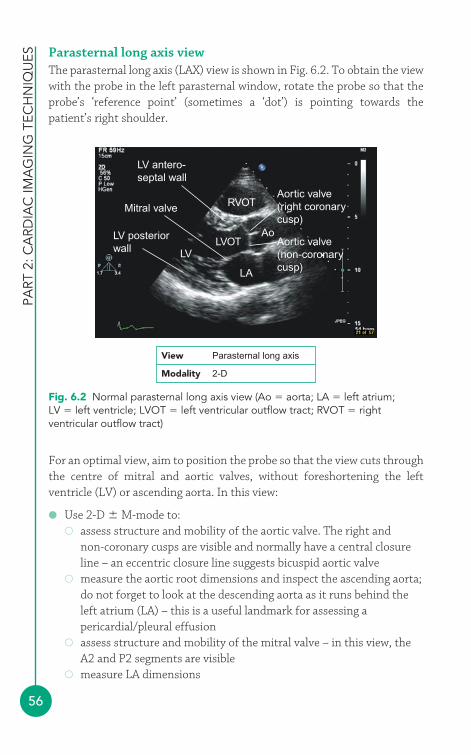
PART
2: C
ARD
IAC
IMA
GIN
G T
ECH
NIQ
UES
56
Parasternal long axis viewThe parasternal long axis (LAX) view is shown in Fig. 6.2. To obtain the viewwith the probe in the left parasternal window, rotate the probe so that theprobe’s ‘reference point’ (sometimes a ‘dot’) is pointing towards thepatient’s right shoulder.
RVOT
LVOT
LA
LV
AoAortic valve(non-coronarycusp)
Aortic valve(right coronarycusp)
LV antero-septal wall
Mitral valve
LV posteriorwall
Fig. 6.2 Normal parasternal long axis view (Ao � aorta; LA � left atrium;LV � left ventricle; LVOT � left ventricular outflow tract; RVOT � rightventricular outflow tract)
View Parasternal long axis
Modality 2-D
For an optimal view, aim to position the probe so that the view cuts throughthe centre of mitral and aortic valves, without foreshortening the leftventricle (LV) or ascending aorta. In this view:
● Use 2-D M-mode to:� assess structure and mobility of the aortic valve. The right and
non-coronary cusps are visible and normally have a central closureline – an eccentric closure line suggests bicuspid aortic valve
� measure the aortic root dimensions and inspect the ascending aorta;do not forget to look at the descending aorta as it runs behind theleft atrium (LA) – this is a useful landmark for assessing apericardial/pleural effusion
� assess structure and mobility of the mitral valve – in this view, theA2 and P2 segments are visible
� measure LA dimensions
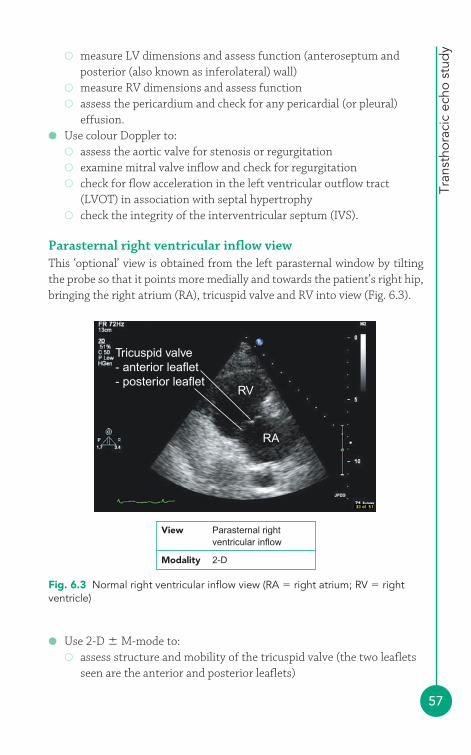
Tran
stho
raci
c ec
ho s
tud
y
57
� measure LV dimensions and assess function (anteroseptum andposterior (also known as inferolateral) wall)
� measure RV dimensions and assess function� assess the pericardium and check for any pericardial (or pleural)
effusion.● Use colour Doppler to:
� assess the aortic valve for stenosis or regurgitation� examine mitral valve inflow and check for regurgitation� check for flow acceleration in the left ventricular outflow tract
(LVOT) in association with septal hypertrophy� check the integrity of the interventricular septum (IVS).
Parasternal right ventricular inflow viewThis ‘optional’ view is obtained from the left parasternal window by tiltingthe probe so that it points more medially and towards the patient’s right hip,bringing the right atrium (RA), tricuspid valve and RV into view (Fig. 6.3).
Tricuspid valve- anterior leaflet- posterior leaflet
RV
RA
Fig. 6.3 Normal right ventricular inflow view (RA � right atrium; RV � rightventricle)
View Parasternal right ventricular inflow
Modality 2-D
● Use 2-D M-mode to:� assess structure and mobility of the tricuspid valve (the two leaflets
seen are the anterior and posterior leaflets)
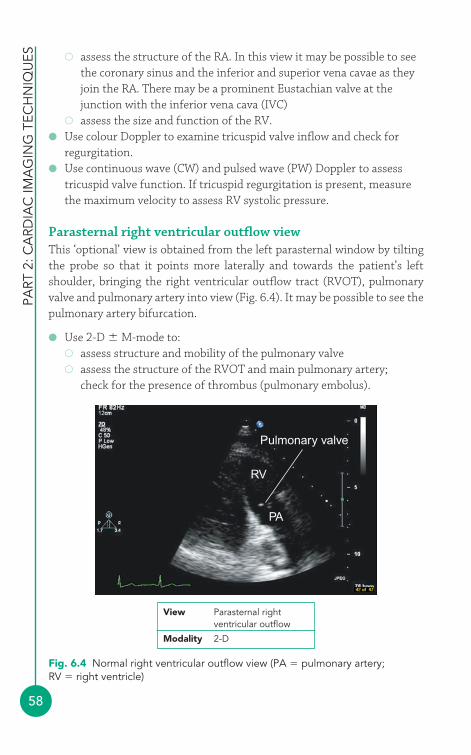
PART
2: C
ARD
IAC
IMA
GIN
G T
ECH
NIQ
UES
58
� assess the structure of the RA. In this view it may be possible to seethe coronary sinus and the inferior and superior vena cavae as theyjoin the RA. There may be a prominent Eustachian valve at thejunction with the inferior vena cava (IVC)
� assess the size and function of the RV.● Use colour Doppler to examine tricuspid valve inflow and check for
regurgitation.● Use continuous wave (CW) and pulsed wave (PW) Doppler to assess
tricuspid valve function. If tricuspid regurgitation is present, measurethe maximum velocity to assess RV systolic pressure.
Parasternal right ventricular outflow viewThis ‘optional’ view is obtained from the left parasternal window by tiltingthe probe so that it points more laterally and towards the patient’s leftshoulder, bringing the right ventricular outflow tract (RVOT), pulmonaryvalve and pulmonary artery into view (Fig. 6.4). It may be possible to see thepulmonary artery bifurcation.
● Use 2-D M-mode to:� assess structure and mobility of the pulmonary valve� assess the structure of the RVOT and main pulmonary artery;
check for the presence of thrombus (pulmonary embolus).
Pulmonary valve
RV
PA
View Parasternal rightventricular outflow
Modality 2-D
Fig. 6.4 Normal right ventricular outflow view (PA � pulmonary artery;RV � right ventricle)
Tran
stho
raci
c ec
ho s
tud
y
59
● Use colour Doppler to examine the pulmonary valve for stenosis orregurgitation.
It may be possible to detect the abnormal jet of a patent ductus arteriosus byexamining the pulmonary artery with colour Doppler in this view.
● Use CW and PW Doppler to:� assess flow in the RVOT� assess the pulmonary valve for stenosis or regurgitation.
Parasternal short axis viewTo obtain the parasternal short axis (SAX) view, keep the probe in the leftparasternal window and rotate it so that the ‘dot’ is pointing towards thepatient’s left shoulder. There are actually three SAX views, obtained bytilting the probe along the axis of the heart from the level of the aortic valvedown to the apex. The standard SAX views are:
● aortic valve level● mitral valve level● papillary muscle level.
At the aortic valve level (Fig. 6.5):
● Use 2-D M-mode to:� assess structure and mobility of the aortic valve; all three cusps
should be visible� inspect the LA and RA and interatrial septum� assess structure and mobility of the tricuspid valve (the two leaflets
seen are the septal and anterior leaflets)� assess RV size and function� assess size of the RVOT� assess structure and mobility of the pulmonary valve� assess morphology of the main pulmonary artery up to its
bifurcation.
You may be able to inspect the origins of the left main stem and rightcoronary arteries arising just above the aortic valve cusps.
● Use colour Doppler to:� check the integrity of the interatrial septum� examine the aortic valve for regurgitation� examine tricuspid valve inflow and check for regurgitation� examine the pulmonary valve for stenosis or regurgitation
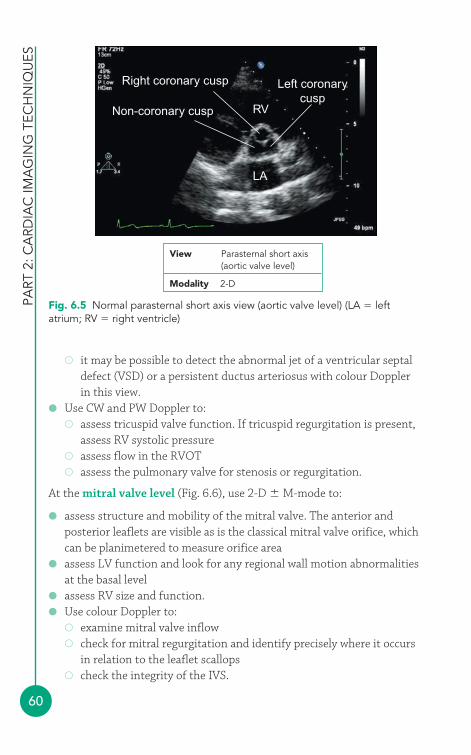
PART
2: C
ARD
IAC
IMA
GIN
G T
ECH
NIQ
UES
60
� it may be possible to detect the abnormal jet of a ventricular septaldefect (VSD) or a persistent ductus arteriosus with colour Doppler in this view.
● Use CW and PW Doppler to:� assess tricuspid valve function. If tricuspid regurgitation is present,
assess RV systolic pressure� assess flow in the RVOT� assess the pulmonary valve for stenosis or regurgitation.
At the mitral valve level (Fig. 6.6), use 2-D M-mode to:
● assess structure and mobility of the mitral valve. The anterior andposterior leaflets are visible as is the classical mitral valve orifice, whichcan be planimetered to measure orifice area
● assess LV function and look for any regional wall motion abnormalitiesat the basal level
● assess RV size and function.● Use colour Doppler to:
� examine mitral valve inflow� check for mitral regurgitation and identify precisely where it occurs
in relation to the leaflet scallops� check the integrity of the IVS.
Right coronary cusp Left coronarycusp
RV
LA
Non-coronary cusp
View Parasternal short axis(aortic valve level)
Modality 2-D
Fig. 6.5 Normal parasternal short axis view (aortic valve level) (LA � leftatrium; RV � right ventricle)

Tran
stho
raci
c ec
ho s
tud
y
61
View Parasternal short axis(mitral valve level)
Modality 2-D
RV
Mitral valve
Fig. 6.6 Normal parasternal short axis view (mitral valve level) (RV � right ventricle)
● At the papillary muscle level (Fig. 6.7), use 2-D M-mode to:� assess structure of the posteromedial and anterolateral papillary
muscles
Posteromedialpapillary muscle RV
Anterolateralpapillary muscle
Fig. 6.7 Normal parasternal short axis view (papillary muscle level) (RV � rightventricle)
View Parasternal short axis(papillary muscle level)
Modality 2-D
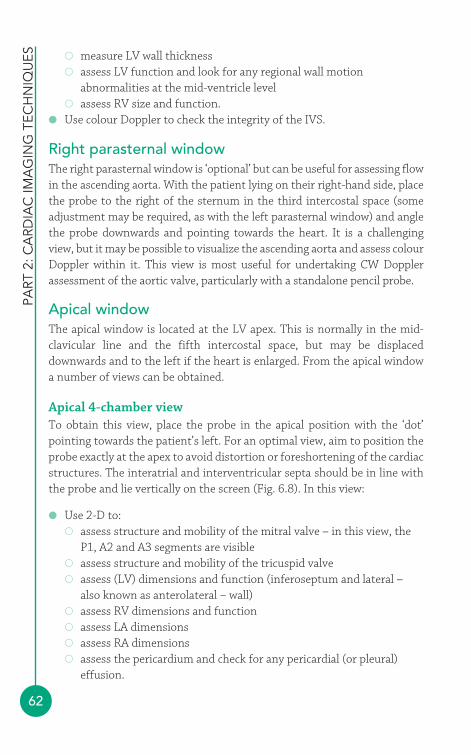
PART
2: C
ARD
IAC
IMA
GIN
G T
ECH
NIQ
UES
62
� measure LV wall thickness� assess LV function and look for any regional wall motion
abnormalities at the mid-ventricle level� assess RV size and function.
● Use colour Doppler to check the integrity of the IVS.
Right parasternal windowThe right parasternal window is ‘optional’ but can be useful for assessing flowin the ascending aorta. With the patient lying on their right-hand side, placethe probe to the right of the sternum in the third intercostal space (someadjustment may be required, as with the left parasternal window) and anglethe probe downwards and pointing towards the heart. It is a challengingview, but it may be possible to visualize the ascending aorta and assess colourDoppler within it. This view is most useful for undertaking CW Dopplerassessment of the aortic valve, particularly with a standalone pencil probe.
Apical windowThe apical window is located at the LV apex. This is normally in the mid-clavicular line and the fifth intercostal space, but may be displaceddownwards and to the left if the heart is enlarged. From the apical windowa number of views can be obtained.
Apical 4-chamber viewTo obtain this view, place the probe in the apical position with the ‘dot’pointing towards the patient’s left. For an optimal view, aim to position theprobe exactly at the apex to avoid distortion or foreshortening of the cardiacstructures. The interatrial and interventricular septa should be in line withthe probe and lie vertically on the screen (Fig. 6.8). In this view:
● Use 2-D to:� assess structure and mobility of the mitral valve – in this view, the
P1, A2 and A3 segments are visible� assess structure and mobility of the tricuspid valve� assess (LV) dimensions and function (inferoseptum and lateral –
also known as anterolateral – wall)� assess RV dimensions and function� assess LA dimensions� assess RA dimensions� assess the pericardium and check for any pericardial (or pleural)
effusion.
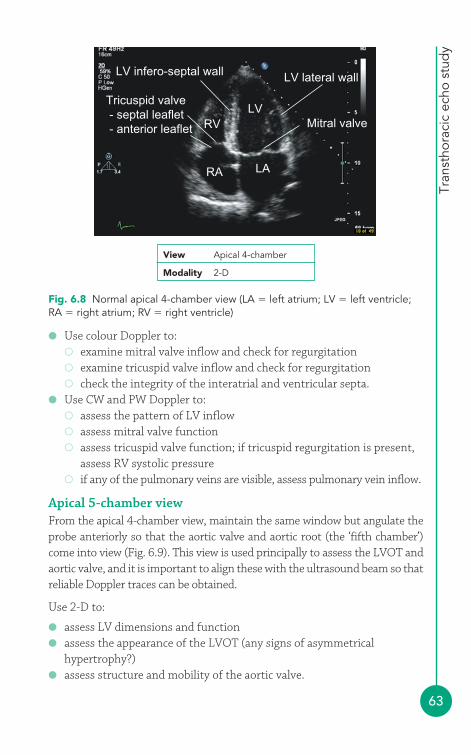
Tran
stho
raci
c ec
ho s
tud
y
63
● Use colour Doppler to:� examine mitral valve inflow and check for regurgitation� examine tricuspid valve inflow and check for regurgitation� check the integrity of the interatrial and ventricular septa.
● Use CW and PW Doppler to:� assess the pattern of LV inflow� assess mitral valve function� assess tricuspid valve function; if tricuspid regurgitation is present,
assess RV systolic pressure� if any of the pulmonary veins are visible, assess pulmonary vein inflow.
Apical 5-chamber viewFrom the apical 4-chamber view, maintain the same window but angulate theprobe anteriorly so that the aortic valve and aortic root (the ‘fifth chamber’)come into view (Fig. 6.9). This view is used principally to assess the LVOT andaortic valve, and it is important to align these with the ultrasound beam so thatreliable Doppler traces can be obtained.
Use 2-D to:
● assess LV dimensions and function● assess the appearance of the LVOT (any signs of asymmetrical
hypertrophy?)● assess structure and mobility of the aortic valve.
Tricuspid valve - septal leaflet - anterior leaflet
LV infero-septal wall
RA
RV
LV lateral wall
Mitral valveLV
LA
View Apical 4-chamber
Modality 2-D
Fig. 6.8 Normal apical 4-chamber view (LA � left atrium; LV � left ventricle;RA � right atrium; RV � right ventricle)
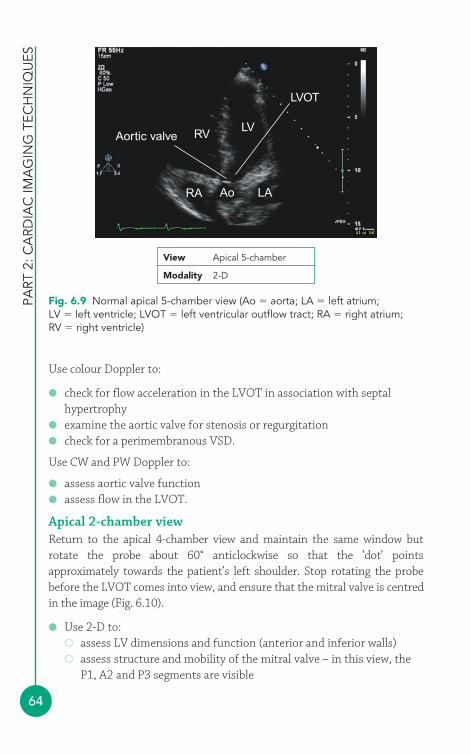
PART
2: C
ARD
IAC
IMA
GIN
G T
ECH
NIQ
UES
64
Use colour Doppler to:
● check for flow acceleration in the LVOT in association with septalhypertrophy
● examine the aortic valve for stenosis or regurgitation● check for a perimembranous VSD.
Use CW and PW Doppler to:
● assess aortic valve function● assess flow in the LVOT.
Apical 2-chamber viewReturn to the apical 4-chamber view and maintain the same window butrotate the probe about 60° anticlockwise so that the ‘dot’ pointsapproximately towards the patient’s left shoulder. Stop rotating the probebefore the LVOT comes into view, and ensure that the mitral valve is centredin the image (Fig. 6.10).
● Use 2-D to:� assess LV dimensions and function (anterior and inferior walls)� assess structure and mobility of the mitral valve – in this view, the
P1, A2 and P3 segments are visible
Aortic valve
LVOT
RV
RA Ao LA
LV
Fig. 6.9 Normal apical 5-chamber view (Ao � aorta; LA � left atrium;LV � left ventricle; LVOT � left ventricular outflow tract; RA � right atrium;RV � right ventricle)
View Apical 5-chamber
Modality 2-D
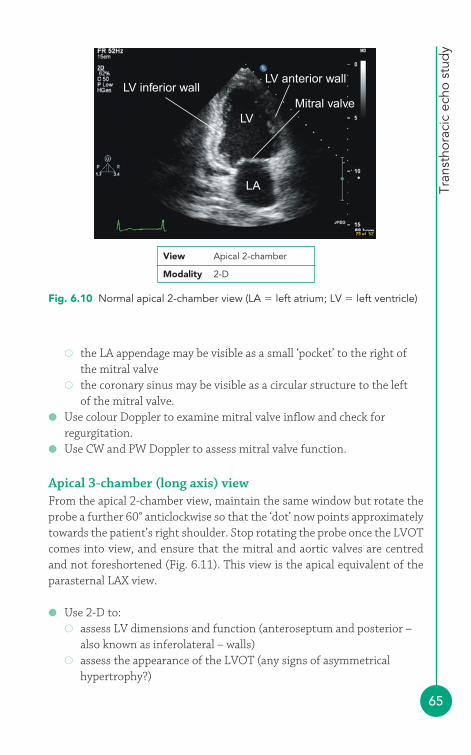
Tran
stho
raci
c ec
ho s
tud
y
65
� the LA appendage may be visible as a small ‘pocket’ to the right ofthe mitral valve
� the coronary sinus may be visible as a circular structure to the left of the mitral valve.
● Use colour Doppler to examine mitral valve inflow and check forregurgitation.
● Use CW and PW Doppler to assess mitral valve function.
Apical 3-chamber (long axis) viewFrom the apical 2-chamber view, maintain the same window but rotate theprobe a further 60° anticlockwise so that the ‘dot’ now points approximatelytowards the patient’s right shoulder. Stop rotating the probe once the LVOTcomes into view, and ensure that the mitral and aortic valves are centredand not foreshortened (Fig. 6.11). This view is the apical equivalent of theparasternal LAX view.
● Use 2-D to:� assess LV dimensions and function (anteroseptum and posterior –
also known as inferolateral – walls)� assess the appearance of the LVOT (any signs of asymmetrical
hypertrophy?)
Fig. 6.10 Normal apical 2-chamber view (LA � left atrium; LV � left ventricle)
View Apical 2-chamber
Modality 2-D
LV inferior wallLV anterior wall
Mitral valveLV
LA
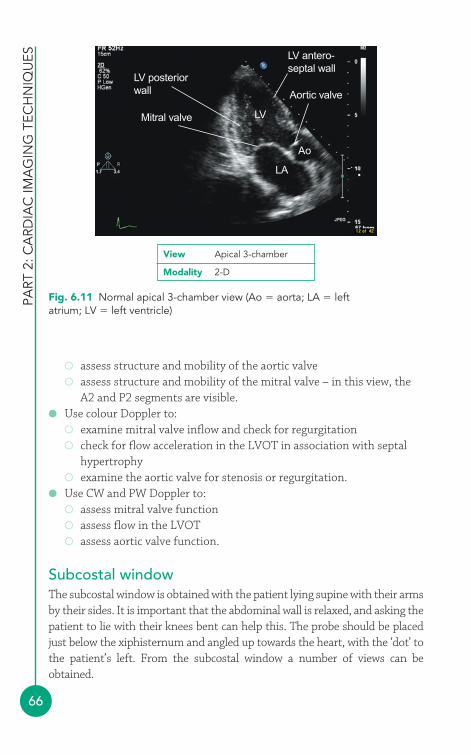
PART
2: C
ARD
IAC
IMA
GIN
G T
ECH
NIQ
UES
66
� assess structure and mobility of the aortic valve� assess structure and mobility of the mitral valve – in this view, the
A2 and P2 segments are visible.● Use colour Doppler to:
� examine mitral valve inflow and check for regurgitation� check for flow acceleration in the LVOT in association with septal
hypertrophy� examine the aortic valve for stenosis or regurgitation.
● Use CW and PW Doppler to:� assess mitral valve function� assess flow in the LVOT� assess aortic valve function.
Subcostal windowThe subcostal window is obtained with the patient lying supine with their armsby their sides. It is important that the abdominal wall is relaxed, and asking thepatient to lie with their knees bent can help this. The probe should be placedjust below the xiphisternum and angled up towards the heart, with the ‘dot’ tothe patient’s left. From the subcostal window a number of views can beobtained.
LV posteriorwall
Mitral valve
Aortic valve
LV antero-septal wall
LA
LV
Ao
Fig. 6.11 Normal apical 3-chamber view (Ao � aorta; LA � leftatrium; LV � left ventricle)
View Apical 3-chamber
Modality 2-D
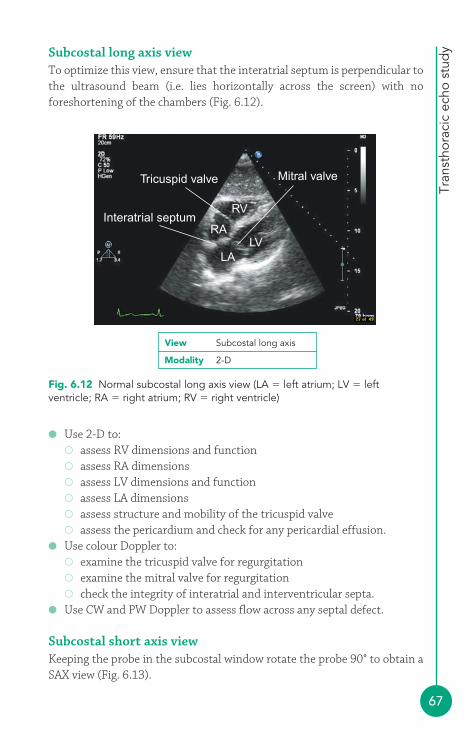
Tran
stho
raci
c ec
ho s
tud
y
67
Subcostal long axis viewTo optimize this view, ensure that the interatrial septum is perpendicular tothe ultrasound beam (i.e. lies horizontally across the screen) with noforeshortening of the chambers (Fig. 6.12).
RV
Mitral valveTricuspid valve
Interatrial septumRA
LVLA
Fig. 6.12 Normal subcostal long axis view (LA � left atrium; LV � leftventricle; RA � right atrium; RV � right ventricle)
View Subcostal long axis
Modality 2-D
● Use 2-D to:� assess RV dimensions and function� assess RA dimensions� assess LV dimensions and function� assess LA dimensions� assess structure and mobility of the tricuspid valve� assess the pericardium and check for any pericardial effusion.
● Use colour Doppler to:� examine the tricuspid valve for regurgitation� examine the mitral valve for regurgitation� check the integrity of interatrial and interventricular septa.
● Use CW and PW Doppler to assess flow across any septal defect.
Subcostal short axis viewKeeping the probe in the subcostal window rotate the probe 90° to obtain aSAX view (Fig. 6.13).
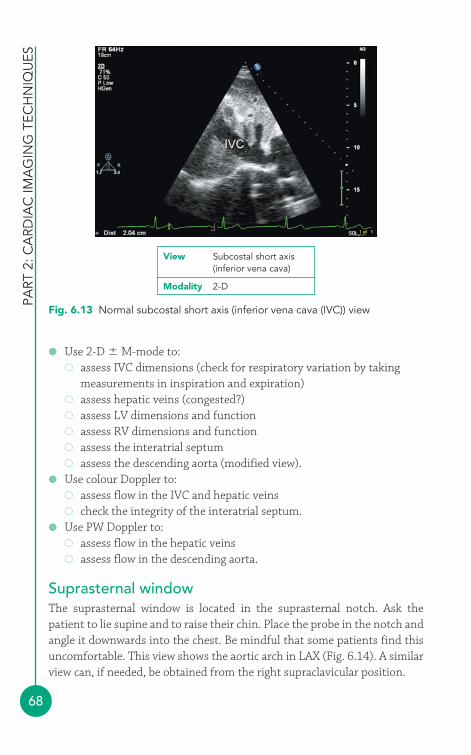
PART
2: C
ARD
IAC
IMA
GIN
G T
ECH
NIQ
UES
68
● Use 2-D M-mode to:� assess IVC dimensions (check for respiratory variation by taking
measurements in inspiration and expiration)� assess hepatic veins (congested?)� assess LV dimensions and function� assess RV dimensions and function� assess the interatrial septum� assess the descending aorta (modified view).
● Use colour Doppler to:� assess flow in the IVC and hepatic veins� check the integrity of the interatrial septum.
● Use PW Doppler to:� assess flow in the hepatic veins� assess flow in the descending aorta.
Suprasternal windowThe suprasternal window is located in the suprasternal notch. Ask thepatient to lie supine and to raise their chin. Place the probe in the notch andangle it downwards into the chest. Be mindful that some patients find thisuncomfortable. This view shows the aortic arch in LAX (Fig. 6.14). A similarview can, if needed, be obtained from the right supraclavicular position.
IVC
Fig. 6.13 Normal subcostal short axis (inferior vena cava (IVC)) view
View Subcostal short axis(inferior vena cava)
Modality 2-D
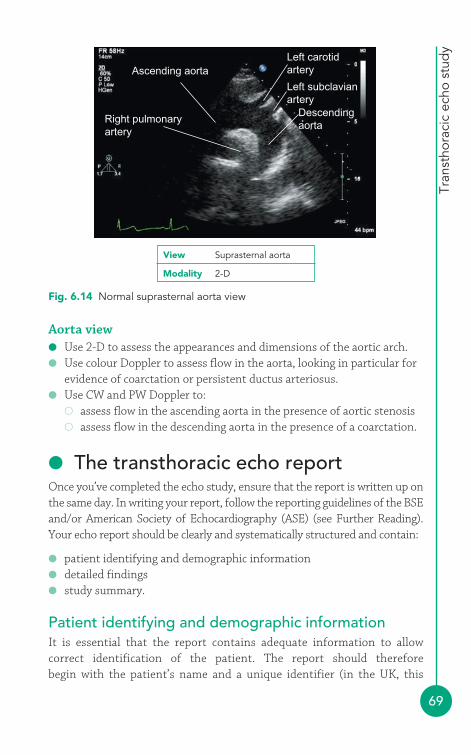
Tran
stho
raci
c ec
ho s
tud
y
69
Ascending aortaLeft carotidartery
Left subclavianartery
Descendingaorta
Right pulmonaryartery
Fig. 6.14 Normal suprasternal aorta view
View Suprasternal aorta
Modality 2-D
Aorta view● Use 2-D to assess the appearances and dimensions of the aortic arch.● Use colour Doppler to assess flow in the aorta, looking in particular for
evidence of coarctation or persistent ductus arteriosus.● Use CW and PW Doppler to:
� assess flow in the ascending aorta in the presence of aortic stenosis� assess flow in the descending aorta in the presence of a coarctation.
● The transthoracic echo reportOnce you’ve completed the echo study, ensure that the report is written up onthe same day. In writing your report, follow the reporting guidelines of the BSEand/or American Society of Echocardiography (ASE) (see Further Reading).Your echo report should be clearly and systematically structured and contain:
● patient identifying and demographic information● detailed findings● study summary.
Patient identifying and demographic informationIt is essential that the report contains adequate information to allowcorrect identification of the patient. The report should therefore begin with the patient’s name and a unique identifier (in the UK, this
PART
2: C
ARD
IAC
IMA
GIN
G T
ECH
NIQ
UES
70
would be the patient’s National Health Service (NHS) number). Thepatient’s age (or date of birth) and gender should be stated. The reportmust also identify the referring clinician and the sonographer and statethe indication for the echo request and the date on which the study wasperformed.
It may also be appropriate to include the patient’s location (e.g. outpatientor name of ward), where the study was performed (e.g. echo department,coronary care unit), when the echo was requested and whether it wasperformed as an emergency/urgent/routine study. It is helpful to includedetails of the patient’s height, weight and blood pressure (e.g. for indexingmeasurements to body surface area). You may also wish to include anydetails that will assist in retrieving the archived echo images for review (e.g.computer disk or videotape number).
Detailed findingsThe main body of your echo report should contain systematic descriptionsof each of the main cardiac structures (chambers, valves, great vessels andpericardium). For each structure you need to describe its appearance andalso its function, grading any abnormalities as mild, moderate or severewhere possible (and supporting these statements with measurementswhere appropriate).
It is usually easiest to set out your study findings by anatomical structure(e.g. mitral valve, LV, etc.) rather than by echo window or modality (whichcan make the report confusing and repetitive). You can simply describe thefindings relating to each anatomical structure in turn, or you may prefer toadapt the list of findings so that the most significant abnormalities appearat the start. Any relevant measurements (M-mode, 2-D and Doppler) andcalculations can be included in the descriptive text of each anatomicalstructure, or if you prefer as a separate section.
The BSE Minimum Dataset for a Standard Adult TransthoracicEchocardiogram describes the essential information you need to include ina standard echo report (see Further Reading). It is important to usestandardized terminology in your report to minimize variability betweenstudies performed at different times and by different sonographers. TheBSE and ASE reporting guidelines contain tables of recommendeddescriptive terms and diagnostic statements and it can be very helpful touse these guidelines as a reference when writing up your study findings.
Tran
stho
raci
c ec
ho s
tud
y
71
Study summaryThe study summary should sum up the key findings of the echo study and placethe findings in a clinical context, with particular reference to the clinicalquestion(s) posed by the referring clinician. The summary should not containany information about the study that hasn’t already been included in thedetailed technical report, but it can include reference to previous studiesperformed on the same patient where a comparison is useful. Any technicallimitations of the study (such as suboptimal imaging windows) should bementioned, and if any structures could not be adequately assessed this must behighlighted so that the referring clinician can consider alternative imaging asnecessary. Clinical advice should not normally be offered in the study summary.
FURTHER READING
Douglas PS, Khandheria B, Stainback RF, et al. ACCF/ASE/ACEP/ASNC/SCAI/SCCT/SCMR Appropriateness criteria fortransthoracic and transesophageal echocardiography. J AmColl Cardiol 2007; 50: 187–204.
The British Society of Echocardiography has several useful documentsrelating to TTE on its website (www.bsecho.org). These include:
A Minimum Dataset for a Standard Adult TransthoracicEchocardiogram
Chaperones and Echocardiography
Clinical Indications for Echocardiography
Recommendations for Standard Adult TransthoracicEchocardiography
The ASE has published Recommendations for a StandardizedReport for Adult Transthoracic Echocardiography, which isavailable on its website (www.asecho.org).

72
It is beyond the scope of this textbook to provide a comprehensive overviewof transoesophageal echo (TOE), but for anyone performing transthoracicecho (TTE) it is important to know how it fits into the cardiac imagingarmamentarium.
● Indications for transoesophageal echoThe key difference between TTE and TOE is that for a TOE study the echoprobe views the heart from within the patient’s oesophagus rather than viathe chest wall (Fig. 7.1). The advantage of this is that it allows for superiorimage quality – the proximity of the probe to the heart means that theultrasound does not need to penetrate so deeply, and so higher ultrasoundfrequencies can be used (giving higher image resolution). The fact that theTOE probe lies behind the back of the heart also means that certainstructures – such as the left atrial (LA) appendage and pulmonary veins – canbe seen more clearly than with a transthoracic study.
Thetransoesophagealecho study
7
TOEtransducer
Oesophagus
Heart
Fig. 7.1 Transoeso-phageal echo (TOE)
Tran
soes
opha
gea
l ech
o st
udy
73
The superior image quality of TOE means that it is generally indicated insituations where TTE is unable to deliver the image quality required to makea diagnosis. The commonest indications for a TOE study includeassessment of:
● cardiac source of emboli● atrial fibrillation/flutter, to judge thromboembolic risk (and thus guide
decisions on anticoagulation and cardioversion)● suspected or proven infective endocarditis● aortic diseases (e.g. aortic dissection/trauma)● regurgitant heart valves, to judge suitability for surgical repair● prosthetic valves (especially those in the mitral position)● cardiac masses● congenital heart disease and intracardiac shunts, e.g. atrial septal defect
(ASD), patent foramen ovale (PFO).
TOE plays a major role in the cardiothoracic intraoperative setting,particularly in relation to valve repair and replacement, and also in thecardiac catheter laboratory for guiding device closure of ASD or PFO. TOEcan also be useful in the intensive care unit, where the image quality of TTEis often limited in ventilated patients, and as well as being a diagnostic toolit can also help in haemodynamic monitoring.
CONTRAINDICATIONS TO A TOE STUDY
Any history of difficulty in swallowing should be investigatedbefore a TOE study can be considered. A TOE study iscontraindicated by:
● patient refusal● cervical spine instability● any abnormality posing a risk of oesophageal or gastric
perforation, e.g. oesophageal obstruction (e.g. stricture,tumour), oesophageal trauma, oesophageal fistula ordiverticulum.
Relative contraindications include the presence of clottingdisorders, large hiatus hernia (apposition of the probe to theoesophageal wall can be difficult), oesophageal varices or uppergastrointestinal haemorrhage.
i
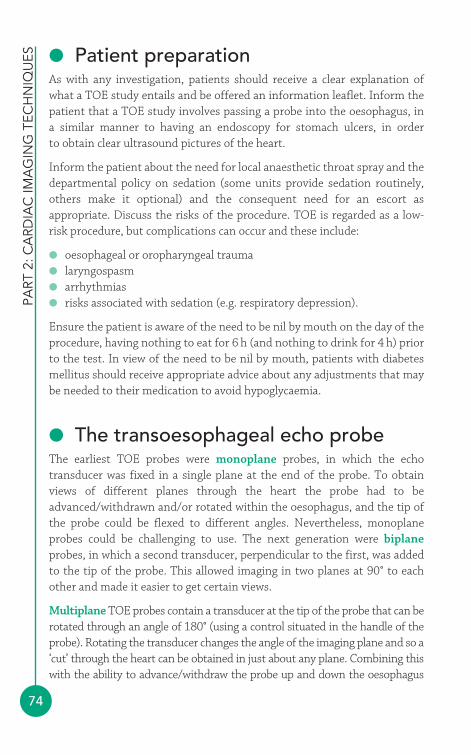
PART
2: C
ARD
IAC
IMA
GIN
G T
ECH
NIQ
UES
74
● Patient preparationAs with any investigation, patients should receive a clear explanation ofwhat a TOE study entails and be offered an information leaflet. Inform thepatient that a TOE study involves passing a probe into the oesophagus, in a similar manner to having an endoscopy for stomach ulcers, in order to obtain clear ultrasound pictures of the heart.
Inform the patient about the need for local anaesthetic throat spray and thedepartmental policy on sedation (some units provide sedation routinely,others make it optional) and the consequent need for an escort asappropriate. Discuss the risks of the procedure. TOE is regarded as a low-risk procedure, but complications can occur and these include:
● oesophageal or oropharyngeal trauma● laryngospasm● arrhythmias● risks associated with sedation (e.g. respiratory depression).
Ensure the patient is aware of the need to be nil by mouth on the day of theprocedure, having nothing to eat for 6 h (and nothing to drink for 4 h) priorto the test. In view of the need to be nil by mouth, patients with diabetesmellitus should receive appropriate advice about any adjustments that maybe needed to their medication to avoid hypoglycaemia.
● The transoesophageal echo probeThe earliest TOE probes were monoplane probes, in which the echotransducer was fixed in a single plane at the end of the probe. To obtainviews of different planes through the heart the probe had to beadvanced/withdrawn and/or rotated within the oesophagus, and the tip ofthe probe could be flexed to different angles. Nevertheless, monoplaneprobes could be challenging to use. The next generation were biplaneprobes, in which a second transducer, perpendicular to the first, was addedto the tip of the probe. This allowed imaging in two planes at 90° to eachother and made it easier to get certain views.
Multiplane TOE probes contain a transducer at the tip of the probe that can berotated through an angle of 180° (using a control situated in the handle of theprobe). Rotating the transducer changes the angle of the imaging plane and so a‘cut’ through the heart can be obtained in just about any plane. Combining thiswith the ability to advance/withdraw the probe up and down the oesophagus
Tran
soes
opha
gea
l ech
o st
udy(and stomach), to rotate the probe to the left or right, and to flex the tip of the
probe to the left/right and anteriorly/posteriorly, means that a comprehensivestudy can be undertaken utilizing a wide range of imaging planes.
● Performing the transoesophagealecho studyA standard diagnostic TOE study is usually performed by a team of staffincluding a clinician sonographer, a technician sonographer and a nurseexperienced in airway management. The study is performed in a roomcontaining a couch for the patient, an echo machine and TOE probe (withfacilities for cleaning/sterilizing the probe between studies), a supply ofoxygen, suction apparatus, a pulse oximeter, blood pressure monitoring,appropriate drugs for the procedure, and a fully equipped resuscitation trolley.
Prior to undertaking the TOE study, ensure that the patient understandswhat is planned and has given informed consent, and check that they havebeen nil by mouth for the required period. Review the patient’s history andprior investigation findings and check for contraindications or anything thatmay increase the risk of complications (e.g. respiratory disorders). Obtainintravenous access and check the blood glucose of patients with diabetes, andthe international normalized ratio (INR) of patients taking warfarin.
Attach the ECG electrodes of the echo machine and use these to monitor thepatient’s heart rate and rhythm during the study. Use an automated cuff tocheck blood pressure at regular intervals, and monitor arterial oxygensaturations continuously using pulse oximetry, providing the patient withinspired oxygen via nasal cannulae as appropriate.
Check if the patient has any loose teeth, and check for (and remove)dentures. Administer local anaesthetic throat spray and allow up to 5 minfor it to take full effect. Before giving sedation (where necessary), ask thepatient to lie on the couch on their left-hand side, facing towards thesonographer. Follow local protocols with regard to sedation – many unitsoffer midazolam, the effects of which can be reversed with flumazenil(which must be available for immediate use in case of respiratorydepression). Before giving sedation, check that appropriate transport/escortarrangements are in place for the patient’s discharge after the procedure.
When you are ready to begin the study, place a bite guard in the patient’smouth and flex their neck slightly, with the chin towards the chest. Flex thetip of the TOE probe and apply gel for lubrication. Next, pass the tip of the
75
PART
2: C
ARD
IAC
IMA
GIN
G T
ECH
NIQ
UES
76
probe into the patient’s mouth and, gently advancing it, ask the patient toswallow. Once the probe has passed round the back of the throat, start tostraighten the tip of the probe and gently advance it to mid-oesophagus level,usually 30–40 cm (distances are marked along the side of the probe). Neveradvance the probe against resistance. When the patient has got used to theprobe (some retching is common initially), commence the study while keepinga careful watch on their pulse, blood pressure and oxygen saturations.
● The ‘standard’ transoesophageal echo studyThere is no fixed ‘routine’ to performing a TOE study and many operators willbegin a study by assessing the most relevant pathology first. This is because thestudy may need to be cut short if the patient is unable to tolerate it or if thereare arrhythmias and/or haemodynamic instability. Once the main aim of thestudy has been addressed, you should move on to look at the rest of the heartin a systematic manner, being sure not to overlook any coexistent pathology.
Mid-oesophageal viewsWith the probe in mid-oesophagus a wide range of views can be obtained.Starting with the transducer at an angle of 40° (all angles quoted areapproximate), the aortic valve is seen in short axis together withsurrounding structures (Fig. 7.2). Rotating a little further to 60° brings thepulmonary and tricuspid valves into view, and then further rotation to 130°provides a long-axis view of the left heart with clear views of both the aorticand mitral valves (Fig. 7.3).
Centring the image on the mitral valve, rotation of the transducer back to90° provides a 2-chamber view of the left heart (usually including a goodview of the LA appendage), and rotating further back to 60° reveals abicommissural view of the mitral valve. Returning to a transducer angle of
CONSCIOUS SEDATION
Where sedation is given, the aim is to achieve conscious sedation –the patient should still be able to respond to verbal instructions(such as ‘open your eyes’) from the sonographer. Oversedation tothe point of unconsciousness carries a significant risk of respiratorydepression for the patient (and litigation for the sonographer!).
i
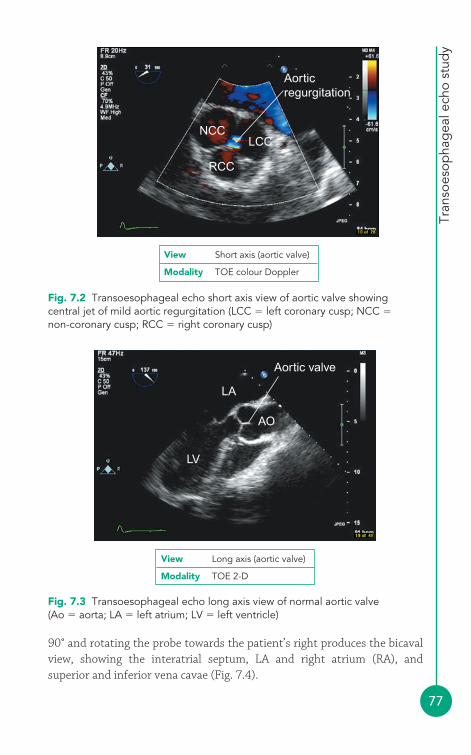
Tran
soes
opha
gea
l ech
o st
udy
77
Aorticregurgitation
NCCLCC
RCC
Fig. 7.2 Transoesophageal echo short axis view of aortic valve showingcentral jet of mild aortic regurgitation (LCC � left coronary cusp; NCC �
non-coronary cusp; RCC � right coronary cusp)
Fig. 7.3 Transoesophageal echo long axis view of normal aortic valve(Ao � aorta; LA � left atrium; LV � left ventricle)
Aortic valve
LA
AO
LV
View Short axis (aortic valve)
Modality TOE colour Doppler
View Long axis (aortic valve)
Modality TOE 2-D
90° and rotating the probe towards the patient’s right produces the bicavalview, showing the interatrial septum, LA and right atrium (RA), andsuperior and inferior vena cavae (Fig. 7.4).
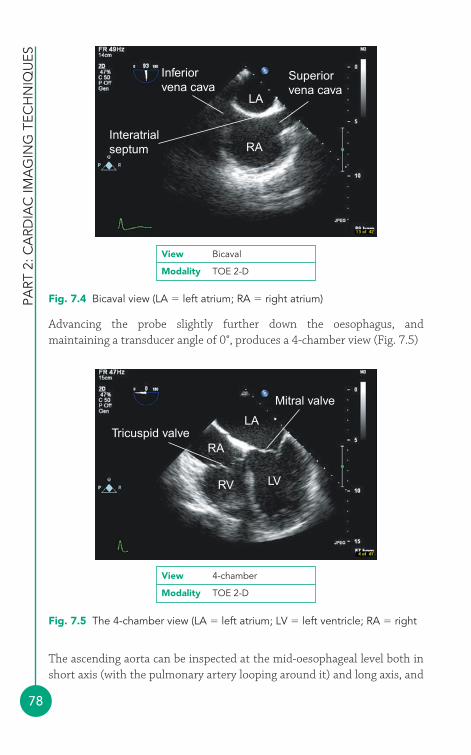
PART
2: C
ARD
IAC
IMA
GIN
G T
ECH
NIQ
UES
78
Advancing the probe slightly further down the oesophagus, andmaintaining a transducer angle of 0°, produces a 4-chamber view (Fig. 7.5)
RV
RATricuspid valve
Mitral valve
LA
LV
Fig. 7.5 The 4-chamber view (LA � left atrium; LV � left ventricle; RA � right
View 4-chamber
Modality TOE 2-D
The ascending aorta can be inspected at the mid-oesophageal level both inshort axis (with the pulmonary artery looping around it) and long axis, and
Inferiorvena cava
Superiorvena cava
LA
RAInteratrialseptum
Fig. 7.4 Bicaval view (LA � left atrium; RA � right atrium)
View Bicaval
Modality TOE 2-D
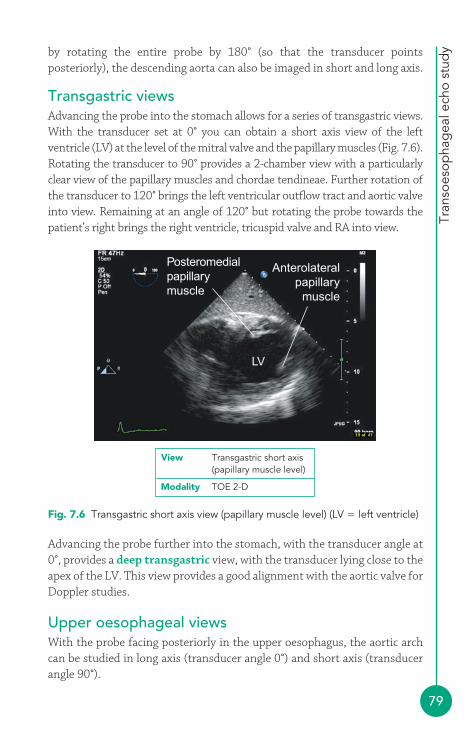
Tran
soes
opha
gea
l ech
o st
udy
79
by rotating the entire probe by 180° (so that the transducer pointsposteriorly), the descending aorta can also be imaged in short and long axis.
Transgastric viewsAdvancing the probe into the stomach allows for a series of transgastric views.With the transducer set at 0° you can obtain a short axis view of the leftventricle (LV) at the level of the mitral valve and the papillary muscles (Fig. 7.6).Rotating the transducer to 90° provides a 2-chamber view with a particularlyclear view of the papillary muscles and chordae tendineae. Further rotation ofthe transducer to 120° brings the left ventricular outflow tract and aortic valveinto view. Remaining at an angle of 120° but rotating the probe towards thepatient’s right brings the right ventricle, tricuspid valve and RA into view.
Posteromedialpapillarymuscle
LV
Anterolateralpapillary
muscle
Fig. 7.6 Transgastric short axis view (papillary muscle level) (LV � left ventricle)
View Transgastric short axis(papillary muscle level)
Modality TOE 2-D
Advancing the probe further into the stomach, with the transducer angle at0°, provides a deep transgastric view, with the transducer lying close to theapex of the LV. This view provides a good alignment with the aortic valve forDoppler studies.
Upper oesophageal viewsWith the probe facing posteriorly in the upper oesophagus, the aortic archcan be studied in long axis (transducer angle 0°) and short axis (transducerangle 90°).
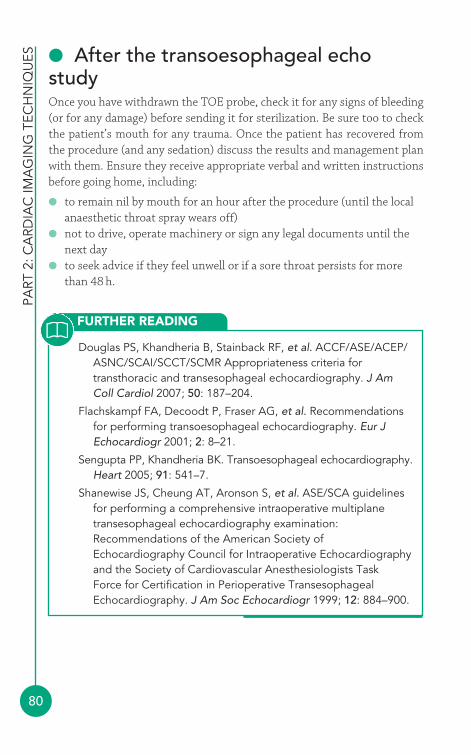
PART
2: C
ARD
IAC
IMA
GIN
G T
ECH
NIQ
UES
80
● After the transoesophageal echostudyOnce you have withdrawn the TOE probe, check it for any signs of bleeding(or for any damage) before sending it for sterilization. Be sure too to checkthe patient’s mouth for any trauma. Once the patient has recovered fromthe procedure (and any sedation) discuss the results and management planwith them. Ensure they receive appropriate verbal and written instructionsbefore going home, including:
● to remain nil by mouth for an hour after the procedure (until the localanaesthetic throat spray wears off)
● not to drive, operate machinery or sign any legal documents until thenext day
● to seek advice if they feel unwell or if a sore throat persists for morethan 48 h.
FURTHER READING
Douglas PS, Khandheria B, Stainback RF, et al. ACCF/ASE/ACEP/ASNC/SCAI/SCCT/SCMR Appropriateness criteria fortransthoracic and transesophageal echocardiography. J AmColl Cardiol 2007; 50: 187–204.
Flachskampf FA, Decoodt P, Fraser AG, et al. Recommendationsfor performing transoesophageal echocardiography. Eur JEchocardiogr 2001; 2: 8–21.
Sengupta PP, Khandheria BK. Transoesophageal echocardiography.Heart 2005; 91: 541–7.
Shanewise JS, Cheung AT, Aronson S, et al. ASE/SCA guidelinesfor performing a comprehensive intraoperative multiplanetransesophageal echocardiography examination:Recommendations of the American Society ofEchocardiography Council for Intraoperative Echocardiographyand the Society of Cardiovascular Anesthesiologists Task Force for Certification in Perioperative TransesophagealEchocardiography. J Am Soc Echocardiogr 1999; 12: 884–900.
81
Stress echo is based upon the principle that an abnormality in myocardialperfusion leads to a change in myocardial function. Stress echo thereforeplays a valuable role in the assessment of myocardial perfusion (and,therefore, of underlying coronary artery disease). It also can make animportant contribution to the assessment of certain patients with aorticand mitral stenosis. This chapter will consider each of these indications.
● Principles of stress echoThe principal role of stress echo is in the detection of regional wall motionabnormalities – areas of left ventricular (LV) myocardium that showabnormal function at rest and/or during stress. Each region of themyocardium is supplied with blood (and therefore oxygen) by one of thecoronary arteries (see Chapter 12), and an imbalance between supply anddemand will cause myocardial ischaemia.
Even a relatively severe stenosis in one of the major epicardial coronaryarteries does not cause myocardial ischaemia at rest, as the myocardialvasculature compensates to maintain resting blood flow by dilating thearterioles downstream of the stenosis. However, this is inadequate toprevent ischaemia with stress, as the increase in myocardial oxygen demandexceeds the ability of the arterioles to dilate further. Thus a patient with asignificant coronary stenosis will usually have normal myocardial perfusion(and therefore contractility) at rest, but will develop myocardial ischaemia(and abnormal wall motion) with stress.
The myocardium can be ‘stressed’ by increasing myocardial oxygen demand,either with physical exercise or pharmacologically using an intravenous (IV)infusion of dobutamine. Alternatively, an IV infusion of a vasodilator (e.g.dipyridamole, adenosine) can be used as the stressor. Vasodilators work by
The stress echostudy
8
redistributing coronary blood flow, causing dilatation of normal coronaryarteries but not of abnormal ones. This increases blood flow down thenormal arteries but leads to a reduction in blood flow to areas supplied bystenosed coronaries, via a ‘steal’ mechanism, leading to ischaemia.
For the purposes of a stress echo study, the LV is subdivided into 16 or 17myocardial segments, and the function of each segment is assessed at restand with stress. A number of distinct patterns of response can be identified.
● A normal response is indicated by normal contractility (normokinetic)at rest, with normal or increased contractility (hyperkinetic) with stress.
● An ischaemic response is indicated by normokinetic myocardium atrest, but worsening function on stress, shown by reduced (hypokinetic),absent (akinetic) or paradoxical (dyskinetic) contractility. This is usuallydue to a stenosis in the supplying coronary artery.
● A necrotic response is indicated by abnormal contractility (akinetic,hypokinetic) at rest which remains unchanged with stress. This isusually due to an area of myocardial infarction (scar tissue) resultingfrom an occlusion in the supplying coronary artery.
● A viability response is indicated by abnormal contractility (akinetic,hypokinetic) at rest which improves with stress:� If the improvement is sustained throughout stress, the myocardium
is said to be stunned. Stunned myocardium can result from a briefperiod of coronary occlusion and gradually improves with time.
� If the improvement only occurs at low level stress, and themyocardium worsens again at higher levels of stress (‘biphasicresponse’), it is said to be hibernating. Hibernating myocardium willnot recover spontaneously but may improve following coronaryrevascularization.
All stress studies (exercise, dobutamine, dipyridamole and adenosine)permit the identification of normal, ischaemic and necrotic myocardium. Toassess viability, a dobutamine stress study (using low-dose as well as higherdoses of dobutamine) is necessary, in order to assess wall motion atdifferent levels of stress.
● Indications for stress echoBecause it can provide valuable information about the presence and extentof coronary artery disease, the indications for a stress echo study include:
● diagnosis of suspected coronary artery disease● risk assessment of patients with known coronary artery disease
PART
2:
CA
RDIA
C IM
AG
ING
TEC
HN
IQU
ES
82
Stre
ss e
cho
stud
y
83
● identification of viable myocardium prior to revascularization● localization of myocardial ischaemia (‘culprit coronary lesion’
identification prior to revascularization)● assessment of myocardial perfusion following revascularization.
Stress echo is reported as having a sensitivity of 88 per cent and a specificityof 83 per cent in the detection of coronary artery disease (coronary stenosis�50 per cent). This is similarly sensitive to, but more specific than, nuclearmyocardial perfusion imaging (p. 102). Stress echo does not, however,involve exposure to ionizing radiation.
In addition to its role in the assessment of myocardial ischaemia, stress echocan be useful in assessing:
● low-gradient aortic stenosis with LV dysfunction● mitral stenosis where there is disparity between severity and
symptoms.
CONTRAINDICATIONS TO A STRESS ECHO STUDY
For all forms of stress:
● acute coronary syndrome in first 24–72 h (high-dosedobutamine should not be used for 7 days after myocardialinfarction)
● known left main stem coronary artery stenosis● LV failure with symptoms at rest● recent life-threatening arrhythmias● severe dynamic or fixed left ventricular outflow tract
obstruction● severe systemic hypertension (systolic blood pressure
�220 mmHg and/or diastolic blood pressure �120 mmHg)● recent pulmonary embolism or infarction● thrombophlebitis or active deep vein thrombosis● hypokalaemia● active endocarditis, myocarditis, or pericarditis.
For atropine:
● closed-angle glaucoma● severe prostatic disease.
i

PART
2:
CA
RDIA
C IM
AG
ING
TEC
HN
IQU
ES
84
● Patient preparationPatients should receive a clear explanation of what a stress echo studyentails and be offered an information leaflet. Ensure that patients takingbeta-blockers are informed, where necessary, to omit the beta-blocker for48 h prior to the stress echo. Patients should be advised to bring acompanion to drive them home.
A minimum of two personnel should be present throughout the stress echostudy, one of whom should be trained in advanced life support and theother in basic life support. The sonographer should be experienced in stressecho, and a physician should be immediately available if not present duringthe study. Appropriate cardiopulmonary resuscitation equipment must beavailable.
Prior to undertaking the stress echo study, ensure that the patientunderstands what is planned and has given informed consent. Review thepatient’s history and prior investigation findings and check forcontraindications or anything that may increase the risk of complications.
A 12-lead ECG must be recorded (and reviewed) at baseline and everyminute during the stress study. Attach the ECG electrodes in their standardpositions, although these may need to be modified slightly to allow access tothe appropriate echo imaging windows. There must also be continuous ECGmonitoring (usually via the ECG electrodes of the echo machine) to monitorfor arrhythmias. Use an automated cuff to check blood pressure at baselineand again at each stress stage.
For vasodilator (dipyridamole, adenosine) stress:
● suspected or known severe bronchospasm● sick sinus syndrome, second or third degree atrioventricular
block (unless a functioning pacemaker is present)● hypotension (systolic blood pressure �90 mmHg)● xanthine (e.g. caffeine, aminophylline) use in the last 12 h or
dipyridamole use in the last 24 h.
Vasodilator stress is relatively contraindicated by bradycardia of�40 beats/min, equivocal left main stem coronary artery stenosis,recent cerebral ischaemia or infarction.
Stre
ss e
cho
stud
y
85
● Acquiring the stress echo imagesThe key to a successful stress echo study is to obtain clear definition of theLV endocardial border. It is important to spend adequate time acquiring therest images before starting the stress part of the study to ensure that imagequality is optimal and that the imaging views will be reproducible whena set of images is acquired at each stage of the stress study – it is essential to compare ‘like with like’ at each stage.
Endocardial border definition can be enhanced using:
● harmonic imaging (p. 23)● ultrasound contrast agents (p. 95).
The use of an ultrasound contrast agent is appropriate if two or moremyocardial segments cannot be seen clearly on the rest images.
Imaging of the LV must show each of the myocardial segments in at leastone and, where possible, two views. The standard stress echo windows andviews are:
● left parasternal window� parasternal long axis view� parasternal short axis view
● apical window� apical 4-chamber view� apical 2-chamber view.
The apical 3-chamber (long axis) view can be used as an alternative to theparasternal long axis view where necessary. With conventional 2-D echo eachview has to be obtained in turn. However 3-D echo, where available, offers anopportunity to image all of the LV myocardial segments at once, which canmake image acquisition faster and also allows more flexible ‘slicing’ of the LV topermit better alignment between views obtained at different levels of stress.
Take your time in acquiring the baseline images – these are the benchmarkfor comparison with the stress images, so it is important that they are asgood as they can be. Make a mental note of the position and angulation ofthe probe that you used for each view – when you repeat the images duringthe stress part of the study, you’ll be under pressure to find the same views ina much shorter time. The baseline echo should also include an assessment of:
● chamber dimensions (including the aortic root)● overall left and right ventricular function● valvular structure and function.
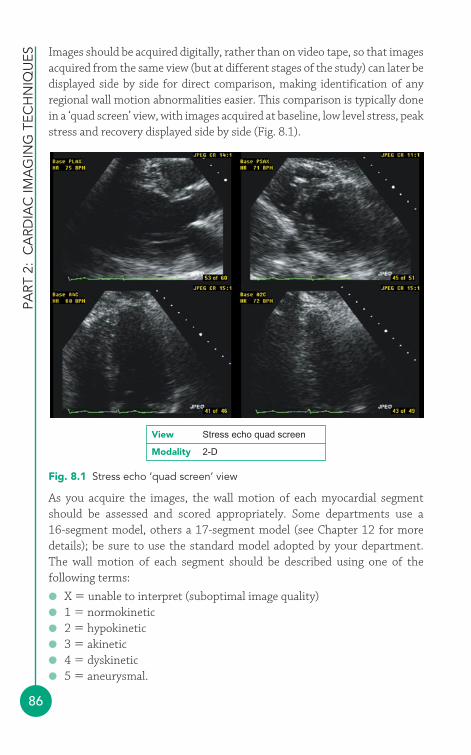
PART
2:
CA
RDIA
C IM
AG
ING
TEC
HN
IQU
ES
86
Images should be acquired digitally, rather than on video tape, so that imagesacquired from the same view (but at different stages of the study) can later bedisplayed side by side for direct comparison, making identification of anyregional wall motion abnormalities easier. This comparison is typically donein a ‘quad screen’ view, with images acquired at baseline, low level stress, peakstress and recovery displayed side by side (Fig. 8.1).
Fig. 8.1 Stress echo ‘quad screen’ view
View Stress echo quad screen
Modality 2-D
As you acquire the images, the wall motion of each myocardial segmentshould be assessed and scored appropriately. Some departments use a 16-segment model, others a 17-segment model (see Chapter 12 for moredetails); be sure to use the standard model adopted by your department.The wall motion of each segment should be described using one of thefollowing terms:
● X � unable to interpret (suboptimal image quality)● 1 � normokinetic● 2 � hypokinetic● 3 � akinetic● 4 � dyskinetic● 5 � aneurysmal.
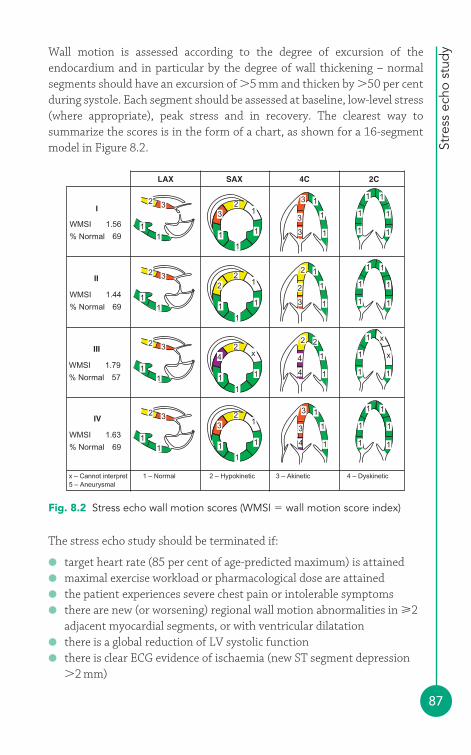
Stre
ss e
cho
stud
y
87
Wall motion is assessed according to the degree of excursion of theendocardium and in particular by the degree of wall thickening – normalsegments should have an excursion of �5 mm and thicken by �50 per centduring systole. Each segment should be assessed at baseline, low-level stress(where appropriate), peak stress and in recovery. The clearest way tosummarize the scores is in the form of a chart, as shown for a 16-segmentmodel in Figure 8.2.
The stress echo study should be terminated if:
● target heart rate (85 per cent of age-predicted maximum) is attained● maximal exercise workload or pharmacological dose are attained● the patient experiences severe chest pain or intolerable symptoms● there are new (or worsening) regional wall motion abnormalities in 2
adjacent myocardial segments, or with ventricular dilatation● there is a global reduction of LV systolic function● there is clear ECG evidence of ischaemia (new ST segment depression
�2 mm)
Fig. 8.2 Stress echo wall motion scores (WMSI � wall motion score index)
11
2 3
11
2 3
11
2 3
11
2 3
11
1
12
3
11
1
12
2
11
1
x2
4
11
1
12
3
1
1
1 1
1
1
1
1
1 1
1
1
1
1
1
1
2
3
2 1
1
1
4
4
2 2
1
1
3
4
3 1
1
1
3
3
3 1
1
1
x
x
1
1
1
1
1
1
LAX
I
II
SAX 4C 2C
WMSI 1.56
% Normal 69
WMSI 1.44
% Normal 69
III
WMSI 1.79
% Normal 57
IV
WMSI 1.63
% Normal
x – Cannot interpret 1 – Normal 2 – Hypokinetic 3 – Akinetic 4 – Dyskinetic5 – Aneurysmal
69
PART
2:
CA
RDIA
C IM
AG
ING
TEC
HN
IQU
ES
88
● systolic blood pressure falls by �20 mmHg below baseline or from aprevious level
● blood pressure increases �220/120 mmHg● there are supraventricular or complex ventricular arrhythmias.
When each myocardial region has been scored, the wall motion score index(WMSI) can be calculated at baseline and for each level of stress. This iscalculated by adding together the total wall motion score (i.e. the individualscores for all the segments that can be scored), and then dividing this by thenumber of scored segments. If all the segments are normokinetic, the WMSIwill be 1.0. If any regional wall motion abnormalities are present, the WMSIwill be greater than 1.0. An additional quantitative measure is the percentageof scored segments that are normokinetic.
If the study has confirmed myocardial ischaemia, you should note the heartrate at which ischaemia was first evident (this is only possible withdobutamine or bicycle stress echo, where repeated imaging occurs at differentlevels of stress). Ischaemic threshold is the heart rate at which ischaemiafirst occurred and is calculated as a percentage, using the equation:
Ischaemic threshold is particularly useful in assessing cardiovascular risk inpatients due to undergo non-cardiac surgery. An ischaemic threshold �60per cent or ischaemia in 3–5 segments is an indicator of high risk.
Ischaemic thresholdheart rate when ischaemia first occurred
�220 � patient’s age (in years)
�100
ADDITIONAL INFORMATION
A normal stress echo study is defined as showing normal wallmotion at rest and with stress. Those patients with a normalexercise stress echo have an annual risk of cardiac death ornonfatal myocardial infarction of �1 per cent and are thereforeregarded as being in a ‘low-risk’ group. The annual risk for thosewith a normal pharmacological stress echo is a little higher whichis thought to reflect the fact that many of these patients areunable to exercise because of co-morbidities. Several factorsindicate high risk, including extensive regional wall motionabnormalities (four to five segments) at rest or induced with stress,or the presence of a low ischaemic threshold (�60–70 per cent).
i
Stre
ss e
cho
stud
y
89
● Stress protocolsExercise stressExercise stress can be undertaken using either a treadmill or a bicycle:treadmill exercise limits the echo assessment to baseline and peak stress(i.e. immediately post exercise), whereas bicycle exercise means that imagescan be acquired during the test at different levels of exertion. ‘Peak’ stressimages must all be acquired within 60 seconds of completing exercise,before the effects of exercise start to wear off and the patient enters therecovery phase.
For treadmill exercise a symptom-limited Bruce protocol is most commonlyused, with the level of exercise increasing at 3-min intervals. For bicycleexercise, workload is usually increased in increments of 25W every 2–3min.Exercise usually continues (all else being equal) until the patient attains 85 per cent of their age-predicted heart rate (220 – patient’s age in years).
Dobutamine stressDobutamine stress protocols begin with an IV infusion of dobutamine at5μg/kg/min, increasing the infusion rate at 3-min intervals to 10, 20, 30and 40μg/kg/min. If patients are failing to approach their target heart ratewith the dobutamine infusion alone, IV atropine can also be administered individed doses of 0.25mg every minute (up to a maximum of 1.0mg) toincrease heart rate. Acquisition of images at low/intermediate levels ofdobutamine stress as well as at peak stress allows for assessment ofmyocardial viability.
Vasodilator stressVasodilator stress usually causes a relatively small increase in heart ratetogether with a mild fall in blood pressure. It is less sensitive than exerciseor dobutamine stress for detecting mild/moderate coronary disease, and sovasodilator stress should therefore be used only when exercise ordobutamine stress are contraindicated.
Dipyridamole stress is performed with an IV infusion of 0.56 mg/kgdipyridamole given over 4 min, followed by no infusion for 4 min. If no endpoints have been reached by this time, a further infusion of 0.28 mg/kg isgiven over 2 min, followed if necessary by IV atropine administered individed doses of 0.25 mg every minute (up to a maximum of 1.0 mg) to
PART
2:
CA
RDIA
C IM
AG
ING
TEC
HN
IQU
ES
90
increase heart rate. Baseline images are acquired prior to the infusion, andstress images are acquired after the first 4-min infusion and, if given, thesecond infusion (atropine). Adverse effects of dipyridamole can be treatedusing 240 mg IV aminophylline.
Adenosine stress is performed with an IV infusion of 140 μg/kg/minadenosine given over 6 min. Baseline images are acquired prior to theinfusion, and stress images are acquired 3 min into the infusion.
● Stress echo and valvular diseaseAortic stenosisAssessing the severity of aortic stenosis in patients with impaired LVfunction can be difficult. One measure of aortic stenosis severity is aorticvalve area, calculated by the continuity equation (p. 155). In the presence ofimpaired LV function a reduced aortic valve area may be the result of aorticstenosis, but it can also result from reduced cardiac output failing to openthe aortic valve cusps to their full extent during systole. Aortic valvegradient (velocity) does not help, as gradients underestimate the severity ofaortic stenosis in the presence of impaired LV function.
It can therefore be difficult to assess whether a patient with ‘low gradient,low flow aortic stenosis’ has a significantly stenosed valve (‘true’ aorticstenosis) or whether the findings are primarily the result of reduced valveopening secondary to low cardiac output (‘functional’ aortic stenosis). ‘Lowgradient, low flow aortic stenosis’ has been defined as an aortic valve orificearea �1.0 cm2 and a mean valve gradient �30 mmHg in a patient with a LVejection fraction �40 per cent.
Dobutamine stress echo can be useful in this situation. To distinguishbetween ‘true’ and ‘functional’ aortic stenosis, dobutamine is initially infusedat 5 μg/kg/min with increases, if necessary, at 5 min intervals to 10 μg/kg/minand 20 μg/kg/min. If there is true (fixed) aortic stenosis, the aortic valve areawill remain essentially unchanged (usually remaining �1.2 cm2) but the meanvalve gradient will increase (usually to a value �30 mmHg). If the ‘stenosis’ isfunctional, the valve area will increase relatively more, and the mean gradientrelatively less, with the dobutamine infusion.
It is important to look for any regional wall motion abnormalities duringsuch a study, which would indicate coexistent myocardial ischaemia, andalso to assess the overall LV response to dobutamine. The presence of LV
Stre
ss e
cho
stud
y
91
‘contractile reserve’ is indicated by an increase in stroke volume withdobutamine stress, as shown by an increase in velocity time integral (VTI) of�20 per cent. Patients with contractile reserve have a better perioperativemortality than those without.
Mitral stenosisIn patients with mitral stenosis, stress echo can be helpful in those whosesymptoms appear disproportionate to resting haemodynamicmeasurements, and also those who are asymptomatic but who appear tohave severe stenosis. Doppler studies of the mitral and tricuspid valves canbe performed during stress, and those who have exertional breathlessnesswith a mean mitral valve gradient �15 mmHg and a pulmonary arterysystolic pressure �60 mmHg are likely to benefit from intervention.
● After the stress echo studyFollowing the stress echo study, continue to monitor the patient carefullyuntil they are asymptomatic and any ECG, echo or haemodynamic changeshave returned to baseline. Patients should rest in the echo department for30 min before going home, and they should be driven home by a companion.The results of the study should, where possible, be discussed with the patientbefore they leave. If the results are not immediately available, advise thepatient how and when they will hear the results of the study.
You should begin your study report with the patient’s demographic detailsand a summary of the indication for the study. Comment on the imagequality and whether a contrast agent was used. Describe the stress protocoland the adequacy of the patient’s response to it, noting in particular anysymptoms (e.g. chest pain) and/or ECG changes, together with changes inheart rate and blood pressure. If an exercise protocol was used, include theexercise duration and peak heart rate attained; for a pharmacologicalprotocol, include information on the drug(s) and doses administered.Review all the images and record the wall motion scores at each level ofstress, summarizing them in your stress echo report in an easilyunderstood visual format (as in Fig. 8.2). Finally, conclude your report witha summary of whether your findings are normal or indicate ischaemia,necrosis or viability (stunning or hibernation). If you have undertaken anyvalvular assessments as part of the study, include these details in yourreport too.
PART
2:
CA
RDIA
C IM
AG
ING
TEC
HN
IQU
ES
92
FURTHER READING
ACCF/ASE/ACEP/AHA/ASNC/SCAI/SCCT/SCMR.Appropriateness criteria for stress echocardiography. Circulation2008; 117: 1478–97.
Becher H, Chambers J, Fox K, et al. BSE procedure guidelines forthe clinical application of stress echocardiography,recommendations for performance and interpretation of stressechocardiography. Heart 2004; 90(suppl VI): vi23–30.
Chambers J. Low ‘gradient’, low flow aortic stenosis. Heart 2006;92: 554–8.
Das M, Pellikka P, Mahoney D, et al. Assessment of cardiac riskbefore nonvascular surgery: dobutamine stress echocardiographyin 530 patients. J Am Coll Cardiol 2000; 35: 1647–53.
Marwick PH. Stress echocardiography. Heart 2003; 89: 113–18.
Pellikka PA, Nagueh SF, Elhendy AA, et al. American Society ofEchocardiography recommendations for performance,interpretation, and application of stress echocardiography. J Am Soc Echocardiogr 2007; 20: 1021–41.
Sicari R, Nihoyannopoulos P, Evangelista A, et al. Stressechocardiography expert consensus statement. Eur JEchocardiogr 2008; 9: 415–37.
93
● Contrast studiesThere are two very different types of echo contrast study, using:
● agitated saline bubble contrast● echo contrast agents.
Agitated saline bubble contrastAn agitated saline bubble contrast is simple to perform and is used primarilyto detect a right-to-left shunt, most commonly a patent foramen ovale (PFO,p. 297). A suspension of tiny air bubbles is injected intravenously while anecho is performed. Normally the bubbles fill the right heart where they areclearly visible on echo (Fig. 9.1), but they are then filtered out as they passthrough the lungs – no bubbles will therefore be seen in the left heart. Ifbubbles are seen within the left heart, this indicates that the agitated salinebubble contrast (and hence blood) is managing to cross directly from theright heart into the left via a right-to-left shunt, bypassing the lungs.
Normally the presence of an intracardiac shunt will allow blood to flow fromleft to right (high pressure to low pressure), but during a Valsalva manoeuvrethe blood flow will momentarily reverse from right to left. To demonstratea transient right-to-left shunt you can use ‘agitated’ saline:
● Draw up 8.5 mL of normal saline and 0.5 mL of air into a 10 mL Luerlock syringe.
● Using a 3-way tap, connect this to another (empty) 10 mL Luer locksyringe, and then attach this to an intravenous cannula sited in thepatient’s antecubital vein.
Advanced echotechniques4
9
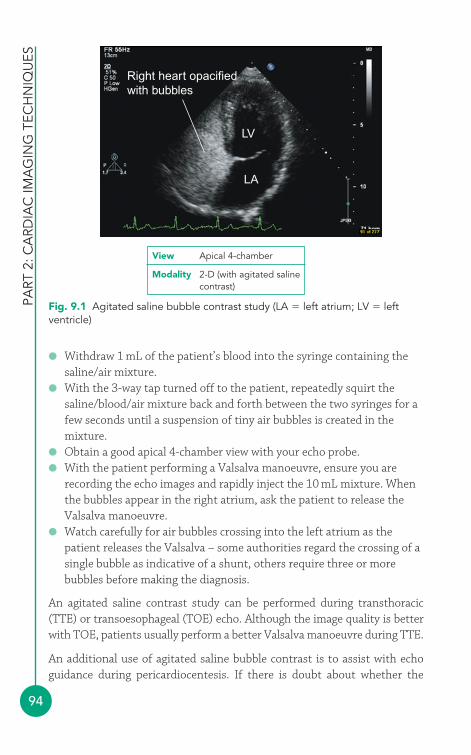
● Withdraw 1 mL of the patient’s blood into the syringe containing thesaline/air mixture.
● With the 3-way tap turned off to the patient, repeatedly squirt thesaline/blood/air mixture back and forth between the two syringes for afew seconds until a suspension of tiny air bubbles is created in themixture.
● Obtain a good apical 4-chamber view with your echo probe.● With the patient performing a Valsalva manoeuvre, ensure you are
recording the echo images and rapidly inject the 10 mL mixture. Whenthe bubbles appear in the right atrium, ask the patient to release theValsalva manoeuvre.
● Watch carefully for air bubbles crossing into the left atrium as thepatient releases the Valsalva – some authorities regard the crossing of asingle bubble as indicative of a shunt, others require three or morebubbles before making the diagnosis.
An agitated saline contrast study can be performed during transthoracic(TTE) or transoesophageal (TOE) echo. Although the image quality is betterwith TOE, patients usually perform a better Valsalva manoeuvre during TTE.
An additional use of agitated saline bubble contrast is to assist with echoguidance during pericardiocentesis. If there is doubt about whether the
PART
2: C
ARD
IAC
IMA
GIN
G T
ECH
NIQ
UES
94
Right heart opacifiedwith bubbles
LV
LA
Fig. 9.1 Agitated saline bubble contrast study (LA � left atrium; LV � leftventricle)
View Apical 4-chamber
Modality 2-D (with agitated salinecontrast)
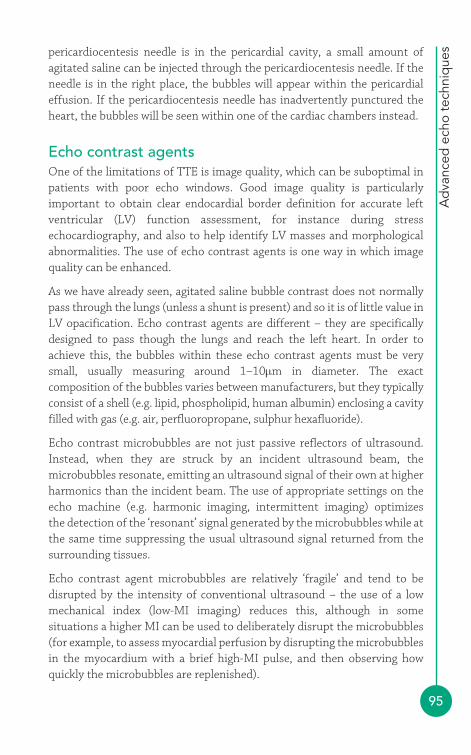
Ad
vanc
ed e
cho
tech
niq
ues
95
pericardiocentesis needle is in the pericardial cavity, a small amount ofagitated saline can be injected through the pericardiocentesis needle. If theneedle is in the right place, the bubbles will appear within the pericardialeffusion. If the pericardiocentesis needle has inadvertently punctured theheart, the bubbles will be seen within one of the cardiac chambers instead.
Echo contrast agentsOne of the limitations of TTE is image quality, which can be suboptimal inpatients with poor echo windows. Good image quality is particularlyimportant to obtain clear endocardial border definition for accurate leftventricular (LV) function assessment, for instance during stressechocardiography, and also to help identify LV masses and morphologicalabnormalities. The use of echo contrast agents is one way in which imagequality can be enhanced.
As we have already seen, agitated saline bubble contrast does not normallypass through the lungs (unless a shunt is present) and so it is of little value inLV opacification. Echo contrast agents are different – they are specificallydesigned to pass though the lungs and reach the left heart. In order toachieve this, the bubbles within these echo contrast agents must be verysmall, usually measuring around 1–10μm in diameter. The exactcomposition of the bubbles varies between manufacturers, but they typicallyconsist of a shell (e.g. lipid, phospholipid, human albumin) enclosing a cavityfilled with gas (e.g. air, perfluoropropane, sulphur hexafluoride).
Echo contrast microbubbles are not just passive reflectors of ultrasound.Instead, when they are struck by an incident ultrasound beam, themicrobubbles resonate, emitting an ultrasound signal of their own at higherharmonics than the incident beam. The use of appropriate settings on theecho machine (e.g. harmonic imaging, intermittent imaging) optimizes the detection of the ‘resonant’ signal generated by the microbubbles while atthe same time suppressing the usual ultrasound signal returned from thesurrounding tissues.
Echo contrast agent microbubbles are relatively ‘fragile’ and tend to bedisrupted by the intensity of conventional ultrasound – the use of a lowmechanical index (low-MI imaging) reduces this, although in somesituations a higher MI can be used to deliberately disrupt the microbubbles(for example, to assess myocardial perfusion by disrupting the microbubblesin the myocardium with a brief high-MI pulse, and then observing howquickly the microbubbles are replenished).

PART
2: C
ARD
IAC
IMA
GIN
G T
ECH
NIQ
UES
96
Echo contrast agents include Definity® (known in Europe as Luminity®)and Optison®, both licensed by the United States Food and DrugAdministration (FDA). Both are indicated for use in patients for LVopacification, endocardial border definition and Doppler.
Clinical applicationsEcho contrast agents are useful in improving visualization of the LV,particularly in cases where image quality is suboptimal and two or morecontiguous LV segments cannot be seen with conventional imaging. Thisimproves the accuracy of LV volume and ejection fraction measurements,and is especially valuable in the assessment of regional wall motion duringstress echo studies (Chapter 8).
Improved imaging of the LV endocardium can also help in the identificationof morphological abnormalities including isolated ventricular non-compaction, apical hypertrophic cardiomyopathy, intracardiac masses suchas tumours and thrombus, and LV aneurysm.
The enhanced LV imaging obtained with echo contrast agents can beparticularly useful when performing portable studies in the intensive careunit, where the inability to position the patient optimally means that imagequality is frequently suboptimal. Echo contrast agents can also improvespectral Doppler signals, aiding in the assessment of valvular disease and LVdiastolic function.
ContraindicationsFor full details about the safe and appropriate use of echo contrast agents,refer to the relevant product datasheet. The following contraindicationsapply to Definity® and Optison®:
● known hypersensitivity to the products● right-to-left, bidirectional or transient right-to-left cardiac shunts.
The agents are for intravenous use and must not be administered by theintra-arterial route.
High-risk patients with pulmonary hypertension or unstable cardiopulmonaryconditions should be monitored during and for 30 min after administration(including vital signs, ECG and oxygen saturations). All other patients shouldbe closely observed during and following administration. Resuscitationequipment and trained personnel must be available.
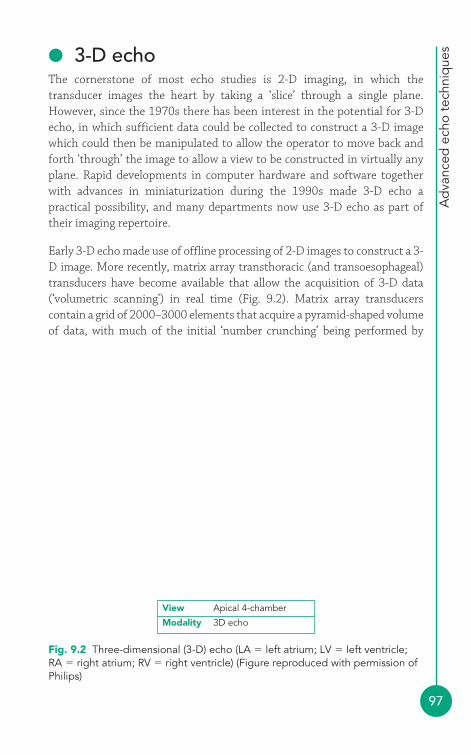
Ad
vanc
ed e
cho
tech
niq
ues
97
● 3-D echoThe cornerstone of most echo studies is 2-D imaging, in which thetransducer images the heart by taking a ‘slice’ through a single plane.However, since the 1970s there has been interest in the potential for 3-Decho, in which sufficient data could be collected to construct a 3-D imagewhich could then be manipulated to allow the operator to move back andforth ‘through’ the image to allow a view to be constructed in virtually anyplane. Rapid developments in computer hardware and software togetherwith advances in miniaturization during the 1990s made 3-D echo apractical possibility, and many departments now use 3-D echo as part oftheir imaging repertoire.
Early 3-D echo made use of offline processing of 2-D images to construct a 3-D image. More recently, matrix array transthoracic (and transoesophageal)transducers have become available that allow the acquisition of 3-D data(‘volumetric scanning’) in real time (Fig. 9.2). Matrix array transducerscontain a grid of 2000–3000 elements that acquire a pyramid-shaped volumeof data, with much of the initial ‘number crunching’ being performed by
View Apical 4-chamber
Modality 3D echo
RA
LV
Mitral valveTricuspid valve
RV
LA
Fig. 9.2 Three-dimensional (3-D) echo (LA � left atrium; LV � left ventricle;RA � right atrium; RV � right ventricle) (Figure reproduced with permission ofPhilips)
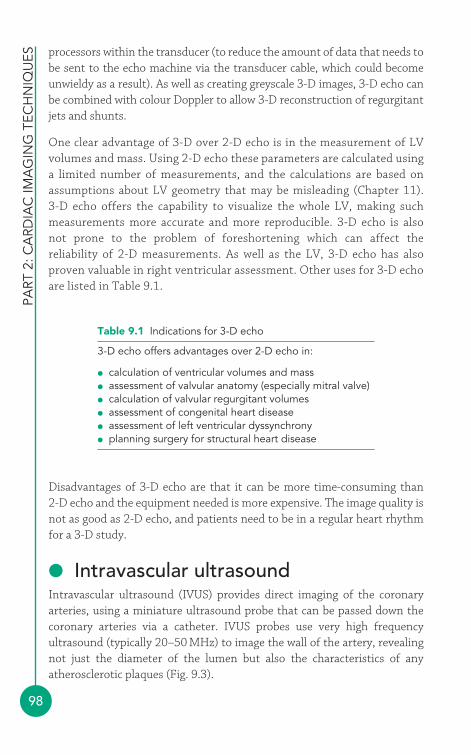
PART
2: C
ARD
IAC
IMA
GIN
G T
ECH
NIQ
UES
98
Table 9.1 Indications for 3-D echo
3-D echo offers advantages over 2-D echo in:
● calculation of ventricular volumes and mass● assessment of valvular anatomy (especially mitral valve)● calculation of valvular regurgitant volumes● assessment of congenital heart disease● assessment of left ventricular dyssynchrony● planning surgery for structural heart disease
processors within the transducer (to reduce the amount of data that needs tobe sent to the echo machine via the transducer cable, which could becomeunwieldy as a result). As well as creating greyscale 3-D images, 3-D echo canbe combined with colour Doppler to allow 3-D reconstruction of regurgitantjets and shunts.
One clear advantage of 3-D over 2-D echo is in the measurement of LVvolumes and mass. Using 2-D echo these parameters are calculated usinga limited number of measurements, and the calculations are based onassumptions about LV geometry that may be misleading (Chapter 11). 3-D echo offers the capability to visualize the whole LV, making suchmeasurements more accurate and more reproducible. 3-D echo is alsonot prone to the problem of foreshortening which can affect thereliability of 2-D measurements. As well as the LV, 3-D echo has alsoproven valuable in right ventricular assessment. Other uses for 3-D echoare listed in Table 9.1.
Disadvantages of 3-D echo are that it can be more time-consuming than 2-D echo and the equipment needed is more expensive. The image quality isnot as good as 2-D echo, and patients need to be in a regular heart rhythmfor a 3-D study.
● Intravascular ultrasoundIntravascular ultrasound (IVUS) provides direct imaging of the coronaryarteries, using a miniature ultrasound probe that can be passed down thecoronary arteries via a catheter. IVUS probes use very high frequencyultrasound (typically 20–50 MHz) to image the wall of the artery, revealingnot just the diameter of the lumen but also the characteristics of anyatherosclerotic plaques (Fig. 9.3).
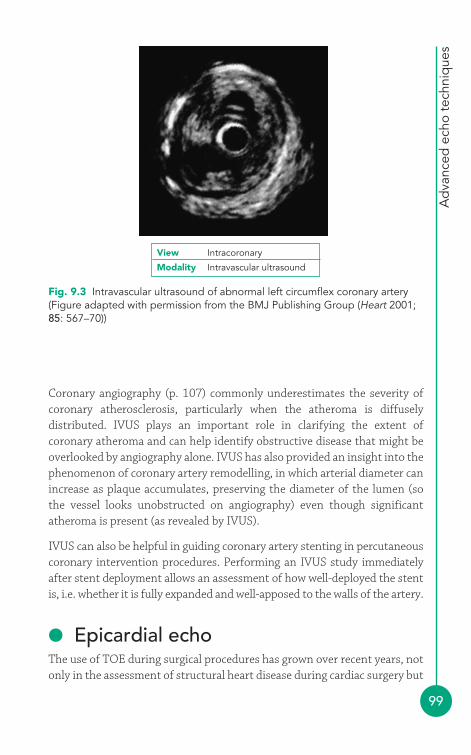
Ad
vanc
ed e
cho
tech
niq
ues
99
Coronary angiography (p. 107) commonly underestimates the severity ofcoronary atherosclerosis, particularly when the atheroma is diffuselydistributed. IVUS plays an important role in clarifying the extent ofcoronary atheroma and can help identify obstructive disease that might beoverlooked by angiography alone. IVUS has also provided an insight into thephenomenon of coronary artery remodelling, in which arterial diameter canincrease as plaque accumulates, preserving the diameter of the lumen (sothe vessel looks unobstructed on angiography) even though significantatheroma is present (as revealed by IVUS).
IVUS can also be helpful in guiding coronary artery stenting in percutaneouscoronary intervention procedures. Performing an IVUS study immediatelyafter stent deployment allows an assessment of how well-deployed the stentis, i.e. whether it is fully expanded and well-apposed to the walls of the artery.
● Epicardial echoThe use of TOE during surgical procedures has grown over recent years, notonly in the assessment of structural heart disease during cardiac surgery but
Fig. 9.3 Intravascular ultrasound of abnormal left circumflex coronary artery(Figure adapted with permission from the BMJ Publishing Group (Heart 2001;85: 567–70))
View Intracoronary
Modality Intravascular ultrasound
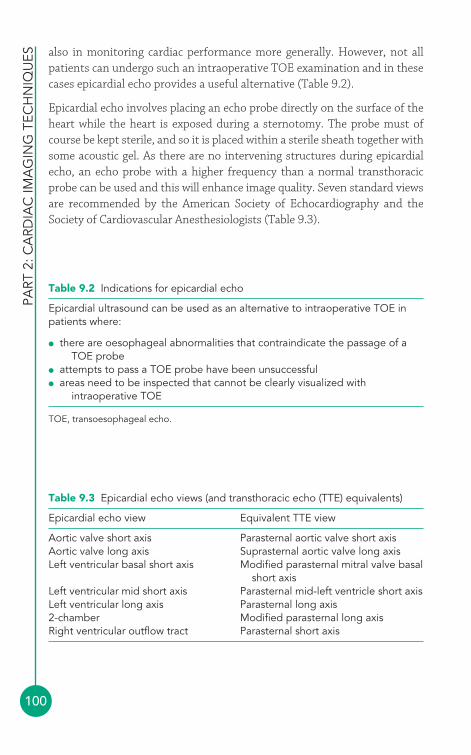
PART
2: C
ARD
IAC
IMA
GIN
G T
ECH
NIQ
UES
100
Table 9.3 Epicardial echo views (and transthoracic echo (TTE) equivalents)
Epicardial echo view Equivalent TTE view
Aortic valve short axis Parasternal aortic valve short axisAortic valve long axis Suprasternal aortic valve long axisLeft ventricular basal short axis Modified parasternal mitral valve basal
short axisLeft ventricular mid short axis Parasternal mid-left ventricle short axisLeft ventricular long axis Parasternal long axis2-chamber Modified parasternal long axisRight ventricular outflow tract Parasternal short axis
Table 9.2 Indications for epicardial echo
Epicardial ultrasound can be used as an alternative to intraoperative TOE inpatients where:
● there are oesophageal abnormalities that contraindicate the passage of aTOE probe
● attempts to pass a TOE probe have been unsuccessful● areas need to be inspected that cannot be clearly visualized with
intraoperative TOE
TOE, transoesophageal echo.
also in monitoring cardiac performance more generally. However, not allpatients can undergo such an intraoperative TOE examination and in thesecases epicardial echo provides a useful alternative (Table 9.2).
Epicardial echo involves placing an echo probe directly on the surface of theheart while the heart is exposed during a sternotomy. The probe must ofcourse be kept sterile, and so it is placed within a sterile sheath together withsome acoustic gel. As there are no intervening structures during epicardialecho, an echo probe with a higher frequency than a normal transthoracicprobe can be used and this will enhance image quality. Seven standard viewsare recommended by the American Society of Echocardiography and theSociety of Cardiovascular Anesthesiologists (Table 9.3).

Ad
vanc
ed e
cho
tech
niq
ues
101
FURTHER READING
Hung J, Lang R, Flachskampf F, et al. 3D echocardiography: areview of the current status and future directions. J Am SocEchocardiogr 2007; 20: 213–33.
Mintz GS, Nissen SE, Anderson WD, et al. American College ofCardiology clinical expert consensus document on standardsfor acquisition, measurement and reporting of intravascularultrasound studies (IVUS). Eur J Echocardiogr 2001; 2:299–313.
Mulvagh SL, Rakowski H, Vannan MA, et al. American Society ofEchocardiography consensus statement on the clinicalapplications of ultrasonic contrast agents in echocardiography. J Am Soc Echocardiogr 2008; 21: 1179–201.
Olszewski R, Timperley J, Cezary S, et al. 2007. The clinicalapplications of contrast echocardiography. Eur J Echocardiogr2007; 8: S13–23.
Reeves ST, Glas KE, Eltzschig H, et al. Guidelines for performing acomprehensive epicardial echocardiography examination:recommendations of the American Society ofEchocardiography and the Society of CardiovascularAnesthesiologists. Anesth Analg 2007; 105: 2–28.
Schoenhagen P, Nissen S. Understanding coronary artery disease:tomographic imaging with intravascular ultrasound. Heart2002; 88: 91–6.
Sugeng L, Mor-Avi V, Lang RM. Three-dimensionalechocardiography: coming of age. Heart 2008; 94: 1123–5.
102
Echo is not the only technique for obtaining diagnostic information aboutthe heart. Several cardiac imaging techniques are available, some of whichprovide similar information to echo (e.g. assessment of left ventricular (LV)function with cardiac magnetic resonance imaging (MRI)) and some ofwhich can provide additional information about the heart that echo alone cannot obtain (e.g. visualization of coronary stenoses with coronaryangiography). Knowledge of these alternative imaging techniques can helpyou decide when another test might replace or supplement an echo study.
● Nuclear cardiologyNuclear cardiology uses radioactive isotopes, administered intravenously,to image the heart and to provide information about myocardial perfusion(myocardial perfusion imaging) and ventricular function (radionuclideventriculography).
Uses of nuclear cardiologyMyocardial perfusion imaging uses a radiopharmaceutical (e.g. thallium-201or a technetium-99m-labelled radiopharmaceutical) to assess myocardial bloodflow, providing valuable information about coronary artery disease with a highdegree of sensitivity and specificity (Fig. 10.1).
After the radiopharmaceutical has been administered intravenously, itsdistribution in the myocardium can be assessed using single photonemission computed tomography (SPECT) imaging. Imaging is performed atrest and again after stress (exercise or pharmacological), and comparison of
Alternative cardiacimagingtechniques
410
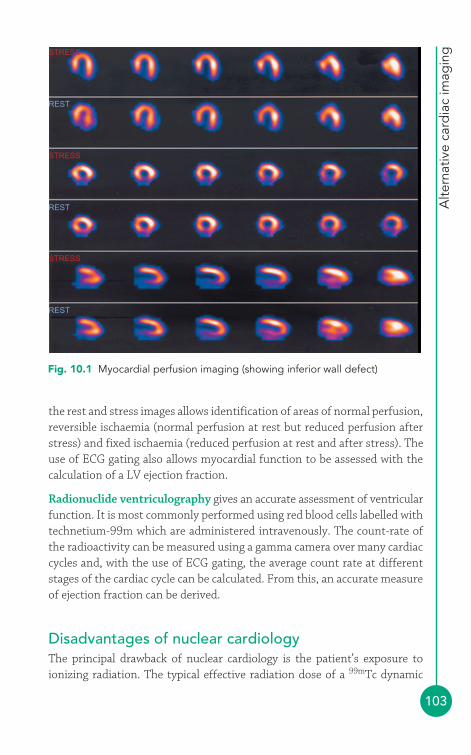
Alte
rnat
ive
card
iac
imag
ing
103
the rest and stress images allows identification of areas of normal perfusion,reversible ischaemia (normal perfusion at rest but reduced perfusion afterstress) and fixed ischaemia (reduced perfusion at rest and after stress). Theuse of ECG gating also allows myocardial function to be assessed with thecalculation of a LV ejection fraction.
Radionuclide ventriculography gives an accurate assessment of ventricularfunction. It is most commonly performed using red blood cells labelled withtechnetium-99m which are administered intravenously. The count-rate ofthe radioactivity can be measured using a gamma camera over many cardiaccycles and, with the use of ECG gating, the average count rate at differentstages of the cardiac cycle can be calculated. From this, an accurate measureof ejection fraction can be derived.
Disadvantages of nuclear cardiologyThe principal drawback of nuclear cardiology is the patient’s exposure toionizing radiation. The typical effective radiation dose of a 99mTc dynamic
STRESS
REST
STRESS
REST
STRESS
REST
Fig. 10.1 Myocardial perfusion imaging (showing inferior wall defect)
PART
2: C
ARD
IAC
IMA
GIN
G T
ECH
NIQ
UES
104
cardiac scan is 6 mSv, equivalent to 2.7 years’ exposure to natural backgroundradiation. For a 201Tl myocardial perfusion scan the typical dose is 18 mSv,equivalent to 8 years’ background radiation (for comparison, the typical doseof a single chest X-ray is 0.02 mSv, or 3 days’ background radiation). Furtherinformation on radiation doses and the lifetime additional risk of fatal cancer,can be found on the website of the Health Protection Agency (www.hpa.org.uk).
● Cardiac magnetic resonance imagingMRI is a highly versatile technique for cardiac imaging and provides bothanatomical and functional information. Cardiac MRI is performed with ascanner containing a large superconducting magnet; radio waves aretransmitted into the heart, aligning hydrogen nuclei, and as the nucleisubsequently ‘relax’ they emit radio waves of their own which can bedetected by the scanner. The detected signal can then be used to reconstructan image of the heart (Fig. 10.2).
Fig. 10.2 Cardiac magneticresonance imaging (MRI) scan
Uses of cardiac MRIOne of the great advantages of cardiac MRI over many other cardiacimaging techniques is the wide range of information that it can provide – aswell as anatomical information (usually with excellent image quality)
Alte
rnat
ive
card
iac
imag
ing
105
cardiac MRI can also measure blood flow velocities, making it suitable forthe assessment of valvular abnormalities and shunts. Its uses include theassessment of:
● cardiac chamber dimensions and function● valvular heart disease● cardiomyopathies● cardiac masses● congenital heart disease● pericardial disease● aortic abnormalities.
Cardiac MRI does not have the spatial resolution to image the coronaryarteries very well, but it can nevertheless aid in the assessment of coronaryartery disease in a similar manner to a stress echo study (Chapter 8). A cardiac MRI scan can be combined with pharmacological stress, as forstress echo, to identify myocardial ischaemia, necrosis and viability. The useof a gadolinium-based contrast agent can provide valuable information onmyocardial perfusion.
Disadvantages of cardiac MRIAlthough cardiac MRI does not involve exposure to ionizing radiation, itdoes expose the patient to a powerful magnetic field and is thereforecontraindicated in patients with certain types of metallic implant (e.g.pacemakers, implantable defibrillators and cerebrovascular aneurysm clips).Some patients with claustrophobia are unable to tolerate the enclosedconditions found in many MRI scanners. For certain cardiac MRI studiespatients require an intravenous injection of a gadolinium-based contrastagent, and in patients with renal impairment this may pose a risk ofnephrogenic systemic fibrosis.
● Cardiac computed tomographyThe development of multislice computed tomography (MSCT) has led to theincreasing use of CT scanning to image the heart. MSCT scanners contain a gantry carrying an X-ray source and a number of detectors that rotatesaround the patient. Multiple image ‘slices’ are obtained as the patient ismoved through the gantry during the scan, and an ECG is also recorded. Theslices are then processed by the appropriate software, and the ECG data canbe used to ‘gate’ the images so that the heart can be examined at different
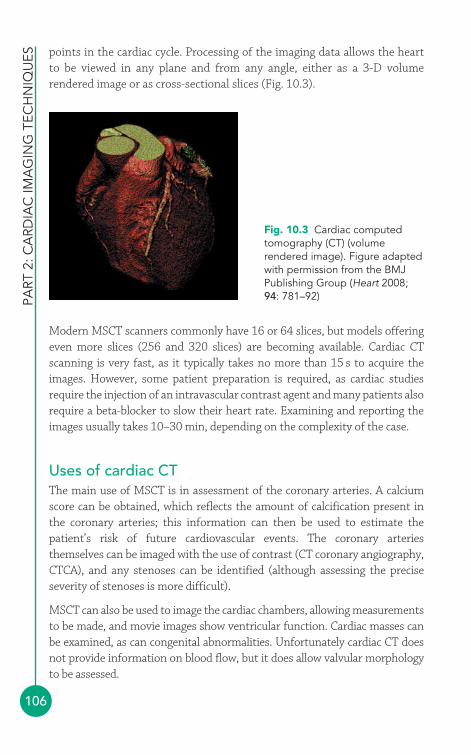
PART
2: C
ARD
IAC
IMA
GIN
G T
ECH
NIQ
UES
106
points in the cardiac cycle. Processing of the imaging data allows the heartto be viewed in any plane and from any angle, either as a 3-D volumerendered image or as cross-sectional slices (Fig. 10.3).
Fig. 10.3 Cardiac computedtomography (CT) (volumerendered image). Figure adaptedwith permission from the BMJPublishing Group (Heart 2008;94: 781–92)
Modern MSCT scanners commonly have 16 or 64 slices, but models offeringeven more slices (256 and 320 slices) are becoming available. Cardiac CTscanning is very fast, as it typically takes no more than 15 s to acquire theimages. However, some patient preparation is required, as cardiac studiesrequire the injection of an intravascular contrast agent and many patients alsorequire a beta-blocker to slow their heart rate. Examining and reporting theimages usually takes 10–30 min, depending on the complexity of the case.
Uses of cardiac CTThe main use of MSCT is in assessment of the coronary arteries. A calciumscore can be obtained, which reflects the amount of calcification present inthe coronary arteries; this information can then be used to estimate thepatient’s risk of future cardiovascular events. The coronary arteriesthemselves can be imaged with the use of contrast (CT coronary angiography,CTCA), and any stenoses can be identified (although assessing the preciseseverity of stenoses is more difficult).
MSCT can also be used to image the cardiac chambers, allowing measurementsto be made, and movie images show ventricular function. Cardiac masses canbe examined, as can congenital abnormalities. Unfortunately cardiac CT doesnot provide information on blood flow, but it does allow valvular morphologyto be assessed.
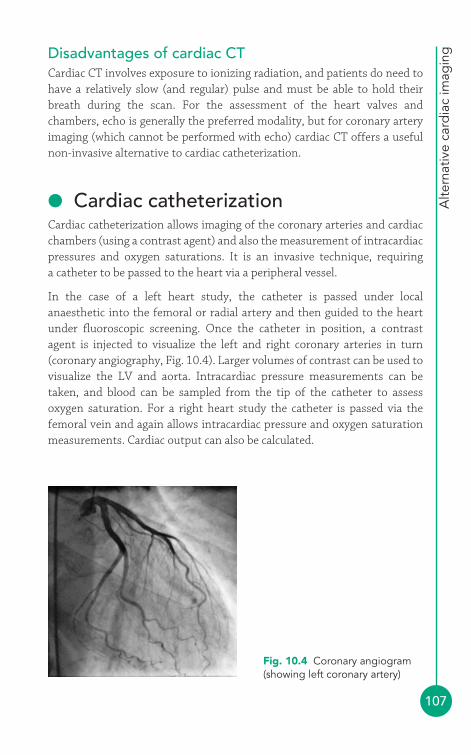
Alte
rnat
ive
card
iac
imag
ing
107
Disadvantages of cardiac CTCardiac CT involves exposure to ionizing radiation, and patients do need tohave a relatively slow (and regular) pulse and must be able to hold theirbreath during the scan. For the assessment of the heart valves andchambers, echo is generally the preferred modality, but for coronary arteryimaging (which cannot be performed with echo) cardiac CT offers a usefulnon-invasive alternative to cardiac catheterization.
● Cardiac catheterizationCardiac catheterization allows imaging of the coronary arteries and cardiacchambers (using a contrast agent) and also the measurement of intracardiacpressures and oxygen saturations. It is an invasive technique, requiring a catheter to be passed to the heart via a peripheral vessel.
In the case of a left heart study, the catheter is passed under localanaesthetic into the femoral or radial artery and then guided to the heartunder fluoroscopic screening. Once the catheter in position, a contrastagent is injected to visualize the left and right coronary arteries in turn(coronary angiography, Fig. 10.4). Larger volumes of contrast can be used tovisualize the LV and aorta. Intracardiac pressure measurements can betaken, and blood can be sampled from the tip of the catheter to assessoxygen saturation. For a right heart study the catheter is passed via thefemoral vein and again allows intracardiac pressure and oxygen saturationmeasurements. Cardiac output can also be calculated.
Fig. 10.4 Coronary angiogram(showing left coronary artery)

PART
2: C
ARD
IAC
IMA
GIN
G T
ECH
NIQ
UES
108
Uses of cardiac catheterizationCardiac catheterisation is most commonly used to assess the coronaryarteries in cases of suspected coronary artery disease. Although echo canprovide information about myocardial ischaemia (e.g. regional LV wallmotion abnormalities) it cannot visualize the coronary arteries themselves.Cardiac catheterization also has a role to play in supplementing the echoassessment of valvular, LV and congenital cardiac abnormalities.
Disadvantages of cardiac catheterizationCardiac catheterization is an invasive procedure, carrying a risk of trauma tothe vessels where catheters are inserted, and also carries a risk ofarrhythmias, myocardial infarction, stroke and death. There is also exposureto radiation and an intravascular contrast agent.
FURTHER READING
Butler R, Gunning M, Nolan J. Essential Cardiac Catheterization.Hodder Arnold, London, 2007.
Pennell D. Cardiovascular magnetic resonance. Heart 2001; 85:581–9.
Roberts WT, Bax JJ, Davies LC. Cardiac CT and CT coronaryangiography: technology and application. Heart 2008; 94:781–92.
Schwaiger M, Melin J. Cardiological applications of nuclearmedicine. Lancet 1999; 354: 661–6.

Clinical Cases
3PART

This page intentionally left blank
111
● Echo assessment of the left ventricleIn many echo departments, assessment of left ventricular (LV) function isthe single commonest echo request. One reason for this is that symptomsand signs that can indicate heart failure are common and echo is a non-invasive, straightforward and relatively inexpensive technique forconfirming whether LV dysfunction is present. This chapter will cover theassessment of LV dimensions and overall LV systolic and diastolic function(together with assessment of the left atrium (LA)). The assessment ofregional systolic function, in the context of coronary artery disease, isdiscussed in Chapter 12.
The key challenge in using echo to assess the LV lies in summarizing the sizeand function of a complex 3-D structure using just a handful of parameters.Trying to represent the LV within a limited number of measurements isfraught with pitfalls, not least when using volumetric measures that rely onassumptions about the geometrical shape of the LV, which are notnecessarily correct, particularly if the shape of the LV is distorted orabnormalities are limited just to one or two areas of the ventricular wall. Thekey is to use common sense – if there is a clear discrepancy between your‘eyeball’ assessment of the LV and the figures coming out of yourcalculations, highlight this in your report.
A comprehensive echo evaluation of the LV should include assessment of:
● LV dimensions� LV shape� wall thickness� cavity size
The left heart andits function4
11
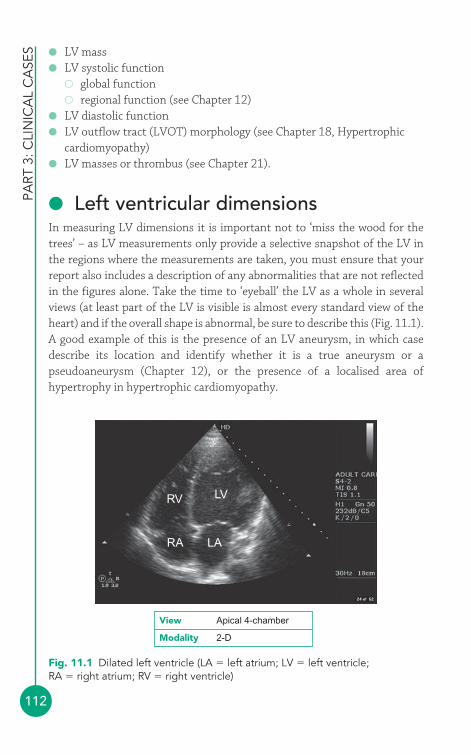
● LV mass● LV systolic function
� global function� regional function (see Chapter 12)
● LV diastolic function● LV outflow tract (LVOT) morphology (see Chapter 18, Hypertrophic
cardiomyopathy)● LV masses or thrombus (see Chapter 21).
● Left ventricular dimensionsIn measuring LV dimensions it is important not to ‘miss the wood for thetrees’ – as LV measurements only provide a selective snapshot of the LV inthe regions where the measurements are taken, you must ensure that yourreport also includes a description of any abnormalities that are not reflectedin the figures alone. Take the time to ‘eyeball’ the LV as a whole in severalviews (at least part of the LV is visible is almost every standard view of theheart) and if the overall shape is abnormal, be sure to describe this (Fig. 11.1).A good example of this is the presence of an LV aneurysm, in which casedescribe its location and identify whether it is a true aneurysm or apseudoaneurysm (Chapter 12), or the presence of a localised area ofhypertrophy in hypertrophic cardiomyopathy.
PART
3: C
LIN
ICA
L C
ASE
S
112
RV
RA LA
LV
Fig. 11.1 Dilated left ventricle (LA � left atrium; LV � left ventricle;RA � right atrium; RV � right ventricle)
View Apical 4-chamber
Modality 2-D
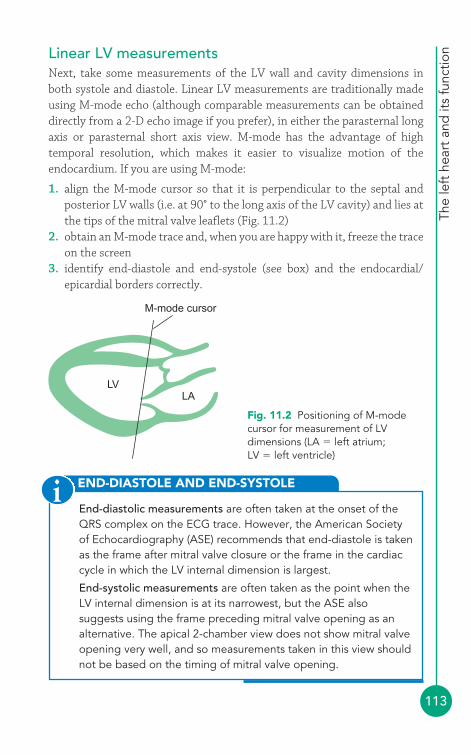
The
left
hea
rt a
nd it
s fu
nctio
n
113
Linear LV measurementsNext, take some measurements of the LV wall and cavity dimensions inboth systole and diastole. Linear LV measurements are traditionally madeusing M-mode echo (although comparable measurements can be obtaineddirectly from a 2-D echo image if you prefer), in either the parasternal longaxis or parasternal short axis view. M-mode has the advantage of hightemporal resolution, which makes it easier to visualize motion of theendocardium. If you are using M-mode:
1. align the M-mode cursor so that it is perpendicular to the septal andposterior LV walls (i.e. at 90° to the long axis of the LV cavity) and lies atthe tips of the mitral valve leaflets (Fig. 11.2)
2. obtain an M-mode trace and, when you are happy with it, freeze the traceon the screen
3. identify end-diastole and end-systole (see box) and the endocardial/epicardial borders correctly.
M-mode cursor
LVLA
Fig. 11.2 Positioning of M-modecursor for measurement of LVdimensions (LA � left atrium;LV � left ventricle)
END-DIASTOLE AND END-SYSTOLE
End-diastolic measurements are often taken at the onset of theQRS complex on the ECG trace. However, the American Societyof Echocardiography (ASE) recommends that end-diastole is takenas the frame after mitral valve closure or the frame in the cardiaccycle in which the LV internal dimension is largest.
End-systolic measurements are often taken as the point when theLV internal dimension is at its narrowest, but the ASE alsosuggests using the frame preceding mitral valve opening as analternative. The apical 2-chamber view does not show mitral valveopening very well, and so measurements taken in this view shouldnot be based on the timing of mitral valve opening.
i
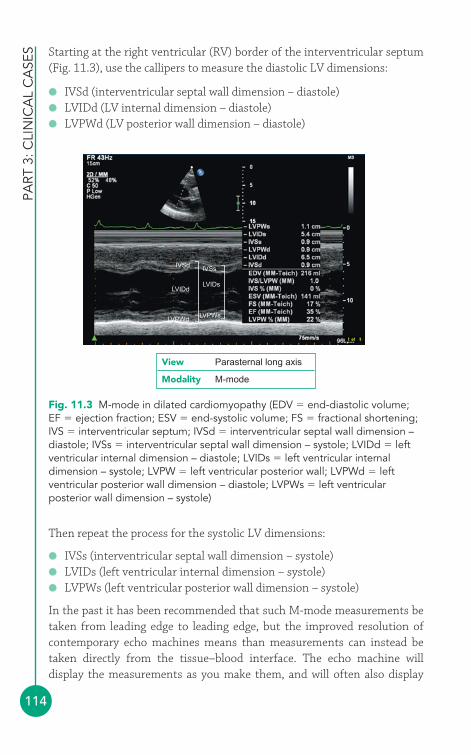
PART
3: C
LIN
ICA
L C
ASE
S
114
Starting at the right ventricular (RV) border of the interventricular septum(Fig. 11.3), use the callipers to measure the diastolic LV dimensions:
● IVSd (interventricular septal wall dimension – diastole)● LVIDd (LV internal dimension – diastole)● LVPWd (LV posterior wall dimension – diastole)
LVPWd
LVIDd
IVSd IVSs
LVIDs
LVPWs
Fig. 11.3 M-mode in dilated cardiomyopathy (EDV � end-diastolic volume;EF � ejection fraction; ESV � end-systolic volume; FS � fractional shortening;IVS � interventricular septum; IVSd � interventricular septal wall dimension –diastole; IVSs � interventricular septal wall dimension – systole; LVIDd � leftventricular internal dimension – diastole; LVIDs � left ventricular internaldimension – systole; LVPW � left ventricular posterior wall; LVPWd � leftventricular posterior wall dimension – diastole; LVPWs � left ventricularposterior wall dimension – systole)
View Parasternal long axis
Modality M-mode
Then repeat the process for the systolic LV dimensions:
● IVSs (interventricular septal wall dimension – systole)● LVIDs (left ventricular internal dimension – systole)● LVPWs (left ventricular posterior wall dimension – systole)
In the past it has been recommended that such M-mode measurements betaken from leading edge to leading edge, but the improved resolution ofcontemporary echo machines means than measurements can instead betaken directly from the tissue–blood interface. The echo machine willdisplay the measurements as you make them, and will often also display
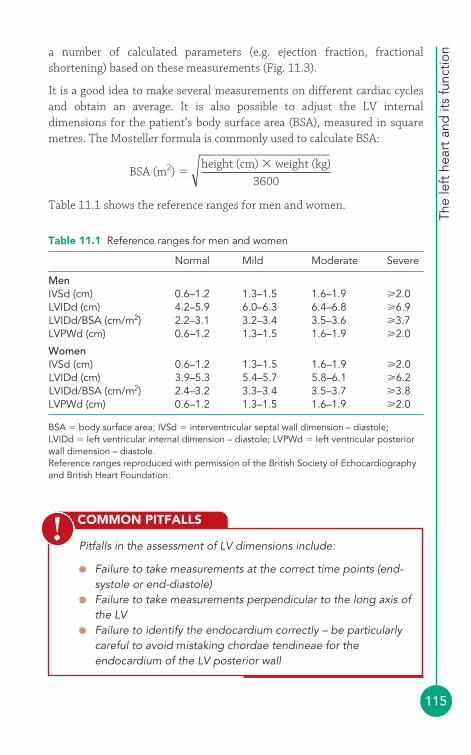
The
left
hea
rt a
nd it
s fu
nctio
n
115
a number of calculated parameters (e.g. ejection fraction, fractionalshortening) based on these measurements (Fig. 11.3).
It is a good idea to make several measurements on different cardiac cyclesand obtain an average. It is also possible to adjust the LV internaldimensions for the patient’s body surface area (BSA), measured in squaremetres. The Mosteller formula is commonly used to calculate BSA:
Table 11.1 shows the reference ranges for men and women.
BSA (m2)height (cm) � weight (kg)
3600�
COMMON PITFALLS
Pitfalls in the assessment of LV dimensions include:
● Failure to take measurements at the correct time points (end-systole or end-diastole)
● Failure to take measurements perpendicular to the long axis ofthe LV
● Failure to identify the endocardium correctly – be particularlycareful to avoid mistaking chordae tendineae for theendocardium of the LV posterior wall
!
Table 11.1 Reference ranges for men and women
Normal Mild Moderate Severe
MenIVSd (cm) 0.6–1.2 1.3–1.5 1.6–1.9 2.0LVIDd (cm) 4.2–5.9 6.0–6.3 6.4–6.8 6.9LVIDd/BSA (cm/m2) 2.2–3.1 3.2–3.4 3.5–3.6 3.7LVPWd (cm) 0.6–1.2 1.3–1.5 1.6–1.9 2.0
WomenIVSd (cm) 0.6–1.2 1.3–1.5 1.6–1.9 2.0LVIDd (cm) 3.9–5.3 5.4–5.7 5.8–6.1 6.2LVIDd/BSA (cm/m2) 2.4–3.2 3.3–3.4 3.5–3.7 3.8LVPWd (cm) 0.6–1.2 1.3–1.5 1.6–1.9 2.0
BSA � body surface area; IVSd � interventricular septal wall dimension – diastole;LVIDd � left ventricular internal dimension – diastole; LVPWd � left ventricular posteriorwall dimension – diastole.Reference ranges reproduced with permission of the British Society of Echocardiographyand British Heart Foundation.
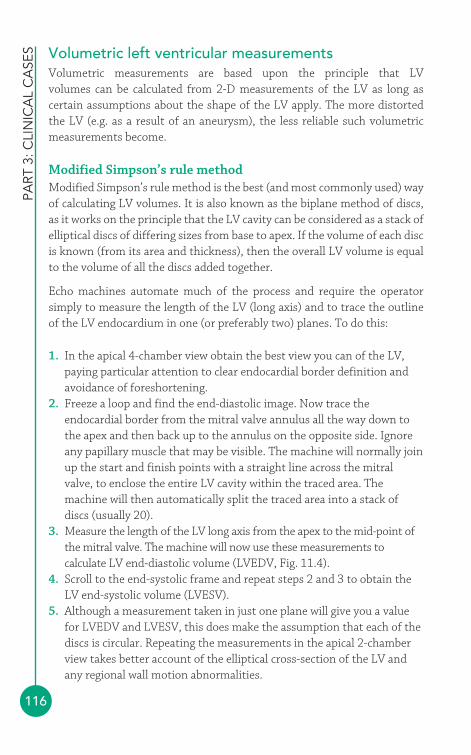
PART
3: C
LIN
ICA
L C
ASE
S
116
Volumetric left ventricular measurementsVolumetric measurements are based upon the principle that LV volumes can be calculated from 2-D measurements of the LV as long ascertain assumptions about the shape of the LV apply. The more distortedthe LV (e.g. as a result of an aneurysm), the less reliable such volumetricmeasurements become.
Modified Simpson’s rule methodModified Simpson’s rule method is the best (and most commonly used) wayof calculating LV volumes. It is also known as the biplane method of discs,as it works on the principle that the LV cavity can be considered as a stack ofelliptical discs of differing sizes from base to apex. If the volume of each discis known (from its area and thickness), then the overall LV volume is equalto the volume of all the discs added together.
Echo machines automate much of the process and require the operatorsimply to measure the length of the LV (long axis) and to trace the outlineof the LV endocardium in one (or preferably two) planes. To do this:
1. In the apical 4-chamber view obtain the best view you can of the LV,paying particular attention to clear endocardial border definition andavoidance of foreshortening.
2. Freeze a loop and find the end-diastolic image. Now trace theendocardial border from the mitral valve annulus all the way down tothe apex and then back up to the annulus on the opposite side. Ignoreany papillary muscle that may be visible. The machine will normally joinup the start and finish points with a straight line across the mitralvalve, to enclose the entire LV cavity within the traced area. Themachine will then automatically split the traced area into a stack ofdiscs (usually 20).
3. Measure the length of the LV long axis from the apex to the mid-point ofthe mitral valve. The machine will now use these measurements tocalculate LV end-diastolic volume (LVEDV, Fig. 11.4).
4. Scroll to the end-systolic frame and repeat steps 2 and 3 to obtain theLV end-systolic volume (LVESV).
5. Although a measurement taken in just one plane will give you a valuefor LVEDV and LVESV, this does make the assumption that each of thediscs is circular. Repeating the measurements in the apical 2-chamberview takes better account of the elliptical cross-section of the LV andany regional wall motion abnormalities.
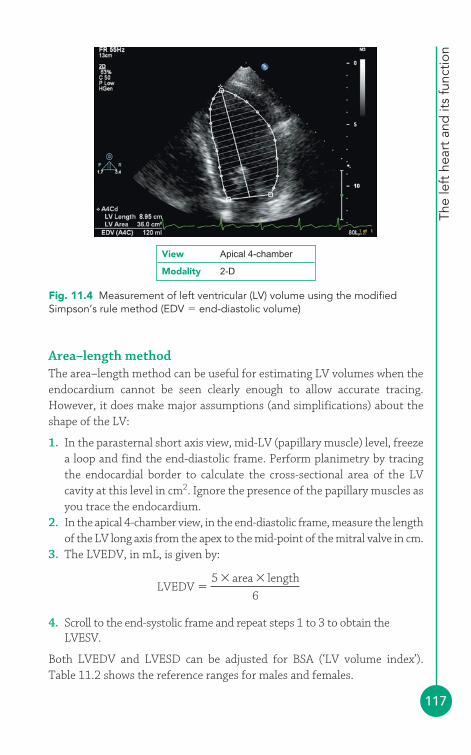
The
left
hea
rt a
nd it
s fu
nctio
n
117
Area–length methodThe area–length method can be useful for estimating LV volumes when theendocardium cannot be seen clearly enough to allow accurate tracing.However, it does make major assumptions (and simplifications) about theshape of the LV:
1. In the parasternal short axis view, mid-LV (papillary muscle) level, freezea loop and find the end-diastolic frame. Perform planimetry by tracingthe endocardial border to calculate the cross-sectional area of the LVcavity at this level in cm2. Ignore the presence of the papillary muscles asyou trace the endocardium.
2. In the apical 4-chamber view, in the end-diastolic frame, measure the lengthof the LV long axis from the apex to the mid-point of the mitral valve in cm.
3. The LVEDV, in mL, is given by:
4. Scroll to the end-systolic frame and repeat steps 1 to 3 to obtain theLVESV.
Both LVEDV and LVESD can be adjusted for BSA (‘LV volume index’).Table 11.2 shows the reference ranges for males and females.
LVEDV �5 � area � length
6
View Apical 4-chamber
Modality 2-D
Fig. 11.4 Measurement of left ventricular (LV) volume using the modifiedSimpson’s rule method (EDV � end-diastolic volume)
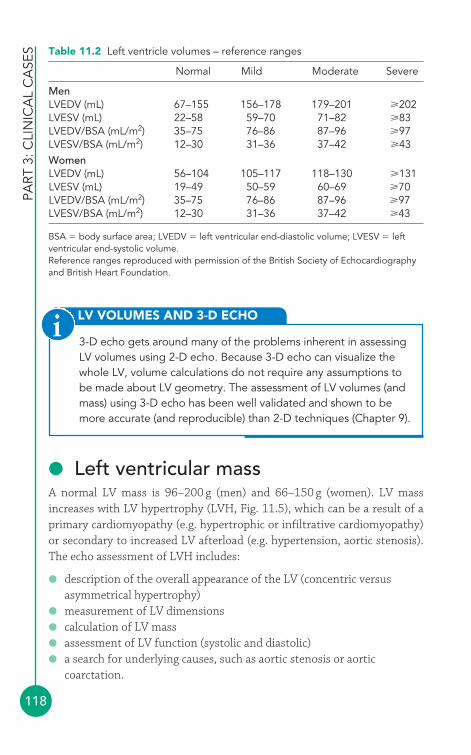
PART
3: C
LIN
ICA
L C
ASE
S
118
● Left ventricular massA normal LV mass is 96–200 g (men) and 66–150 g (women). LV massincreases with LV hypertrophy (LVH, Fig. 11.5), which can be a result of aprimary cardiomyopathy (e.g. hypertrophic or infiltrative cardiomyopathy)or secondary to increased LV afterload (e.g. hypertension, aortic stenosis).The echo assessment of LVH includes:
● description of the overall appearance of the LV (concentric versusasymmetrical hypertrophy)
● measurement of LV dimensions● calculation of LV mass● assessment of LV function (systolic and diastolic)● a search for underlying causes, such as aortic stenosis or aortic
coarctation.
LV VOLUMES AND 3-D ECHO
3-D echo gets around many of the problems inherent in assessingLV volumes using 2-D echo. Because 3-D echo can visualize thewhole LV, volume calculations do not require any assumptions tobe made about LV geometry. The assessment of LV volumes (andmass) using 3-D echo has been well validated and shown to bemore accurate (and reproducible) than 2-D techniques (Chapter 9).
i
Table 11.2 Left ventricle volumes – reference ranges
Normal Mild Moderate Severe
MenLVEDV (mL) 67–155 156–178 179–201 202LVESV (mL) 22–58 59–70 71–82 83LVEDV/BSA (mL/m2) 35–75 76–86 87–96 97LVESV/BSA (mL/m2) 12–30 31–36 37–42 43WomenLVEDV (mL) 56–104 105–117 118–130 131LVESV (mL) 19–49 50–59 60–69 70LVEDV/BSA (mL/m2) 35–75 76–86 87–96 97LVESV/BSA (mL/m2) 12–30 31–36 37–42 43
BSA � body surface area; LVEDV � left ventricular end-diastolic volume; LVESV � leftventricular end-systolic volume.Reference ranges reproduced with permission of the British Society of Echocardiographyand British Heart Foundation.
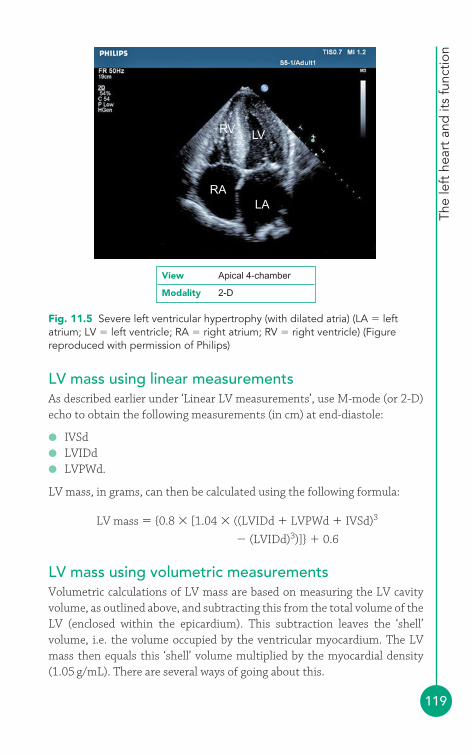
The
left
hea
rt a
nd it
s fu
nctio
n
119
LV mass using linear measurementsAs described earlier under ‘Linear LV measurements’, use M-mode (or 2-D)echo to obtain the following measurements (in cm) at end-diastole:
● IVSd● LVIDd● LVPWd.
LV mass, in grams, can then be calculated using the following formula:
LV mass � {0.8 � [1.04 � ((LVIDd � LVPWd � IVSd)3
� (LVIDd)3)]} � 0.6
LV mass using volumetric measurementsVolumetric calculations of LV mass are based on measuring the LV cavityvolume, as outlined above, and subtracting this from the total volume of theLV (enclosed within the epicardium). This subtraction leaves the ‘shell’volume, i.e. the volume occupied by the ventricular myocardium. The LVmass then equals this ‘shell’ volume multiplied by the myocardial density(1.05 g/mL). There are several ways of going about this.
RV
RA
LV
LA
Fig. 11.5 Severe left ventricular hypertrophy (with dilated atria) (LA � leftatrium; LV � left ventricle; RA � right atrium; RV � right ventricle) (Figurereproduced with permission of Philips)
View Apical 4-chamber
Modality 2-D
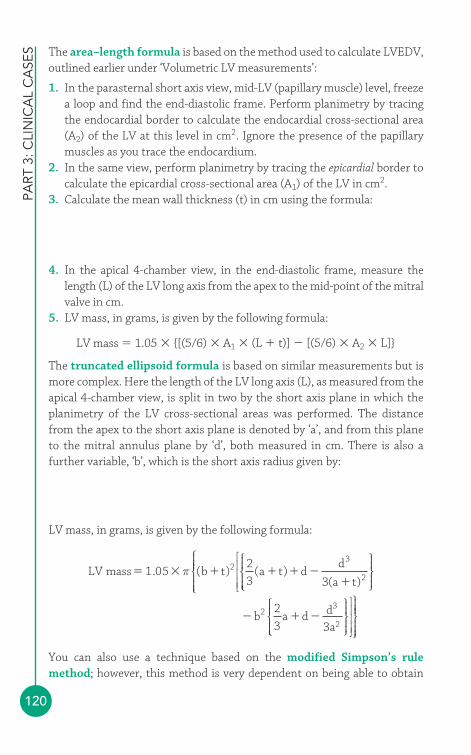
PART
3: C
LIN
ICA
L C
ASE
S
120
The area–length formula is based on the method used to calculate LVEDV,outlined earlier under ‘Volumetric LV measurements’:
1. In the parasternal short axis view, mid-LV (papillary muscle) level, freezea loop and find the end-diastolic frame. Perform planimetry by tracingthe endocardial border to calculate the endocardial cross-sectional area(A2) of the LV at this level in cm2. Ignore the presence of the papillarymuscles as you trace the endocardium.
2. In the same view, perform planimetry by tracing the epicardial border tocalculate the epicardial cross-sectional area (A1) of the LV in cm2.
3. Calculate the mean wall thickness (t) in cm using the formula:
4. In the apical 4-chamber view, in the end-diastolic frame, measure thelength (L) of the LV long axis from the apex to the mid-point of the mitralvalve in cm.
5. LV mass, in grams, is given by the following formula:
LV mass � 1.05 � {[(5/6) � A1 � (L � t)] � [(5/6) � A2 � L]}
The truncated ellipsoid formula is based on similar measurements but ismore complex. Here the length of the LV long axis (L), as measured from theapical 4-chamber view, is split in two by the short axis plane in which theplanimetry of the LV cross-sectional areas was performed. The distancefrom the apex to the short axis plane is denoted by ‘a’, and from this planeto the mitral annulus plane by ‘d’, both measured in cm. There is also afurther variable, ‘b’, which is the short axis radius given by:
LV mass, in grams, is given by the following formula:
You can also use a technique based on the modified Simpson’s rulemethod; however, this method is very dependent on being able to obtain
LV mass b t a t dd
a t� � � � � �
�1 05
2
3 32
3
2. ( ) ( )
( )π
⎧⎨⎪⎪
⎩⎩⎪⎪
⎫⎬⎪⎪
⎭⎪⎪
⎡
⎣
⎢⎢⎢
⎧⎨⎪⎪⎪
⎩⎪⎪⎪
⎧⎨⎪⎪� � �b a d d3
2 2
3 3a2⎩⎩⎪⎪
⎫⎬⎪⎪
⎭⎪⎪
⎤
⎦
⎥⎥⎥
⎫⎬⎪⎪⎪
⎭⎪⎪⎪
b �A2
π
tA1 A2� �π π
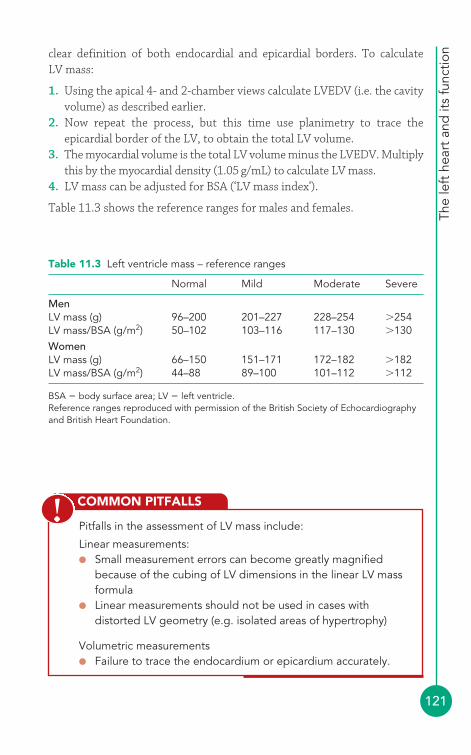
The
left
hea
rt a
nd it
s fu
nctio
n
121
clear definition of both endocardial and epicardial borders. To calculate LV mass:
1. Using the apical 4- and 2-chamber views calculate LVEDV (i.e. the cavityvolume) as described earlier.
2. Now repeat the process, but this time use planimetry to trace theepicardial border of the LV, to obtain the total LV volume.
3. The myocardial volume is the total LV volume minus the LVEDV. Multiplythis by the myocardial density (1.05 g/mL) to calculate LV mass.
4. LV mass can be adjusted for BSA (‘LV mass index’).
Table 11.3 shows the reference ranges for males and females.
COMMON PITFALLS
Pitfalls in the assessment of LV mass include:
Linear measurements: ● Small measurement errors can become greatly magnified
because of the cubing of LV dimensions in the linear LV massformula
● Linear measurements should not be used in cases withdistorted LV geometry (e.g. isolated areas of hypertrophy)
Volumetric measurements● Failure to trace the endocardium or epicardium accurately.
!
Table 11.3 Left ventricle mass – reference ranges
Normal Mild Moderate Severe
MenLV mass (g) 96–200 201–227 228–254 �254LV mass/BSA (g/m2) 50–102 103–116 117–130 �130WomenLV mass (g) 66–150 151–171 172–182 �182LV mass/BSA (g/m2) 44–88 89–100 101–112 �112
BSA � body surface area; LV � left ventricle.Reference ranges reproduced with permission of the British Society of Echocardiographyand British Heart Foundation.
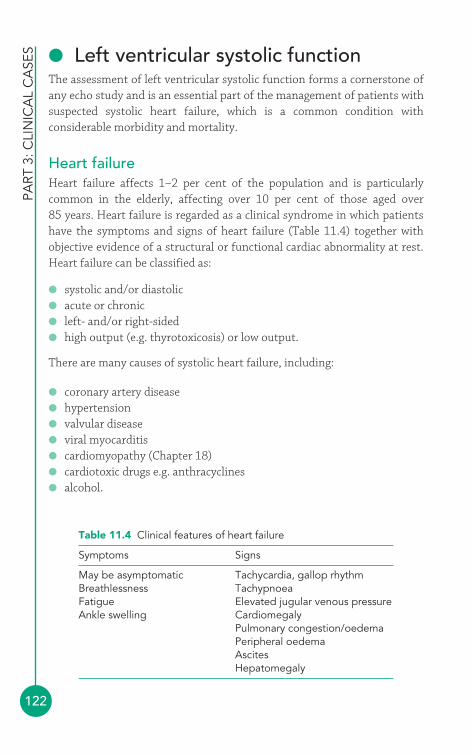
PART
3: C
LIN
ICA
L C
ASE
S
122
● Left ventricular systolic functionThe assessment of left ventricular systolic function forms a cornerstone ofany echo study and is an essential part of the management of patients withsuspected systolic heart failure, which is a common condition withconsiderable morbidity and mortality.
Heart failureHeart failure affects 1–2 per cent of the population and is particularlycommon in the elderly, affecting over 10 per cent of those aged over 85 years. Heart failure is regarded as a clinical syndrome in which patientshave the symptoms and signs of heart failure (Table 11.4) together withobjective evidence of a structural or functional cardiac abnormality at rest.Heart failure can be classified as:
● systolic and/or diastolic● acute or chronic● left- and/or right-sided● high output (e.g. thyrotoxicosis) or low output.
There are many causes of systolic heart failure, including:
● coronary artery disease● hypertension● valvular disease● viral myocarditis● cardiomyopathy (Chapter 18)● cardiotoxic drugs e.g. anthracyclines● alcohol.
Table 11.4 Clinical features of heart failure
Symptoms Signs
May be asymptomatic Tachycardia, gallop rhythmBreathlessness TachypnoeaFatigue Elevated jugular venous pressureAnkle swelling Cardiomegaly
Pulmonary congestion/oedemaPeripheral oedemaAscitesHepatomegaly
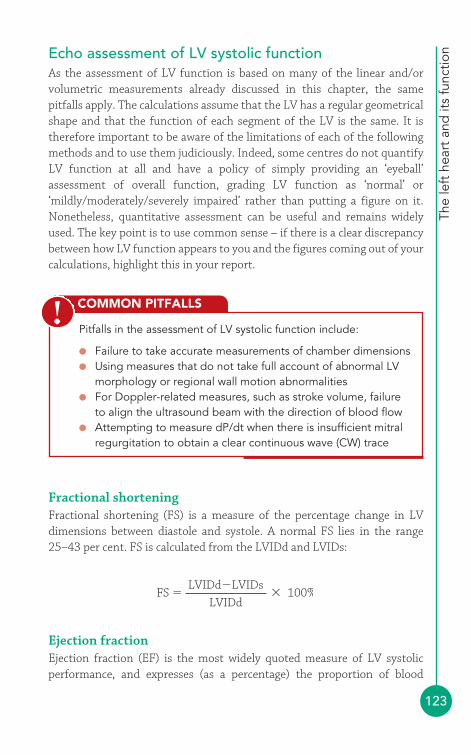
The
left
hea
rt a
nd it
s fu
nctio
n
123
Echo assessment of LV systolic functionAs the assessment of LV function is based on many of the linear and/orvolumetric measurements already discussed in this chapter, the samepitfalls apply. The calculations assume that the LV has a regular geometricalshape and that the function of each segment of the LV is the same. It istherefore important to be aware of the limitations of each of the followingmethods and to use them judiciously. Indeed, some centres do not quantifyLV function at all and have a policy of simply providing an ‘eyeball’assessment of overall function, grading LV function as ‘normal’ or‘mildly/moderately/severely impaired’ rather than putting a figure on it.Nonetheless, quantitative assessment can be useful and remains widelyused. The key point is to use common sense – if there is a clear discrepancybetween how LV function appears to you and the figures coming out of yourcalculations, highlight this in your report.
COMMON PITFALLS
Pitfalls in the assessment of LV systolic function include:
● Failure to take accurate measurements of chamber dimensions● Using measures that do not take full account of abnormal LV
morphology or regional wall motion abnormalities● For Doppler-related measures, such as stroke volume, failure
to align the ultrasound beam with the direction of blood flow● Attempting to measure dP/dt when there is insufficient mitral
regurgitation to obtain a clear continuous wave (CW) trace
!
Fractional shorteningFractional shortening (FS) is a measure of the percentage change in LVdimensions between diastole and systole. A normal FS lies in the range25–43 per cent. FS is calculated from the LVIDd and LVIDs:
Ejection fractionEjection fraction (EF) is the most widely quoted measure of LV systolicperformance, and expresses (as a percentage) the proportion of blood
FS �LVIDd�LVIDs
LVIDd� 100%
PART
3: C
LIN
ICA
L C
ASE
S
124
pumped out of the LV with each heartbeat. A normal EF is 55 per cent. EF is calculated from the LVEDV and LVESV:
It is also possible to calculate EF using linear rather than volumetricmeasurements (i.e. based upon M-mode measurements alone), using theformula:
However, this method takes no account of variations in regional wallmotion and is highly prone to inaccuracies. EF is often automaticallycalculated by an echo machine as soon as the linear measurements of LVIDdand LVIDs have been entered by the sonographer (Fig. 11.3), but ratherthan accepting this value you should, where possible, go on to assess EFusing volumetric measurements.
EF �LVIDd3�LVIDs3
LVIDd3 � 100%
EF �LVEDV�LVESV
LVEDV� 100%
EF AND TRASTUZUMAB (HERCEPTIN)
Accurate measurement of EF is always desirable, but there aresituations in which it can be crucial. One of these is in themonitoring of patients with breast cancer receiving trastuzumab(Herceptin), a drug that can affect LV function. It is recommendedby the National Institute for Health and Clinical Excellence thatcardiac function should be assessed prior to starting treatment,and that treatment should not be offered to those with an EF � 55per cent. Patients on treatment should have a cardiac functionalassessment every 3 months and if the EF drops by 10 percentage(ejection) points or more from baseline and to below 50 per centthen treatment should be suspended. The British Society ofEchocardiography stresses the importance of measuring EFaccurately in these patients, using the modified Simpson’s rulemethod (or 3-D echo) and with the availability of LV contrast asappropriate, and that echo departments should have recent auditdata to demonstrate that they can reproducibly measure EF to therequirements of these guidelines.
i
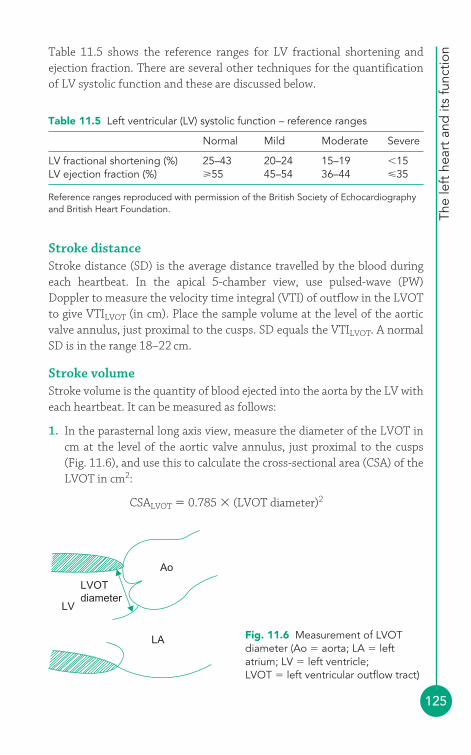
The
left
hea
rt a
nd it
s fu
nctio
n
125
Table 11.5 shows the reference ranges for LV fractional shortening andejection fraction. There are several other techniques for the quantificationof LV systolic function and these are discussed below.
LV
LA
Ao
LVOTdiameter
Fig. 11.6 Measurement of LVOTdiameter (Ao � aorta; LA � leftatrium; LV � left ventricle;LVOT � left ventricular outflow tract)
Stroke distanceStroke distance (SD) is the average distance travelled by the blood duringeach heartbeat. In the apical 5-chamber view, use pulsed-wave (PW)Doppler to measure the velocity time integral (VTI) of outflow in the LVOTto give VTILVOT (in cm). Place the sample volume at the level of the aorticvalve annulus, just proximal to the cusps. SD equals the VTILVOT. A normalSD is in the range 18–22 cm.
Stroke volumeStroke volume is the quantity of blood ejected into the aorta by the LV witheach heartbeat. It can be measured as follows:
1. In the parasternal long axis view, measure the diameter of the LVOT incm at the level of the aortic valve annulus, just proximal to the cusps (Fig. 11.6), and use this to calculate the cross-sectional area (CSA) of theLVOT in cm2:
CSALVOT � 0.785 � (LVOT diameter)2
Table 11.5 Left ventricular (LV) systolic function – reference ranges
Normal Mild Moderate Severe
LV fractional shortening (%) 25–43 20–24 15–19 �15LV ejection fraction (%) 55 45–54 36–44 �35
Reference ranges reproduced with permission of the British Society of Echocardiographyand British Heart Foundation.
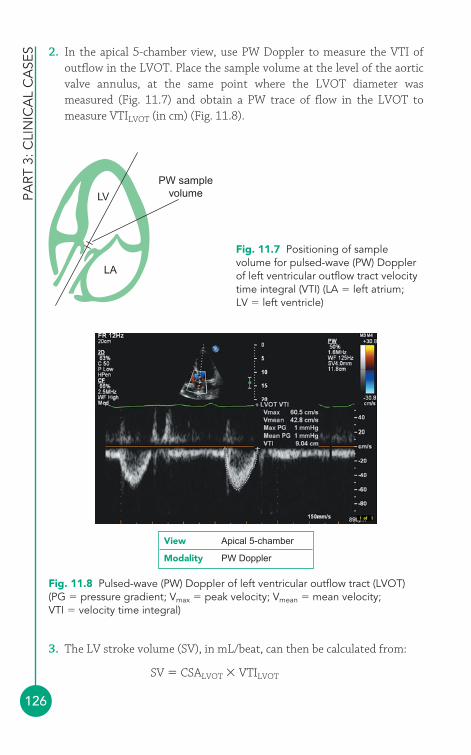
PART
3: C
LIN
ICA
L C
ASE
S
126
2. In the apical 5-chamber view, use PW Doppler to measure the VTI ofoutflow in the LVOT. Place the sample volume at the level of the aorticvalve annulus, at the same point where the LVOT diameter wasmeasured (Fig. 11.7) and obtain a PW trace of flow in the LVOT tomeasure VTILVOT (in cm) (Fig. 11.8).
Fig. 11.8 Pulsed-wave (PW) Doppler of left ventricular outflow tract (LVOT)(PG � pressure gradient; Vmax � peak velocity; Vmean � mean velocity;VTI � velocity time integral)
View Apical 5-chamber
Modality PW Doppler
LV
LA
PW samplevolume
Fig. 11.7 Positioning of samplevolume for pulsed-wave (PW) Dopplerof left ventricular outflow tract velocitytime integral (VTI) (LA � left atrium;LV � left ventricle)
3. The LV stroke volume (SV), in mL/beat, can then be calculated from:
SV � CSALVOT � VTILVOT
The
left
hea
rt a
nd it
s fu
nctio
n
127
A normal SV lies in the range 60–100 mL/beat. The calculation of SV dependson a good alignment of the Doppler interrogation angle with the direction offlow, and upon the assumption that flow in the LVOT is laminar and theLVOT cross-section is circular. It is essential to measure the LVOT diameter asaccurately as possible. SV can, in principle, be measured anywhere in the heartwhere a cross-sectional area and VTI can be measured, but in practical termsmeasurement at the LVOT is relatively straightforward.
Stroke volume indexStroke volume index (SVI) is SV adjusted for BSA, measured in mL/beat/m2:
Cardiac outputCardiac output (CO) can be calculated from the SV and the heart rate (HR,in beats/min). A normal cardiac output is 4–8 L/min:
Cardiac indexCardiac index (CI) is CO adjusted for BSA, measured in L/min/m2:
Rate of ventricular pressure rise (dP/dt)With normal LV systolic function, the rate of rise in ventricular pressure(dP/dt) during systole is rapid. If systolic function is impaired, dP/dt starts tofall. The measurement of dP/dt requires the presence of mitral regurgitation:
1. In the apical 4-chamber view, use CW Doppler to obtain a spectral traceof mitral regurgitation, ensuring careful alignment of the ultra-sound beamwith the regurgitant jet. Set the sweep speed as high as possible to‘spread out’ the trace and make it easier to mark the relevant timepoints.
2. Using the trace, mark the points where the regurgitant jet velocityreaches 1 m/s and also 3 m/s. Measure the time interval (dt) betweenthese two points in seconds (Fig. 11.9).
3. At 1 m/s the pressure gradient driving the regurgitant jet is 4 mmHg(Bernoulli equation), and at 3 m/s the gradient is 36 mmHg, giving achange in pressure gradients (dP) between the two velocities of 32 mmHg.
CI �CO
BSA
CO �SV�HR
1000
SVI �SV
BSA
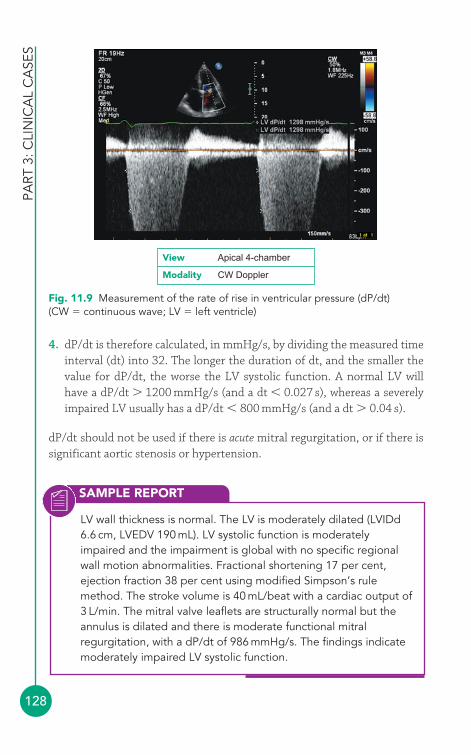
SAMPLE REPORT
PART
3: C
LIN
ICA
L C
ASE
S
128
LV wall thickness is normal. The LV is moderately dilated (LVIDd6.6 cm, LVEDV 190 mL). LV systolic function is moderatelyimpaired and the impairment is global with no specific regionalwall motion abnormalities. Fractional shortening 17 per cent,ejection fraction 38 per cent using modified Simpson’s rulemethod. The stroke volume is 40 mL/beat with a cardiac output of3 L/min. The mitral valve leaflets are structurally normal but theannulus is dilated and there is moderate functional mitralregurgitation, with a dP/dt of 986 mmHg/s. The findings indicatemoderately impaired LV systolic function.
4. dP/dt is therefore calculated, in mmHg/s, by dividing the measured timeinterval (dt) into 32. The longer the duration of dt, and the smaller thevalue for dP/dt, the worse the LV systolic function. A normal LV willhave a dP/dt � 1200 mmHg/s (and a dt � 0.027 s), whereas a severelyimpaired LV usually has a dP/dt � 800 mmHg/s (and a dt � 0.04 s).
dP/dt should not be used if there is acute mitral regurgitation, or if there issignificant aortic stenosis or hypertension.
Fig. 11.9 Measurement of the rate of rise in ventricular pressure (dP/dt)(CW � continuous wave; LV � left ventricle)
View Apical 4-chamber
Modality CW Doppler
CARDIAC RESYNCHRONIZATION THERAPY
The
left
hea
rt a
nd it
s fu
nctio
n
129
Management of impaired LV systolic functionPatients with LV systolic dysfunction are treated with diuretics to relievesymptoms and any contributing factors (e.g. hypertension, valvular disease,myocardial ischaemia) should be treated as appropriate. Both morbidity andmortality are improved by the use of angiotensin-converting enzyme (ACE)inhibitors (or angiotensin receptor blockers) and beta-blockers (e.g.bisoprolol, carvedilol). In some patients there is also a role for aldosteroneantagonists (e.g. spironolactone) and digoxin.
Patients with moderate to severe heart failure despite optimal medicaltreatment, a LVEF � 35 per cent and broad QRS complexes on the ECG (QRSduration 120 ms) may gain a reduction in symptoms and in mortality withthe implantation of a biventricular pacemaker (cardiac resynchronizationtherapy, CRT – see box). Those at high risk of ventricular arrhythmias maybenefit from an implantable cardioverter defibrillator (ICD).
Echo can help in patient selection for CRT by demonstratingimpaired synchrony in contraction both between LV and RV(interventricular dyssynchrony) and between different walls withinthe LV (intraventricular dyssynchrony). Many different measuresare available, often using advanced techniques such as tissueDoppler imaging (TDI) and 3-D echo.
Interventricular dyssynchrony can be assessed by measuring thetime from the start of the QRS complex on the ECG to the start ofaortic and pulmonary flow (as measured using PW Doppler in theapical 5-chamber and parasternal short axis views, respectively). If the difference between the onset of aortic and pulmonary flowis 40 ms, significant dyssynchrony is present.
Intraventricular dyssynchrony can be assessed by measuring thetime from the start of the QRS complex on the ECG to the peak of LV septal and posterior wall contraction (as measured using M-mode in the parasternal long axis view). If the difference inpeak contraction between the two walls is 130 ms, significantdyssynchrony is present.
i
● Left ventricular diastolic functionThe diagnosis and management of diastolic heart failure has always beensomewhat controversial because it is harder to characterize, and the
HEART FAILURE WITH PRESERVED EF
PART
3: C
LIN
ICA
L C
ASE
S
130
treatment strategies are less well studied than for systolic heart failure.Clinically, a diagnosis of diastolic heart failure is usually considered when apatient has symptoms and/or signs of heart failure (as for systolic heart failure)but their LV systolic function is normal or near-normal (EF � 50 per cent).
Diastolic heart failure is also known as ‘heart failure with preserved ejectionfraction’ (HFPEF), distinguishing it from systolic heart failure (‘heart failure
Many authorities argue that LV diastolic dysfunction can bepresent regardless of whether systolic function is normal or not.However, if you wish to specifically diagnose heart failure withpreserved EF, you need to confirm that systolic function is indeedvirtually normal. The European Society of Cardiology criteria for‘normal or mildly abnormal LV function’ are:
● LV ejection fraction � 50 per cent● LV end-diastolic volume index � 97 mL/m2
● LV end-systolic volume index � 49 mL/m2.
i
with reduced ejection fraction’, HFREF). There is however evidence thatdiastolic dysfunction is also present in patients with systolic dysfunction, sosome authorities regard the distinction between systolic and diastolicfailure as false and argue that systolic and diastolic dysfunction are part of asingle spectrum, and that diastolic dysfunction is often a precursor tosystolic dysfunction. It certainly seems that there is significant overlapbetween systolic and diastolic dysfunction and they should not be regardedas mutually exclusive entities.
Causes of impaired LV diastolic functionDiastolic dysfunction is thought to reflect ‘stiffness’ or impaired relaxationof the LV, and so occurs in conditions where the LV becomes less compliant:
● ageing● hypertension● LVH● myocardial ischaemia● aortic stenosis● infiltrative cardiomyopathies.
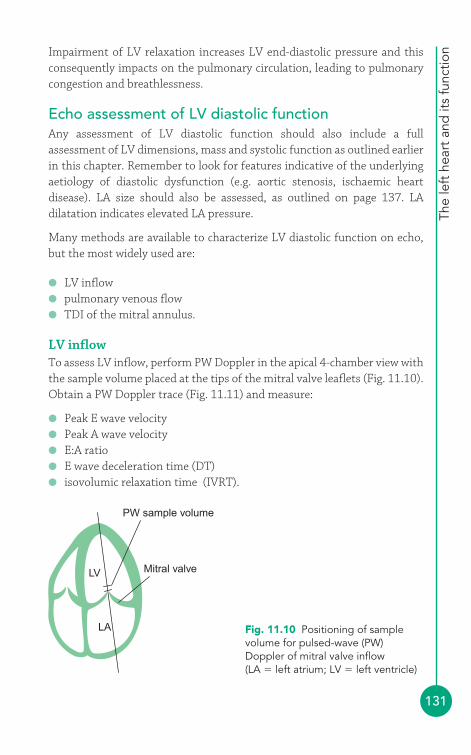
The
left
hea
rt a
nd it
s fu
nctio
n
131
Impairment of LV relaxation increases LV end-diastolic pressure and thisconsequently impacts on the pulmonary circulation, leading to pulmonarycongestion and breathlessness.
Echo assessment of LV diastolic functionAny assessment of LV diastolic function should also include a fullassessment of LV dimensions, mass and systolic function as outlined earlierin this chapter. Remember to look for features indicative of the underlyingaetiology of diastolic dysfunction (e.g. aortic stenosis, ischaemic heartdisease). LA size should also be assessed, as outlined on page 137. LAdilatation indicates elevated LA pressure.
Many methods are available to characterize LV diastolic function on echo,but the most widely used are:
● LV inflow● pulmonary venous flow● TDI of the mitral annulus.
LV inflowTo assess LV inflow, perform PW Doppler in the apical 4-chamber view withthe sample volume placed at the tips of the mitral valve leaflets (Fig. 11.10).Obtain a PW Doppler trace (Fig. 11.11) and measure:
● Peak E wave velocity● Peak A wave velocity● E:A ratio● E wave deceleration time (DT)● isovolumic relaxation time (IVRT).
PW sample volume
Mitral valve
LA
LV
Fig. 11.10 Positioning of samplevolume for pulsed-wave (PW)Doppler of mitral valve inflow(LA � left atrium; LV � left ventricle)
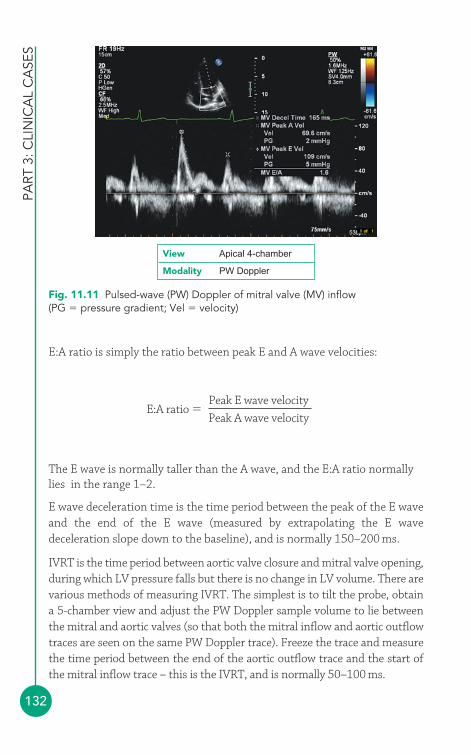
PART
3: C
LIN
ICA
L C
ASE
S
132
E:A ratio is simply the ratio between peak E and A wave velocities:
The E wave is normally taller than the A wave, and the E:A ratio normallylies in the range 1–2.
E wave deceleration time is the time period between the peak of the E waveand the end of the E wave (measured by extrapolating the E wavedeceleration slope down to the baseline), and is normally 150–200 ms.
IVRT is the time period between aortic valve closure and mitral valve opening,during which LV pressure falls but there is no change in LV volume. There arevarious methods of measuring IVRT. The simplest is to tilt the probe, obtain a 5-chamber view and adjust the PW Doppler sample volume to lie betweenthe mitral and aortic valves (so that both the mitral inflow and aortic outflowtraces are seen on the same PW Doppler trace). Freeze the trace and measurethe time period between the end of the aortic outflow trace and the start ofthe mitral inflow trace – this is the IVRT, and is normally 50–100 ms.
E:A ratio �Peak E wave velocity
Peak A wave velocity
Fig. 11.11 Pulsed-wave (PW) Doppler of mitral valve (MV) inflow(PG � pressure gradient; Vel � velocity)
View Apical 4-chamber
Modality PW Doppler
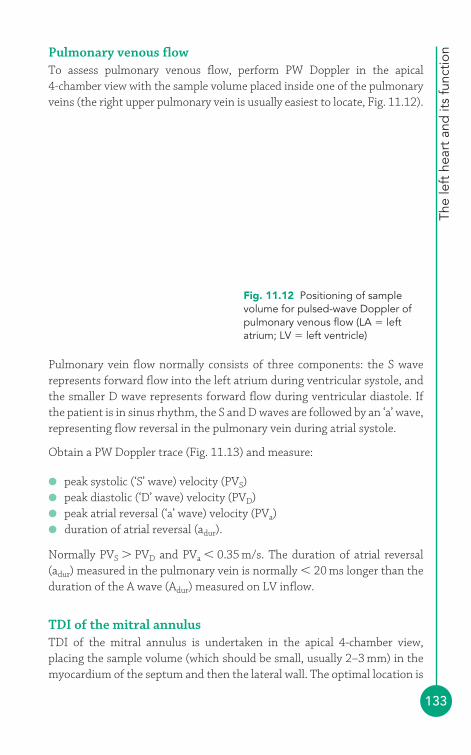
The
left
hea
rt a
nd it
s fu
nctio
n
133
Pulmonary venous flowTo assess pulmonary venous flow, perform PW Doppler in the apical 4-chamber view with the sample volume placed inside one of the pulmonaryveins (the right upper pulmonary vein is usually easiest to locate, Fig. 11.12).
Pulmonary vein flow normally consists of three components: the S waverepresents forward flow into the left atrium during ventricular systole, andthe smaller D wave represents forward flow during ventricular diastole. Ifthe patient is in sinus rhythm, the S and D waves are followed by an ‘a’ wave,representing flow reversal in the pulmonary vein during atrial systole.
Obtain a PW Doppler trace (Fig. 11.13) and measure:
● peak systolic (‘S’ wave) velocity (PVS)● peak diastolic (‘D’ wave) velocity (PVD)● peak atrial reversal (‘a’ wave) velocity (PVa)● duration of atrial reversal (adur).
Normally PVS � PVD and PVa � 0.35 m/s. The duration of atrial reversal(adur) measured in the pulmonary vein is normally � 20 ms longer than theduration of the A wave (Adur) measured on LV inflow.
TDI of the mitral annulusTDI of the mitral annulus is undertaken in the apical 4-chamber view,placing the sample volume (which should be small, usually 2–3 mm) in themyocardium of the septum and then the lateral wall. The optimal location is
Right upperpulmonary vein
LA
LV
PW sample volumeFig. 11.12 Positioning of samplevolume for pulsed-wave Doppler ofpulmonary venous flow (LA � leftatrium; LV � left ventricle)
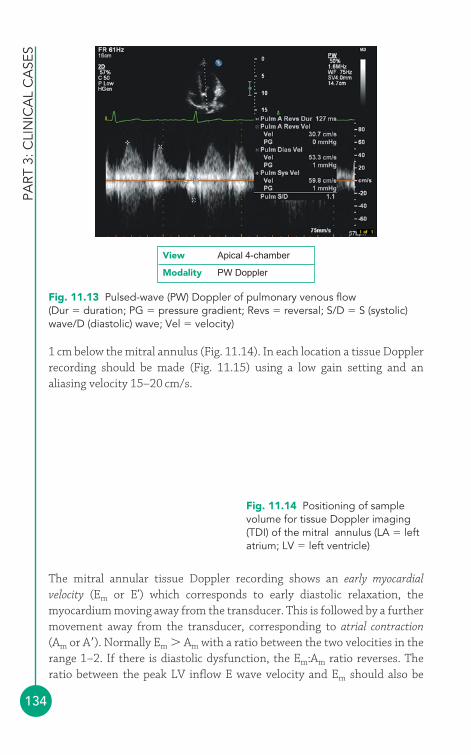
PART
3: C
LIN
ICA
L C
ASE
S
134
1 cm below the mitral annulus (Fig. 11.14). In each location a tissue Dopplerrecording should be made (Fig. 11.15) using a low gain setting and analiasing velocity 15–20 cm/s.
LA
LV
SeptumLateral wall
Fig. 11.14 Positioning of samplevolume for tissue Doppler imaging(TDI) of the mitral annulus (LA � leftatrium; LV � left ventricle)
Fig. 11.13 Pulsed-wave (PW) Doppler of pulmonary venous flow(Dur � duration; PG � pressure gradient; Revs � reversal; S/D � S (systolic)wave/D (diastolic) wave; Vel � velocity)
View Apical 4-chamber
Modality PW Doppler
The mitral annular tissue Doppler recording shows an early myocardialvelocity (Em or E’) which corresponds to early diastolic relaxation, themyocardium moving away from the transducer. This is followed by a furthermovement away from the transducer, corresponding to atrial contraction(Am or A�). Normally Em � Am with a ratio between the two velocities in therange 1–2. If there is diastolic dysfunction, the Em:Am ratio reverses. Theratio between the peak LV inflow E wave velocity and Em should also be
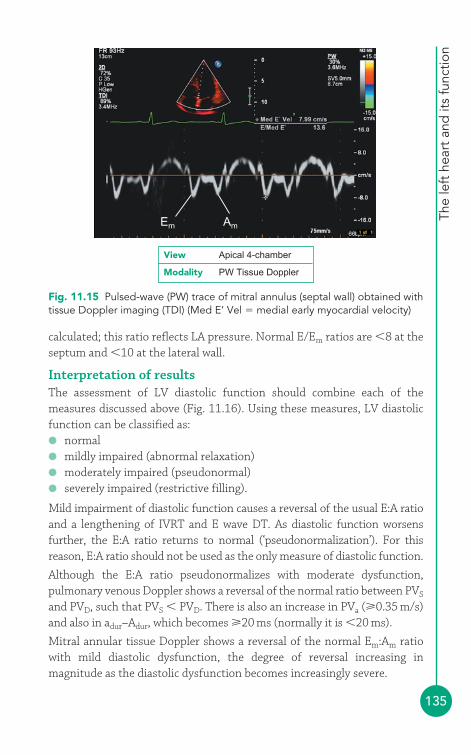
The
left
hea
rt a
nd it
s fu
nctio
n
135
calculated; this ratio reflects LA pressure. Normal E/Em ratios are �8 at theseptum and �10 at the lateral wall.
Interpretation of resultsThe assessment of LV diastolic function should combine each of themeasures discussed above (Fig. 11.16). Using these measures, LV diastolicfunction can be classified as:● normal● mildly impaired (abnormal relaxation)● moderately impaired (pseudonormal)● severely impaired (restrictive filling).
Mild impairment of diastolic function causes a reversal of the usual E:A ratioand a lengthening of IVRT and E wave DT. As diastolic function worsensfurther, the E:A ratio returns to normal (‘pseudonormalization’). For thisreason, E:A ratio should not be used as the only measure of diastolic function.
Although the E:A ratio pseudonormalizes with moderate dysfunction,pulmonary venous Doppler shows a reversal of the normal ratio between PVS
and PVD, such that PVS � PVD. There is also an increase in PVa (0.35 m/s)and also in adur–Adur, which becomes 20 ms (normally it is �20 ms).
Mitral annular tissue Doppler shows a reversal of the normal Em:Am ratiowith mild diastolic dysfunction, the degree of reversal increasing inmagnitude as the diastolic dysfunction becomes increasingly severe.
Em Am
Fig. 11.15 Pulsed-wave (PW) trace of mitral annulus (septal wall) obtained withtissue Doppler imaging (TDI) (Med E’ Vel � medial early myocardial velocity)
View Apical 4-chamber
Modality PW Tissue Doppler
SAMPLE REPORT
PART
3: C
LIN
ICA
L C
ASE
S
136
The LA is moderately dilated (volume 70 mL). There is moderateconcentric LV hypertrophy. LV systolic function is normal (LVEF 64per cent, LVEDV index 82 mL/m2). There is significant reversal ofthe LV inflow E:A ratio (2.2) with shortening of IVRT (42 ms) and DT(138 ms). Pulmonary vein Doppler shows marked reversal of thePVS:PVD ratio, with a PVa of 0.41 m/s and adur–Adur of 25 ms. Mitralannular tissue Doppler shows marked reversal of the Em:Am ratioand a septal E:Em ratio of 18. These findings indicate severelyimpaired LV diastolic function.
Normal Mild Moderate SevereRelaxation Relaxation
ComplianceLVEDP
RelaxationCompliance
LVEDP
Abnormal relaxation Pseudo-normal Restrictive filling
LV inflow Doppler
E/A ratioIVRT (ms)DT (ms)
Pulmonary venous Doppler
PVS/PVDPVa (m/s)adur�Adur (ms)
PVS � PVD�0.35�20
PVS � PVD�0.35�20
PVS � PVD�0.35�20
PVS �� PVD�0.35�20
Mitral annular tissue Doppler
Em/Am
E/Em (septum)E/Em (lateral)
1�250�100150�200
1�2
�8�10
�1
––
�1
�15�10
��1
––
1�250�100
150�200
�1�100�200
�2�50
�150
A
E
D
Sa
Em
Am
Fig. 11.16 Classification of left ventricular (LV) diastolic dysfunction (A � peakA-wave velocity; Am � atrial contraction; adur � duration of atrial reversal;DT � deceleration time; E � peak E-wave velocity; Em � early myocardialvelocity on tissue Doppler imaging of mitral annulus (also known as E’);IVRT � isovolumic relaxation time; LVEDP � left ventricular end-diastolicpressure; PVa � peak atrial reversal (‘a’ wave) velocity; PVD � peak diastolic(‘D’ wave) velocity; PVS � peak systolic (‘S’ wave) velocity (Adapted withpermission of the British Society of Echocardiography and British HeartFoundation)
The
left
hea
rt a
nd it
s fu
nctio
n
137
Management of impaired LV diastolic functionPatients with LV diastolic dysfunction are treated with diuretics to relievefluid congestion and any contributing factors (e.g. hypertension, myocardialischaemia) should be treated as appropriate. The value of ACE inhibitors orangiotensin receptor blockers remains unclear.
● Echo assessment of the left atriumThe left atrium (LA) can be seen in several views:
● left parasternal window� parasternal long axis view� parasternal short axis view (aortic valve level)
● apical window� apical 4-chamber view� apical 2-chamber view� apical 3-chamber (long axis) view
● subcostal window� subcostal long axis view.
An echo evaluation of the LA should include assessment of:
● LA morphology and dimensions● presence of any LA masses (e.g. tumour, thrombus)● presence of spontaneous echo contrast.
LA masses and spontaneous echo contrast are discussed in Chapter 21.
● Left atrial dimensionsLA dilatation (Fig. 11.17) can result from:
● mitral valve disease● dilated cardiomyopathy● restrictive cardiomyopathy● LV diastolic dysfunction● atrial fibrillation.
LA diameter is measured at end-systole in the parasternal long axis view,using either 2-D or M-mode imaging (Fig. 11.18).
LA volume is measured using the modified Simpson’s rule method:
1. In the apical 4-chamber view obtain the best view you can of the LA,paying particular attention to avoidance of foreshortening.
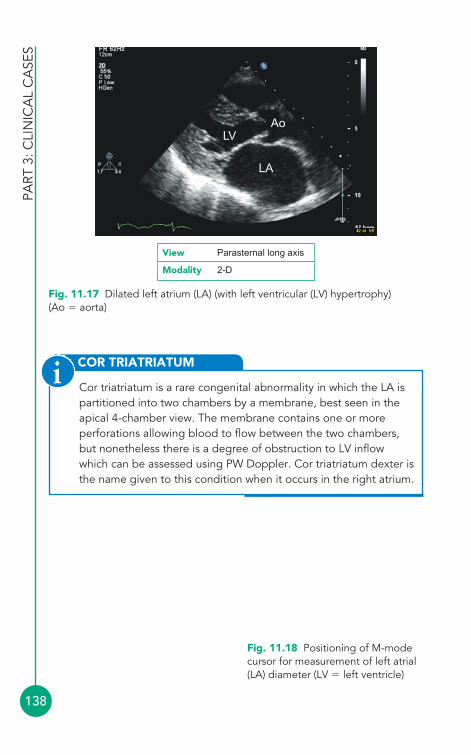
PART
3: C
LIN
ICA
L C
ASE
S
138
COR TRIATRIATUM
Cor triatriatum is a rare congenital abnormality in which the LA ispartitioned into two chambers by a membrane, best seen in theapical 4-chamber view. The membrane contains one or moreperforations allowing blood to flow between the two chambers,but nonetheless there is a degree of obstruction to LV inflowwhich can be assessed using PW Doppler. Cor triatriatum dexter isthe name given to this condition when it occurs in the right atrium.
i
M-mode cursor
LVLA
Fig. 11.18 Positioning of M-modecursor for measurement of left atrial(LA) diameter (LV � left ventricle)
LA
LVAo
Fig. 11.17 Dilated left atrium (LA) (with left ventricular (LV) hypertrophy)(Ao � aorta)
View Parasternal long axis
Modality 2-D
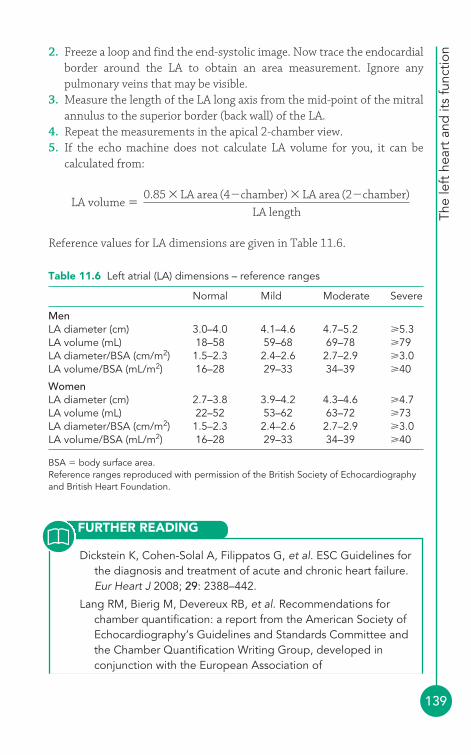
Dickstein K, Cohen-Solal A, Filippatos G, et al. ESC Guidelines forthe diagnosis and treatment of acute and chronic heart failure.Eur Heart J 2008; 29: 2388–442.
Lang RM, Bierig M, Devereux RB, et al. Recommendations forchamber quantification: a report from the American Society ofEchocardiography’s Guidelines and Standards Committee andthe Chamber Quantification Writing Group, developed inconjunction with the European Association of
The
left
hea
rt a
nd it
s fu
nctio
n
139
Table 11.6 Left atrial (LA) dimensions – reference ranges
Normal Mild Moderate Severe
MenLA diameter (cm) 3.0–4.0 4.1–4.6 4.7–5.2 5.3LA volume (mL) 18–58 59–68 69–78 79LA diameter/BSA (cm/m2) 1.5–2.3 2.4–2.6 2.7–2.9 3.0LA volume/BSA (mL/m2) 16–28 29–33 34–39 40
WomenLA diameter (cm) 2.7–3.8 3.9–4.2 4.3–4.6 4.7LA volume (mL) 22–52 53–62 63–72 73LA diameter/BSA (cm/m2) 1.5–2.3 2.4–2.6 2.7–2.9 3.0LA volume/BSA (mL/m2) 16–28 29–33 34–39 40
BSA � body surface area.Reference ranges reproduced with permission of the British Society of Echocardiographyand British Heart Foundation.
2. Freeze a loop and find the end-systolic image. Now trace the endocardialborder around the LA to obtain an area measurement. Ignore anypulmonary veins that may be visible.
3. Measure the length of the LA long axis from the mid-point of the mitralannulus to the superior border (back wall) of the LA.
4. Repeat the measurements in the apical 2-chamber view.5. If the echo machine does not calculate LA volume for you, it can be
calculated from:
Reference values for LA dimensions are given in Table 11.6.
LA volume �0.85 � LA area (4�chamber) � LA area (2�chamber)
LA length
FURTHER READING
PART
3: C
LIN
ICA
L C
ASE
S
140
Echocardiography, a branch of the European Society ofCardiology. J Am Soc Echocardiogr 2005; 18: 1440–63.
Paulus WJ, Tschöpe C, Sanderson JE, et al. How to diagnosediastolic heart failure: a consensus statement on the diagnosisof heart failure with normal left ventricular ejection fraction bythe Heart Failure and Echocardiography Associations of theEuropean Society of Cardiology. Eur Heart J 2007; 28:2539–50.
Senior R, Ashrafian H. Screening for isolated diastolic dysfunction –a bridge too far? Eur J Echocardiogr 2005; 6: 79–82.
Senior R, Bhatia VK. British Society of Echocardiography DistanceLearning Module 13: Evaluation of Systolic Function of the LeftVentricle. Accessible from the BSE website (www.bsecho.org).
141
Chapter 11 looked at the global assessment of left ventricular (LV)dimensions and function. However, abnormalities of LV function can affectone or more specific areas of the LV wall and then the LV is said to show aregional wall motion abnormality (RWMA). RWMA is the result of coronaryartery disease affecting the function of the myocardium, either because theblood supply to a particular area of myocardium has become reduced(ischaemia) or blocked altogether, causing death (necrosis) of the myocytes.The identification of RWMA by echo can therefore reveal a great deal aboutthe status of the coronary circulation.
● The coronary arteriesNormal coronary artery anatomyAs discussed in Chapter 2, the coronary circulation normally arises as twoseparate vessels from the sinuses of Valsalva – the left coronary artery (LCA)from the left sinus, and the right coronary artery (RCA) from the right sinus(Fig. 2.5, p. 12). The initial portion of the LCA is the left main stem whichsoon divides into the left anterior descending (LAD) and circumflex (Cx)arteries. The LAD runs down the anterior interventricular groove and the Cxruns in the left atrioventricular groove. The RCA runs in the rightatrioventricular groove, and in most people gives rise to the posteriordescending artery which runs down the posterior interventricular groove.
Coronary arterydisease andregional leftventricular function
12
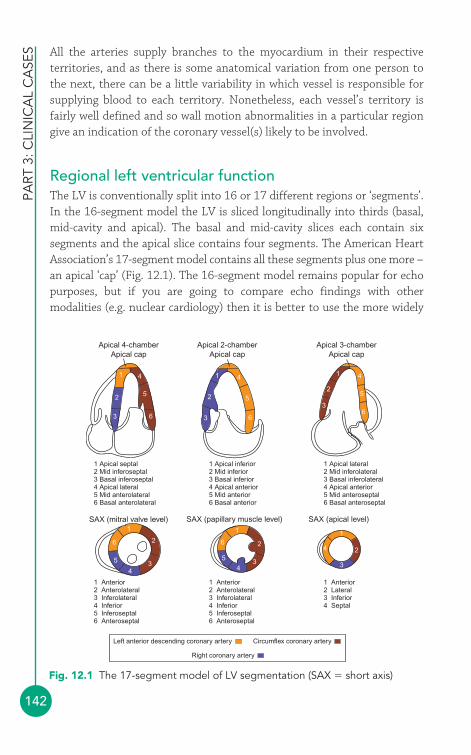
PART
3: C
LIN
ICA
L C
ASE
S
142
All the arteries supply branches to the myocardium in their respectiveterritories, and as there is some anatomical variation from one person tothe next, there can be a little variability in which vessel is responsible forsupplying blood to each territory. Nonetheless, each vessel’s territory isfairly well defined and so wall motion abnormalities in a particular regiongive an indication of the coronary vessel(s) likely to be involved.
Regional left ventricular functionThe LV is conventionally split into 16 or 17 different regions or ‘segments’.In the 16-segment model the LV is sliced longitudinally into thirds (basal,mid-cavity and apical). The basal and mid-cavity slices each contain sixsegments and the apical slice contains four segments. The American HeartAssociation’s 17-segment model contains all these segments plus one more –an apical ‘cap’ (Fig. 12.1). The 16-segment model remains popular for echopurposes, but if you are going to compare echo findings with othermodalities (e.g. nuclear cardiology) then it is better to use the more widely
Apical 4-chamberApical cap
41
1 Apical septal2 Mid inferoseptal3 Basal inferoseptal4 Apical lateral5 Mid anterolateral6 Basal anterolateral
1 Apical inferior2 Mid inferior3 Basal inferior4 Apical anterior5 Mid anterior6 Basal anterior
1 Apical lateral2 Mid inferolateral3 Basal inferolateral4 Apical anterior5 Mid anteroseptal6 Basal anteroseptal
1 Anterior2 Anterolateral3 Inferolateral4 Inferior5 Inferoseptal6 Anteroseptal
1 Anterior2 Anterolateral3 Inferolateral4 Inferior5 Inferoseptal6 Anteroseptal
1 Anterior2 Lateral3 Inferior4 Septal
5
6
2
3
SAX (mitral valve level)
Apical 2-chamberApical cap
SAX (papillary muscle level)
Apical 3-chamberApical cap
SAX (apical level)
Left anterior descending coronary artery Circumflex coronary artery
Right coronary artery
1 1
2
3
4 4
55
66
2
3
1 1 12 2
2
3 3 34 4
4
5 5
6 6
Fig. 12.1 The 17-segment model of LV segmentation (SAX � short axis)
Cor
onar
y ar
tery
dis
ease
and
LV
func
tion
143
applicable 17-segment model. Whichever model you choose, ensure thatyour nomenclature is consistent.
In the 17-segment model, the six segments in each of the basal and mid-cavity slices are termed anterior, anteroseptal, inferoseptal, inferior,inferolateral (sometimes also called posterior) and anterolateral. Theboundaries of the septum are defined by the attachment of the rightventricle (RV), and each of the six circumferential segments occupies 60° inthe short axis view. As the LV narrows towards the apex, there are just fourapical segments, termed anterior, septal, inferior and lateral. The apical capis at the very tip of the ventricle, where there is no LV cavity.
Each segment is assigned to one of the coronary arteries (LAD, Cx or RCA),as indicated by the colour-coding in Fig. 12.1, although there can be someoverlap depending on each individual’s coronary anatomy. Normal wallmotion during systole is indicated by an endocardial excursion �5 mm andby wall thickening �50 per cent. Each segment should be inspected in turn,where possible in two separate views, and scored according to its motion:
● X � unable to interpret (suboptimal image quality)● 1 � normokinetic● 2 � hypokinetic● 3 � akinetic● 4 � dyskinetic● 5 � aneurysmal.
● Myocardial ischaemia and infarctionMyocardial ischaemia results from the development of an atheroscleroticplaque in one or more coronary arteries, limiting the flow of blood to themyocardium downstream. This normally does not cause symptoms untilthe lumen is obstructed by 70 per cent, at which point the patientdevelops exertional chest discomfort and/or breathlessness. The chestdiscomfort is typically central in location and heavy or tight in character,and may radiate into the neck and jaw and down one or both arms. Thesymptoms are rapidly relieved with rest and/or nitrates.
An acute coronary syndrome occurs when an atherosclerotic plaqueruptures, exposing the lipid-rich core to the bloodstream. This leads to therapid formation of a thrombus which acutely obstructs flow down thecoronary artery. If this leads to necrosis of a portion of myocardium, cardiacmarkers (e.g. troponins, creatine kinase) will be released into the circulation,
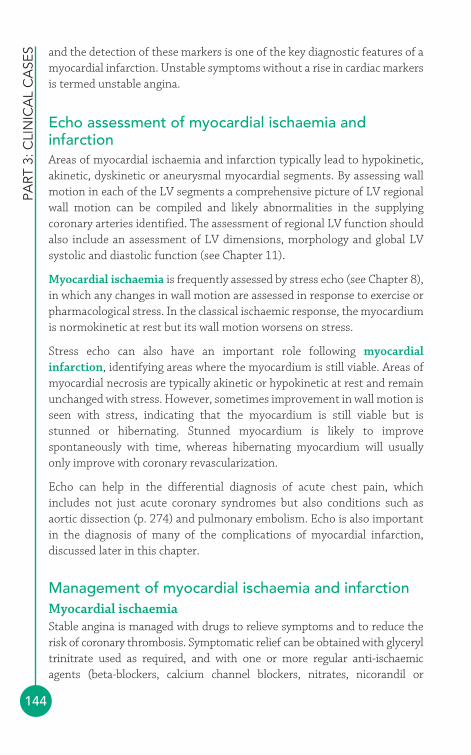
PART
3: C
LIN
ICA
L C
ASE
S
144
and the detection of these markers is one of the key diagnostic features of amyocardial infarction. Unstable symptoms without a rise in cardiac markersis termed unstable angina.
Echo assessment of myocardial ischaemia andinfarctionAreas of myocardial ischaemia and infarction typically lead to hypokinetic,akinetic, dyskinetic or aneurysmal myocardial segments. By assessing wallmotion in each of the LV segments a comprehensive picture of LV regionalwall motion can be compiled and likely abnormalities in the supplyingcoronary arteries identified. The assessment of regional LV function shouldalso include an assessment of LV dimensions, morphology and global LVsystolic and diastolic function (see Chapter 11).
Myocardial ischaemia is frequently assessed by stress echo (see Chapter 8),in which any changes in wall motion are assessed in response to exercise orpharmacological stress. In the classical ischaemic response, the myocardiumis normokinetic at rest but its wall motion worsens on stress.
Stress echo can also have an important role following myocardialinfarction, identifying areas where the myocardium is still viable. Areas ofmyocardial necrosis are typically akinetic or hypokinetic at rest and remainunchanged with stress. However, sometimes improvement in wall motion isseen with stress, indicating that the myocardium is still viable but isstunned or hibernating. Stunned myocardium is likely to improvespontaneously with time, whereas hibernating myocardium will usuallyonly improve with coronary revascularization.
Echo can help in the differential diagnosis of acute chest pain, whichincludes not just acute coronary syndromes but also conditions such asaortic dissection (p. 274) and pulmonary embolism. Echo is also importantin the diagnosis of many of the complications of myocardial infarction,discussed later in this chapter.
Management of myocardial ischaemia and infarctionMyocardial ischaemiaStable angina is managed with drugs to relieve symptoms and to reduce therisk of coronary thrombosis. Symptomatic relief can be obtained with glyceryltrinitrate used as required, and with one or more regular anti-ischaemicagents (beta-blockers, calcium channel blockers, nitrates, nicorandil or

Cor
onar
y ar
tery
dis
ease
and
LV
func
tion
145
ivabradine). Cardioprotective drugs include aspirin, statins and angiotensin-converting enzyme (ACE) inhibitors.
Unstable angina is also managed with cardioprotective and anti-ischaemicdrugs, but with the addition of antithrombotic agents such as heparin andglycoprotein IIb/IIIa antagonists.
Coronary revascularization has an important role in patients withtroublesome symptoms or a high risk of coronary events. Revascularizationcan be achieved with percutaneous coronary intervention (PCI) or coronaryartery bypass grafting (CABG).
Myocardial infarctionMyocardial infarctions are subgrouped and managed according to theaccompanying ECG changes: the presence of ST segment elevation definesan ST elevation myocardial infarction (STEMI) in which urgent restorationof coronary blood flow, with primary PCI or thrombolysis, is required. OtherECG changes (ST segment depression, T wave inversion) are seen in a non-STEMI (NSTEMI), in which the mainstay of therapy is aggressive treatmentwith antiplatelet and antithrombotic drugs and reduction in myocardialoxygen demand, followed by coronary angiography and coronaryrevascularization (as guided by symptoms and risk stratification).
As for stable angina, patients who have had a myocardial infarction shouldreceive appropriate cardioprotective drugs including aspirin, beta-blockers,statins and ACE inhibitors.
● Complications of myocardial infarctionLeft ventricular aneurysmAneurysmal dilatation of the LV can occur in areas where the infarctedmyocardium has become weakened and thinned. Patients may have clinicalfeatures of impaired LV function and persistent ST segment elevation onthe ECG.
Echo assessmentIdentify the region of the LV affected with reference to the usual segmentalnomenclature. Look for the characteristic dyskinetic wall motion within the aneurysmal segment. In contrast with pseudoaneurysms (see below),‘true’ aneurysms have a wide ‘neck’, which is at least half the diameter of the aneurysm itself (Fig. 12.2), and are lined by myocardium rather than pericardium.
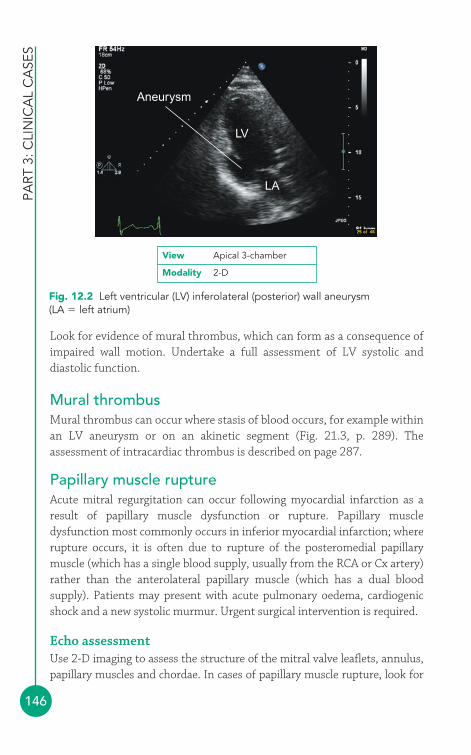
PART
3: C
LIN
ICA
L C
ASE
S
146
Aneurysm
LV
LA
Fig. 12.2 Left ventricular (LV) inferolateral (posterior) wall aneurysm (LA � left atrium)
View Apical 3-chamber
Modality 2-D
Look for evidence of mural thrombus, which can form as a consequence ofimpaired wall motion. Undertake a full assessment of LV systolic anddiastolic function.
Mural thrombusMural thrombus can occur where stasis of blood occurs, for example withinan LV aneurysm or on an akinetic segment (Fig. 21.3, p. 289). Theassessment of intracardiac thrombus is described on page 287.
Papillary muscle ruptureAcute mitral regurgitation can occur following myocardial infarction as aresult of papillary muscle dysfunction or rupture. Papillary muscledysfunction most commonly occurs in inferior myocardial infarction; whererupture occurs, it is often due to rupture of the posteromedial papillarymuscle (which has a single blood supply, usually from the RCA or Cx artery)rather than the anterolateral papillary muscle (which has a dual bloodsupply). Patients may present with acute pulmonary oedema, cardiogenicshock and a new systolic murmur. Urgent surgical intervention is required.
Echo assessmentUse 2-D imaging to assess the structure of the mitral valve leaflets, annulus,papillary muscles and chordae. In cases of papillary muscle rupture, look for

Cor
onar
y ar
tery
dis
ease
and
LV
func
tion
147
evidence of a flail mitral leaflet with an attached piece of papillary muscle, andits chordal attachments, prolapsing into the left atrium (LA) during systole.
Use Doppler assessment to examine the nature and extent of mitralregurgitation, as outlined in Chapter 14. Assess LV dimensions andfunction, and LA dimensions (in acute severe mitral regurgitation the LAwill not have had time to dilate).
Be alert to alternative diagnoses – haemodynamic decompensation with anew systolic murmur can also occur in post-infarction ventricular septaldefect (VSD; described below).
Post-infarction ventricular septal defectRupture of the interventricular septum, due to a focal area of myocardialnecrosis, causes an acquired VSD. There is usually a sudden deterioration inthe patient’s condition and a new harsh systolic murmur. It is associatedwith a high mortality and requires urgent surgical intervention.
Echo assessmentAssess the interventricular septum using 2-D and colour Doppler to identifythe location and size of the VSD – some post-infarction VSDs are small andcan be challenging to find. Do not forget that post-infarction VSDs can bemultiple, so check to see if there is more than one jet on colour Doppler.Doppler imaging will show a left-to-right shunt, with a high-velocity jet.Assess LV and RV dimensions and function.
Ventricular rupture and cardiac tamponadeRupture of the ventricular free wall is usually a devastating complication,causing rapid haemorrhage into the pericardium and fatal cardiactamponade in around 75 per cent of cases. However, sometimes theventricular rupture can be contained by adhesions or thrombosis, causing a more stable (but nonetheless still extremely dangerous) situation whichcan, if time permits, be repaired surgically.
A chronic ventricular rupture is known as a pseudoaneurysm. The distinctionbetween a ‘true’ aneurysm and a pseudoaneurysm is that the wall of a trueaneurysm is composed of myocardium, but with a pseudoaneurysm the myoca-rdium has been breached and the pseudoaneurysm is lined by pericardium.
Echo assessmentLook for evidence of a pericardial effusion with associated thrombus in thepericardial space, and for evidence of flow between the ventricle and the

FURTHER READING
pericardium on colour Doppler. Assess the location and dimensions of therupture and the pericardial effusion, and look for features of cardiactamponade. A pericardial effusion alone is common after myocardialinfarction and does not, in itself, necessarily indicate a ventricular rupture.
A pseudoaneurysm is well demarcated from the surrounding myocardiumand has a narrow ‘neck’, which is less than half the diameter of theaneurysm itself. Thrombus may be present within the aneurysm.
DRESSLER’S SYNDROME
A pericardial effusion may be seen following a myocardialinfarction and should be assessed as outlined in Chapter 19.Pericardial effusion occurring 2–10 weeks after the myocardialinfarction is likely to be due to Dressler’s syndrome, a form ofpericarditis also known as postmyocardial infarction syndrome.Patients may present with pleuritic chest pain, fever and apericardial friction rub. Dressler’s syndrome is thought to be anautoimmune response, caused by the release of myocardialantigens, and is also seen in some patients after cardiac surgery(post-pericardiotomy syndrome).
i
Bassand JP, Hamm CW, Ardissino D, et al. Guidelines for thediagnosis and treatment of non-ST-segment elevation acutecoronary syndromes. Eur Heart J 2007; 28: 1598–660.
Cerqueira MD, Weissman NJ, Dilsizian V, et al. Standardizedmyocardial segmentation and nomenclature for tomographicimaging of the heart. Circulation 2002; 105: 539–42.
Lang RM, Bierig M, Devereux RB, et al. Recommendations forchamber quantification: a report from the American Society ofEchocardiography’s Guidelines and Standards Committee andthe Chamber Quantification Writing Group, developed inconjunction with the European Association ofEchocardiography, a branch of the European Society ofCardiology. J Am Soc Echocardiogr 2005; 18: 1440–63.
Van de Werf F, Bax J, Betriu A, et al. Management of acutemyocardial infarction in patients presenting with persistent ST-segment elevation. Eur Heart J 2008; 29: 2909–45.
PART
3: C
LIN
ICA
L C
ASE
S
148
149
● Echo views of the aortic valveThe aortic valve is usually assessed in the:
● left parasternal window� parasternal long axis view� parasternal short axis view (aortic valve level)
● apical window� apical 5-chamber view.
The parasternal long axis view (Fig. 6.2, p. 56) bisects the aortic valve,showing the right coronary cusp anterior to the non-coronary cusp. 2-Dimaging shows the structure of the aortic valve and allows an assessment ofcusp mobility. An M-mode study of the valve, at the level of the cusp tips,shows the cusps opening at the start of systole (Fig. 13.1). The aortic root asa whole moves anteriorly during systole, being pushed forwards by theexpanding left atrium (LA) as it fills during diastole. Conditions thatenhance LA filling, such as mitral regurgitation, exaggerate this anteriormotion of the aortic root. The aortic valve cusps close at the end of systoleto make a single thin closure line. This M-mode pattern of normal aorticvalve cusp motion is described as ‘box-shaped’. While in this view, usecolour Doppler to assess valvular flow.
The parasternal short axis view (aortic valve level) shows the valve ‘faceon’ and all three cusps can be seen together with the surrounding cardiacstructures (Fig. 6.5, p. 60). Colour Doppler shows the location and extent ofany valvular regurgitation.
The apical 5-chamber view allows further 2-D inspection of the valve (Fig. 6.9, p. 64) and a colour Doppler assessment of any regurgitant flow.
The aortic valve13

PART
3: C
LIN
ICA
L C
ASE
S
150
In this view a good alignment of continuous wave (CW) Doppler with thevalve can usually be obtained, allowing an assessment of forward (and anyregurgitant) flow. The normal aortic valve has a peak forward flow velocity�1.7 m/s and a valve area �2.0 cm2.
Additional information can also be obtained from the:
● right parasternal window● apical 3-chamber (long axis) view● subcostal window
� subcostal short axis view● suprasternal window
� aorta view.
The right parasternal window provides an additional view from which theaortic valve can be interrogated using CW Doppler (e.g. using a standalonepencil probe). The apical 3-chamber (long axis) view is similar in manyways to the parasternal long axis view, but offers the advantage of a suitableangle for CW Doppler assessment (Fig. 6.11, p. 66). The subcostal shortaxis view is seldom used but can visualize the aortic valve in short axiswhen good views cannot be obtained from the standard locations. Thesuprasternal window (aorta view) allows Doppler assessment of flow inthe descending thoracic aorta, which is useful in aortic regurgitation.
Closure line(diastole)
NCC
RCC
LA
Ao
View Parasternal long axis
Modality M-mode
Fig. 13.1 M-mode of normal aortic valve (Ao � aorta; LA � left atrium;NCC � non-coronary cusp; RCC � right coronary cusp)
The
aort
ic v
alve
151
● Aortic stenosisAortic stenosis is the obstruction of blood flow from the left ventricle (LV)due to a narrowing of the aortic valve, or an obstruction just below or abovethe level of the valve.
Causes of aortic stenosisCalcific degeneration of the aortic valve is one of the commonest causes ofaortic stenosis. This is characterized by progressive fibrosis and calcificationof the aortic valve, beginning at the base of the cusps. The early stage of thisprocess is often referred to as ‘aortic sclerosis’, but this term is somewhatmisleading – it implies a benign process, but in fact aortic sclerosis is oftena prelude to the development of significant stenosis later on.
Bicuspid aortic valve (p. 303) is also a common cause of aortic stenosis inthe West, and is thought to be responsible for around half of cases of severeaortic stenosis in adults. The stenotic process is similar to that seen in calcificdegeneration, but occurs at a younger age. Fibrosis typically starts in apatient’s teens, with gradual calcification in their thirties onwards. Patientswho require surgery for stenosis of a bicuspid aortic valve do so on average 5years earlier than those with calcific degeneration of a tricuspid aortic valve.
Rheumatic aortic stenosis is less common than rheumatic mitral stenosis,and the two often coexist in the same patient. There is fusion of thecommissures of the aortic valve cusps and the cusps themselves becomefibrotic and eventually calcified.
Sub- and supravalvular obstruction cause a form of aortic stenosis in whichthe valve itself is unaffected but the obstruction lies below or above the valve.Subvalvular aortic stenosis results from a fixed obstruction in the LV outflowtract (LVOT), usually a fibromuscular ridge or membrane, and may be associatedwith other congenital heart defects in up to half of cases. In supravalvular aorticstenosis there is a fixed obstruction in the ascending aorta, just above thesinuses of Valsalva, due to a diffuse narrowing or a discrete membrane.
Clinical features of aortic stenosisThe clinical features of aortic stenosis are summarized in Table 13.1. Manycases of aortic stenosis are detected incidentally, either because of a systolicmurmur heard during a routine examination or as an incidental findingduring an echocardiogram for other indications. The appearance of symptomshas significant implications for the patient’s outlook: those with angina as aresult of aortic stenosis have an average life expectancy of 5 years, those withexertional syncope 3 years, and those with heart failure just 1 year.
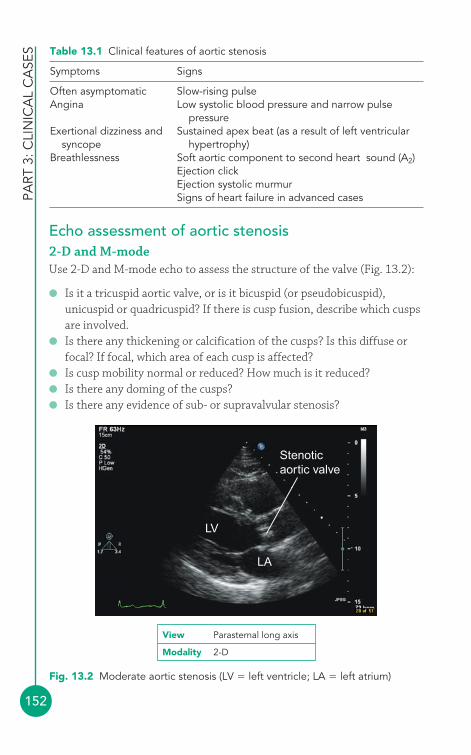
PART
3: C
LIN
ICA
L C
ASE
S
152
Echo assessment of aortic stenosis2-D and M-modeUse 2-D and M-mode echo to assess the structure of the valve (Fig. 13.2):
● Is it a tricuspid aortic valve, or is it bicuspid (or pseudobicuspid),unicuspid or quadricuspid? If there is cusp fusion, describe which cuspsare involved.
● Is there any thickening or calcification of the cusps? Is this diffuse orfocal? If focal, which area of each cusp is affected?
● Is cusp mobility normal or reduced? How much is it reduced?● Is there any doming of the cusps?● Is there any evidence of sub- or supravalvular stenosis?
Table 13.1 Clinical features of aortic stenosis
Symptoms Signs
Often asymptomatic Slow-rising pulseAngina Low systolic blood pressure and narrow pulse
pressureExertional dizziness and Sustained apex beat (as a result of left ventricular
syncope hypertrophy)Breathlessness Soft aortic component to second heart sound (A2)
Ejection clickEjection systolic murmurSigns of heart failure in advanced cases
LV
LA
Stenoticaortic valve
Fig. 13.2 Moderate aortic stenosis (LV � left ventricle; LA � left atrium)
View Parasternal long axis
Modality 2-D
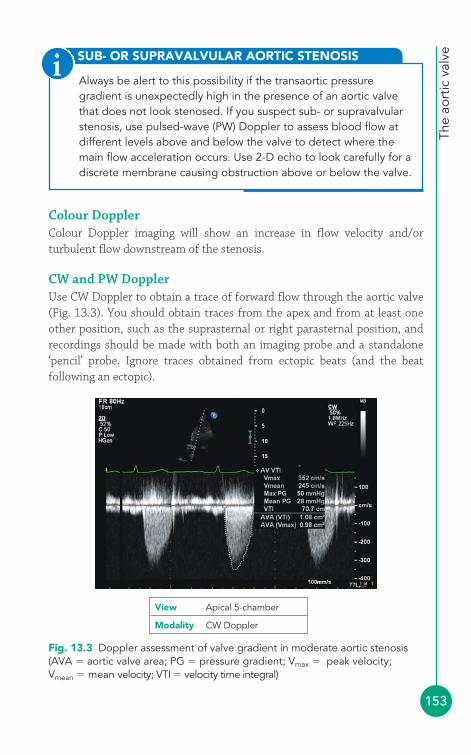
The
aort
ic v
alve
153
Colour DopplerColour Doppler imaging will show an increase in flow velocity and/orturbulent flow downstream of the stenosis.
CW and PW DopplerUse CW Doppler to obtain a trace of forward flow through the aortic valve(Fig. 13.3). You should obtain traces from the apex and from at least oneother position, such as the suprasternal or right parasternal position, andrecordings should be made with both an imaging probe and a standalone‘pencil’ probe. Ignore traces obtained from ectopic beats (and the beatfollowing an ectopic).
SUB- OR SUPRAVALVULAR AORTIC STENOSIS
Always be alert to this possibility if the transaortic pressuregradient is unexpectedly high in the presence of an aortic valvethat does not look stenosed. If you suspect sub- or supravalvularstenosis, use pulsed-wave (PW) Doppler to assess blood flow atdifferent levels above and below the valve to detect where themain flow acceleration occurs. Use 2-D echo to look carefully for adiscrete membrane causing obstruction above or below the valve.
i
Fig. 13.3 Doppler assessment of valve gradient in moderate aortic stenosis(AVA � aortic valve area; PG � pressure gradient; Vmax � peak velocity;Vmean � mean velocity; VTI � velocity time integral)
View Apical 5-chamber
Modality CW Doppler

PART
3: C
LIN
ICA
L C
ASE
S
154
The CW Doppler trace will give peak transaortic velocity (Vmax), whichrelates to peak transaortic pressure gradient (ΔPmax) via the simplifiedBernoulli equation:
ΔPmax � 4 � V2max
If peak velocity in the LVOT is �1.0 m/s, the full Bernoulli equation shouldbe used for greater accuracy:
ΔPmax � 4 � (V22 � V1
2)
where V2 is the peak transaortic velocity, assessed by CW Doppler, and V1 isthe peak LVOT velocity, assessed by PW Doppler.
PEAK-TO-PEAK AND INSTANTANEOUS GRADIENTS
Transaortic gradient can also be assessed during cardiaccatheterization, by measuring the fall in systolic pressure onwithdrawing a catheter across the aortic valve. The gradientmeasured in this way is a peak-to-peak gradient – it is thedifference between the peak pressure in the LV and the peakpressure in the aorta (which do not occur simultaneously – see Fig. 2.6, p. 13). In contrast, the gradient measured by echoDoppler is an instantaneous gradient – it measures the maximuminstantaneous pressure difference between the two chambers.Instantaneous gradients are greater than peak-to-peak gradients,and so peak transaortic gradients measured by echo will be higherthan gradients measured by cardiac catheterization.
i
The mean transaortic pressure gradient (ΔPmean) can be obtained by tracingthe Doppler envelope, from which the echo machine can calculate a meanvalue by averaging the instantaneous gradients throughout the trace.Alternatively, ΔPmean can be estimated from the ΔPmax using the equation:
Conditions that increase stroke volume (e.g. aortic regurgitation, pregnancy)increase transaortic flow during systole and can therefore lead to an
Pmean� Pmax � 2mmHg1.45
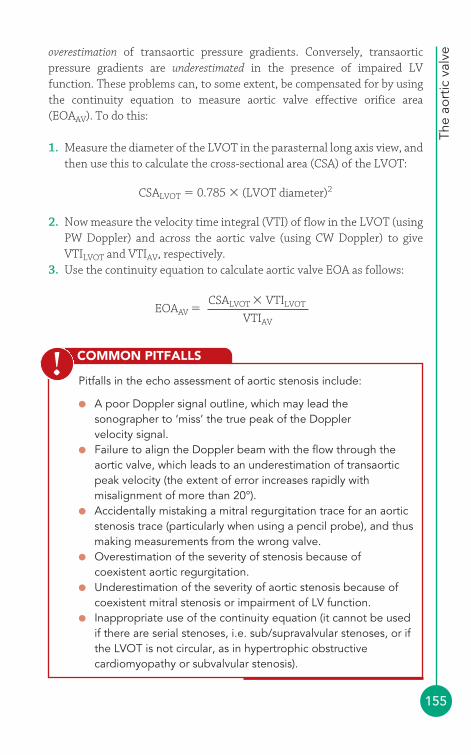
The
aort
ic v
alve
155
overestimation of transaortic pressure gradients. Conversely, transaorticpressure gradients are underestimated in the presence of impaired LVfunction. These problems can, to some extent, be compensated for by usingthe continuity equation to measure aortic valve effective orifice area(EOAAV). To do this:
1. Measure the diameter of the LVOT in the parasternal long axis view, andthen use this to calculate the cross-sectional area (CSA) of the LVOT:
CSALVOT � 0.785 � (LVOT diameter)2
2. Now measure the velocity time integral (VTI) of flow in the LVOT (usingPW Doppler) and across the aortic valve (using CW Doppler) to giveVTILVOT and VTIAV, respectively.
3. Use the continuity equation to calculate aortic valve EOA as follows:
EOAAV �CSALVOT � VTILVOT
VTIAV
COMMON PITFALLS
Pitfalls in the echo assessment of aortic stenosis include:
● A poor Doppler signal outline, which may lead thesonographer to ‘miss’ the true peak of the Doppler velocity signal.
● Failure to align the Doppler beam with the flow through theaortic valve, which leads to an underestimation of transaorticpeak velocity (the extent of error increases rapidly withmisalignment of more than 20°).
● Accidentally mistaking a mitral regurgitation trace for an aorticstenosis trace (particularly when using a pencil probe), and thusmaking measurements from the wrong valve.
● Overestimation of the severity of stenosis because ofcoexistent aortic regurgitation.
● Underestimation of the severity of aortic stenosis because ofcoexistent mitral stenosis or impairment of LV function.
● Inappropriate use of the continuity equation (it cannot be usedif there are serial stenoses, i.e. sub/supravalvular stenoses, or ifthe LVOT is not circular, as in hypertrophic obstructivecardiomyopathy or subvalvular stenosis).
!
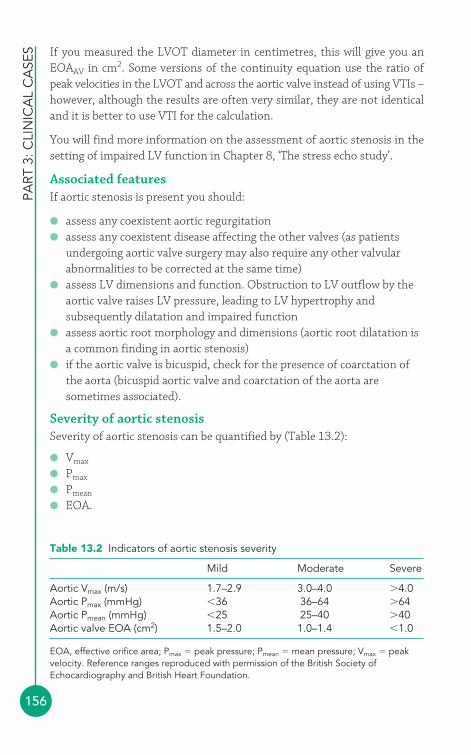
PART
3: C
LIN
ICA
L C
ASE
S
156
If you measured the LVOT diameter in centimetres, this will give you anEOAAV in cm2. Some versions of the continuity equation use the ratio ofpeak velocities in the LVOT and across the aortic valve instead of using VTIs –however, although the results are often very similar, they are not identicaland it is better to use VTI for the calculation.
You will find more information on the assessment of aortic stenosis in thesetting of impaired LV function in Chapter 8, ‘The stress echo study’.
Associated featuresIf aortic stenosis is present you should:
● assess any coexistent aortic regurgitation● assess any coexistent disease affecting the other valves (as patients
undergoing aortic valve surgery may also require any other valvularabnormalities to be corrected at the same time)
● assess LV dimensions and function. Obstruction to LV outflow by theaortic valve raises LV pressure, leading to LV hypertrophy andsubsequently dilatation and impaired function
● assess aortic root morphology and dimensions (aortic root dilatation isa common finding in aortic stenosis)
● if the aortic valve is bicuspid, check for the presence of coarctation ofthe aorta (bicuspid aortic valve and coarctation of the aorta aresometimes associated).
Severity of aortic stenosisSeverity of aortic stenosis can be quantified by (Table 13.2):
● Vmax
● Pmax
● Pmean
● EOA.
Table 13.2 Indicators of aortic stenosis severity
Mild Moderate Severe
Aortic Vmax (m/s) 1.7–2.9 3.0–4.0 �4.0Aortic Pmax (mmHg) �36 36–64 �64Aortic Pmean (mmHg) �25 25–40 �40Aortic valve EOA (cm2) 1.5–2.0 1.0–1.4 �1.0
EOA, effective orifice area; Pmax � peak pressure; Pmean � mean pressure; Vmax � peakvelocity. Reference ranges reproduced with permission of the British Society ofEchocardiography and British Heart Foundation.
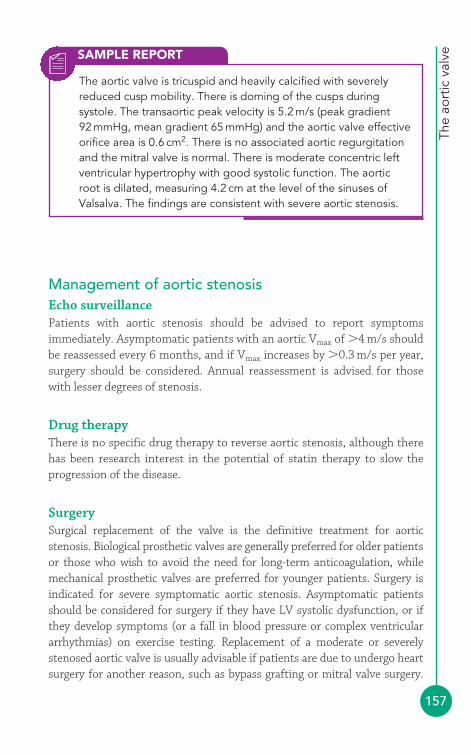
The
aort
ic v
alve
157
Management of aortic stenosisEcho surveillancePatients with aortic stenosis should be advised to report symptomsimmediately. Asymptomatic patients with an aortic Vmax of �4 m/s shouldbe reassessed every 6 months, and if Vmax increases by �0.3 m/s per year,surgery should be considered. Annual reassessment is advised for thosewith lesser degrees of stenosis.
Drug therapyThere is no specific drug therapy to reverse aortic stenosis, although therehas been research interest in the potential of statin therapy to slow theprogression of the disease.
SurgerySurgical replacement of the valve is the definitive treatment for aorticstenosis. Biological prosthetic valves are generally preferred for older patientsor those who wish to avoid the need for long-term anticoagulation, whilemechanical prosthetic valves are preferred for younger patients. Surgery isindicated for severe symptomatic aortic stenosis. Asymptomatic patientsshould be considered for surgery if they have LV systolic dysfunction, or ifthey develop symptoms (or a fall in blood pressure or complex ventriculararrhythmias) on exercise testing. Replacement of a moderate or severelystenosed aortic valve is usually advisable if patients are due to undergo heartsurgery for another reason, such as bypass grafting or mitral valve surgery.
SAMPLE REPORT
The aortic valve is tricuspid and heavily calcified with severelyreduced cusp mobility. There is doming of the cusps duringsystole. The transaortic peak velocity is 5.2 m/s (peak gradient92 mmHg, mean gradient 65 mmHg) and the aortic valve effectiveorifice area is 0.6 cm2. There is no associated aortic regurgitationand the mitral valve is normal. There is moderate concentric leftventricular hypertrophy with good systolic function. The aorticroot is dilated, measuring 4.2 cm at the level of the sinuses ofValsalva. The findings are consistent with severe aortic stenosis.
PART
3: C
LIN
ICA
L C
ASE
S
158
Balloon valvuloplasty can be used as a bridge to valve replacement in unstablepatients, or for patients who need urgent non-cardiac surgery. Transcatheteraortic valve implantation (TAVI, page 232) is a new technique for aortic valvereplacement in patients who cannot undergo conventional valve surgery.
● Aortic regurgitationAortic regurgitation is the flow of blood from the aorta back through theaortic valve during diastole. It can result from a problem with the aorticvalve itself or from a problem with the aortic root affecting an otherwisenormal valve.
Causes of aortic regurgitationValvular causes include:
● bicuspid aortic valve, causing incomplete closure of the valve● calcific degeneration of the aortic valve● rheumatic aortic valve disease● infective endocarditis● connective tissue diseases (e.g. rheumatoid arthritis, systemic lupus
erythematosus).
Aortic root causes result from dilatation and/or distortion of the aorticroot. These include:
● hypertension● Marfan syndrome● Ehlers–Danlos syndrome● osteogenesis imperfecta● aortic dissection● sinus of Valsalva aneurysm● cystic medial necrosis● syphilitic aortitis● Behçet disease.
Some conditions, such as ankylosing spondylitis, can affect both the aorticvalve and the aortic root.
Clinical features of aortic regurgitationThe clinical features of aortic regurgitation are summarized in Table 13.3.Chronic aortic regurgitation places a volume overload on the LV, which, with
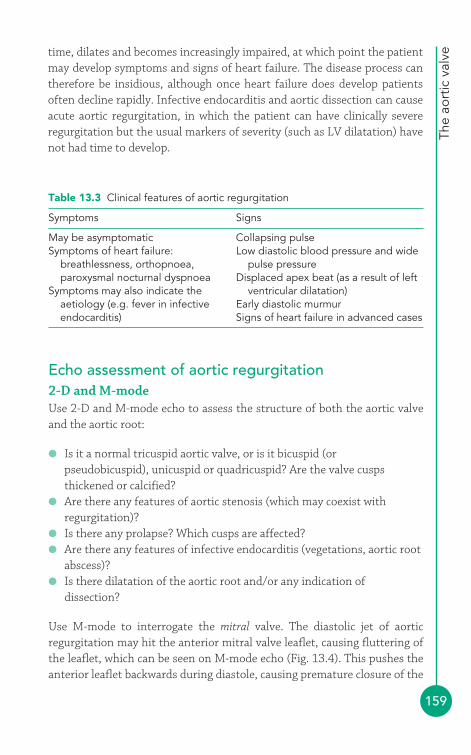
The
aort
ic v
alve
159
time, dilates and becomes increasingly impaired, at which point the patientmay develop symptoms and signs of heart failure. The disease process cantherefore be insidious, although once heart failure does develop patientsoften decline rapidly. Infective endocarditis and aortic dissection can causeacute aortic regurgitation, in which the patient can have clinically severeregurgitation but the usual markers of severity (such as LV dilatation) havenot had time to develop.
Table 13.3 Clinical features of aortic regurgitation
Symptoms Signs
May be asymptomatic Collapsing pulseSymptoms of heart failure: Low diastolic blood pressure and wide
breathlessness, orthopnoea, pulse pressureparoxysmal nocturnal dyspnoea Displaced apex beat (as a result of left
Symptoms may also indicate the ventricular dilatation)aetiology (e.g. fever in infective Early diastolic murmurendocarditis) Signs of heart failure in advanced cases
Echo assessment of aortic regurgitation2-D and M-modeUse 2-D and M-mode echo to assess the structure of both the aortic valveand the aortic root:
● Is it a normal tricuspid aortic valve, or is it bicuspid (orpseudobicuspid), unicuspid or quadricuspid? Are the valve cuspsthickened or calcified?
● Are there any features of aortic stenosis (which may coexist withregurgitation)?
● Is there any prolapse? Which cusps are affected?● Are there any features of infective endocarditis (vegetations, aortic root
abscess)?● Is there dilatation of the aortic root and/or any indication of
dissection?
Use M-mode to interrogate the mitral valve. The diastolic jet of aorticregurgitation may hit the anterior mitral valve leaflet, causing fluttering ofthe leaflet, which can be seen on M-mode echo (Fig. 13.4). This pushes theanterior leaflet backwards during diastole, causing premature closure of the
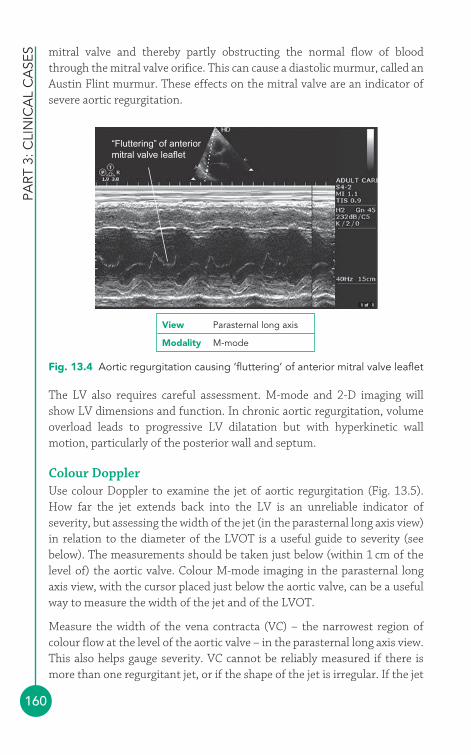
PART
3: C
LIN
ICA
L C
ASE
S
160
The LV also requires careful assessment. M-mode and 2-D imaging willshow LV dimensions and function. In chronic aortic regurgitation, volumeoverload leads to progressive LV dilatation but with hyperkinetic wallmotion, particularly of the posterior wall and septum.
Colour DopplerUse colour Doppler to examine the jet of aortic regurgitation (Fig. 13.5).How far the jet extends back into the LV is an unreliable indicator ofseverity, but assessing the width of the jet (in the parasternal long axis view)in relation to the diameter of the LVOT is a useful guide to severity (seebelow). The measurements should be taken just below (within 1 cm of thelevel of) the aortic valve. Colour M-mode imaging in the parasternal longaxis view, with the cursor placed just below the aortic valve, can be a usefulway to measure the width of the jet and of the LVOT.
Measure the width of the vena contracta (VC) – the narrowest region ofcolour flow at the level of the aortic valve – in the parasternal long axis view.This also helps gauge severity. VC cannot be reliably measured if there ismore than one regurgitant jet, or if the shape of the jet is irregular. If the jet
“Fluttering” of anteriormitral valve leaflet
Fig. 13.4 Aortic regurgitation causing ‘fluttering’ of anterior mitral valve leaflet
View Parasternal long axis
Modality M-mode
mitral valve and thereby partly obstructing the normal flow of bloodthrough the mitral valve orifice. This can cause a diastolic murmur, called anAustin Flint murmur. These effects on the mitral valve are an indicator ofsevere aortic regurgitation.
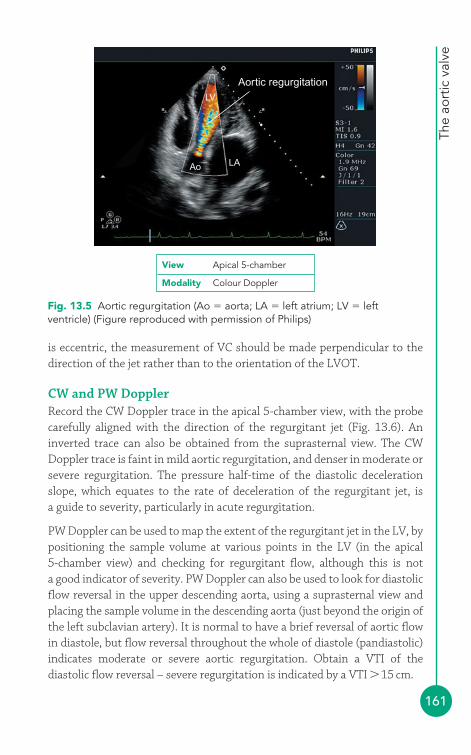
The
aort
ic v
alve
161
is eccentric, the measurement of VC should be made perpendicular to thedirection of the jet rather than to the orientation of the LVOT.
CW and PW DopplerRecord the CW Doppler trace in the apical 5-chamber view, with the probecarefully aligned with the direction of the regurgitant jet (Fig. 13.6). Aninverted trace can also be obtained from the suprasternal view. The CWDoppler trace is faint in mild aortic regurgitation, and denser in moderate orsevere regurgitation. The pressure half-time of the diastolic decelerationslope, which equates to the rate of deceleration of the regurgitant jet, is a guide to severity, particularly in acute regurgitation.
PW Doppler can be used to map the extent of the regurgitant jet in the LV, bypositioning the sample volume at various points in the LV (in the apical 5-chamber view) and checking for regurgitant flow, although this is not a good indicator of severity. PW Doppler can also be used to look for diastolicflow reversal in the upper descending aorta, using a suprasternal view andplacing the sample volume in the descending aorta (just beyond the origin ofthe left subclavian artery). It is normal to have a brief reversal of aortic flowin diastole, but flow reversal throughout the whole of diastole (pandiastolic)indicates moderate or severe aortic regurgitation. Obtain a VTI of thediastolic flow reversal – severe regurgitation is indicated by a VTI �15 cm.
LV
Ao LA
Aortic regurgitation
Fig. 13.5 Aortic regurgitation (Ao � aorta; LA � left atrium; LV � leftventricle) (Figure reproduced with permission of Philips)
View Apical 5-chamber
Modality Colour Doppler

PART
3: C
LIN
ICA
L C
ASE
S
162
Aortic regurgitation
Fig. 13.6 Aortic regurgitation (Figure reproduced with permission of Philips)
View Apical 5-chamber
Modality CW Doppler
Regurgitant volumeThe volume of blood entering the LV via the mitral valve during diastoleshould normally equal the volume of blood leaving it via the LVOT (strokevolume). In the presence of aortic regurgitation, LVOT outflow will begreater than mitral valve inflow as the systolic LVOT outflow will consist ofthe blood that has entered via the mitral valve plus the blood that enteredthe ventricle via aortic regurgitation during diastole. The difference betweenLVOT outflow and mitral valve inflow gives the regurgitant volume.
Although simple in principle, measurement of regurgitant volume isdifficult in practice. First, the measurement is not valid if there is significantmitral regurgitation. Second, any error in measurement of mitral valveorifice area or LVOT diameter can have a large impact on the result. If youwish to measure regurgitant fraction, you can do so as follows:
1. In the apical 4-chamber view, measure the diameter of the mitralannulus in cm, and then use this to calculate the CSA of the mitral valve in cm2. This calculation makes the assumption that the mitralorifice is circular:
CSAMV � 0.785 � (mitral annulus diameter)2
2. In the apical 4-chamber view, measure the VTI of mitral valve inflow(using PW Doppler) to give VTIMV, in cm. It is generally easiest to place

The
aort
ic v
alve
163
the sample volume at the valve tips (some place it at the level of themitral valve annulus).
3. The stroke volume of the mitral valve (SVMV), in mL/beat, can then becalculated from:
SVMV � CSAMV � VTIMV
4. In the parasternal long axis view, measure the diameter of the LVOT incm, and then use this to calculate the cross-sectional area (CSA) of theLVOT in cm2:
CSALVOT � 0.785 � (LVOT diameter)2
5. In the apical 5-chamber view, measure the VTI of LVOT outflow (usingPW Doppler) to give VTILVOT, in cm.
6. The stroke volume of the LVOT (SVLVOT), in mL/beat, can then becalculated from:
SVLVOT � CSALVOT � VTILVOT
7. Aortic regurgitant volume (RV) can be calculated from:
RV � SVLVOT � SVMV
8. Aortic regurgitant fraction (RF) can be calculated from:
Once you have calculated the aortic RV, you can also calculate theregurgitant orifice area (ROA). This is the average size of the orifice in theaortic valve, in cm2, through which the regurgitation occurs during diastole,and equals the aortic RV (in mL) divided by the VTI of the aorticregurgitation Doppler trace (VTIAR), measured in cm using CW Doppler:
Proximal isovelocity surface area (PISA) assessmentThe use of PISA in the assessment of aortic regurgitation is not as commonas it is for mitral regurgitation, as it is technically more challenging to obtainsuitable images and the technique has not been so well studied in relation tothe aortic valve.
ROA �RV
VTIAR
RF�RV
SVMV
( � 100 to express as a percentage)
PART
3: C
LIN
ICA
L C
ASE
S
164
Associated featuresIf aortic regurgitation is present you should:
● assess any coexistent aortic stenosis● assess any coexistent disease affecting the other valves (as patients
undergoing aortic valve surgery may also require any other valvularabnormalities to be corrected at the same time)
● assess LV dimensions and function● assess aortic root morphology and dimensions● if the aortic valve is bicuspid, check for the presence of coarctation of
the aorta (bicuspid aortic valve and coarctation of the aorta aresometimes associated).
Severity of aortic regurgitationSeverity of aortic regurgitation can be assessed by (Table 13.4):
● VC width● ratio of jet width to LVOT width● jet pressure half-time● VTI of diastolic flow reversal in upper descending aorta● RV● RF● ROA.
The ratio of jet width to LVOT width is commonly used to quantify severity,but can be misleading in jets that are eccentric or have a diffuse origin. Insuch cases it is generally better to use visual assessment to grade the ratio interms of small, intermediate or large, and to use this as a gross guide toseverity, than to stick slavishly to percentages. The VC width is a morereliable indicator of severity.
The pressure half-time of the diastolic deceleration slope shortens withincreasing severity, as the rate of fall in aortic pressure is greater in severe
COMMON PITFALLS
Pitfalls in the echo assessment of aortic regurgitation include:
● An eccentric jet usually leads to underestimation of severity.● Measuring the width of the regurgitant jet on colour Doppler
too far below the aortic valve, where it tends to spread out,overestimates severity.
!
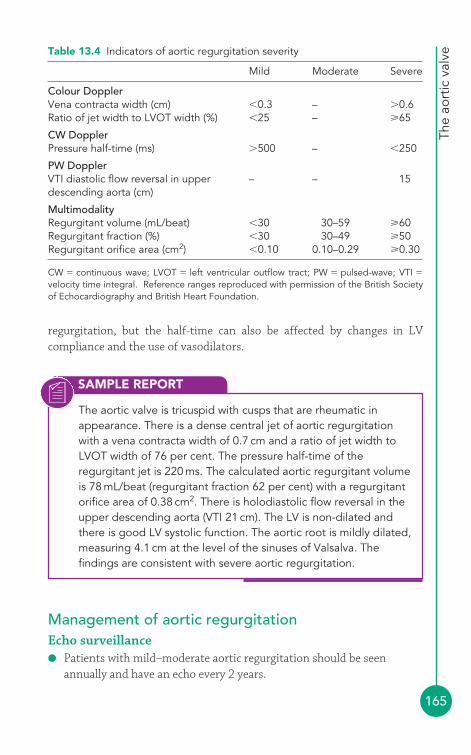
The
aort
ic v
alve
165
SAMPLE REPORT
The aortic valve is tricuspid with cusps that are rheumatic inappearance. There is a dense central jet of aortic regurgitationwith a vena contracta width of 0.7 cm and a ratio of jet width toLVOT width of 76 per cent. The pressure half-time of theregurgitant jet is 220 ms. The calculated aortic regurgitant volumeis 78 mL/beat (regurgitant fraction 62 per cent) with a regurgitantorifice area of 0.38 cm2. There is holodiastolic flow reversal in theupper descending aorta (VTI 21 cm). The LV is non-dilated andthere is good LV systolic function. The aortic root is mildly dilated,measuring 4.1 cm at the level of the sinuses of Valsalva. Thefindings are consistent with severe aortic regurgitation.
regurgitation, but the half-time can also be affected by changes in LVcompliance and the use of vasodilators.
Table 13.4 Indicators of aortic regurgitation severity
Mild Moderate Severe
Colour DopplerVena contracta width (cm) �0.3 – �0.6Ratio of jet width to LVOT width (%) �25 – 65
CW DopplerPressure half-time (ms) �500 – �250
PW DopplerVTI diastolic flow reversal in upper – – 15descending aorta (cm)
MultimodalityRegurgitant volume (mL/beat) �30 30–59 60Regurgitant fraction (%) �30 30–49 50Regurgitant orifice area (cm2) �0.10 0.10–0.29 0.30
CW � continuous wave; LVOT � left ventricular outflow tract; PW � pulsed-wave; VTI �
velocity time integral. Reference ranges reproduced with permission of the British Societyof Echocardiography and British Heart Foundation.
Management of aortic regurgitationEcho surveillance● Patients with mild–moderate aortic regurgitation should be seen
annually and have an echo every 2 years.
PART
3: C
LIN
ICA
L C
ASE
S
166
● Patients with severe regurgitation and normal LV function should be reviewed every 6 months, or annually if stable and not close to needing surgery.
● Patients with a dilated aortic root (especially those with Marfan syndrome or bicuspid aortic valve) should have an annual echo, or even more frequently if the aorta is enlarging.
Drug therapyPatients who develop LV impairment should be treated with appropriateheart failure medication and hypertension should be well controlled. The ‘pre-emptive’ use of vasodilators in patients with normal LV function isunproven, but beta-blockers have a role to play in those with Marfansyndrome.
SurgeryAortic valve surgery is indicated for symptomatic acute aortic regurgitationand in chronic aortic regurgitation when severe and symptomatic. Inasymptomatic patients with severe aortic regurgitation, surgery is indicatedfor:
● LV impairment (ejection fraction �50 per cent)● LV dilatation (end-diastolic diameter �7.0 cm or end-systolic
diameter �5.0 cm)● Patients needing heart surgery for other reasons (e.g. coronary artery
bypass graft).
Regardless of aortic regurgitation severity, surgery is indicated for patientswith aortic root disease and an aortic root diameter measuring:
● 4.5 cm in Marfan syndrome● 5.0 cm with a bicuspid aortic valve● 5.5 cm for other patients.
Surgery may involve aortic valve replacement or repair (where the valve issuitable), together with aortic root grafting where appropriate.
The
aort
ic v
alve
167
FURTHER READING
Chambers J. British Society of Echocardiography DistanceLearning Module 3: Echocardiographic Assessment of AorticStenosis. Accessible from the BSE website (www.bsecho.org).
Maurer G. Aortic regurgitation. Heart 2006; 92: 994–1000.
Ramaraj R, Sorrell VL. Degenerative aortic stenosis. BMJ 2008;336: 550–5.
The Task Force on the Management of Valvular Heart Disease ofthe European Society of Cardiology. Guidelines on themanagement of valvular heart disease. Eur Heart J 2007; 28:230–68.
Ward C. Clinical significance of the bicuspid aortic valve. Heart2000; 83: 81–5.
Zoghbi WA, Enriquez-Sarano M, Foster E, et al. American Societyof Echocardiography: recommendations for evaluation of theseverity of native valvular regurgitation with two-dimensionaland Doppler echocardiography. J Am Soc Echocardiogr 2003;16: 777–802.
168
4
● Echo views of the mitral valveThe mitral valve is usually assessed in the:
● left parasternal window� parasternal long axis view� parasternal short axis view (mitral valve and papillary muscle levels)
● apical window� apical 4-chamber view� apical 2-chamber view� apical 3-chamber (long axis) view.
The parasternal long axis view (Fig. 6.2, p. 56) bisects the mitral valve,showing the anterior and posterior leaflets in the plane of the A2 and P2scallops. 2-D imaging shows the structure of the mitral valve and allows anassessment of leaflet mobility. An M-mode study of the valve, at the level ofthe leaflet tips, shows the tips open widely in early diastole as blood flowsfrom the left atrium (LA) into the left ventricle (LV), and the point at whichthe anterior leaflet tip reaches its most anterior position is called the E point(Fig. 14.1). The leaflets then move back together in mid-diastole beforeseparating once again towards the end of diastole, as a result of the extrasurge of blood through the valve that accompanies atrial systole. Themaximum excursion of the anterior leaflet during this phase is called the A point. The anterior leaflet then follows a straight downward line to itsclosure point at the onset of systole. Once you have completed the M-moderecording, use colour Doppler to assess valvular flow.
The parasternal short axis view (mitral valve level) shows the valve ‘faceon’ and all three scallops of both leaflets can be seen together with both
The mitral valve14
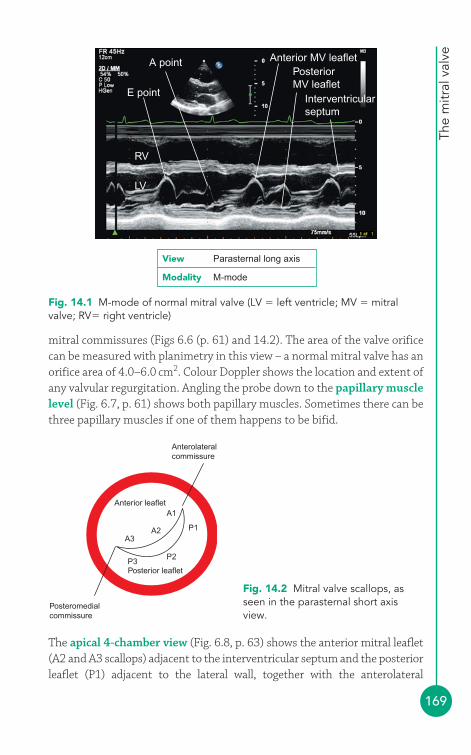
The
mitr
al v
alve
169
mitral commissures (Figs 6.6 (p. 61) and 14.2). The area of the valve orificecan be measured with planimetry in this view – a normal mitral valve has anorifice area of 4.0–6.0 cm2. Colour Doppler shows the location and extent ofany valvular regurgitation. Angling the probe down to the papillary musclelevel (Fig. 6.7, p. 61) shows both papillary muscles. Sometimes there can bethree papillary muscles if one of them happens to be bifid.
Anterior MV leafletPosteriorMV leaflet
Interventricularseptum
A point
RV
LV
E point
Fig. 14.1 M-mode of normal mitral valve (LV � left ventricle; MV � mitralvalve; RV� right ventricle)
View Parasternal long axis
Modality M-mode
Posteromedialcommissure
A3
Anterolateralcommissure
A2
A1
P3
P1
P2
Anterior leaflet
Posterior leaflet
Fig. 14.2 Mitral valve scallops, asseen in the parasternal short axisview.
The apical 4-chamber view (Fig. 6.8, p. 63) shows the anterior mitral leaflet(A2 and A3 scallops) adjacent to the interventricular septum and the posteriorleaflet (P1) adjacent to the lateral wall, together with the anterolateral
PART
3: C
LIN
ICA
L C
ASE
S
170
papillary muscle and its chordae. The apical 2-chamber view (Fig. 6.10, p. 65) shows the anterior mitral leaflet in a ‘bicommisural view’, with the P1and P3 scallops of the posterior leaflet on either side and the A2 scallop of theanterior leaflet in the middle. The apical 3-chamber view (Fig. 6.11, p. 66) issimilar to the parasternal long axis view, showing the A2 and P2 scallops.
In each of the apical views inspect the valve structure with 2-D echo andassess flow with colour Doppler. The apical views permit a good alignmentof continuous wave (CW) and pulsed-wave (PW) Doppler with the valve toassess forward (and any regurgitant) flow. Forward flow across a normalmitral valve has a pressure half-time of 40–70 ms. Additional informationcan also be obtained from the:
● subcostal window� subcostal long axis view� subcostal short axis view.
The subcostal long axis view provides an additional view from which themitral valve can be examined. The subcostal short axis view is seldomused to examine the mitral valve, but with appropriate angulation of theprobe it can be visualized.
● Mitral stenosisMitral stenosis is the obstruction of diastolic blood flow from the LA to the LVdue to a narrowing of the mitral valve. This is almost always due to rheumaticmitral valve disease, as a consequence of rheumatic fever earlier in life.
Causes of mitral stenosisRheumatic valve disease can affect any of the heart valves (or several incombination), but most commonly affects the mitral valve. Thecharacteristic feature is fusion of the mitral leaflets along their edges,starting from the mitral commissures, restricting their ability to open. Theleaflet edges become thickened, although there can be thickening and/orcalcification elsewhere too. As the main body of each leaflet usually remainsrelatively pliable, the leaflets are seen to ‘dome’ during diastole, with therising LA pressure causing the leaflet body to bow forwards towards theventricle. This gives the leaflets what is described as a ‘hockey stick’appearance. Rheumatic mitral stenosis also affects the chordae, causingfibrosis, shortening and calcification of the subvalvular apparatus.
Other causes of mitral stenosis are rare. These include congenital mitralstenosis, mitral annular calcification, systemic lupus erythematosus,
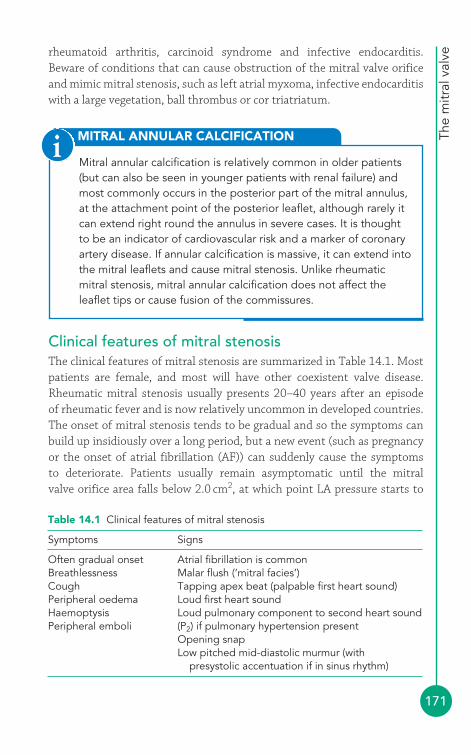
The
mitr
al v
alve
171
rheumatoid arthritis, carcinoid syndrome and infective endocarditis.Beware of conditions that can cause obstruction of the mitral valve orificeand mimic mitral stenosis, such as left atrial myxoma, infective endocarditiswith a large vegetation, ball thrombus or cor triatriatum.
MITRAL ANNULAR CALCIFICATION
Mitral annular calcification is relatively common in older patients(but can also be seen in younger patients with renal failure) andmost commonly occurs in the posterior part of the mitral annulus,at the attachment point of the posterior leaflet, although rarely itcan extend right round the annulus in severe cases. It is thoughtto be an indicator of cardiovascular risk and a marker of coronaryartery disease. If annular calcification is massive, it can extend intothe mitral leaflets and cause mitral stenosis. Unlike rheumaticmitral stenosis, mitral annular calcification does not affect theleaflet tips or cause fusion of the commissures.
i
Table 14.1 Clinical features of mitral stenosis
Symptoms Signs
Often gradual onset Atrial fibrillation is commonBreathlessness Malar flush (‘mitral facies’)Cough Tapping apex beat (palpable first heart sound)Peripheral oedema Loud first heart soundHaemoptysis Loud pulmonary component to second heart sound Peripheral emboli (P2) if pulmonary hypertension present
Opening snapLow pitched mid-diastolic murmur (with
presystolic accentuation if in sinus rhythm)
Clinical features of mitral stenosisThe clinical features of mitral stenosis are summarized in Table 14.1. Mostpatients are female, and most will have other coexistent valve disease.Rheumatic mitral stenosis usually presents 20–40 years after an episode of rheumatic fever and is now relatively uncommon in developed countries.The onset of mitral stenosis tends to be gradual and so the symptoms canbuild up insidiously over a long period, but a new event (such as pregnancyor the onset of atrial fibrillation (AF)) can suddenly cause the symptoms to deteriorate. Patients usually remain asymptomatic until the mitral valve orifice area falls below 2.0 cm2, at which point LA pressure starts to
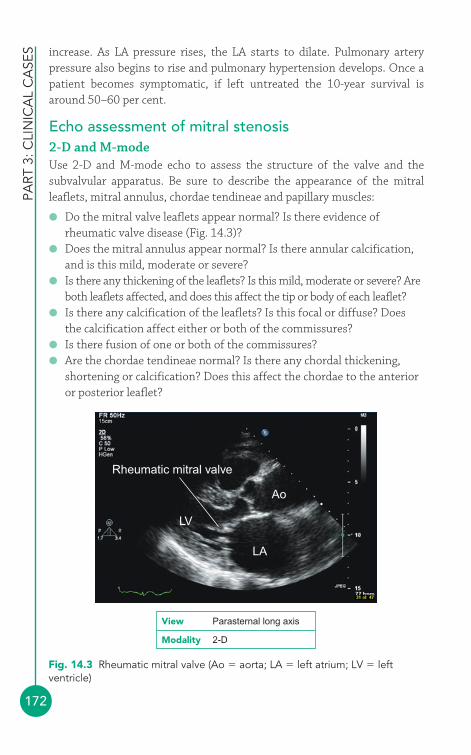
PART
3: C
LIN
ICA
L C
ASE
S
172
increase. As LA pressure rises, the LA starts to dilate. Pulmonary arterypressure also begins to rise and pulmonary hypertension develops. Once apatient becomes symptomatic, if left untreated the 10-year survival isaround 50–60 per cent.
Echo assessment of mitral stenosis2-D and M-modeUse 2-D and M-mode echo to assess the structure of the valve and thesubvalvular apparatus. Be sure to describe the appearance of the mitralleaflets, mitral annulus, chordae tendineae and papillary muscles:
● Do the mitral valve leaflets appear normal? Is there evidence ofrheumatic valve disease (Fig. 14.3)?
● Does the mitral annulus appear normal? Is there annular calcification,and is this mild, moderate or severe?
● Is there any thickening of the leaflets? Is this mild, moderate or severe? Areboth leaflets affected, and does this affect the tip or body of each leaflet?
● Is there any calcification of the leaflets? Is this focal or diffuse? Doesthe calcification affect either or both of the commissures?
● Is there fusion of one or both of the commissures?● Are the chordae tendineae normal? Is there any chordal thickening,
shortening or calcification? Does this affect the chordae to the anterioror posterior leaflet?
Rheumatic mitral valve
LV
LA
Ao
Fig. 14.3 Rheumatic mitral valve (Ao � aorta; LA � left atrium; LV � leftventricle)
View Parasternal long axis
Modality 2-D
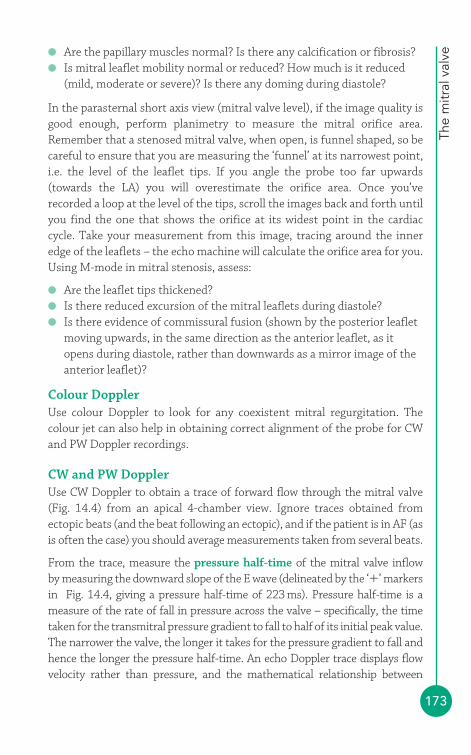
The
mitr
al v
alve
173
● Are the papillary muscles normal? Is there any calcification or fibrosis?● Is mitral leaflet mobility normal or reduced? How much is it reduced
(mild, moderate or severe)? Is there any doming during diastole?
In the parasternal short axis view (mitral valve level), if the image quality isgood enough, perform planimetry to measure the mitral orifice area.Remember that a stenosed mitral valve, when open, is funnel shaped, so becareful to ensure that you are measuring the ‘funnel’ at its narrowest point,i.e. the level of the leaflet tips. If you angle the probe too far upwards(towards the LA) you will overestimate the orifice area. Once you’verecorded a loop at the level of the tips, scroll the images back and forth untilyou find the one that shows the orifice at its widest point in the cardiaccycle. Take your measurement from this image, tracing around the inneredge of the leaflets – the echo machine will calculate the orifice area for you.Using M-mode in mitral stenosis, assess:
● Are the leaflet tips thickened?● Is there reduced excursion of the mitral leaflets during diastole?● Is there evidence of commissural fusion (shown by the posterior leaflet
moving upwards, in the same direction as the anterior leaflet, as itopens during diastole, rather than downwards as a mirror image of theanterior leaflet)?
Colour DopplerUse colour Doppler to look for any coexistent mitral regurgitation. Thecolour jet can also help in obtaining correct alignment of the probe for CWand PW Doppler recordings.
CW and PW DopplerUse CW Doppler to obtain a trace of forward flow through the mitral valve(Fig. 14.4) from an apical 4-chamber view. Ignore traces obtained fromectopic beats (and the beat following an ectopic), and if the patient is in AF (asis often the case) you should average measurements taken from several beats.
From the trace, measure the pressure half-time of the mitral valve inflow by measuring the downward slope of the E wave (delineated by the ‘�’ markersin Fig. 14.4, giving a pressure half-time of 223 ms). Pressure half-time is ameasure of the rate of fall in pressure across the valve – specifically, the timetaken for the transmitral pressure gradient to fall to half of its initial peak value.The narrower the valve, the longer it takes for the pressure gradient to fall andhence the longer the pressure half-time. An echo Doppler trace displays flowvelocity rather than pressure, and the mathematical relationship between
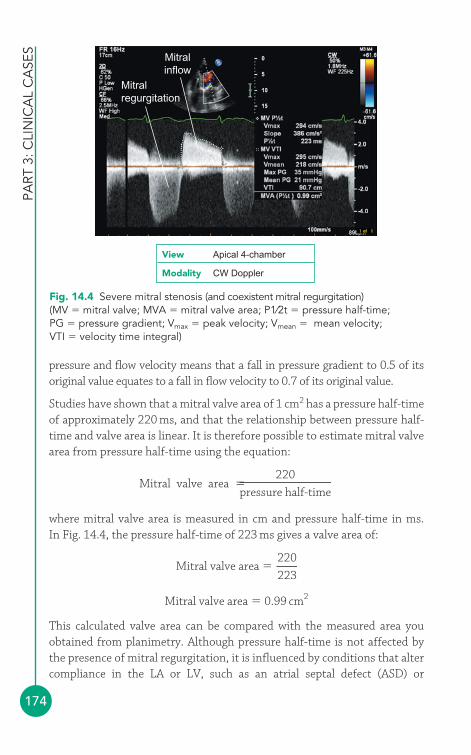
PART
3: C
LIN
ICA
L C
ASE
S
174
pressure and flow velocity means that a fall in pressure gradient to 0.5 of itsoriginal value equates to a fall in flow velocity to 0.7 of its original value.
Studies have shown that a mitral valve area of 1 cm2 has a pressure half-timeof approximately 220 ms, and that the relationship between pressure half-time and valve area is linear. It is therefore possible to estimate mitral valvearea from pressure half-time using the equation:
where mitral valve area is measured in cm and pressure half-time in ms. In Fig. 14.4, the pressure half-time of 223 ms gives a valve area of:
Mitral valve area � 0.99 cm2
This calculated valve area can be compared with the measured area youobtained from planimetry. Although pressure half-time is not affected bythe presence of mitral regurgitation, it is influenced by conditions that altercompliance in the LA or LV, such as an atrial septal defect (ASD) or
Mitral valve area �220
223
Mitral valve area �220
pressure half-time
Mitralinflow
Mitralregurgitation
Fig. 14.4 Severe mitral stenosis (and coexistent mitral regurgitation)(MV � mitral valve; MVA � mitral valve area; P1⁄2t � pressure half-time;PG � pressure gradient; Vmax � peak velocity; Vmean � mean velocity;VTI � velocity time integral)
View Apical 4-chamber
Modality CW Doppler

The
mitr
al v
alve
175
significant aortic regurgitation, which will shorten pressure half-time (andthus overestimate mitral valve area). Pressure half-time is also influenced bythe acute haemodynamic changes that occur following mitral valvuloplasty(see p. 231).
Next, measure the mean mitral pressure drop by tracing the VTI of themitral inflow (delineated by the ‘X’ markers in Fig. 14.4, giving a meanpressure gradient of 21 mmHg). Unlike pressure half-time, the meanpressure gradient is dependent not only on stenosis severity but also uponflow across the valve – conditions that increase transmitral flow (such asexercise or, as in the example in Figure 14.4, coexistent mitral regurgitation)will also increase the gradient.
Continuity equationMitral valve area can also be calculated using the continuity equation. Thiscalculation relies on the volume of blood entering the LV via the mitral valveorifice during diastole (transmitral stroke volume) being equal to thevolume of blood leaving the LV via the LV outflow tract (LVOT) duringsystole. This calculation cannot therefore be used in the presence ofsignificant mitral or aortic regurgitation.
1. In the parasternal long axis view, measure the diameter of the LVOT incm, and then use this to calculate the cross-sectional area (CSA) of theLVOT in cm2:
CSALVOT � 0.785 � (LVOT diameter)2
2. In the apical 5-chamber view, measure the velocity time integral (VTI) ofLVOT outflow (using PW Doppler) to give VTILVOT, in cm.
3. The stroke volume of the LVOT (SVLVOT), in mL/beat, can then becalculated from:
SVLVOT � CSALVOT � VTILVOT
4. This will be equal to the transmitral stoke volume (SVMV):
SVMV � SVLVOT
5. In the apical 4-chamber view, measure the VTI of mitral valve inflow(using PW Doppler) to give VTIMV, in cm.
6. Mitral valve area (MVA), in cm2, can be calculated from:
MVA �SVMV
VTIMV
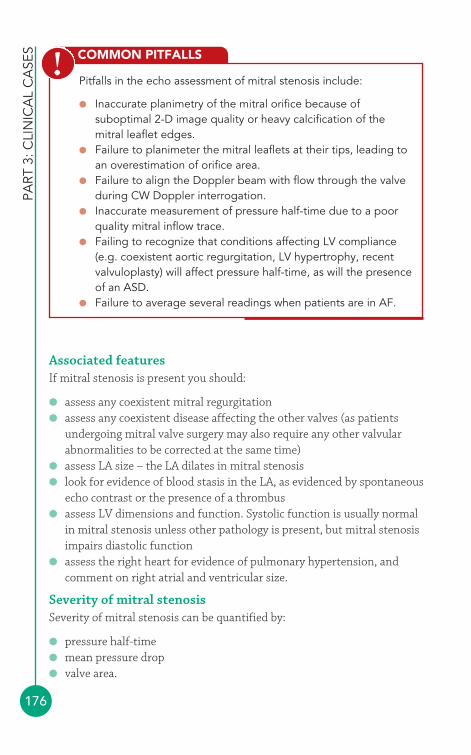
PART
3: C
LIN
ICA
L C
ASE
S
176
Associated featuresIf mitral stenosis is present you should:
● assess any coexistent mitral regurgitation● assess any coexistent disease affecting the other valves (as patients
undergoing mitral valve surgery may also require any other valvularabnormalities to be corrected at the same time)
● assess LA size – the LA dilates in mitral stenosis● look for evidence of blood stasis in the LA, as evidenced by spontaneous
echo contrast or the presence of a thrombus● assess LV dimensions and function. Systolic function is usually normal
in mitral stenosis unless other pathology is present, but mitral stenosisimpairs diastolic function
● assess the right heart for evidence of pulmonary hypertension, andcomment on right atrial and ventricular size.
Severity of mitral stenosisSeverity of mitral stenosis can be quantified by:
● pressure half-time● mean pressure drop● valve area.
COMMON PITFALLS
Pitfalls in the echo assessment of mitral stenosis include:
● Inaccurate planimetry of the mitral orifice because ofsuboptimal 2-D image quality or heavy calcification of themitral leaflet edges.
● Failure to planimeter the mitral leaflets at their tips, leading toan overestimation of orifice area.
● Failure to align the Doppler beam with flow through the valveduring CW Doppler interrogation.
● Inaccurate measurement of pressure half-time due to a poorquality mitral inflow trace.
● Failing to recognize that conditions affecting LV compliance(e.g. coexistent aortic regurgitation, LV hypertrophy, recentvalvuloplasty) will affect pressure half-time, as will the presenceof an ASD.
● Failure to average several readings when patients are in AF.
!

SAMPLE REPORT
The
mitr
al v
alve
177
Table 14.2 summarizes the echo indicators of mitral stenosis severity. Youshould always state the method(s) you have used to measure mitral valvearea in your report.
The mitral valve is rheumatic in appearance, with fusion of theleaflets at both commissures and moderate thickening of bothleaflet tips and the chordae tendineae. There is no calcificationand the mitral annulus and papillary muscles appear normal. Mitralleaflet mobility is severely reduced, with doming during diastole.The mitral valve area measures 0.86 cm2 by planimetry. Thepressure half-time is 245 ms, giving a calculated valve area of0.9 cm2. The mean transmitral pressure drop is 14 mmHg. There ismild associated mitral regurgitation. The left atrium is severelydilated at 5.6 cm, and there is spontaneous echo contrast (thepatient is also noted to be in atrial fibrillation). Left ventriculardimensions are normal with good systolic function. There is mildtricuspid regurgitation with an elevated pulmonary artery systolicpressure of 56 mmHg. The findings are consistent with severemitral stenosis potentially suitable for balloon mitral valvuloplasty.
Table 14.2 Indicators of mitral stenosis severity
Mild Moderate Severe
Pressure half-time (ms) 71–139 140–219 �219Mean pressure drop (mmHg) �5.0 5–10 �10Valve area (cm2) 1.6–2.0 1.0–1.5 �1.0
Reference ranges reproduced with permission of the British Society of Echocardiographyand British Heart Foundation.
Indirect indicators that point towards more severe mitral stenosis include:
● LA dilatation● pulmonary hypertension.
Management of mitral stenosisEcho surveillancePatients with asymptomatic but significant mitral stenosis should beadvised to report symptoms immediately and should have annual clinicaland echo evaluations.

PART
3: C
LIN
ICA
L C
ASE
S
178
Drug therapyThere is no specific drug therapy to reverse mitral stenosis, but diuretics areuseful in treating breathlessness. Anticoagulation is important in those inAF and with thrombus in the LA.
SurgeryPatients with symptomatic severe mitral stenosis symptoms should beconsidered for intervention. If the valve is suitable this usually takes theform of percutaneous balloon mitral valvuloplasty (PBMV, p. 231). Ifunsuitable for this technique, surgical intervention can be offered.
● Mitral regurgitationMitral regurgitation is the flow of blood from the LV back through themitral valve during systole. Mitral regurgitation can result from dysfunctionof any part of the mitral valve apparatus: the leaflets, annulus, papillarymuscles or chordae tendineae. Different pathologies tend to affect differentparts of the valve apparatus, and sometimes more than one part is affected.
Causes of mitral regurgitationA trace amount of mitral regurgitation, in the absence of any structuralheart disease, is a common finding in normal individuals. More significantmitral regurgitation can be the result of:
● myxomatous degeneration/mitral valve prolapse (MVP)● rheumatic valve disease● infective endocarditis● ischaemic heart disease (papillary muscle dysfunction/rupture)● mitral annular dilatation (‘functional’ mitral regurgitation, secondary to
LV dilatation).
MVP is the single commonest cause of mitral regurgitation in the developedworld, and as well as being a result of degenerative valve disease, it can alsooccur in collagen disorders such as Ehlers–Danlos syndrome or Marfansyndrome (Chapter 23), or papillary muscle dysfunction/rupture.
Mitral regurgitation in ischaemic heart disease can be intermittent, onlyoccurring when an episode of myocardial ischaemia affects a papillarymuscle, or it may be permanent following a myocardial infarction. It ischaracterized by ‘tethering’ of the valve during systole, causing failure ofleaflet apposition. Myocardial infarction can also lead to rupture of apapillary muscle, leading to flailing of the affected leaflet segments (the
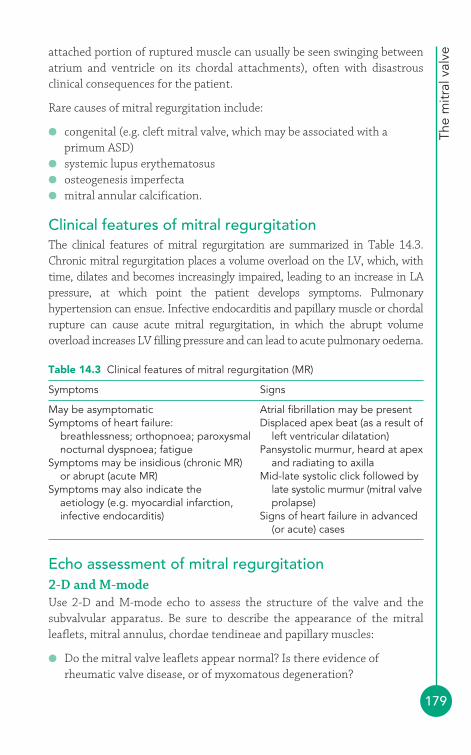
The
mitr
al v
alve
179
attached portion of ruptured muscle can usually be seen swinging betweenatrium and ventricle on its chordal attachments), often with disastrousclinical consequences for the patient.
Rare causes of mitral regurgitation include:
● congenital (e.g. cleft mitral valve, which may be associated with aprimum ASD)
● systemic lupus erythematosus● osteogenesis imperfecta● mitral annular calcification.
Clinical features of mitral regurgitationThe clinical features of mitral regurgitation are summarized in Table 14.3.Chronic mitral regurgitation places a volume overload on the LV, which, withtime, dilates and becomes increasingly impaired, leading to an increase in LApressure, at which point the patient develops symptoms. Pulmonaryhypertension can ensue. Infective endocarditis and papillary muscle or chordalrupture can cause acute mitral regurgitation, in which the abrupt volumeoverload increases LV filling pressure and can lead to acute pulmonary oedema.
Table 14.3 Clinical features of mitral regurgitation (MR)
Symptoms Signs
May be asymptomatic Atrial fibrillation may be presentSymptoms of heart failure: Displaced apex beat (as a result of
breathlessness; orthopnoea; paroxysmal left ventricular dilatation)nocturnal dyspnoea; fatigue Pansystolic murmur, heard at apex
Symptoms may be insidious (chronic MR) and radiating to axillaor abrupt (acute MR) Mid-late systolic click followed by
Symptoms may also indicate the late systolic murmur (mitral valve aetiology (e.g. myocardial infarction, prolapse)infective endocarditis) Signs of heart failure in advanced
(or acute) cases
Echo assessment of mitral regurgitation2-D and M-modeUse 2-D and M-mode echo to assess the structure of the valve and thesubvalvular apparatus. Be sure to describe the appearance of the mitralleaflets, mitral annulus, chordae tendineae and papillary muscles:
● Do the mitral valve leaflets appear normal? Is there evidence ofrheumatic valve disease, or of myxomatous degeneration?
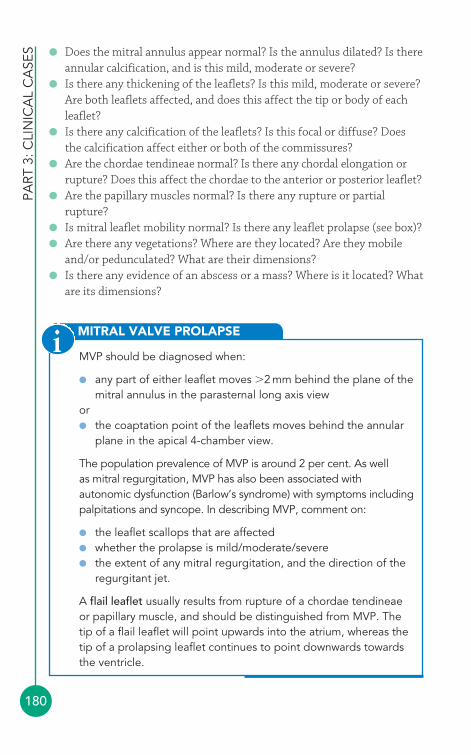
PART
3: C
LIN
ICA
L C
ASE
S
180
● Does the mitral annulus appear normal? Is the annulus dilated? Is thereannular calcification, and is this mild, moderate or severe?
● Is there any thickening of the leaflets? Is this mild, moderate or severe?Are both leaflets affected, and does this affect the tip or body of eachleaflet?
● Is there any calcification of the leaflets? Is this focal or diffuse? Doesthe calcification affect either or both of the commissures?
● Are the chordae tendineae normal? Is there any chordal elongation orrupture? Does this affect the chordae to the anterior or posterior leaflet?
● Are the papillary muscles normal? Is there any rupture or partialrupture?
● Is mitral leaflet mobility normal? Is there any leaflet prolapse (see box)?● Are there any vegetations? Where are they located? Are they mobile
and/or pedunculated? What are their dimensions?● Is there any evidence of an abscess or a mass? Where is it located? What
are its dimensions?
MITRAL VALVE PROLAPSE
MVP should be diagnosed when:
● any part of either leaflet moves �2 mm behind the plane of themitral annulus in the parasternal long axis view
or● the coaptation point of the leaflets moves behind the annular
plane in the apical 4-chamber view.
The population prevalence of MVP is around 2 per cent. As well as mitral regurgitation, MVP has also been associated withautonomic dysfunction (Barlow’s syndrome) with symptoms includingpalpitations and syncope. In describing MVP, comment on:
● the leaflet scallops that are affected● whether the prolapse is mild/moderate/severe● the extent of any mitral regurgitation, and the direction of the
regurgitant jet.
A flail leaflet usually results from rupture of a chordae tendineaeor papillary muscle, and should be distinguished from MVP. Thetip of a flail leaflet will point upwards into the atrium, whereas thetip of a prolapsing leaflet continues to point downwards towardsthe ventricle.
i
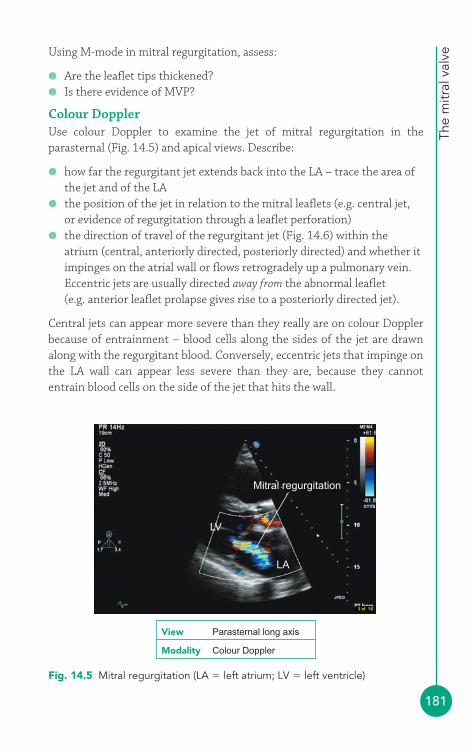
The
mitr
al v
alve
181
Using M-mode in mitral regurgitation, assess:
● Are the leaflet tips thickened?● Is there evidence of MVP?
Colour DopplerUse colour Doppler to examine the jet of mitral regurgitation in theparasternal (Fig. 14.5) and apical views. Describe:
● how far the regurgitant jet extends back into the LA – trace the area ofthe jet and of the LA
● the position of the jet in relation to the mitral leaflets (e.g. central jet,or evidence of regurgitation through a leaflet perforation)
● the direction of travel of the regurgitant jet (Fig. 14.6) within theatrium (central, anteriorly directed, posteriorly directed) and whether itimpinges on the atrial wall or flows retrogradely up a pulmonary vein.Eccentric jets are usually directed away from the abnormal leaflet (e.g. anterior leaflet prolapse gives rise to a posteriorly directed jet).
Central jets can appear more severe than they really are on colour Dopplerbecause of entrainment – blood cells along the sides of the jet are drawnalong with the regurgitant blood. Conversely, eccentric jets that impinge onthe LA wall can appear less severe than they are, because they cannotentrain blood cells on the side of the jet that hits the wall.
Mitral regurgitation
LV
LA
Fig. 14.5 Mitral regurgitation (LA � left atrium; LV � left ventricle)
View Parasternal long axis
Modality Colour Doppler
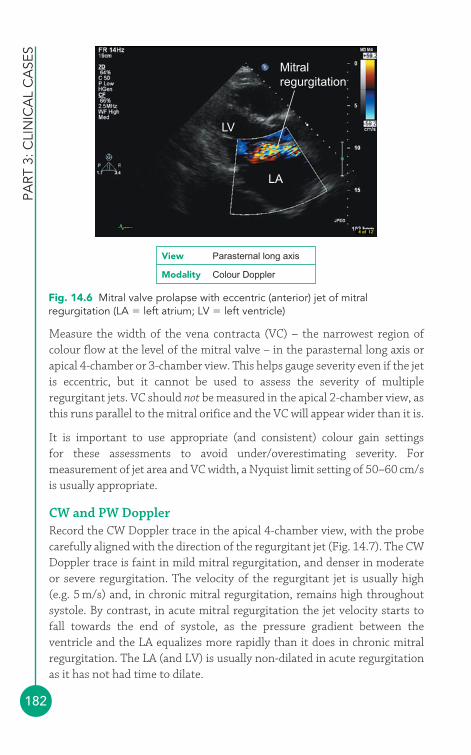
PART
3: C
LIN
ICA
L C
ASE
S
182
Measure the width of the vena contracta (VC) – the narrowest region ofcolour flow at the level of the mitral valve – in the parasternal long axis orapical 4-chamber or 3-chamber view. This helps gauge severity even if the jetis eccentric, but it cannot be used to assess the severity of multipleregurgitant jets. VC should not be measured in the apical 2-chamber view, asthis runs parallel to the mitral orifice and the VC will appear wider than it is.
It is important to use appropriate (and consistent) colour gain settings for these assessments to avoid under/overestimating severity. Formeasurement of jet area and VC width, a Nyquist limit setting of 50–60 cm/sis usually appropriate.
CW and PW DopplerRecord the CW Doppler trace in the apical 4-chamber view, with the probecarefully aligned with the direction of the regurgitant jet (Fig. 14.7). The CWDoppler trace is faint in mild mitral regurgitation, and denser in moderateor severe regurgitation. The velocity of the regurgitant jet is usually high(e.g. 5 m/s) and, in chronic mitral regurgitation, remains high throughoutsystole. By contrast, in acute mitral regurgitation the jet velocity starts tofall towards the end of systole, as the pressure gradient between theventricle and the LA equalizes more rapidly than it does in chronic mitralregurgitation. The LA (and LV) is usually non-dilated in acute regurgitationas it has not had time to dilate.
Mitralregurgitation
LV
LA
Fig. 14.6 Mitral valve prolapse with eccentric (anterior) jet of mitralregurgitation (LA � left atrium; LV � left ventricle)
View Parasternal long axis
Modality Colour Doppler
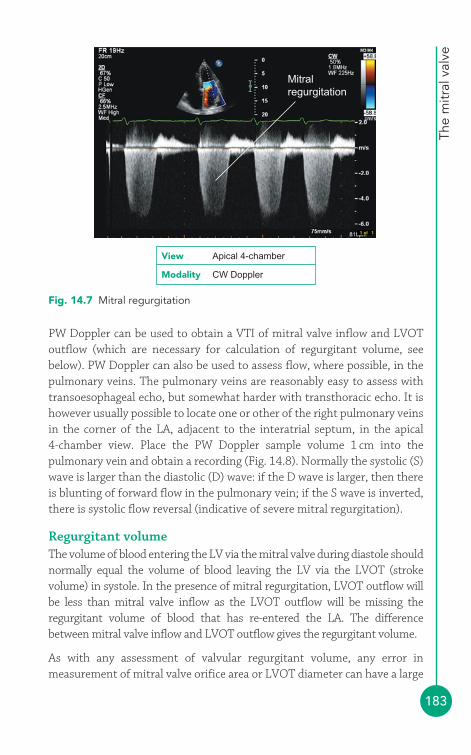
The
mitr
al v
alve
183
PW Doppler can be used to obtain a VTI of mitral valve inflow and LVOToutflow (which are necessary for calculation of regurgitant volume, seebelow). PW Doppler can also be used to assess flow, where possible, in thepulmonary veins. The pulmonary veins are reasonably easy to assess withtransoesophageal echo, but somewhat harder with transthoracic echo. It ishowever usually possible to locate one or other of the right pulmonary veinsin the corner of the LA, adjacent to the interatrial septum, in the apical 4-chamber view. Place the PW Doppler sample volume 1 cm into thepulmonary vein and obtain a recording (Fig. 14.8). Normally the systolic (S)wave is larger than the diastolic (D) wave: if the D wave is larger, then thereis blunting of forward flow in the pulmonary vein; if the S wave is inverted,there is systolic flow reversal (indicative of severe mitral regurgitation).
Regurgitant volumeThe volume of blood entering the LV via the mitral valve during diastole shouldnormally equal the volume of blood leaving the LV via the LVOT (strokevolume) in systole. In the presence of mitral regurgitation, LVOT outflow willbe less than mitral valve inflow as the LVOT outflow will be missing theregurgitant volume of blood that has re-entered the LA. The differencebetween mitral valve inflow and LVOT outflow gives the regurgitant volume.
As with any assessment of valvular regurgitant volume, any error inmeasurement of mitral valve orifice area or LVOT diameter can have a large
Mitralregurgitation
Fig. 14.7 Mitral regurgitation
View Apical 4-chamber
Modality CW Doppler
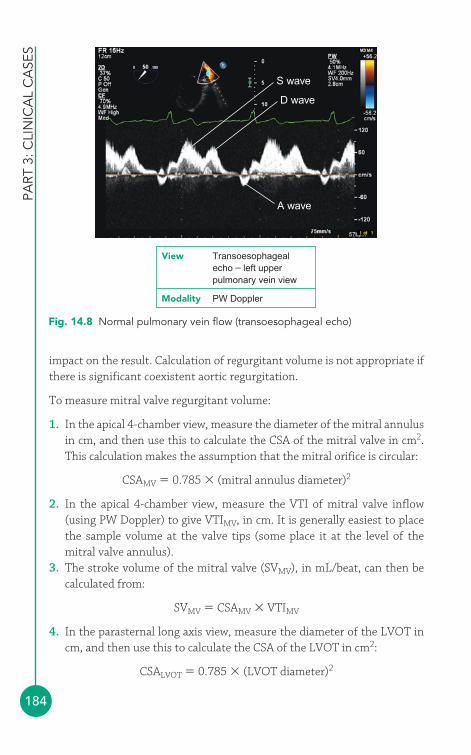
PART
3: C
LIN
ICA
L C
ASE
S
184
impact on the result. Calculation of regurgitant volume is not appropriate ifthere is significant coexistent aortic regurgitation.
To measure mitral valve regurgitant volume:
1. In the apical 4-chamber view, measure the diameter of the mitral annulusin cm, and then use this to calculate the CSA of the mitral valve in cm2.This calculation makes the assumption that the mitral orifice is circular:
CSAMV � 0.785 � (mitral annulus diameter)2
2. In the apical 4-chamber view, measure the VTI of mitral valve inflow(using PW Doppler) to give VTIMV, in cm. It is generally easiest to placethe sample volume at the valve tips (some place it at the level of themitral valve annulus).
3. The stroke volume of the mitral valve (SVMV), in mL/beat, can then becalculated from:
SVMV � CSAMV � VTIMV
4. In the parasternal long axis view, measure the diameter of the LVOT incm, and then use this to calculate the CSA of the LVOT in cm2:
CSALVOT � 0.785 � (LVOT diameter)2
S wave
D wave
A wave
Fig. 14.8 Normal pulmonary vein flow (transoesophageal echo)
View Transoesophagealecho – left upper pulmonary vein view
Modality PW Doppler
The
mitr
al v
alve
185
5. In the apical 5-chamber view, measure the VTI of LVOT outflow (usingPW Doppler) to give VTILVOT, in cm.
6. The stroke volume of the LVOT (SVLVOT), in mL/beat, can then becalculated from:
SVLVOT � CSALVOT � VTILVOT
7. Mitral regurgitant volume (RV) can be calculated from:
RV � SVMV � SVLVOT
8. Mitral regurgitant fraction (RF) can be calculated from:
Once you have calculated the mitral RV, you can also calculate theregurgitant orifice area (ROA). This is the average size of the orifice in themitral valve, in cm2, through which the regurgitation occurs during systole,and equals the mitral RV (in mL) divided by the VTI of the mitralregurgitation Doppler trace (VTIMR), measured in cm using CW Doppler:
Proximal isovelocity surface area (PISA) assessmentThe use of PISA has been well validated in the assessment of mitralregurgitation. The principle behind PISA is that blood flowing towards acircular orifice converges to form a series of hemispheric shells, each ofwhich gets smaller and faster as it approaches the orifice. If the aliasingvelocity (Nyquist limit) of the echo machine is adjusted it can be made tomatch the velocity of blood flow in the ‘shells’ – there will be a blue–redinterface at the point in the series of shells where aliasing occurs, and at thatposition the velocity of blood flow equals the aliasing velocity you haveselected (Fig. 14.9). Knowing the velocity of blood flow at that point, andcalculating the surface area of the relevant hemisphere, you can calculateregurgitant flow rate:
1. Using colour Doppler in the apical 4-chamber view, narrow down thesector width and minimize the depth before zooming in on the locationof the regurgitant jet through the mitral valve. Adjust the aliasingvelocity by adjusting the zero point on the colour flow scale until you see
ROA �RV
VTIMR
RF �RV
SVMV
(�100 to express as a percentage)
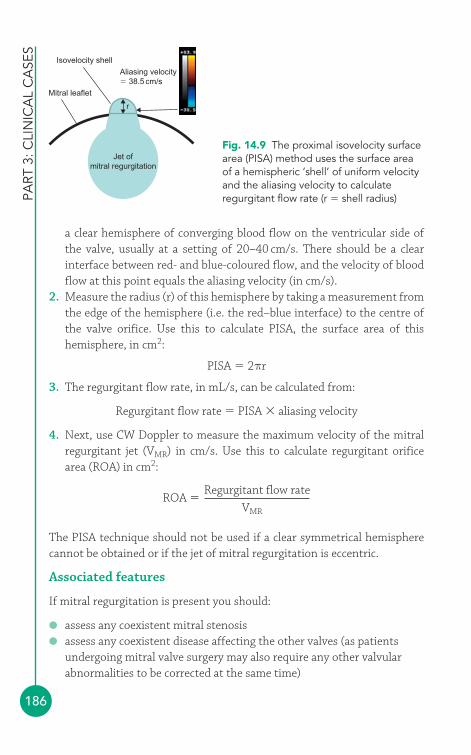
PART
3: C
LIN
ICA
L C
ASE
S
186
a clear hemisphere of converging blood flow on the ventricular side ofthe valve, usually at a setting of 20–40 cm/s. There should be a clearinterface between red- and blue-coloured flow, and the velocity of bloodflow at this point equals the aliasing velocity (in cm/s).
2. Measure the radius (r) of this hemisphere by taking a measurement fromthe edge of the hemisphere (i.e. the red–blue interface) to the centre ofthe valve orifice. Use this to calculate PISA, the surface area of thishemisphere, in cm2:
PISA � 2πr
3. The regurgitant flow rate, in mL/s, can be calculated from:
Regurgitant flow rate � PISA � aliasing velocity
4. Next, use CW Doppler to measure the maximum velocity of the mitralregurgitant jet (VMR) in cm/s. Use this to calculate regurgitant orificearea (ROA) in cm2:
The PISA technique should not be used if a clear symmetrical hemispherecannot be obtained or if the jet of mitral regurgitation is eccentric.
Associated features
If mitral regurgitation is present you should:
● assess any coexistent mitral stenosis● assess any coexistent disease affecting the other valves (as patients
undergoing mitral valve surgery may also require any other valvularabnormalities to be corrected at the same time)
ROA �Regurgitant flow rate
VMR
Mitral leaflet
Isovelocity shellAliasing velocity� 38.5 cm/s
r
Jet ofmitral regurgitation
Fig. 14.9 The proximal isovelocity surfacearea (PISA) method uses the surface areaof a hemispheric ‘shell’ of uniform velocityand the aliasing velocity to calculateregurgitant flow rate (r � shell radius)

The
mitr
al v
alve
187
● assess LA size – the LA dilates in chronic mitral regurgitation● assess LV dimensions and function● assess the right heart for evidence of pulmonary hypertension, and
comment on right atrial and ventricular size.
Severity of mitral regurgitationSeverity of mitral regurgitation can be assessed by:
● jet area● ratio of jet area to left atrial area● VC width● PISA radius● RV● RF● ROA.
Table 14.4 summarizes the echo indicators of mitral regurgitation severity.
Indirect indicators that point towards more severe mitral regurgitationinclude:
● LA dilatation● LV dilatation/dysfunction● pulmonary vein systolic flow reversal● pulmonary hypertension.
COMMON PITFALLS
Pitfalls in the echo assessment of mitral regurgitation include:
● Measuring regurgitant jet area or VC width on colour Dopplerwith inappropriate colour gain settings.
● Underestimating the severity of eccentric jets on colour Doppler.● Failure to align the Doppler beam with regurgitant flow during
CW Doppler interrogation.● Inaccurate measurement of mitral valve orifice area or LVOT
diameter when calculating RV.● Trying to calculate RV when there is coexistent aortic
regurgitation.● Using the PISA method to assess eccentric jets.● Failure to average several readings when the patient is in AF.
!
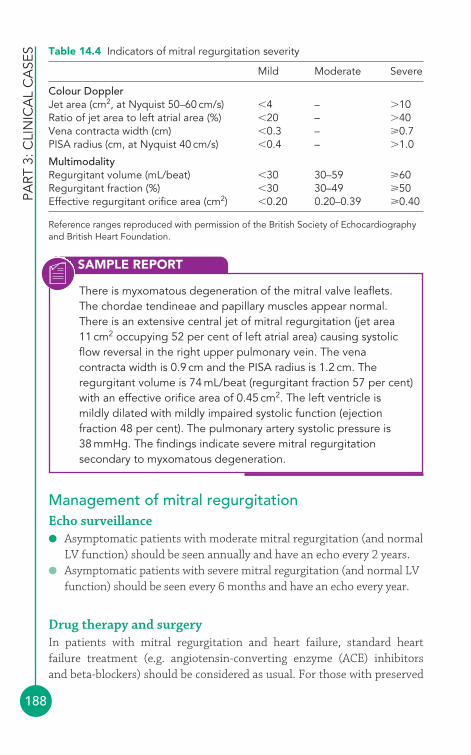
PART
3: C
LIN
ICA
L C
ASE
S
188
Management of mitral regurgitationEcho surveillance● Asymptomatic patients with moderate mitral regurgitation (and normal
LV function) should be seen annually and have an echo every 2 years.● Asymptomatic patients with severe mitral regurgitation (and normal LV
function) should be seen every 6 months and have an echo every year.
Drug therapy and surgeryIn patients with mitral regurgitation and heart failure, standard heartfailure treatment (e.g. angiotensin-converting enzyme (ACE) inhibitors and beta-blockers) should be considered as usual. For those with preserved
Table 14.4 Indicators of mitral regurgitation severity
Mild Moderate Severe
Colour DopplerJet area (cm2, at Nyquist 50–60 cm/s) �4 – �10Ratio of jet area to left atrial area (%) �20 – �40Vena contracta width (cm) �0.3 – 0.7PISA radius (cm, at Nyquist 40 cm/s) �0.4 – �1.0
MultimodalityRegurgitant volume (mL/beat) �30 30–59 60Regurgitant fraction (%) �30 30–49 50Effective regurgitant orifice area (cm2) �0.20 0.20–0.39 0.40
Reference ranges reproduced with permission of the British Society of Echocardiographyand British Heart Foundation.
SAMPLE REPORT
There is myxomatous degeneration of the mitral valve leaflets.The chordae tendineae and papillary muscles appear normal.There is an extensive central jet of mitral regurgitation (jet area11 cm2 occupying 52 per cent of left atrial area) causing systolicflow reversal in the right upper pulmonary vein. The venacontracta width is 0.9 cm and the PISA radius is 1.2 cm. Theregurgitant volume is 74 mL/beat (regurgitant fraction 57 per cent)with an effective orifice area of 0.45 cm2. The left ventricle ismildly dilated with mildly impaired systolic function (ejectionfraction 48 per cent). The pulmonary artery systolic pressure is38 mmHg. The findings indicate severe mitral regurgitationsecondary to myxomatous degeneration.
The
mitr
al v
alve
189
LV function, there is no role for the routine use of drugs. Those with AFshould be treated with anticoagulation.
Where patients require mitral valve surgery, valve repair is, where feasible,generally considered superior to valve replacement. For patients with severesymptomatic mitral regurgitation secondary to disease of the mitral leaflets, surgery should be considered if the LV ejection fraction (LVEF) is�30 per cent and the LV end-systolic diameter (LVESD) �5.5 cm. Those withsevere LV dysfunction (LVEF �30 per cent and/or LVESD �5.5 cm) shouldfirst undergo optimization of medical therapy, with surgery considered if thisfails and the likelihood of a durable repair is thought to be good.
In asymptomatic patients, mitral valve surgery should be considered if thereis evidence of any of the following:
● AF● LV dysfunction (LVEF �60 per cent and/or LVESD �4.5 cm)● Pulmonary hypertension (resting pulmonary artery systolic pressure
�50 mmHg).
MITRAL REGURGITATION AND 3-D ECHO
3-D echo is proving to be extremely useful in assessing mitralvalve disease and in planning surgery. It offers more accuratevisualisation and measurement of valve orifice area in mitralstenosis, and better assessment of the geometry of the mitralvalve apparatus in assessing the cause of mitral regurgitation.Combining 3-D echo with colour Doppler is helpful in determiningthe origin and direction of regurgitant jets.
i
Ischaemic mitral regurgitationRupture of a papillary muscle following acute myocardial infarction requiresurgent stabilization (intra-aortic balloon pump and vasodilators) followedby urgent surgery. In chronic ischaemic mitral regurgitation, it is generallyagreed that severe regurgitation should be corrected at the time of coronaryartery bypass surgery. In moderate ischaemic regurgitation the managementstrategies are more controversial.
PART
3: C
LIN
ICA
L C
ASE
S
190
Functional mitral regurgitationDrug therapy is the mainstay of treatment in functional mitral regurgitationsecondary to cardiomyopathy, although mitral valve surgery (in combinationwith LV reconstruction) may be considered in those with severe functionalregurgitation and severely impaired LV function.
FURTHER READING
Grayburn PA. How to measure severity of mitral regurgitation.Heart 2008; 94: 376–83.
Khattar R. British Society of Echocardiography Distance LearningModule 7: Mitral Stenosis. Accessible from the BSE website(www.bsecho.org).
Otto CM. Timing of surgery in mitral regurgitation. Heart 2003;89: 100–5.
Prendergast BD, Shaw TRD, Iung B, et al. Contemporary criteriafor the selection of patients for percutaneous balloon mitralvalvuloplasty. Heart 2002; 87: 401–4.
The Task Force on the Management of Valvular Heart Disease ofthe European Society of Cardiology. Guidelines on themanagement of valvular heart disease. Eur Heart J 2007; 28:230–68.
Wilkins GT, Weyman AE, Abascal VM, et al. Percutaneous balloondilatation of the mitral valve: an analysis of echocardiographicvariables related to outcome and the mechanism of dilatation.Br Heart J 1988; 60: 299–308.
Zoghbi WA, Enriquez-Sarano M, Foster E, et al. 2003. AmericanSociety of Echocardiography: Recommendations for evaluationof the severity of native valvular regurgitation with two-dimensional and Doppler echocardiography. J Am SocEchocardiogr 2003; 16: 777–802.
191
4
The right heart tends to be a relatively neglected part of the standardtransthoracic echo study, because:
● much of the right heart lies behind the sternum, making it difficult toimage using ultrasound
● the anatomy and orientation of the right heart is relatively complex,compared with the left
● the right ventricle (RV) is trabeculated, which makes accuratemeasurements difficult.
Nonetheless, an assessment of right heart dimensions and function is anessential part of the standard echo study, not only to detect primary rightheart disorders but also because right heart size and function can reveal agreat deal about disorders affecting other parts of the heart (e.g. mitral valvedisease, atrial septal defect (ASD)).
● Right atriumThe right atrium (RA) receives venous blood returning from the upper body(via the superior vena cava, SVC), the lower body (via the inferior vena cava,IVC) and also from the myocardium (via the coronary sinus). It can best beseen in:
● parasternal RV inflow view (Fig. 6.3, p. 57)● parasternal short axis view (aortic valve level) (Fig. 6.5, p. 60)● apical 4-chamber view (Fig. 6.8, p. 63)● subcostal view (Fig. 6.12, p. 67).
The right heart4
15
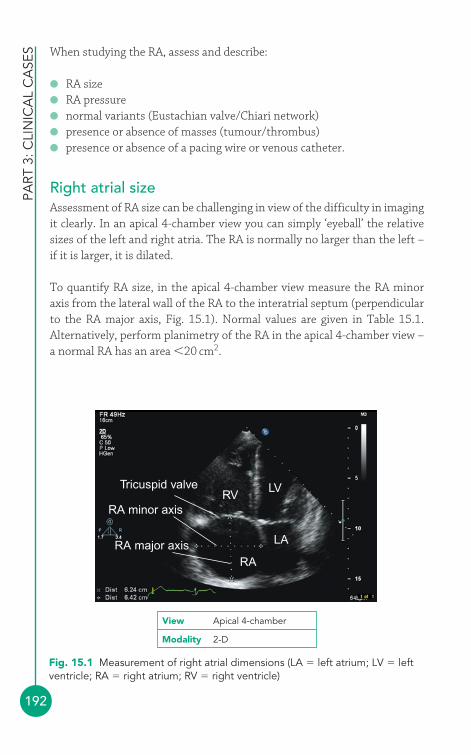
PART
3: C
LIN
ICA
L C
ASE
S
192
When studying the RA, assess and describe:
● RA size● RA pressure● normal variants (Eustachian valve/Chiari network)● presence or absence of masses (tumour/thrombus)● presence or absence of a pacing wire or venous catheter.
Right atrial sizeAssessment of RA size can be challenging in view of the difficulty in imagingit clearly. In an apical 4-chamber view you can simply ‘eyeball’ the relativesizes of the left and right atria. The RA is normally no larger than the left –if it is larger, it is dilated.
To quantify RA size, in the apical 4-chamber view measure the RA minoraxis from the lateral wall of the RA to the interatrial septum (perpendicularto the RA major axis, Fig. 15.1). Normal values are given in Table 15.1.Alternatively, perform planimetry of the RA in the apical 4-chamber view –a normal RA has an area �20 cm2.
Tricuspid valveRV
LV
LA
RA
RA minor axis
RA major axis
Fig. 15.1 Measurement of right atrial dimensions (LA � left atrium; LV � leftventricle; RA � right atrium; RV � right ventricle)
View Apical 4-chamber
Modality 2-D

The
right
hea
rt
193
RA dilatation can result from RA pressure overload (e.g. pulmonary hyper-tension, restrictive cardiomyopathy, tricuspid stenosis), RA volume overload(e.g. tricuspid regurgitation, ASD) and chronic atrial fibrillation (AF).
Right atrial pressureThere are a number of ways of assessing RA pressure (RAP):
1. The RAP can be gauged by examining the patient’s neck to assess theirjugular venous pressure (JVP) – with the patient reclining supine at 45°,the height of the JVP above the sternal angle (in cm) is the same as RAP(in mmHg). However, the height of the JVP can be tricky to assess,particularly if the JVP is not clearly visible or if it is very high or low.
2. A ‘constant’ value of 10 mmHg can be ‘assumed’ as the RAP. However,RAP does vary, and so using a ‘constant’ value is rather a bluntinstrument and can be potentially misleading.
3. The best approach is to estimate RAP using the IVC. In the subcostalwindow, look at the IVC and measure its diameter in both expiration andinspiration (Fig. 15.2). Normally the IVC measures 1.5–2.5 cm indiameter and decreases by �50 per cent in inspiration. The data in Table 15.2 will allow you to place an approximate value on RAP.
For example, if the IVC measures 2.8 cm in expiration and 1.8 cm ininspiration, a reduction of 36 per cent, the RAP would be estimated at15–20 mmHg.
Another indicator of RAP is RA size, which is usually normal when RAP is�10 mmHg, but becomes dilated at pressures above this (and, in general,the higher the RAP, the greater the dilatation). Similarly, the hepatic veinsbecome increasingly dilated as RAP rises above 15 mmHg.
Eustachian valve and Chiari networkWhere the IVC enters the RA there is often an embryological remnant, theEustachian valve, which in fetal life directs oxygenated blood away from
Table 15.1 Assessment of right atrial (RA) size
Mildly Moderately Severely Normal dilated dilated dilated
RA minor axis (cm) 2.9–4.5 4.6–4.9 5.0–5.4 5.5RA minor axis/BSA (cm/m2) 1.7–2.5 2.6–2.8 2.9–3.1 3.2
Reprinted from Journal of the American Society of Echocardiography, 18, Lang RM, Bierig M,Devereux RB, et al., Recommendations for chamber quantification, 1440–63, © 2005, withpermission from Elsevier.
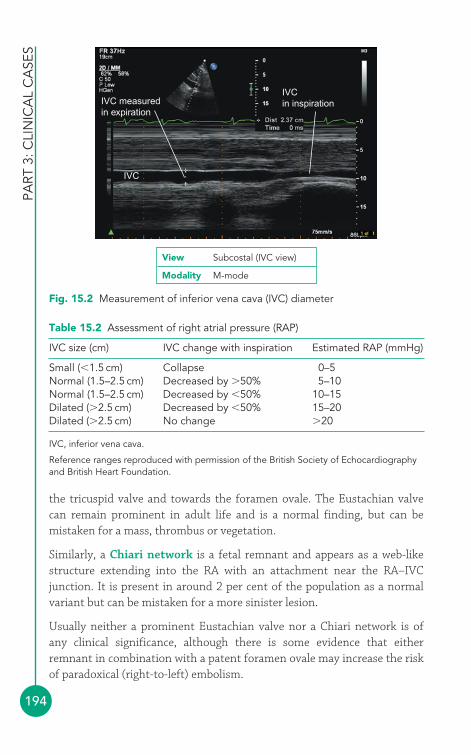
PART
3: C
LIN
ICA
L C
ASE
S
194
the tricuspid valve and towards the foramen ovale. The Eustachian valvecan remain prominent in adult life and is a normal finding, but can bemistaken for a mass, thrombus or vegetation.
Similarly, a Chiari network is a fetal remnant and appears as a web-likestructure extending into the RA with an attachment near the RA–IVCjunction. It is present in around 2 per cent of the population as a normalvariant but can be mistaken for a more sinister lesion.
Usually neither a prominent Eustachian valve nor a Chiari network is of any clinical significance, although there is some evidence that eitherremnant in combination with a patent foramen ovale may increase the riskof paradoxical (right-to-left) embolism.
IVC measuredin expiration
IVC
IVCin inspiration
Fig. 15.2 Measurement of inferior vena cava (IVC) diameter
View Subcostal (IVC view)
Modality M-mode
Table 15.2 Assessment of right atrial pressure (RAP)
IVC size (cm) IVC change with inspiration Estimated RAP (mmHg)
Small (�1.5 cm) Collapse 0–5Normal (1.5–2.5 cm) Decreased by �50% 5–10Normal (1.5–2.5 cm) Decreased by �50% 10–15Dilated (�2.5 cm) Decreased by �50% 15–20Dilated (�2.5 cm) No change �20
IVC, inferior vena cava.
Reference ranges reproduced with permission of the British Society of Echocardiographyand British Heart Foundation.
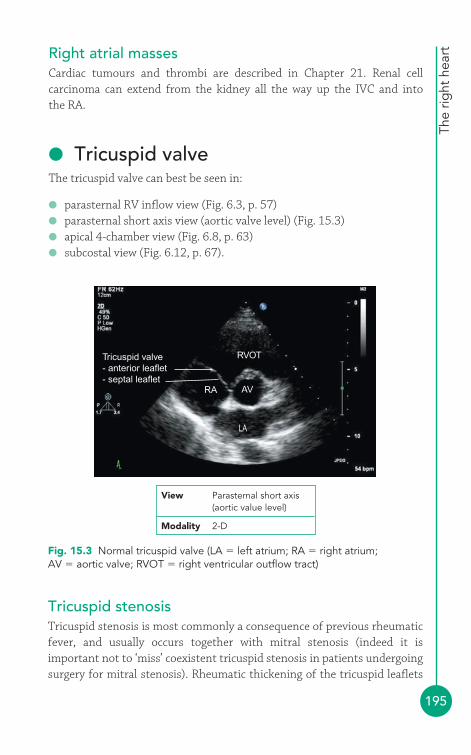
The
right
hea
rt
195
Right atrial massesCardiac tumours and thrombi are described in Chapter 21. Renal cellcarcinoma can extend from the kidney all the way up the IVC and into the RA.
● Tricuspid valveThe tricuspid valve can best be seen in:
● parasternal RV inflow view (Fig. 6.3, p. 57)● parasternal short axis view (aortic valve level) (Fig. 15.3)● apical 4-chamber view (Fig. 6.8, p. 63)● subcostal view (Fig. 6.12, p. 67).
Tricuspid valve- anterior leaflet- septal leaflet
RVOT
AVRA
LA
View Parasternal short axis(aortic value level)
Modality 2-D
Fig. 15.3 Normal tricuspid valve (LA � left atrium; RA � right atrium;AV � aortic valve; RVOT � right ventricular outflow tract)
Tricuspid stenosisTricuspid stenosis is most commonly a consequence of previous rheumaticfever, and usually occurs together with mitral stenosis (indeed it isimportant not to ‘miss’ coexistent tricuspid stenosis in patients undergoingsurgery for mitral stenosis). Rheumatic thickening of the tricuspid leaflets
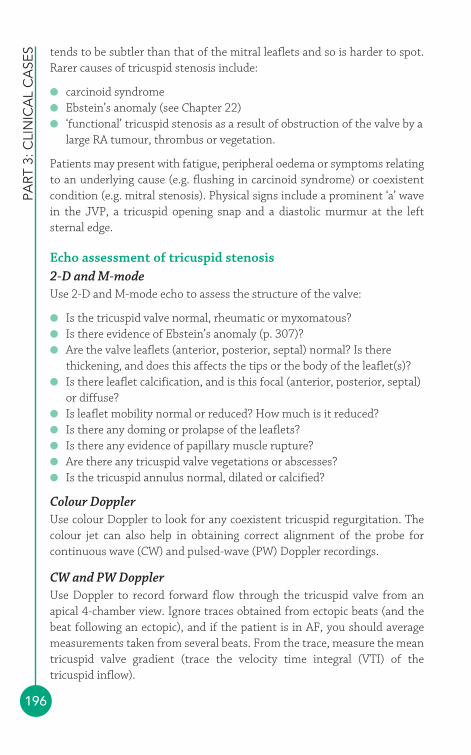
PART
3: C
LIN
ICA
L C
ASE
S
196
tends to be subtler than that of the mitral leaflets and so is harder to spot.Rarer causes of tricuspid stenosis include:
● carcinoid syndrome● Ebstein’s anomaly (see Chapter 22)● ‘functional’ tricuspid stenosis as a result of obstruction of the valve by a
large RA tumour, thrombus or vegetation.
Patients may present with fatigue, peripheral oedema or symptoms relatingto an underlying cause (e.g. flushing in carcinoid syndrome) or coexistentcondition (e.g. mitral stenosis). Physical signs include a prominent ‘a’ wavein the JVP, a tricuspid opening snap and a diastolic murmur at the leftsternal edge.
Echo assessment of tricuspid stenosis2-D and M-modeUse 2-D and M-mode echo to assess the structure of the valve:
● Is the tricuspid valve normal, rheumatic or myxomatous?● Is there evidence of Ebstein’s anomaly (p. 307)?● Are the valve leaflets (anterior, posterior, septal) normal? Is there
thickening, and does this affects the tips or the body of the leaflet(s)?● Is there leaflet calcification, and is this focal (anterior, posterior, septal)
or diffuse?● Is leaflet mobility normal or reduced? How much is it reduced?● Is there any doming or prolapse of the leaflets?● Is there any evidence of papillary muscle rupture?● Are there any tricuspid valve vegetations or abscesses?● Is the tricuspid annulus normal, dilated or calcified?
Colour DopplerUse colour Doppler to look for any coexistent tricuspid regurgitation. Thecolour jet can also help in obtaining correct alignment of the probe forcontinuous wave (CW) and pulsed-wave (PW) Doppler recordings.
CW and PW DopplerUse Doppler to record forward flow through the tricuspid valve from anapical 4-chamber view. Ignore traces obtained from ectopic beats (and thebeat following an ectopic), and if the patient is in AF, you should averagemeasurements taken from several beats. From the trace, measure the meantricuspid valve gradient (trace the velocity time integral (VTI) of thetricuspid inflow).
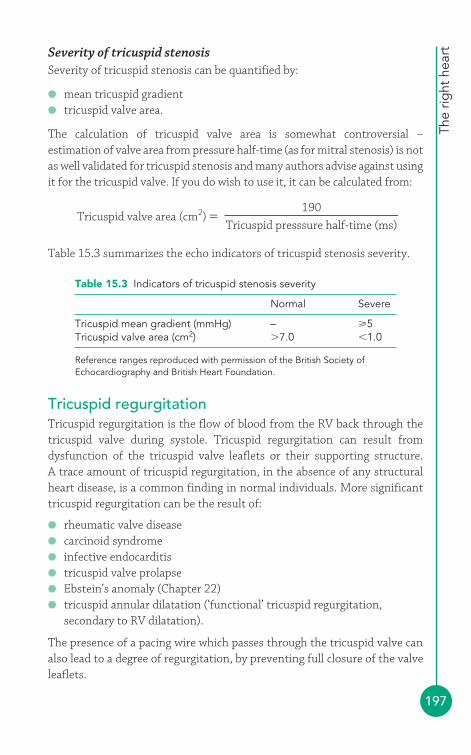
The
right
hea
rt
197
Severity of tricuspid stenosisSeverity of tricuspid stenosis can be quantified by:
● mean tricuspid gradient● tricuspid valve area.
The calculation of tricuspid valve area is somewhat controversial –estimation of valve area from pressure half-time (as for mitral stenosis) is notas well validated for tricuspid stenosis and many authors advise against usingit for the tricuspid valve. If you do wish to use it, it can be calculated from:
Table 15.3 summarizes the echo indicators of tricuspid stenosis severity.
Tricuspid valve area (cm2) �Tricuspid presssure half-time (ms)
190
Table 15.3 Indicators of tricuspid stenosis severity
Normal Severe
Tricuspid mean gradient (mmHg) – 5Tricuspid valve area (cm2) �7.0 �1.0
Reference ranges reproduced with permission of the British Society ofEchocardiography and British Heart Foundation.
Tricuspid regurgitationTricuspid regurgitation is the flow of blood from the RV back through thetricuspid valve during systole. Tricuspid regurgitation can result fromdysfunction of the tricuspid valve leaflets or their supporting structure. A trace amount of tricuspid regurgitation, in the absence of any structuralheart disease, is a common finding in normal individuals. More significanttricuspid regurgitation can be the result of:
● rheumatic valve disease● carcinoid syndrome● infective endocarditis● tricuspid valve prolapse● Ebstein’s anomaly (Chapter 22)● tricuspid annular dilatation (‘functional’ tricuspid regurgitation,
secondary to RV dilatation).
The presence of a pacing wire which passes through the tricuspid valve canalso lead to a degree of regurgitation, by preventing full closure of the valveleaflets.
PART
3: C
LIN
ICA
L C
ASE
S
198
CARCINOID SYNDROME AND THE HEART
Carcinoid tumours are rare and usually arise in the gastrointestinalsystem. If they metastasize they can produce the carcinoidsyndrome, in which secretion of vasoactive substances such as 5-hydroxytryptamine causes flushing, diarrhoea and bronchospasm.These substances can also affect the heart, leading to thedevelopment of fibrous endocardial plaques, typically on the right-sided valves and chambers. The tricuspid and pulmonary valveleaflets characteristically become shortened and thickened, leadingto stenosis and/or regurgitation and ultimately right heart failure.
i
Significant tricuspid regurgitation can cause symptoms and signs of right-sided heart failure, with a prominent V wave in the jugular venous pressure,peripheral oedema, ascites and a distended pulsatile liver.
Echo assessment of tricuspid regurgitation2-D and M-modeUse 2-D and M-mode echo to assess the structure of the valve as describedfor tricuspid stenosis (above). Remember to look at the whole valveapparatus (tricuspid annulus, papillary muscles and chordae), not just the leaflets.
Colour DopplerUse colour Doppler to examine the jet of tricuspid regurgitation in theparasternal and apical (Fig. 15.4) views. Describe:
● the extent of the regurgitant jet within the RA (trace the area of the jetin the apical 4-chamber view)
● the position of the jet in relation to the tricuspid leaflets (e.g. centraljet, or evidence of regurgitation through a leaflet perforation)
● the direction of travel of the regurgitant jet within the atrium (centralor directed towards the interatrial septum or the RA free wall).
Measure the width of the vena contracta (VC) – the narrowest region ofcolour flow at the level of the tricuspid valve – in the apical 4-chamber viewand with the Nyquist limit set at 50–60 cm/s.
CW and PW DopplerRecord the CW Doppler trace with the probe carefully aligned with thedirection of the regurgitant jet (Fig. 15.5). The CW Doppler trace is soft in
The
right
hea
rt
199
Tricuspidregurgitation
Fig. 15.5 Moderate tricuspid regurgitation (TR), showing measurement ofpeak velocity (TR Vmax) (PG � pressure gradient)
View Parasternal rightventricular inflow
Modality CW Doppler
mild tricuspid regurgitation and denser in moderate or severe regurgitation.Look at the contour of the regurgitant jet – in mild tricuspid regurgitationthe shape of the waveform is parabolic, but in severe regurgitation the shapebecomes more triangular with an early peak.
Tricuspid regurgitationLV
RV
RA
LA
Fig. 15.4 Severe tricuspid regurgitation (LA � left atrium; RA � right atrium;LV � left ventricle; RV � right ventricle)
View Apical 4-chamber
Modality Colour Doppler
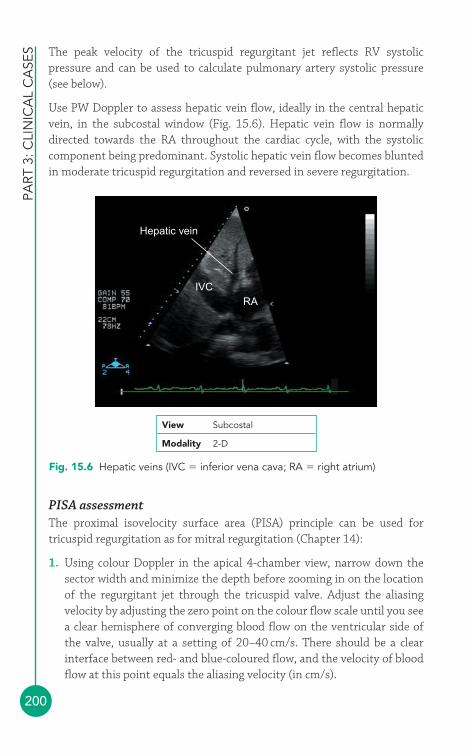
PART
3: C
LIN
ICA
L C
ASE
S
200
The peak velocity of the tricuspid regurgitant jet reflects RV systolicpressure and can be used to calculate pulmonary artery systolic pressure(see below).
Use PW Doppler to assess hepatic vein flow, ideally in the central hepaticvein, in the subcostal window (Fig. 15.6). Hepatic vein flow is normallydirected towards the RA throughout the cardiac cycle, with the systoliccomponent being predominant. Systolic hepatic vein flow becomes bluntedin moderate tricuspid regurgitation and reversed in severe regurgitation.
Hepatic vein
IVCRA
Fig. 15.6 Hepatic veins (IVC � inferior vena cava; RA � right atrium)
View Subcostal
Modality 2-D
PISA assessmentThe proximal isovelocity surface area (PISA) principle can be used fortricuspid regurgitation as for mitral regurgitation (Chapter 14):
1. Using colour Doppler in the apical 4-chamber view, narrow down thesector width and minimize the depth before zooming in on the locationof the regurgitant jet through the tricuspid valve. Adjust the aliasingvelocity by adjusting the zero point on the colour flow scale until you seea clear hemisphere of converging blood flow on the ventricular side ofthe valve, usually at a setting of 20–40 cm/s. There should be a clearinterface between red- and blue-coloured flow, and the velocity of bloodflow at this point equals the aliasing velocity (in cm/s).
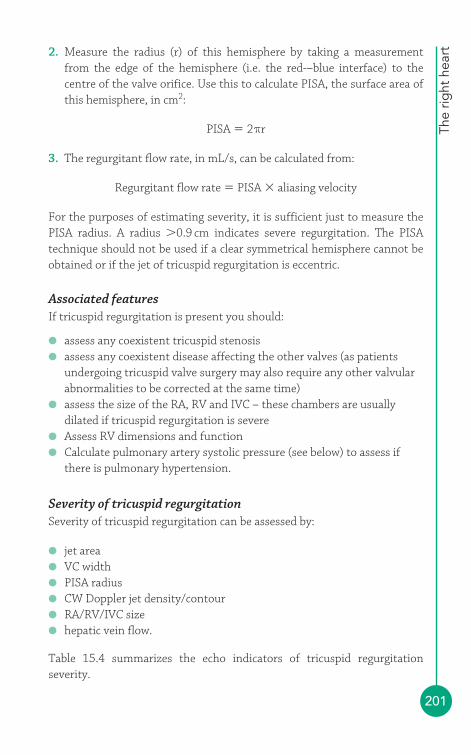
The
right
hea
rt
201
2. Measure the radius (r) of this hemisphere by taking a measurement from the edge of the hemisphere (i.e. the red-–blue interface) to thecentre of the valve orifice. Use this to calculate PISA, the surface area ofthis hemisphere, in cm2:
PISA � 2πr
3. The regurgitant flow rate, in mL/s, can be calculated from:
Regurgitant flow rate � PISA � aliasing velocity
For the purposes of estimating severity, it is sufficient just to measure thePISA radius. A radius �0.9 cm indicates severe regurgitation. The PISAtechnique should not be used if a clear symmetrical hemisphere cannot beobtained or if the jet of tricuspid regurgitation is eccentric.
Associated featuresIf tricuspid regurgitation is present you should:
● assess any coexistent tricuspid stenosis● assess any coexistent disease affecting the other valves (as patients
undergoing tricuspid valve surgery may also require any other valvularabnormalities to be corrected at the same time)
● assess the size of the RA, RV and IVC – these chambers are usuallydilated if tricuspid regurgitation is severe
● Assess RV dimensions and function● Calculate pulmonary artery systolic pressure (see below) to assess if
there is pulmonary hypertension.
Severity of tricuspid regurgitationSeverity of tricuspid regurgitation can be assessed by:
● jet area● VC width● PISA radius● CW Doppler jet density/contour● RA/RV/IVC size● hepatic vein flow.
Table 15.4 summarizes the echo indicators of tricuspid regurgitationseverity.
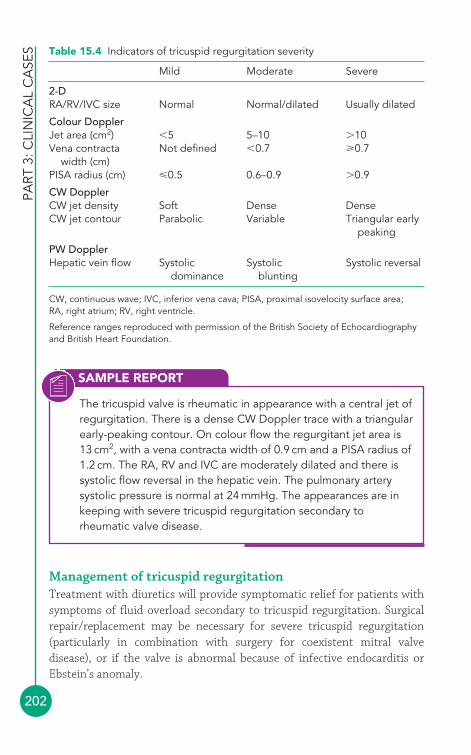
PART
3: C
LIN
ICA
L C
ASE
S
202
Management of tricuspid regurgitationTreatment with diuretics will provide symptomatic relief for patients withsymptoms of fluid overload secondary to tricuspid regurgitation. Surgicalrepair/replacement may be necessary for severe tricuspid regurgitation(particularly in combination with surgery for coexistent mitral valvedisease), or if the valve is abnormal because of infective endocarditis orEbstein’s anomaly.
Table 15.4 Indicators of tricuspid regurgitation severity
Mild Moderate Severe
2-DRA/RV/IVC size Normal Normal/dilated Usually dilated
Colour DopplerJet area (cm2) �5 5–10 �10Vena contracta Not defined �0.7 0.7
width (cm)PISA radius (cm) �0.5 0.6–0.9 �0.9
CW DopplerCW jet density Soft Dense DenseCW jet contour Parabolic Variable Triangular early
peaking
PW DopplerHepatic vein flow Systolic Systolic Systolic reversal
dominance blunting
CW, continuous wave; IVC, inferior vena cava; PISA, proximal isovelocity surface area; RA, right atrium; RV, right ventricle.
Reference ranges reproduced with permission of the British Society of Echocardiographyand British Heart Foundation.
SAMPLE REPORT
The tricuspid valve is rheumatic in appearance with a central jet ofregurgitation. There is a dense CW Doppler trace with a triangularearly-peaking contour. On colour flow the regurgitant jet area is13 cm2, with a vena contracta width of 0.9 cm and a PISA radius of1.2 cm. The RA, RV and IVC are moderately dilated and there issystolic flow reversal in the hepatic vein. The pulmonary arterysystolic pressure is normal at 24 mmHg. The appearances are inkeeping with severe tricuspid regurgitation secondary torheumatic valve disease.

The
right
hea
rt
203
● Right ventricleThe RV can be challenging to assess by echo because of its shape andextensive trabeculation. The RV can best be seen in:
● parasternal long axis view (Fig. 6.2, p. 56)● parasternal RV inflow view (Fig. 6.3, p. 57)● parasternal RV outflow view (Fig. 6.4, p. 58)● parasternal short axis view (aortic valve level) (Fig. 6.5, p. 60)● parasternal short axis view (mitral valve level) (Fig. 6.6, p. 61)● parasternal short axis view (papillary muscle level) (Fig. 6.7, p. 61)● apical 4-chamber view (Fig. 6.8, p. 63)● subcostal long axis view (Fig. 6.12, p. 67).
An RV assessment should include:
● RV dimensions� cavity size� wall thickness
● global systolic function● regional systolic function● RV masses or thrombus (see Chapter 21).
Right ventricular dimensionsAssessment of RV dimensions is commonly made qualitatively by ‘eyeball’,particularly in the apical 4-chamber view. In this view, the RV is normallyaround two-thirds the size of the left ventricle (LV); if the two ventriclesappear to be the same size, the RV is dilated.
RV size can also be assessed quantitatively, and because of its complexmorphology it is possible to obtain RV diameters from several differentpoints. Use 2-D imaging to take measurements at end-diastole as follows:
● apical 4-chamber view (Fig. 15.7)� basal RV diameter (RVD1)� mid RV diameter (RVD2)� RV base-to-apex (long axis) length (RVD3)
● parasternal short axis view – aortic valve level (Fig. 15.8)� RV outflow tract (RVOT) diameter at aortic valve (AV) level
(RVOT1)� RVOT diameter at pulmonary valve (PV) annulus level (RVOT2)� main pulmonary artery diameter (PA1).

PART
3: C
LIN
ICA
L C
ASE
S
204
RVD3(base to apex)
RVD2(mid RV)
RVD1(basal RV)
LARA
LV
View Apical 4-chamber
Modality 2-D
Fig. 15.7 Measurement of right ventricular dimensions (RVD) in apical 4-chamber view (LA � left atrium; RA � right atrium; LV � left ventricle)
RVOT1(aortic valve level)
RVOT2(pulmonary valve annulus)
PA1(main pulmonary artery)
AV
LA
RA
View Parasternal short axis (aortic valve level)
Modality 2-D
Fig. 15.8 Measurement of right ventricular dimensions in parasternal shortaxis view (AV � aortic valve; LA � left atrium; PA1 � main pulmonary arterydiameter; RA � right atrium; RVOT � right ventricular outflow tract)
The reference ranges for RV, RVOT and PA dimensions are listed in Table 15.5.
The
right
hea
rt
205
The thickness of the RV wall is ideally measured, at end-diastole, from theanterior wall of the RVOT in the parasternal long axis view (Fig. 15.9), oralternatively using the RV wall in the subcostal view. The normal RV wallthickness is �5 mm.
Table 15.5 RV, RVOT and PA dimensions – reference ranges
Normal Mild Moderate Severe
Apical 4-chamber viewBasal RV diameter (RVD1) (cm) 2.0–2.8 2.9–3.3 3.4–3.8 3.9Mid RV diameter (RVD2) (cm) 2.7–3.3 3.4–3.7 3.8–4.1 4.2Base-to-apex length (RVD3) (cm) 7.1–7.9 8.0–8.5 8.6–9.1 9.2
Parasternal short axis viewRVOT at AV level (RVOT1) (cm) 2.5–2.9 3.0–3.2 3.3–3.5 3.6RVOT at PV annulus (RVOT2) (cm) 1.7–2.3 2.4–2.7 2.8–3.1 3.2Main PA (PA1) (cm) 1.5–2.1 2.2–2.5 2.6–2.9 3.0
PA, pulmonary artery; PV, pulmonary valve; RV, right ventricle; RVOT, right ventricular outflowtract.
Reference ranges reproduced with permission of the British Society of Echocardiographyand British Heart Foundation.
RVOT anterior wall
RVOT
Ao
LA
LV
View Parasternal long axis
Modality 2-D
Fig. 15.9 Assessment of the right ventricular outflow tract (RVOT) anterior wall(Ao � aorta; LA � left atrium; LV � left ventricle)
RV area can be measured in the apical 4-chamber view, tracing around theendocardial border to obtain an outline of the cavity area. Area should bemeasured at end-diastole and end-systole to allow quantitative assessment
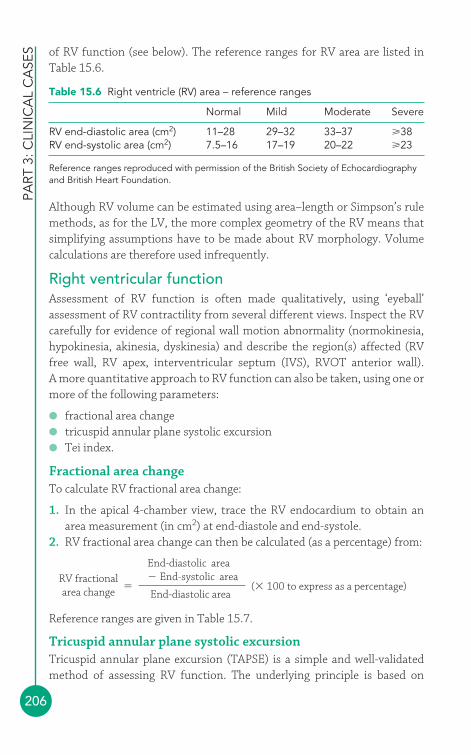
PART
3: C
LIN
ICA
L C
ASE
S
206
of RV function (see below). The reference ranges for RV area are listed inTable 15.6.
Table 15.6 Right ventricle (RV) area – reference ranges
Normal Mild Moderate Severe
RV end-diastolic area (cm2) 11–28 29–32 33–37 38RV end-systolic area (cm2) 7.5–16 17–19 20–22 23
Reference ranges reproduced with permission of the British Society of Echocardiographyand British Heart Foundation.
Although RV volume can be estimated using area–length or Simpson’s rulemethods, as for the LV, the more complex geometry of the RV means thatsimplifying assumptions have to be made about RV morphology. Volumecalculations are therefore used infrequently.
Right ventricular functionAssessment of RV function is often made qualitatively, using ‘eyeball’assessment of RV contractility from several different views. Inspect the RVcarefully for evidence of regional wall motion abnormality (normokinesia,hypokinesia, akinesia, dyskinesia) and describe the region(s) affected (RVfree wall, RV apex, interventricular septum (IVS), RVOT anterior wall). A more quantitative approach to RV function can also be taken, using one ormore of the following parameters:
● fractional area change● tricuspid annular plane systolic excursion● Tei index.
Fractional area changeTo calculate RV fractional area change:
1. In the apical 4-chamber view, trace the RV endocardium to obtain anarea measurement (in cm2) at end-diastole and end-systole.
2. RV fractional area change can then be calculated (as a percentage) from:
Reference ranges are given in Table 15.7.
Tricuspid annular plane systolic excursionTricuspid annular plane excursion (TAPSE) is a simple and well-validatedmethod of assessing RV function. The underlying principle is based on
End-diastolic area� End-systolic areaRV fractional
area change End-diastolic area � (� 100 to express as a percentage)
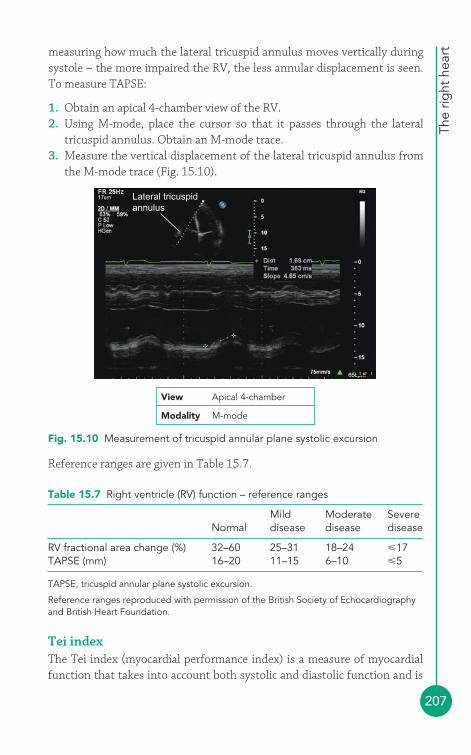
The
right
hea
rt
207
measuring how much the lateral tricuspid annulus moves vertically duringsystole – the more impaired the RV, the less annular displacement is seen.To measure TAPSE:
1. Obtain an apical 4-chamber view of the RV.2. Using M-mode, place the cursor so that it passes through the lateral
tricuspid annulus. Obtain an M-mode trace.3. Measure the vertical displacement of the lateral tricuspid annulus from
the M-mode trace (Fig. 15.10).
Reference ranges are given in Table 15.7.
Lateral tricuspidannulus
View Apical 4-chamber
Modality M-mode
Fig. 15.10 Measurement of tricuspid annular plane systolic excursion
Table 15.7 Right ventricle (RV) function – reference ranges
Mild Moderate SevereNormal disease disease disease
RV fractional area change (%) 32–60 25–31 18–24 �17TAPSE (mm) 16–20 11–15 6–10 �5
TAPSE, tricuspid annular plane systolic excursion.
Reference ranges reproduced with permission of the British Society of Echocardiographyand British Heart Foundation.
Tei indexThe Tei index (myocardial performance index) is a measure of myocardialfunction that takes into account both systolic and diastolic function and is
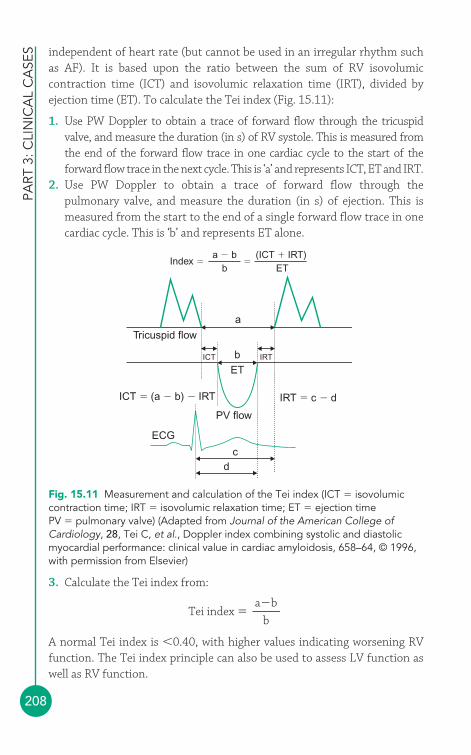
PART
3: C
LIN
ICA
L C
ASE
S
208
independent of heart rate (but cannot be used in an irregular rhythm suchas AF). It is based upon the ratio between the sum of RV isovolumiccontraction time (ICT) and isovolumic relaxation time (IRT), divided byejection time (ET). To calculate the Tei index (Fig. 15.11):
1. Use PW Doppler to obtain a trace of forward flow through the tricuspid valve, and measure the duration (in s) of RV systole. This is measured fromthe end of the forward flow trace in one cardiac cycle to the start of theforward flow trace in the next cycle. This is ‘a’ and represents ICT, ET and IRT.
2. Use PW Doppler to obtain a trace of forward flow through thepulmonary valve, and measure the duration (in s) of ejection. This ismeasured from the start to the end of a single forward flow trace in onecardiac cycle. This is ‘b’ and represents ET alone.
3. Calculate the Tei index from:
A normal Tei index is �0.40, with higher values indicating worsening RVfunction. The Tei index principle can also be used to assess LV function aswell as RV function.
Tei index �a�b
b
Index � �a � b
b(ICT � IRT)
ET
Tricuspid flow
ICT IRT
a
bET
ICT � (a � b) � IRT IRT � c � d
PV flow
ECG
cd
Fig. 15.11 Measurement and calculation of the Tei index (ICT � isovolumiccontraction time; IRT � isovolumic relaxation time; ET � ejection timePV � pulmonary valve) (Adapted from Journal of the American College ofCardiology, 28, Tei C, et al., Doppler index combining systolic and diastolicmyocardial performance: clinical value in cardiac amyloidosis, 658–64, © 1996,with permission from Elsevier)
The
right
hea
rt
209
● Pulmonary valveThe pulmonary valve can best be seen in:
● parasternal RV outflow view (Fig. 6.4, p. 58)● parasternal short axis view (aortic valve level) (Fig. 6.5, p. 60)● subcostal short axis view.
Beyond the pulmonary valve it is possible to visualize the main pulmonaryartery (‘pulmonary trunk’), sometimes to the point of its bifurcation intoleft and right pulmonary arteries (often best seen in the parasternal RVoutflow view).
Pulmonary stenosisPulmonary stenosis is most commonly a congenital defect, often presentingin infancy or childhood, although it can also result from previous rheumaticfever or from carcinoid syndrome (see above).
Patients are often asymptomatic and are diagnosed when an incidental heartmurmur is found during examination. Symptomatic patients may havefatigue, breathlessness, presyncope/syncope, symptoms of RV dysfunctionor symptoms relating to an underlying cause (e.g. flushing in carcinoidsyndrome), or cyanosis (when there is a coexistent right-to-left shunt).Physical signs include a widely split second heart sound and an ejectionsystolic murmur in the pulmonary area, and in severe stenosis there may be evidence of RV hypertrophy.
VOLUME AND PRESSURE OVERLOAD
Assessing the IVS in the parasternal short axis view can provideuseful information about RV haemodynamics. Normally septalmotion is dominated by the LV, and the septum bulges towardsthe RV in the short axis views. If the RV is overloaded this septalbulge starts to flatten, and in the short axis views this gives the LVa ‘D’ shape rather than its usual circular appearance. In thepresence of chronic RV volume overload (e.g. severe tricuspidregurgitation), the RV is dilated and the septum is pushed towardsthe LV in diastole. In RV pressure overload (e.g. severe pulmonaryhypertension), the RV is hypertrophied and the septum is pushedtowards the LV in systole. Coexistent volume and pressureoverload will flatten the septum in both systole and diastole.
i
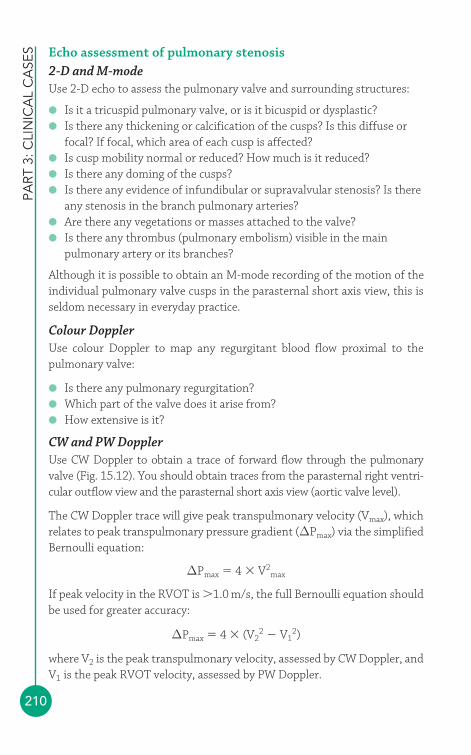
PART
3: C
LIN
ICA
L C
ASE
S
210
Echo assessment of pulmonary stenosis2-D and M-modeUse 2-D echo to assess the pulmonary valve and surrounding structures:
● Is it a tricuspid pulmonary valve, or is it bicuspid or dysplastic?● Is there any thickening or calcification of the cusps? Is this diffuse or
focal? If focal, which area of each cusp is affected?● Is cusp mobility normal or reduced? How much is it reduced?● Is there any doming of the cusps?● Is there any evidence of infundibular or supravalvular stenosis? Is there
any stenosis in the branch pulmonary arteries?● Are there any vegetations or masses attached to the valve?● Is there any thrombus (pulmonary embolism) visible in the main
pulmonary artery or its branches?
Although it is possible to obtain an M-mode recording of the motion of theindividual pulmonary valve cusps in the parasternal short axis view, this isseldom necessary in everyday practice.
Colour DopplerUse colour Doppler to map any regurgitant blood flow proximal to thepulmonary valve:
● Is there any pulmonary regurgitation?● Which part of the valve does it arise from?● How extensive is it?
CW and PW DopplerUse CW Doppler to obtain a trace of forward flow through the pulmonaryvalve (Fig. 15.12). You should obtain traces from the parasternal right ventri-cular outflow view and the parasternal short axis view (aortic valve level).
The CW Doppler trace will give peak transpulmonary velocity (Vmax), whichrelates to peak transpulmonary pressure gradient (ΔPmax) via the simplifiedBernoulli equation:
ΔPmax � 4 � V2max
If peak velocity in the RVOT is �1.0 m/s, the full Bernoulli equation shouldbe used for greater accuracy:
ΔPmax � 4 � (V22 � V1
2)
where V2 is the peak transpulmonary velocity, assessed by CW Doppler, andV1 is the peak RVOT velocity, assessed by PW Doppler.
The
right
hea
rt
211
The mean transpulmonary pressure gradient (ΔPmean) can be obtained bytracing the Doppler envelope, from which the echo machine can calculate amean value by averaging the instantaneous gradients throughout the trace.Calculation of the pulmonary valve effective orifice area is not usuallynecessary, but if it is required then the continuity equation can be used (asfor aortic stenosis, see Chapter 13).
If you suspect infundibular or supravalvular stenosis, use PW Doppler toassess blood flow at different levels above and below the valve to detectwhere the main flow acceleration occurs. If colour Doppler revealspulmonary regurgitation, record a trace using CW Doppler to assess thedensity of the regurgitant signal (more dense � more severe) and also theangle of the downward (deceleration) slope (steeper slope � more severe).
Associated featuresPulmonary stenosis is often associated with other congenital heartdisorders, and so you should look carefully for any other structural heartdefects (e.g. tetralogy of Fallot). In addition:
● assess any coexistent pulmonary regurgitation● assess any coexistent tricuspid valve disease (carcinoid syndrome can
affect both tricuspid and pulmonary valves)
Pulmonary valveforward flow
View Parasternal short axis(aortic valve level)
Modality CW Doppler
Fig. 15.12 Moderate pulmonary stenosis (PG � pressure gradient;PV � pulmonary valve; Vmax � peak velocity; Vmean � mean velocity;VTI � velocity time integral)
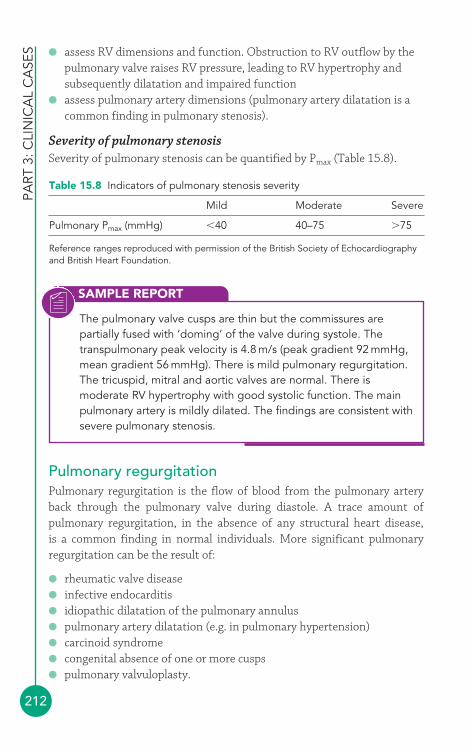
PART
3: C
LIN
ICA
L C
ASE
S
212
● assess RV dimensions and function. Obstruction to RV outflow by thepulmonary valve raises RV pressure, leading to RV hypertrophy andsubsequently dilatation and impaired function
● assess pulmonary artery dimensions (pulmonary artery dilatation is acommon finding in pulmonary stenosis).
Severity of pulmonary stenosisSeverity of pulmonary stenosis can be quantified by Pmax (Table 15.8).
Table 15.8 Indicators of pulmonary stenosis severity
Mild Moderate Severe
Pulmonary Pmax (mmHg) �40 40–75 �75
Reference ranges reproduced with permission of the British Society of Echocardiographyand British Heart Foundation.
SAMPLE REPORT
The pulmonary valve cusps are thin but the commissures arepartially fused with ‘doming’ of the valve during systole. Thetranspulmonary peak velocity is 4.8 m/s (peak gradient 92 mmHg,mean gradient 56 mmHg). There is mild pulmonary regurgitation.The tricuspid, mitral and aortic valves are normal. There ismoderate RV hypertrophy with good systolic function. The mainpulmonary artery is mildly dilated. The findings are consistent withsevere pulmonary stenosis.
Pulmonary regurgitationPulmonary regurgitation is the flow of blood from the pulmonary arteryback through the pulmonary valve during diastole. A trace amount ofpulmonary regurgitation, in the absence of any structural heart disease, is a common finding in normal individuals. More significant pulmonaryregurgitation can be the result of:
● rheumatic valve disease● infective endocarditis● idiopathic dilatation of the pulmonary annulus● pulmonary artery dilatation (e.g. in pulmonary hypertension)● carcinoid syndrome● congenital absence of one or more cusps● pulmonary valvuloplasty.
The
right
hea
rt
213
Significant pulmonary regurgitation leads to RV volume overload and cancause symptoms and signs of right-sided heart failure.
Echo assessment of pulmonary regurgitation2-D and M-modeUse 2-D and M-mode echo to assess the structure of the valve as describedfor pulmonary stenosis (above).
Colour DopplerUse colour Doppler to examine the jet of pulmonary regurgitation anddescribe the jet size. In mild pulmonary regurgitation the jet is narrow(�1.0 cm), whereas in moderate or severe regurgitation the jet is wider.
CW and PW DopplerRecord a CW Doppler trace with the probe carefully aligned with thedirection of the regurgitant jet (Fig. 15.13). The CW Doppler trace is soft in mild pulmonary regurgitation, and denser in moderate or severeregurgitation. Look at the contour of the regurgitant jet – in mildpulmonary regurgitation the deceleration rate of the jet is slow, becomingsteeper with more severe degrees of regurgitation.
Pulmonary regurgitation
View Parasternal short axis(aortic valve level)
Modality Colour and CW Doppler
Fig. 15.13 Pulmonary regurgitation (Figure reproduced with permission ofPhilips)
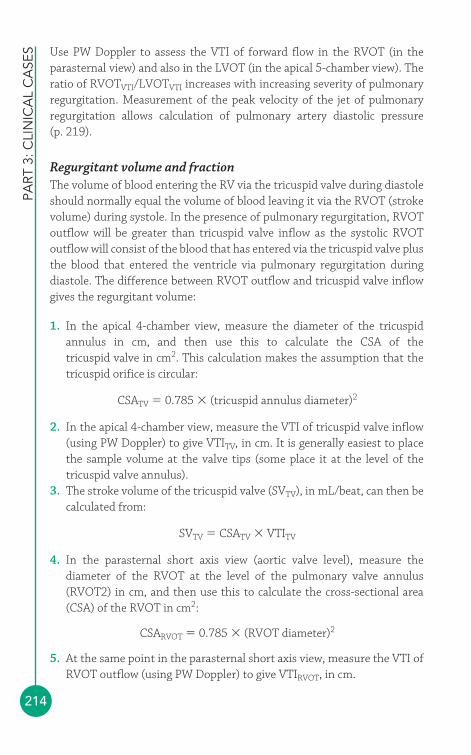
PART
3: C
LIN
ICA
L C
ASE
S
214
Use PW Doppler to assess the VTI of forward flow in the RVOT (in theparasternal view) and also in the LVOT (in the apical 5-chamber view). Theratio of RVOTVTI/LVOTVTI increases with increasing severity of pulmonaryregurgitation. Measurement of the peak velocity of the jet of pulmonaryregurgitation allows calculation of pulmonary artery diastolic pressure (p. 219).
Regurgitant volume and fractionThe volume of blood entering the RV via the tricuspid valve during diastoleshould normally equal the volume of blood leaving it via the RVOT (strokevolume) during systole. In the presence of pulmonary regurgitation, RVOToutflow will be greater than tricuspid valve inflow as the systolic RVOToutflow will consist of the blood that has entered via the tricuspid valve plusthe blood that entered the ventricle via pulmonary regurgitation duringdiastole. The difference between RVOT outflow and tricuspid valve inflowgives the regurgitant volume:
1. In the apical 4-chamber view, measure the diameter of the tricuspidannulus in cm, and then use this to calculate the CSA of the tricuspid valve in cm2. This calculation makes the assumption that thetricuspid orifice is circular:
CSATV � 0.785 � (tricuspid annulus diameter)2
2. In the apical 4-chamber view, measure the VTI of tricuspid valve inflow(using PW Doppler) to give VTITV, in cm. It is generally easiest to placethe sample volume at the valve tips (some place it at the level of thetricuspid valve annulus).
3. The stroke volume of the tricuspid valve (SVTV), in mL/beat, can then becalculated from:
SVTV � CSATV � VTITV
4. In the parasternal short axis view (aortic valve level), measure thediameter of the RVOT at the level of the pulmonary valve annulus(RVOT2) in cm, and then use this to calculate the cross-sectional area(CSA) of the RVOT in cm2:
CSARVOT � 0.785 � (RVOT diameter)2
5. At the same point in the parasternal short axis view, measure the VTI ofRVOT outflow (using PW Doppler) to give VTIRVOT, in cm.

The
right
hea
rt
215
6. The stroke volume of the RVOT (SVRVOT), in mL/beat, can then becalculated from:
SVRVOT � CSARVOT � VTIRVOT
7. Pulmonary regurgitant volume (RV) can be calculated from:
RV � SVRVOT � SVTV
8. Pulmonary regurgitant fraction (RF) can be calculated from:
This measurement is not valid if there is significant tricuspid regurgitation,and any error in measurement of tricuspid valve orifice area or RVOTdiameter can have a large impact on the result.
Associated featuresIf pulmonary regurgitation is present you should:
● assess any coexistent pulmonary stenosis● assess any coexistent disease affecting the other valves● assess RV dimensions and function – the RV may become dilated due
to volume overload if pulmonary regurgitation is severe● assess flow in the pulmonary artery (diastolic flow reversal indicates
severe pulmonary regurgitation)● calculate pulmonary artery systolic and diastolic pressure (see below) to
assess if there is pulmonary hypertension.
Severity of pulmonary regurgitationSeverity of pulmonary regurgitation can be assessed by:
● jet size● RF● CW Doppler jet density● CW Doppler jet deceleration rate● RVOTVTI/LVOTVTI ratio.
Table 15.9 summarizes the echo indicators of pulmonary regurgitationseverity.
RF �RV
(� 100 to express as a percentage)SVTV
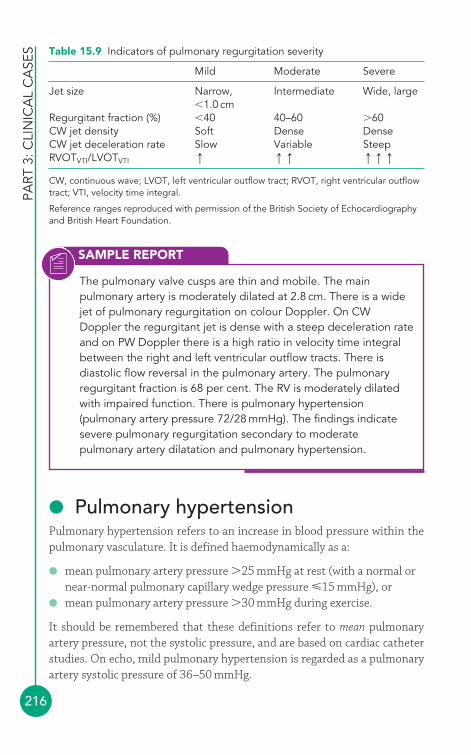
PART
3: C
LIN
ICA
L C
ASE
S
216
● Pulmonary hypertensionPulmonary hypertension refers to an increase in blood pressure within thepulmonary vasculature. It is defined haemodynamically as a:
● mean pulmonary artery pressure �25 mmHg at rest (with a normal ornear-normal pulmonary capillary wedge pressure �15 mmHg), or
● mean pulmonary artery pressure �30 mmHg during exercise.
It should be remembered that these definitions refer to mean pulmonaryartery pressure, not the systolic pressure, and are based on cardiac catheterstudies. On echo, mild pulmonary hypertension is regarded as a pulmonaryartery systolic pressure of 36–50 mmHg.
Table 15.9 Indicators of pulmonary regurgitation severity
Mild Moderate Severe
Jet size Narrow, Intermediate Wide, large�1.0 cm
Regurgitant fraction (%) �40 40–60 �60CW jet density Soft Dense DenseCW jet deceleration rate Slow Variable SteepRVOTVTI/LVOTVTI q qq qqq
CW, continuous wave; LVOT, left ventricular outflow tract; RVOT, right ventricular outflowtract; VTI, velocity time integral.
Reference ranges reproduced with permission of the British Society of Echocardiographyand British Heart Foundation.
SAMPLE REPORT
The pulmonary valve cusps are thin and mobile. The mainpulmonary artery is moderately dilated at 2.8 cm. There is a widejet of pulmonary regurgitation on colour Doppler. On CWDoppler the regurgitant jet is dense with a steep deceleration rateand on PW Doppler there is a high ratio in velocity time integralbetween the right and left ventricular outflow tracts. There isdiastolic flow reversal in the pulmonary artery. The pulmonaryregurgitant fraction is 68 per cent. The RV is moderately dilatedwith impaired function. There is pulmonary hypertension(pulmonary artery pressure 72/28 mmHg). The findings indicatesevere pulmonary regurgitation secondary to moderatepulmonary artery dilatation and pulmonary hypertension.
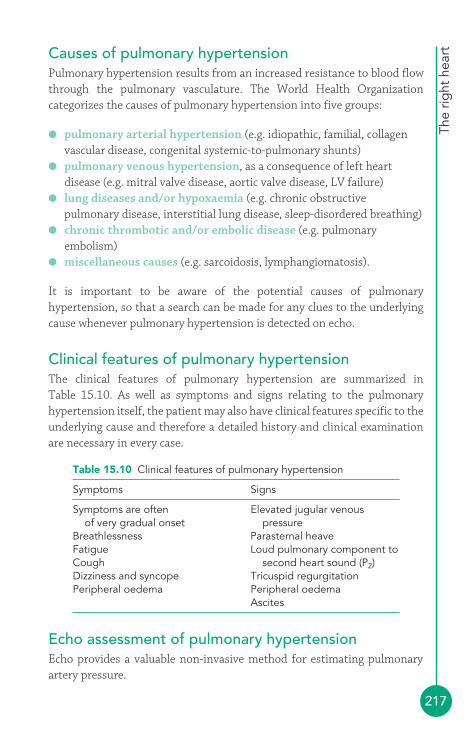
The
right
hea
rt
217
Causes of pulmonary hypertensionPulmonary hypertension results from an increased resistance to blood flowthrough the pulmonary vasculature. The World Health Organizationcategorizes the causes of pulmonary hypertension into five groups:
● pulmonary arterial hypertension (e.g. idiopathic, familial, collagenvascular disease, congenital systemic-to-pulmonary shunts)
● pulmonary venous hypertension, as a consequence of left heartdisease (e.g. mitral valve disease, aortic valve disease, LV failure)
● lung diseases and/or hypoxaemia (e.g. chronic obstructivepulmonary disease, interstitial lung disease, sleep-disordered breathing)
● chronic thrombotic and/or embolic disease (e.g. pulmonaryembolism)
● miscellaneous causes (e.g. sarcoidosis, lymphangiomatosis).
It is important to be aware of the potential causes of pulmonaryhypertension, so that a search can be made for any clues to the underlyingcause whenever pulmonary hypertension is detected on echo.
Clinical features of pulmonary hypertensionThe clinical features of pulmonary hypertension are summarized in Table 15.10. As well as symptoms and signs relating to the pulmonaryhypertension itself, the patient may also have clinical features specific to theunderlying cause and therefore a detailed history and clinical examinationare necessary in every case.
Table 15.10 Clinical features of pulmonary hypertension
Symptoms Signs
Symptoms are often Elevated jugular venous of very gradual onset pressure
Breathlessness Parasternal heaveFatigue Loud pulmonary component toCough second heart sound (P2)Dizziness and syncope Tricuspid regurgitationPeripheral oedema Peripheral oedema
Ascites
Echo assessment of pulmonary hypertensionEcho provides a valuable non-invasive method for estimating pulmonaryartery pressure.
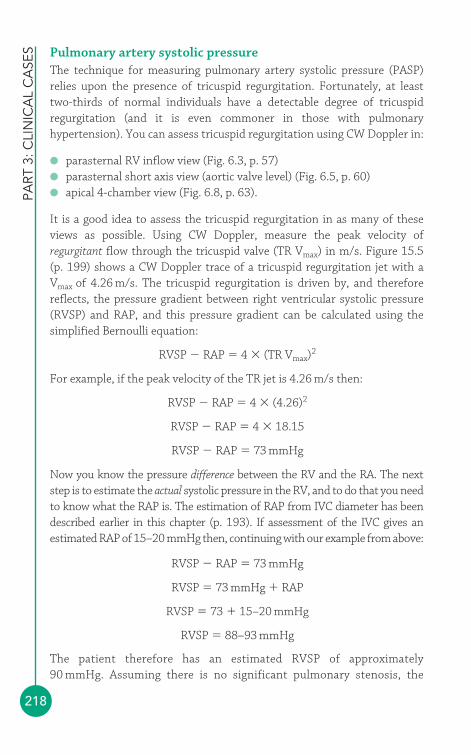
PART
3: C
LIN
ICA
L C
ASE
S
218
Pulmonary artery systolic pressureThe technique for measuring pulmonary artery systolic pressure (PASP)relies upon the presence of tricuspid regurgitation. Fortunately, at leasttwo-thirds of normal individuals have a detectable degree of tricuspidregurgitation (and it is even commoner in those with pulmonaryhypertension). You can assess tricuspid regurgitation using CW Doppler in:
● parasternal RV inflow view (Fig. 6.3, p. 57)● parasternal short axis view (aortic valve level) (Fig. 6.5, p. 60)● apical 4-chamber view (Fig. 6.8, p. 63).
It is a good idea to assess the tricuspid regurgitation in as many of theseviews as possible. Using CW Doppler, measure the peak velocity ofregurgitant flow through the tricuspid valve (TR Vmax) in m/s. Figure 15.5 (p. 199) shows a CW Doppler trace of a tricuspid regurgitation jet with aVmax of 4.26 m/s. The tricuspid regurgitation is driven by, and thereforereflects, the pressure gradient between right ventricular systolic pressure(RVSP) and RAP, and this pressure gradient can be calculated using thesimplified Bernoulli equation:
RVSP � RAP � 4 � (TR Vmax)2
For example, if the peak velocity of the TR jet is 4.26 m/s then:
RVSP � RAP � 4 � (4.26)2
RVSP � RAP � 4 � 18.15
RVSP � RAP � 73 mmHg
Now you know the pressure difference between the RV and the RA. The nextstep is to estimate the actual systolic pressure in the RV, and to do that you needto know what the RAP is. The estimation of RAP from IVC diameter has beendescribed earlier in this chapter (p. 193). If assessment of the IVC gives anestimated RAP of 15–20 mmHg then, continuing with our example from above:
RVSP � RAP � 73 mmHg
RVSP � 73 mmHg � RAP
RVSP � 73 � 15–20 mmHg
RVSP � 88–93 mmHg
The patient therefore has an estimated RVSP of approximately90 mmHg. Assuming there is no significant pulmonary stenosis, the
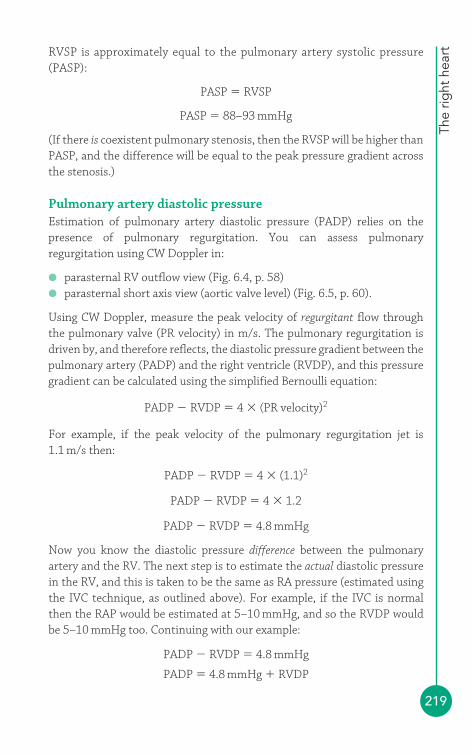
The
right
hea
rt
219
RVSP is approximately equal to the pulmonary artery systolic pressure(PASP):
PASP � RVSP
PASP � 88–93 mmHg
(If there is coexistent pulmonary stenosis, then the RVSP will be higher thanPASP, and the difference will be equal to the peak pressure gradient acrossthe stenosis.)
Pulmonary artery diastolic pressureEstimation of pulmonary artery diastolic pressure (PADP) relies on thepresence of pulmonary regurgitation. You can assess pulmonaryregurgitation using CW Doppler in:
● parasternal RV outflow view (Fig. 6.4, p. 58)● parasternal short axis view (aortic valve level) (Fig. 6.5, p. 60).
Using CW Doppler, measure the peak velocity of regurgitant flow throughthe pulmonary valve (PR velocity) in m/s. The pulmonary regurgitation isdriven by, and therefore reflects, the diastolic pressure gradient between thepulmonary artery (PADP) and the right ventricle (RVDP), and this pressuregradient can be calculated using the simplified Bernoulli equation:
PADP � RVDP � 4 � (PR velocity)2
For example, if the peak velocity of the pulmonary regurgitation jet is1.1 m/s then:
PADP � RVDP � 4 � (1.1)2
PADP � RVDP � 4 � 1.2
PADP � RVDP � 4.8 mmHg
Now you know the diastolic pressure difference between the pulmonaryartery and the RV. The next step is to estimate the actual diastolic pressurein the RV, and this is taken to be the same as RA pressure (estimated usingthe IVC technique, as outlined above). For example, if the IVC is normalthen the RAP would be estimated at 5–10 mmHg, and so the RVDP wouldbe 5–10 mmHg too. Continuing with our example:
PADP � RVDP � 4.8 mmHg
PADP � 4.8 mmHg � RVDP
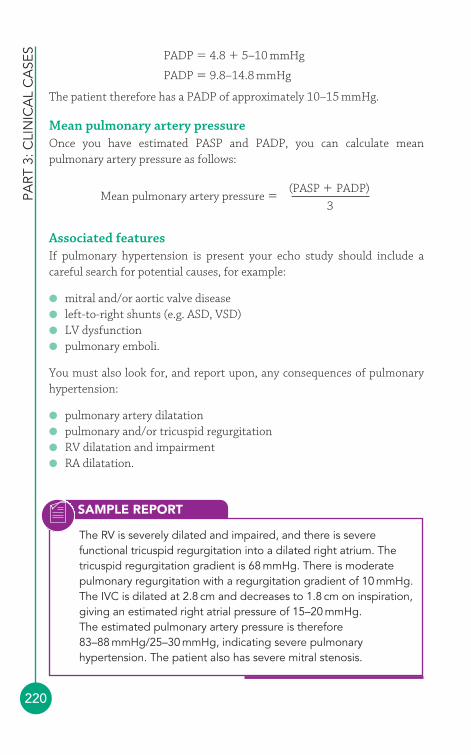
PART
3: C
LIN
ICA
L C
ASE
S
220
PADP � 4.8 � 5–10 mmHg
PADP � 9.8–14.8 mmHg
The patient therefore has a PADP of approximately 10–15 mmHg.
Mean pulmonary artery pressureOnce you have estimated PASP and PADP, you can calculate meanpulmonary artery pressure as follows:
Associated featuresIf pulmonary hypertension is present your echo study should include acareful search for potential causes, for example:
● mitral and/or aortic valve disease● left-to-right shunts (e.g. ASD, VSD)● LV dysfunction● pulmonary emboli.
You must also look for, and report upon, any consequences of pulmonaryhypertension:
● pulmonary artery dilatation● pulmonary and/or tricuspid regurgitation● RV dilatation and impairment● RA dilatation.
Mean pulmonary artery pressure �(PASP � PADP)
3
SAMPLE REPORT
The RV is severely dilated and impaired, and there is severefunctional tricuspid regurgitation into a dilated right atrium. Thetricuspid regurgitation gradient is 68 mmHg. There is moderatepulmonary regurgitation with a regurgitation gradient of 10 mmHg.The IVC is dilated at 2.8 cm and decreases to 1.8 cm on inspiration,giving an estimated right atrial pressure of 15–20 mmHg. The estimated pulmonary artery pressure is therefore83–88 mmHg/25–30 mmHg, indicating severe pulmonaryhypertension. The patient also has severe mitral stenosis.
The
right
hea
rt
221
Management of pulmonary hypertensionTreatment options for pulmonary hypertension include identification andtreatment of any underlying causes (e.g. valvular heart disease, pulmonaryemboli). Oral anticoagulants, diuretics, oxygen therapy, digoxin andcalcium-channel blockers may all have a role to play. Endothelin receptorantagonists can also be useful. Surgical options include balloon atrialseptostomy or lung/heart–lung transplantation.
FURTHER READING
Fox DJ, Khattar RS. Carcinoid heart disease: presentation,diagnosis, and management. Heart 2004; 90: 1224–8.
Ionescu A. British Society of Echocardiography Distance LearningModule 10: The Echocardiographic Assessment of the RightHeart in the Adult. Accessible from the BSE website(www.bsecho.org).
Lang RM, Bierig M, Devereux RB, et al. Recommendations forchamber quantification: a report from the American Society ofEchocardiography’s Guidelines and Standards Committee andthe Chamber Quantification Writing Group, developed inconjunction with the European Association ofEchocardiography, a branch of the European Society ofCardiology. J Am Soc Echocardiogr 2005; 18: 1440–63.
National Pulmonary Hypertension Centres of the UK and Ireland.Consensus statement on the management of pulmonaryhypertension in clinical practice in the UK and Ireland. Heart2008; 94(suppl 1): i1–4.
Simonneau G, Galie N, Rubin LJ, et al. Clinical classification ofpulmonary hypertension. J Am Coll Cardiol 2004; 43: 5–12.
Tei C, Dujardin KS, Hodge DO, et al. Doppler index combiningsystolic and diastolic myocardial performance: clinical value incardiac amyloidosis. J Am Coll Cardiol 1996; 28: 658–64.

222
Heart valve repairand replacement
Valvular heart disease can be treated in a variety of ways:
● valve replacement, in which an artificial (prosthetic) heart valve isimplanted surgically to replace an abnormal (regurgitant or stenotic) valve
● valve repair, in which a regurgitant valve is corrected surgically,preserving the original valve rather than replacing it
● percutaneous techniques, which include percutaneous balloonvalvuloplasty (in which a stenotic valve is ‘stretched’ with a balloon)and, more recently, transcatheter aortic valve implantation (in which an abnormal aortic valve is replaced with a new valve deployedpercutaneously rather than with cardiothoracic surgery).
It is important to be aware of the different valvular procedures that patientsundergo, as patients will require follow-up echo studies to confirm thesuccess of the procedure and to monitor their repaired/replaced valve forany subsequent dysfunction. It’s particularly useful to undertake a detailed‘baseline’ echo study around 6–8 weeks after valve surgery to act as acomparator for subsequent studies.
● Prosthetic valvesEach year approximately 6000 people in the UK (and 60 000 in the USA)undergo surgery to implant a prosthetic heart valve. Prosthetic valves fallinto one of two categories:
● Mechanical valves – in which the valve is constructed using artificialmaterials.
● Biological valves – in which the valve contains biological material,derived either from a natural valve or fashioned from pericardium.Biological valves are also sometimes called ‘tissue valves’ or‘bioprosthetic valves’.
16

Hea
rt v
alve
rep
air
and
rep
lace
men
t
223
Before undertaking an echo assessment of a prosthetic valve, it is essential toknow the type of valve implanted. The request form should therefore state:
● the type of prosthetic valve (e.g. biological, mechanical) and its specificname (e.g. Bjork-Shiley)
● the size of prosthetic valve (which is its internal diameter, stated in mm)● the date of implantation● current clinical details (e.g. new diastolic murmur)● a specific question to be addressed (e.g. valve dehiscence?).
Details of the type of valve can usually be obtained from the originaloperation note.
Echo assessment of mechanical valvesA mechanical valve consists of three parts: the sewing ring (which is likethe ‘annulus’ of the valve, used by the surgeon to sew the valve intoposition), the occluder (the moving part of the valve which opens andcloses during the cardiac cycle) and the retaining mechanism (which isattached to the sewing ring and holds the occluder in position).
There are three types of mechanical valve (Fig. 16.1):
● Ball and cage valves, consisting of a silastic ball occluder which canmove up and down within the cage-like retaining mechanism – this wasthe earliest type of mechanical valve, introduced during the 1960s
● Tilting disc valves, in which a single disc occluder tilts within its occluder● Bileaflet valves, in which two semicircular disc occluders open and close
on hinges – these are now the most commonly used prosthetic valves.
The advantage of mechanical valves is their long-term durability (althoughsome earlier valves were prone to catastrophic failure). The main disadvantage
Ball and cage Tilting disc Bileaflet
Fig. 16.1 Types of mechanical heart valve
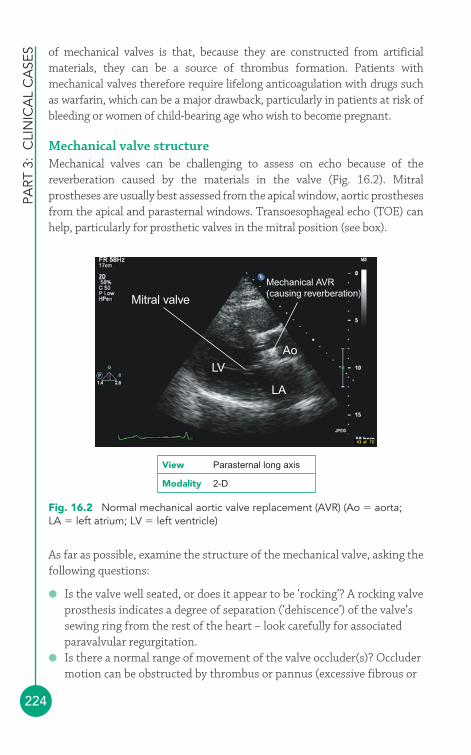
PART
3:
CLI
NIC
AL
CA
SES
224
of mechanical valves is that, because they are constructed from artificialmaterials, they can be a source of thrombus formation. Patients withmechanical valves therefore require lifelong anticoagulation with drugs suchas warfarin, which can be a major drawback, particularly in patients at risk ofbleeding or women of child-bearing age who wish to become pregnant.
Mechanical valve structureMechanical valves can be challenging to assess on echo because of thereverberation caused by the materials in the valve (Fig. 16.2). Mitralprostheses are usually best assessed from the apical window, aortic prosthesesfrom the apical and parasternal windows. Transoesophageal echo (TOE) canhelp, particularly for prosthetic valves in the mitral position (see box).
Mitral valve
Mechanical AVR(causing reverberation)
LVAo
LA
Fig. 16.2 Normal mechanical aortic valve replacement (AVR) (Ao � aorta;LA � left atrium; LV � left ventricle)
View Parasternal long axis
Modality 2-D
As far as possible, examine the structure of the mechanical valve, asking thefollowing questions:
● Is the valve well seated, or does it appear to be ‘rocking’? A rocking valveprosthesis indicates a degree of separation (‘dehiscence’) of the valve’ssewing ring from the rest of the heart – look carefully for associatedparavalvular regurgitation.
● Is there a normal range of movement of the valve occluder(s)? Occludermotion can be obstructed by thrombus or pannus (excessive fibrous or
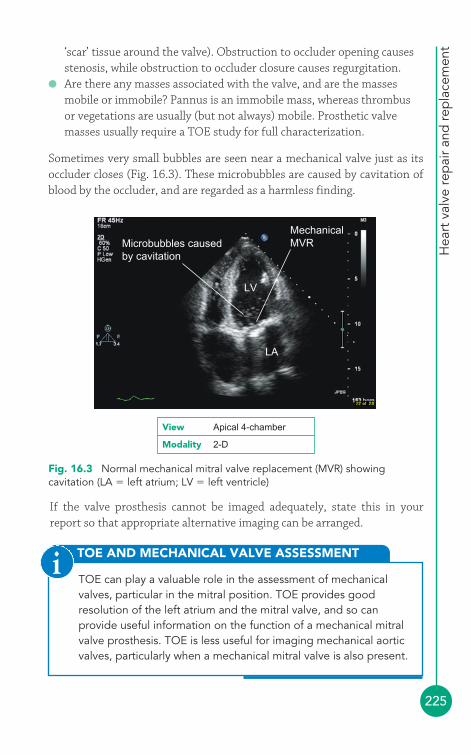
Hea
rt v
alve
rep
air
and
rep
lace
men
t
225
Microbubbles causedby cavitation
MechanicalMVR
LV
LA
Fig. 16.3 Normal mechanical mitral valve replacement (MVR) showingcavitation (LA � left atrium; LV � left ventricle)
TOE AND MECHANICAL VALVE ASSESSMENT
TOE can play a valuable role in the assessment of mechanicalvalves, particular in the mitral position. TOE provides goodresolution of the left atrium and the mitral valve, and so canprovide useful information on the function of a mechanical mitralvalve prosthesis. TOE is less useful for imaging mechanical aorticvalves, particularly when a mechanical mitral valve is also present.
i
View Apical 4-chamber
Modality 2-D
‘scar’ tissue around the valve). Obstruction to occluder opening causesstenosis, while obstruction to occluder closure causes regurgitation.
● Are there any masses associated with the valve, and are the massesmobile or immobile? Pannus is an immobile mass, whereas thrombusor vegetations are usually (but not always) mobile. Prosthetic valvemasses usually require a TOE study for full characterization.
Sometimes very small bubbles are seen near a mechanical valve just as itsoccluder closes (Fig. 16.3). These microbubbles are caused by cavitation ofblood by the occluder, and are regarded as a harmless finding.
If the valve prosthesis cannot be imaged adequately, state this in yourreport so that appropriate alternative imaging can be arranged.
PART
3:
CLI
NIC
AL
CA
SES
226
Mechanical valve functionForward flowAll prosthetic valves exhibit a degree of ‘patient–prosthesis mismatch’, inthat the prosthetic valve tends to have a smaller effective orifice area thanthe native valve it replaces, and so some degree of obstruction to blood flowis to be expected. As for native valves, assess forward flow by measuring:
● gradient (peak and mean) – but beware the problem of pressurerecovery (see box)
● pressure half-time (for mitral prostheses)● effective orifice area (based on pressure half-time for mitral prostheses
and the continuity equation for aortic prostheses).
PRESSURE RECOVERY
The phenomenon of pressure recovery is complex, but in essence itdescribes how pressure increases downstream of a stenosisbecause of the conversion (‘recovery’) of kinetic energy intopotential energy. The practical upshot of pressure recovery is thatmeasured pressure gradients across prosthetic valves can appearmisleadingly high, particularly for aortic valves. The phenomenonhas been found in both mechanical and biological valves.Calculation of effective orifice area for a prosthetic valve is oftenmore useful than valve gradient alone, and serial measurements areparticularly helpful for identifying ‘true’ prosthetic valve stenosis.
i
The normal ranges of prosthetic valve forward flow parameters varyaccording to the type and size of the valve concerned, and tables of normalvalues can be obtained either from the prosthetic valve’s manufacturer or byreferring to published tables in the literature (the paper by Rosenhek et al. isparticularly useful – see Further Reading below).
Obstruction to forward flow occurs if motion of the valve occluder isobstructed (by thrombus, pannus, vegetations or mechanical failure), so thatthe occluder cannot open properly, or if there is subvalvular or supravalvularobstruction from pannus formation. Inspect the valve carefully to assessoccluder motion where possible. If obstruction occurs intermittently, aprolonged period of Doppler interrogation may be required.
Regurgitant flowA small amount of regurgitation is normal for mechanical valve prostheses.There is an initial regurgitant flow as the occluder closes and blood is

Hea
rt v
alve
rep
air
and
rep
lace
men
t
227
pushed backwards by it. Then, once the occluder is closed, there is a furtherregurgitant flow which is intended to ‘wash’ over the prosthesis and reducethe risk of thrombus formation. These normal regurgitant jets are usuallysmall – the precise extent and location of the regurgitant jet(s) depends onthe type of valve.
Abnormal regurgitation through the orifice of the prosthetic valve mayoccur if the occluder fails to close properly, either because closure isobstructed (e.g. by thrombus, vegetations or pannus) or because ofmechanical failure of the occluder itself. Regurgitation through a prostheticvalve orifice is called transvalvular regurgitation. Regurgitation may alsooccur around the valve, due to dehiscence of part of the sewing ring – this isparavalvular regurgitation. Use colour Doppler to examine the locationand extent of any abnormal regurgitation, and describe it as fully aspossible. Regurgitation from mitral prostheses can be difficult to see withtransthoracic echo and a TOE study may be required.
Echo assessment of biological valvesAs with a mechanical valve, biological valves contain a sewing ring which thesurgeon uses to sew the valve into position. From the sewing ring projects aframework consisting of a number of struts, commonly called stents, towhich the valve leaflets are attached. These stents take up space and thuscan cause a degree of obstruction to blood flow through the valve. Valveswhich lack this supporting framework, called ‘stentless valves’ are availableand offer a greater orifice area (for the same overall size of valve), reducingthe gradient across the prosthetic valve.
There are three types of biological valve:
● Xenograft valves, in which the valve is fashioned from a porcine valveor from bovine pericardium
● Homograft valves, which are human valves obtained from cadavers● Autograft valves, in which a patient’s own pulmonary valve is used to
replace their aortic valve (and the pulmonary valve is itself replaced witha xenograft or homograft valve) – this is known as the Ross procedure.
Unlike mechanical valves, biological valves do not require long-termanticoagulation. However, they do not have the durability of mechanicalvalves and there is a significant failure rate from 8–10 years onwards afterimplantation. Failure can occur as a result of gradual calcification of thevalve, causing stenosis, or from regurgitation.
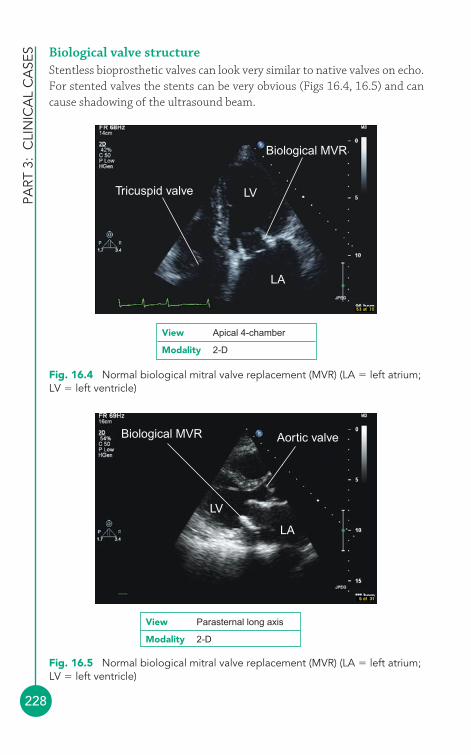
PART
3:
CLI
NIC
AL
CA
SES
228
Biological valve structureStentless bioprosthetic valves can look very similar to native valves on echo.For stented valves the stents can be very obvious (Figs 16.4, 16.5) and cancause shadowing of the ultrasound beam.
LVTricuspid valve
Biological MVR
LA
Biological MVR Aortic valve
LV
LA
Fig. 16.4 Normal biological mitral valve replacement (MVR) (LA � left atrium;LV � left ventricle)
Fig. 16.5 Normal biological mitral valve replacement (MVR) (LA � left atrium;LV � left ventricle)
View Apical 4-chamber
Modality 2-D
View Parasternal long axis
Modality 2-D
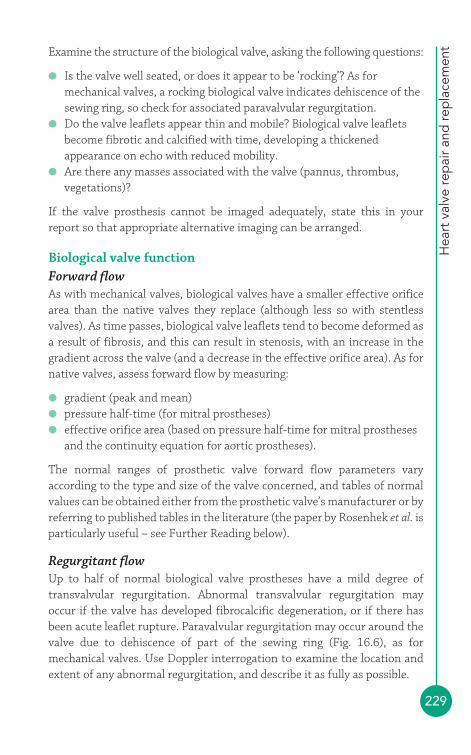
Hea
rt v
alve
rep
air
and
rep
lace
men
t
229
Examine the structure of the biological valve, asking the following questions:
● Is the valve well seated, or does it appear to be ‘rocking’? As formechanical valves, a rocking biological valve indicates dehiscence of thesewing ring, so check for associated paravalvular regurgitation.
● Do the valve leaflets appear thin and mobile? Biological valve leafletsbecome fibrotic and calcified with time, developing a thickenedappearance on echo with reduced mobility.
● Are there any masses associated with the valve (pannus, thrombus,vegetations)?
If the valve prosthesis cannot be imaged adequately, state this in yourreport so that appropriate alternative imaging can be arranged.
Biological valve functionForward flowAs with mechanical valves, biological valves have a smaller effective orificearea than the native valves they replace (although less so with stentlessvalves). As time passes, biological valve leaflets tend to become deformed asa result of fibrosis, and this can result in stenosis, with an increase in thegradient across the valve (and a decrease in the effective orifice area). As fornative valves, assess forward flow by measuring:
● gradient (peak and mean)● pressure half-time (for mitral prostheses)● effective orifice area (based on pressure half-time for mitral prostheses
and the continuity equation for aortic prostheses).
The normal ranges of prosthetic valve forward flow parameters varyaccording to the type and size of the valve concerned, and tables of normalvalues can be obtained either from the prosthetic valve’s manufacturer or byreferring to published tables in the literature (the paper by Rosenhek et al. isparticularly useful – see Further Reading below).
Regurgitant flowUp to half of normal biological valve prostheses have a mild degree oftransvalvular regurgitation. Abnormal transvalvular regurgitation mayoccur if the valve has developed fibrocalcific degeneration, or if there hasbeen acute leaflet rupture. Paravalvular regurgitation may occur around thevalve due to dehiscence of part of the sewing ring (Fig. 16.6), as formechanical valves. Use Doppler interrogation to examine the location andextent of any abnormal regurgitation, and describe it as fully as possible.

PART
3:
CLI
NIC
AL
CA
SES
230
SAMPLE REPORT
Biological AVR Paravalvularregurgitation
Fig. 16.6 Biological aortic valve replacement (AVR) with paravalvularregurgitation
View Parasternal short axis
Modality Colour Doppler
● Valve repairMitral valve repair is, where feasible, the preferred surgical option for mitralregurgitation with better long-term outcomes than valve replacement. The operation usually involves resection of a wedge of redundant mitraltissue and, where necessary, inserting an annuloplasty ring to reinforce themitral annulus and repairing/replacing damaged chordae tendineae. Analternative technique is the so-called Alfieri or ‘edge-to-edge’ repair, inwhich the central points of the two mitral leaflets are sutured together tocreate a double-orifice mitral valve.
There is a biological stented aortic valve replacement in situ (statedto be a 23 mm Carpentier-Edwards prosthesis, implanted 3 yearsago, on the request form). The valve is well seated. There are noassociated masses. The valve cusps are thin and mobile, with apeak gradient of 25 mmHg (mean 13 mmHg) and an effectiveorifice area of 1.9 cm2 (calculated from the continuity equation).There is no transvalvular or paravalvular regurgitation. The findingsindicate a normally functioning biological aortic valve replacement.
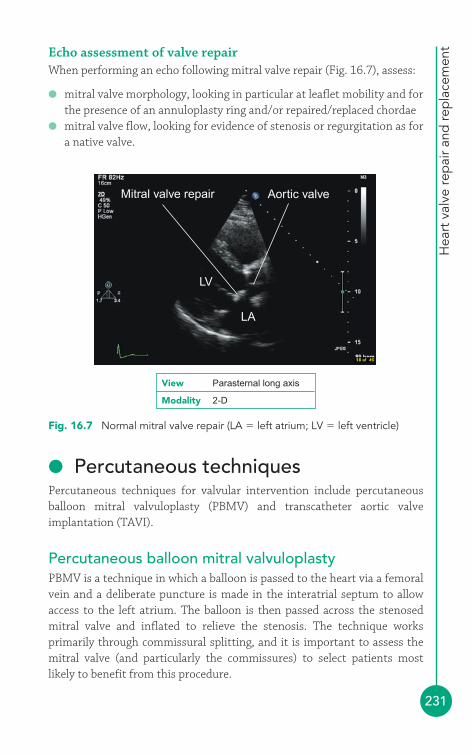
Hea
rt v
alve
rep
air
and
rep
lace
men
t
231
Echo assessment of valve repairWhen performing an echo following mitral valve repair (Fig. 16.7), assess:
● mitral valve morphology, looking in particular at leaflet mobility and forthe presence of an annuloplasty ring and/or repaired/replaced chordae
● mitral valve flow, looking for evidence of stenosis or regurgitation as fora native valve.
Mitral valve repair Aortic valve
LV
LA
Fig. 16.7 Normal mitral valve repair (LA � left atrium; LV � left ventricle)
View Parasternal long axis
Modality 2-D
● Percutaneous techniquesPercutaneous techniques for valvular intervention include percutaneousballoon mitral valvuloplasty (PBMV) and transcatheter aortic valveimplantation (TAVI).
Percutaneous balloon mitral valvuloplastyPBMV is a technique in which a balloon is passed to the heart via a femoralvein and a deliberate puncture is made in the interatrial septum to allowaccess to the left atrium. The balloon is then passed across the stenosedmitral valve and inflated to relieve the stenosis. The technique worksprimarily through commissural splitting, and it is important to assess themitral valve (and particularly the commissures) to select patients mostlikely to benefit from this procedure.
PART
3:
CLI
NIC
AL
CA
SES
232
Echo assessment for PBMV is formalised in the Wilkins score, which gradesthe valve’s suitability according to four criteria: leaflet mobility, valvularthickening, subvalvular thickening and valvular calcification. Each criterionis scored from 1 to 4, and a total score �8 indicates a low probability ofsuccessful PBMV. Full assessment will entail a TOE. Patients not suitablefor PBMV include those with:
● significant mitral regurgitation● bilateral commissural calcification● thrombus on the interatrial septum, protruding into the atrial cavity or
obstructing the mitral orifice.
The presence of unilateral commissural calcification or thrombus in the leftatrial appendage is a relative contraindication to PBMV.
Following PBMV the valve should be assessed carefully for any residualstenosis or for the development of mitral regurgitation, and for any residualatrial septal defect. Note that mitral valve pressure half-time is not a reliableway to assess mitral stenosis in the 72 h following PBMV. During this periodthe improvement in transmitral flow following the procedure causes anincrease in left atrial (and a decrease in left ventricular) compliance, whichaffects pressure half-time measurements. Once chamber compliance hasstabilised after 72 h, pressure half-time can be used once again.
Transcatheter aortic valve implantation (TAVI)For many years balloon valvuloplasty has been available to treat aorticstenosis in patients for whom conventional surgery is contraindicated.More recently, there has been growing interest in new techniques not just todilate a stenosed aortic valve but also to replace the aortic valve via atranscatheter approach, particularly in elderly patients with aortic stenosiswho have multiple comorbidities and for whom conventional aortic valvesurgery would present a high risk. TAVI can be performed either via thefemoral artery (transluminal approach) or via a direct puncture at the leftventricular apex (transapical approach). A balloon is placed across thestenosed aortic valve and inflated to dilate it. A replacement valve, which ismounted within a stent, is then deployed using either a balloon or a self-expanding system.
Following TAVI, echo is important is assessing the function of theprosthetic aortic valve and checking for any complications of the procedure(such as pericardial effusion/cardiac tamponade).

Hea
rt v
alve
rep
air
and
rep
lace
men
t
233
FURTHER READING
Bloomfield P. Choice of heart valve prosthesis. Heart 2002; 87:583–9.
British Society of Echocardiography Distance Learning Module 8:The Echocardiographic Assessment of Prosthetic Heart Valves.Accessible from the BSE website (www.bsecho.org).
Prendergast BD, Shaw TRD, Iung B, et al. Contemporary criteriafor the selection of patients for percutaneous balloon mitralvalvuloplasty. Heart 2002; 87: 401–4.
Rosenhek R, Binder T, Maurer G, et al. Normal values for Dopplerechocardiographic assessment of heart valve prostheses. J AmSoc Echocardiogr 2003; 16: 1116–27.

234
Endocarditis refers to inflammation of the endocardium, the inner layer ofthe heart (including the heart valves). Endocarditis can be:
● infective (e.g. bacterial, fungal)● non-infective (e.g. Libman–Sacks endocarditis in systemic lupus
erythematosus).
The characteristic lesion in endocarditis is the vegetation, a mass ofinflammatory material which can include fibrin, platelets, red and whiteblood cells and (where present) micro-organisms.
● Infective endocarditisIn the past, infective endocarditis has been classified as acute or subacute(‘SBE’, subacute bacterial endocarditis) but this terminology is outdated andshould no longer be used. Although infective endocarditis is rare (fewerthan 10 cases per 100 000 population every year) it is nevertheless a seriousand dangerous condition, with a mortality of around 20 per cent.
Infective endocarditis starts with organisms reaching the endocardiumeither via a bacteraemia or directly via surgery or device placement. Theorganisms adhere to the endocardium and as they invade the local tissues a vegetation begins to form. Left untreated, they cause local tissuedestruction (e.g. valvular regurgitation) and can also lead to abscess and/orfistula formation.
The single most common causative organism is Staphylococcus aureus; othercommonly encountered organisms are listed in Table 17.1.
Endocarditis17
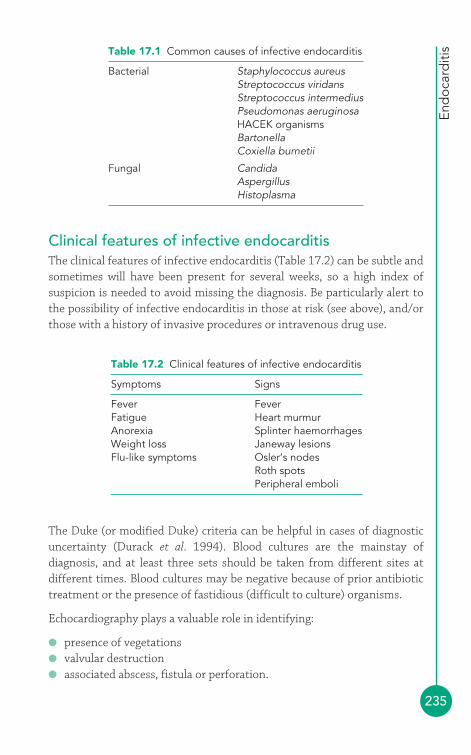
End
ocar
diti
s
235
Clinical features of infective endocarditisThe clinical features of infective endocarditis (Table 17.2) can be subtle andsometimes will have been present for several weeks, so a high index ofsuspicion is needed to avoid missing the diagnosis. Be particularly alert tothe possibility of infective endocarditis in those at risk (see above), and/orthose with a history of invasive procedures or intravenous drug use.
Table 17.1 Common causes of infective endocarditis
Bacterial Staphylococcus aureusStreptococcus viridansStreptococcus intermediusPseudomonas aeruginosaHACEK organismsBartonellaCoxiella burnetii
Fungal CandidaAspergillusHistoplasma
Table 17.2 Clinical features of infective endocarditis
Symptoms Signs
Fever FeverFatigue Heart murmurAnorexia Splinter haemorrhagesWeight loss Janeway lesionsFlu-like symptoms Osler‘s nodes
Roth spotsPeripheral emboli
The Duke (or modified Duke) criteria can be helpful in cases of diagnosticuncertainty (Durack et al. 1994). Blood cultures are the mainstay ofdiagnosis, and at least three sets should be taken from different sites atdifferent times. Blood cultures may be negative because of prior antibiotictreatment or the presence of fastidious (difficult to culture) organisms.
Echocardiography plays a valuable role in identifying:
● presence of vegetations● valvular destruction● associated abscess, fistula or perforation.
PART
3: C
LIN
ICA
L C
ASE
S
236
‘Major’ echo criteria supporting a diagnosis of infective endocarditis are thepresence of oscillating structures (vegetations), the presence of an abscess,new valvular regurgitation and dehiscence of a prosthetic valve.
Transthoracic echo (TTE) can, at best, detect vegetations down to aminimum size of 2 mm (and is known to miss the majority of vegetations�5 mm). The superior image quality of transoesophageal echo (TOE) makesit more sensitive and specific than TTE, particularly in cases of prostheticvalve endocarditis and in the detection of abscesses. TTE has an overallsensitivity in detecting vegetations of �50 per cent, whereas the sensitivityof TOE is 90 per cent. TOE should be considered in cases where the TTEis negative or inconclusive (particularly if the clinical suspicion of infectiveendocarditis is high), or where there is a suspicion of prosthetic valveendocarditis, right heart endocarditis or a cardiac abscess. It is important tonote that a negative echocardiogram (even TOE) does not rule out adiagnosis of infective endocarditis and it is prudent to include this, whenappropriate, in your echo report.
VEGETATIONS AND JET LESIONS
Vegetations occur most commonly on heart valves. However, theycan also occur anywhere where a high velocity jet of blood flow(‘jet lesion’) occurs between a high-pressure and low-pressurechamber, impinging on the endocardium and potentially resultingin endothelial injury and establishing a focus for infection.Examples include the high velocity jets found in ventricular septaldefect (VSD) or persistent ductus arteriosus (PDA).
i
Echo assessment of infective endocarditisA full echo study should be performed and any structural abnormalities thatpredispose to infective endocarditis noted. According to the NationalInstitute for Health and Clinical Excellence (2008), patients at risk ofdeveloping infective endocarditis include those with:
● acquired valvular disease including stenosis or regurgitation● valve replacement● structural congenital heart disease, including surgically corrected or
palliated conditions (except isolated atrial septal defect and fullyrepaired VSD or PDA, and endothelialized closure devices)
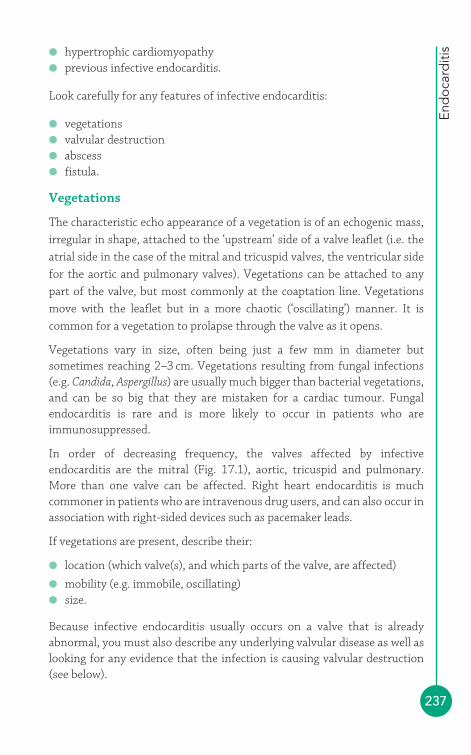
End
ocar
diti
s
237
● hypertrophic cardiomyopathy● previous infective endocarditis.
Look carefully for any features of infective endocarditis:
● vegetations● valvular destruction● abscess● fistula.
Vegetations
The characteristic echo appearance of a vegetation is of an echogenic mass,irregular in shape, attached to the ‘upstream’ side of a valve leaflet (i.e. theatrial side in the case of the mitral and tricuspid valves, the ventricular sidefor the aortic and pulmonary valves). Vegetations can be attached to anypart of the valve, but most commonly at the coaptation line. Vegetationsmove with the leaflet but in a more chaotic (‘oscillating’) manner. It iscommon for a vegetation to prolapse through the valve as it opens.
Vegetations vary in size, often being just a few mm in diameter butsometimes reaching 2–3 cm. Vegetations resulting from fungal infections(e.g. Candida, Aspergillus) are usually much bigger than bacterial vegetations,and can be so big that they are mistaken for a cardiac tumour. Fungalendocarditis is rare and is more likely to occur in patients who areimmunosuppressed.
In order of decreasing frequency, the valves affected by infectiveendocarditis are the mitral (Fig. 17.1), aortic, tricuspid and pulmonary.More than one valve can be affected. Right heart endocarditis is muchcommoner in patients who are intravenous drug users, and can also occur inassociation with right-sided devices such as pacemaker leads.
If vegetations are present, describe their:
● location (which valve(s), and which parts of the valve, are affected)
● mobility (e.g. immobile, oscillating)● size.
Because infective endocarditis usually occurs on a valve that is alreadyabnormal, you must also describe any underlying valvular disease as well aslooking for any evidence that the infection is causing valvular destruction(see below).
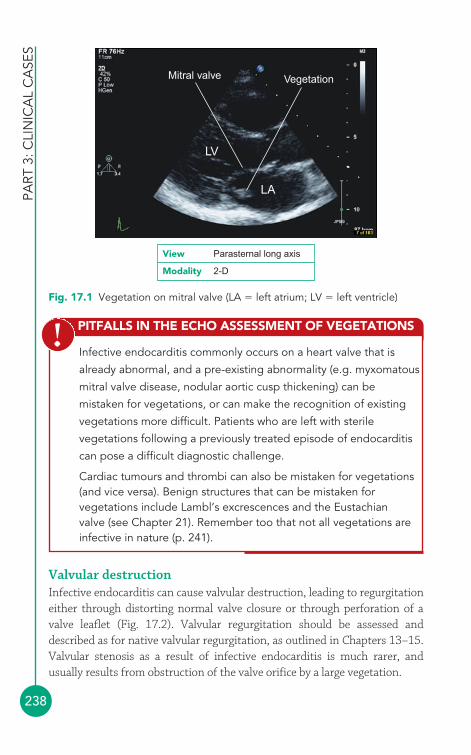
PART
3: C
LIN
ICA
L C
ASE
S
238
PITFALLS IN THE ECHO ASSESSMENT OF VEGETATIONS
Infective endocarditis commonly occurs on a heart valve that is
already abnormal, and a pre-existing abnormality (e.g. myxomatous
mitral valve disease, nodular aortic cusp thickening) can be
mistaken for vegetations, or can make the recognition of existing
vegetations more difficult. Patients who are left with sterile
vegetations following a previously treated episode of endocarditis
can pose a difficult diagnostic challenge.
Cardiac tumours and thrombi can also be mistaken for vegetations(and vice versa). Benign structures that can be mistaken forvegetations include Lambl’s excrescences and the Eustachianvalve (see Chapter 21). Remember too that not all vegetations areinfective in nature (p. 241).
!
LV
LA
VegetationMitral valve
View Parasternal long axis
Modality 2-D
Fig. 17.1 Vegetation on mitral valve (LA � left atrium; LV � left ventricle)
Valvular destructionInfective endocarditis can cause valvular destruction, leading to regurgitationeither through distorting normal valve closure or through perforation of avalve leaflet (Fig. 17.2). Valvular regurgitation should be assessed anddescribed as for native valvular regurgitation, as outlined in Chapters 13–15.Valvular stenosis as a result of infective endocarditis is much rarer, andusually results from obstruction of the valve orifice by a large vegetation.

End
ocar
diti
s
239
PROSTHETIC VALVE ENDOCARDITIS
Prosthetic valve endocarditis can be challenging to diagnose,particularly using TTE. Imaging of the valve itself is oftensuboptimal because of shadowing and reverberation of the echosignal by the prosthesis. Furthermore, prosthetic valve infectionstypically occur at the sewing ring rather than on the leaflets,making it harder to identify any vegetations. Look carefully for anysigns of dehiscence (‘splitting open’) of the sewing ring aroundthe valve, allowing regurgitant blood flow around the valveprosthesis (paravalvular regurgitation).
A TOE study is therefore usually appropriate in order to obtainbetter resolution of the prosthesis and any associatedabnormalities. Prosthetic valve endocarditis is difficult to treat withantibiotics alone and early re-do surgery is usually required,particularly in the first 12 months after the valve was firstimplanted.
i
AbscessA valvular infection can spread to involve surrounding tissues, particularlyin prosthetic valve endocarditis. On echo, an abscess appears as an
Mitral valve
LV
LA
Mitralregurgitation
View Parasternal long axis
Modality Colour Doppler
Fig. 17.2 Mitral regurgitation as a result of infective endocarditis (LA � leftatrium; LV � left ventricle)
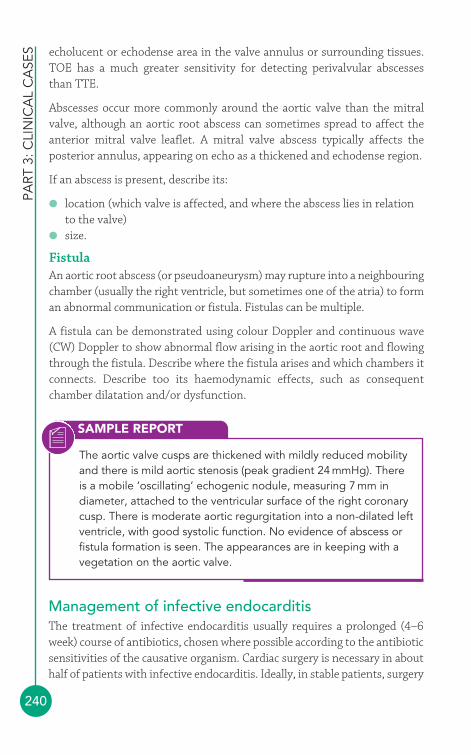
SAMPLE REPORT
PART
3: C
LIN
ICA
L C
ASE
S
240
echolucent or echodense area in the valve annulus or surrounding tissues.TOE has a much greater sensitivity for detecting perivalvular abscesses than TTE.
Abscesses occur more commonly around the aortic valve than the mitralvalve, although an aortic root abscess can sometimes spread to affect theanterior mitral valve leaflet. A mitral valve abscess typically affects theposterior annulus, appearing on echo as a thickened and echodense region.
If an abscess is present, describe its:
● location (which valve is affected, and where the abscess lies in relationto the valve)
● size.
FistulaAn aortic root abscess (or pseudoaneurysm) may rupture into a neighbouringchamber (usually the right ventricle, but sometimes one of the atria) to forman abnormal communication or fistula. Fistulas can be multiple.
A fistula can be demonstrated using colour Doppler and continuous wave(CW) Doppler to show abnormal flow arising in the aortic root and flowingthrough the fistula. Describe where the fistula arises and which chambers itconnects. Describe too its haemodynamic effects, such as consequentchamber dilatation and/or dysfunction.
The aortic valve cusps are thickened with mildly reduced mobilityand there is mild aortic stenosis (peak gradient 24 mmHg). Thereis a mobile ‘oscillating’ echogenic nodule, measuring 7 mm indiameter, attached to the ventricular surface of the right coronarycusp. There is moderate aortic regurgitation into a non-dilated leftventricle, with good systolic function. No evidence of abscess orfistula formation is seen. The appearances are in keeping with avegetation on the aortic valve.
Management of infective endocarditisThe treatment of infective endocarditis usually requires a prolonged (4–6week) course of antibiotics, chosen where possible according to the antibioticsensitivities of the causative organism. Cardiac surgery is necessary in abouthalf of patients with infective endocarditis. Ideally, in stable patients, surgery
End
ocar
diti
s
241
should be performed only once the infection has been successfully treatedwith antibiotics to minimize the risk of recurrent infection. However, it isnot always possible to delay surgery if patients are unstable or at high risk ofcomplications (e.g. embolization). Early surgery should be considered for:
● haemodynamic instability/heart failure as a result of acute aortic ormitral regurgitation
● persistent infection (fever and bacteraemia despite treatment withappropriate antibiotics for 7–10 days)
● development of a perivalvular abscess or fistula● infective endocarditis on a prosthetic valve● fungal infections● difficult to treat organisms (e.g. Brucella)● high embolic risk:
� recurrent emboli despite appropriate antibiotics� large vegetation (�10 mm) and a single embolic event� very large mobile vegetation (�15 mm).
Follow-up echoPatients being treated for infective endocarditis require regular follow-upecho studies to monitor progress and to watch for complications. Witheffective treatment the vegetations may gradually shrink and become lessmobile. The sudden disappearance of a vegetation between studies shouldraise a suspicion that the vegetation has broken free and embolized elsewhere.
Even when an episode of infective endocarditis has been fully treated,(sterile) vegetations may remain visible on echo. This can make thediagnosis of recurrent infection challenging in patients who have sufferedan episode of endocarditis previously – clinical evidence of active infection,particularly on blood cultures, is the key to diagnosis in such cases.
Prevention of infective endocarditisPatients at risk of infective endocarditis (see above) should receive guidanceon good oral hygiene and how to recognize the symptoms of infectiveendocarditis, and also information on the risks of invasive procedures, butantibiotic prophylaxis is no longer routinely recommended.
● Non-infective endocarditisNot all vegetations occur as a result of infection, a fact that emphasises theimportance of taking the patient’s clinical history (and in particular theresults of blood cultures) into account when making a diagnosis of infective(versus non-infective) endocarditis.
FURTHER READING
PART
3: C
LIN
ICA
L C
ASE
S
242
Non-infective endocarditis has also been termed non-bacterial thromboticendocarditis (NBTE) or, historically, marantic endocarditis. The vegetationsthat occur are sterile, and are composed mainly of fibrin and platelets. Non-infective endocarditis can result from:
● trauma to the valve leaflets (e.g. from an intracardiac catheter)● circulating immune complexes● vasculitis● hypercoagulability● mucin-producing adenocarcinomas.
Non-infective endocarditis occurring in systemic lupus erythematosus iscalled Libman–Sacks endocarditis (also known as ‘verrucous’ endocarditis),and in this condition, the vegetations mainly consist of immune complexesand mononuclear cells. The mitral and aortic valves are most commonlyaffected, although just about any part of the endocardium can be involved.The vegetations are usually small, irregular and immobile (compared with thevegetations in infective endocarditis). Libman–Sacks endocarditis is usuallyasymptomatic, but can present with valvular regurgitation or, less commonly,stenosis. There is also a risk of embolization, although this is uncommon.
Beynon RP, Bahl VK, Prendergast BD. Infective endocarditis. BMJ2006; 333: 334–9.
Durack DT, Lukes AS, Bright DK. New criteria for diagnosis ofinfective endocarditis: utilization of specific echocardiographicfindings. Duke Endocarditis Service. Am J Med 1994; 96: 200–9.
Evangelista A, González-Alujas MT. Echocardiography in infectiveendocarditis. Heart 2004; 90: 614–17.
Habib G. Management of infective endocarditis. Heart 2006; 92:124–30.
National Institute for Health and Clinical Excellence. ProphylaxisAgainst Infective Endocarditis. NICE clinical guideline No. 64,2008. Available at: www.nice.org.uk/CG064 (accessed 8December 2008).
The Task Force on Infective Endocarditis of the European Societyof Cardiology. Guidelines on the prevention, diagnosis andtreatment of infective endocarditis: executive summary. EurHeart J 2004; 25: 267–76.
243
● Classification of the cardiomyopathiesIn 1995, a classification scheme for the cardiomyopathies was proposed by the World Health Organization (WHO). This scheme definedcardiomyopathies as ‘diseases of the myocardium associated with cardiacdysfunction’ and categorized them as follows:
● dilated cardiomyopathy (DCM)● hypertrophic cardiomyopathy (HCM)● restrictive cardiomyopathy● arrhythmogenic right ventricular (RV) cardiomyopathy● unclassified cardiomyopathies (e.g. isolated ventricular non-compaction).
The WHO classification also recognized an overlapping group of ‘specific’cardiomyopathies, in which a particular case of cardiomyopathy could beattributed to a specific underlying aetiology. Examples include:
● ischemic cardiomyopathy● valvular cardiomyopathy● hypertensive cardiomyopathy● metabolic cardiomyopathy● peripartum cardiomyopathy.
The advent of molecular genetics has provided new insights into thepathophysiology of the cardiomyopathies, and in some respects the WHOclassification is now somewhat outdated. In 2006, the American HeartAssociation (AHA) proposed a new scheme in which cardiomyopathies aredefined as: ‘a heterogeneous group of diseases of the myocardium associatedwith mechanical and/or electrical dysfunction that usually (but not invariably)exhibit inappropriate ventricular hypertrophy or dilatation and are due to avariety of causes that frequently are genetic. Cardiomyopathies either are
Thecardiomyopathies
18

confined to the heart or are part of generalized systemic disorders, oftenleading to cardiovascular death or progressive heart failure-related disability.’
According to the AHA classification, cardiomyopathies can be classified asprimary (mainly or only affecting the heart) or secondary (where thecardiomyopathy is part of a wider multisystem disorder):
● primary cardiomyopathies� genetic (e.g. HCM, arrhythmogenic RV cardiomyopathy, isolated
ventricular non-compaction)� acquired (e.g. post-myocarditis, stress-related, peripartum,
tachycardia-induced)� mixed (e.g. DCM, restrictive cardiomyopathy)
● secondary cardiomyopathies� infiltrative (e.g. amyloidosis)� storage (e.g. haemochromatosis, Fabry’s disease)� toxicity (e.g. drugs)� endomyocardial (e.g. endomyocardial fibrosis)� inflammatory (e.g. sarcoidosis)� endocrine (e.g. diabetes mellitus, acromegaly)� cardiofacial (e.g. Noonan syndrome)� neuromuscular/neurological (e.g. Friedreich’s ataxia)� nutritional deficiencies (e.g. beriberi, scurvy)� autoimmune/collagen (e.g. systemic lupus erythematosus)� electrolyte imbalance� consequence of cancer therapy (e.g. anthracyclines).
The echo assessment of any cardiomyopathy requires a detailed study witha particular emphasis on chamber morphology, dimensions and function(including ventricular systolic and diastolic function), as outlined inChapters 11, 12 and 15, together with a full assessment of valvularfunction. In addition, you will need to look for the specific features relatingto the cardiomyopathy in question. This chapter describes the key featuresof the cardiomyopathies most likely to be encountered in everyday practice.
● Dilated cardiomyopathyDCM is characterized by dilatation and systolic impairment of the leftventricle (LV), usually accompanied by dilatation of the RV and the atria.DCM can result from a number of conditions, including:
● myocarditis● alcohol
PART
3: C
LIN
ICA
L C
ASE
S
244
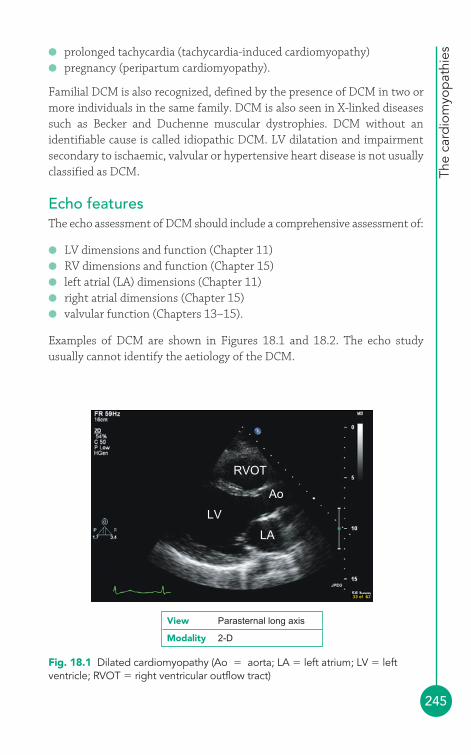
The
card
iom
yop
athi
es
245
● prolonged tachycardia (tachycardia-induced cardiomyopathy)● pregnancy (peripartum cardiomyopathy).
Familial DCM is also recognized, defined by the presence of DCM in two ormore individuals in the same family. DCM is also seen in X-linked diseasessuch as Becker and Duchenne muscular dystrophies. DCM without anidentifiable cause is called idiopathic DCM. LV dilatation and impairmentsecondary to ischaemic, valvular or hypertensive heart disease is not usuallyclassified as DCM.
Echo featuresThe echo assessment of DCM should include a comprehensive assessment of:
● LV dimensions and function (Chapter 11)● RV dimensions and function (Chapter 15)● left atrial (LA) dimensions (Chapter 11)● right atrial dimensions (Chapter 15)● valvular function (Chapters 13–15).
Examples of DCM are shown in Figures 18.1 and 18.2. The echo studyusually cannot identify the aetiology of the DCM.
RVOT
Ao
LV
LA
Fig. 18.1 Dilated cardiomyopathy (Ao � aorta; LA � left atrium; LV � leftventricle; RVOT � right ventricular outflow tract)
View Parasternal long axis
Modality 2-D

PART
3: C
LIN
ICA
L C
ASE
S
246
● Hypertrophic cardiomyopathyHCM is an autosomal dominant condition affecting 1 in 500 of thepopulation and is a common cause of sudden cardiac death, particularly inthe young. The LV hypertrophy in HCM is usually asymmetrical (in contrastto the concentric LV hypertrophy seen in hypertension or aortic stenosis)and systolic function is preserved but diastolic function is impaired.
RV
RA
LV
LA
Fig. 18.2 Dilated cardiomyopathy (LA � left atrium; LV � left ventricle;RA � right atrium; RV � right ventricle)
View Apical 4-chamber
Modality 2-D
APICAL BALLOONING CARDIOMYOPATHY
A rare form of cardiomyopathy, first described in Japan, is apicalballooning or stress cardiomyopathy. It is also known as tako-tsubo(‘octopus bottle’) cardiomyopathy, named after the characteristicshape of the LV seen in this condition. This cardiomyopathy is mostcommonly seen in post-menopausal women and is triggered byextreme emotional or clinical stress, which causes a ballooning ofthe LV apex (Fig. 18.3). Patients present with chest pain and/orheart failure with ECG changes suggestive of an anterior myocardialinfarction (but in the absence of coronary disease). In most cases LVfunction recovers within 2 months of the presenting episode.
i

The
card
iom
yop
athi
es
247
If the hypertrophy is located in the LV outflow tract (LVOT) it may obstructthe flow of blood out of the LV into the aorta – this is hypertrophic obstructivecardiomyopathy (HOCM). Another common pattern is apical hypertrophy,which gives the LV cavity a characteristic ‘ace of spades’ appearance.
Echo featuresIn HCM, the LV is hypertrophied in the absence of an underlying cause such as hypertension, aortic stenosis or aortic coarctation. In an echo studyfor HCM look for the following features:
● LV hypertrophy, which is usually asymmetrical (but is sometimesconcentric)
● LV systolic and diastolic function (Chapter 11)● evidence of obstruction (subaortic, midventricular)● systolic anterior motion of the anterior mitral valve leaflet● mitral regurgitation.
LV morphologyIn HCM, the LV is non-dilated; indeed, the LV cavity is usually small. AssessLV morphology and dimensions looking, in particular, for evidence of
Apicalballooning
LV
View Apical 4-chamber
Modality 2-D
Fig. 18.3 Apical ballooning cardiomyopathy (LV � left ventricle) (Reproducedfrom Heart, Nef HM, et al. 93, 1309–15, © 2007, with permission from BMJPublishing Group Ltd.)
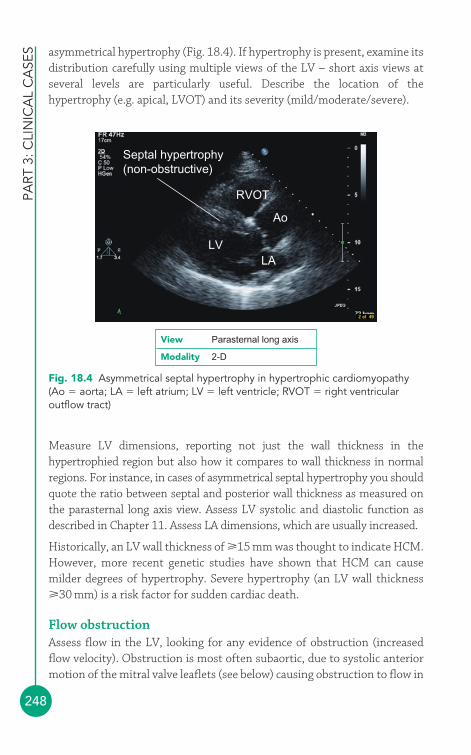
PART
3: C
LIN
ICA
L C
ASE
S
248
asymmetrical hypertrophy (Fig. 18.4). If hypertrophy is present, examine itsdistribution carefully using multiple views of the LV – short axis views atseveral levels are particularly useful. Describe the location of thehypertrophy (e.g. apical, LVOT) and its severity (mild/moderate/severe).
RVOT
Ao
LVLA
Septal hypertrophy(non-obstructive)
Fig. 18.4 Asymmetrical septal hypertrophy in hypertrophic cardiomyopathy(Ao � aorta; LA � left atrium; LV � left ventricle; RVOT � right ventricularoutflow tract)
View Parasternal long axis
Modality 2-D
Measure LV dimensions, reporting not just the wall thickness in thehypertrophied region but also how it compares to wall thickness in normalregions. For instance, in cases of asymmetrical septal hypertrophy you shouldquote the ratio between septal and posterior wall thickness as measured onthe parasternal long axis view. Assess LV systolic and diastolic function asdescribed in Chapter 11. Assess LA dimensions, which are usually increased.
Historically, an LV wall thickness of 15 mm was thought to indicate HCM.However, more recent genetic studies have shown that HCM can causemilder degrees of hypertrophy. Severe hypertrophy (an LV wall thickness30 mm) is a risk factor for sudden cardiac death.
Flow obstructionAssess flow in the LV, looking for any evidence of obstruction (increasedflow velocity). Obstruction is most often subaortic, due to systolic anteriormotion of the mitral valve leaflets (see below) causing obstruction to flow in

The
card
iom
yop
athi
es
249
the LVOT, but obstruction can sometimes be mid-ventricular. Performcolour Doppler to look for evidence of turbulent LVOT flow, and usecontinuous wave (CW) Doppler in the apical 5-chamber view to measure anyLVOT gradient. You can also use pulsed-wave (PW) Doppler to assess flowin different regions of the LVOT, to distinguish between gradients causedby asymmetrical hypertrophy and any gradient across the aortic valve.
LVOT obstruction is characteristically dynamic, with the rate of increase in flowvelocity rising as the velocity increases – this gives the spectral Doppler trace acharacteristic ‘sabre-shaped’ appearance (Fig. 18.5). LVOT obstruction mayoccur (or increase) with exercise – this is termed latent obstruction and can beassessed by performing an echo Doppler study while the patient undertakesbicycle exercise. HCM can be categorized according to the type of obstruction:
● resting obstruction – gradient 30 mmHg at rest● latent obstruction – gradient �30 mmHg at rest, but 30 mmHg with
provocation● non-obstructive – gradient �30 mmHg at rest and with provocation.
PITFALLS IN THE ECHO ASSESSMENT OF HCM
Difficulties in the echo diagnosis of HCM include:
● Overestimating LV septal thickness by taking a measurementusing an oblique cut, or including a moderator band or falsetendon in the measurement, leading to a false positivediagnosis of HCM.
● Mistaking the normal variant of sigmoid septum for asymmetricalseptal hypertrophy. Sigmoid septum is a prominent bulge orangulation of the septum in the region of the LVOT, commonlyseen in older patients. The angulation can make the septumappear hypertrophied, particularly on M-mode, even when thewall thickness is normal.
● Distinguishing between HCM and the normal hypertrophy seenin highly trained athletes. In ‘athlete’s heart’ the LV cavity isdilated (LV end-diastolic diameter (LVEDd) �55 mm), incontrast to the small cavity seen in HCM. The LA is not dilatedin athlete’s heart, unlike in HCM.
!
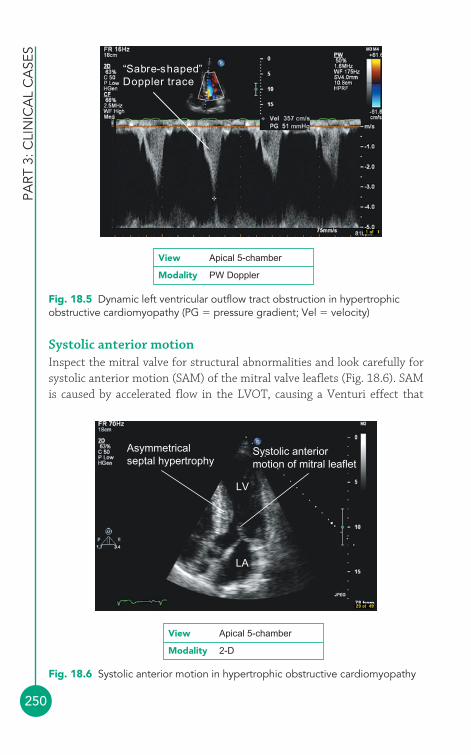
PART
3: C
LIN
ICA
L C
ASE
S
250
LV
LA
Asymmetricalseptal hypertrophy
Systolic anteriormotion of mitral leaflet
Fig. 18.6 Systolic anterior motion in hypertrophic obstructive cardiomyopathy
View Apical 5-chamber
Modality 2-D
“Sabre-shaped”Doppler trace
Fig. 18.5 Dynamic left ventricular outflow tract obstruction in hypertrophicobstructive cardiomyopathy (PG � pressure gradient; Vel � velocity)
View Apical 5-chamber
Modality PW Doppler
Systolic anterior motionInspect the mitral valve for structural abnormalities and look carefully forsystolic anterior motion (SAM) of the mitral valve leaflets (Fig. 18.6). SAMis caused by accelerated flow in the LVOT, causing a Venturi effect that
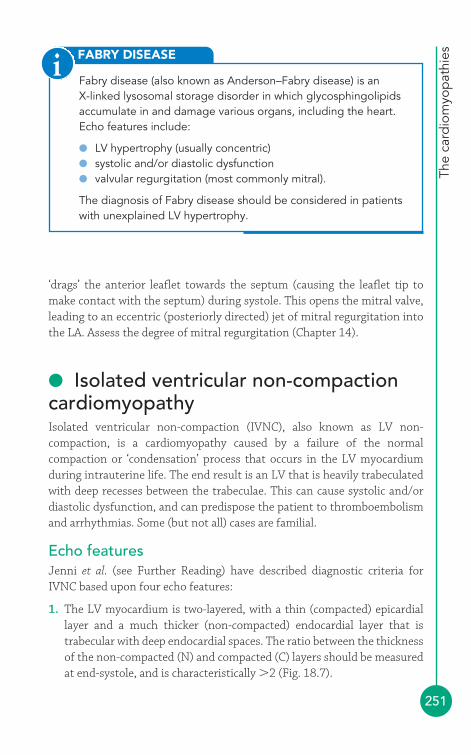
The
card
iom
yop
athi
es
251
‘drags’ the anterior leaflet towards the septum (causing the leaflet tip tomake contact with the septum) during systole. This opens the mitral valve,leading to an eccentric (posteriorly directed) jet of mitral regurgitation intothe LA. Assess the degree of mitral regurgitation (Chapter 14).
● Isolated ventricular non-compactioncardiomyopathyIsolated ventricular non-compaction (IVNC), also known as LV non-compaction, is a cardiomyopathy caused by a failure of the normalcompaction or ‘condensation’ process that occurs in the LV myocardiumduring intrauterine life. The end result is an LV that is heavily trabeculatedwith deep recesses between the trabeculae. This can cause systolic and/ordiastolic dysfunction, and can predispose the patient to thromboembolismand arrhythmias. Some (but not all) cases are familial.
Echo featuresJenni et al. (see Further Reading) have described diagnostic criteria forIVNC based upon four echo features:
1. The LV myocardium is two-layered, with a thin (compacted) epicardiallayer and a much thicker (non-compacted) endocardial layer that istrabecular with deep endocardial spaces. The ratio between the thicknessof the non-compacted (N) and compacted (C) layers should be measuredat end-systole, and is characteristically �2 (Fig. 18.7).
FABRY DISEASE
Fabry disease (also known as Anderson–Fabry disease) is an X-linked lysosomal storage disorder in which glycosphingolipidsaccumulate in and damage various organs, including the heart.Echo features include:
● LV hypertrophy (usually concentric)● systolic and/or diastolic dysfunction● valvular regurgitation (most commonly mitral).
The diagnosis of Fabry disease should be considered in patientswith unexplained LV hypertrophy.
i
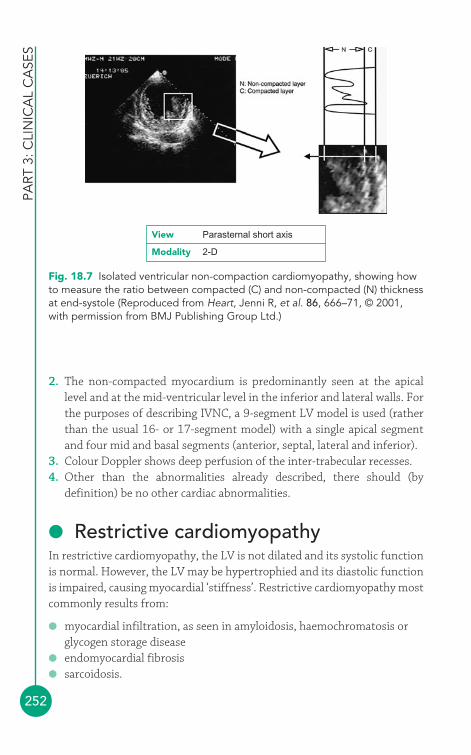
PART
3: C
LIN
ICA
L C
ASE
S
252
2. The non-compacted myocardium is predominantly seen at the apicallevel and at the mid-ventricular level in the inferior and lateral walls. Forthe purposes of describing IVNC, a 9-segment LV model is used (ratherthan the usual 16- or 17-segment model) with a single apical segmentand four mid and basal segments (anterior, septal, lateral and inferior).
3. Colour Doppler shows deep perfusion of the inter-trabecular recesses.4. Other than the abnormalities already described, there should (by
definition) be no other cardiac abnormalities.
● Restrictive cardiomyopathyIn restrictive cardiomyopathy, the LV is not dilated and its systolic functionis normal. However, the LV may be hypertrophied and its diastolic functionis impaired, causing myocardial ‘stiffness’. Restrictive cardiomyopathy mostcommonly results from:
● myocardial infiltration, as seen in amyloidosis, haemochromatosis orglycogen storage disease
● endomyocardial fibrosis● sarcoidosis.
Fig. 18.7 Isolated ventricular non-compaction cardiomyopathy, showing howto measure the ratio between compacted (C) and non-compacted (N) thicknessat end-systole (Reproduced from Heart, Jenni R, et al. 86, 666–71, © 2001,with permission from BMJ Publishing Group Ltd.)
View Parasternal short axis
Modality 2-D

The
card
iom
yop
athi
es
253
Echo featuresA full evaluation of the LV is required, looking in particular at:
● LV dimensions and wall thickness● LV systolic function (usually normal)● LV diastolic function (impaired).
The LV myocardium usually appears echo-reflective and ‘speckled’ inamyloid infiltration, and the endocardium is echo-reflective in endomyocardialfibrosis. Restrictive cardiomyopathy may also involve the RV and both atriaare usually significantly dilated as a consequence of elevated ventricularfilling pressures.
The distinction between restrictive cardiomyopathy and constrictivepericarditis can be challenging. The distinguishing features of the twoconditions are listed in Table 19.5 (p. 268).
● Arrhythmogenic right ventricularcardiomyopathyArrhythmogenic RV cardiomyopathy or dysplasia (ARVC or ARVD) is a rarehereditary cardiomyopathy, primarily affecting the RV, in which there isloss of myocytes and replacement with fatty/fibrous tissue. Patients maypresent with ventricular arrhythmias; sudden cardiac death may occur.
Echo featuresInspect the RV carefully, looking for one or more of the following (Fig. 18.8):
● dilatation of the RV (diastolic RVOT dimension �30 mm in parasternallong axis view)
● RV dysfunction (RV wall motion abnormalities, or fractional areachange �32 per cent in apical 4-chamber view)
● localised aneurysms of the RV free wall● thickened, echo-reflective moderator band● echo-reflective RV myocardium (due to fatty/fibrous tissue).
For more detailed information on echo assessment of the RV, see Chapter 15. The RV is always involved in ARVC but there may be LVabnormalities as well. The echo findings can sometimes be subtle, makingthe diagnosis of ARVC challenging. Several tests, including cardiac magneticresonance imaging and endomyocardial biopsy, may be needed to establishthe diagnosis.
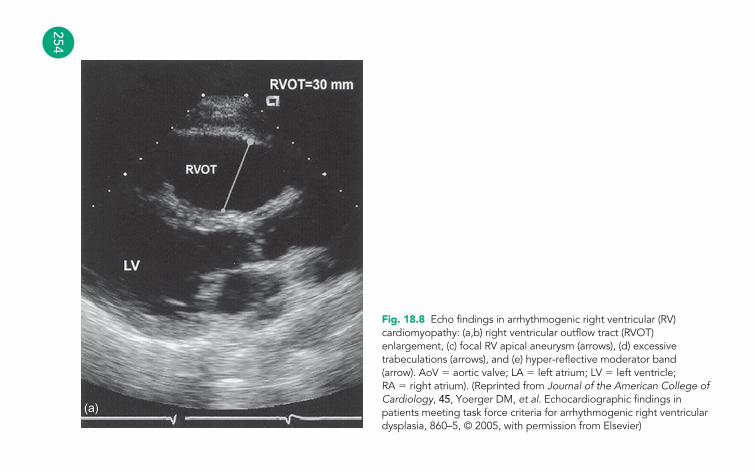
254
(a)
Fig. 18.8 Echo findings in arrhythmogenic right ventricular (RV)cardiomyopathy: (a,b) right ventricular outflow tract (RVOT)enlargement, (c) focal RV apical aneurysm (arrows), (d) excessivetrabeculations (arrows), and (e) hyper-reflective moderator band(arrow). AoV � aortic valve; LA � left atrium; LV � left ventricle;RA � right atrium). (Reprinted from Journal of the American College ofCardiology, 45, Yoerger DM, et al. Echocardiographic findings inpatients meeting task force criteria for arrhythmogenic right ventriculardysplasia, 860–5, © 2005, with permission from Elsevier)
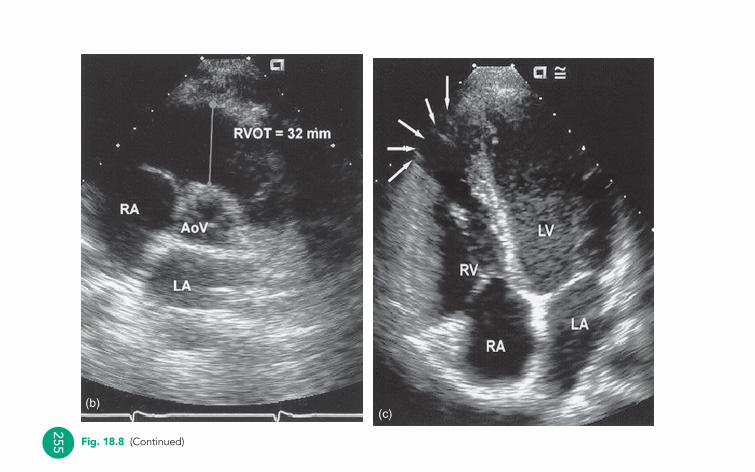
255
(c)
Fig. 18.8 (Continued)
(b)
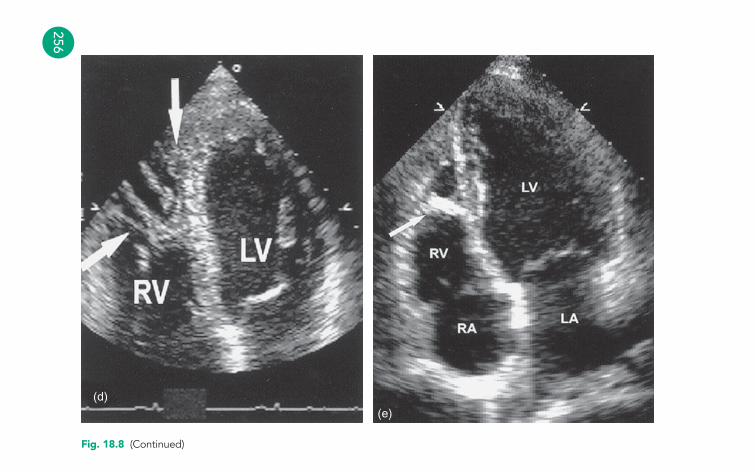
256
(d)(e)
Fig. 18.8 (Continued)
The
card
iom
yop
athi
es
257
FURTHER READING
Elliott P. Diagnosis and management of dilated cardiomyopathy.Heart 2000; 84: 106–12.
Jenni R, Oechslin E, Schneider J, et al. Echocardiographic andpathoanatomical characteristics of isolated left ventricular non-compaction: a step towards classification as a distinctcardiomyopathy. Heart 2001; 86: 666–71.
Jenni R, Oechslin EN, van der Loo B. Isolated ventricular non-compaction of the myocardium in adults. Heart 2007; 93:11–15.
Maron BJ, McKenna WJ, Danielson GK, et al. American College ofCardiology/European Society of Cardiology clinical expertconsensus document on hypertrophic cardiomyopathy. EurHeart J 2003; 24: 1965–91.
Maron BJ, Towbin JA, Thiene G, et al. Contemporary definitionsand classification of the cardiomyopathies Circulation 2006;113: 1807–16.
Nef HM, Möllmann H, Elsässer A. Tako-tsubo cardiomyopathy(apical ballooning). Heart 2007; 93: 1309–15.
Nihoyannopoulos P. British Society of Echocardiography DistanceLearning Module 12: Cardiomyopathies. Accessible from theBSE website (www.bsecho.org).
Richardson P, McKenna W, Bristow M, et al. Reports of the 1995World Health Organization/International Society andFederation of Cardiology task force on the definition andclassification of cardiomyopathies. Circulation 1996; 93: 841–2.
Wood MJ, Picard MH. Utility of echocardiography in the evaluationof individuals with cardiomyopathy. Heart 2004; 90: 707–12.
Yoerger DM, Marcus F, Sherrill D. Echocardiographic findings inpatients meeting task force criteria for arrhythmogenic rightventricular dysplasia. J Am Coll Cardiol 2005; 45: 860–5.
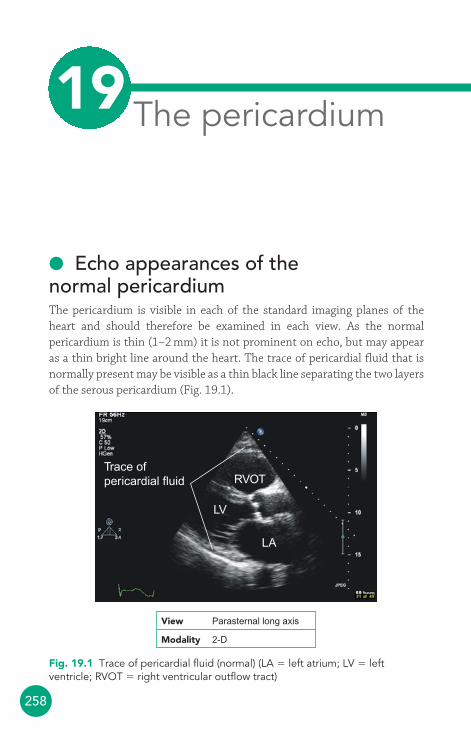
258
● Echo appearances of the normal pericardiumThe pericardium is visible in each of the standard imaging planes of theheart and should therefore be examined in each view. As the normalpericardium is thin (1–2 mm) it is not prominent on echo, but may appearas a thin bright line around the heart. The trace of pericardial fluid that isnormally present may be visible as a thin black line separating the two layersof the serous pericardium (Fig. 19.1).
Trace ofpericardial fluid
LV
LA
RVOT
View Parasternal long axis
Modality 2-D
Fig. 19.1 Trace of pericardial fluid (normal) (LA � left atrium; LV � leftventricle; RVOT � right ventricular outflow tract)
The pericardium19
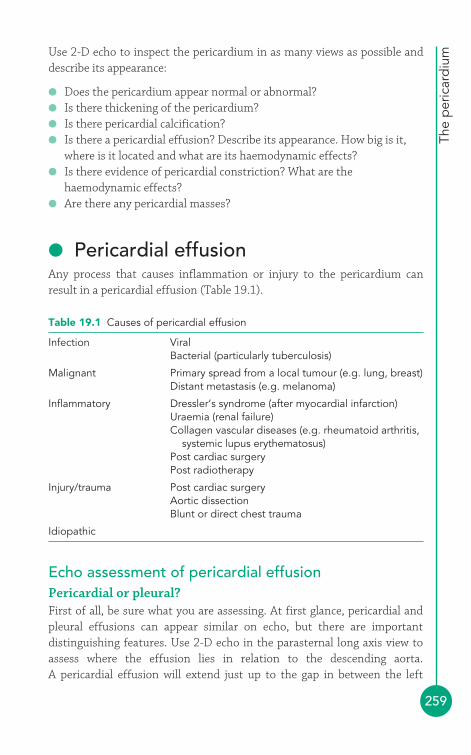
The
per
icar
diu
m
259
Use 2-D echo to inspect the pericardium in as many views as possible anddescribe its appearance:
● Does the pericardium appear normal or abnormal?● Is there thickening of the pericardium?● Is there pericardial calcification?● Is there a pericardial effusion? Describe its appearance. How big is it,
where is it located and what are its haemodynamic effects?● Is there evidence of pericardial constriction? What are the
haemodynamic effects?● Are there any pericardial masses?
● Pericardial effusionAny process that causes inflammation or injury to the pericardium canresult in a pericardial effusion (Table 19.1).
Table 19.1 Causes of pericardial effusion
Infection ViralBacterial (particularly tuberculosis)
Malignant Primary spread from a local tumour (e.g. lung, breast)Distant metastasis (e.g. melanoma)
Inflammatory Dressler’s syndrome (after myocardial infarction)Uraemia (renal failure)Collagen vascular diseases (e.g. rheumatoid arthritis,
systemic lupus erythematosus)Post cardiac surgeryPost radiotherapy
Injury/trauma Post cardiac surgeryAortic dissectionBlunt or direct chest trauma
Idiopathic
Echo assessment of pericardial effusionPericardial or pleural?First of all, be sure what you are assessing. At first glance, pericardial andpleural effusions can appear similar on echo, but there are importantdistinguishing features. Use 2-D echo in the parasternal long axis view toassess where the effusion lies in relation to the descending aorta. A pericardial effusion will extend just up to the gap in between the left
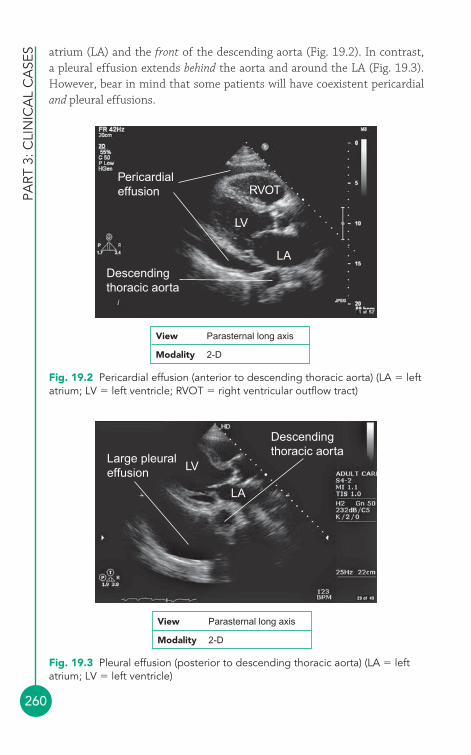
PART
3: C
LIN
ICA
L C
ASE
S
260
atrium (LA) and the front of the descending aorta (Fig. 19.2). In contrast, a pleural effusion extends behind the aorta and around the LA (Fig. 19.3).However, bear in mind that some patients will have coexistent pericardialand pleural effusions.
Pericardialeffusion
Descendingthoracic aorta
LV
LA
RVOT
View Parasternal long axis
Modality 2-D
Fig. 19.2 Pericardial effusion (anterior to descending thoracic aorta) (LA � leftatrium; LV � left ventricle; RVOT � right ventricular outflow tract)
Large pleuraleffusion LV
LA
Descendingthoracic aorta
View Parasternal long axis
Modality 2-D
Fig. 19.3 Pleural effusion (posterior to descending thoracic aorta) (LA � leftatrium; LV � left ventricle)
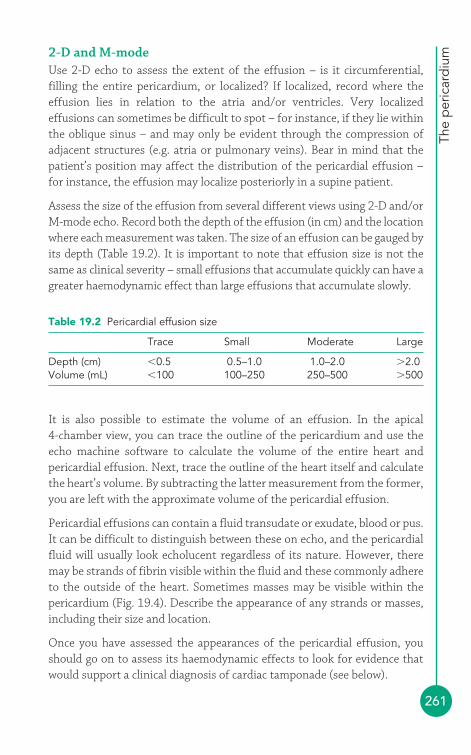
The
per
icar
diu
m
261
2-D and M-modeUse 2-D echo to assess the extent of the effusion – is it circumferential,filling the entire pericardium, or localized? If localized, record where theeffusion lies in relation to the atria and/or ventricles. Very localizedeffusions can sometimes be difficult to spot – for instance, if they lie withinthe oblique sinus – and may only be evident through the compression ofadjacent structures (e.g. atria or pulmonary veins). Bear in mind that thepatient’s position may affect the distribution of the pericardial effusion –for instance, the effusion may localize posteriorly in a supine patient.
Assess the size of the effusion from several different views using 2-D and/orM-mode echo. Record both the depth of the effusion (in cm) and the locationwhere each measurement was taken. The size of an effusion can be gauged byits depth (Table 19.2). It is important to note that effusion size is not thesame as clinical severity – small effusions that accumulate quickly can have agreater haemodynamic effect than large effusions that accumulate slowly.
It is also possible to estimate the volume of an effusion. In the apical 4-chamber view, you can trace the outline of the pericardium and use theecho machine software to calculate the volume of the entire heart andpericardial effusion. Next, trace the outline of the heart itself and calculatethe heart’s volume. By subtracting the latter measurement from the former,you are left with the approximate volume of the pericardial effusion.
Pericardial effusions can contain a fluid transudate or exudate, blood or pus.It can be difficult to distinguish between these on echo, and the pericardialfluid will usually look echolucent regardless of its nature. However, theremay be strands of fibrin visible within the fluid and these commonly adhereto the outside of the heart. Sometimes masses may be visible within thepericardium (Fig. 19.4). Describe the appearance of any strands or masses,including their size and location.
Once you have assessed the appearances of the pericardial effusion, youshould go on to assess its haemodynamic effects to look for evidence thatwould support a clinical diagnosis of cardiac tamponade (see below).
Table 19.2 Pericardial effusion size
Trace Small Moderate Large
Depth (cm) �0.5 0.5–1.0 1.0–2.0 �2.0Volume (mL) �100 100–250 250–500 �500
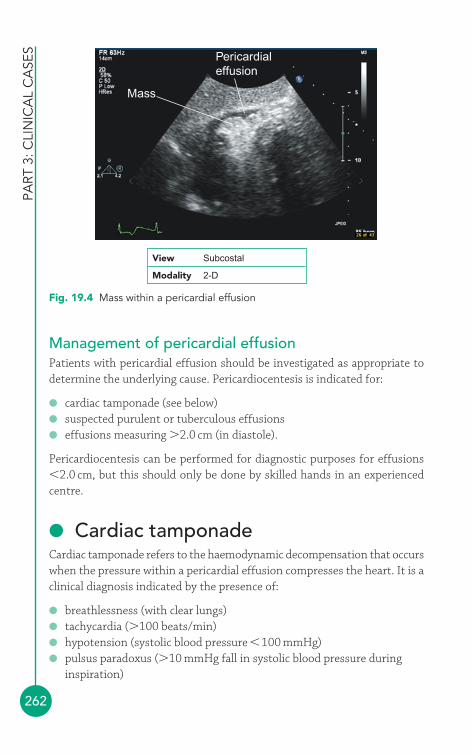
PART
3: C
LIN
ICA
L C
ASE
S
262
Management of pericardial effusionPatients with pericardial effusion should be investigated as appropriate todetermine the underlying cause. Pericardiocentesis is indicated for:
● cardiac tamponade (see below)● suspected purulent or tuberculous effusions● effusions measuring �2.0 cm (in diastole).
Pericardiocentesis can be performed for diagnostic purposes for effusions�2.0 cm, but this should only be done by skilled hands in an experiencedcentre.
● Cardiac tamponadeCardiac tamponade refers to the haemodynamic decompensation that occurswhen the pressure within a pericardial effusion compresses the heart. It is aclinical diagnosis indicated by the presence of:
● breathlessness (with clear lungs)● tachycardia (�100 beats/min)● hypotension (systolic blood pressure �100 mmHg)● pulsus paradoxus (�10 mmHg fall in systolic blood pressure during
inspiration)
Mass
Pericardialeffusion
View Subcostal
Modality 2-D
Fig. 19.4 Mass within a pericardial effusion
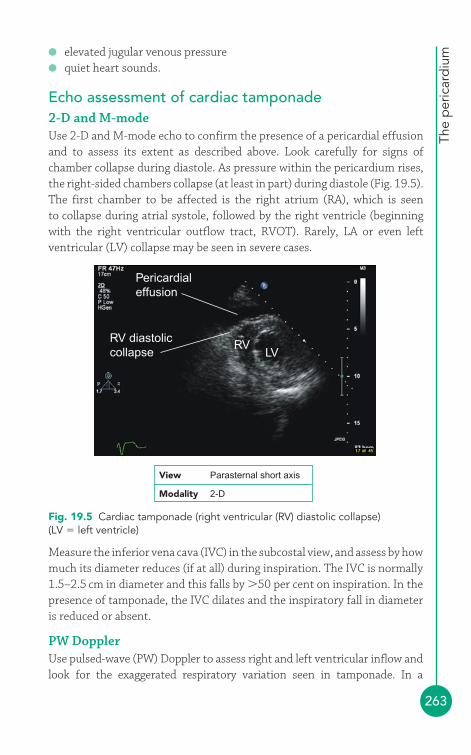
The
per
icar
diu
m
263
Measure the inferior vena cava (IVC) in the subcostal view, and assess by howmuch its diameter reduces (if at all) during inspiration. The IVC is normally1.5–2.5 cm in diameter and this falls by �50 per cent on inspiration. In thepresence of tamponade, the IVC dilates and the inspiratory fall in diameteris reduced or absent.
PW DopplerUse pulsed-wave (PW) Doppler to assess right and left ventricular inflow andlook for the exaggerated respiratory variation seen in tamponade. In a
● elevated jugular venous pressure● quiet heart sounds.
Echo assessment of cardiac tamponade2-D and M-modeUse 2-D and M-mode echo to confirm the presence of a pericardial effusionand to assess its extent as described above. Look carefully for signs ofchamber collapse during diastole. As pressure within the pericardium rises,the right-sided chambers collapse (at least in part) during diastole (Fig. 19.5).The first chamber to be affected is the right atrium (RA), which is seento collapse during atrial systole, followed by the right ventricle (beginningwith the right ventricular outflow tract, RVOT). Rarely, LA or even leftventricular (LV) collapse may be seen in severe cases.
RV diastoliccollapse
Pericardialeffusion
RVLV
View Parasternal short axis
Modality 2-D
Fig. 19.5 Cardiac tamponade (right ventricular (RV) diastolic collapse)(LV � left ventricle)
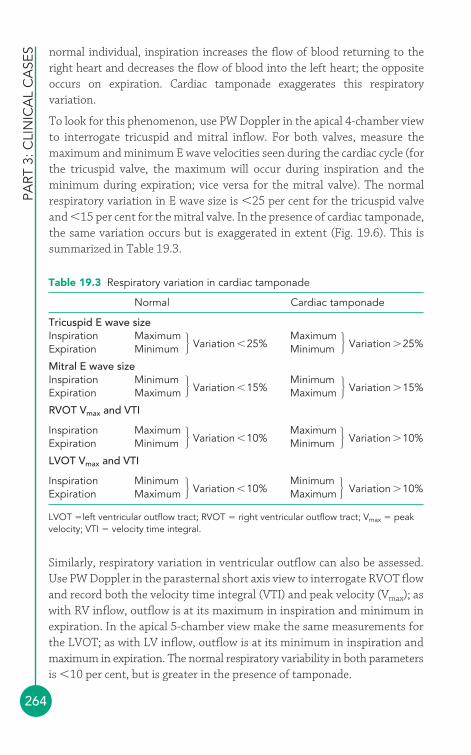
PART
3: C
LIN
ICA
L C
ASE
S
264
Table 19.3 Respiratory variation in cardiac tamponade
Normal Cardiac tamponade
Tricuspid E wave sizeInspiration Maximum
Variation �25%Maximum
Variation �25%Expiration Minimum Minimum
Mitral E wave sizeInspiration Minimum
Variation �15%Minimum
Variation �15%Expiration Maximum Maximum
RVOT Vmax and VTI
Inspiration MaximumVariation �10%
MaximumVariation �10%Expiration Minimum Minimum
LVOT Vmax and VTI
Inspiration MinimumVariation �10%
MinimumVariation �10%Expiration Maximum Maximum
LVOT �left ventricular outflow tract; RVOT � right ventricular outflow tract; Vmax � peakvelocity; VTI � velocity time integral.
�
�
�
�
� �
�
�
normal individual, inspiration increases the flow of blood returning to theright heart and decreases the flow of blood into the left heart; the oppositeoccurs on expiration. Cardiac tamponade exaggerates this respiratoryvariation.
To look for this phenomenon, use PW Doppler in the apical 4-chamber viewto interrogate tricuspid and mitral inflow. For both valves, measure themaximum and minimum E wave velocities seen during the cardiac cycle (forthe tricuspid valve, the maximum will occur during inspiration and theminimum during expiration; vice versa for the mitral valve). The normalrespiratory variation in E wave size is �25 per cent for the tricuspid valveand �15 per cent for the mitral valve. In the presence of cardiac tamponade,the same variation occurs but is exaggerated in extent (Fig. 19.6). This issummarized in Table 19.3.
Similarly, respiratory variation in ventricular outflow can also be assessed.Use PW Doppler in the parasternal short axis view to interrogate RVOT flowand record both the velocity time integral (VTI) and peak velocity (Vmax); aswith RV inflow, outflow is at its maximum in inspiration and minimum inexpiration. In the apical 5-chamber view make the same measurements forthe LVOT; as with LV inflow, outflow is at its minimum in inspiration andmaximum in expiration. The normal respiratory variability in both parametersis �10 per cent, but is greater in the presence of tamponade.
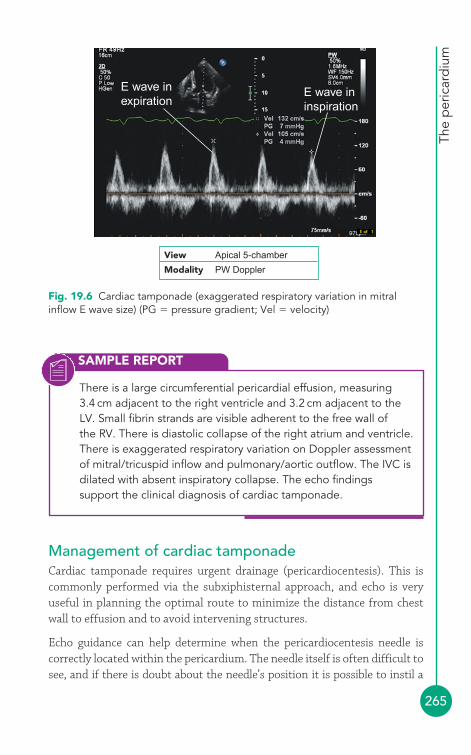
The
per
icar
diu
m
265
Management of cardiac tamponadeCardiac tamponade requires urgent drainage (pericardiocentesis). This iscommonly performed via the subxiphisternal approach, and echo is veryuseful in planning the optimal route to minimize the distance from chestwall to effusion and to avoid intervening structures.
Echo guidance can help determine when the pericardiocentesis needle iscorrectly located within the pericardium. The needle itself is often difficult tosee, and if there is doubt about the needle’s position it is possible to instil a
SAMPLE REPORT
There is a large circumferential pericardial effusion, measuring3.4 cm adjacent to the right ventricle and 3.2 cm adjacent to theLV. Small fibrin strands are visible adherent to the free wall of the RV. There is diastolic collapse of the right atrium and ventricle.There is exaggerated respiratory variation on Doppler assessmentof mitral/tricuspid inflow and pulmonary/aortic outflow. The IVC isdilated with absent inspiratory collapse. The echo findingssupport the clinical diagnosis of cardiac tamponade.
View Apical 5-chamber
Modality PW Doppler
E wave inexpiration
E wave ininspiration
Fig. 19.6 Cardiac tamponade (exaggerated respiratory variation in mitralinflow E wave size) (PG � pressure gradient; Vel � velocity)

PART
3: C
LIN
ICA
L C
ASE
S
266
small amount of agitated saline (9.5 mL of sterile saline agitated with 0.5 mLof air in a 10 mL syringe, to create a suspension of small air bubbles) throughthe needle that can be detected by echo screening as bubble contrast within the effusion. If the pericardiocentesis needle has inadvertently punctured theheart, the bubbles will be seen within one of the cardiac chambers instead.
● Pericardial constrictionThickening and fibrosis of the serous pericardium can constrict the heart, likea rigid envelope, impairing filling of the ventricles in diastole. Filling of theheart in early diastole is rapid but then abruptly stops as the diastolic pressureplateaus. The diastolic pressures in the right and left ventricles become equal.
Pericardial constriction can result from pericardial inflammation, often after along delay, and is most common after tuberculous pericarditis, radiotherapyand cardiac surgery.
Clinical features of pericardial constrictionThe clinical features of pericardial constriction (Table 19.4) tend to be vagueand the diagnosis is often delayed or missed altogether.
Table 19.4 Clinical features of pericardial constriction
Symptoms Signs
Fatigue Elevated jugular venous pressureBreathlessness Hypotension with low pulse pressureAbdominal swelling and discomfort Quiet heart sounds
Pleural effusionsHepatomegalyAscitesPeripheral oedemaMuscle wasting
Echo assessment of pericardial constriction2-D and M-modeUse 2-D and M-mode echo to assess the structure of the pericardium inseveral different views:
● Is the pericardium thickened? This can be difficult to assess on echoand is more accurately assessed with cardiac computed tomography(CT) or magnetic resonance imaging (MRI).
The
per
icar
diu
m
267
● Is there any calcification of the pericardium? Is this localized orgeneralized?
LV dimensions and function will usually be normal. M-mode assessment ofthe ventricular septum in the parasternal long axis view may show:
● abrupt posterior motion early in diastole, caused by rapid rightventricular diastolic filling, followed by
● little motion in mid-diastole, caused by equalization of right and leftventricular pressures, followed by
● abrupt anterior motion at the end of diastole (after atrial contraction)as there is further RV filling.
There may also be a ventricular septal ‘bounce’ during inspiration. Increasedfilling of the RV during inspiration causes the septum to shift over to theleft, as the constraints imposed by the pericardium lead to ventricularinterdependence. This can be seen as a shift in the ventricular septumtowards the LV with inspiration and towards the RV with expiration.
Measure the LA in the parasternal long axis view – it enlarges as a result ofthe chronically elevated LV diastolic pressure. The RA also enlarges.
Measure the IVC in the subcostal view, and assess how much it collapsesduring inspiration. The IVC is normally 1.5–2.5 cm in diameter and collapsesby �50 per cent on inspiration. In the presence of pericardial constriction,the IVC dilates and inspiratory collapse is reduced or absent.
PW DopplerUse PW Doppler to assess right and left ventricular inflow and look forexaggerated respiratory variation, as seen in cardiac tamponade (see above).
Look particularly carefully at mitral valve inflow, as recorded by PW Dopplerin the apical 4-chamber view. Pericardial constriction causes:
● an exaggeration of the normal E/A ratio (the E wave is larger thannormal and the A wave is smaller)
● a rapid E-wave deceleration time (normally �160 ms).
Pericardial constriction versus restrictivecardiomyopathyThe differentiation between pericardial constriction and restrictive cardiomyopathy can be challenging and makes a popular topic for echo

PART
3: C
LIN
ICA
L C
ASE
S
268
accreditation examinations! Restrictive cardiomyopathy is discussed inChapter 18. It shares many of the clinical features of pericardial constriction,so using investigations appropriately to distinguish between the two isimportant. Table 19.5 lists some of the echo features that can help todistinguish constriction from restriction.
Table 19.5 Pericardial constriction versus restrictive cardiomyopathy
Pericardial constriction Restrictive cardiomyopathy
Pericardium Usually thickened NormalAtrial enlargement Mild-moderate Moderate-severeMitral inflow E wave respiratory E wave respiratory
variation �25% variation �15 per centTricuspid inflow E wave respiratory E wave respiratory
variation �25% variation �15 per centVentricular septal Abrupt early diastolic Normal
motion motion
SAMPLE REPORT
The pericardium appears thickened and calcification is present.Both atria are mildly enlarged. The mitral and tricuspid inflows (E wave) show a variation of �25 per cent between inspiration andexpiration. Mitral inflow also shows an exaggerated E/A ratio anda rapid E-wave deceleration time. There is abrupt early diastolicmotion of the ventricular septum. The IVC is dilated with reducedinspiratory variation in diameter. There is no pericardial effusion.The echo findings support the clinical diagnosis of pericardialconstriction.
Management of pericardial constrictionSurgical intervention (pericardiectomy) is the definitive treatment forpermanent pericardial constriction, with a mortality of 6–12 per cent andnormalization of haemodynamic parameters in around 60 per cent.
● Other pericardial abnormalitiesCongenital absence of the pericardiumCongenital absence is a rare abnormality (around 1:10 000) that can affectpart (left more commonly than the right) or all of the pericardium. Patients

The
per
icar
diu
m
269
are usually asymptomatic, but it is possible for parts of the heart to becomeherniated or even strangulated through gaps in the pericardium. With partialabsence of the pericardium, herniation of part of the heart may be apparenton 2-D echo. With complete absence of the pericardium, the position of theheart as a whole may be abnormal (usually rotated posteriorly).
Pericardial cystsPericardial cysts are discussed on page 291. Small loculated pericardialeffusions can be mistaken for congenital cysts.
Pericardial tumoursPericardial tumours are rare. They can be primary or secondary and includesuch tumours as lipoma, liposarcoma, mesothelioma and lymphoma. Thepresence of any pericardial masses should be noted and their appearancedescribed as fully as possible.
FURTHER READING
Hancock EW. Differential diagnosis of restrictive cardiomyopathyand constrictive pericarditis. Heart 2001; 86: 343–9.
Malik I. British Society of Echocardiography Distance LearningModule 2: The Echo Differentiation of Restriction andConstriction. Accessible from the BSE website(www.bsecho.org).
Oakley CM. Myocarditis, pericarditis and other pericardialdiseases. Heart 2000; 84: 449–54.
Soler-Soler J, Sagristà-Sauleda J, Permanyer-Miralda G.Management of pericardial effusion. Heart 2001; 86: 235–40.
The Task Force on the Diagnosis and Management of PericardialDiseases of the European Society of Cardiology. Guidelines onthe diagnosis and management of pericardial diseases:executive summary. Eur Heart J 2004; 25: 587–610.
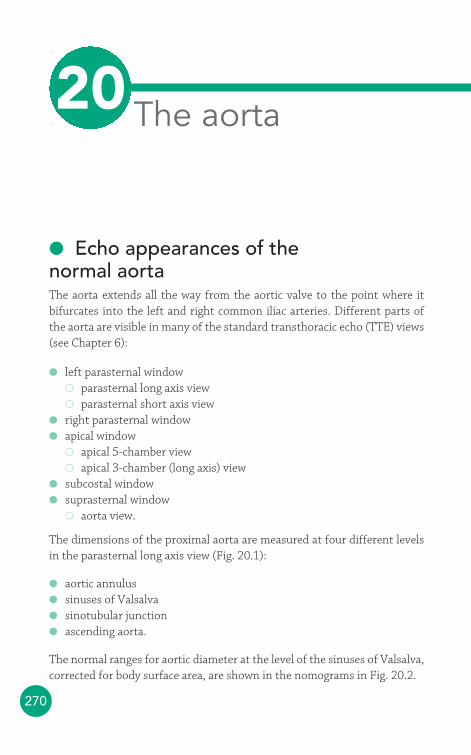
270
● Echo appearances of the normal aortaThe aorta extends all the way from the aortic valve to the point where itbifurcates into the left and right common iliac arteries. Different parts ofthe aorta are visible in many of the standard transthoracic echo (TTE) views(see Chapter 6):
● left parasternal window� parasternal long axis view� parasternal short axis view
● right parasternal window● apical window
� apical 5-chamber view� apical 3-chamber (long axis) view
● subcostal window● suprasternal window
� aorta view.
The dimensions of the proximal aorta are measured at four different levelsin the parasternal long axis view (Fig. 20.1):
● aortic annulus● sinuses of Valsalva● sinotubular junction● ascending aorta.
The normal ranges for aortic diameter at the level of the sinuses of Valsalva,corrected for body surface area, are shown in the nomograms in Fig. 20.2.
The aorta20
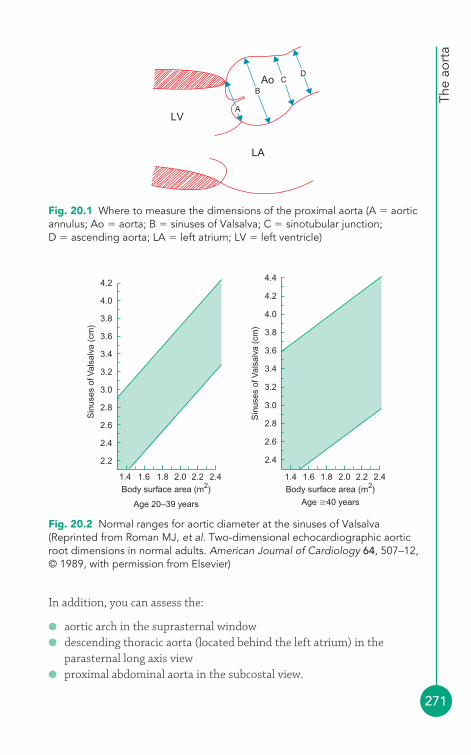
The
aort
a
271
In addition, you can assess the:
● aortic arch in the suprasternal window● descending thoracic aorta (located behind the left atrium) in the
parasternal long axis view● proximal abdominal aorta in the subcostal view.
LV
LA
Ao
A
BC
D
Fig. 20.1 Where to measure the dimensions of the proximal aorta (A � aorticannulus; Ao � aorta; B � sinuses of Valsalva; C � sinotubular junction;D � ascending aorta; LA � left atrium; LV � left ventricle)
Body surface area (m2)
Age 20–39 years
2.2
2.4
2.6
2.8
3.0
Sin
uses
of V
alsa
lva
(cm
)
3.2
3.4
3.6
3.8
4.0
4.2
1.4 1.6 1.8 2.0 2.2 2.4Body surface area (m2)
Age �40 years
1.4
2.4
2.6
2.8
3.0
3.2
Sin
uses
of V
alsa
lva
(cm
)
3.4
3.6
3.8
4.0
4.2
4.4
1.6 1.8 2.0 2.2 2.4
Fig. 20.2 Normal ranges for aortic diameter at the sinuses of Valsalva(Reprinted from Roman MJ, et al. Two-dimensional echocardiographic aorticroot dimensions in normal adults. American Journal of Cardiology 64, 507–12,© 1989, with permission from Elsevier)
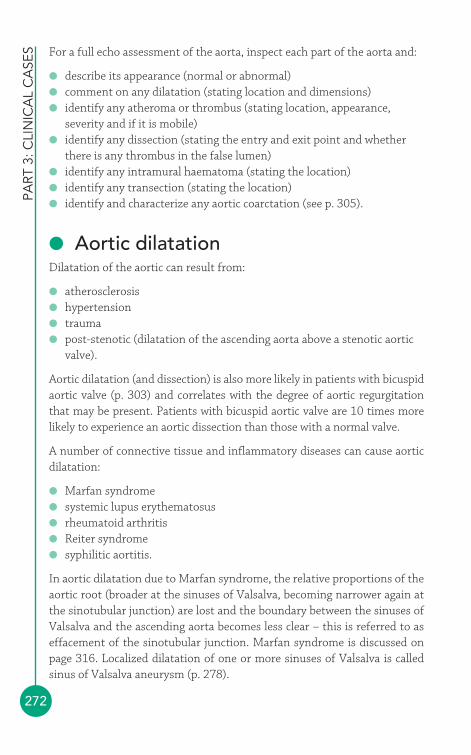
PART
3: C
LIN
ICA
L C
ASE
S
272
For a full echo assessment of the aorta, inspect each part of the aorta and:
● describe its appearance (normal or abnormal)● comment on any dilatation (stating location and dimensions)● identify any atheroma or thrombus (stating location, appearance,
severity and if it is mobile)● identify any dissection (stating the entry and exit point and whether
there is any thrombus in the false lumen)● identify any intramural haematoma (stating the location)● identify any transection (stating the location)● identify and characterize any aortic coarctation (see p. 305).
● Aortic dilatationDilatation of the aortic can result from:
● atherosclerosis● hypertension● trauma● post-stenotic (dilatation of the ascending aorta above a stenotic aortic
valve).
Aortic dilatation (and dissection) is also more likely in patients with bicuspidaortic valve (p. 303) and correlates with the degree of aortic regurgitationthat may be present. Patients with bicuspid aortic valve are 10 times morelikely to experience an aortic dissection than those with a normal valve.
A number of connective tissue and inflammatory diseases can cause aorticdilatation:
● Marfan syndrome● systemic lupus erythematosus● rheumatoid arthritis● Reiter syndrome● syphilitic aortitis.
In aortic dilatation due to Marfan syndrome, the relative proportions of theaortic root (broader at the sinuses of Valsalva, becoming narrower again atthe sinotubular junction) are lost and the boundary between the sinuses ofValsalva and the ascending aorta becomes less clear – this is referred to aseffacement of the sinotubular junction. Marfan syndrome is discussed onpage 316. Localized dilatation of one or more sinuses of Valsalva is calledsinus of Valsalva aneurysm (p. 278).
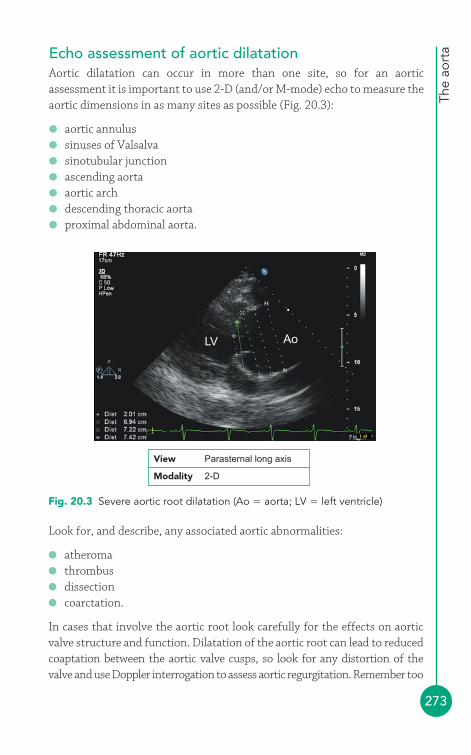
The
aort
a
273
Echo assessment of aortic dilatationAortic dilatation can occur in more than one site, so for an aorticassessment it is important to use 2-D (and/or M-mode) echo to measure theaortic dimensions in as many sites as possible (Fig. 20.3):
● aortic annulus● sinuses of Valsalva● sinotubular junction● ascending aorta● aortic arch● descending thoracic aorta● proximal abdominal aorta.
LV Ao
Fig. 20.3 Severe aortic root dilatation (Ao � aorta; LV � left ventricle)
Look for, and describe, any associated aortic abnormalities:
● atheroma● thrombus● dissection● coarctation.
In cases that involve the aortic root look carefully for the effects on aorticvalve structure and function. Dilatation of the aortic root can lead to reducedcoaptation between the aortic valve cusps, so look for any distortion of thevalve and use Doppler interrogation to assess aortic regurgitation. Remember too
View Parasternal long axis
Modality 2-D
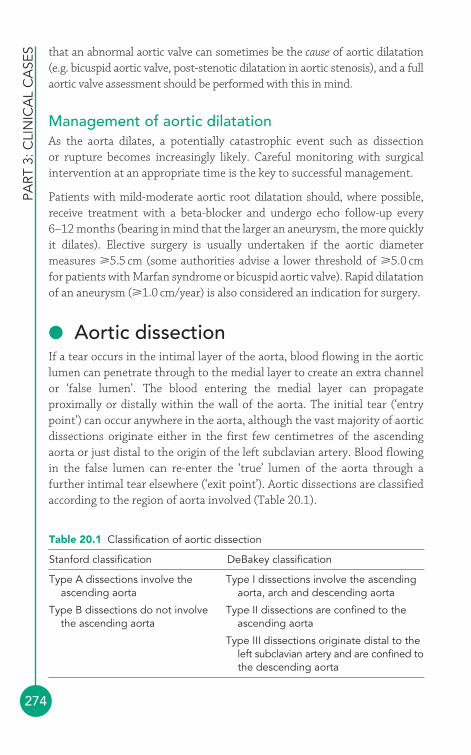
PART
3: C
LIN
ICA
L C
ASE
S
274
that an abnormal aortic valve can sometimes be the cause of aortic dilatation(e.g. bicuspid aortic valve, post-stenotic dilatation in aortic stenosis), and a fullaortic valve assessment should be performed with this in mind.
Management of aortic dilatationAs the aorta dilates, a potentially catastrophic event such as dissection or rupture becomes increasingly likely. Careful monitoring with surgicalintervention at an appropriate time is the key to successful management.
Patients with mild-moderate aortic root dilatation should, where possible,receive treatment with a beta-blocker and undergo echo follow-up every6–12 months (bearing in mind that the larger an aneurysm, the more quicklyit dilates). Elective surgery is usually undertaken if the aortic diametermeasures 5.5 cm (some authorities advise a lower threshold of 5.0 cm for patients with Marfan syndrome or bicuspid aortic valve). Rapid dilatationof an aneurysm (1.0 cm/year) is also considered an indication for surgery.
● Aortic dissectionIf a tear occurs in the intimal layer of the aorta, blood flowing in the aorticlumen can penetrate through to the medial layer to create an extra channelor ‘false lumen’. The blood entering the medial layer can propagateproximally or distally within the wall of the aorta. The initial tear (‘entrypoint’) can occur anywhere in the aorta, although the vast majority of aorticdissections originate either in the first few centimetres of the ascendingaorta or just distal to the origin of the left subclavian artery. Blood flowingin the false lumen can re-enter the ‘true’ lumen of the aorta through afurther intimal tear elsewhere (‘exit point’). Aortic dissections are classifiedaccording to the region of aorta involved (Table 20.1).
Table 20.1 Classification of aortic dissection
Stanford classification DeBakey classification
Type A dissections involve the Type I dissections involve the ascendingascending aorta aorta, arch and descending aorta
Type B dissections do not involve Type II dissections are confined to thethe ascending aorta ascending aorta
Type III dissections originate distal to theleft subclavian artery and are confined tothe descending aorta
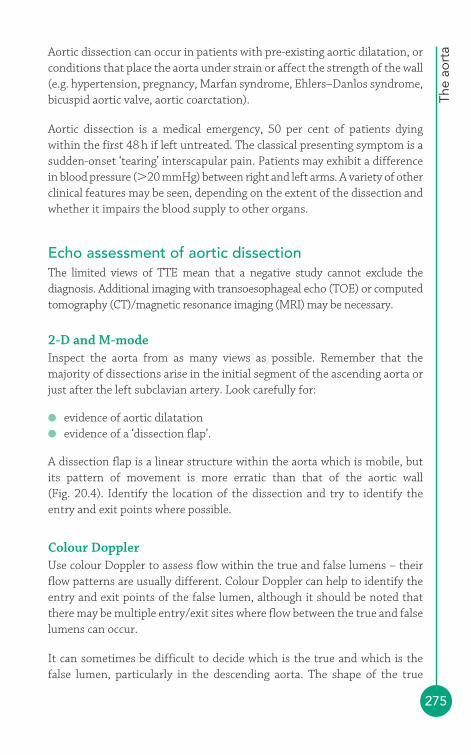
The
aort
a
275
Aortic dissection can occur in patients with pre-existing aortic dilatation, orconditions that place the aorta under strain or affect the strength of the wall(e.g. hypertension, pregnancy, Marfan syndrome, Ehlers–Danlos syndrome,bicuspid aortic valve, aortic coarctation).
Aortic dissection is a medical emergency, 50 per cent of patients dyingwithin the first 48 h if left untreated. The classical presenting symptom is asudden-onset ‘tearing’ interscapular pain. Patients may exhibit a differencein blood pressure (�20 mmHg) between right and left arms. A variety of otherclinical features may be seen, depending on the extent of the dissection andwhether it impairs the blood supply to other organs.
Echo assessment of aortic dissectionThe limited views of TTE mean that a negative study cannot exclude thediagnosis. Additional imaging with transoesophageal echo (TOE) or computedtomography (CT)/magnetic resonance imaging (MRI) may be necessary.
2-D and M-modeInspect the aorta from as many views as possible. Remember that themajority of dissections arise in the initial segment of the ascending aorta orjust after the left subclavian artery. Look carefully for:
● evidence of aortic dilatation● evidence of a ‘dissection flap’.
A dissection flap is a linear structure within the aorta which is mobile, butits pattern of movement is more erratic than that of the aortic wall(Fig. 20.4). Identify the location of the dissection and try to identify theentry and exit points where possible.
Colour DopplerUse colour Doppler to assess flow within the true and false lumens – theirflow patterns are usually different. Colour Doppler can help to identify theentry and exit points of the false lumen, although it should be noted thatthere may be multiple entry/exit sites where flow between the true and falselumens can occur.
It can sometimes be difficult to decide which is the true and which is thefalse lumen, particularly in the descending aorta. The shape of the true
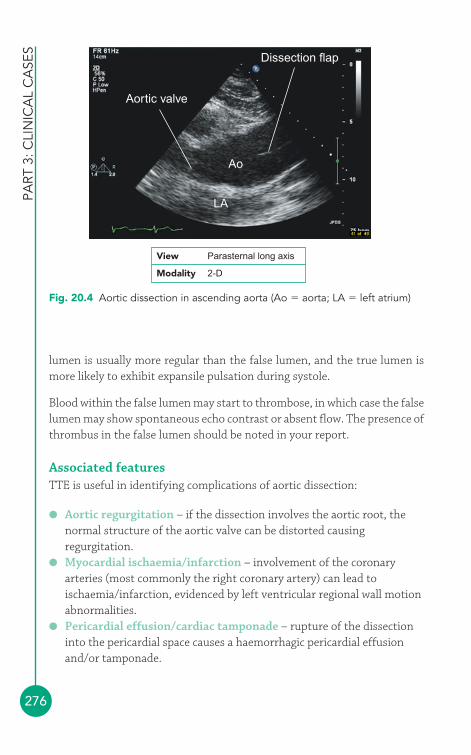
PART
3: C
LIN
ICA
L C
ASE
S
276
lumen is usually more regular than the false lumen, and the true lumen ismore likely to exhibit expansile pulsation during systole.
Blood within the false lumen may start to thrombose, in which case the falselumen may show spontaneous echo contrast or absent flow. The presence ofthrombus in the false lumen should be noted in your report.
Associated featuresTTE is useful in identifying complications of aortic dissection:
● Aortic regurgitation – if the dissection involves the aortic root, thenormal structure of the aortic valve can be distorted causingregurgitation.
● Myocardial ischaemia/infarction – involvement of the coronaryarteries (most commonly the right coronary artery) can lead toischaemia/infarction, evidenced by left ventricular regional wall motionabnormalities.
● Pericardial effusion/cardiac tamponade – rupture of the dissectioninto the pericardial space causes a haemorrhagic pericardial effusionand/or tamponade.
Aortic valve
LA
Ao
Dissection flap
Fig. 20.4 Aortic dissection in ascending aorta (Ao � aorta; LA � left atrium)
View Parasternal long axis
Modality 2-D

The
aort
a
277
Management of aortic dissectionPatients with aortic dissection may be critically ill and haemodynamicallycompromised, requiring urgent stabilization. Dissections involving theascending aorta are managed with urgent surgical intervention. Dissectionsconfined to the descending aorta are usually managed pharmacologically(e.g. assiduous control of hypertension), with surgery being reserved for anycomplications (e.g. rupture) that may occur.
SAMPLE REPORT
The aortic root is dilated (diameter 5.8 cm at the level of thesinuses of Valsalva). There is a linear echogenic structure witherratic movement arising in the aortic root and extending to thedescending aorta, just distal to the origin of the left subclavianartery, indicative of an aortic dissection flap. A false lumen isnoted containing blood flow on colour Doppler, with an entrypoint at the sinotubular junction. There is poor apposition of theaortic valve cusps and moderate aortic regurgitation. There is nopericardial effusion. Left ventricular function is normal. Theappearances indicate an aortic dissection (Stanford Type A) with adilated aortic root and moderate aortic regurgitation.
PITFALLS IN THE ECHO ASSESSMENT OF AORTICDISSECTION
● False negative diagnosis – a normal TTE study does notexclude an aortic dissection.
● False positive diagnosis – echo artefact within the aortic lumencan be mistaken for dissection. Typical causes of artefactinclude reverberation or beam-width artefact (p. 28). Artefactsusually lack the chaotic motion seen with a dissection flap.
● In a patient with acute chest pain and left ventricular wallmotion abnormality, always check for aortic dissection as apotential cause of the myocardial ischaemia/infarction.
!
PART
3: C
LIN
ICA
L C
ASE
S
278
● Sinus of Valsalva aneurysmJust above the level of the aortic valve lie the three sinuses of Valsalva, eachone corresponding to one of the aortic valve cusps (right coronary, leftcoronary and non-coronary). Although any of the sinuses of Valsalva candevelop aneurysmal dilatation, the right sinus is affected most commonly(around two-thirds of cases) and the non-coronary sinus in around a quarterof cases; the left sinus is seldom affected.
Sinus of Valsalva aneurysm can be congenital, occurring as a result of anabnormality of the aortic media and elastic tissue, leading to dilatation of asingle sinus. Congenital aneurysms can become elongated and are classicallydescribed as having a ‘windsock’ appearance on echo. Acquired causesinclude atherosclerosis, endocarditis, cystic medial necrosis, chest traumaand syphilis. Acquired cases often affect all three sinuses. Sinus of Valsalvaaneurysm is seen in around 10 per cent of patients with Marfan syndrome.
Sinus of Valsalva aneurysm can lead to:
● aortic regurgitation● compression or distortion of local structures (e.g. coronary arteries,
right ventricular outflow tract, conduction system)● rupture of the aneurysm into an adjacent structure (most commonly
the right ventricle or right atrium, or more rarely into the left heartchambers, pulmonary artery or pericardium).
Echo assessment of sinus of Valsalva aneurysm includes:
● measurement of aortic root dimensions● description of the sinus(es) involved
INTRAMURAL HAEMATOMA
Intramural haematoma can present with similar symptoms to aorticdissection and is managed similarly. However, in intramuralhaematoma there is bleeding into the aortic medial layer not fromthe aortic lumen but from vessels that supply the aorta itself –there is therefore no communication between the blood in theaorta and in the haematoma. Intramural haematoma cannevertheless lead to aortic dissection or rupture. On echo, anintramural haematoma appears as an echogenic ‘mass’ within thewall of the aorta, between the intimal and adventitial layers.
i
The
aort
a
279
● assessment of aortic valve structure and function, looking in particularfor aortic regurgitation
● looking for evidence of compression or distortion of any neighbouringstructures by the aneurysm
● assessment of whether rupture is present, which chamber is involved,and what the haemodynamic effects are
● looking for associated abnormalities (ventricular septal defect, bicuspidaortic valve).
Repair of a ruptured sinus of Valsalva aneurysm can be performed surgically orpercutaneously, using an occluder device. Unruptured aneurysms can berepaired surgically, although the optimal timing of such surgery is controversial.
● Aortic atheromaAtherosclerotic plaques can form in the aorta, particularly in patients withvascular disease elsewhere (e.g. coronary artery disease, cerebrovasculardisease, peripheral vascular disease). Aortic atheroma is seen in thedescending aorta more frequently than in the ascending aorta, and is beststudied with TOE (but it may be seen during TTE studies too).
Clinical features of aortic atheromaAortic atheroma is commonly an incidental finding and in itself is thereforeoften asymptomatic. However, it can be a source for arterial embolidownstream of the plaque, causing stroke and/or peripheral emboli.Atheromatous disease of the aorta can also be a precursor to dilatation ofthe aorta and/or to aortic dissection (see above).
Patients with aortic atheroma may have atheromatous disease elsewhere inthe arterial system, and this can cause symptoms, e.g.:
● coronary artery disease – causing angina and/or acute coronarysyndromes
● cerebrovascular disease – causing transient ischaemic attacks and/orstroke
● peripheral vascular disease – causing intermittent claudication.
Review patients with aortic atheroma for symptoms and signs of vasculardisease, and also for major treatable risk factors for vascular disease:
● hyperlipidaemia● tobacco consumption
PART
3: C
LIN
ICA
L C
ASE
S
280
Management of aortic atheromaCounsel patients with aortic atheroma about risk factor management (e.g.quitting smoking, dietary modification). Drug treatment with an antiplateletdrug (e.g. aspirin) and a statin is often appropriate. Atheroma associated withaortic dilatation or dissection may require surgical intervention.
● diabetes mellitus● hypertension.
Echo assessment of aortic atheromaUse 2-D echo to examine the aorta for the presence of atheroma. Ifatheroma is present, describe its location:
● aortic root● ascending aorta● aortic arch● descending thoracic aorta● abdominal aorta.
Describe the appearance of the atheroma:
● Is there any calcification of the atheroma?● Is there protrusion of the atheroma into the lumen of the vessel? How
thick is any protruding plaque?● Is the atheroma mobile?● Is the atheromatous plaque ulcerated?
Finally, you should grade the extent of any aortic atheroma as mild, moderateor severe. Although these gradings are not clearly defined, it is reasonable toregard plaque disease that is mobile, ulcerated and/or protruding with athickness of 5 mm or more as ‘severe’.
SAMPLE REPORT
There is mild calcified atheromatous plaque visible in theascending aorta, and moderate calcified plaque in the aortic arch,protruding into the aortic lumen with a thickness up to 3 mm. Theatheromatous plaque is not mobile.
The
aort
a
281
FURTHER READING
Anderson RH. Clinical anatomy of the aortic root. Heart 2000; 84:670–3.
Erbel R, Eggebrecht H. Aortic dimensions and the risk ofdissection. Heart 2006; 92: 137–42.
Nataf P, Lansac E. Dilation of the thoracic aorta: medical andsurgical management. Heart 2006; 92: 1345–52.
The Task Force on Aortic Dissection, European Society ofCardiology. Diagnosis and management of aortic dissection.Eur Heart J 2001; 22: 1642–81.
Von Kodolitsch Y, Robinson PN. Marfan syndrome: an update ofgenetics, medical and surgical management. Heart 2007; 93:755–60.
282
4The finding of a cardiac mass often has significant clinical implications andtherefore apparent masses need careful echo evaluation to determine, as faras possible, their likely nature. Some harmless structures, such as the rightventricular (RV) moderator band, can give the appearance of a mass, and soit is particularly important to try to distinguish a mass that it pathologicalfrom one that is a normal variant. Cardiac masses on echo can result from:
● tumours� primary cardiac tumours
– benign– malignant
� secondary cardiac tumours● thrombus● vegetations● normal variants and other conditions
� moderator band� Lambl’s excrescences� Eustachian valve� Chiari network� lipomatous hypertrophy of the interatrial septum� dilated vessels� cysts� implanted devices.
● TumoursThe echo assessment of a cardiac tumour should include a description of its:
● Size (measure its dimensions)● Location● Shape (e.g. spherical, pedunculated, papillary, flat)
Cardiac masses421
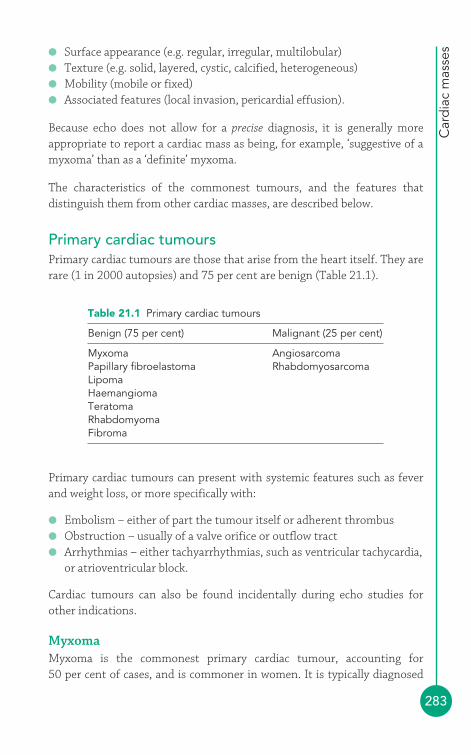
Car
dia
c m
asse
s
283
● Surface appearance (e.g. regular, irregular, multilobular)● Texture (e.g. solid, layered, cystic, calcified, heterogeneous)● Mobility (mobile or fixed)● Associated features (local invasion, pericardial effusion).
Because echo does not allow for a precise diagnosis, it is generally moreappropriate to report a cardiac mass as being, for example, ‘suggestive of amyxoma’ than as a ‘definite’ myxoma.
The characteristics of the commonest tumours, and the features thatdistinguish them from other cardiac masses, are described below.
Primary cardiac tumoursPrimary cardiac tumours are those that arise from the heart itself. They arerare (1 in 2000 autopsies) and 75 per cent are benign (Table 21.1).
Primary cardiac tumours can present with systemic features such as feverand weight loss, or more specifically with:
● Embolism – either of part the tumour itself or adherent thrombus● Obstruction – usually of a valve orifice or outflow tract● Arrhythmias – either tachyarrhythmias, such as ventricular tachycardia,
or atrioventricular block.
Cardiac tumours can also be found incidentally during echo studies forother indications.
MyxomaMyxoma is the commonest primary cardiac tumour, accounting for 50 per cent of cases, and is commoner in women. It is typically diagnosed
Table 21.1 Primary cardiac tumours
Benign (75 per cent) Malignant (25 per cent)
Myxoma AngiosarcomaPapillary fibroelastoma RhabdomyosarcomaLipomaHaemangiomaTeratomaRhabdomyomaFibroma
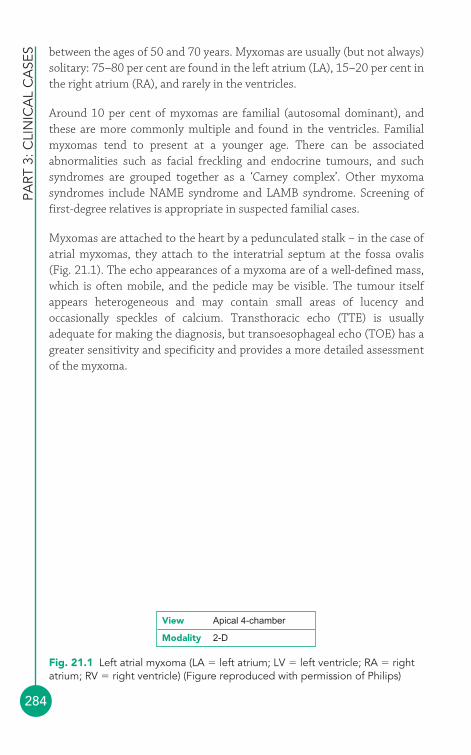
PART
3: C
LIN
ICA
L C
ASE
S
284
between the ages of 50 and 70 years. Myxomas are usually (but not always)solitary: 75–80 per cent are found in the left atrium (LA), 15–20 per cent inthe right atrium (RA), and rarely in the ventricles.
Around 10 per cent of myxomas are familial (autosomal dominant), andthese are more commonly multiple and found in the ventricles. Familialmyxomas tend to present at a younger age. There can be associatedabnormalities such as facial freckling and endocrine tumours, and suchsyndromes are grouped together as a ‘Carney complex’. Other myxomasyndromes include NAME syndrome and LAMB syndrome. Screening offirst-degree relatives is appropriate in suspected familial cases.
Myxomas are attached to the heart by a pedunculated stalk – in the case ofatrial myxomas, they attach to the interatrial septum at the fossa ovalis (Fig. 21.1). The echo appearances of a myxoma are of a well-defined mass,which is often mobile, and the pedicle may be visible. The tumour itselfappears heterogeneous and may contain small areas of lucency andoccasionally speckles of calcium. Transthoracic echo (TTE) is usuallyadequate for making the diagnosis, but transoesophageal echo (TOE) has agreater sensitivity and specificity and provides a more detailed assessmentof the myxoma.
RV
Pedicle of myxoma Mitral valve
Left atrialmyxoma
RA
LV
LA
Fig. 21.1 Left atrial myxoma (LA � left atrium; LV � left ventricle; RA � rightatrium; RV � right ventricle) (Figure reproduced with permission of Philips)
View Apical 4-chamber
Modality 2-D
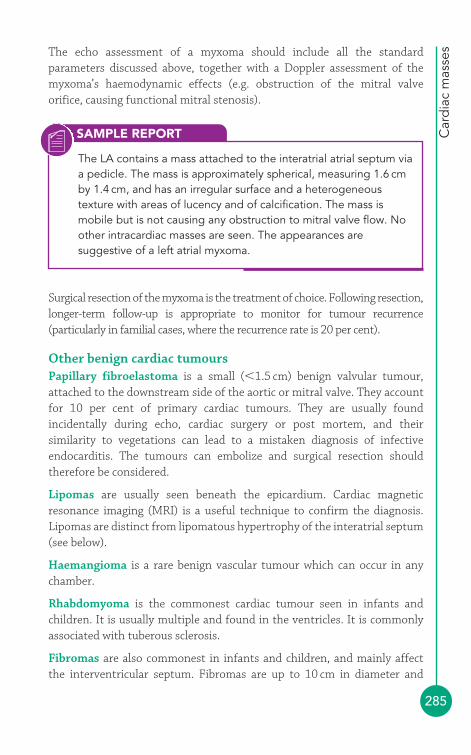
Car
dia
c m
asse
s
285
The echo assessment of a myxoma should include all the standardparameters discussed above, together with a Doppler assessment of themyxoma’s haemodynamic effects (e.g. obstruction of the mitral valveorifice, causing functional mitral stenosis).
SAMPLE REPORT
The LA contains a mass attached to the interatrial atrial septum viaa pedicle. The mass is approximately spherical, measuring 1.6 cmby 1.4 cm, and has an irregular surface and a heterogeneoustexture with areas of lucency and of calcification. The mass ismobile but is not causing any obstruction to mitral valve flow. Noother intracardiac masses are seen. The appearances aresuggestive of a left atrial myxoma.
Surgical resection of the myxoma is the treatment of choice. Following resection,longer-term follow-up is appropriate to monitor for tumour recurrence(particularly in familial cases, where the recurrence rate is 20 per cent).
Other benign cardiac tumoursPapillary fibroelastoma is a small (�1.5 cm) benign valvular tumour,attached to the downstream side of the aortic or mitral valve. They accountfor 10 per cent of primary cardiac tumours. They are usually foundincidentally during echo, cardiac surgery or post mortem, and theirsimilarity to vegetations can lead to a mistaken diagnosis of infectiveendocarditis. The tumours can embolize and surgical resection shouldtherefore be considered.
Lipomas are usually seen beneath the epicardium. Cardiac magneticresonance imaging (MRI) is a useful technique to confirm the diagnosis.Lipomas are distinct from lipomatous hypertrophy of the interatrial septum(see below).
Haemangioma is a rare benign vascular tumour which can occur in anychamber.
Rhabdomyoma is the commonest cardiac tumour seen in infants andchildren. It is usually multiple and found in the ventricles. It is commonlyassociated with tuberous sclerosis.
Fibromas are also commonest in infants and children, and mainly affectthe interventricular septum. Fibromas are up to 10 cm in diameter and
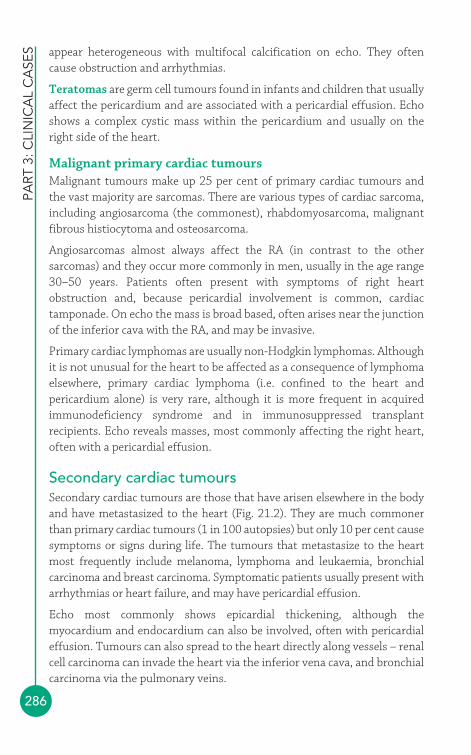
PART
3: C
LIN
ICA
L C
ASE
S
286
appear heterogeneous with multifocal calcification on echo. They oftencause obstruction and arrhythmias.
Teratomas are germ cell tumours found in infants and children that usuallyaffect the pericardium and are associated with a pericardial effusion. Echoshows a complex cystic mass within the pericardium and usually on theright side of the heart.
Malignant primary cardiac tumoursMalignant tumours make up 25 per cent of primary cardiac tumours andthe vast majority are sarcomas. There are various types of cardiac sarcoma,including angiosarcoma (the commonest), rhabdomyosarcoma, malignantfibrous histiocytoma and osteosarcoma.
Angiosarcomas almost always affect the RA (in contrast to the othersarcomas) and they occur more commonly in men, usually in the age range30–50 years. Patients often present with symptoms of right heartobstruction and, because pericardial involvement is common, cardiactamponade. On echo the mass is broad based, often arises near the junctionof the inferior cava with the RA, and may be invasive.
Primary cardiac lymphomas are usually non-Hodgkin lymphomas. Althoughit is not unusual for the heart to be affected as a consequence of lymphomaelsewhere, primary cardiac lymphoma (i.e. confined to the heart andpericardium alone) is very rare, although it is more frequent in acquiredimmunodeficiency syndrome and in immunosuppressed transplantrecipients. Echo reveals masses, most commonly affecting the right heart,often with a pericardial effusion.
Secondary cardiac tumoursSecondary cardiac tumours are those that have arisen elsewhere in the bodyand have metastasized to the heart (Fig. 21.2). They are much commonerthan primary cardiac tumours (1 in 100 autopsies) but only 10 per cent causesymptoms or signs during life. The tumours that metastasize to the heartmost frequently include melanoma, lymphoma and leukaemia, bronchialcarcinoma and breast carcinoma. Symptomatic patients usually present witharrhythmias or heart failure, and may have pericardial effusion.
Echo most commonly shows epicardial thickening, although themyocardium and endocardium can also be involved, often with pericardialeffusion. Tumours can also spread to the heart directly along vessels – renalcell carcinoma can invade the heart via the inferior vena cava, and bronchialcarcinoma via the pulmonary veins.

Car
dia
c m
asse
s
287
● ThrombusCardiac thrombus is more likely to form when:
1. there is stasis (or slow flow) of blood2. there is abnormal endocardium (allowing thrombus to attach)3. the blood is hypercoagulable (making it more likely to clot).
Thrombus formation is therefore more likely in the LA in atrial fibrillation(AF), when there is a loss of normal atrial contraction, and in the leftventricle (LV) following myocardial infarction, when reduced contractilitypredisposes to thrombus formation (particularly if there is aneurysmformation). The presence of an intracardiac device, such as a prostheticvalve or a pacing wire, can also act as a focus for thrombosis. Where there isa high risk of thrombosis (or where a thrombus has already formed)anticoagulation with a drug such as warfarin is used.
When you suspect you have found a cardiac thrombus, it is important to askyourself, ‘What is the substrate?’. In other words, what is the underlyingabnormality that has allowed the thrombus to form? If you cannot find asubstrate, you should reassess whether are you observing a thrombus or adifferent type of cardiac mass. For instance, LV thrombus formation wouldbe very unusual in the presence of a structurally normal LV with goodfunction.
Tumour inright atrium
IVC
Fig. 21.2 Large secondary tumour within right atrium (IVC � inferior vena cava)
View Subcostal
Modality 2-D
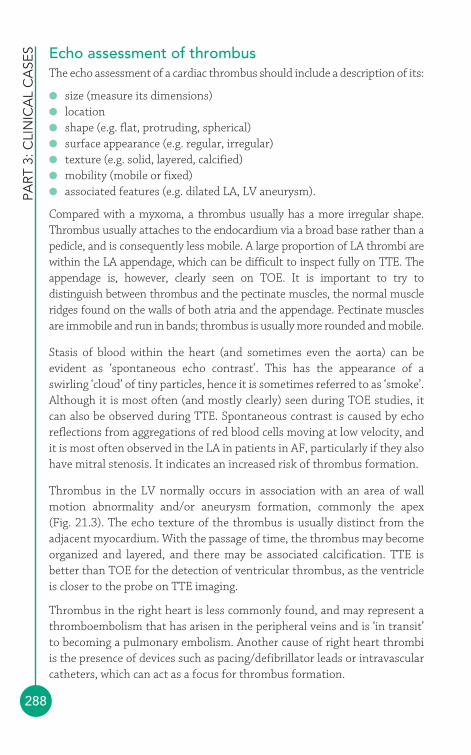
PART
3: C
LIN
ICA
L C
ASE
S
288
Echo assessment of thrombusThe echo assessment of a cardiac thrombus should include a description of its:
● size (measure its dimensions)● location● shape (e.g. flat, protruding, spherical)● surface appearance (e.g. regular, irregular)● texture (e.g. solid, layered, calcified)● mobility (mobile or fixed)● associated features (e.g. dilated LA, LV aneurysm).
Compared with a myxoma, a thrombus usually has a more irregular shape.Thrombus usually attaches to the endocardium via a broad base rather than apedicle, and is consequently less mobile. A large proportion of LA thrombi arewithin the LA appendage, which can be difficult to inspect fully on TTE. Theappendage is, however, clearly seen on TOE. It is important to try todistinguish between thrombus and the pectinate muscles, the normal muscleridges found on the walls of both atria and the appendage. Pectinate musclesare immobile and run in bands; thrombus is usually more rounded and mobile.
Stasis of blood within the heart (and sometimes even the aorta) can beevident as ‘spontaneous echo contrast’. This has the appearance of aswirling ‘cloud’ of tiny particles, hence it is sometimes referred to as ‘smoke’.Although it is most often (and mostly clearly) seen during TOE studies, itcan also be observed during TTE. Spontaneous contrast is caused by echoreflections from aggregations of red blood cells moving at low velocity, andit is most often observed in the LA in patients in AF, particularly if they alsohave mitral stenosis. It indicates an increased risk of thrombus formation.
Thrombus in the LV normally occurs in association with an area of wallmotion abnormality and/or aneurysm formation, commonly the apex (Fig. 21.3). The echo texture of the thrombus is usually distinct from theadjacent myocardium. With the passage of time, the thrombus may becomeorganized and layered, and there may be associated calcification. TTE isbetter than TOE for the detection of ventricular thrombus, as the ventricleis closer to the probe on TTE imaging.
Thrombus in the right heart is less commonly found, and may represent athromboembolism that has arisen in the peripheral veins and is ‘in transit’to becoming a pulmonary embolism. Another cause of right heart thrombiis the presence of devices such as pacing/defibrillator leads or intravascularcatheters, which can act as a focus for thrombus formation.
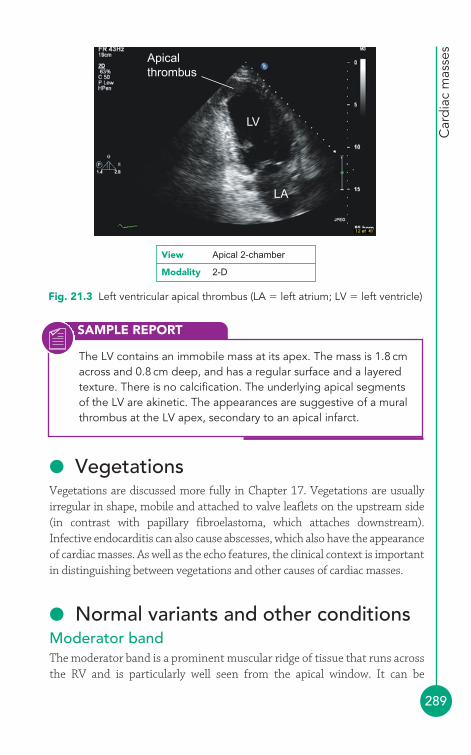
Car
dia
c m
asse
s
289
SAMPLE REPORT
The LV contains an immobile mass at its apex. The mass is 1.8 cmacross and 0.8 cm deep, and has a regular surface and a layeredtexture. There is no calcification. The underlying apical segmentsof the LV are akinetic. The appearances are suggestive of a muralthrombus at the LV apex, secondary to an apical infarct.
Apicalthrombus
LV
LA
Fig. 21.3 Left ventricular apical thrombus (LA � left atrium; LV � left ventricle)
View Apical 2-chamber
Modality 2-D
● VegetationsVegetations are discussed more fully in Chapter 17. Vegetations are usuallyirregular in shape, mobile and attached to valve leaflets on the upstream side(in contrast with papillary fibroelastoma, which attaches downstream).Infective endocarditis can also cause abscesses, which also have the appearanceof cardiac masses. As well as the echo features, the clinical context is importantin distinguishing between vegetations and other causes of cardiac masses.
● Normal variants and other conditionsModerator bandThe moderator band is a prominent muscular ridge of tissue that runs acrossthe RV and is particularly well seen from the apical window. It can be

PART
3: C
LIN
ICA
L C
ASE
S
290
mistaken for a cardiac mass. Similarly, ‘false chords’ in the LV (and even thepapillary muscles) can inadvertently be mistaken for abnormal masses.
Lambl’s excrescencesLambl’s excrescences are small filamentous strands on the ventricular sideof the aortic valve. They are a normal finding in the elderly and are thoughtto arise from ‘wear and tear’ at the edges of the cusps. On echo they can bemistaken for papillary fibroelastomas, but are usually smaller.
Eustachian valveThe Eustachian valve is a membranous embryological remnant – its role in fetallife is to direct oxygenated blood towards the foramen ovale and away from thetricuspid valve. In adult life it is usually seen as a thin flap at the junction of theinferior vena cava with the RA. The size and mobility of the Eustachian valve isvery variable between individuals, but this represents normal variation.
Chiari networkA Chiari network is an embryological remnant of the sinus venosus andforms a net-like web across the RA in around in 2 per cent of the population.It has no clinical significance, although it can make passage of right heartcatheters more difficult.
Lipomatous hypertrophy of the interatrial septumLipomatous hypertrophy of the interatrial septum is characterized by anaccumulation of non-encapsulated fatty tissue within the interatrial septum.It has an incidence of between 1 per cent and 8 per cent and is commonerwith increasing age. Although usually asymptomatic, associations witharrhythmias have been reported. The characteristic echo appearances are:
● marked thickening of the interatrial septum (15 mm)● echogenic appearance of the lipomatous tissue● sparing of the fossa ovalis (giving a dumbbell appearance).
Dilated vesselsA dilated coronary sinus can give the appearance of a cystic mass behindthe heart (Fig. 21.4). Enlargement of the coronary sinus usually occurs as aresult of anomalous drainage of a left-sided superior vena cava. This can beconfirmed by an injection of agitated saline into a left arm vein – thebubbles will be seen to fill the coronary sinus, followed by the RA.
An aneurysmal coronary artery can also give the appearance of a cardiaccystic mass along the route of the coronary arteries. The right coronary
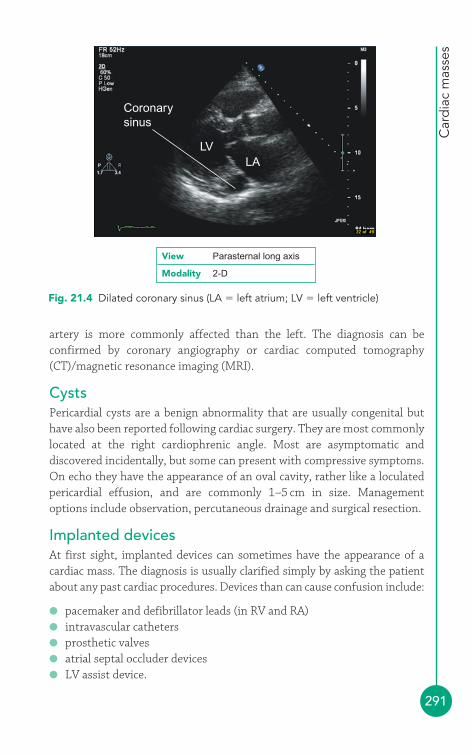
Car
dia
c m
asse
s
291
Coronarysinus
LVLA
View Parasternal long axis
Modality 2-D
Fig. 21.4 Dilated coronary sinus (LA � left atrium; LV � left ventricle)
artery is more commonly affected than the left. The diagnosis can beconfirmed by coronary angiography or cardiac computed tomography(CT)/magnetic resonance imaging (MRI).
CystsPericardial cysts are a benign abnormality that are usually congenital buthave also been reported following cardiac surgery. They are most commonlylocated at the right cardiophrenic angle. Most are asymptomatic anddiscovered incidentally, but some can present with compressive symptoms.On echo they have the appearance of an oval cavity, rather like a loculatedpericardial effusion, and are commonly 1–5 cm in size. Managementoptions include observation, percutaneous drainage and surgical resection.
Implanted devicesAt first sight, implanted devices can sometimes have the appearance of acardiac mass. The diagnosis is usually clarified simply by asking the patientabout any past cardiac procedures. Devices than can cause confusion include:
● pacemaker and defibrillator leads (in RV and RA)● intravascular catheters● prosthetic valves● atrial septal occluder devices● LV assist device.
PART
3: C
LIN
ICA
L C
ASE
S
292
FURTHER READING
Grebenc ML, de Christenson MLR, Burke AP, et al. Primary cardiacand pericardial neoplasms: radiologic-pathologic correlation.Radiographics 2000; 20: 1073–103.
Joshi J. British Society of Echocardiography Distance LearningModule 5: Tumours and Infiltrative Processes. Accessible fromthe BSE website (www.bsecho.org).
Nadra I, Dawson D, Schmitz SA, et al. Lipomatous hypertrophy ofthe interatrial septum: a commonly misdiagnosed mass oftenleading to unnecessary cardiac surgery. Heart 2004; 90: e66.
Patel J, Park C, Michaels J, et al. Pericardial cyst: case reports anda literature review. Echocardiography 2004; 21: 269–72.
Shapiro LM. Cardiac tumours: diagnosis and management. Heart2001; 85: 218–22.
293
This book is concerned with adult echocardiography, and so the congenitalabnormalities described in this chapter are primarily those that may beencountered in adult patients, often following surgical or percutaneouscorrection. A detailed discussion of congenital heart disease is beyond thescope of this book but a number of excellent reference works are availablefor further reading.
● Atrial septal defectAtrial septal defect (ASD) is the commonest form of congenital heartdisease seen in adults. The commonest form of defect is the secundumASD, accounting for two-thirds of cases, in which the fossa ovalis is absent,leaving a defect in the centre of the interatrial septum. Primum ASD is rarerand causes a defect in the inferior interatrial septum, often associated witha cleft anterior mitral valve leaflet. Sinus venosus ASD is also rare and isfound near to where the superior or inferior vena cava joins the right atrium(RA). It is associated with partial anomalous pulmonary venous drainage, inwhich one or more pulmonary veins drain directly into the RA (or one of thevena cavae) instead of the left atrium (LA).
An ASD can also be acquired as a result of deliberate puncture of the interatrialseptum during balloon mitral valvuloplasty or left-sided electrophysiologicalprocedures, or accidental puncture during right heart catheterization or pacing.
Clinical features of atrial septal defectASD can remain asymptomatic for many years and may present late in adultlife. It can also be an incidental finding. The clinical features are summarized
Congenital heartdisease
22
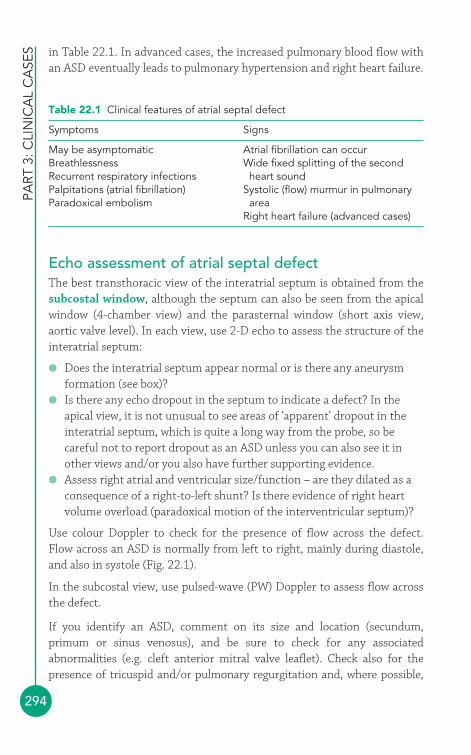
in Table 22.1. In advanced cases, the increased pulmonary blood flow withan ASD eventually leads to pulmonary hypertension and right heart failure.
PART
3: C
LIN
ICA
L C
ASE
S
294
Table 22.1 Clinical features of atrial septal defect
Symptoms Signs
May be asymptomatic Atrial fibrillation can occurBreathlessness Wide fixed splitting of the second Recurrent respiratory infections heart soundPalpitations (atrial fibrillation) Systolic (flow) murmur in pulmonary Paradoxical embolism area
Right heart failure (advanced cases)
Echo assessment of atrial septal defectThe best transthoracic view of the interatrial septum is obtained from thesubcostal window, although the septum can also be seen from the apicalwindow (4-chamber view) and the parasternal window (short axis view,aortic valve level). In each view, use 2-D echo to assess the structure of theinteratrial septum:
● Does the interatrial septum appear normal or is there any aneurysmformation (see box)?
● Is there any echo dropout in the septum to indicate a defect? In theapical view, it is not unusual to see areas of ‘apparent’ dropout in theinteratrial septum, which is quite a long way from the probe, so becareful not to report dropout as an ASD unless you can also see it inother views and/or you also have further supporting evidence.
● Assess right atrial and ventricular size/function – are they dilated as aconsequence of a right-to-left shunt? Is there evidence of right heartvolume overload (paradoxical motion of the interventricular septum)?
Use colour Doppler to check for the presence of flow across the defect. Flow across an ASD is normally from left to right, mainly during diastole,and also in systole (Fig. 22.1).
In the subcostal view, use pulsed-wave (PW) Doppler to assess flow acrossthe defect.
If you identify an ASD, comment on its size and location (secundum,primum or sinus venosus), and be sure to check for any associatedabnormalities (e.g. cleft anterior mitral valve leaflet). Check also for thepresence of tricuspid and/or pulmonary regurgitation and, where possible,

Con
gen
ital h
eart
dis
ease
295
Flow from leftto right atrium
RA
LA
Interatrialseptum
View Subcostal
Modality Colour Doppler
Fig. 22.1 Secundum atrial septal defect (LA � left atrium; RA � right atrium)
SHUNT CALCULATIONS
Normally the stroke volume of the right heart equals that of theleft. However, the presence of a left-to-right shunt such as an ASDmeans that a portion of the blood that would normally leave theleft heart with each heartbeat instead enters the right heart, and ispumped through the lungs before returning to the left heart again.Thus in the presence of a left-to-right shunt the stroke volume ofthe right heart is greater than that of the left, and the ratiobetween the two is a measure of the severity of shunting. The ratiois often referred to as Qp/Qs, where Qp is pulmonary blood flowand Qs is systemic blood flow. To calculate the shunt ratio:
● In the parasternal short axis view (aortic valve level), measurethe diameter of the right ventricular outflow tract (RVOT) in cm,then use this to calculate the cross-sectional area (CSA) of theRVOT in cm2:
CSARVOT � 0.785 � (RVOT diameter)2
i
assess pulmonary artery pressure in case pulmonary hypertension hasdeveloped. Perform a shunt calculation to estimate the shunt ratio (see box).

PART
3: C
LIN
ICA
L C
ASE
S
296
If there is doubt about the presence of an ASD, it may be necessary toperform an ‘agitated’ saline contrast study as for patent foramen ovale(PFO) (see box). Although transthoracic echo (TTE) can often detectevidence of an ASD, transoesophageal echo (TOE) will usually be required toassess an ASD in detail (or to rule out an ASD if clinical suspicion remainsafter a normal TTE). Sinus venosus defects can be very difficult to visualizeon TTE.
● In the same view, measure the velocity time integral (VTI) offlow in the RVOT (using PW Doppler) to give VTIRVOT, in cm.
● The stroke volume in the RVOT (SVRVOT), in mL/beat, can thenbe calculated from:
● In the parasternal long axis view, measure the diameter of theLVOT in cm, then use this to calculate the CSA of the LVOT in cm2:
● In the apical 5-chamber view, measure the VTI of flow in theLVOT (using PW Doppler) to give VTILVOT, in cm.
● The stroke volume in the LVOT (SVLVOT), in mL/beat, can thenbe calculated from:
The shunt ratio is the ratio of SVRVOT to SVLVOT which, in thepresence of a left-to-right shunt, will be greater than 1. Asignificant limitation to shunt calculations is that they are heavilydependent on an accurate measurement of RVOT and LVOTdiameter – as the calculation involves squaring thesemeasurements, even a small inaccuracy in measurement can leadto a large error in the final result.
SVLVOT � CSALVOT � VTILVOT
CSALVOT � 0.785 � (LVOT diameter)2
SVRVOT � CSARVOT � VTIRVOT
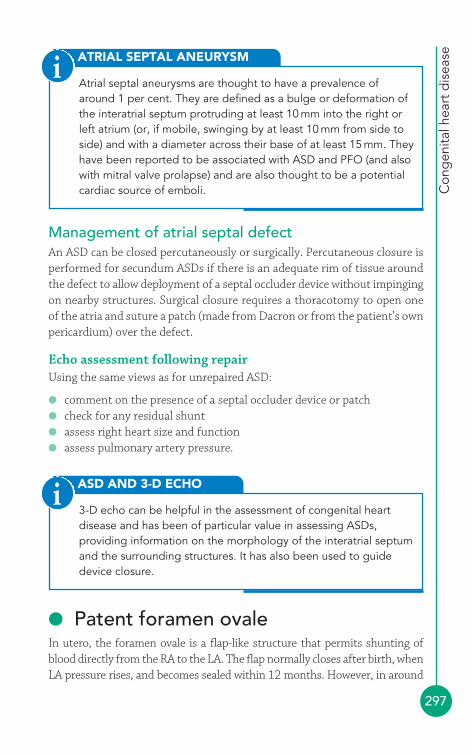
Con
gen
ital h
eart
dis
ease
297
Management of atrial septal defectAn ASD can be closed percutaneously or surgically. Percutaneous closure isperformed for secundum ASDs if there is an adequate rim of tissue aroundthe defect to allow deployment of a septal occluder device without impingingon nearby structures. Surgical closure requires a thoracotomy to open oneof the atria and suture a patch (made from Dacron or from the patient’s ownpericardium) over the defect.
Echo assessment following repairUsing the same views as for unrepaired ASD:
● comment on the presence of a septal occluder device or patch● check for any residual shunt● assess right heart size and function● assess pulmonary artery pressure.
ATRIAL SEPTAL ANEURYSM
Atrial septal aneurysms are thought to have a prevalence ofaround 1 per cent. They are defined as a bulge or deformation ofthe interatrial septum protruding at least 10 mm into the right orleft atrium (or, if mobile, swinging by at least 10 mm from side toside) and with a diameter across their base of at least 15 mm. Theyhave been reported to be associated with ASD and PFO (and alsowith mitral valve prolapse) and are also thought to be a potentialcardiac source of emboli.
i
ASD AND 3-D ECHO
3-D echo can be helpful in the assessment of congenital heartdisease and has been of particular value in assessing ASDs,providing information on the morphology of the interatrial septumand the surrounding structures. It has also been used to guidedevice closure.
i
● Patent foramen ovaleIn utero, the foramen ovale is a flap-like structure that permits shunting ofblood directly from the RA to the LA. The flap normally closes after birth, whenLA pressure rises, and becomes sealed within 12 months. However, in around
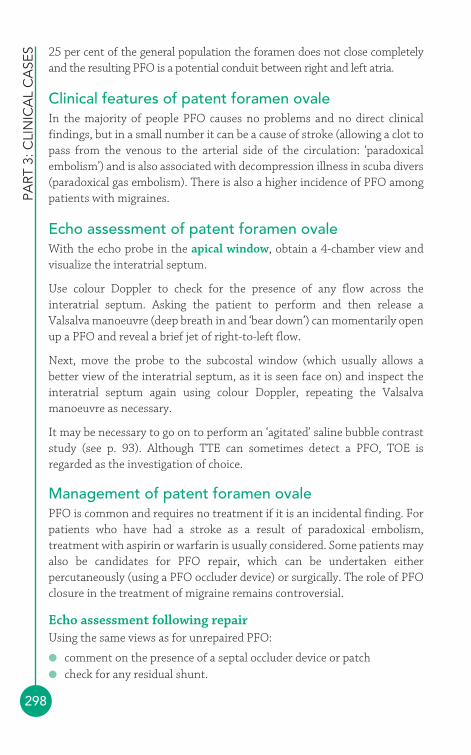
PART
3: C
LIN
ICA
L C
ASE
S
298
25 per cent of the general population the foramen does not close completelyand the resulting PFO is a potential conduit between right and left atria.
Clinical features of patent foramen ovaleIn the majority of people PFO causes no problems and no direct clinicalfindings, but in a small number it can be a cause of stroke (allowing a clot topass from the venous to the arterial side of the circulation: ‘paradoxicalembolism’) and is also associated with decompression illness in scuba divers(paradoxical gas embolism). There is also a higher incidence of PFO amongpatients with migraines.
Echo assessment of patent foramen ovaleWith the echo probe in the apical window, obtain a 4-chamber view andvisualize the interatrial septum.
Use colour Doppler to check for the presence of any flow across theinteratrial septum. Asking the patient to perform and then release aValsalva manoeuvre (deep breath in and ‘bear down’) can momentarily openup a PFO and reveal a brief jet of right-to-left flow.
Next, move the probe to the subcostal window (which usually allows abetter view of the interatrial septum, as it is seen face on) and inspect theinteratrial septum again using colour Doppler, repeating the Valsalvamanoeuvre as necessary.
It may be necessary to go on to perform an ‘agitated’ saline bubble contraststudy (see p. 93). Although TTE can sometimes detect a PFO, TOE isregarded as the investigation of choice.
Management of patent foramen ovalePFO is common and requires no treatment if it is an incidental finding. Forpatients who have had a stroke as a result of paradoxical embolism,treatment with aspirin or warfarin is usually considered. Some patients mayalso be candidates for PFO repair, which can be undertaken eitherpercutaneously (using a PFO occluder device) or surgically. The role of PFOclosure in the treatment of migraine remains controversial.
Echo assessment following repairUsing the same views as for unrepaired PFO:
● comment on the presence of a septal occluder device or patch● check for any residual shunt.
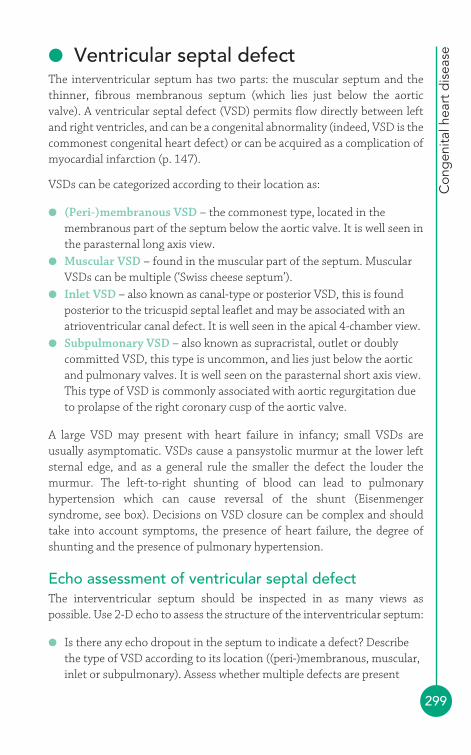
Con
gen
ital h
eart
dis
ease
299
● Ventricular septal defectThe interventricular septum has two parts: the muscular septum and thethinner, fibrous membranous septum (which lies just below the aorticvalve). A ventricular septal defect (VSD) permits flow directly between leftand right ventricles, and can be a congenital abnormality (indeed, VSD is thecommonest congenital heart defect) or can be acquired as a complication ofmyocardial infarction (p. 147).
VSDs can be categorized according to their location as:
● (Peri-)membranous VSD – the commonest type, located in themembranous part of the septum below the aortic valve. It is well seen inthe parasternal long axis view.
● Muscular VSD – found in the muscular part of the septum. MuscularVSDs can be multiple (‘Swiss cheese septum’).
● Inlet VSD – also known as canal-type or posterior VSD, this is foundposterior to the tricuspid septal leaflet and may be associated with anatrioventricular canal defect. It is well seen in the apical 4-chamber view.
● Subpulmonary VSD – also known as supracristal, outlet or doublycommitted VSD, this type is uncommon, and lies just below the aorticand pulmonary valves. It is well seen on the parasternal short axis view.This type of VSD is commonly associated with aortic regurgitation dueto prolapse of the right coronary cusp of the aortic valve.
A large VSD may present with heart failure in infancy; small VSDs areusually asymptomatic. VSDs cause a pansystolic murmur at the lower leftsternal edge, and as a general rule the smaller the defect the louder themurmur. The left-to-right shunting of blood can lead to pulmonaryhypertension which can cause reversal of the shunt (Eisenmengersyndrome, see box). Decisions on VSD closure can be complex and shouldtake into account symptoms, the presence of heart failure, the degree ofshunting and the presence of pulmonary hypertension.
Echo assessment of ventricular septal defectThe interventricular septum should be inspected in as many views aspossible. Use 2-D echo to assess the structure of the interventricular septum:
● Is there any echo dropout in the septum to indicate a defect? Describethe type of VSD according to its location ((peri-)membranous, muscular,inlet or subpulmonary). Assess whether multiple defects are present
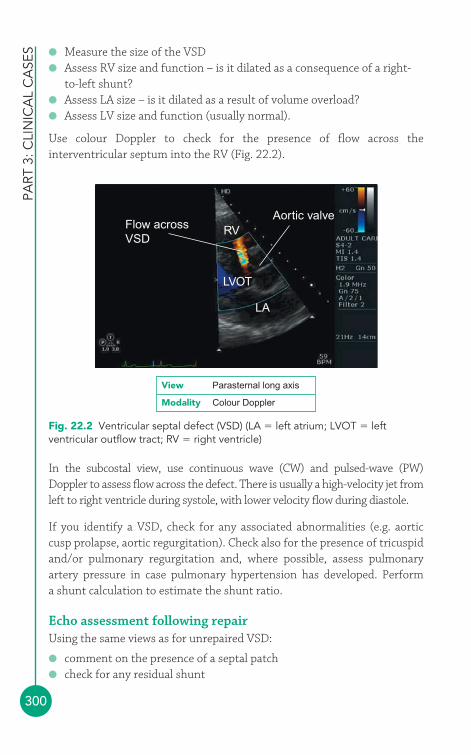
PART
3: C
LIN
ICA
L C
ASE
S
300
● Measure the size of the VSD● Assess RV size and function – is it dilated as a consequence of a right-
to-left shunt?● Assess LA size – is it dilated as a result of volume overload?● Assess LV size and function (usually normal).
Use colour Doppler to check for the presence of flow across theinterventricular septum into the RV (Fig. 22.2).
Flow acrossVSD
RVAortic valve
LVOT
LA
View Parasternal long axis
Modality Colour Doppler
Fig. 22.2 Ventricular septal defect (VSD) (LA � left atrium; LVOT � leftventricular outflow tract; RV � right ventricle)
In the subcostal view, use continuous wave (CW) and pulsed-wave (PW)Doppler to assess flow across the defect. There is usually a high-velocity jet fromleft to right ventricle during systole, with lower velocity flow during diastole.
If you identify a VSD, check for any associated abnormalities (e.g. aorticcusp prolapse, aortic regurgitation). Check also for the presence of tricuspidand/or pulmonary regurgitation and, where possible, assess pulmonaryartery pressure in case pulmonary hypertension has developed. Perform a shunt calculation to estimate the shunt ratio.
Echo assessment following repairUsing the same views as for unrepaired VSD:
● comment on the presence of a septal patch● check for any residual shunt
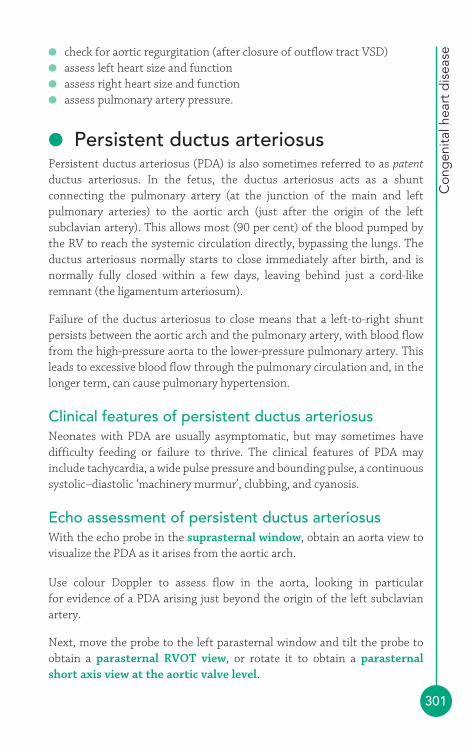
Con
gen
ital h
eart
dis
ease
301
● check for aortic regurgitation (after closure of outflow tract VSD)● assess left heart size and function● assess right heart size and function● assess pulmonary artery pressure.
● Persistent ductus arteriosusPersistent ductus arteriosus (PDA) is also sometimes referred to as patentductus arteriosus. In the fetus, the ductus arteriosus acts as a shuntconnecting the pulmonary artery (at the junction of the main and leftpulmonary arteries) to the aortic arch (just after the origin of the leftsubclavian artery). This allows most (90 per cent) of the blood pumped bythe RV to reach the systemic circulation directly, bypassing the lungs. Theductus arteriosus normally starts to close immediately after birth, and isnormally fully closed within a few days, leaving behind just a cord-likeremnant (the ligamentum arteriosum).
Failure of the ductus arteriosus to close means that a left-to-right shuntpersists between the aortic arch and the pulmonary artery, with blood flowfrom the high-pressure aorta to the lower-pressure pulmonary artery. Thisleads to excessive blood flow through the pulmonary circulation and, in thelonger term, can cause pulmonary hypertension.
Clinical features of persistent ductus arteriosusNeonates with PDA are usually asymptomatic, but may sometimes havedifficulty feeding or failure to thrive. The clinical features of PDA mayinclude tachycardia, a wide pulse pressure and bounding pulse, a continuoussystolic–diastolic ‘machinery murmur’, clubbing, and cyanosis.
Echo assessment of persistent ductus arteriosusWith the echo probe in the suprasternal window, obtain an aorta view tovisualize the PDA as it arises from the aortic arch.
Use colour Doppler to assess flow in the aorta, looking in particular for evidence of a PDA arising just beyond the origin of the left subclavianartery.
Next, move the probe to the left parasternal window and tilt the probe toobtain a parasternal RVOT view, or rotate it to obtain a parasternalshort axis view at the aortic valve level.
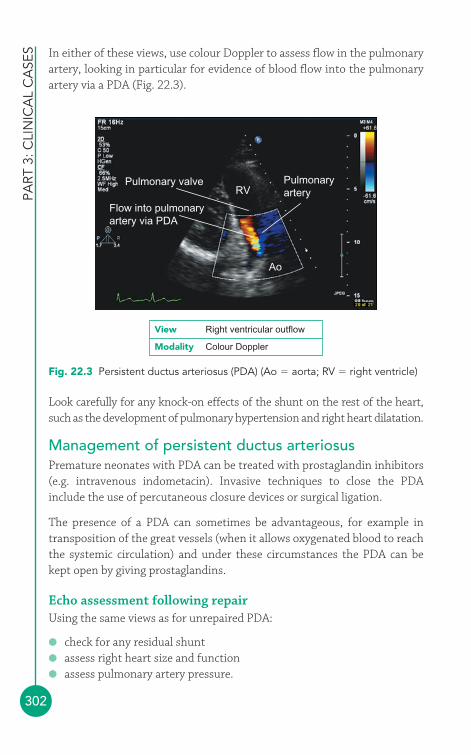
PART
3: C
LIN
ICA
L C
ASE
S
302
RV
Flow into pulmonaryartery via PDA
Ao
Pulmonary valve Pulmonaryartery
View Right ventricular outflow
Modality Colour Doppler
Fig. 22.3 Persistent ductus arteriosus (PDA) (Ao � aorta; RV � right ventricle)
In either of these views, use colour Doppler to assess flow in the pulmonaryartery, looking in particular for evidence of blood flow into the pulmonaryartery via a PDA (Fig. 22.3).
Look carefully for any knock-on effects of the shunt on the rest of the heart,such as the development of pulmonary hypertension and right heart dilatation.
Management of persistent ductus arteriosusPremature neonates with PDA can be treated with prostaglandin inhibitors(e.g. intravenous indometacin). Invasive techniques to close the PDAinclude the use of percutaneous closure devices or surgical ligation.
The presence of a PDA can sometimes be advantageous, for example intransposition of the great vessels (when it allows oxygenated blood to reachthe systemic circulation) and under these circumstances the PDA can bekept open by giving prostaglandins.
Echo assessment following repairUsing the same views as for unrepaired PDA:
● check for any residual shunt● assess right heart size and function● assess pulmonary artery pressure.

Con
gen
ital h
eart
dis
ease
303
● Bicuspid aortic valveA bicuspid aortic valve has two functioning cusps, usually of unequal size,with just a single line of coaptation. Pseudobicuspid valves have three cusps,but fusion of two of the cusps (‘functionally’ bicuspid). There is a strongassociation with aortic coarctation (p. 305), a bicuspid aortic valve beingpresent in at least 50 per cent of cases.
The prevalence of bicuspid aortic valve is 1–2 per cent of the population,and it is thought to be responsible for around half of cases of severe aorticstenosis in adults. The stenotic process is similar to that seen in calcificdegeneration, but occurs at a younger age. Fibrosis typically starts in apatient’s teens, with gradual calcification from their thirties onwards.Patients who require surgery for stenosis of a bicuspid aortic valve do so onaverage 5 years earlier than those with calcific degeneration of a tricuspidaortic valve.
Bicuspid aortic valve is often asymptomatic, but with the onset of valvedysfunction patients may develop clinical features of aortic stenosis orregurgitation. Patients are also at risk of aortic root dilatation and infective
EISENMENGER SYNDROME
The presence of a left-to-right shunt (such as an ASD, VSD orPDA) allows blood to pass directly from the left side of thecirculation to the right, increasing the volume of blood flowingthrough the pulmonary circulation. This leads to an increasedpressure within the pulmonary vessels (pulmonary hypertension)and, over time, the vessels develop an increasing resistance toblood flow. This leads to a back pressure on the right heart and,gradually, the right-sided pressures rise and begin to equal andthen exceed the pressures found in the left heart. As this occurs,the left-to-right shunt reverses, causing blood to start shuntingfrom right to left instead. At this point, the patient is said to havedeveloped Eisenmenger syndrome (or reaction). This means that a portion of the venous (deoxygenated) blood entering the rightheart starts crossing directly into the left heart, bypassing thelungs, and reducing the overall oxygen content in the arterialcirculation. Clinically, the patient develops cyanosis, a bluediscoloration of the skin and tongue, together with breathlessnessand a fall in exercise capacity.
i
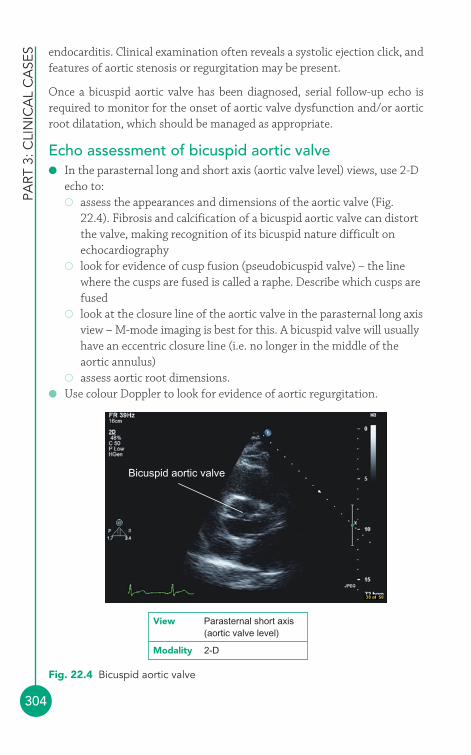
PART
3: C
LIN
ICA
L C
ASE
S
304
endocarditis. Clinical examination often reveals a systolic ejection click, andfeatures of aortic stenosis or regurgitation may be present.
Once a bicuspid aortic valve has been diagnosed, serial follow-up echo isrequired to monitor for the onset of aortic valve dysfunction and/or aorticroot dilatation, which should be managed as appropriate.
Echo assessment of bicuspid aortic valve● In the parasternal long and short axis (aortic valve level) views, use 2-D
echo to:� assess the appearances and dimensions of the aortic valve (Fig.
22.4). Fibrosis and calcification of a bicuspid aortic valve can distortthe valve, making recognition of its bicuspid nature difficult onechocardiography
� look for evidence of cusp fusion (pseudobicuspid valve) – the linewhere the cusps are fused is called a raphe. Describe which cusps arefused
� look at the closure line of the aortic valve in the parasternal long axisview – M-mode imaging is best for this. A bicuspid valve will usuallyhave an eccentric closure line (i.e. no longer in the middle of theaortic annulus)
� assess aortic root dimensions.● Use colour Doppler to look for evidence of aortic regurgitation.
Bicuspid aortic valve
View Parasternal short axis(aortic valve level)
Modality 2-D
Fig. 22.4 Bicuspid aortic valve
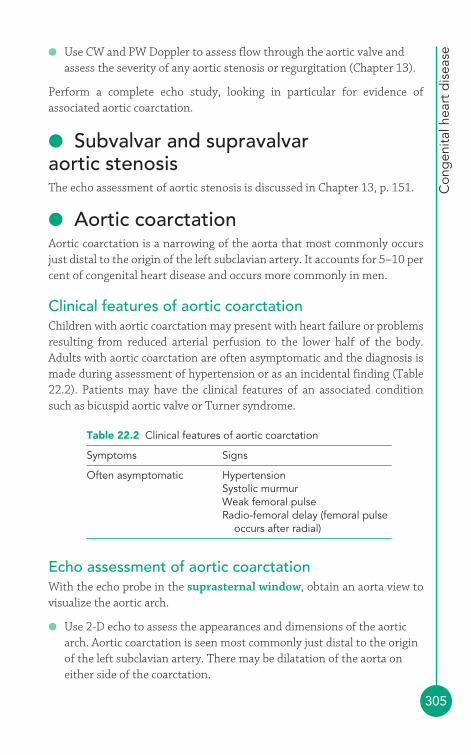
Con
gen
ital h
eart
dis
ease
305
● Use CW and PW Doppler to assess flow through the aortic valve andassess the severity of any aortic stenosis or regurgitation (Chapter 13).
Perform a complete echo study, looking in particular for evidence ofassociated aortic coarctation.
● Subvalvar and supravalvar aortic stenosisThe echo assessment of aortic stenosis is discussed in Chapter 13, p. 151.
● Aortic coarctationAortic coarctation is a narrowing of the aorta that most commonly occursjust distal to the origin of the left subclavian artery. It accounts for 5–10 percent of congenital heart disease and occurs more commonly in men.
Clinical features of aortic coarctationChildren with aortic coarctation may present with heart failure or problemsresulting from reduced arterial perfusion to the lower half of the body.Adults with aortic coarctation are often asymptomatic and the diagnosis ismade during assessment of hypertension or as an incidental finding (Table22.2). Patients may have the clinical features of an associated conditionsuch as bicuspid aortic valve or Turner syndrome.
Table 22.2 Clinical features of aortic coarctation
Symptoms Signs
Often asymptomatic HypertensionSystolic murmurWeak femoral pulseRadio-femoral delay (femoral pulse
occurs after radial)
Echo assessment of aortic coarctationWith the echo probe in the suprasternal window, obtain an aorta view tovisualize the aortic arch.
● Use 2-D echo to assess the appearances and dimensions of the aorticarch. Aortic coarctation is seen most commonly just distal to the originof the left subclavian artery. There may be dilatation of the aorta oneither side of the coarctation.
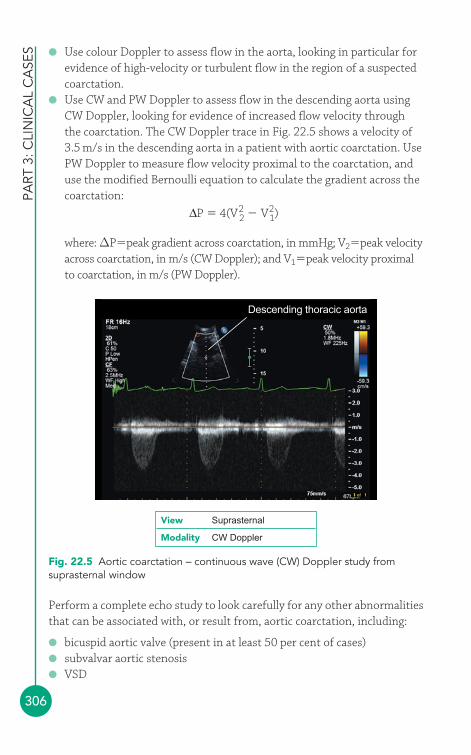
PART
3: C
LIN
ICA
L C
ASE
S
306
● Use colour Doppler to assess flow in the aorta, looking in particular forevidence of high-velocity or turbulent flow in the region of a suspectedcoarctation.
● Use CW and PW Doppler to assess flow in the descending aorta usingCW Doppler, looking for evidence of increased flow velocity throughthe coarctation. The CW Doppler trace in Fig. 22.5 shows a velocity of3.5 m/s in the descending aorta in a patient with aortic coarctation. UsePW Doppler to measure flow velocity proximal to the coarctation, anduse the modified Bernoulli equation to calculate the gradient across thecoarctation:
where: ΔP�peak gradient across coarctation, in mmHg; V2�peak velocityacross coarctation, in m/s (CW Doppler); and V1�peak velocity proximalto coarctation, in m/s (PW Doppler).
ΔP � 4(V22 � V2
1)
Descending thoracic aorta
View Suprasternal
Modality CW Doppler
Fig. 22.5 Aortic coarctation – continuous wave (CW) Doppler study fromsuprasternal window
Perform a complete echo study to look carefully for any other abnormalitiesthat can be associated with, or result from, aortic coarctation, including:
● bicuspid aortic valve (present in at least 50 per cent of cases)● subvalvar aortic stenosis● VSD
Con
gen
ital h
eart
dis
ease
307
● LV hypertrophy (LVH) or dysfunction (as a consequence ofhypertension).
Management of aortic coarctationAortic coarctation can be managed by surgical excision of the area ofcoarctation (followed either by end-to-end anastomosis of the aorta, or withthe use of a graft to bridge the resulting gap). It can also be managedpercutaneously by angioplasty and/or stenting of the coarctation.
Echo assessment following repairFollowing correction, patients with aortic coarctation require lifelong follow-upwith annual echo studies. Using the same views as for unrepaired coarctation:
● measure any residual gradient● check for the development of any dilatation of the aorta.
In addition:
● assess any LVH (patients may remain hypertensive)● assess any associated abnormalities such as bicuspid aortic valve.
● Subvalvar, valvar and supravalvarpulmonary stenosisThe echo assessment of pulmonary stenosis is discussed in Chapter 15, p. 209.
● Ebstein’s anomalyIn Ebstein’s anomaly the tricuspid valve (specifically the septal and posteriorleaflets) is displaced towards the RV apex. As a result, part of the RV becomes‘atrialized’ – although it becomes part of the RA, it still contracts with the RV,which impairs the haemodynamic function of the right heart and tends toexacerbate the tricuspid regurgitation that is usually present (and ranges inseverity from mild to severe). There are several associated conditions:
● ASD and VSD● pulmonary stenosis● accessory pathway (Wolff–Parkinson–White syndrome).
When Ebstein’s anomaly presents in adult life, it can be with:
● breathlessness and fatigue● tricuspid regurgitation● right heart failure
PART
3: C
LIN
ICA
L C
ASE
S
308
● cyanosis● palpitations.
Echo assessment of Ebstein’s anomalyThe tricuspid valve can be studied in:
● left parasternal window� parasternal right ventricular inflow view� parasternal short axis view
● apical window� apical 4-chamber view
● subcostal window� subcostal long axis view.
2-DUse 2-D echo to assess the structure of the tricuspid valve:
● Is the tricuspid valve position normal or is it displaced apically (inEbstein’s anomaly the tricuspid valve plane is displaced at least 1 cmtowards the RV apex, in comparison with the mitral valve plane)?
● Are the tricuspid valve leaflets morphologically normal or abnormal?Do the leaflets coapt normally or eccentrically?
● Is the RA dilated?● Is the RV dilated? Is RV function impaired?
Colour DopplerUse colour Doppler to:
● assess the severity of tricuspid regurgitation● look for shunts (see ‘Associated features’ below).
CW and PW DopplerUse CW Doppler to obtain a trace of regurgitant flow through the tricuspidvalve. You should obtain traces from the apex and from at least one otherposition, such as the parasternal short axis or RV inflow views. Assess theseverity of tricuspid regurgitation and calculate pulmonary artery systolicpressure.
Associated featuresA number of conditions can be associated with Ebstein’s anomaly, soperform a complete echo study to look for them:
● ASD● PFO (as a consequence of RA dilatation)
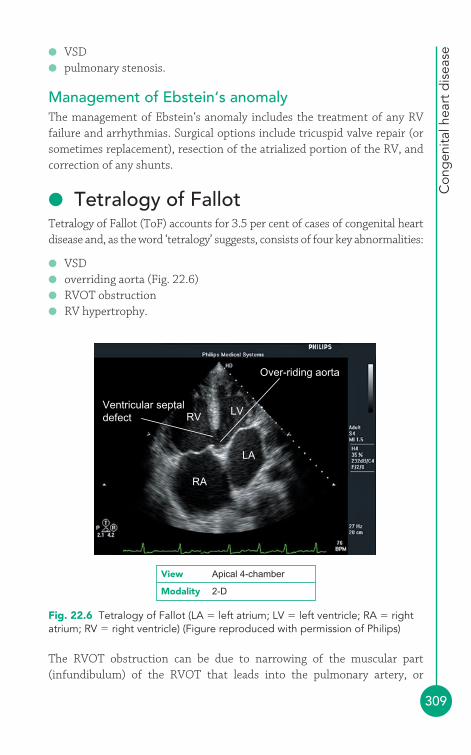
Con
gen
ital h
eart
dis
ease
309
● VSD● pulmonary stenosis.
Management of Ebstein‘s anomalyThe management of Ebstein‘s anomaly includes the treatment of any RVfailure and arrhythmias. Surgical options include tricuspid valve repair (orsometimes replacement), resection of the atrialized portion of the RV, andcorrection of any shunts.
● Tetralogy of FallotTetralogy of Fallot (ToF) accounts for 3.5 per cent of cases of congenital heartdisease and, as the word ‘tetralogy’ suggests, consists of four key abnormalities:
● VSD● overriding aorta (Fig. 22.6)● RVOT obstruction● RV hypertrophy.
RV
RA
Ventricular septaldefect
LV
Over-riding aorta
LA
View Apical 4-chamber
Modality 2-D
Fig. 22.6 Tetralogy of Fallot (LA � left atrium; LV � left ventricle; RA � rightatrium; RV � right ventricle) (Figure reproduced with permission of Philips)
The RVOT obstruction can be due to narrowing of the muscular part(infundibulum) of the RVOT that leads into the pulmonary artery, or

PART
3: C
LIN
ICA
L C
ASE
S
310
affecting the pulmonary valve itself (where there can be a degree of cusptethering). RV hypertrophy develops in response to the pressure overloadthat results from the RVOT obstruction.
In some cases ToF may be diagnosed in utero with fetal ultrasound scanning.After birth, the clinical severity depends primarily upon how severe theRVOT obstruction is. Neonates may present with failure to thrive and/orcyanosis, although cyanotic episodes may not appear until later. The clinicalfeatures include a harsh ejection systolic murmur in the pulmonary area,cyanosis and clubbing.
Management and echo follow-up in tetralogy of FallotIt’s very rare to see adults with untreated ToF, as fewer than 10 per cent ofpatients with untreated ToF survive to the age of 20 years. As a result,almost all the adults seen with a history of ToF will have undergone surgicalcorrection. ToF is usually treated with primary repair (closing the VSD andrelieving the RVOT obstruction) before the age of 1 year. However, wherenecessary it is possible to perform a modified Blalock–Taussig shuntprocedure (placing a graft between the subclavian artery and the pulmonaryartery) as a palliative measure – this does not fully correct the ToF, but itdoes increase blood flow to the pulmonary circulation.
Following primary ToF repair in childhood, survival at 30 years is over 90 per cent. As a result, there are now many adults with previous ToF repairwho need follow-up. The key problems to assess during echo follow-up include:
● pulmonary regurgitation● severity of any residual RVOT obstruction● any shunting across a residual VSD.
Pulmonary regurgitation is common following repair and this can lead to RVdilatation and dysfunction (and a risk of ventricular tachycardia). It istherefore important to assess the degree of any pulmonary regurgitation, inaddition to assessing the impact of this on RV dimensions and function(Chapter 15). Any residual RVOT obstruction should be quantified withDoppler studies. Use colour Doppler to detect any shunting across a residualVSD and then go on to assess the degree of shunting.
It should be noted that although echo plays an important role in follow-upafter ToF repair, cardiac magnetic resonance imaging can provide moredetailed information about residual right heart abnormalities.
Con
gen
ital h
eart
dis
ease
311
FURTHER READING
Brickner ME, Hillis LD, Lange RA. Congenital heart disease inadults: first of two parts. N Engl J Med 2000; 342: 256–63.
Brickner ME, Hillis LD, Lange RA. Congenital heart disease inadults: second of two parts. N Engl J Med 2000; 342: 334–42.
Li W. British Society of Echocardiography Distance LearningModule 9: Adult Congenital Heart Disease. Accessible from theBSE website (www.bsecho.org).
Shinebourne EA, Babu-Narayan SV, Carvalho JS. Tetralogy ofFallot: from fetus to adult. Heart 2006; 92: 1353–9.
The Task Force on the Management of Grown Up CongenitalHeart Disease of the European Society of Cardiology.Management of grown up congenital heart disease. Eur Heart J2003; 24: 1035–84.
312
A number of echo requests crop up commonly, such as ‘Breathlessness?cause’ and ‘Stroke ?cardiac source of emboli’. This chapter considers someof the requests you will see most often and discusses the key points that youneed to consider in each case.
● BreathlessnessBreathlessness is a common symptom that has a multitude of possiblecauses. In many cases the clinician will want the sonographer to look forevidence of heart failure (systolic or diastolic), but it is important to be alertto a broad range of possible diagnoses as you perform the echo study. Evenif you do find evidence of left ventricular (LV) dysfunction, remember thatan individual patient can have more than one contributing factor for theirsymptoms. Common causes of breathlessness are listed below:
● Heart failure:� Measure left and right ventricular dimensions.� Assess left and right ventricular systolic function.� Check for LV diastolic dysfunction.� Describe any regional wall motion abnormalities.� Check for associated valvular disease.
● Valvular disease:� Assess valvular structure and function.� Assess chamber dimensions and function.� Assess pulmonary artery pressure (if possible).
● Ischaemic heart disease:� Are there any regional wall motion abnormalities?� Consider stress echo.
Common echorequests
23

Com
mon
ech
o re
que
sts
313
● Lung disease:� Assess right ventricular (RV) dimensions and function.� Assess pulmonary artery pressure (if possible).� Is there any evidence of pulmonary embolism?
Remain alert to non-cardiac causes of breathlessness that might nonethelessbe detected on echo, such as a pleural effusion (Fig. 19.3, p. 260).
● ArrhythmiasEcho is frequently requested in patients with arrhythmias to check forassociated structural heart disease. Although the heart will often prove to bestructurally normal, it is nonetheless important to perform a full echo studyas there are several possible abnormalities that may be found. It is helpful tohave as much detail as possible about the nature of the arrhythmia to help guidethe echo study. An echo should be part of the assessment of patients withsustained (or non-sustained) supraventricular or ventricular tachyarrhythmias.It is not usually helpful in those with isolated supraventricular or ventricularectopic beats, in the absence of any other features.
Atrial fibrillationAtrial fibrillation (AF) is the commonest sustained arrhythmia, affecting 0.5 per cent of the adult population (and 10 per cent of those aged over 75 years). Many conditions can cause AF (Table 23.1), and an echo mayreveal evidence of these, in particular:
● valvular heart disease● cardiomyopathy● LV hypertrophy (LVH) in hypertension● right heart abnormalities in pulmonary disease or pulmonary embolism● pericardial disease.
Table 23.1 Causes of atrial fibrillation
Ischaemic heart disease Pulmonary diseaseValvular heart disease Pulmonary embolismHypertension PneumoniaCardiomyopathy PericarditisMyocarditis ‘Lone’ atrial fibrillation Alcohol (no identified cause)Thyrotoxicosis
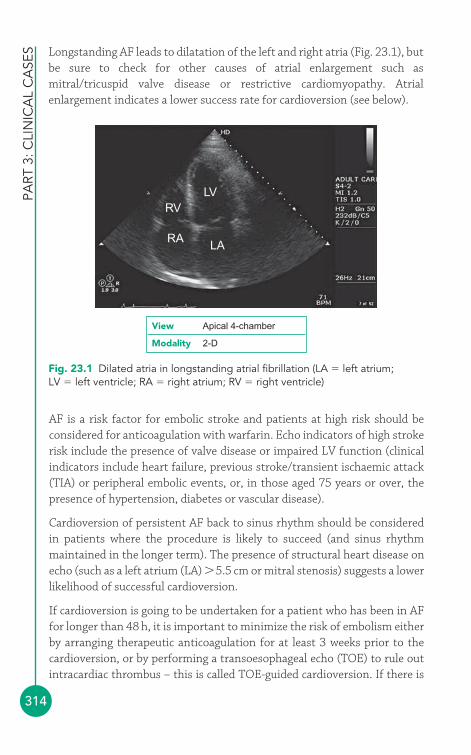
PART
3: C
LIN
ICA
L C
ASE
S
314
AF is a risk factor for embolic stroke and patients at high risk should beconsidered for anticoagulation with warfarin. Echo indicators of high strokerisk include the presence of valve disease or impaired LV function (clinicalindicators include heart failure, previous stroke/transient ischaemic attack(TIA) or peripheral embolic events, or, in those aged 75 years or over, thepresence of hypertension, diabetes or vascular disease).
Cardioversion of persistent AF back to sinus rhythm should be consideredin patients where the procedure is likely to succeed (and sinus rhythmmaintained in the longer term). The presence of structural heart disease onecho (such as a left atrium (LA) �5.5 cm or mitral stenosis) suggests a lowerlikelihood of successful cardioversion.
If cardioversion is going to be undertaken for a patient who has been in AFfor longer than 48 h, it is important to minimize the risk of embolism eitherby arranging therapeutic anticoagulation for at least 3 weeks prior to thecardioversion, or by performing a transoesophageal echo (TOE) to rule outintracardiac thrombus – this is called TOE-guided cardioversion. If there is
RV
RALA
LV
Fig. 23.1 Dilated atria in longstanding atrial fibrillation (LA � left atrium;LV � left ventricle; RA � right atrium; RV � right ventricle)
View Apical 4-chamber
Modality 2-D
Longstanding AF leads to dilatation of the left and right atria (Fig. 23.1), butbe sure to check for other causes of atrial enlargement such asmitral/tricuspid valve disease or restrictive cardiomyopathy. Atrialenlargement indicates a lower success rate for cardioversion (see below).
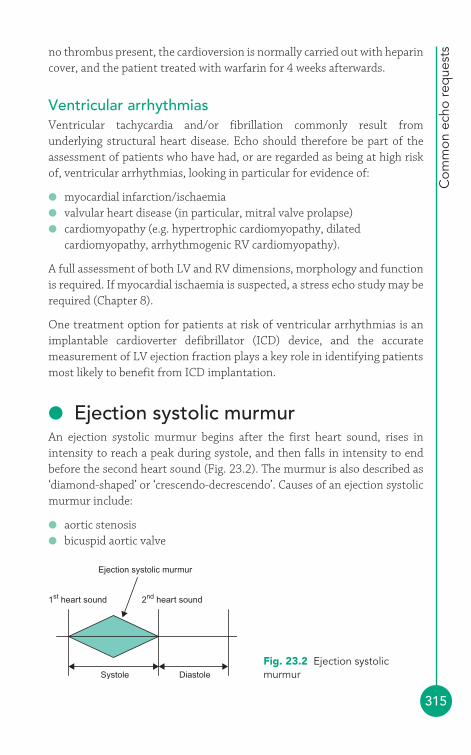
Com
mon
ech
o re
que
sts
315
no thrombus present, the cardioversion is normally carried out with heparincover, and the patient treated with warfarin for 4 weeks afterwards.
Ventricular arrhythmiasVentricular tachycardia and/or fibrillation commonly result fromunderlying structural heart disease. Echo should therefore be part of theassessment of patients who have had, or are regarded as being at high riskof, ventricular arrhythmias, looking in particular for evidence of:
● myocardial infarction/ischaemia● valvular heart disease (in particular, mitral valve prolapse)● cardiomyopathy (e.g. hypertrophic cardiomyopathy, dilated
cardiomyopathy, arrhythmogenic RV cardiomyopathy).
A full assessment of both LV and RV dimensions, morphology and functionis required. If myocardial ischaemia is suspected, a stress echo study may berequired (Chapter 8).
One treatment option for patients at risk of ventricular arrhythmias is animplantable cardioverter defibrillator (ICD) device, and the accuratemeasurement of LV ejection fraction plays a key role in identifying patientsmost likely to benefit from ICD implantation.
● Ejection systolic murmurAn ejection systolic murmur begins after the first heart sound, rises inintensity to reach a peak during systole, and then falls in intensity to endbefore the second heart sound (Fig. 23.2). The murmur is also described as‘diamond-shaped’ or ‘crescendo-decrescendo’. Causes of an ejection systolicmurmur include:
● aortic stenosis● bicuspid aortic valve
1st heart sound 2nd heart sound
Ejection systolic murmur
Systole Diastole
Fig. 23.2 Ejection systolicmurmur
PART
3: C
LIN
ICA
L C
ASE
S
316
● pulmonary stenosis● hypertrophic obstructive cardiomyopathy.
Remember that aortic and pulmonary stenosis can occur not just at the valve but also with obstruction to outflow at a subvalvular or supravalvularlevel.
‘Ejection systolic murmur cause?’ is a common echo request and mustinclude a search for all these structural abnormalities. If no structural heartdisease is found, the murmur is likely to be a result of increased flow acrossa normal aortic or pulmonary valve, as seen in hyperdynamic flow states(e.g. exercise, anaemia, pregnancy, thyrotoxicosis), and is termed an‘innocent’ murmur.
● HypertensionHypertension is arbitrarily defined as a blood pressure �140/90 mmHgand is a major risk factor for cardiovascular disease. In 95 per cent of caseshypertension is idiopathic, but in 5 per cent there is an identifiableunderlying cause such as renal disease, metabolic/endocrine abnormalitiesor coarctation of the aorta.
Echo assessment is appropriate for patients with suspected hypertensiveheart disease, but not as a routine screening tool in uncomplicatedhypertension. When performing an echo in hypertension, look for aorticcoarctation (Chapter 22) and for end-organ damage as a consequence of thehypertension:
● LVH and diastolic dysfunction● LV dilatation and systolic dysfunction● Aortic root dilatation and aortic regurgitation.
You should calculate LV mass in patients found to have LVH (p. 118). LVH is a significant independent risk factor for cardiovascular morbidity andmortality.
● Collagen abnormalitiesMarfan syndrome is a genetic condition with an autosomal dominantpattern of inheritance (although in a quarter of cases there is no familyhistory, i.e. a new mutation) and an incidence of 2–3 per 10 000 population.Patients with Marfan syndrome have an abnormality of fibrillin, a
Com
mon
ech
o re
que
sts
317
constituent of connective tissue, and this can cause abnormalities affectingthe musculoskeletal and cardiovascular systems, and also the skin and eyes.
The diagnosis of Marfan syndrome is based on the Ghent criteria, whichrequire the presence of ‘major’ criteria in two organ systems and a ‘minor’criterion in a third system. Major cardiovascular criteria include:
● aortic root dilatation● dissection of the ascending aorta.
Minor cardiovascular criteria include:
● mitral valve prolapse● mitral valve calcification (�40 years)● pulmonary artery dilatation● dilatation/dissection of the descending aorta.
Echo therefore plays an important role in the diagnosis of Marfansyndrome. It is also essential in follow-up; patients with Marfan syndromerequire regular echo monitoring with particular attention to the aortic root,which should be measured at the level of the aortic annulus, the sinuses ofValsalva (which is where dilatation usually begins), the sinotubular junctionand the ascending aorta. Measurements should be compared with normalrange nomograms which take into account the patient’s age and bodysurface area. For follow-up studies, it is important to ensure that themeasurements are reproducible and therefore can be compared from onestudy to the next. Echo follow-up should occur at least annually in adults(and every 6–12 months in children).
The risk of aortic dissection is related to the aortic diameter, and the risk ofrupture is particularly high if the aortic root diameter exceeds 5.5 cm.Treatment with beta-blockers should be considered if any degree of aorticdilatation is present, and surgical referral should be made if the aortic rootdiameter exceeds 5.0–5.5 cm in an adult (or 5.0 cm in a child). Decisions onthe timing of surgery may also be influenced by the rate of aortic dilatationor a family history of aortic dissection. For details on the risks of pregnancyin Marfan syndrome, see below.
Ehlers–Danlos syndrome is a group of genetic disorders, classified into sixsubgroups, characterized by collagen abnormalities. Some patients developmitral valve prolapse and echo assessment is important if this is suspected.Patients with the Ehlers–Danlos vascular subtype (type IV) are prone todevelop arterial aneurysms that can include the aorta, and a screening echoto assess the aortic root and arch is appropriate.

PART
3: C
LIN
ICA
L C
ASE
S
318
● Renal failureThe echo assessment of patients with chronic renal failure should include afull assessment of LV dimensions, and systolic and diastolic function.Hypertension is common in chronic renal failure and may be associatedwith LVH. Both systolic and diastolic dysfunction may be impaired.
Amyloidosis refers to a group of conditions in which amyloid protein builds upin tissues, including the kidney and the heart. Patients with amyloid-relatedrenal failure may therefore show signs of cardiac amyloid on echo (p. 252).
Mitral annular calcification is a frequent finding in chronic renal failure, andits presence is associated with a poor prognosis. It is recognized as a calcified(echodense) area at the junction of the posterior mitral valve leaflet andatrioventricular groove (Fig. 23.3).
LV
Mitral annularcalcification
LA
Fig. 23.3 Mitral annular calcification (LA � left atrium; LV � left ventricle)
View Parasternal long axis
Modality 2-D
Uraemia is a consequence of renal failure and can cause uraemic pericarditis,in which pericardial effusion (and possibly cardiac tamponade) may occur.
Coronary artery disease (CAD) is the commonest cause of death in patientswith chronic renal failure, and its detection (and treatment) prior to renaltransplantation is important. Dobutamine stress echo (DSE, Chapter 8) hasproven a valuable technique for detecting CAD in these patients (and issuperior to exercise treadmill testing). It also provides information on
Com
mon
ech
o re
que
sts
319
prognosis – the greater the extent of myocardial ischaemia (percentage ofischaemic segments) during DSE, the greater the risk of premature death.
● StrokeIn patients who have had a TIA or an embolic stroke or a peripheral arterialembolism, an echo is commonly requested to check whether there is acardiac source of emboli. However, the yield of such studies is low,particularly in the absence of any other features in the history, examinationor ECG that point towards a cardiac abnormality. The use of echo to assess for an embolic source varies from centre to centre, but a transthoracicecho (TTE) is often requested in patients who are younger than 50 years ofage or if clinical evaluation is suggestive of an underlying cardiacabnormality. The diagnostic yield of transoesophageal echo (TOE) is betterthan that of TTE, and TOE is often considered in younger patients (�50 years), or if there is ongoing clinical suspicion of a cardiac source ofemboli after a normal TTE, or if an abnormality found on TTE requires moredetailed evaluation.
Echo may identify a direct source of emboli:
● LV thrombus● LA thrombus (especially LA appendage)● left heart tumour (e.g. myxoma)● infective endocarditis● aortic atheroma.
Alternatively, echo may find a condition associated with an increased risk ofemboli:
● atrial septal aneurysm● patent foramen ovale/atrial septal defect (paradoxical embolism)● ventricular septal defect (with pulmonary hypertension)● acute myocardial infarction● dilated cardiomyopathy● mitral stenosis● prosthetic heart valve.
One of the commonest cardiac causes of emboli is AF. Although this isdiagnosed with an ECG rather than an echo, an echo is nonethelessimportant in the assessment of patients with this condition (see above).
PART
3: C
LIN
ICA
L C
ASE
S
320
● PregnancyEcho provides a safe and effective means of assessing the heart duringpregnancy. Pregnant patients may require an echo to assess known pre-existing cardiac problems, or as a diagnostic investigation in the case of newsymptoms (e.g. breathlessness) or signs (e.g. murmurs). It is important to beaware of the normal cardiovascular changes in pregnancy and the effect thatthese changes can have on those with prior cardiac conditions.
During a normal pregnancy, cardiac output increases by around 40 per cent,because of a rise in both heart rate and stroke volume, reaching a peaktowards the end of the second trimester. Cardiac output then remains on aplateau until the time of delivery, at which point there is a further increase(due to an increase in venous return to the heart, relief of pressure on theinferior vena cava, and the return of blood from the contracted uterus to thecirculation) before gradually returning to normal over the next 2 weeks.
The ‘volume overload’ of pregnancy leads to an increase in LV end-systolicand end-diastolic diameters, and also an increase in LV mass. There is alsoan increase in valve orifice area of all four valves, increasing the likelihood ofvalvular regurgitation.
Pre-existing dilated cardiomyopathy is poorly tolerated during pregnancy,with a high maternal mortality rate, particularly if the patient hasmoderate/severe symptoms or an ejection fraction �20 per cent. Acardiomyopathy can also develop as a consequence of pregnancy(peripartum cardiomyopathy, defined as an ejection fraction �45 per centoccurring in the last months of pregnancy or within 5 months of delivery).Although fetal outcome is generally good, maternal mortality can be high. It isparticularly important to assess the risk of recurrence in future pregnancies –persistently abnormal LV function 1 year after pregnancy predicts a high (20 per cent) risk of mortality in a subsequent pregnancy.
‘Innocent’ flow-related heart murmurs are common in pregnancy, and are afrequent reason for echo referrals. However, not all murmurs in pregnancyare benign, and structural valvular disease must be identified and assessedcarefully. Obstructive cardiac lesions such as mitral stenosis and aorticstenosis (and also hypertrophic obstructive cardiomyopathy) can be verypoorly tolerated and require careful clinical and echo assessment.
Patients with Marfan syndrome (see above) have a 1 per cent risk of aorticdissection during pregnancy, even if the aortic dimensions are initiallynormal. This risk is much higher is the aortic root is dilated �4 cm (or is
Com
mon
ech
o re
que
sts
321
FURTHER READING
Chambers JB, de Belder MA, Moore D. Echocardiography instroke and transient ischaemic attack. Heart 1997; 78 (suppl 1):2–6.
Dean JCS. Management of Marfan syndrome. Heart 2002; 88:97–103.
Douglas PS, Khandheria B, Stainback RF, et al. ACCF/ASE/ACEP/ASNC/SCAI/SCCT/SCMR 2007 Appropriateness criteriafor transthoracic and transesophageal echocardiography. J AmColl Cardiol 2007; 50: 187–204.
Feringa HHH, Bax JJ, Schouten O. Ischemic heart disease in renal transplant candidates: towards non-invasive approachesfor preoperative risk stratification. Eur J Echocardiogr 2005; 6:313–16.
Thorne SA. Pregnancy in heart disease. Heart 2005; 90: 450–6.
rapidly dilating), or if there is cardiac involvement or a poor family history.Monthly clinical assessment and echo are appropriate, with the fullinvolvement of a multidisciplinary specialist team (particularly at the timeof delivery). Beta-blockers should be continued throughout pregnancy.
Patients with pre-existing congenital heart disease should receiveappropriate assessment and counselling before planning a pregnancy. Someconditions are very high risk – patients with Eisenmenger syndrome, forexample, have a maternal mortality of around 40 per cent and are advised toavoid pregnancy (and indeed pulmonary hypertension, whatever the cause,generally presents a high risk in pregnancy). A detailed discussion of therisks of pregnancy in different congenital heart problems is beyond thescope of this book, but helpful guidance is available (see Further Reading).

This page intentionally left blank

323
TEXTBOOKSIntroductory handbooks
Kaddoura S. Echo Made Easy, 2nd edn. Edinburgh: Churchill Livingstone,2009. ISBN-13: 978-0443103636.
Leeson P, Mitchell AR, Becher H. Echocardiography. Oxford: OxfordUniversity Press, 2007. ISBN-13: 978-0199215751.
Rimington H, Chambers J. Echocardiography: A Practical Guide for Reporting,2nd edn. Oxford: Informa Healthcare, 2007. ISBN-13: 978-1841846347.
Comprehensive reference books
Feigenbaum H, Armstrong WF, Ryan T. Feigenbaum’s Echocardiography,6th edn. Philadelphia: Lippincott Williams & Wilkins, 2004. ISBN-13: 978-0781731980.
Jae KO, Seward JB, Tajik AJ. The Echo Manual, 3rd edn. Philadelphia:Lippincott Williams & Wilkins, 2006. ISBN-13: 978-0781748537.
Otto CM. Textbook of Clinical Echocardiography, 3rd edn. Edinburgh:Elsevier Saunders, 2004. ISBN-13: 978-0721607894.
JOURNALSCardiovascular Ultrasound (online journal):www.cardiovascularultrasound.com
Echo: The Journal of the British Society of Echocardiography: www.bsecho.org
Appendix 1Echo resources

ECH
O R
ESO
URC
ES
324
Echocardiography: A Journal of Cardiovascular Ultrasound and AlliedTechniques: www.blackwell-synergy.com/loi/echo
European Journal of Echocardiography: http://ejechocard.oxfordjournals.org
Journal of the American Society of Echocardiography:http://journals.elsevierhealth.com/periodicals/ymje
KEY GUIDELINES
Key guidance published by the British Society of Echocardiography (BSE)and available from its website (www.bsecho.org):
● Clinical Indications for Echocardiography● A Minimum Dataset for a Standard Adult Transthoracic Echocardiogram● Recommendations for Standard Adult Transthoracic Echocardiography● Recommended Views for a Standard Adult Transthoracic Echo.
Posters published by the BSE and British Heart Foundation (details can beobtained from the BSE):
● Echocardiography: guidelines for chamber quantification● Echocardiography: guidelines for valve quantification.
Cerqueira MD, Weissman NJ, Dilsizian V, et al. Standardized myocardialsegmentation and nomenclature for tomographic imaging of the heart.Circulation 2002; 105: 539–42.
Douglas PS, Khandheria B, Stainback RF, et al. ACCF/ASE/ACEP/ASNC/SCAI/SCCT/SCMR 2007 Appropriateness criteria for transthoracic andtransesophageal echocardiography. J Am Coll Cardiol 2007; 50: 187–204.
Douglas PS, Khandheria B, Stainback RF, et al. ACCF/ASE/ACEP/AHA/ASNC/SCAI/SCCT/SCMR 2008 Appropriateness criteria for stressechocardiography. J Am Coll Cardiol 2006; 51: 1127–47.
Lang RM, Bierig M, Devereux RB, et al. Recommendations for ChamberQuantification: A Report from the American Society of Echocardiography’sGuidelines and Standards Committee and the Chamber QuantificationWriting Group, Developed in Conjunction with the European Associationof Echocardiography, a Branch of the European Society of Cardiology. J AmSoc Echocardiogr 2005; 18: 1440–63.

Echo
res
ourc
es
325
The Task Force on the Management of Valvular Heart Disease of theEuropean Society of Cardiology. Guidelines on the management of valvularheart disease. Eur Heart J 2007; 28: 230–68.
Zoghbi WA, Enriquez-Sarano M, Foster E, et al. American Society ofEchocardiography: Recommendations for evaluation of the severity ofnative valvular regurgitation with two-dimensional and Dopplerechocardiography. J Am Soc Echocardiogr 2003; 16: 777–802.
SOCIETIESAmerican Society of Echocardiography2100, Gateway Centre BoulevardSuite 310Morrisville NC 27560United States of America
Tel: �919 861 5574Fax: �919 882 9900Website: www.asecho.org
British Society of Echocardiography10-16, Tiller RoadDocklands Business CentreLondon E14 8PXUnited Kingdom
Tel: 020 7345 5185Fax: 020 7345 5186Website: www.bsecho.org
European Association of EchocardiographyEuropean Society of CardiologyThe European Heart House2035, Route des CollesBP 179 – Les TempliersF-06903 Sophia AntipolisFrance
Tel: �33.4.92.94.76.00Fax: �33.4.92.94.76.01Website: www.escardio.org/bodies/associations/EAE

ECH
O R
ESO
URC
ES
326
WEBSITESIn addition to the websites already listed above, the following sites containmaterial of interest to anyone learning or practising echocardiography:
E-chocardiography Journal: www2.umdnj.edu/�shindler
Echocardiology.org: www.echocardiology.org
Wikiecho: www.wikiecho.com
Yahoo! Discussion Group – Cardiovascular Ultrasound:http://health.groups.yahoo.com/group/echocardiography
Yale Atlas of Echocardiography:http://info.med.yale.edu/intmed/cardio/echo_atlas/contents.

327
We would like to know what should be included (or omitted!) in the nextedition of Making Sense of Echocardiography. Please write with yourcomments or suggestions to:
Dr Andrew R. HoughtonMaking Sense of Echocardiographyc/o Hodder Arnold (Publishers)338 Euston RoadLondon NW1 3BH
We will acknowledge all suggestions that are used.
Appendix 2Help with the next edition

This page intentionally left blank
329
A point 168, 169A wave 131–2A-mode (amplitude mode) scans 3–4,
23abscess 239–40accreditation 45acoustic impedance 18–19, 20acoustic lens 22acute coronary syndrome 143–4adenosine stress 90advanced echo techniques 93–101
3-D echo 97–8 3-Dcontrast studies 93–6epicardial echo 99–100intravascular ultrasound 98–9
agitated saline bubble contrast 93–5,296, 298
aldosterone antagonists 129Alfieri (edge-to-edge) repair 230aliasing 36, 41, 185–6, 200American College of Cardiology (ACC)
51American Heart Association (AHA)
142, 243–4American Society of Echocardiography
(ASE) 69, 100, 113amplitude 17amyloidosis 252–3, 318anaesthetics, local 74, 75aneurysm 147
atrial septal 297left ventricular 112, 145–6sinus of Valsalva 272, 278–9
aneurysmal coronary artery 290–1angina 151–2
stable 144–5unstable 144, 145
angiogram, coronary 107angiosarcoma 286angiotensin-converting enzyme
(ACE) inhibitors 129anti-ischaemic drugs 144–5antibiotics 240–1anticoagulation 178, 189, 224, 287,
314–15antithrombotic agents 145aorta 6–7, 270–81
ascending 56, 62descending 56false lumen 274, 275–6measurement 270–1normal echo appearance 270–2sinus of Valsalva aneurysm 272,
278–9views and windows 270–1see also aortic atheroma;
aortic dilatation; aorticdissection
aortic arch 68–9aortic atheroma 279–80aortic coarctation 305–7aortic dilatation 272–4
causes 272, 317echo assessment 273–4management 274in pregnancy 320–1
Index
aortic dissection 274–8associated features 276causes 275classification 274dissection flap 275echo assessment 275–7management 277mortality 275sample report 277
aortic mean pressure (Pmean) 156aortic peak pressure (Pmax) 156aortic peak velocity (Vmax) 156, 157aortic regurgitation 158–66, 276–7
associated features 164causes 158clinical features 158–9echo assessment 41, 77, 159–65echo pitfalls 164jet measurement 160–1, 164management 165–6proximal isovelocity surface area
163regurgitant fraction 163regurgitant orifice area 163regurgitant volume 162–3sample report 165severity 164–5
aortic rootand aortic regurgitation 158dilatation 273–4, 277, 317, 320–1disease 166
aortic sclerosis 151aortic stenosis 151–8
associated features 156and bicuspid aortic valve 303–4causes 151clinical features 151–2echo assessment 152–7functional 90low gradient, low flow 90management 157–8, 232pressure gradients 39–40rheumatic 151sample report 157severity 156and stress echo 90–1subvalvar 151, 152–3, 305supravalvar 151, 152–3, 305
aortic valve 7–8, 149–67abscess 240bicuspid 151, 166, 272, 303–5calcific degeneration 151and the cardiac cycle 13–14echo views 149–50pressure gradient 39–40, 90pseudobicuspid 303, 304transoesophageal echo 76,
77, 79transthoracic echo 56–7, 59–60,
62–4vegetations 240see also aortic regurgitation; aortic
stenosisaortic valve annulus 8aortic valve area 90aortic valve effective orifice area
(EOAAV) 154–5, 157apposition 10archiving 28area-length method 117–18, 120arrhythmias 313–15artefacts 20, 27–8, 277
acoustic shadowing 27beam width 28reverberation 27–8side lobe 28
ascending aorta 56, 62atherosclerosis 98–9atherosclerotic plaque 143athlete’s heart 249atrial dilatation 314atrial fibrillation 313–15, 319atrial kick 10atrial septal aneurysm 297atrial septal defect 10, 14, 293–7
clinical features 293–4echo assessment 294–7management 297primum 293secundum 293sinus venosus 293types 293windows and views 294
atrium see left atrium; right atriumatropine 83, 89attenuation 20
IND
EX
330

Ind
ex
331
audit 46–7autoimmune conditions 148autosomal dominant conditions
246–51, 316–17
B-mode (brightness mode) scans 23balloon valvuloplasty 158, 178, 222,
231–2baseline shift 33, 36Bernoulli equation 39–40, 154
modified 306simplified 40, 154, 210, 218–19
beta-blockers 84, 129, 166biological valves see prosthetic valves,
biological valvesBlalock-Taussig shunt procedure,
modified 310blood flow velocity see cardiac blood
flow velocityblood stasis 287, 288body surface area (BSA) 115, 117–18,
121, 127breathlessness 312–13British Society of Echocardiography
(BSE) 44, 51, 69–70, 124
carcinoid syndrome 198carcinoid tumour 198cardiac anatomy 6–15cardiac blood flow velocity 31, 32–41
flow volume 38laminar 37–8mean velocity Vmean 38, 41, 156,
157modal velocity 38peak velocity Vmax 38, 40turbulent 37–8, 41
cardiac catheterization 107–8, 154cardiac chambers 7–11cardiac computed tomography 105–7cardiac cycle 13–14
isovolumic contraction 13isovolumic relaxation 13, 14ventricular ejection 13, 14ventricular filling 13, 14
cardiac death, risk of 88cardiac index 127
cardiac magnetic resonance imaging104–5
cardiac markers 143–4cardiac masses 195, 261–2, 282–7
causes 282normal variants 282, 289–91thrombus 287–9tumours 282–7vegetations 289see also left ventricular mass
cardiac output 127cardiac physiology 6–15cardiac resynchronization therapy
129cardiac tamponade 262–6
and aortic dissection 276clinical features 262–3echo assessment 263–5management 265–6sample report 265and ventricular rupture 147–8
cardiac valves 7–11see also specific valves
Cardiac Workforce Committee 45–6cardiomyopathies 243–57
apical ballooning 246, 247arrhythmogenic right ventricular
253–6classification 243–4dilated 114, 244–6, 320hypertrophic 246–51hypertrophic obstructive 247,
248–50isolated ventricular non-compaction
251–2peripartum 320primary 244restrictive 252–3, 267–8secondary 244
cardioprotective drugs 145cardioversion 314–15Carney complex 284catheterization, cardiac 107–8, 154cavitation 29Chiari network 193–4, 290chordae 9circumflex (coronary) artery 11–12,
141
IND
EX
332
clinical governance 46collagen abnormalities 316–17colour Doppler 40–1
aortic coarctation 306aortic dissection 275–6aortic regurgitation 160–1, 165,
304aortic stenosis 153aortic valve views 149Ebstein’s anomaly 308mitral regurgitation 181–2, 185–6,
188mitral stenosis 173patent foramen ovule 298persistent ductus arteriosus 301–2post-infarction ventricular septal
defect 147pulmonary regurgitation 213pulmonary stenosis 210transthoracic echo 57, 58–60,
62–9tricuspid regurgitation 198, 200tricuspid stenosis 196ventricular septal defect 300
computed tomographycardiac 105–7multislice 105–7single photon emission 102–3
congenital heart disease 293–311aortic coarctation 305–7aortic stenosis 305atrial septal defect 293–7bicuspid aortic valve 303–5Ebstein’s anomaly 307–9patent foramen ovule 297–8persistent ductus arteriosus 301–3and pregnancy 320–1pulmonary stenosis 307Tetralogy of Fallot 309–10ventricular septal defect 299–301
conservation of mass, law of 39continuity equation 39, 155–6, 175continuous wave (CW) Doppler 33–7
aortic coarctation 306aortic regurgitation 161–2, 165aortic stenosis 153–4, 155aortic valve views 150bicuspid aortic valve 305
Ebstein’s anomaly 308mitral regurgitation 182–3, 186mitral stenosis 173–5pulmonary regurgitation 213–14,
219pulmonary stenosis 210–11transthoracic echo 58, 59, 60,
62–7, 69tricuspid regurgitation 198–200,
218tricuspid stenosis 196ventricular septal defect 300
contrast studies 93–6agitated saline bubble 93–5, 296,
298echo contrast agents 4, 85, 95–6,
105cor triatriatum 138cor triatriatum dexter 138coronary angiogram 107coronary artery 11–12
aneurysmal 290–1calcification 106and cardiac computed tomography
107–8circumflex 11–12, 141and intravascular ultrasound 98–9left 8, 11–12, 141–3left anterior descending 11–12, 141and multislice computed
tomography 106normal 141–3remodelling 99right 8, 11–12, 141–3stenting 99
coronary artery disease 318–19and regional left ventricular
function 141–8and stress echo 82–3
coronary artery stenosis 81–2coronary atherosclerosis 98–9coronary revascularization 145coronary sinus 11
dilated 290, 291cross-sectional area (CSA) 38–9
CSALVOT 125–7, 155–6, 163, 175,183, 184, 296
CSAMV 162, 184
Ind
ex
333
CSARVOT 214–15, 295CSATV 214, 215
cyst, pericardial 269, 291
D waves 133decibels (dB) 17decompression illness 298Definity® 96departmental issues 44–5depth settings 26descending aorta 56diastolic function see left ventricular
diastolic functiondiastolic heart failure 129–30diastolic measurements
linear left ventricular 113–15see also end-diastolic measurements;
right ventricular diastolicpressure
digoxin 129dilated vessels 290–1dipyridamole stress 89–90display methods 28dissection flap 275diuretics 129, 137, 178, 202dobutamine stress study 81–2,
88–91, 318–19Doppler physics 4, 31–43
Doppler effect 31–2Doppler principles 31–2Doppler shift 32, 35, 36fluid dynamics 37–40spectral Doppler 32–8
see also continuous wave (CW)Doppler; pulsed-wave (PW)Doppler
spectral Doppler envelope 38tissue Doppler imaging 4, 42see also colour Doppler
Dressler’s (postmyocardial infarction)syndrome 148
Duke criteria 235Dussik, Karl 3
E:A ratio 131–2, 135Em:Am ratio 134–5E point 168, 169
E wave 131–2Ebstein’s anomaly 307–9echo contrast agents 4, 85, 95–6
gadolinium-based 105echo machine instrumentation
25–6echoreflection 3–4Edler, Inge 3–4effective orifice area
aortic valve 154–5, 157prosthetic valves 226, 229pulmonary valve 211
Ehlers-Danlos syndrome 317Eisenmenger syndrome 303, 321ejection fraction 123–5, 315ejection time, right ventricle 208electrocardiogram (ECG) 84embolic disease 217embolism 314embolus 279, 319end-diastolic measurements 113,
116–17, 119RV 203, 205–6see also left ventricular end-diastolic
volumeend-systolic measurements 113,
116RV 205–6see also left ventricular end-systolic
volumeendocarditis 234–42
fungal 237infective 234–41
acute/subacute 234–5at risk groups 236–7causes 234–5clinical features 235–6, 237–40echo assessment 236–40, 241management 240–1prevention 241sample report 240
Libman–Sacks 242non-infective 241–2prosthetic valve 239endomyocardial fibrosis 252–3epicardial echo 99–100European Association of
Echocardiography (EAE) 45
IND
EX
334
European Society of Cardiology (ESC)130
Eustachian valve 11, 193–4, 290
Fabry disease 251far field (Fraunhofer zone) 21–2fast Fourier transform 32fibrillin 316–17fibroma 285–6first heart sound 14fistula 240fluid dynamics 37–40flumazenil 75focus 26fractional shortening 123, 125frame rate 25, 26, 27frequency 17, 18
gain setting 26, 33gel 19Ghent criteria 317glyceryl trinitrate 144gold standards 47grey scale compression 26
haemangioma 285haematoma, intramural 278half-intensity depth (HID) 20harmonic imaging 4, 23, 85
second 23heart
anatomy 6–11sound wave propagation velocity
18heart failure 122
and aortic regurgitation 159and aortic stenosis 152and breathlessness 312causes 122classification 122clinical features 122diastolic (heart failure with
preserved ejection fraction)129–30
management 129and mitral regurgitation 188–9moderate to severe 129
systolic (heart failure with reducedejection fraction) 122, 129, 130
heart murmurAustin Flint 160diastolic 160ejection systolic 315–16innocent 316, 320pansystolic 299
heart rate, ischaemic threshold 88heart sound, first/second 14heartbeat 13–14hepatic vein 200Hertz (Hz) 17Hertz, Carl Hellmuth 3–4history of echocardiography 1–5hyperphonography 3hypertension 316
see also pulmonary hypertension
imaging modalities 24–5implantable cardioverter defibrillator
(ICD) 129, 315implanted devices 129, 315
and cardiac masses 291see also prosthetic valves
inferior vena cava (IVC) 6–7diameter 193–4, 218, 263, 267
information leaflets 54infrasound 17instrumentation 16–30intensity of ultrasound 29interatrial septum 10
lipomatous hypertrophy 290interventricular dyssynchrony 129interventricular septum 114–15, 119
rupture 147transthoracic echo 57ventricular septal defect 299–300
intracardiac pressure, normal 14intravascular ultrasound 98–9intraventricular dyssynchrony 129ischaemic heart disease
and breathlessness 312mitral regurgitation 178, 189see also myocardial ischaemia
ischaemic threshold 88isovolumic contraction 13isovolumic relaxation 13, 14
Ind
ex
335
isovolumic relaxation time (IVRT)131, 132, 208
jet lesions 236Joyner, Claude 4jugular venous pressure 193
Keidel, Wolf-Dieter 3
Lambl’s excrescences 8, 290left anterior descending (coronary)
artery 11–12, 141left atrium
anatomy 6, 10cardiac cycle 14dilatation 137–8pressure 14thrombi 287, 288
left atrium echo assessment 137–9apical window 137left atrial dimensions 137–9
diameter 137, 138, 139volume 137–9
left parasternal window 137subcostal window 137
left coronary artery 8, 11–12normal 141–3
left heart 111–40cardiac computed tomography 107left atrium 137–9left ventricle 111–37
left ventricleanatomy 6, 8aneurysm 112, 145–6cardiac cycle 13–14‘contractile reserve’ 90–1dilatation 112, 244–5dimensions 111, 112–18
linear 113–15volumetric 116–18
echo contrast agents 96hypertrophy 118–19, 246–8non-compaction 251–2pressure 14regional wall motion abnormality
141–8segmentation 142–3, 144
left ventricle echo assessment111–37
3-D echo 98left ventricular diastolic function
129–37left ventricular dimensions 111,
112–18left ventricular mass 118–21left ventricular systolic function
112, 122–9overall shape abnormality 111,
112stress echo 82, 85, 90–1transthoracic 95
left ventricular diastolic function129–37
causes of impaired 130–1echo assessment 131–6interpretation of results 135left ventricular inflow 131–2, 136management of impaired 137pulmonary venous flow 133, 136sample report 136tissue Doppler imaging of the
mitral annulus 133–5, 136left ventricular end-diastolic volume
(LVEDV) 116–18, 120–1, 124left ventricular end-systolic volume
(LVESV) 116, 117, 124left ventricular inflow
echo assessment 131–2, 136respiratory variation in cardiac
tamponade 263–4left ventricular internal dimension –
diastole (LVIDd) 114–15,119, 123, 124
left ventricular internal dimension –systole (LVIDs) 114, 123, 124
left ventricular mass 118–21echo pitfalls 121linear measurements 119, 121normal 118volumetric measurements 119–21
area-length method 120Modified Simpson’s rule method
120–1truncated ellipsoid formula
120
IND
EX
336
left ventricular outflow tract (LVOT)8
cross-sectional area (CSALVOT)125–7, 155–6, 163, 175, 184,185, 296
flow obstruction 247, 248–50hypertrophy 247pulsed-wave Doppler imaging 37,
126respiratory variation 264stroke volume (SVLVOT) 163, 175,
185, 296transthoracic echo 57, 63–4turbulent flow 249velocity time integral (VTILVOT)
125–7, 155–6, 163, 175, 185,214, 296
left ventricular posterior wall (LVPW)114–15, 119
left ventricular systolic function 112,122–9
cardiac index 127cardiac output 127echo pitfalls 123ejection fraction 123–5, 315fractional shortening 123, 125heart failure 122management of impaired 129rate of ventricular pressure rise
127–8sample report 128stroke distance 125stroke volume 125–7stroke volume index 127
left ventricular thrombus 287, 288,289
lipoma 285lipomatous hypertrophy of the
interatrial septum 290low mechanical index (low-MI)
imaging 95lung disease 313lymphoma, primary cardiac 286
M-mode cursor 113M-mode (motion mode) scans 4,
23–4, 27aortic dilatation 273
aortic dissection 275aortic regurgitation 159–60aortic stenosis 152aortic valve views 149–50bicuspid aortic valve 304cardiac tamponade 263colour Doppler 41intensity of ultrasound 29linear left ventricular
measurements 113–14mitral regurgitation 179–81mitral valve 168, 172–3pericardial constriction 266–7pericardial effusion 261pulmonary regurgitation 213pulmonary stenosis 210transthoracic echo 56–61tricuspid regurgitation 198tricuspid stenosis 196
magnetic resonance imaging, cardiac104–5
Marfan syndrome 166, 272, 278,316–17, 320–1
matrix array transducers 97–8mechanical effects 29mechanical index (MI) 29
low 95mechanical valves see prosthetic
valves, mechanical valvesmetastases 286midazolam 75migraine 298mitral annulus 8–9
calcification 171, 318tissue Doppler imaging 133–5,
136mitral regurgitation 10, 173, 178–90,
238–9acute 182associated features 186–7causes 178–9chronic 182, 189clinical features 179echo assessment 179–88echo pitfalls 187functional 190ischaemic 189jet measurement 181–2, 185–7

Ind
ex
337
management 188–90and papillary muscle rupture
146–7proximal isovelocity surface area
185–6rate of ventricular pressure rise
127–8regurgitant fraction 185regurgitant orifice area 185regurgitant volume 183–5sample report 188severity 187–8spectral Doppler display 33, 34transthoracic echo 60
mitral stenosis 170–8, 220associated features 176causes 170–1clinical features 171–2coexistence with tricuspid stenosis
195continuity equation 175echo assessment 172–7echo pitfalls 176management 177–8rheumatic 170, 171, 172sample report 177severity 176–7spectral Doppler display 34and stress echo 91
mitral valve 8–10, 168–90abscess 240and aortic regurgitation 159–60and the cardiac cycle 13, 14echo views 168–70
apical window 168, 169–70left parasternal window 168–9,
173subcostal window 170
flail leaflet 178–9, 180leaflets 8–10, 178–9, 180M-mode study 24mean mitral pressure drop 175,
176–7pressure gradient 173–4, 175prolapse 178, 180, 182repair 230–1stroke volume (SVMV) 163, 184systolic anterior motion 250–1
transthoracic echo studies 56, 57,60–1, 68
vegetations 237, 238see also mitral regurgitation; mitral
stenosis; percutaneousballoon mitral valvuloplasty
mitral valve area 174, 175, 176–7mitral valve cross-sectional area
(CSAMV) 162, 184mitral valve inflow
pressure half-time 173–5, 176–7velocity time integral (VTIMV)
162–3, 175, 183–5moderator band 282, 289–90Modified Simpson’s rule method
116–17, 120–1, 137Mosteller formula 115multislice computed tomography
(MSCT) 105–7myocardial infarction 82, 143–5
and aortic dissection 276, 277complications 145–8echo assessment 144management 145and mitral regurgitation 178–9non-ST elevation (NSTEMI) 145ST elevation (STEMI) 145
myocardial infiltration 252–3myocardial ischaemia 143–5
and aortic dissection 276, 277echo assessment 144ischaemic threshold 88management 144–5with stress 81–3, 88, 91see also ischaemic heart disease
myocardial perfusionimaging 102–3, 104and myocardial function 81stress echo 81–92
myocardiumDoppler assessment 42hibernating 82, 144ischaemic response 82necrotic response 82, 91, 143–4normal response 82stress induction 81–2stunned 82, 144viability response 82, 91

IND
EX
338
myxoma 283–5atrial 284, 285familial 284
National Institute for Health andClinical Excellence (NICE) 124, 236near field (Fresnel zone) 21–2nil by mouth 74, 75, 80nodule of Arantius 8non-ST elevation myocardial
infarction (NSTEMI) 145nuclear cardiology 102–4
disadvantages 103–4myocardial perfusion imaging
102–3, 104radionuclide ventriculography
103Nyquist’s theorem 36
Optison® 96
pacemakers, biventricular 129pacing wires 197pannus 224–5papillary fibroelastoma 285papillary muscle 9, 61–2
and the mitral valve 169–70,178–9, 189
rupture 146–7, 178–9, 189transoesophageal echo 79
paravalvular regurgitation 227,229–30, 239
patent foramen ovule 10, 297–8pectinate muscles 288percutaneous techniques 222, 231–2
atrial septal defect closure 297percutaneous balloon mitral
valvuloplasty 178, 222, 231–2transcatheter aortic valve
implantation 158, 222, 232pericardial constriction 266–8
causes 266clinical features 266, 268echo assessment 266–8management 268sample report 268
pericardial cyst 269, 291pericardial effusion 12, 148, 259–62,
265and aortic dissection 276causes 259echo assessment 259–62management 262size 261see also cardiac tamponade
pericardial fluid 258, 261pericardial mass 261–2pericardial tumour 269pericardiocentesis 94–5, 262, 265–6pericarditis 12, 148pericardium 12, 258–69
cardiac tamponade 262–6congenital absence 268–9fibrous 12normal echo 258–9serous 12transthoracic echo 57and ventricular rupture 147–8
persistent (patent) ductus arteriosus301–3
phased-array transducers 4physics 16–30
artefacts 27–8display and recording methods 28Doppler 31–43echo machine instrumentation
25–6elementary 16–18imaging modalities 24–5resolution 26–7safety issues 29–30ultrasound propagation 18–20ultrasound transducers 20–3
piezoelectric effect 3, 21piezoelectric elements 21pleural effusion 259–60post-infarction ventricular septal
defect 147posterior descending artery 141pregnancy 320–1
volume overload 320pressure gradients 39–40, 127–8
of aortic stenosis 39–40of biological valves 229
Ind
ex
339
of mechanical valves 226of the mitral valve 173–4, 175transaortic 153, 154–5transpulmonary 210, 211of the tricuspid valve 197
pressure half-timeof biological valves 229of mechanical valves 226mitral valve inflow 173–5, 176–7of the tricuspid valve 197
pressure recovery 226probes, transoesophageal echo 74–5,
76biplane 74monoplane 74multiplane 74–5
propagation velocity 17–18prostaglandin inhibitors 302prosthetic valve endocarditis 239prosthetic valves 157, 222–30
biological valves 157, 222–3,227–30
aortic 230autograft 227forward flow 229function 229–30homograft 227mitral 228regurgitant flow 229–30rocking 229sample report 230structure 228–9xenograft 227
mechanical valves 222–7advantages/disadvantages
223–4aortic 224ball and cage 223bileaflet 223blood bubbles 225forward flow 226function 226–7mitral 224–5occluder 223, 224–5, 226–7patient-prosthesis mismatch
226regurgitant flow 226–7retaining mechanism 223
rocking 224sewing ring 223structure 224–5tilting disc 223
sewing rings 223, 239proximal isovelocity surface
area (PISA) 163, 185–6,200–1
pseudoaneurysm 147–8pulmonary artery 6–7, 58–9, 209pulmonary artery pressure
diastolic 219–20mean 216, 220systolic 216, 218–19, 220
pulmonary hypertension 216–21associated features 220causes 217classification 217clinical features 217definition 216echo assessment 217–20hypoxaemia 217and lung disease 217management 221pulmonary arterial 217pulmonary venous 217sample report 220and thrombotic/embolic disease
217pulmonary regurgitation 59–60, 210,
211, 212–16associated features 215causes 212echo assessment 213–16jet measurements 213–14, 219jet peak velocity 219and pulmonary artery diastolic
pressure 219regurgitant fraction 214–15regurgitant volume 214–15sample report 216severity 215–16and Tetralogy of Fallot 310
pulmonary stenosis 59–60, 209–12associated features 211–12causes 209clinical features 209echo assessment 210–12
IND
EX
340
pulmonary stenosis (continued)sample report 212severity 212subvalvar 307supravalvar 307valvar 307
pulmonary valve 10, 209–16and the cardiac cycle 14dimensions 203–5transthoracic echo 58–9windows and views 209see also pulmonary regurgitation;
pulmonary stenosispulmonary valve effective orifice area
211pulmonary vein 6–7, 10pulmonary venous flow 133, 136,
183pulse repetition frequency (PRF)
36pulsed-wave (PW) Doppler 33,
35–7, 126aortic coarctation 306aortic regurgitation 161, 165aortic stenosis 153–4bicuspid aortic valve 305cardiac tamponade 263–5Ebstein’s anomaly 308intensity of ultrasound 29left ventricular diastolic echo
131–2, 133mitral regurgitation 182–3mitral stenosis 173–5pericardial constriction 267pulmonary regurgitation
213–14pulmonary stenosis 210–11transthoracic echo 58, 59, 60,
63–9tricuspid regurgitation 198–200tricuspid stenosis 196ventricular septal defect 300
quality control 46–7
radiation, ionizing 103–4radionuclide ventriculography 103radiopharmaceuticals 102
recording methods 28red blood cell velocity 32, 34Reed, Jack 4reflection 19–20, 22
backscatter 19, 20Rayleigh scatterers 20specular 19
refraction 20regional wall motion abnormality
(RWMA), left ventricle 141–8regulations 4regurgitant flow, prosthetic valves
226–7, 229–30regurgitant fraction 163, 185,
214–15regurgitant orifice area 163, 185regurgitant volume
aortic 162–3mitral 183–5pulmonary 214–15
renal failure 318–19resolution 26–7
spatial 26–7temporal 27
respiratory variation, in cardiactamponade 263–4
Reynolds equation 38rhabdomyoma 285rheumatic valve disease 170, 171,
172, 195–6, 202right atrial mass 195right atrial pressure (RAP) 193, 194,
218right atrium 6, 191–5
anatomy 11echo studies 191–5size 192–3
right coronary artery 8, 11–12normal 141–3
right heart 191–221cardiac computed tomography 107neglect in transthoracic echo 191pulmonary hypertension 216–21pulmonary valve 209–16right atrium 191–5right ventricle 203–9thrombus 288tricuspid valve 195–202
Ind
ex
341
right ventricle 6, 10, 203–9atrialization 307dimensions 203–6ejection time 208function 206–9
fractional area change 206, 207Tei index 207–8tricuspid annular plane systolic
excursion 206–7haemodynamics 209isovolumic contraction time 208isovolumic relaxation time 208pressure overload 209views and windows 203–5volume overload 209
right ventricular diastolic pressure(RVDP) 219
right ventricular hypertrophy 309–10right ventricular inflow, respiratory
variation in cardiactamponade 263–4
right ventricular outflow tract(RVOT) 10
cross-sectional area (CSARVOT)214–15, 295
dimensions 203–5flow in pulmonary regurgitation 214obstruction 309–10respiratory variation in flow 264stroke volume (SVRVOT) 215, 296transthoracic echo 58, 59–60velocity time integral (VTIRVOT)
214–15, 296right ventricular systolic pressure
(RVSP) 218–19round trip time 22, 36
S waves 133safety issues 29–30saline bubble contrast, agitated 93–5,
296, 298sample volumes 35–7, 133sarcomas 286second heart sound 14sector width 26sedation 75
conscious 76service provision 44–7
departmental issues 44–5quality control 46–7staffing issues 45–6
shuntcalculations 295–6, 300left-to-right 299, 301, 303right-to-left 93–4, 303
sigmoid septum 249sine waves 16single photon emission computed
tomography (SPECT) 102–3sinotubular junction, effacement
272sinus of Valsalva 7–8
aneurysm 272, 278–9aortic measurement 270–1
Society of CardiovascularAnesthesiologists 100
sound waves 16–18amplitude 17propagation velocity 17–18wavelength 17, 18
spatial peak temporal average (SPTA)29
‘spontaneous echo contrast’ 288ST elevation myocardial infarction
(STEMI) 145staffing issues 45–6Staphylococcus aureus 234–5statins 157stents 99, 227, 228stomach 79storing echo studies 28stress echo 81–92
acquiring images 85–8aftercare 91baseline images 85–7contraindications for 83–4endocardial border definition 85indications for 82–3and myocardial infarction 144and myocardial ischaemia 144normal 88patient preparation 84principles 81–2reports 91sensitivity 83stress protocols 88–91
IND
EX
342
stress echo (continued)dobutamine stress study 81–2,
88–91, 318–19exercise stress 89vasodilator stress 81–2, 84,
89–90termination 87–8and valvular disease 90–1wall motion score index 86–8windows and views 85, 86
stroke 298, 314, 319stroke distance 38–9, 125stroke volume 39, 125–7
SVLVOT 163, 175, 185, 296SVMV 163, 184SVRVOT 215, 296SVTV 214, 215
stroke volume index 127superior vena cava 6–7surgery
aortic valve 157–8, 166atrial septal defect closure 297for infective endocarditis 240–1mitral valve 178, 189prosthetic valve replacement 222–30tricuspid valve 202
syncope, exertional 151–2systole
aortic valve views 149left atrial contraction 10see also left ventricular systolic
functionsystolic anterior motion 250–1systolic heart failure 122, 129, 130systolic measurements
left ventricular 113–15, 122–9see also end-systolic measurements;
right ventricular systolicpressure
Tei index 207–8teratoma 286Tetralogy of Fallot 309–10thermal effects 29thoracotomy 297Three dimensional (3-D) echo 97–8
disadvantages 98indications for 98
and left ventricular volumeassessment 118
and mitral regurgitation 189real time 97stress echo 85
thrombotic disease 217thrombus 143, 147–8, 287–9, 319
in aortic false lumen 276and atrial fibrillation 314–15causes 287echo assessment 288–9and mechanical valves 224mural 146sample report 289substrate 287
time-gain compensation (TGC) 26tissue boundaries, and acoustic
impedance 18–19, 20tissue Doppler imaging 4, 42
of the mitral annulus 133–5, 136training 45transaortic pressure gradient 153,
154–5instantaneous 154mean 154peak-to-peak 154
transaortic velocity 154transcatheter aortic valve
implantation 158, 222, 232‘transmit power’ control 26, 33transoesophageal echo (TOE) 4, 72–80
advantages 72–3aftercare 80and agitated saline bubble contrast
94atrial septal defect 296cardiac thrombus 288complications 74contraindications 73and epicardial echo 99–100indications 73infective endocarditis 236myxoma 284patient preparation 74performance 75–6probe 74–5, 76prosthetic valve assessment 224–5prosthetic valve endocarditis 239
Ind
ex
343
standard study 76–9mid-oesophageal views 76–9transgastric views 79upper oesophageal views 79
stroke 319thermal effects 29TOE-guided cardioversion 314
transpulmonary pressure gradientmean ( Pmean) 211peak ( Pmax) 210
transpulmonary velocity, peak (Vmax)210
transthoracic echo (TTE) 51–71accuracy 52–3and agitated saline bubble contrast
94aorta 270aortic dissection 275, 276–7atrial septal defect 296Bayesian analysis 53cardiac thrombus 288echo requests 52false negatives 52–3, 277false positives 52–3, 277guidelines 51–2image quality 95indications for 51–3infective endocarditis 236limitations 52, 95myxoma 284patient preparation 53–4report 69–71sensitivity 52–3specificity 52–3stroke 319triage of inpatient requests 53urgent 53windows and views 54–69
apical window 55, 62–6left parasternal window 55–62parasternal long axis view 55,
56–7parasternal right ventricular
inflow view 55, 57–8parasternal right ventricular
outflow view 55, 58–9parasternal short axis view 55,
59–62
right parasternal window 55, 62subcostal parasternal window
55, 66–8suprasternal parasternal window
55, 68–9transvalvular regurgitation 227, 229trastuzumab (Herceptin) 124treadmill exercise 89tricuspid annular plane systolic
excursion (TAPSE) 206–7tricuspid regurgitation 11, 40,
197–202associated features 201causes 197Ebstein’s anomaly 307–8echo assessment 198–200jet measurement 198–200, 218jet peak velocity (TR Vmax) 218management 202proximal isovelocity surface area
200–1and pulmonary artery systolic
pressure 218sample report 202severity 201–2
tricuspid stenosis 195–7causes 195–6clinical signs 196echo assessment 196–7severity 197
tricuspid valve 11, 195–202area 197cross-sectional CSA (CSATV) 214,
215and Ebstein’s anomaly 307–8inflow 214mean pressure gradient 197pressure half-time 197stroke volume (SVTV) 214, 215transthoracic echo 57, 58, 59–60velocity time integral (VTITV) 214views and windows 195, 218see also tricuspid regurgitation;
tricuspid stenosis truncated ellipsoid formula 120tumour 198, 269, 282–7
carcinoid 198clinical features 282–3
IND
EX
344
tumour (continued)malignant primary 286primary cardiac 283–6secondary cardiac 286–7
Two-dimensional (2-D) imaging 4,23, 24–5, 27
aortic coarctation 305aortic dilatation 273aortic dissection 275aortic regurgitation 159–60aortic stenosis 152–3, 304aortic valve 149, 304atrial septal defect 297bicuspid aortic valve 304cardiac tamponade 263comparison with 3-D 97–8Ebstein’s anomaly 308intensity of ultrasound 29mitral regurgitation 179–80mitral valve 168, 170, 172–3myocardial infarction 146–7pericardial assessment 259pericardial constriction 266–7pericardial effusion 261–2pulmonary regurgitation 213pulmonary stenosis 210RV dimensions 203stress echo 85transthoracic echo 56–69tricuspid regurgitation 198tricuspid stenosis 196ventricular septal defect 299–300
ultrasoundbeam focus 21–2definition 17history of cardiac 3–4physics 16–30propagation 18–20
ultrasound transducers 20–3backing layers 21matching layers 21phased-array 21
uraemia 318
Valsalva manoeuvre 93–4valve repair 222, 230–1
echo assessment 231mitral 230–1
valve replacement see prostheticvalves
valvular destruction 238–9valvular disease
and breathlessness 312and stress echo 90–1
vasodilator stress 81–2, 84, 89–90
vasodilators, pre-emptive use 166vegetations 235–8, 240–2, 289‘velocity range’ setting 33velocity time integral (VTI) 38, 39
VTILVOT 125–7, 155–6, 163, 175,185, 214, 296
VTIMV 162–3, 175, 183–5VTIRVOT 214–15, 296VTITV 214
vena contracta 160–1, 182, 198ventricle see left ventricle; right
ventricleventricular arrhythmias 315ventricular ejection 13, 14ventricular filling 13, 14ventricular rupture 147–8ventricular septal bounce 267ventricular septal defect 299–301
inlet 299muscular 299(peri-)membranous 299subpulmonary 299and Tetralogy of Fallot 309–10
wall motion abnormality, regional141–8
wall motion score index (WMSI) 86–8
wavelength 17, 18Wilkins score 232World Health Organization (WHO)
243