eclipse test & performance tools platform, part 1: test ... · eclipse test & performance...
TRANSCRIPT

Eclipse Test & Performance Tools Platform, Part 1:Test, profile, and monitor applicationsSkill Level: Intermediate
Martin Streicher ([email protected])Editor-in-ChiefLinux Magazine
14 Feb 2006
Learn how to use the Eclipse Test & Performance Tools Platform (TPTP) to profile aJava™ application, and discover how to quantify memory usage, identify memoryleaks, and isolate performance bottlenecks.
Section 1. Before you start
About this tutorial
This tutorial introduces the Eclipse Test & Performance Tools Platform (TPTP),provides step-by-step instructions on how to install Eclipse and the TPTP tools, anddemonstrates how to profile a running Java application.
Prerequisites
To benefit, you should have experience with Java software development and theentire software development life cycle, including testing and profiling. You shouldalso have experience installing software from the command line, and setting andmanaging shell and system environment variables, such as the Java CLASSPATH.Acquaintance with Eclipse and the Standard Widget Toolkit (SWT) is also beneficial.
Before you start, you must install several software packages on your UNIX®,Linux®, Mac OS X, or Microsoft® Windows® system. You need a functioning Java
Test, profile, and monitor applications© Copyright IBM Corporation 1994, 2008. All rights reserved. Page 1 of 33

Virtual Machine (JVM), a copy of the Eclipse platform, the Eclipse TPTP runtime,and several prerequisites and co-requisites on which TPTP depends. You also needTPTP's Agent Controller, which allows you to start and profile applications. Here'severything you need:
• Java 2 Platform, Standard Edition (J2SE) V1.4 Software Development Kit(SDK)
• J2SE V1.4 Java Runtime Environment (J2RE)
• Eclipse V3.1 SDK
• Eclipse Modeling Framework (EMF) SDK V2.1
• XML Schema Infoset Model (XSD) SDK V2.1
• Version 1.1.1 of UML2
• TPTP runtime
• Agent Controller runtime (appropriate to your system)
• The Eclipse Update Manager (optional)
System requirements
If you don't have a JVM and Eclipse installed on your system, make sure you haveat least 300 MB of disk space free for all the software. You also need enough freephysical memory to run the JVM. In general, 64 MB or more of free physical memoryis recommended.
Section 2. Introducing TPTP
Writing the Java code for an application or servlet is just the first stage in the muchlonger process required to deliver robust production-quality programs. Code must betested to vet its operation and accuracy. Code must often be profiled to removebottlenecks that impede performance and to remove wasteful or inadvertent use ofresources, especially memory. Code must also be monitored -- to pinpoint failures,of course, but also to identify usage patterns, opportunities for further enhancementand optimization, and attempted and actual intrusions.
developerWorks® ibm.com/developerWorks
Test, profile, and monitor applicationsPage 2 of 33 © Copyright IBM Corporation 1994, 2008. All rights reserved.

What is the Eclipse TPTP?
While many tools exist to test, profile, and monitor code, few, if any, are integratedinto a larger whole. Moreover, such tools are typically offered by separate vendors,leaving you to spend valuable time and effort learning and mastering many differentuser interfaces (UIs), compilers, and diagnostics. Measured in hours and dollars,proprietary development tools require a steep investment.
But what if the test harness, profiler, and monitor were open source? And what if thetools were extensible, so that any vendor or developer could create new tools orenhance existing tools? And what if the tools were well integrated into an existing,popular, familiar development environment? A daydream, perchance? Hardly.
The Eclipse TPTP is a software architecture and several realized components (sofar) that extend the Eclipse platform to include test, performance, and monitoringtools. Some Java, C, and C++ developers use TPTP to build unique tools for otherdevelopers, while others combine TPTP-derived tools and the other features ofEclipse to build and deploy applications for users.
The TPTP deliverables
Briefly, TPTP is an Eclipse Foundation top-level project chartered to "build a generic,extensible, standards-based tool platform upon which software developers cancreate specialized, differentiated, and interoperable ... test and performance tools."In other words, TPTP, at its core, is a tool to build other tools that automate softwarequality control.
Indeed, the current release of TPTP includes that core and three core-derived tools:
TPTPThe TPTP provides foundational code for UI development, data collection,rule-based data queries, and the control of applications. For instance, theTPTP provides many wizards that other tools can reuse and extend. It alsoprovides programming interfaces and a daemon that facilitate data collectionfrom a running, local, or remote process.
TPTP Testing ToolsThis project builds upon TPTP to provide additional services for automatingapplication testing of all kinds. The current release supports JUnit automatedtesting, a point-and-click scriptable system to direct manual testing and recordresults, and an automated system to test Web applications, including arecorder that can record and play back Web browsing sessions and
ibm.com/developerWorks developerWorks®
Test, profile, and monitor applications© Copyright IBM Corporation 1994, 2008. All rights reserved. Page 3 of 33

authenticate results. Eclipse V4.1 also includes an early release of a graphicaluser interface (GUI) recorder that can record and play back mouse andkeyboard events in SWT-based interfaces.
TPTP Monitoring ToolsThis project collects, analyzes, and visualizes data, either from log files or fromstatistics that the application gathers.
TPTP Tracing and Profiling ToolsThis project also extends the TPTP to collect and analyze resource use,including CPU and memory, in running applications. The tracing tools alsoallow you to interact with a running process. For example, you can manuallyforce garbage collection and examine the remaining object pool in efforts tofind and fix a memory "leak."
In addition, the TPTP includes a daemon called the Agent Controller. The AgentController is a liaison between the Eclipse workbench and the application beingtested. It can launch local or remote Java applications on behalf of Eclipse andforwards application metrics, including application log files, to the workbench.
The remainder of this tutorial demonstrates several of the TPTP profiling tools forJava technology.
Section 3. Installing the prerequisite software andcomponents
Before you can begin this tutorial, you must install and set up the software andcomponents included in the Prerequisites section.
Install J2SE and J2RE
Download and install the J2SE V1.4 SDK and the V1.4 J2RE. (If your systemalready has J2SE V1.4.2_10 or a higher version, you can skip this step.)
Typically, the J2SE SDK and Java Runtime Environment (JRE) are distributed asself-extracting binaries. Installation on Linux is typically as easy as this:
Listing 1. J2SE SDK and Java Runtime Environment installation
developerWorks® ibm.com/developerWorks
Test, profile, and monitor applicationsPage 4 of 33 © Copyright IBM Corporation 1994, 2008. All rights reserved.

% cd ~% mkdir ~/java% cd ~/java% mv ~/j2sdk-1_4_2_10-linux-i586.bin .% mv ~/j2re-1_4_2_10-linux-i586.bin .% chmod +x j2sdk-1_4_2_10-linux-i586.bin \j2re-1_4_2_10-linux-i586.bin% ./j2sdk-1_4_2_10-linux-i586.bin.% ./j2re-1_4_2_10-linux-i586.bin.% ls -Fj2re1.4.2_10/ j2sdk1.4.2_10/
Use the Eclipse Update Manager to install TPTP (optional)
If you have already installed Eclipse, you can use the Eclipse Update Manager toinstall TPTP. To do so:
1. Click Help > Software Updates > Find and Install.
2. Select the Search for new features to install option, then click Next.
3. Click New Remote Site, then type TPTP Update Site andhttp://eclipse.org/tptp/updates/site.xml for the name andURL, respectively. Click Finish.
4. Select the features to install, then Next.
5. Accept the license agreement, click Next, then Finish.
6. At the confirmation prompt, click Install All. When the installation iscomplete, restart Eclipse.
You can now safely skip to the steps in the Install the Agent Controller section belowthat describe how to install the Agent Controller, which you must install manually. Ifyou haven't installed Eclipse yet, continue reading.
Install the Eclipse V3.1 SDK
Download the Eclipse 3.1 SDK that's appropriate for your platform. You can find theSDK at the Eclipse Downloads. Typically, installation is as easy as unpacking theEclipse .tar.gz file into the directory of your choice. For example, if you're usingLinux, download the Eclipse V3.1 SDK tarball, then unpack it in a directory, such as
ibm.com/developerWorks developerWorks®
Test, profile, and monitor applications© Copyright IBM Corporation 1994, 2008. All rights reserved. Page 5 of 33

~/java/, using this code:
% cd ~/java% mv ~/eclipse-SDK-3.1.1-linux-gtk.tar.gz .% tar zxvf eclipse-SDK-3.1.1-linux-gtk.tar.gz
To verify that Eclipse was installed successfully, remain in the directory where youunpacked Eclipse, make sure that the java executable is in your PATH, and runjava -jar eclipse/startup.jar. For example:
Listing 2. Verify that Eclipse was installed successfully
% export JAVA_DIR=$HOME/java% export JAVA_HOME=$JAVA_DIR/j2sdk1.4.2_08/sdk% export PATH=$JAVA_HOME/bin% export CLASSPATH=$JAVA_HOME% cd $JAVA_DIR% java -jar eclipse/startup.jar
If you're prompted to choose a directory for your workspace, type$HOME/java/workspace. This directory will retain all the projects you create inEclipse. (Of course, if you have many projects, you can choose other directorieslater, say, to contain one project per workspace.)
Install the EMF SDK V2.1
Quit Eclipse if it's running and download EMF SDK V2.1. (According to the EMFWeb site, "EMF is a modeling framework and code generation facility for buildingtools and other applications based on a structured data model.") After you downloadthe file, change to the directory that contains the Eclipse folder and run unzipemf-sdo-SDK-2.1.0.zip. For instance:
Listing 3. Run unzip emf-sdo-SDK-2.1.0.zip
% cd $JAVA_DIR% lseclipse j2sdk1.4.2_08% mv ~/emf-sdo-SDK-2.1.0.zip .% unzip emf-sdo-SDK-2.1.0.zip
creating: eclipse/features/creating: eclipse/features/org.eclipse.emf.ecore.sdo_2.1.0/creating: eclipse/features/org.eclipse.emf_2.1.0/inflating: ...
developerWorks® ibm.com/developerWorks
Test, profile, and monitor applicationsPage 6 of 33 © Copyright IBM Corporation 1994, 2008. All rights reserved.

Install the XSD SDK V2.1
Download the XSD SDK V2.1. (According to the project Web site, "XSD is a librarythat provides an application programming interface (API) for manipulating thecomponents of an XML schema as described by the World Wide Web Consortium(W3C) XML Schema specifications.") As with the previous file, change to thedirectory that contains the Eclipse directory, and run unzip xsd-SDK-2.1.0.zip.Here is an example:
% cd $JAVA_DIR% mv ~/xsd-SDK-2.1.0.zip .% unzip xsd-SDK-2.1.0.zip
If you're prompted to confirm the overwrite of any files, simply press y (lowercase) toanswer Yes to each question.
Install the UML V2.0 Metamodel Implementation
To use the Unified Modeling Language (UML) features of TPTP, you need to installthe UML V2.0 Metamodel Implementation. If you're using Eclipse V3.1.1, downloadV1.1.1 of UML2, then unpack its archive file in the same directory that containsEclipse:
% cd $JAVA_DIR% mv ~/uml2-1.1.1.zip .% unzip uml2-1.1.1.zip
Install the TPTP runtime
For the next step, download the TPTP runtime, which contains all the TPTP featuresand Eclipse plug-ins needed to integrate the two systems. To install TPTP, changeto the directory that contains Eclipse and run unzip tptp.runtime-TPTP-4.1.0.zip.Here is an example:
% cd $JAVA_DIR% mv ~/tptp.runtime-TPTP-4.1.0.zip .% unzip tptp.runtime-TPTP-4.1.0.zip
ibm.com/developerWorks developerWorks®
Test, profile, and monitor applications© Copyright IBM Corporation 1994, 2008. All rights reserved. Page 7 of 33

Install the Agent Controller
The Agent Controller is a vital component of TPTP that allows Eclipse to launchapplications and interact with those applications to extract profiling data. Downloadthe Agent Controller runtime appropriate for your operating system. Next, create adirectory named tptpd in the same directory that contains Eclipse and unpack theAgent Controller archive into that directory. The commands to run are:
% mkdir $JAVA_DIR/tptpd% cd $JAVA_DIR/tptpd% mv ~/tptpdc.linux_ia32-TPTP-4.1.0.zip .% unzip tptpdc.linux_ia32-TPTP-4.1.0.zip
If you see two errors like these:
linking: lib/libxerces-c.sowarning: symbolic link (lib/libxerces-c.so) failed
linking: lib/libxerces-c.so.24warning: symbolic link (lib/libxerces-c.so.24) failed
you must recreate the two links manually by typing the following commands:
% cd $JAVA_DIR/tptpd/lib% rm libxerces-c.so libxerces-c.so.24% ln -s libxerces-c.so.24.0 libxerces-c.so% ln -s libxerces-c.so.24.0 libxerces-c.so.24
Add the Agent Controller directory
To use the Agent Controller, you must add its lib directory to yourLD_LIBRARY_PATH. For example, if you're running Linux and have adopted thesame directory structure shown in the steps above, you'd add$JAVA_DIR/tptpd/lib as follows:
% export LD_LIBRARY_PATH=$JAVA_DIR/tptpd/lib:$LD_LIBRARY_PATH
You must also ensure that the contents of the Controller's lib and bin directories areexecutable. To do that, run:
% chmod +x $JAVA_DIR/tptpd/{bin,lib}/*
developerWorks® ibm.com/developerWorks
Test, profile, and monitor applicationsPage 8 of 33 © Copyright IBM Corporation 1994, 2008. All rights reserved.
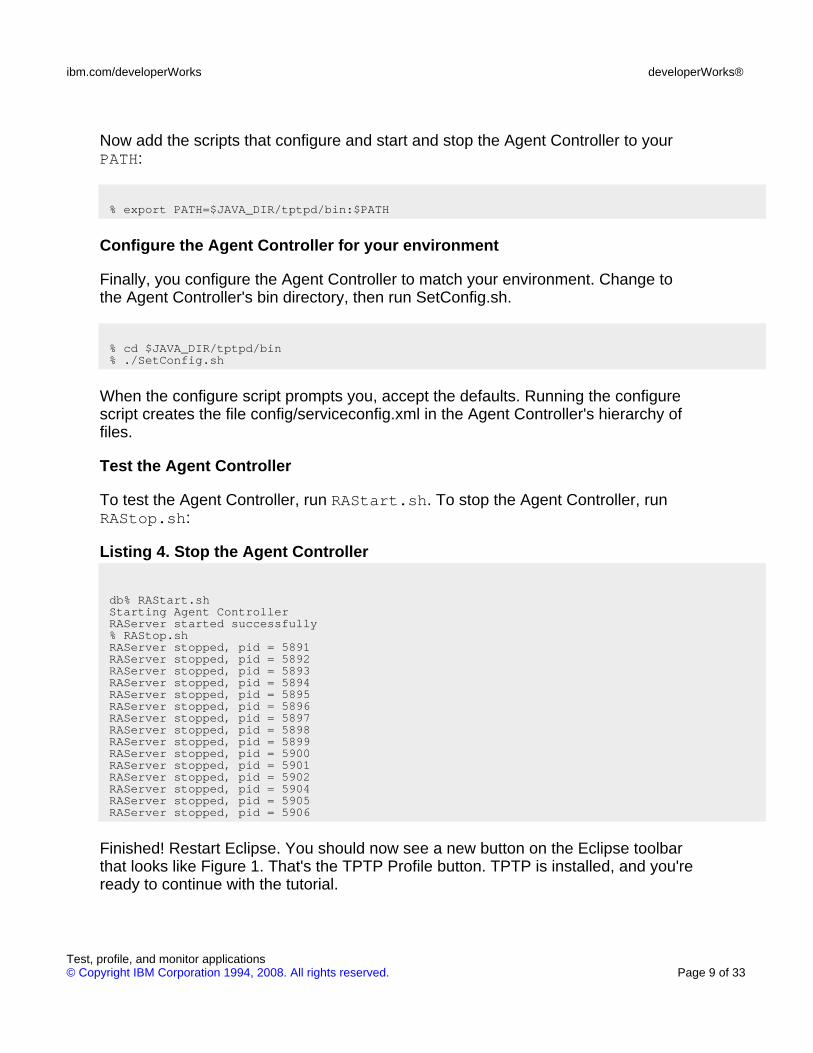
Now add the scripts that configure and start and stop the Agent Controller to yourPATH:
% export PATH=$JAVA_DIR/tptpd/bin:$PATH
Configure the Agent Controller for your environment
Finally, you configure the Agent Controller to match your environment. Change tothe Agent Controller's bin directory, then run SetConfig.sh.
% cd $JAVA_DIR/tptpd/bin% ./SetConfig.sh
When the configure script prompts you, accept the defaults. Running the configurescript creates the file config/serviceconfig.xml in the Agent Controller's hierarchy offiles.
Test the Agent Controller
To test the Agent Controller, run RAStart.sh. To stop the Agent Controller, runRAStop.sh:
Listing 4. Stop the Agent Controller
db% RAStart.shStarting Agent ControllerRAServer started successfully% RAStop.shRAServer stopped, pid = 5891RAServer stopped, pid = 5892RAServer stopped, pid = 5893RAServer stopped, pid = 5894RAServer stopped, pid = 5895RAServer stopped, pid = 5896RAServer stopped, pid = 5897RAServer stopped, pid = 5898RAServer stopped, pid = 5899RAServer stopped, pid = 5900RAServer stopped, pid = 5901RAServer stopped, pid = 5902RAServer stopped, pid = 5904RAServer stopped, pid = 5905RAServer stopped, pid = 5906
Finished! Restart Eclipse. You should now see a new button on the Eclipse toolbarthat looks like Figure 1. That's the TPTP Profile button. TPTP is installed, and you'reready to continue with the tutorial.
ibm.com/developerWorks developerWorks®
Test, profile, and monitor applications© Copyright IBM Corporation 1994, 2008. All rights reserved. Page 9 of 33
Figure 1. TPTP Profile button
Section 4. Profiling a Java application
Now that you've installed the TPTP and underlying software, run Eclipse.
The sample application
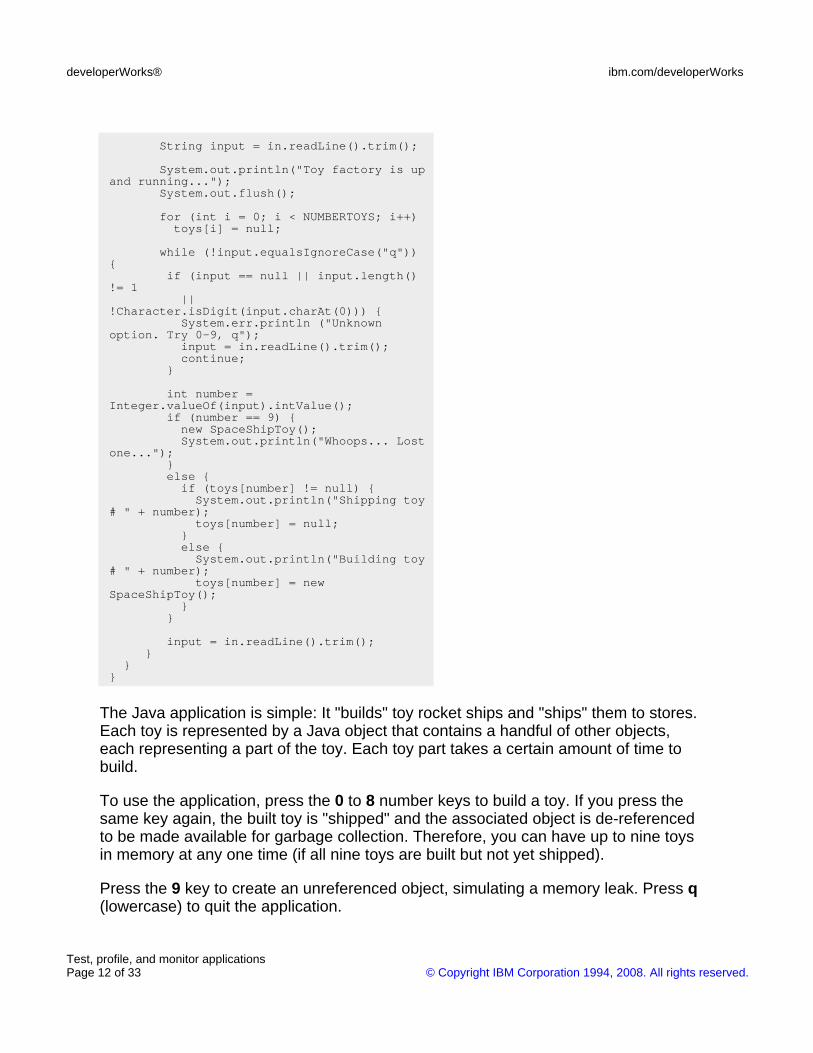
The Java application to profile is shown in Listing 5.
Listing 5. A simple Java application that hordes a small number of objects
import java.io.BufferedReader;import java.io.IOException;import java.io.InputStreamReader;
public class SpaceShipToy {/** To build a spaceship, you need a
capsule, a booster,* three stages, and two monkeys
(borrowed* from a Barrel of Monkeys).*/
public Capsule capsule = new Capsule();public Booster booster = new Booster();public Stage[] stage = new Stage[3];
public SpaceShipToy(){
for (int i = 0; i < 3; i++)stage[i] = new Stage();
}
private void _killTime(int seconds){
if (seconds <= 0)return;
for (int i = 0; i < seconds; i++);}
static final int MINUTE = 60;static final int CAPSULE = 2 * MINUTE;static final int BOOSTER = 5 * MINUTE;static final int STAGE = 3 * MINUTE;static final int MONKEY = 10 * MINUTE;
developerWorks® ibm.com/developerWorks
Test, profile, and monitor applicationsPage 10 of 33 © Copyright IBM Corporation 1994, 2008. All rights reserved.

class Capsule {public Monkey chimp1 = new Monkey(),
\chimp2 = new Monkey();
public Capsule() {System.out.println("Start building
the capsule...");_killTime(CAPSULE);chimp1.build();chimp2.build();System.out.println("Capsule
complete.");}
}
class Booster {public Booster() {
System.out.println("Startbooster...");
_killTime(BOOSTER);System.out.println("Blast off.");
}}
class Stage {public Stage() {
System.out.println("Startstage...");
_killTime(STAGE);System.out.println("Stage
complete.");}
}
class Monkey {public void start() {
System.out.println("Start the monkeybusiness...");
}
public void build() {start();_killTime(MONKEY);finish();
}
public void finish() {System.out.println("Monkey business
complete.");}
}
public static void main(String[] args)throws \
java.io.IOException{
final int NUMBERTOYS = 9;
BufferedReader in = newBufferedReader(new
InputStreamReader(System.in));SpaceShipToy[] toys = new
SpaceShipToy[NUMBERTOYS];
ibm.com/developerWorks developerWorks®
Test, profile, and monitor applications© Copyright IBM Corporation 1994, 2008. All rights reserved. Page 11 of 33
String input = in.readLine().trim();
System.out.println("Toy factory is upand running...");
System.out.flush();
for (int i = 0; i < NUMBERTOYS; i++)toys[i] = null;
while (!input.equalsIgnoreCase("q")){
if (input == null || input.length()!= 1
||!Character.isDigit(input.charAt(0))) {
System.err.println ("Unknownoption. Try 0-9, q");
input = in.readLine().trim();continue;
}
int number =Integer.valueOf(input).intValue();
if (number == 9) {new SpaceShipToy();System.out.println("Whoops... Lost
one...");}else {if (toys[number] != null) {
System.out.println("Shipping toy# " + number);
toys[number] = null;}else {
System.out.println("Building toy# " + number);
toys[number] = newSpaceShipToy();
}}
input = in.readLine().trim();}
}}
The Java application is simple: It "builds" toy rocket ships and "ships" them to stores.Each toy is represented by a Java object that contains a handful of other objects,each representing a part of the toy. Each toy part takes a certain amount of time tobuild.
To use the application, press the 0 to 8 number keys to build a toy. If you press thesame key again, the built toy is "shipped" and the associated object is de-referencedto be made available for garbage collection. Therefore, you can have up to nine toysin memory at any one time (if all nine toys are built but not yet shipped).
Press the 9 key to create an unreferenced object, simulating a memory leak. Press q(lowercase) to quit the application.
developerWorks® ibm.com/developerWorks
Test, profile, and monitor applicationsPage 12 of 33 © Copyright IBM Corporation 1994, 2008. All rights reserved.

Run a profiling session
Use Eclipse and TPTP to run and profile the "toy factory." TPTP can show thenumber of active objects, execution time, and more. To use Eclipse and TPTP:
1. Launch the Agent Controller.
2. Change to the Agent Controller bin directory, and then run RAStart.sh:
% cd $JAVA_DIR/tptpd/bin% ./RAStart.sh
3. In Eclipse, go to the workbench and create a new Java Project by clickingFile > New > Project. Select Java Project from the list of options, thenclick Next.
4. In the following window, type Toy Maker for the Project Name, then clickFinish. A new project titled "Toy Maker" should appear in the PackageExplorer pane.
5. Create a new Java class within the project called SpaceShipToy in theexample package. Click File > New > Class.
6. In the window that pops up, type example in the Package field andSpaceShipToy in the Name field. Leave the other settings in the windowas is.
7. Click Finish. You should now see a skeleton for the new class.
8. Paste the code from Listing 1 into the Eclipse class editor, being sure toleave the package example declaration, but replacing the empty classdefinition. Save the code to persist your changes, which also causesEclipse to automatically recompile the new version of your class.
9. If you want to run the application, click Run > Run..., double-click JavaApplication, select SpaceShipToy, then click Run. To interact with theapplication, click Windows > Show View..., then select Console.
10. Type a 1 (the numeral one) and press Return. Your screen should looksomething like Figure 2.Figure 2. The toy factory running under Eclipse
ibm.com/developerWorks developerWorks®
Test, profile, and monitor applications© Copyright IBM Corporation 1994, 2008. All rights reserved. Page 13 of 33
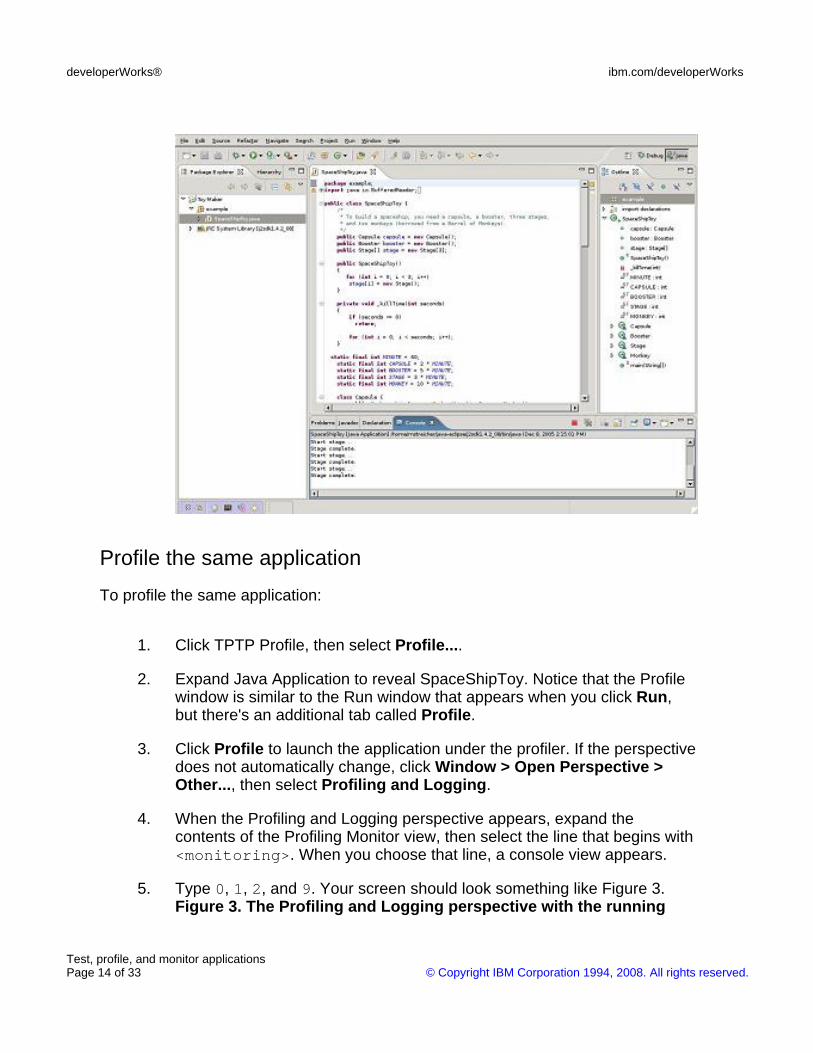
Profile the same application
To profile the same application:
1. Click TPTP Profile, then select Profile....
2. Expand Java Application to reveal SpaceShipToy. Notice that the Profilewindow is similar to the Run window that appears when you click Run,but there's an additional tab called Profile.
3. Click Profile to launch the application under the profiler. If the perspectivedoes not automatically change, click Window > Open Perspective >Other..., then select Profiling and Logging.
4. When the Profiling and Logging perspective appears, expand thecontents of the Profiling Monitor view, then select the line that begins with<monitoring>. When you choose that line, a console view appears.
5. Type 0, 1, 2, and 9. Your screen should look something like Figure 3.Figure 3. The Profiling and Logging perspective with the running
developerWorks® ibm.com/developerWorks
Test, profile, and monitor applicationsPage 14 of 33 © Copyright IBM Corporation 1994, 2008. All rights reserved.

application
6. Click the Memory Statistics view, then expand the line associated with theexample package. The view should look something like Figure 4. Thereare four instances of each object: three for the "built" toys and one for theunreferenced toy.Figure 4. Memory consumption after building three toy objects andone unreferenced toy object
The columns in the Memory Statistics view track instance and memory use statistics:
• Total Instances reflects the total number of instances of a class.
ibm.com/developerWorks developerWorks®
Test, profile, and monitor applications© Copyright IBM Corporation 1994, 2008. All rights reserved. Page 15 of 33

• Live Instances shows how many instances are still referenced and werenot collected by the garbage collector.
• Collected counts how many class instances the garbage collectorreaped.
• Total Size (bytes) and Active Size (bytes) show the total cumulativememory that all instances used (a kind of high-water mark) and theamount of memory in active use by the live instances, respectively.
Finish the trial run
To finish this trial run, switch back to the console view, then press the 0, 1, and 2number keys again. Click the trash can icon in the Monitoring view to force garbagecollection. A good garbage collector will reap all the unreferenced objects. You canrefresh all the views in the current perspective at any time by clicking Refresh,shown in Figure 5.
Figure 5. The Refresh button
Section 5. Finding the data you want
The Profiling and Logging perspective offers a large collection of views that reveal agreat deal about the state of your application. To see the list, click Window > ShowView > Other..., then expand the list under Profiling and Logging. The list shouldlook like Figure 6.
Figure 6. The list of Profiling and Logging views
developerWorks® ibm.com/developerWorks
Test, profile, and monitor applicationsPage 16 of 33 © Copyright IBM Corporation 1994, 2008. All rights reserved.

Collect data to populate views
Depending on your goals and the problem at hand, you can collect data to populateone or all of those views. In the previous section, the only data collected wasmemory statistics to populate the Memory Statistics view. If you recall, theMonitoring view looked like Figure 7.
Figure 7. Basic statistics in the Monitoring view
The bottom-most expanded list indicates that the current profile configurationincludes statistics only for memory use. Let's create a new profile configuration thatcollects as much information as possible, so you can explore all the metrics andvisualizations that the profiling and performance tools provide:
1. Click the little arrow in the TPTP Profile button, then select Profile....
ibm.com/developerWorks developerWorks®
Test, profile, and monitor applications© Copyright IBM Corporation 1994, 2008. All rights reserved. Page 17 of 33

2. In the Profile window, select SpaceShipToy, then click New at the bottomleft of the window.
3. At the top of the right-most pane, type Lots of Data in the Name field,then click Apply.
4. Click the Profiling tab, then click Add....
5. In the next window, type All for the Profile set name and All of thedata that's available in the Description field. Click Next.
6. The next pane allows you to choose the data you want to collect. Expandall the choices, then select all the check boxes shown in Figure 8.Figure 8. Metrics to select
7. Click Execution Time Analysis.
8. Select the Collect method CPU time information check box, then selectthe Show execution flow graphical details option. Click Next again.The next window, shown in Figure 9, allows you to filter out classes thatdon't interest you.Figure 9. Excluding irrelevant classes from profiling
developerWorks® ibm.com/developerWorks
Test, profile, and monitor applicationsPage 18 of 33 © Copyright IBM Corporation 1994, 2008. All rights reserved.

9. For the purposes of this example, click Add... at the top of the pane toadd a new filter set. Name the filter set No Monkey Business and clickOK.
10. Click Add... to the right of the list of rules to add a new rule to the filterset. Type example.SpaceShipToy in the Class name field and main("asterisk") in the Method name field, select EXCLUDE for the Rule (asshown in Figure 10), then click OK.Figure 10. Edit a filter rule
ibm.com/developerWorks developerWorks®
Test, profile, and monitor applications© Copyright IBM Corporation 1994, 2008. All rights reserved. Page 19 of 33

11. In the larger window, click Apply.
12. You've defined which application to profile and what metrics to collect.Now click Profile.
13. In the Profiling and Logging perspective, open the Memory Statistics view.You should see that execution metrics for the methodexample.SpaceShipToy.main() are missing, per the rule that youcreated.
Section 6. Tips and tricks
The TPTP tools are full of features to help you peer into your application. Andbecause TPTP is well integrated with the rest of Eclipse, you'll find manyconveniences that tie all of Eclipse's features together.
To get you started, here's a handful of tips and tricks you might find useful.
Quick data filters
Start a profiling session and open the Execution Statistics view. The view shows allthe classes and methods in the application (at least those that you did not filter out inthe profile set). Right-click in the view to open a shortcut menu that looks like Figure11.
Figure 11. Shortcut menu
developerWorks® ibm.com/developerWorks
Test, profile, and monitor applicationsPage 20 of 33 © Copyright IBM Corporation 1994, 2008. All rights reserved.
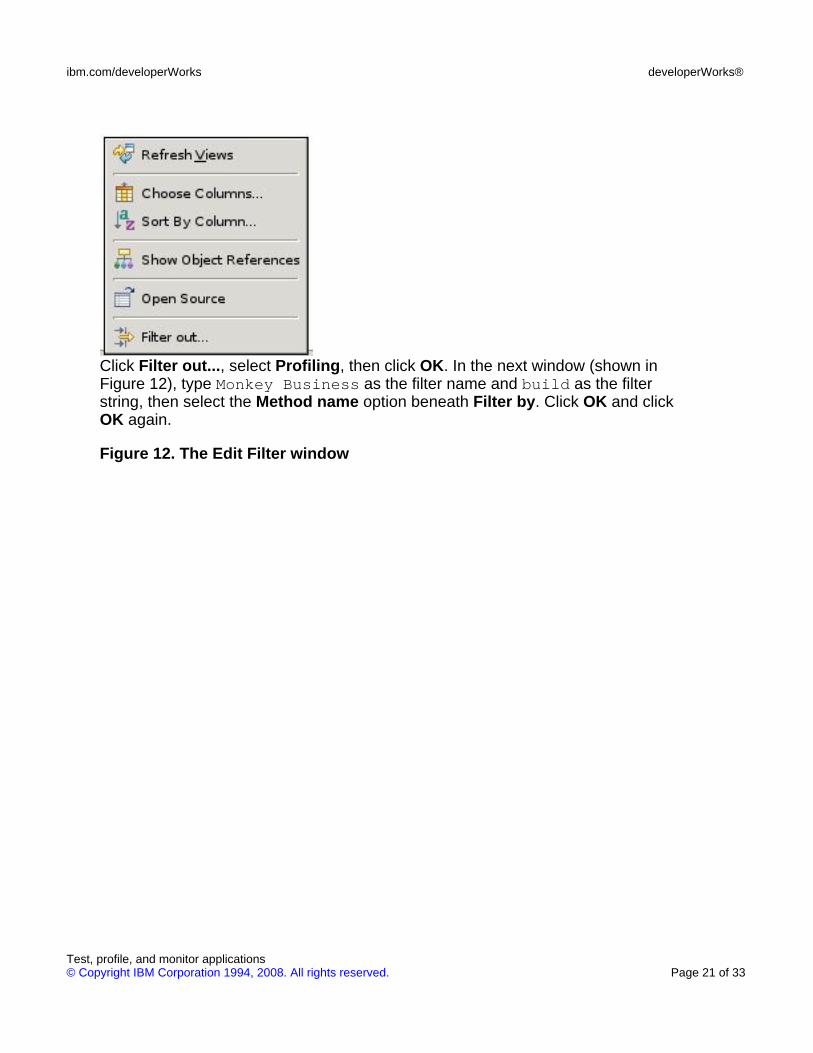
Click Filter out..., select Profiling, then click OK. In the next window (shown inFigure 12), type Monkey Business as the filter name and build as the filterstring, then select the Method name option beneath Filter by. Click OK and clickOK again.
Figure 12. The Edit Filter window
ibm.com/developerWorks developerWorks®
Test, profile, and monitor applications© Copyright IBM Corporation 1994, 2008. All rights reserved. Page 21 of 33
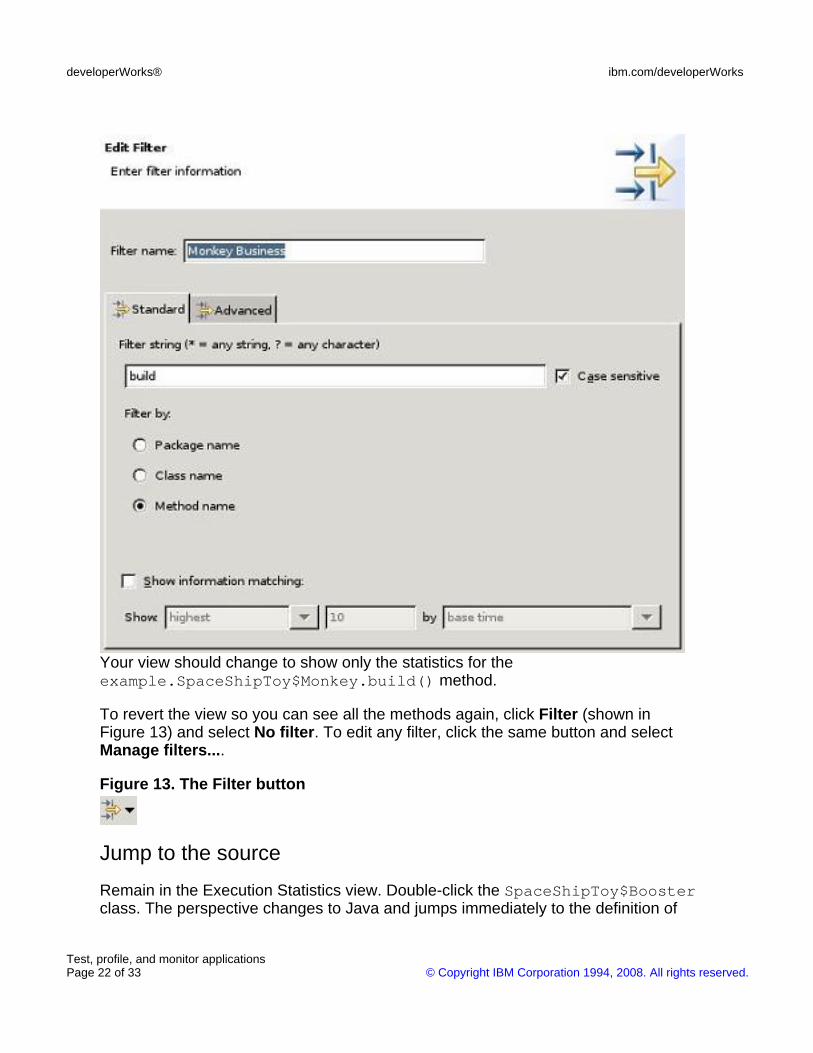
Your view should change to show only the statistics for theexample.SpaceShipToy$Monkey.build() method.
To revert the view so you can see all the methods again, click Filter (shown inFigure 13) and select No filter. To edit any filter, click the same button and selectManage filters....
Figure 13. The Filter button
Jump to the source
Remain in the Execution Statistics view. Double-click the SpaceShipToy$Boosterclass. The perspective changes to Java and jumps immediately to the definition of
developerWorks® ibm.com/developerWorks
Test, profile, and monitor applicationsPage 22 of 33 © Copyright IBM Corporation 1994, 2008. All rights reserved.
the inner class Booster. This connection between the memory analysis view andthe Eclipse code editor is invaluable.
Advanced, arbitrarily complex filters
You can build arbitrarily complex filters using the Advanced tab of the Edit Filterwindow. An advanced filter is a series of rules in which each rule lists a property, acondition (such as "equal," "not equal," and "like"), and a value. Care to know howmuch memory a single instance is consuming? You an express that in an advancedfilter.
Organizing and sorting
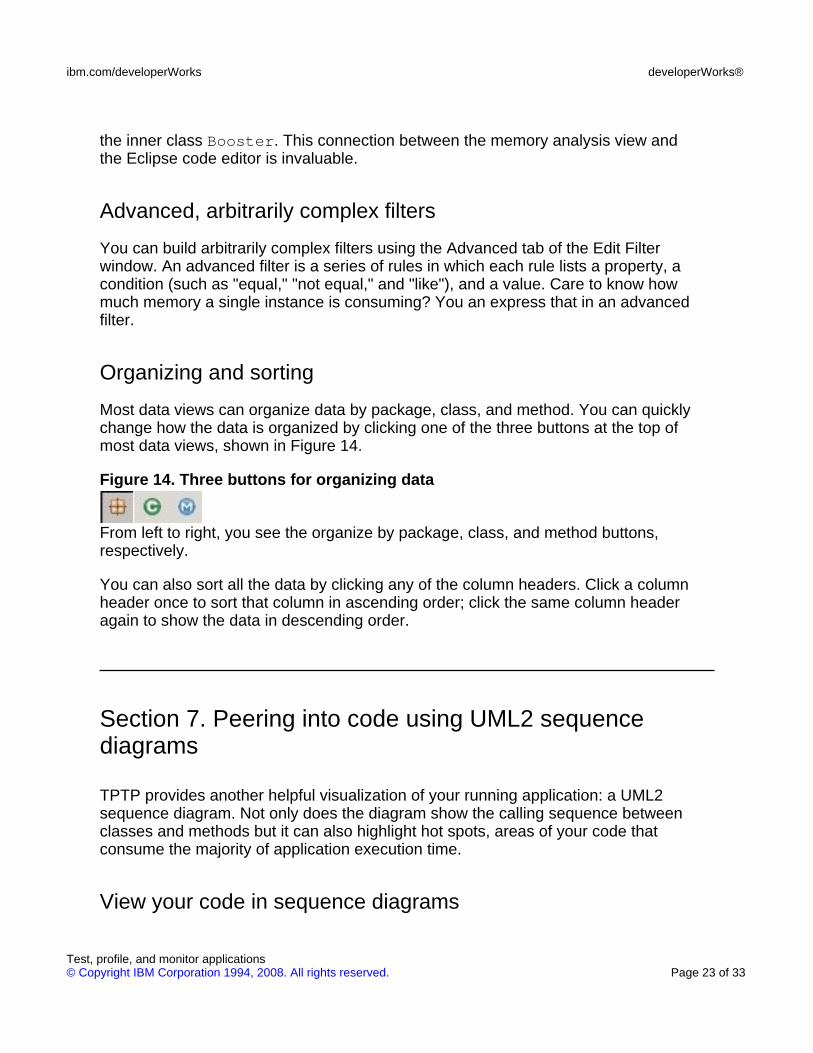
Most data views can organize data by package, class, and method. You can quicklychange how the data is organized by clicking one of the three buttons at the top ofmost data views, shown in Figure 14.
Figure 14. Three buttons for organizing data
From left to right, you see the organize by package, class, and method buttons,respectively.
You can also sort all the data by clicking any of the column headers. Click a columnheader once to sort that column in ascending order; click the same column headeragain to show the data in descending order.
Section 7. Peering into code using UML2 sequencediagrams
TPTP provides another helpful visualization of your running application: a UML2sequence diagram. Not only does the diagram show the calling sequence betweenclasses and methods but it can also highlight hot spots, areas of your code thatconsume the majority of application execution time.
View your code in sequence diagrams
ibm.com/developerWorks developerWorks®
Test, profile, and monitor applications© Copyright IBM Corporation 1994, 2008. All rights reserved. Page 23 of 33
To view your code using the UML2 sequence diagrams:
1. Quit all instances of the toy factory application you may be profiling.
2. Click the small arrow in the TPTP Profiling button. Select Profile..., selectSpaceShipToy, click the Profiling tab, then select All.
3. Click Apply (if necessary), then click Profile.
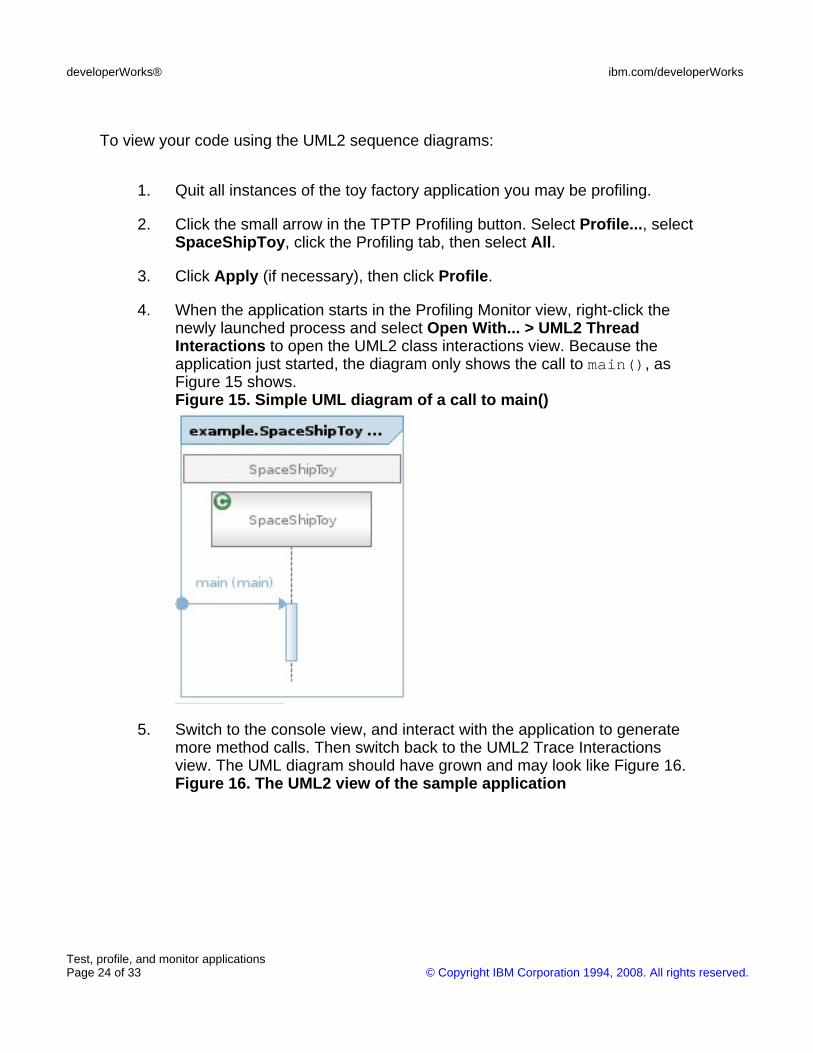
4. When the application starts in the Profiling Monitor view, right-click thenewly launched process and select Open With... > UML2 ThreadInteractions to open the UML2 class interactions view. Because theapplication just started, the diagram only shows the call to main(), asFigure 15 shows.Figure 15. Simple UML diagram of a call to main()
5. Switch to the console view, and interact with the application to generatemore method calls. Then switch back to the UML2 Trace Interactionsview. The UML diagram should have grown and may look like Figure 16.Figure 16. The UML2 view of the sample application
developerWorks® ibm.com/developerWorks
Test, profile, and monitor applicationsPage 24 of 33 © Copyright IBM Corporation 1994, 2008. All rights reserved.
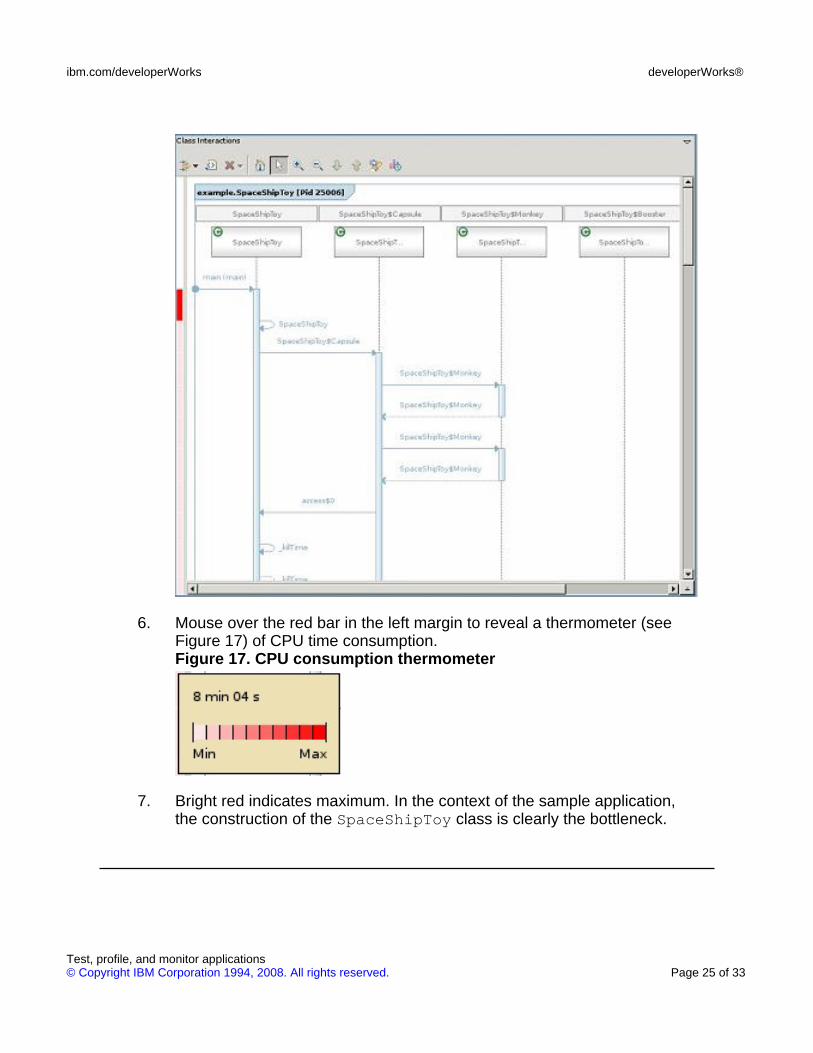
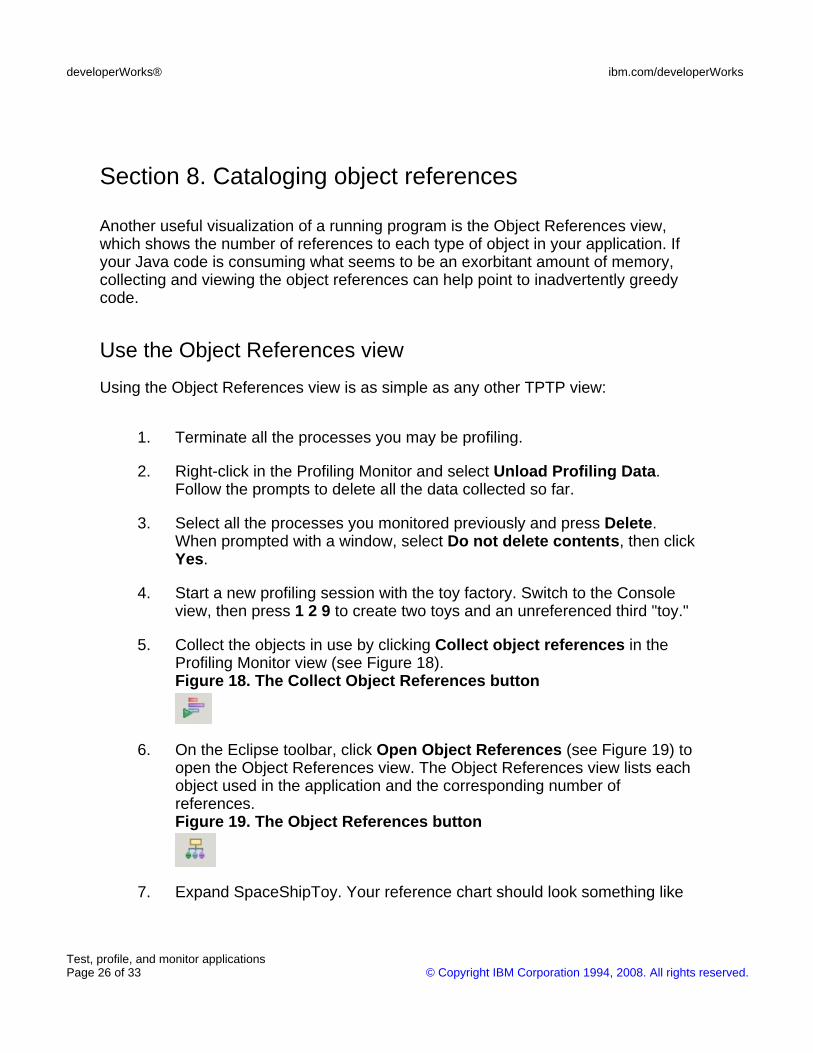
6. Mouse over the red bar in the left margin to reveal a thermometer (seeFigure 17) of CPU time consumption.Figure 17. CPU consumption thermometer
7. Bright red indicates maximum. In the context of the sample application,the construction of the SpaceShipToy class is clearly the bottleneck.
ibm.com/developerWorks developerWorks®
Test, profile, and monitor applications© Copyright IBM Corporation 1994, 2008. All rights reserved. Page 25 of 33
Section 8. Cataloging object references
Another useful visualization of a running program is the Object References view,which shows the number of references to each type of object in your application. Ifyour Java code is consuming what seems to be an exorbitant amount of memory,collecting and viewing the object references can help point to inadvertently greedycode.
Use the Object References view
Using the Object References view is as simple as any other TPTP view:
1. Terminate all the processes you may be profiling.
2. Right-click in the Profiling Monitor and select Unload Profiling Data.Follow the prompts to delete all the data collected so far.
3. Select all the processes you monitored previously and press Delete.When prompted with a window, select Do not delete contents, then clickYes.
4. Start a new profiling session with the toy factory. Switch to the Consoleview, then press 1 2 9 to create two toys and an unreferenced third "toy."
5. Collect the objects in use by clicking Collect object references in theProfiling Monitor view (see Figure 18).Figure 18. The Collect Object References button
6. On the Eclipse toolbar, click Open Object References (see Figure 19) toopen the Object References view. The Object References view lists eachobject used in the application and the corresponding number ofreferences.Figure 19. The Object References button
7. Expand SpaceShipToy. Your reference chart should look something like
developerWorks® ibm.com/developerWorks
Test, profile, and monitor applicationsPage 26 of 33 © Copyright IBM Corporation 1994, 2008. All rights reserved.
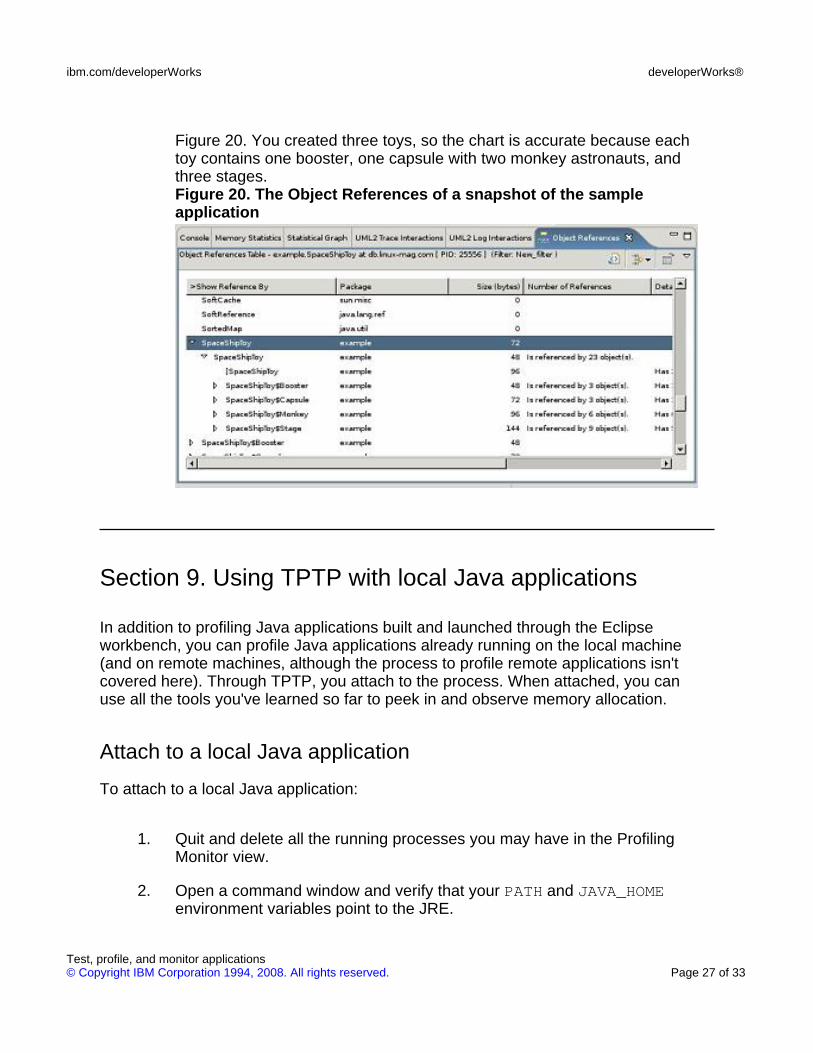
Figure 20. You created three toys, so the chart is accurate because eachtoy contains one booster, one capsule with two monkey astronauts, andthree stages.Figure 20. The Object References of a snapshot of the sampleapplication
Section 9. Using TPTP with local Java applications
In addition to profiling Java applications built and launched through the Eclipseworkbench, you can profile Java applications already running on the local machine(and on remote machines, although the process to profile remote applications isn'tcovered here). Through TPTP, you attach to the process. When attached, you canuse all the tools you've learned so far to peek in and observe memory allocation.
Attach to a local Java application
To attach to a local Java application:
1. Quit and delete all the running processes you may have in the ProfilingMonitor view.
2. Open a command window and verify that your PATH and JAVA_HOMEenvironment variables point to the JRE.
ibm.com/developerWorks developerWorks®
Test, profile, and monitor applications© Copyright IBM Corporation 1994, 2008. All rights reserved. Page 27 of 33
3. Make sure that your LD_LIBRARY_PATH includes the TPTP libraries. Onthe test system, those variables looked like this (your path names anddirectory names may differ, depending on your system configuration):
% printenv.PATH=/bin:/usr/bin:/usr/X11R6/bin:/home/\mstreicher/java/jdk/binJAVA_HOME=/home/mstreicher/java/jdkJAVA_DIR=/home/mstreicher/javaLD_LIBRARY_PATH=/home/mstreicher/java/tptpd/lib:
4. Make sure that your TPTP Agent Controller is running. Change to thedirectory that contains the Agent Controller, then stop and start thedaemon:
% cd $JAVA_DIR/tptpd/bin% ./RAStop.shRAServer stopped, pid = 3163RAServer stopped, pid = 3164.RAServer stopped, pid = 18108% ./RAStart.shStarting Agent ControllerRAServer started successfully
5. Run the toy factory application as a separate, stand-alone Javaapplication:
• Change to the workspace directory that contains the sampleapplication, perhaps $HOME/workspace/Toy Maker. Within thatdirectory, you should see a directory named example, which containsthe code for SpaceShipToy.java and the associated .class files.
• Add the current working directory, . ("dot"), to your CLASSPATH:
% cd $HOME/workspace/Toy Maker% ls -Fexample% export CLASSPATH=.:$CLASSPATH
6. Launch the application through the TPTP Agent Controller with the-XrunpiAgent:server=enabled option. The enabled mode startsthat Java application as normal and runs the controller in the background.(If you prefer to not execute the application until you attach to it, use thecontrolled mode.)
developerWorks® ibm.com/developerWorks
Test, profile, and monitor applicationsPage 28 of 33 © Copyright IBM Corporation 1994, 2008. All rights reserved.

% java -XrunpiAgent:server=enabled example/SpaceShipToy
7. Return to Eclipse, then click the small arrow in the TPTP Profile button.Select Profile.... In the list on the left, double-click Attach - JavaProcess.
8. In the next window, type Toys in the Name field, then select localhost asthe host. Click Apply.
9. Select an agent by clicking the Agents tab, which Figure 21 shows.Figure 21. Choosing an agent to attach to
Click the agent displayed (there should be just one, at least for now, if noother application or process is actively being profiled), then click >. Tosave this change, click Apply again.
10. Select what data you would like to collect by clicking the Profiling tab and
ibm.com/developerWorks developerWorks®
Test, profile, and monitor applications© Copyright IBM Corporation 1994, 2008. All rights reserved. Page 29 of 33
selecting a profiling set. You can choose All, the set you created earlier.
11. Click Apply, then Profile. Eclipse should switch to the Profiling andLogging perspective.
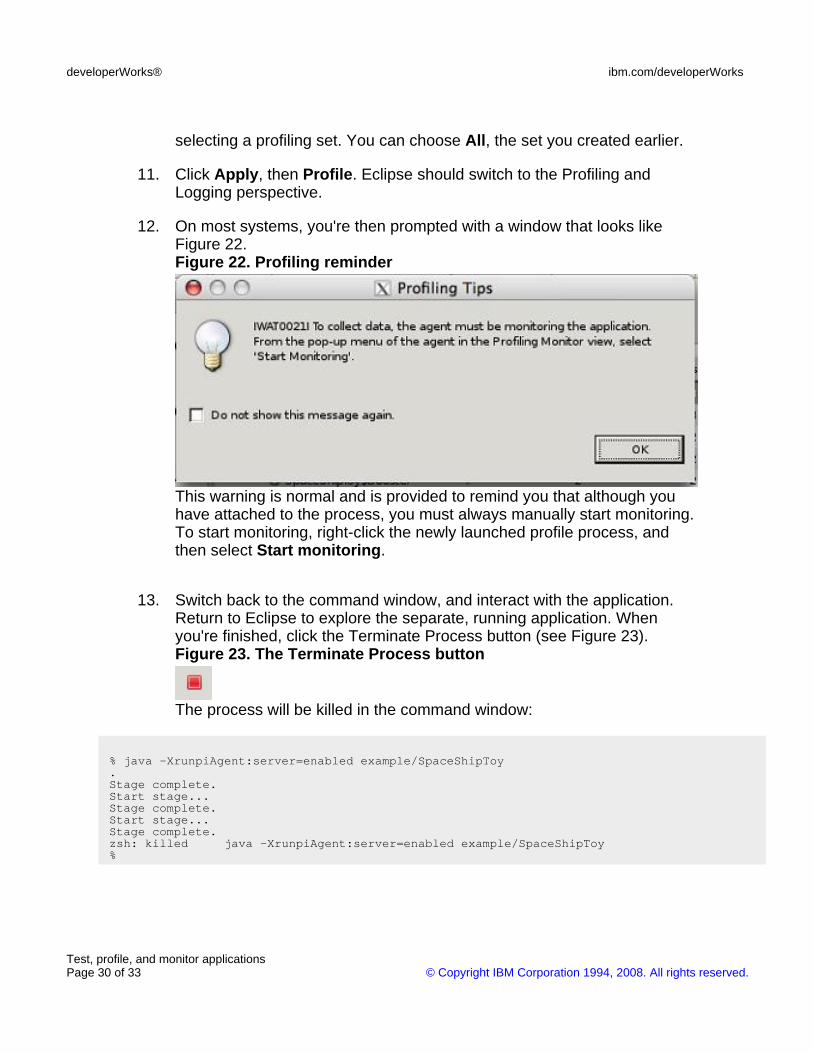
12. On most systems, you're then prompted with a window that looks likeFigure 22.Figure 22. Profiling reminder
This warning is normal and is provided to remind you that although youhave attached to the process, you must always manually start monitoring.To start monitoring, right-click the newly launched profile process, andthen select Start monitoring.
13. Switch back to the command window, and interact with the application.Return to Eclipse to explore the separate, running application. Whenyou're finished, click the Terminate Process button (see Figure 23).Figure 23. The Terminate Process button
The process will be killed in the command window:
% java -XrunpiAgent:server=enabled example/SpaceShipToy.Stage complete.Start stage...Stage complete.Start stage...Stage complete.zsh: killed java -XrunpiAgent:server=enabled example/SpaceShipToy%
developerWorks® ibm.com/developerWorks
Test, profile, and monitor applicationsPage 30 of 33 © Copyright IBM Corporation 1994, 2008. All rights reserved.
Section 10. Conclusion
This tutorial has demonstrated how you can refine and improve your Javaapplication by profiling its code. Using the Eclipse TPTP, you can run your code anddetect those segments that waste memory and ruin or slow performance. TPTP alsooffers other tools to comb through large log files and to automate and analyze testresults.
Additional tools in the TPTP pipeline include a record-and-playback facility to test theGUIs of applications running under Eclipse and a special profiler called XRay,specially designed to profile applications derived from the Eclipse platform.
ibm.com/developerWorks developerWorks®
Test, profile, and monitor applications© Copyright IBM Corporation 1994, 2008. All rights reserved. Page 31 of 33
Resources
Learn
• Read Part 2 and Part 3 of this series for more information about the Eclipse Test& Performance Tools Platform.
• Learn more about the Eclipse Foundation and its many projects.
• Discover all the features of the Eclipse Test & Performance Tools Platform.
• Browse the extensive documentation, tutorials, presentations, and screen caststhat further illuminate the Eclipse TPTP.
• Expand your Eclipse skills by visiting IBM developerWorks Eclipse projectresources.
• Visit the developerWorks Open source zone for extensive how-to information,tools, and project updates to help you develop with open source technologies anduse them with IBM's products.
Get products and technologies
• Visit Sun Microsystems to download the J2SE V1.4 SDK and the JRE.
• Download Eclipse, the open source, freely available, and extensible IDE.
• Download the Eclipse Test & Performance Tools Platform.
• The Eclipse TPTP depends on the EMF SDK V2.1 and the XSD SDK V2.1.
• If you want to visualize the behavior of your application as a UML2 diagram,download the UML2 plug-ins. If you're using Eclipse Version V3.1.1, downloadVersion 1.1.1 of UML2 and unpack its archive file in the directory that containsEclipse.
• Download the TPTP Agent Controller, a vital component if you want to profileyour applications.
• Innovate your next open source development project with IBM trial software,available for download or on DVD.
Discuss
• Connect with Eclipse developers and other users in the Eclipse mailing lists andnewsgroups. (You must register to read the newsgroups, but membership is free,and the registration process is easy.)
• Get involved in the developerWorks community by participating indeveloperWorks blogs.
developerWorks® ibm.com/developerWorks
Test, profile, and monitor applicationsPage 32 of 33 © Copyright IBM Corporation 1994, 2008. All rights reserved.

About the author
Martin StreicherMartin Streicher is the Editor-in-Chief of Linux Magazine. He earned a master's degreein computer science from Purdue University and has been programming UNIX-likesystems since 1982 in the Pascal, C, Perl, Java, and (most recently) Rubyprogramming languages.
ibm.com/developerWorks developerWorks®
Test, profile, and monitor applications© Copyright IBM Corporation 1994, 2008. All rights reserved. Page 33 of 33