eco-certified natural rubber from sustainable rubber agroforestry
TRANSCRIPT

1 | P a g e
Eco-certified Natural Rubber
from Sustainable Rubber Agroforestry
in Sumatra, Indonesia
Final Report prepared by Beria Leimona and Laxman Joshi
Contributor:
Andree Ekadinata, Asep Ayat, Atiek Widayati, Deyrizal Alira, Gede Wibawa, Irma Nurhayati,
M. Thoha Zulkarnain, Ratna Akiefnawati, Rosa van den Beent, Suseno Budidarsono, Suyitno
Project Final Report
June 2010

2 | P a g e
CONTENTS
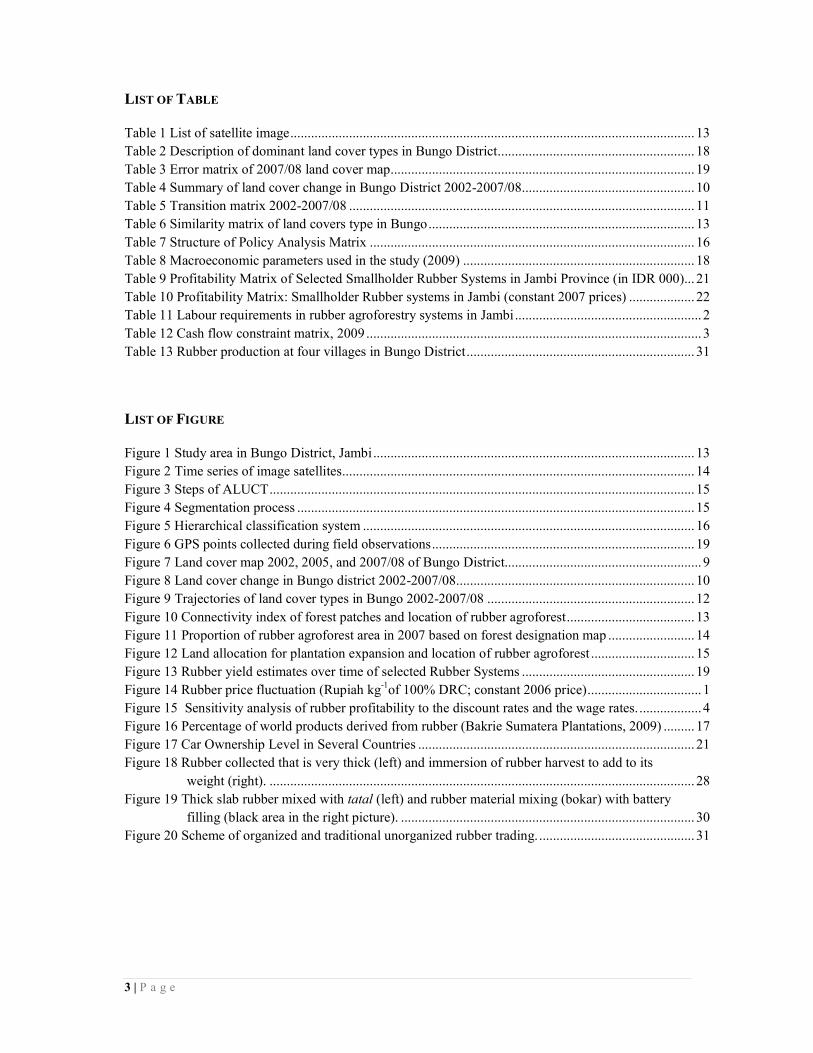
LIST OF TABLE .............................................................................................................................................. 3
LIST OF FIGURE ............................................................................................................................................. 3
BACKGROUND ............................................................................................................................................... 4
METHODS OF THE STUDY .............................................................................................................................. 5
RESULTS AND DISCUSSION ........................................................................................................................... 6
Trade-off analysis of different land use system .................................................................................. 6
Spatial dynamics and trajectories of rubber agroforestry ................................................................... 7
Potential of eco-certification of rubber agroforestry ........................................................................... 8
Support from industry and government, local consultation and awareness building .......................... 9
CONCLUSION ............................................................................................................................................... 10
RECOMMENDATION AND FUTURE RESEARCH QUESTION ........................................................................... 11
APPENDIX 1 A PROFITABILITY ASSESSMENT OF SMALLHOLDER RUBBER AGROFORESTRY SYSTEMS IN
JAMBI, SUMATRA, INDONESIA .......................................................................................................... 14
APPENDIX 2 AGROFORESTRY AREA UNDER THREATS: DYNAMICS AND TRAJECTORIES OF RUBBER
AGROFOREST IN BUNGO DISTRICT, JAMBI ....................................................................................... 12
APPENDIX 3 MULTI-STAKEHOLDER PERCEPTION AND PREMIUM PRICE ON RUBBER ECO-CERTIFICATION IN BUNGO DISTRICT, JAMBI .................................................................................... 16
APPENDIX 4 ENHANCING RUBBER PRODUCTION IN COMMUNITIES AROUND A VILLAGE FOREST IN
BUNGO DISTRICT, JAMBI PROVINCE ................................................................................................. 25
APPENDIX 5 AN ARTICLE ON MOU SIGNING BETWEEN ICRAF AND BRIDGESTONE JAPAN ....................... 32
REFERENCES ............................................................................................................................................... 33
3 | P a g e
LIST OF TABLE
Table 1 List of satellite image ..................................................................................................................... 13
Table 2 Description of dominant land cover types in Bungo District ......................................................... 18
Table 3 Error matrix of 2007/08 land cover map ........................................................................................ 19
Table 4 Summary of land cover change in Bungo District 2002-2007/08 .................................................. 10
Table 5 Transition matrix 2002-2007/08 .................................................................................................... 11
Table 6 Similarity matrix of land covers type in Bungo ............................................................................. 13
Table 7 Structure of Policy Analysis Matrix .............................................................................................. 16
Table 8 Macroeconomic parameters used in the study (2009) ................................................................... 18
Table 9 Profitability Matrix of Selected Smallholder Rubber Systems in Jambi Province (in IDR 000) ... 21
Table 10 Profitability Matrix: Smallholder Rubber systems in Jambi (constant 2007 prices) ................... 22
Table 11 Labour requirements in rubber agroforestry systems in Jambi ...................................................... 2
Table 12 Cash flow constraint matrix, 2009 ................................................................................................. 3
Table 13 Rubber production at four villages in Bungo District .................................................................. 31
LIST OF FIGURE
Figure 1 Study area in Bungo District, Jambi ............................................................................................. 13
Figure 2 Time series of image satellites ...................................................................................................... 14
Figure 3 Steps of ALUCT ........................................................................................................................... 15
Figure 4 Segmentation process ................................................................................................................... 15
Figure 5 Hierarchical classification system ................................................................................................ 16
Figure 6 GPS points collected during field observations ............................................................................ 19
Figure 7 Land cover map 2002, 2005, and 2007/08 of Bungo District......................................................... 9
Figure 8 Land cover change in Bungo district 2002-2007/08 ..................................................................... 10
Figure 9 Trajectories of land cover types in Bungo 2002-2007/08 ............................................................ 12
Figure 10 Connectivity index of forest patches and location of rubber agroforest ..................................... 13
Figure 11 Proportion of rubber agroforest area in 2007 based on forest designation map ......................... 14
Figure 12 Land allocation for plantation expansion and location of rubber agroforest .............................. 15
Figure 13 Rubber yield estimates over time of selected Rubber Systems .................................................. 19
Figure 14 Rubber price fluctuation (Rupiah kg-1of 100% DRC; constant 2006 price) ................................. 1
Figure 15 Sensitivity analysis of rubber profitability to the discount rates and the wage rates. .................. 4
Figure 16 Percentage of world products derived from rubber (Bakrie Sumatera Plantations, 2009) ......... 17
Figure 17 Car Ownership Level in Several Countries ................................................................................ 21
Figure 18 Rubber collected that is very thick (left) and immersion of rubber harvest to add to its
weight (right). ........................................................................................................................... 28
Figure 19 Thick slab rubber mixed with tatal (left) and rubber material mixing (bokar) with battery
filling (black area in the right picture). ..................................................................................... 30
Figure 20 Scheme of organized and traditional unorganized rubber trading. ............................................. 31
4 | P a g e
BACKGROUND
This project applies an action research method to analyze and test eco-certification of jungle rubber as
a mechanism for conserving biodiversity and enhancing the livelihood of rubber-growers in Jambi,
Sumatra, Indonesia. Jungle rubber is a traditional agroforestry system practiced by farmers in rural
areas of Jambi. This system has been practiced since 1904 and the rubber plantation commences with
slash and burning land after which rain-fed paddy and perennials are planted. Farmers then allow
natural vegetation to grow amongst the rubber trees. They selectively nurture some economically
valuable plants to create a mix of food, medicine, timber and fibre-producing trees. This system is
also commonly called “rubber agroforestry”.
The jungle rubber system develops a complex, multi-strata canopy that resembles natural secondary
forest and shares about 60-80% of plant species found in neighbouring primary forests (Gouyon et al.,
1993; Penot, 1995; Beukema and van Noordwijk, 2004; Michon, 2005). It forms a buffer zone for
natural parks and functions as an animal corridor for these parks. Besides biodiversity conservation,
the woody biomass in a typical jungle rubber system also represents a substantial carbon stock (about
20 Mg C ha-1) that is larger than that achieved by the average rubber rotational systems over time
(Tomich et al., 2004). The rubber agroforestry in Bungo, Jambi are located in the Batanghari
watershed and have important hydrological functions for the locals living both upstream and
downstream in the watershed.
Rubber agroforestry or jungle rubber supports the livelihood of rural smallholders and also has socio-
cultural values. Despite their low productivity, about 80% of smallholder rubber farmers with plots
less than 5 ha in size produce nearly 67% of the national production. Rubber is one of the major
products in Jambi province. Smallholder farmers gain some benefits from selling rubber slabs and
providing labour to collect the sap, carry out post-harvest tasks and sell rubber products. Culturally,
this agroforest system has been maintained by successive generations and local communities have
traditional beliefs about maintaining their rubber agroforestry. For example, they are forbidden to
climb durian trees to harvest fruit, but rather have to wait until the fruit falls down to the ground.
Earlier feasibility studies to identify a potential payment mechanism in regard to the conservation
issue associated with the rubber agroforestry system in Bungo indicated both potential and difficulties
with timber and latex eco-certification (Gouyon, 2003). Eco-certifiers guarantee to consumers that
producers have followed a set of standards that offer ecosystem protection. Identification by a
community of its conservation practices and its commitment to them form an important first step
toward certification. Based on a comprehensive investigation of the issue, Bennett (2008)
recommended eco-certification to allow jungle rubber farmers to generate revenue streams by
marketing the environmental benefits of their practices.
Recently ICRAF, in partnership with local NGOs WARSI and Gita Buana, implemented an action-
research project in Bungo district in Jambi to investigate a reward mechanism for conservation of
traditional rubber agroforestry. Agreements to conserve 2,000 ha of jungle rubber were made with
four villages. Intermediate rewards were provided in the form of support to establish micro-hydro
power generators, local tree nurseries and model village forests. The conservation agreements also set
the stage for potentially pursuing eco-certification as a longer-term feasible approach that can reward
jungle rubber farmers for the biodiversity services they provide.
A partnership between ICRAF and the W-BRIDGE (Waseda-Bridgestone) Initiative (Bridging
Human Activities and Development of the Global Environment, Research and Action Support
5 | P a g e
Program) is an ideal and timely opportunity for supporting action-research on testing the eco-
certification approach, as well as to advance understanding of the role of natural rubber production
and environmental issues. As the trends to integrate environmental thinking into business strategies
emerge, we foresee the potential use of this eco-certified “dark green” rubber (from jungle rubber) in
the “green products” among the rubber-based industry.
The project is a proactive effort to protect the threatened biodiversity in jungle rubber systems by
providing an economic incentive (a premium price for rubber) through eco-certification. This will
help introduce the natural rubber industry to producers of environmentally friendly rubber in the
developing world and to the environment-conscious consumers in the more developed world.
The following outcomes are envisaged:
Outcome 1: Stakeholder recognition of the trade-off between private profitability of land use
systems and the conservation value of traditional rubber agroforestry in Jambi, Sumatra
– complex rubber agroforestry corridors connecting protected forest areas.
Outcome 2: Appropriate eco-certification approach, as an innovative incentive, for maintaining the
environmental qualities of natural rubber production.
Outcome 3: Enhanced conservation support from the natural rubber industry and local governments.
METHODS OF THE STUDY
Study under this project encompassed quantitative and qualitative analysis to achieve different
outcomes.
Outcome 1: Trade-off analysis of different land use systems.
Firstly, to assess the profitability of rubber agroforestry and other land use systems within the Bungo
district, we conducted a series of household interviews and collected secondary socioeconomic data at
the provincial and district level (Appendix 1). We focused on three socioeconomic variables in
smallholder rubber farming: (1) farming system profitability; (2) labour requirements; and (3)
establishment cost of the farming systems. We compared the profitability of three smallholder rubber
system: (1) complex rubber agroforestry with a rotational/cyclical system; (2) complex rubber with a
sisipan system; (3) monoculture rubber with improved rubber clone. Farmers practicing the complex
rubber agroforestry with a rotational system usually clear their 35-44 year old rubber gardens to start
new rubber plantation. Under the sisipan system, farmers actively interplant rubber seedlings or
maintain rubber saplings within productive rubber plot to ensure the productivity of their complex
rubber agroforestry. We assumed that farmers begin to interplant their gardens at year 20 and these
rubber plots would continuously be productive up to year 68. The monoculture rubber with improved
rubber clone represented a high-input and high-output system. It required intensive plantation
management to ensure optimal latex production. Available data indicated that this system remained
productive up to year 30.
The policy analysis matrix (PAM) technique that estimates profitability indicators and analyses labour
requirements and the farm budget was applied to provide insights into patterns of incentives in
conserving rubber agroforestry at the microeconomic level (Table 1 Appendix 1). It also estimates
quantitatively the impacts of policies on such incentives by valuing agricultural production at private
and social prices.

6 | P a g e
Secondly, to analyse land use dynamics and their trajectories, including potential threats to rubber
agroforestry and opportunities for eco-certification areas, we conducted spatial analysis using a series
of land-use/cover maps interpreted from satellite images dated from 2000 to 2005 and 2007 to 2008
(Table 7 Appendix 2). The research team also performed direct on-site checks on dominant land cover
types and collected Global Positioning System (GPS) points. These data are useful as samples for the
image interpretation process and as references for accuracy assessment of the spatial analysis. An
interview with local government officers was organized to gain their perspectives on future land
allocation for different land uses in Bungo. For the biodiversity context, we analyzed the connectivity
index of the remaining forest patches using FRAGSTATS – a computer software program designed to
compute a wide variety of landscape metrics for categorical map patterns1.
Outcome 2: Potential of eco-certification of rubber agroforestry
The research team, including an MSc student from the University of Amsterdam, observed the
possibilities and constraints of eco-certification of rubber agroforestry in Bungo district, Jambi
(Appendix 3). This process captured the perceptions of different stakeholders that were relevant to the
development of a rubber eco-certification scheme. The stakeholders were suppliers, (smallholder
rubber farmers), buyers (companies using natural rubber in their production), intermediaries (local
NGOs) and regulators (district and provincial government). A series of interviews and focus group
discussions were organized with these various groups.
Outcome 3: Support from industry and government
In partnership with Komunitas Konservasi Indonesia-WARSI (KKI-WARSI) and cofounded by the
Landscape Mosaic Project of the Swiss Agency for Development and Cooperation, the WARSI and
ICRAF team facilitated regular meetings among stakeholders in the Bungo district or the Forest
Governance Learning Group (FGLG). The team visited the Bridgestone Company in North Sumatra
and exchanged to discuss any potential to increase natural rubber quality within the Bungo rubber
agroforestry system. As the follow up action, the Bridgestone staff visited Bungo and conducted a
training to improve quality of rubber produced from jungle rubber (Appendix 4 and 5).
RESULTS AND DISCUSSION
Trade-off analysis of different land use system
The profitability assessment of smallholder rubber systems indicated that all the systems (complex
rubber agroforestry with a rotational system, complex rubber agroforestry with a sisipan system and
monoculture rubber) were profitable at the current rubber price (IDR 13,000 or about USD 1.44 per
kg). Under well-managed conditions and without any credit to pay back, monoculture rubber was
more profitable compared to complex rubber agroforestry, with both private and social prices. Within
the complex system, the rotational system was more profitable with private prices, but lower with
social prices compared to the sisipan system (Table 3 and 4). However, to interpret this result, we
have to consider some important assumption and on-ground realities:
- Assumption: monoculture rubber is optimally managed, with selective planting material,
intensive pest control and recommended practices for rubber tapping and post-harvesting.
1 http://www.umass.edu/landeco/research/fragstats/fragstats.html

7 | P a g e
Fact: farmers lack access to good planting material and lack knowledge on good plant
management and rubber post-harvesting processes.
- Assumption: under the complex rubber systems (rotational or sisipan), farmers maximise
their latex production and require labour inputs for the establishment and operation of their
plantations.
Fact: farmers rely on a number of alternative jobs – on farm and off farm – to maintain their
household income. In addition, the variety of trees within the complex rubber agroforestry
enables farmers to have an additional source of income from their rubber plantation, such as
from selling fruit from their agroforestry gardens. The complex systems usually utilize family
labour, which tends to not be included in any economic assessment. In this case, the cost of
labour is actually returned to the household. However, these labour inputs presumably
represent the opportunity cost of foregone earnings from other economically beneficial
activities.
The analysis of the labour requirement concluded that monoculture rubber required more labour for
all activities compared to the complex options (Table 5). From the farmers’ perspective, higher labour
requirements impose a more serious constraint when the average wage rate increases beyond the
returns from the labour. For policy makers, perhaps the monoculture systems could be attractive for
employment generation in rural areas. However, this requires careful checking with population data
and also to see whether the economically active population in agriculture can actually meet the labour
requirements of a monoculture system. Current population density data shows that agricultural labour
availability in Jambi is bordering on scarce.
The cost of establishment of monoculture rubber is double compared to complex rubber systems
(Table 6). Therefore, cost rarely becomes a constraint for farmers to establish complex rubber
agroforestry compared to the cost of establishing a monoculture rubber system. The literature
mentioned that the cost of establishment of oil palm was lower compared to that for monoculture
rubber. However, currently, farmers still lack the necessary technological knowledge to invest in oil
palm plantations.
The sensitivity analysis of profitability to the discount rate and wage rate indicated that rubber
cultivation was not a capital-intensive investment and was perhaps affordable for smallholders (Figure
3). The analysis revealed also that maintaining lower capital investment (as in a complex rubber
system), will increase indirectly the profitability of the system. Although a monoculture rubber system
provides better returns for labour and the opportunity for employment in rural areas, the system is
more susceptible to any changes in wage rates compared to the complex systems. This implies that
complex rubber agroforestry has an important role in buffering stable production, as rubber prices
fluctuate over time.
Spatial dynamics and trajectories of rubber agroforestry
Based on field observations, there are four dominant types of land cover in Bungo: (1) forest; (2)
rubber agroforestry; (3) monoculture rubber; and (4) oil palm (Figure 8 and Table 8 – Appendix 2).
Rubber agroforestry is further classified into two classes: (1) complex rubber agroforestry; and (2)
simple rubber agroforestry. The overall accuracy of spatial analysis using the 2007/2008 land cover
map is 81.3% (Table 9). Most misclassifications occurred among the classes of complex rubber
agroforestry, simple rubber agroforestry and monoculture rubber, because of their similar canopy
cover structure.

8 | P a g e
The spatial analysis showed that the landscape of Bungo has been dominated by monoculture
plantations since 2002. Between 2005 and 2008, oil palm plantation establishment expanded rapidly
while rubber monoculture seemed to slow down. Oil palm was established as large-scale homogenous
patches in the landscape, since this plantation type is managed by large-scale companies. Complex
rubber agroforestry or jungle rubber formed a continuous corridor along the river in the central part of
Bungo district. Simple rubber agroforestry was located closer to settlements forming small
fragmented patches. New patches of simple rubber agroforestry appeared in 2005 and 2007/2008,
indicating that this system was being increasingly adopted. Forest cover also declined, especially in
the peneplain area and was replaced by tracts of shrubs and grass. This indicated the occurrence of
logging activity or an initial stage of conversion to tree-crop land use. Table 10 and Figure 10 show
the amount of each land cover at three points in time (2002, 2005 and 2007/2008).
The land cover transition matrix showed that most complex rubber agroforestry was converted to
monoculture rubber and oil palm during 2002-2008 (Table 11). In general, rubber agroforestry, under
both simple and complex systems, was converted to oil palm, cropland and monoculture rubber, while
forest areas degraded to shrubs, monoculture rubber and oil palm plantation (Figure 12).
With the assumption that forest and rubber agroforestry had an index of similarity of 0.8, based on the
number of species found in both land cover types (Dewi and Ekadinata 2010), our analysis of the
connectivity index identified priority locations for the eco-certification process (Figure 13). There
were at least three crucial locations where rubber agroforestry provided connectivity with the forest.
To understand further the potential location of rubber eco-certification sites, we overlaid the land
cover map 2007/2008 and the “Forest Designation Map” published by the Indonesian Ministry of
Forestry. We found that about 91% of the rubber agroforestry area in 2007 was located in the “land
for other use” category. The “land for other use” was owned mostly by local people or managed by
local government (Figure14). Thus, decision making for any eco-certification scheme will depend
mostly on local communities and/or local government. Our interviews with local government revealed
that they had entered into some agreements with private companies to convert areas under the “land
for other use” category to oil palm plantation. Most of the land under this category was complex
rubber agroforestry.
Potential of eco-certification of rubber agroforestry
Quality remains the most important aspect of natural rubber for most companies. Most companies also
indicated that there is already a demand from both the consumer and the producer for green certified
rubber, or that this demand can be created because of the growing consumer awareness of the loss of
biodiversity through monoculture farming. The valuation of biodiversity in monetary terms though, is
still rather low; most companies would pay a premium price of 1-5% for green certified rubber, with
the highest offer being from one company that indicated it would pay a 10-25% price increase.
Companies would expect green certified rubber to come from plantations that were either simple or
complex mixed rubber agroforestry systems. An interesting note is that the Indonesian division of a
large producer of pneumatic bicycle tyres seemed interested in the idea of green rubber and placed a
premium price on this of 5-10%.
From the supply side, the most important actors on the production side of the natural rubber value
chain in Jambi were the smallholder farmers, local government and the assisting agencies, such as
NGOs and ICRAF. The focus of this survey is on Bungo, Jambi and specifically Lubuk Beringin
village. The choice of Lubuk Beringin as the data source is based on the fact that the village has prior
knowledge on eco-certification and is participating in the eco-certification project. Lubuk Beringin

9 | P a g e
can act as an example for the rest of the region after the eco-certification of agroforestry rubber has
been proven successful.
The farmers in Lubuk Beringin have a very positive attitude towards eco-certification, as we have
already noticed from previous research. However, their expectations might be too high; when asked
what extra money they would need from eco-certification in order to sustain agroforestry, almost all
farmers indicated that they would need a 100% price increase for the rubber. This might be due to the
nature of the question itself, because perhaps it was not fully understood. With questions regarding the
valuation of positive outcomes of eco-certification, most farmers ranked the financial benefits in first
(and often also second) place. They were willing to work hard for these possible financial benefits and
to form a cooperative (Koperasi) with smallholders who could trust each other. However, the farmers
having participated in projects where certification was mentioned before, were wondering when the
“talk” of eco-certification will actually become “action”.
Interviews with local government officials provided further clarification on land use and concessions
in the Bungo district. Their message was very simple; if eco-certification in Lubuk Beringin works
(thus, if it is profitable to the farmers), then their attitude towards it will be very positive. As long as
there is proof that eco-certification can be financially beneficial to the area, it is worth investing in.
There might even be a possibility that local government helps fund the transaction costs needed for
eco-certification (however, this was only mentioned by one individual). It must be noted that big
companies operating in the region, and the relationship that local government has with these
companies, might be an obstacle, when farmers are not as willing to sell their land anymore.
However, this is a concern for later and might not even occur due to the division of Bungo into
production and forest areas.
Furthermore, the local government wants and needs to have more knowledge on the concept of eco-
certification and what it might mean for the region. Not many government officials have a clear
understanding of what it entails.
The experience of the local NGO, in this case WARSI, with the certification of organic products
explains a lot about the possibilities and challenges that eco-certification of rubber faces. Organic
certification, supposedly creating the highest premium prices for all kinds of certification, was good
for a 10-20% price increase. This was not all given directly to the farmers, but was used to develop
facilities in the village as well. Such a system might not increase the financial assets of the rubber
farmers very much, but would increase their livelihoods by improving their village surroundings/
facilities. Although WARSI believes generally that eco-certifying rubber is a very difficult task
because of the nature of rubber (it is not edible and so does not directly concern people’s health,
neither is it a very visible product on its own), getting certification for the production system might
not be as difficult. As WARSI staffs have assisted Lubuk Beringin for many years, their role as an
NGO will be prominent in the eco-certification process, perhaps as a potential facilitating NGO. As a
facilitating NGO they will then commit to provide training, and assist in management planning,
marketing and quality control.
Support from industry and government, local consultation and awareness building
ICRAF and WARSI continue to work and consult with local people at the project site in Bungo. Four
villages (Lubuk Beringin, Sangi, Letung and Mengkuang) have been further identified for testing the
eco-certification of jungle rubber. Awareness building at the local community and district government
levels is continuing. In the process of monitoring extant conservation agreements in the four villages

10 | P a g e
in Bungo District, WARSI and ICRAF field-based colleagues are in regular contact with the local
people to explore and pursue eco-certification for jungle rubber.
A team from ICRAF and WARSI visited the Bridgestone Company in North Sumatra in March 4-5,
2010. Some points of discussion were (1) productivity of rubber agroforestry and its potential to
increase its production; (2) updates of ICRAF-WARSI facilitation to encourage sustainable rubber
agroforestry, such as RUPES activities and Hutan Desa (village forest) initiatives; (3) rubber trade
between rubber agroforestry farmers and Bridgestone as part of their corporate social responsibility
program.
Staffs from Bridgestone North Sumatra visited Bungo district and conducted training on rubber
sapping and post-harvesting techniques in March 12-13, 2010. The total participants were about 30
rubber farmers and local traders. The Bridgestone staffs observed that the rubber sapping technique
currently practiced by the farmers caused about 30% lower rubber productivity compared to the
techniques applied by the Bridgestone. Farmers also utilized different type of chemical liquid to treat
their rubber slabs. Overall, the rubber quality at the village level was still low because of many
contaminants, such as leaves and stones. Farmers usually dipped their rubber slab into water to
increase its weight. This process was not recommended because it can destroy the rubber elasticity.
Our field observation also revealed that farmers usually had weak bargaining position compared to the
local traders (or called toke). A social connection between them was formed. A toke not only acts as a
rubber trader but also as a money lender when farmers need urgent financial problem. This left no
choice for farmers – they had to sell their rubber harvest to certain toke to whom they borrowed some
money.
A Memorandum of Understanding between ICRAF and Bridgestone Japan represented by Mr Hideki
Yokoyama was signed on April 29, 2010 in ICRAF Office, Bogor, Indonesia. The company will fund
a cost-benefit analysis on improved quality of rubber, train more local farmers in how to get better
rubber from their tress, and share the results of the research globally.
CONCLUSION
There is now a consensus among research and development professionals on the need to provide
incentives (as rewards, compensation and recognition) to the poor tropical producers of non-timber
forest products for providing environmental services. Eco-certification at its most fundamental level
protects environmental services by attaining agreement from producers to follow a defined set of
practices in exchange for certification that they have done so. When consumers elect to pay price
premiums for environmental services, the premiums can increase the pool of funds available for
conserving environmental services by providing returns to the landholders for their environmental
outputs. These returns would make land-uses that provide biodiversity services more competitive with
land uses that emphasise only crop production. One mechanism investigated in the Jambi Province of
Indonesia involved eco-certification of jungle rubber, a traditional Indonesian management practice
that retains a forest-like environment, harbouring far more species than a monoculture.
Despite its economical and ecological functions, the study found that traditional complex rubber
agroforestry system was under threat but somehow opportunities to preserve it still exist. The
economic calculation showed that the monoculture rubber and oil palm are much more economically
attractive for farmers in Bungo. On-ground realities revealed that not all assumptions have been well-
justified. Some constraints exist for both monoculture rubber and oil palm plantations, such as

11 | P a g e
unavailable good seedlings and lack of technological knowledge for establishing, managing,
harvesting and handling post-harvesting process of the plantations. The spatial analysis revealed that
the monoculture rubber has been relatively stable since 2002 and oil palm plantations were still
dominated by large companies. However, in the future, when constraints become minimal for
smallholders to adopt monoculture rubber and oil palm plantations, it will be no doubt that jungle
rubber can slowly diminish.
The case in Jambi showed that supportive policy toward eco-certification was still very low. Most of
government’s programmes and policies were only focused on agricultural productions without
providing incentives to sustainable agricultural management, including eco-certification. Technically,
this concept was still nascent to relevant actors in Bungo (and elsewhere in Indonesia). We observed
that the local governments at district and provincial level are the most prominent decision makers for
championing the implementation of eco-certification scheme. They were the ones who had stronger
position to decide whether the existing jungle rubber would be preserved or converted to other land
uses, such as oil palms. Farmers, in this case, would rationally select the most beneficial farming
system that is affordable and familiar for them. The roles of intermediary, such as local NGOs
become important to sensitize the importance of sustainable resource management and the long-term
advantage of linking livelihood and conservation.
Field interviews revealed that while jungle rubber had the potential to meet eco-certification
standards, many obstacles inherent in current eco-certification approaches needed to be overcome to
make it a viable option for Jambi’s rubber producers. From the demand perspective, although the
awareness about green products was increasing, companies were still hesitant to adopt the eco-
certification concept. They were still uncertain about the effect of buying green product with premium
prices, even with small scale of trading, since this was assumed to distort the global price market.
Therefore, the current practice to adopt environmentally friendly production system was through their
corporate social responsibility programmes. At the supplier level, farmers had been enthusiastic with
the concept; however, many further steps have to be prepared, such as improving the rubber quality,
strengthening local institutions and capacity to actively involve in the scheme.
RECOMMENDATION AND FUTURE RESEARCH QUESTION
To date, eco-certification has not resulted in high rates of conservation of tropical forests. As of mid
2005, less than 1.5% of tropical forests had become eco-certified, compared to slightly over 31% of
temperate forests. Reasons for the low rate of eco-certification in the tropics include the fact that
producers have not received higher prices for eco-certified products. Nonetheless, eco-certification
shows promise. Studies in temperate forests indicate that eco-certified forests are better managed than
others. In addition, eco-certification is based on using areas for economic purposes, while at the same
time protecting them and this necessitates working to integrate small producers into markets.
Evaluation of integrated conservation and development projects indicates these factors are associated
with ecological and economic success. Therefore, as the results of this study, we recommend that:
� Sustainable eco-certification needs to promote development
Eco-certification comes with much fine print to observe if it is to deliver on its promise. First,
in the tropics, eco-certification cannot deliver sustainable conservation if it does not also
deliver sustainable development. If biodiversity-conserving land-uses do not produce benefits
for small holders that out compete biodiversity-destroying uses, producers will opt for the use

12 | P a g e
that offers the best returns for their labour and resources, especially in settings like Indonesia,
where a high percentage of rural people earn USD 2 or less per day.
� Certification choices should match local circumstances
Producers wanting to pursue certification should match the market and conservation strengths
of the various types of certification (organic, fair trade, eco-based) to the circumstances of
their specific locale. Organic certification has provided the most evidence of price premiums
for crops consumed or worn. Evidence also shows that fair trade produces price premiums.
However, eco-certification schemes establish conservation protection most rigorously and
explicitly, making them highly suited for situations with threatened biodiversity. Among the
eco-certification approaches, each has its own strengths as well as weaknesses in different
situations. Research to target improvements to weak areas for each situation could result in
the best set of options for producers and their crops. Crops already traded internationally
make the best choice for internationally-based eco-certification.
� Research should target price premiums, transaction costs and conservation outcomes.
Research for improving the reach and efficacy of eco-certification should focus on the
following:
1. Can eco-certification deliver sufficient price premiums?
Powerful retailers and retail manufacturers near the consumer end of the eco-certification
value chain have agreed to stock eco-certified products whenever possible. However,
these retailers have not offered consumers choices between eco-certified and non-
certified products, thereby giving them no way to communicate demand by “voting with
their dollars.” Furthermore, there is evidence these retailers use their power to pass the
costs of eco-certification up the value chain without passing along any price premium
that might materialise. Yet, if these retailers marketed eco-certified products, they could
potentially gain market share and consumer loyalty, while being able to pass the costs
onto consumers.
2. Could contracts directly between producers and retailers get price premiums to producers
while otherwise meeting the needs of producers and sellers?
Such contracts are used in fair-trade certification, which has effectively transmitted price
premiums to producers. The contracts would, in effect, separate the value chain of the
biodiversity conservation services product created through eco-certification from the
value chain for raw materials.
3. Could shortening the eco-certification value chain enable an “accounting chain-of-
custody?”
Selling products under an eco-certification label requires proof that the items were
actually produced according to eco-certification standards. Currently, to offer such proof,
each intermediary in the value chain must keep certified and non-certified material
physically separate and maintain documentation of doing so. This requirement adds to
the transaction costs.

13 | P a g e
4. Would contracts produce more conservation value if they paid producers based on
indicators of the desired biodiversity conservation, rather than amount of raw material
produced? If so, these contracts could limit the potential for perverse incentives to
producers to grow more raw materials, when more conservation is the desired goal.
Eco-certification is a relatively new and still evolving market. Whether it ultimately succeeds or fails
in conserving environmental services depends on whether consumers can be motivated to pay for
these services, so that producers near and far can earn decent returns for providing services with
global value. Creating this willingness and the value chains to meet the demand will require
significant resources, just like for any more traditional business products.

14 | P a g e
APPENDIX 1 A PROFITABILITY ASSESSMENT OF SMALLHOLDER RUBBER AGROFORESTRY
SYSTEMS IN JAMBI, SUMATRA, INDONESIA
Suseno Budidarsono1, Laxman Joshi2, Gede Wibawa3
1World Agroforestry Centre (ICRAF), ICRAF Southeast Asia, Indonesia. 2International Centre for Integrated Mountain Development, ICIMOD, Nepal 3Indonesian Estate Crop Research Centre Rubber Research Institute, Indonesia.
INTRODUCTION
A literature review on traditional rubber agroforestry systems in Indonesia, or jungle rubber as it is
referred to, reveals two main points of interest. First, jungle rubber that is mostly owned by
smallholder farmers (2-5 ha) is a result of local farmers’ efforts since the early 20th century to adopt
rubber as a cash crop into their crop fallow system (van Noordwijk et al., 1995; Penot, 1997; Joshi et
al., 2002). Rubber was adapted to the traditional upland rice fallow system leading to the
development of complex rubber agroforests that are characterized by high diversity in native forest
tree species and understory plants. These rubber agroforests represent the best example of
‘domesticated forests’ (Michon, 2005) that maintain basic forest ecological processes in a productive
context.
From an economic perspective, this land use system provides a wide range of sources of income for
farmers, their neighbours and the other agents in rubber marketing. Jungle rubber provides regular
income for farmers, mostly from rubber, and temporarily from food and cash crops in the initial years,
fruits and other commodities from other tree species that grow spontaneously in the later years.
Secondly, from a conservation point of view, jungle rubber provides environmental benefits; being
essentially secondary forest, it harbours many wild plants and animals of the primary forest that is
almost disappeared from Sumatra’s lowland peneplains (Gouyon, et. al., 1993; de Jong et al., 2001).
Ecological studies have clarified vegetation structure and composition of rubber agroforest in Jambi
(Gouyon et al., 1993; Penot, 1995; Beukema and van Noordwijk, 2004; Michon, 2005) and local
ecological knowledge and farmer management styles for regeneration in cyclical or semipermanent
rubber agroforest have been analysed by Joshi et al. (2003, 2005), Ketterings et al. (1999) and
Wibawa et al. (2005). In brief, 60-80% of plant species found in neighbouring forests are also found
in traditional jungle rubber. The woody biomass in a typical old traditional rubber agroforests also
represents a carbon stock substantially (some 20 Mg C ha-1) above what rotational systems would
achieve as time-averaged value (Tomich et al., 2004). In addition, the locations where the agroforest
are found, which are in riparian areas, also provide important hydrological functions. Michon and de
Foresta (1994) found that a sample plot of jungle rubber contained 92 tree species, 97 lianas, and 28
epiphytes compared to respectively 171, 89, and 63 in the primary forest. In addition, Thiollay (1985)
estimates that jungle rubber supports about 137 bird species of which nearly half are associated with
primary forest.
The inherent production characteristics of jungle rubber in Jambi, however, are not at par with the
environmental services they provide, because of the problems faced by farmers. Compared to a
monoculture plantation that is common in estate system, the latex yield of jungle rubber on a per unit
area is very low and the quality of rubber output is also inferior. Extensive processing is needed to
produce a low grade product for the international market (Barlow et. al., 1988).
15 | P a g e
In addition, the low quality weakens farmers’ bargaining position in the rubber marketing systems.
Although the Indonesian National Standard (SNI) of rubber quality was launched by the government
at the end of 1999, to improve rubber quality and increase farmers’ income, the continuity and the
effectiveness of such regulation are still in question as long as the control system is not well managed.
The issue of economic feasibility of various rubber production systems has been raised many times. In
this paper we address two research questions:
1. How profitable is jungle rubber; what are its returns to land and returns to labour?
2. How does jungle rubber compare with more intensive mono-species systems of clonal rubber
and oil palm?
Other points explored in relation to the long-term agricultural investments in rubber agroforests are
the cash flow constraints and labour requirements. Investing in rubber agroforests, a perennial
cultivation system entails multi-year financing. Here analysis of multi-year cash flow is carried out to
reveal investment barriers to farmer adoption. Assessing labour requirements is based on calculations
of person-days required including, total labour required for establishment phase (refers to the period
before positive cash flow), and the average person-days per hectare per year employed for the
operational phase (period after positive cash flow begin).
ASSESSMENT METHOD
Current assessment is focused on three socio-economic variables of smallholder rubber cultivation:
(1) profitability as an indicator of production incentives for smallholders and also an indicator of
comparative advantage of such activity to society at large; (2) labour requirements as an indicator of
labour constraint for smallholders and a measurement of rural employment opportunity provided by
the systems; and (3) cost of establishment as an indicator of cash flow constraint in establishing such
systems. To relate them with policy perspectives, the assessment employed Policy Analyses Matrix
(PAM) technique (Monke and Pearson, 1995). Assessment starts with the PAM framework for
estimating profitability indicators and proceeds with an analysis of labour requirement and cash flow
The PAM approach is designed to analyse the pattern of incentives at the microeconomic level and to
provide quantitative estimates of the impact of policies on those incentives (Monke and Pearson,
1995). As a partial equilibrium static framework, the PAM provides a consistent framework to
analyse the information regarding land use activities, and to relate the direct financial and economic
incentives that smallholder farmers face to relevant government policy that influences these
incentives. The PAM compares household production budgets for a given agricultural production
valued at private and social prices. The private prices are the prices that households and firms actually
face; they indicate the financial incentives for adoption and investment in a system by independent
smallholder farmers. Social prices, or economic ‘shadow prices,’ are calculated to remove the impact
of policy regulations and market imperfections; they indicate the potential profitability or comparative
advantage of a particular land use activity, given the opportunity costs of inputs from the perspective
of society. The basic structure of PAM is shown in Table 1.
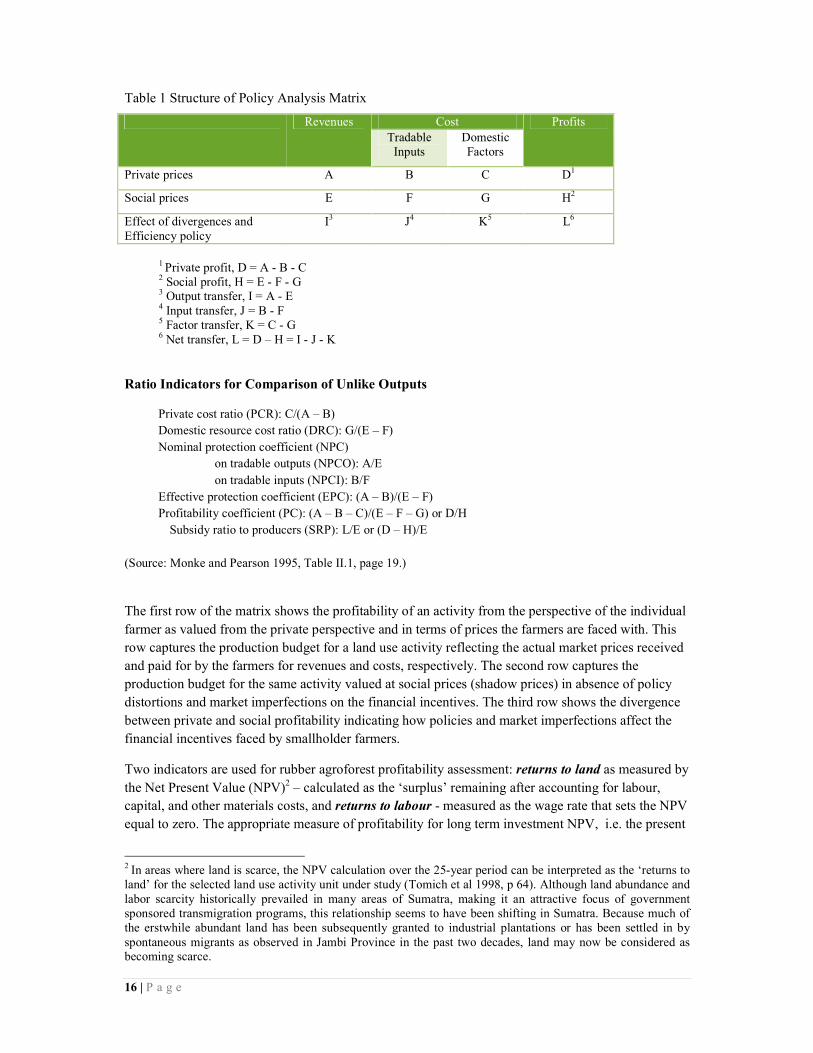
16 | P a g e
Table 1 Structure of Policy Analysis Matrix
Revenues Cost Profits
Tradable Inputs
Domestic Factors
Private prices A B C D1
Social prices E F G H2
Effect of divergences and Efficiency policy
I3 J4 K5 L6
1 Private profit, D = A - B - C 2 Social profit, H = E - F - G 3 Output transfer, I = A - E 4 Input transfer, J = B - F 5 Factor transfer, K = C - G 6 Net transfer, L = D – H = I - J - K
Ratio Indicators for Comparison of Unlike Outputs
Private cost ratio (PCR): C/(A – B)
Domestic resource cost ratio (DRC): G/(E – F)
Nominal protection coefficient (NPC)
on tradable outputs (NPCO): A/E
on tradable inputs (NPCI): B/F
Effective protection coefficient (EPC): (A – B)/(E – F)
Profitability coefficient (PC): (A – B – C)/(E – F – G) or D/H
Subsidy ratio to producers (SRP): L/E or (D – H)/E
(Source: Monke and Pearson 1995, Table II.1, page 19.)
The first row of the matrix shows the profitability of an activity from the perspective of the individual
farmer as valued from the private perspective and in terms of prices the farmers are faced with. This
row captures the production budget for a land use activity reflecting the actual market prices received
and paid for by the farmers for revenues and costs, respectively. The second row captures the
production budget for the same activity valued at social prices (shadow prices) in absence of policy
distortions and market imperfections on the financial incentives. The third row shows the divergence
between private and social profitability indicating how policies and market imperfections affect the
financial incentives faced by smallholder farmers.
Two indicators are used for rubber agroforest profitability assessment: returns to land as measured by
the Net Present Value (NPV)2 – calculated as the ‘surplus’ remaining after accounting for labour,
capital, and other materials costs, and returns to labour - measured as the wage rate that sets the NPV
equal to zero. The appropriate measure of profitability for long term investment NPV, i.e. the present
2 In areas where land is scarce, the NPV calculation over the 25-year period can be interpreted as the ‘returns to land’ for the selected land use activity unit under study (Tomich et al 1998, p 64). Although land abundance and labor scarcity historically prevailed in many areas of Sumatra, making it an attractive focus of government sponsored transmigration programs, this relationship seems to have been shifting in Sumatra. Because much of the erstwhile abundant land has been subsequently granted to industrial plantations or has been settled in by spontaneous migrants as observed in Jambi Province in the past two decades, land may now be considered as becoming scarce.
17 | P a g e
worth of benefits (revenues) minus the present worth of the cost of tradable inputs and domestic
factors of productions (Gittinger, 1992). Mathematically, it is defined as:
where Bt is benefit at year t, Ct cost at year t, t is time denoting year and i is the discount rate used in
the assessment. An investment is appraised as profitable if NPV is greater than 0.
Calculating the wage rate until NPV goes to zero leads to a proxy for ‘returns to labour’, since this
process converts the surplus to a wage rate (Vosti et al, 2000). The calculation of returns to labour
converts the ‘surplus’ to a wage after accounting for purchased inputs and discounting for the cost of
capital. Where a return to labour exceeds the average daily wage rate, individuals with their own land
will prefer this activity to off-farm activities; it also justifies hiring non-family labour. Returns to
labour valued at private prices can be viewed as a primary indicator of profitability for smallholders’
production incentives.
Cost of establishment, as an indicator of cash flow constraints, is defined as NPV of all inputs used
prior to positive cash flow to establish a system– including the imputed value of family labour and
family owned implement, but excluding any imputed costs for family land and management (Vosti et
al., 2000). This is to assess whether the investment required by the systems are barriers to adoption by
smallholders.
With regard to labour requirements, three different indicators are used in the assessment: total
person-days required for establishment (i.e. the period before positive cash flow occurs), person-days
required for operations (i.e. the period after positive cash flow starts) and total person-days employed
over time (Tomich et al., 1998; Vosti et al., 1998). The last two indicators are expressed on an average
basis, per hectare per year, throughout the relevant time period. From farmer’s perspective, unmet
labour requirement indicators reflect labour constraints that farmers face. From policy makers’ point
of view, the figures reflect employment opportunity that may exist.
Pricing costs and returns
Profitability assessment needs a detailed farm budget calculation3. It is necessary to clarify the
appropriate prices for calculating costs and returns and the macroeconomic assumptions used in this
assessment. In determining the prices, we used the annual average prices of 1998 - 2009 of all
tradable farm inputs and farm commodities that were cast in the respective constant 2007 prices
(2007=100)4. The local market prices in Jambi were used for calculating farm budget valued at private
prices. For comparable farm budgets at social prices, export or import parity prices at farm gate were
3 This assessment did not include the environmental benefits provided by jungle rubber. Further study is needed to value the environmental benefit of jungle rubber.
4 This refers to 2007 price as an index from which overall effect of general price inflation has been removed. So
that the prices of all inputs and outputs used in the assessment have been deflated to real term. Shortly, the nominal prices net of inflation.
( )∑=
= +
−=
nt
tt
tt
i
CBNPV
0 1

18 | P a g e
used. Farm budget calculation was done based on the macroeconomic parameters of year 2009 (Table
2), representing the recent situation.
Real interest rates, or the nominal interest rate net of inflation, are the discount factors used to value
future cash flows into present terms. A private discount rate of 10% and a social discount rate of 5%
were used for calculating NPV at private and social prices respectively5.
Sensitivity analysis of rubber system profitability to interest rate and wage rate was carried out to
understand to what extent these variables can influence profitability.
Table 2 Macroeconomic parameters used in the study (2009)
Exchange rate (Rp/US $) Rp 10,374
Average real wage rate in Sumatra 2004 – 2009, Constant 2007 price (Rp/person-days)
Rp 28,409
Real interest rate (net of inflation):
At private prices At social prices
10% per annum 5% per annum
Smallholder rubber systems under study
Two common smallholder rubber systems in Jambi were selected for this assessment. The first is the
extensive traditional jungle rubber agroforestry that covers around 86% of the existing total rubber
system (Penot, 1995) that is characterized by a high variability in vegetation structure and
composition - ranging from near-forest with hundreds of plant species to near-monocrop plantations
with little non-rubber vegetation. Farmers’ decision making process in the selection between a
rotational system versus a sisipan system in jungle rubber agroforestry are discussed. Under a
cyclical system, farmers usually clear old rubber gardens (35 to 44 years old) to start new rubber
plantations. We use the average figure of 40 years for rubber garden age in our assessment. Under a
sisipan system, farmers actively interplant rubber seedlings or maintain rubber saplings within
productive rubber plot to ensure a continuous income from these rubber gardens. We assume that
under a sisipan system farmers begin to interplant new rubber seedlings only at year 20 and these
rubber plots will continue to be productive until year 68 – close to two cycles of rotational system.
The second system used in this evaluation is the improved monocrop plantation using GT1 clone
representing a high-input and high-output system that is being promoted in rubber development
projects. It is a nearly a clean system (no other natural vegetation) and requires intensive plantation
management to ensure optimal yield of latex. Available data indicate that these plantations remain
productive up to year 30.
Field establishment and latex production
Establishment of a new rubber garden involves land clearing, mostly through a slash and burn
activity, followed by planting rubber propagules, guarding against wildlife damage and frequent
weeding and maintenance until the rubber plants are established. Other crops such as maize, dry land
rice and other cash crops may be cultivated in the first two or three years. The main differences
5 Capital markets in Indonesia are fraught with imperfections, particularly in rural area. Private interest rates,
particularly for the smallholder sector have been very high in real terms. The real social interest rate is less than the private rate (Tomich et al. 1998)

19 | P a g e
between the traditional jungle rubber and monoculture system are in the use of tradable purchased
inputs, the corresponding crop care activities, hence labour requirements. Monoculture systems using
selected clones almost always require fertilizer input but also yield higher latex production. The
details inputs used and the outputs of both systems are shown in Appendix 1B. The next difference
between the two systems is in the continuity of rubber gardens in producing latex. Under the cyclical
system, once the old rubber plot is cleared, there is an establishment (or waiting) period, six to ten
years, before rubber trees can be tapped (45 cm girth at breast height). Under a sisipan system, no
clear felling is necessary, as rubber seedlings are planted in small gaps (hence the term “gap
replanting”), and rubber plots keep producing latex, albeit at a lower rate.
Latex productivity of jungle rubber constitutes a major data challenge for this assessment as it
requires latex production in sequential planting years. Moreover, little data is available regarding
jungle rubber productivity. Although crude estimates of production had been used for jungle rubber
(Penot, 1995; World Bank, 1984) these figures appear not to take into account the large range of
stocking density, management flexibility and complexity of the system (Vincent et al., this issue).
Data based on recent observations of the system (ICRAF, internal reports) have been used in the
current assessment. The trend used in the production data of Indonesia Smallholder Rubber
Development Project II (The World Bank, 1984) was used to develop production scenarios for the
monoculture rubber system. Figure 1 indicates rubber production scenario for the three systems used
in the current assessment; figures are provided in Appendix 1A.
Figure 1 Rubber yield estimates over time of selected rubber systems
Non-rubber products
Although latex is the main source of income from rubber agroforestry, farmers also collect products
such as annual crops (e.g., paddy rice, maize, vegetables) in the initial years of rubber establishment
while fruits, medicinal plant, tubers can be collected in the latter years. However, a few products have
any commercial value. Many fruit trees in rubber agroforestry, for example, are considered public
0
500
1000
1500
2000
2500
0 5 10 15 20 25 30 35 40 45 66
Rubber yields (in kg, 100% DRC)
Cultivation years
Monoculture System
Cyclical System
Sisipan System
gap replanting starts

20 | P a g e
property; anybody in the community may collect fruits for self consumption. Accordingly it is
assumed that only half of their potential contributes to household income. Fruits of durian (Durio
zibethinus), petai (Parkia spesiosa) and jengkol (Pithecellobium jeringa) are the most common fruits
collected from rubber agroforest that have market value. Because of their infrequent occurrence in
jungle rubber agroforests, it is estimated that on average only three fruit trees per species per hectare
of jungle rubber contribute to household income.
Currently timber is considered only a by-product from rubber agroforestry. Rubber wood is of little
importance as it requires fungicide treatment within two days of felling. Otherwise, the blue stain
fungus renders the wood undesirable. In the absence of such processing facility in the vicinity, rubber
wood from jungle rubber in Jambi has little value. However, woods of other high quality timber
species are a high-value product. This assessment includes timber from the clearing activity both prior
to establishment and at the end of the tapping stage. Clearance of secondary forest for rubber garden
yields only about 4m3 ha-1 of marketable timber. At the end of the each rubber cycle (40 years) in
Jambi, 25 m3 of marketable rubber wood and 13.5 m3 of other marketable timber species per hectare
can be harvested (Phillippe, 2000). From sisipan system that reaches 68 years old onward, it is
estimated to contain 30.7m3 ha-1 of marketable rubber wood and 23.4 m3 ha-1 of non-rubber timber in
the system.
RESULTS OF THE ASSESSMENT
Profitability
Estimates returns to land and returns to labour of the smallholder rubber systems under study, both
evaluated at private and social prices, are summarised in Table 3 and Table 4. The profitability
assessment for the three systems yielded similar results. With the current rubber price, IDR, 13,000
per kg (in real term), the three systems are profitable, indicated by positive values for returns to land
and the calculated IRR higher than the discount rate. They vary in its production incentives (returns
to labour at private prices). Return to labour of the Sisipan system is not much different from the real
average wage rate in the province (IDR 28,409), and the cyclical system is 25% higher slightly higher.
The monoculture rubber system, well managed and without any credit to pay back, is more profitable
than traditional systems. As shown in Table 3, the monoculture system is the highest NPV for both
private (financial) and social (economic) prices, as well as its estimated IRR. Positive estimates of
return to land and returns to labour of this system suggest that the system is attractive enough for
farmers. This is true for an ideal rubber monoculture setting. It is hereby assumed that the
monoculture system is optimally managed (pest control, tapping and other maintenance) following
recommended practices and using easily available planting material. However, in reality and even in
project areas, these ideal conditions are exceptions rather than norms.
For traditional systems, the assessment assumes a “standard” jungle rubber and the inherent flexibility
of these systems are difficult to cater for in such evaluations. It is to be noted that rubber farmers do
not necessarily maximise latex production from their rubber gardens, but rely on a number of
alternative sources, including on-farm and off-farm jobs to maintain their household income.
Furthermore, economic assessment tends not to include family labour – the most dominant labour
inputs in smallholder rubber cultivation – in the component of expenditure; hence, cost of labour is
actually returns to the family labour involved. Perhaps this explains why traditional rubber production
systems, despite their negative economic indicators, continue to be practised.

21 | P a g e
Table 3 Profitability Matrix of Selected Smallholder Rubber Systems in Jambi Province (in IDR 000)
Traditional Rubber agroforest Monoclonal rubber (30 years)
Cyclical System (40 years) Sisipan Systems (68 years)
private social effect of divergences
private social effect of divergences
private social effect of divergences
Revenues 28,943 81,986 (53,043) 29,836 96,173 (66,337) 75,965 184,747 (108,782)
Cost
Purchased inputs
Tradables 2,380 4,261 (1,882) 1,985 4,295 (2,310) 15,122 24,184 (9,063)
Non Tradable 1,635 1,813 (178) 372 1,977 (1,606) 166 355 (190)
Domestic factors
Labors 19,644 39,406 (19,762) 26,119 45,262 (19,143) 42,967 77,205 (34,238)
Capital 246 253 (7) 26 301 (275) 1,330 1,006 324
Profit 5,038 36,253 (31,215) 1,334 44,338 (43,004) 16,381 81,996 (65,615)

22 | P a g e
Table 4 Profitability Matrix: Smallholder Rubber systems in Jambi (constant 2007 prices)
System RETURN TO LAND (NPV)
IDR ‘000 per ha
INTERNAL Rate of
Return (IRR)
RETURN TO LABOR
IDR/ person-day
NPCO
2)
Private Prices r=10%
Social Prices r=5%
Divergences Private Prices
Social Prices Private Prices
Social Prices
RAF Traditional
Cyclical system
(40 year cycle)
5,038 36,253 (31,215) 14.8% 16.7% 36,600 54,400 0.56
Sisipan System
(68 year cycle)
1,334 44,338 (43,004) 15.1% 16.82% 29,800 56,100 0.46
Monoculture
(30 year cycle)
16,381 81,996 (65,615) 16.7% 19.8% 38,900 57,800 0.63
Note:
1) Profitability coefficient (PC) is ratio between NPV at private prices to the comparable NPV at social prices, showing the extent to which financial-private profit differ to the comparable economic-social profit. PC measures the incentives effect of all policies and provides a ratio to determine the relative net policy transfer (Monke and Pearson, 1995)
2) Nominal Protection Coefficient on tradable Output (NPCO) is a ratio that contrasts the observed (private) commodity prices with the comparable world price. This ratio indicates the impact of policy (and of any market failure not corrected by efficient policy) that causes a divergence between the two prices. NPCO > 1 is indicative of private prices of output being greater than social prices reflecting that producers are positively protected.
1 | P a g e
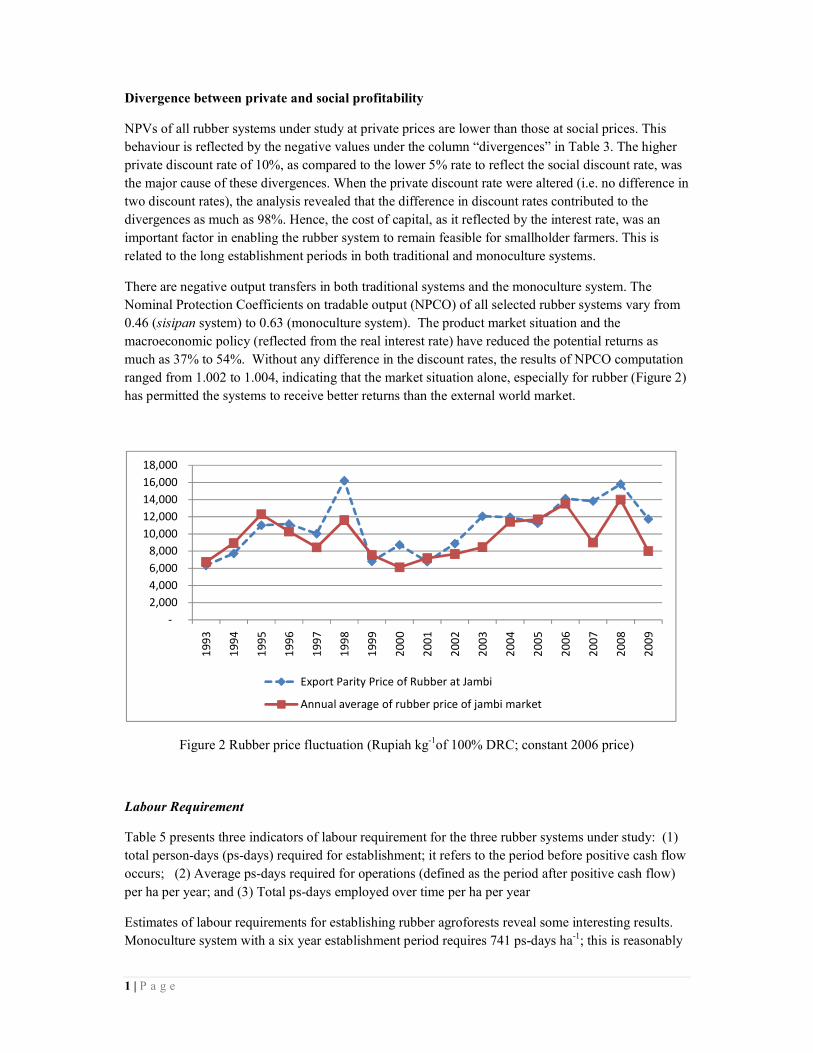
Divergence between private and social profitability
NPVs of all rubber systems under study at private prices are lower than those at social prices. This
behaviour is reflected by the negative values under the column “divergences” in Table 3. The higher
private discount rate of 10%, as compared to the lower 5% rate to reflect the social discount rate, was
the major cause of these divergences. When the private discount rate were altered (i.e. no difference in
two discount rates), the analysis revealed that the difference in discount rates contributed to the
divergences as much as 98%. Hence, the cost of capital, as it reflected by the interest rate, was an
important factor in enabling the rubber system to remain feasible for smallholder farmers. This is
related to the long establishment periods in both traditional and monoculture systems.
There are negative output transfers in both traditional systems and the monoculture system. The
Nominal Protection Coefficients on tradable output (NPCO) of all selected rubber systems vary from
0.46 (sisipan system) to 0.63 (monoculture system). The product market situation and the
macroeconomic policy (reflected from the real interest rate) have reduced the potential returns as
much as 37% to 54%. Without any difference in the discount rates, the results of NPCO computation
ranged from 1.002 to 1.004, indicating that the market situation alone, especially for rubber (Figure 2)
has permitted the systems to receive better returns than the external world market.
Figure 2 Rubber price fluctuation (Rupiah kg-1of 100% DRC; constant 2006 price)
Labour Requirement
Table 5 presents three indicators of labour requirement for the three rubber systems under study: (1)
total person-days (ps-days) required for establishment; it refers to the period before positive cash flow
occurs; (2) Average ps-days required for operations (defined as the period after positive cash flow)
per ha per year; and (3) Total ps-days employed over time per ha per year
Estimates of labour requirements for establishing rubber agroforests reveal some interesting results.
Monoculture system with a six year establishment period requires 741 ps-days ha-1; this is reasonably
-
2,000
4,000
6,000
8,000
10,000
12,000
14,000
16,000
18,000
19
93
19
94
19
95
19
96
19
97
19
98
19
99
20
00
20
01
20
02
20
03
20
04
20
05
20
06
20
07
20
08
20
09
Export Parity Price of Rubber at Jambi
Annual average of rubber price of jambi market

2 | P a g e
higher than the traditional systems (both cyclical and sisipan), that employ 474 ps-days ha-1 for 9
years of establishment period. Translated into yearly employment, monoculture system requires 123
ps-days ha-1 year-1, and the traditional systems require only 53 ps-days ha-1 year-1.
Table 5 Labour requirements in rubber agroforestry systems in Jambi
Systems Years to Positive
Cash flow
Labour requirements
Establishment phase ps-day/ha
Operation Phase ps-day/ha/year
Traditional RAF
Cyclical system 9 464 104
Sisipan system 9 474 115
Monoculture Rubber 7 744 211
Estimates of labour requirement during latex production phase, also show significantly different
figures between monoculture and traditional systems. Although monoculture system has a shorter
production phase (24 years), it requires 185 ps-days ha-1 year-1 for tapping and other maintenance
activities. While the two traditional systems, cyclical and sisipan, with 31 years and 59 years of
production phase respectively, require 115 and 104 ps-days ha-1 year-1. Monoculture system requires
the more labour for all activities. From farmers’ perspective, higher labour requirements impose a
more serious constraint when the average wage rate increases beyond the returns to labour. For policy
makers, monoculture systems could be probably attractive as employment generation in rural areas.
But this requires a careful check with the population data and whether economically active population
in agriculture can actually meet the labour requirements of monoculture system. As additional
information, published statistics on population and agriculture area of Jambi (BPS, 2001) and
estimates of Economically Active Population in Agriculture in Indonesia (FAO) show that population
density per unit agriculture land in Jambi is 218 per km2 or roughly 2 persons per hectare. Assuming
that average working days per annum for rubber cultivation is 180 days per person, it can be roughly
estimated that there are 360 ps-days per hectare per year available for rubber cultivation.
Cost of establishment - a constraint?
Table 6 includes two perspectives on multi-year cash flow constraint: years to positive cash flow and
establishment cost that can be defined as discounted cash outflow prior to positive cash flow. The
imputed value of family labour is included in these establishment cost because these labour inputs
presumably represent opportunity cost – foregone earnings – in the other activities, even when they do
not require any cash outlay.
Positive cash flow in both traditional rubber systems starts in year 9 (establishment period). This does
not appear to be a constraint for smallholder rubber farmers as they usually keep two or more rubber
agroforests at different stages of maturity. However, there are indications that this establishment
period has shortened primarily as land scarcity has increased and farmers’ waiting capacity has
declined. During the waiting period, farmers can also work on other parcels of land or work in off
farm activities.

3 | P a g e
Table 6 Cash flow constraint matrix in 2009
Rubber System
Years to
positive cash flow
Discounted
establishment cost at private prices IDR 000/ha
Discounted
establishment cost at social prices
IDR 000/ha
RAF Traditional
Cyclical System 9 11.907 13,408
Sisipan System 9 11,789 13,259
Monoculture Rubber 7 30,087 30,335
The amount of IDR 13.4 million required to establish the system seems not an insurmountable barrier
for smallholder. The monoculture system with positive cash flow for occurs in year 7, requiring IDR
30.1 million to establish. This amount is too expensive for smallholder to invest. But the competing
land use option (oil palm plantation) that requires slightly lower investment (about IDR 25 million/ha)
with higher return to labour (approximately two fold of rubber monoculture system) is attractive for
farmers to invest. However, there are some technological constraints for some farmer to invest in oil
palm plantation at the current stage.
Influence of discount rate and wage rate on profitability
The current analysis indicated the importance of discount rate and wage rate in determining the
overall profitability of these systems. To understand to what extent these parameters changed the
NPVs of rubber systems in Jambi, sensitivity analysis of profitability to the discount rate and the wage
rate results was carried out. The results are summarised in Figure 3. There is a differential impact of
changes of interest rate to the profitability (NPV). The lower the discount rate the more sensitive are
the NPVs (traditional system’s profitability) to the change of interest rate. Beyond a discount rate of
30%, profitability of rubber systems in Jambi is no longer sensitive to the change of interest rate. This
illustrates that rubber cultivation is not a capital-intensive type of investment, meaning that the initial
capital is only a small proportion of the total expenditure over time. This capital investment is perhaps
affordable to many smallholder farmers. However, below 20% discount rate, profitability of rubber
system becomes more sensitive. This implies that maintaining lower capital investment will indirectly
increase profitability of traditional rubber agroforestry.
Figure 3 also indicates that an increase in wage rate in agricultural labour market lowers returns to
land in all rubber production systems. The trend line of monoculture system is steeper than that of the
traditional systems; it proves that monoculture system, although providing better returns to labour and
employment opportunities in rural area, is more susceptible to any change of wage rate than
traditional systems. Traditional production systems appear to be less sensitive than monoculture
system to rubber price fluctuation hence provides an important buffering to overall latex production
(Box1).
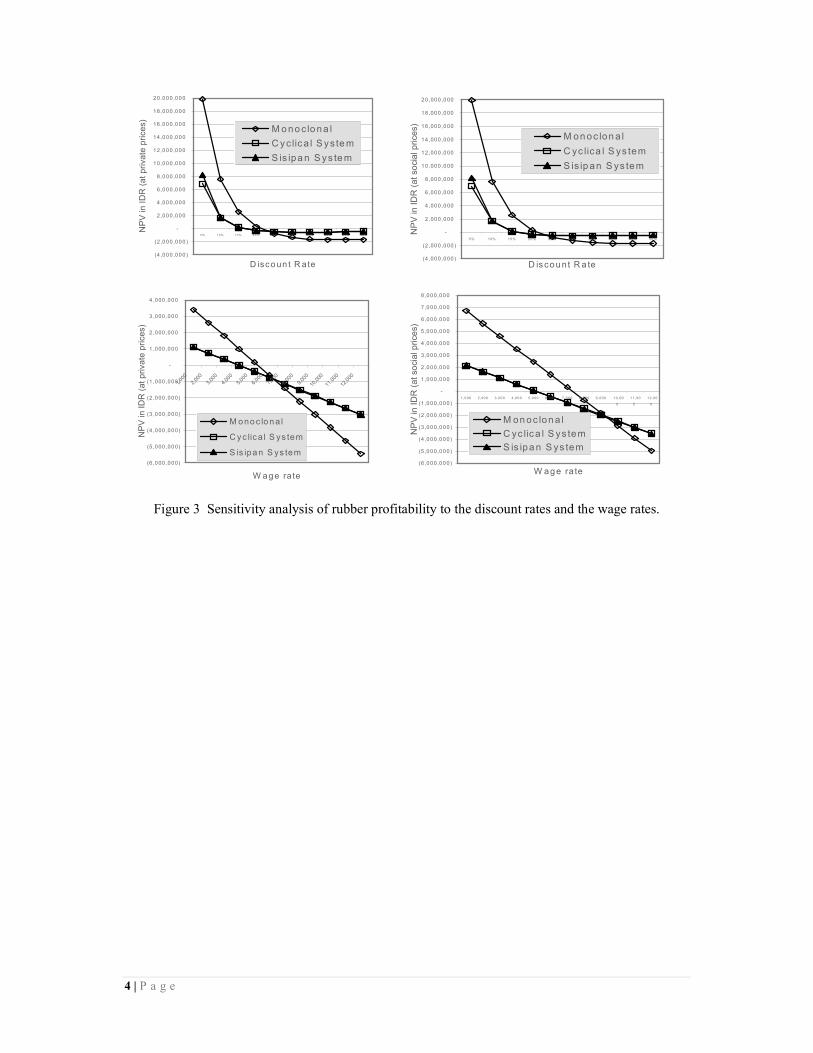
4 | P a g e
Figure 3 Sensitivity analysis of rubber profitability to the discount rates and the wage rates.
(4 ,000 ,000 )
(2 ,000 ,000 )
-
2,000 ,000
4,000 ,000
6,000 ,000
8,000 ,000
10,000 ,000
12,000 ,000
14,000 ,000
16,000 ,000
18,000 ,000
20,000 ,000
5% 10% 15% 20% 25% 30% 35% 40% 45% 50%
D iscoun t R ate
NPV in IDR (at private prices)
Monoc lona l
C yc lica l S ys tem
S is ipan Sys tem
(6 ,000 ,000)
(5 ,000 ,000)
(4 ,000 ,000)
(3 ,000 ,000)
(2 ,000 ,000)
(1 ,000 ,000)
-
1 ,000 ,000
2 ,000 ,000
3 ,000 ,000
4 ,000 ,000
1,000
2,000
3,000
4,000
5,000
6,000
7,000
8,000
9,000
10,000
11,000
12,000
Wage ra te
NPV in IDR (at private prices)
M onoc lona l
C yc lica l S ys tem
S is ipan S ys tem
(4 ,000 ,000 )
(2 ,000 ,000 )
-
2 ,000 ,000
4 ,000 ,000
6 ,000 ,000
8 ,000 ,000
10 ,000 ,000
12 ,000 ,000
14 ,000 ,000
16 ,000 ,000
18 ,000 ,000
20 ,000 ,000
5% 10% 15% 20% 25% 30% 35% 40% 45% 50%
D iscount R a te
NPV in IDR (at social prices)
Monoc lona l
C yc lica l S ys tem
S is ipan S ys tem
(6,000,000 )
(5,000,000 )
(4,000,000 )
(3,000,000 )
(2,000,000 )
(1,000,000 )
-
1,000,000
2,000,000
3,000,000
4,000,000
5,000,000
6,000,000
7,000,000
8,000,000
1 ,000 2 ,000 3 ,000 4,000 5,000 6 ,000 7 ,000 8 ,000 9 ,000 10 ,00
0
11 ,00
0
12,00
0
Wage ra te
NPV in IDR (at social prices)
Monoc lona l
C yc lica l S ys tem
S is ipan S ys tem
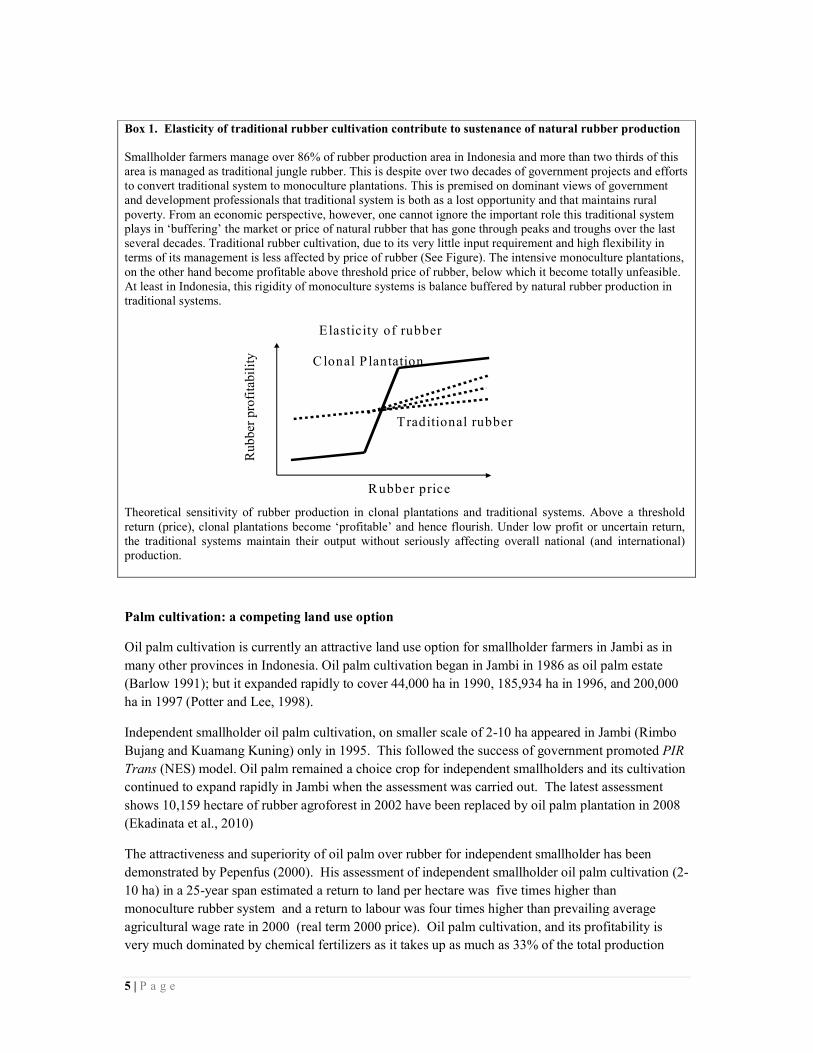
5 | P a g e
Box 1. Elasticity of traditional rubber cultivation contribute to sustenance of natural rubber production
Smallholder farmers manage over 86% of rubber production area in Indonesia and more than two thirds of this area is managed as traditional jungle rubber. This is despite over two decades of government projects and efforts to convert traditional system to monoculture plantations. This is premised on dominant views of government and development professionals that traditional system is both as a lost opportunity and that maintains rural
poverty. From an economic perspective, however, one cannot ignore the important role this traditional system plays in ‘buffering’ the market or price of natural rubber that has gone through peaks and troughs over the last several decades. Traditional rubber cultivation, due to its very little input requirement and high flexibility in terms of its management is less affected by price of rubber (See Figure). The intensive monoculture plantations,
on the other hand become profitable above threshold price of rubber, below which it become totally unfeasible. At least in Indonesia, this rigidity of monoculture systems is balance buffered by natural rubber production in traditional systems.
Theoretical sensitivity of rubber production in clonal plantations and traditional systems. Above a threshold
return (price), clonal plantations become ‘profitable’ and hence flourish. Under low profit or uncertain return, the traditional systems maintain their output without seriously affecting overall national (and international) production.
Palm cultivation: a competing land use option
Oil palm cultivation is currently an attractive land use option for smallholder farmers in Jambi as in
many other provinces in Indonesia. Oil palm cultivation began in Jambi in 1986 as oil palm estate
(Barlow 1991); but it expanded rapidly to cover 44,000 ha in 1990, 185,934 ha in 1996, and 200,000
ha in 1997 (Potter and Lee, 1998).
Independent smallholder oil palm cultivation, on smaller scale of 2-10 ha appeared in Jambi (Rimbo
Bujang and Kuamang Kuning) only in 1995. This followed the success of government promoted PIR
Trans (NES) model. Oil palm remained a choice crop for independent smallholders and its cultivation
continued to expand rapidly in Jambi when the assessment was carried out. The latest assessment
shows 10,159 hectare of rubber agroforest in 2002 have been replaced by oil palm plantation in 2008
(Ekadinata et al., 2010)
The attractiveness and superiority of oil palm over rubber for independent smallholder has been
demonstrated by Pepenfus (2000). His assessment of independent smallholder oil palm cultivation (2-
10 ha) in a 25-year span estimated a return to land per hectare was five times higher than
monoculture rubber system and a return to labour was four times higher than prevailing average
agricultural wage rate in 2000 (real term 2000 price). Oil palm cultivation, and its profitability is
very much dominated by chemical fertilizers as it takes up as much as 33% of the total production
Rubber
pro
fita
bility
Rubber price
Elasticity of rubber
C lonal P lantation
Traditional rubber agroforest

6 | P a g e
cost. The fertilizer requirement increases in less suitable land; this is the case in most parts of
Sumatra.
Large-scale oil palm cultivation is less profitable than independent smallholder farming. (Tomich et
al. 1998) showed that the estimate of return to land of a 10,700 ha of oil palm plantation was nearly
the same with most productive rubber systems and return to labour was only 35% higher than average
agricultural wage rate. It was partly because of requirement for a much higher infrastructure (road
and drainage network) and management costs compared to small-scale plantations. In a 10,700 ha of
oil palm plantation, for example, the discounted cost for road construction was estimated to be around
20% of its investment excluding road maintenance during the 25 year-span.
LESSON LEARNED AND FUTURE DIRECTIONS
Traditional rubber agroforestry system still remains in Jambi. However, it is clear, both from our
current assessment and with observations made by others, that rubber agroforestry with low latex
productivity has little competitive advantages and is not financially attractive for farmers to engage in.
This is also indicated by the rapid conversion of old jungle rubber with monoculture oil palm and
rubber in the recent years. On-going monitoring of land use change in Bungo Tebo area in Jambi
using Geographical Information System and remote sensing analysis of 1973 – 2002 spatial data
points to very high rate of disappearance of forest area and rubber agroforest area in recent years
(Ekadinata et al., 2010) the same time monoculture rubber and oil palm cultivation has increased
significantly. Traditional rubber agroforestry may provide better environmental benefits; but currently
this does not translate to any significant incentives to farmers.
While the traditional rubber agroforests are important for biodiversity conservation and other forest
functions, the economic analysis of the system concluded that profitability of the system is marginal
compare to other land uses. In spite of this, the system was the most important land use in the local
economy until late 1990s. Therefore, there remains the potential to conserve biodiversity and other
environmental services within agroforest systems through appropriate innovative interventions
including payment mechanisms.
Between rubber systems, current assessment clearly shows the economic advantages of monoculture
rubber over the traditional systems. Despite its advantages, adoption of monoculture system entails
easy availability of good quality planting material. This, however, has remained a significant
bottleneck in most smallholder rubber development projects. Where this constraint is overcome, a
significant increase in both returns to labour and returns to land can be achieved. However, in the
current analysis no consideration was made of the establishment risks such as those imposed by an
inferior quality of clones in the market and low survival rate of planting material in the field due to
vertebrate pests during the establishment phase.
Farmer management of high yielding rubber clones also requires intensive care and input. Even in
project endeavours in Jambi and South Sumatra where farmers received orientation and training on
good management and tapping, farmers have been observed to tap at a much higher intensity than
recommended, thereby affecting the health of rubber trees and significantly shortening their
production phase to less than 10 years. Whether this is due to lack of knowledge of tapping or due to
other constraints remains unclear.
The monoculture system may provide higher returns to both land and labour and overall higher latex
productivity for smallholder rubber farmers. Nevertheless, from a conservation perspective, the
monoculture system poses a serious threat to the mega biodiversity that is a characteristic of the

7 | P a g e
Sumatran forests. In the current analysis, the environmental services provided by the traditional jungle
rubber have not been considered as currently the value of this biodiversity is yet to be determined.
Studies to assess environmental valuation of biodiversity and other services provided by these systems
need to be undertaken urgently. It is likely that the conservation value of traditional jungle rubber
compensates for its lower latex production potential.
ACKNOWLEDGEMENTS
This is an extended assessment of the profitability of rubber agroforestry system that was previously
carried out in 1997, under Alternatives to Slash and Burn programme, and been recalculated and
updated in 2009. The new data on latex and timber production in a range of jungle rubber systems in
Jambi used in the current calculation was provided by Gregoire Vincent of ICRAF/IRD.
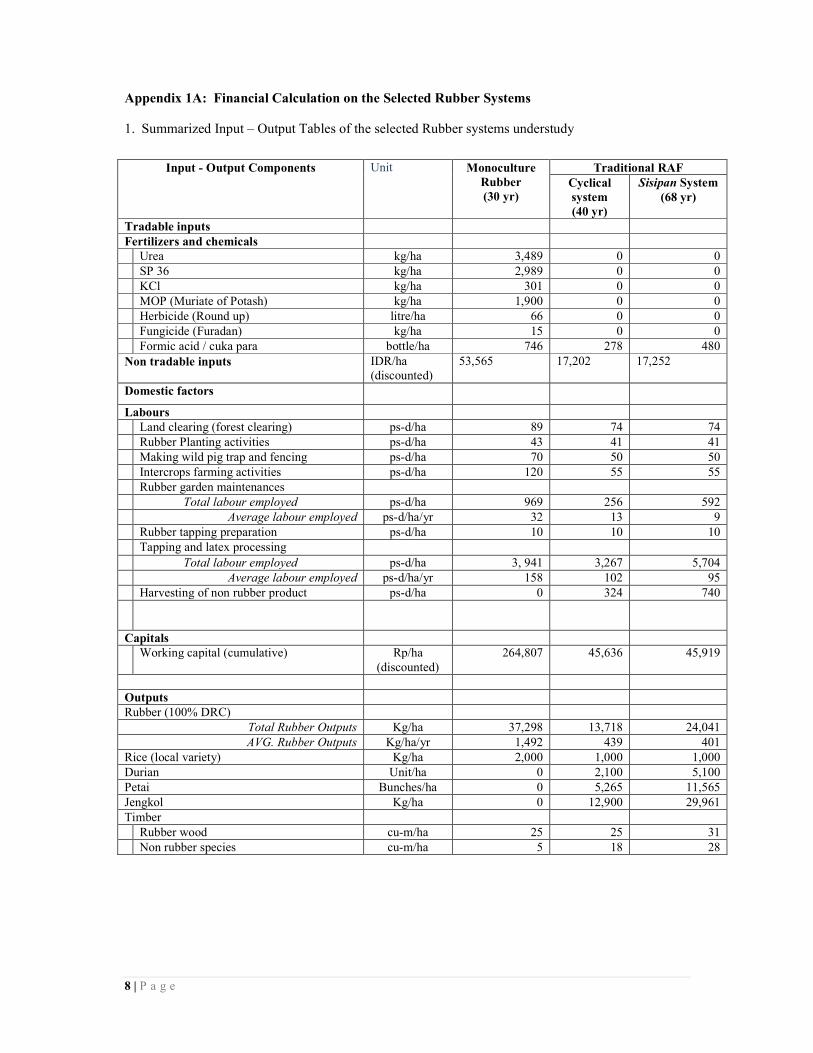
8 | P a g e
Appendix 1A: Financial Calculation on the Selected Rubber Systems
1. Summarized Input – Output Tables of the selected Rubber systems understudy
Input - Output Components Unit Monoculture
Rubber
(30 yr)
Traditional RAF
Cyclical
system
(40 yr)
Sisipan System
(68 yr)
Tradable inputs
Fertilizers and chemicals
Urea kg/ha 3,489 0 0
SP 36 kg/ha 2,989 0 0
KCl kg/ha 301 0 0
MOP (Muriate of Potash) kg/ha 1,900 0 0
Herbicide (Round up) litre/ha 66 0 0
Fungicide (Furadan) kg/ha 15 0 0
Formic acid / cuka para bottle/ha 746 278 480
Non tradable inputs IDR/ha (discounted)
53,565 17,202 17,252
Domestic factors
Labours
Land clearing (forest clearing) ps-d/ha 89 74 74
Rubber Planting activities ps-d/ha 43 41 41
Making wild pig trap and fencing ps-d/ha 70 50 50
Intercrops farming activities ps-d/ha 120 55 55
Rubber garden maintenances
Total labour employed ps-d/ha 969 256 592
Average labour employed ps-d/ha/yr 32 13 9
Rubber tapping preparation ps-d/ha 10 10 10
Tapping and latex processing
Total labour employed ps-d/ha 3, 941 3,267 5,704
Average labour employed ps-d/ha/yr 158 102 95
Harvesting of non rubber product ps-d/ha 0 324 740
Capitals
Working capital (cumulative) Rp/ha
(discounted)
264,807 45,636 45,919
Outputs
Rubber (100% DRC)
Total Rubber Outputs Kg/ha 37,298 13,718 24,041
AVG. Rubber Outputs Kg/ha/yr 1,492 439 401
Rice (local variety) Kg/ha 2,000 1,000 1,000
Durian Unit/ha 0 2,100 5,100
Petai Bunches/ha 0 5,265 11,565
Jengkol Kg/ha 0 12,900 29,961
Timber
Rubber wood cu-m/ha 25 25 31
Non rubber species cu-m/ha 5 18 28
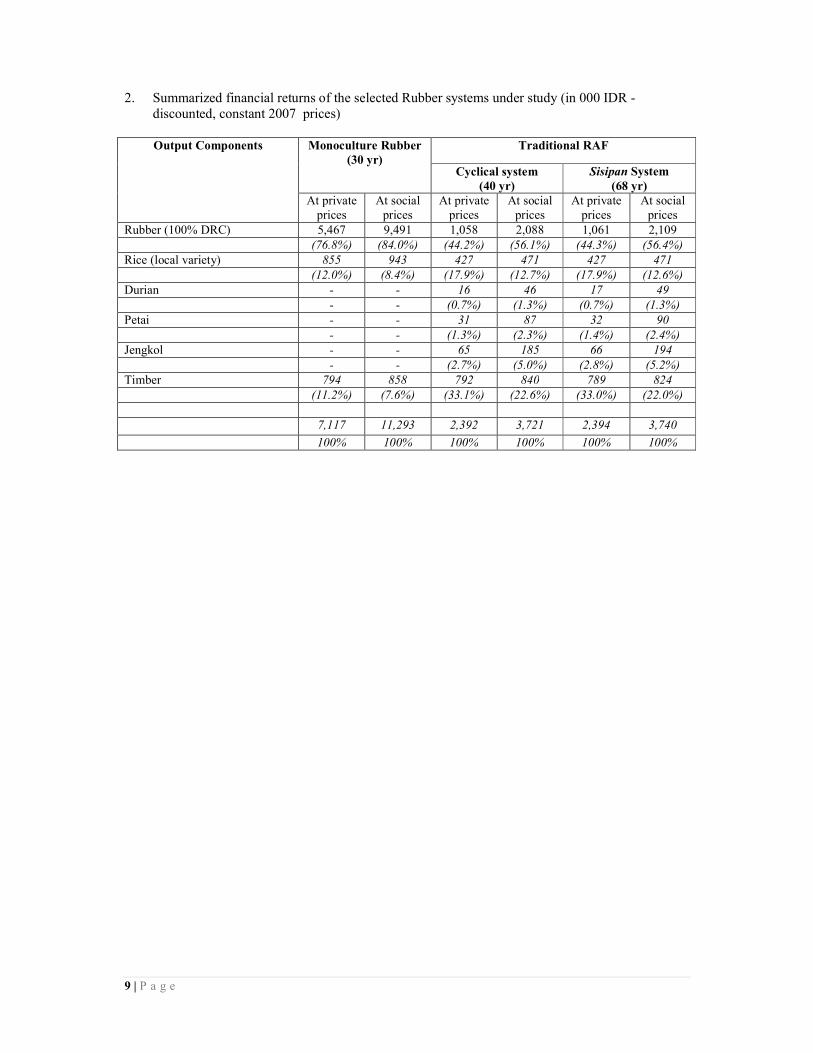
9 | P a g e
2. Summarized financial returns of the selected Rubber systems under study (in 000 IDR - discounted, constant 2007 prices)
Output Components Monoculture Rubber
(30 yr)
Traditional RAF
Cyclical system
(40 yr)
Sisipan System
(68 yr)
At private prices
At social prices
At private prices
At social prices
At private prices
At social prices
Rubber (100% DRC) 5,467 9,491 1,058 2,088 1,061 2,109
(76.8%) (84.0%) (44.2%) (56.1%) (44.3%) (56.4%)
Rice (local variety) 855 943 427 471 427 471
(12.0%) (8.4%) (17.9%) (12.7%) (17.9%) (12.6%)
Durian - - 16 46 17 49
- - (0.7%) (1.3%) (0.7%) (1.3%)
Petai - - 31 87 32 90
- - (1.3%) (2.3%) (1.4%) (2.4%)
Jengkol - - 65 185 66 194
- - (2.7%) (5.0%) (2.8%) (5.2%)
Timber 794 858 792 840 789 824
(11.2%) (7.6%) (33.1%) (22.6%) (33.0%) (22.0%)
7,117 11,293 2,392 3,721 2,394 3,740
100% 100% 100% 100% 100% 100%
10 | P a g e
Appendix 1B: Estimated yields of the selected rubber systems under study
Year Traditional Jungle Rubber Monoculture Rubber
Cyclical System Sisipan system
Gtt1) Total
2) Gtt
1) Total
2) Gtt
1) Total
2)
0
1
2
3
4
5
6 12 430
7 16 984
8 20 1,512
9 11.3 203.9 11.3 203.93 21 1,648
10 13.8 373.1 13.8 373.05 22 1,726
11 15.3 495.4 15.3 495.40 23 1,877
12 15.7 538.6 15.7 538.63 24 1,912
13 15.9 542.5 15.9 542.47 25 1,936
14 16.1 550.1 16.1 550.06 25 1,908
15 16.2 568.4 16.2 568.38 26 1,879
16 16.4 590.7 16.4 590.74 26 1,855
17 16.5 594.6 16.5 594.58 26 1,829
18 16.7 602.2 16.7 602.15 26 1,760
19 16.9 609.6 16.9 609.59 25 1,691
20 17.1 616.9 17.1 616.89 25 1,648
21 17.2 605.0 17.2 604.98 25 1,598
22 17.1 601.5 17.1 601.47 25 1,549
23 16.8 575.6 16.8 575.59 25 1,494
24 16.6 538.5 16.6 538.54 25 1,445
25 16.6 538.5 16.6 538.54 25 1,343
26 16.1 521.1 16.1 521.11 24 1,241
27 15.7 510.3 15.7 510.28 24 1,148
28 15.2 491.6 15.2 491.60 24 1,055
29 14.6 473.8 14.6 473.77 23 959
30 14.1 406.1 14.1 406.07 23 869
31 13.6 367.3 13.6 367.32 21 717
32 13.1 331.1 13.1 331.06 20 620
33 12.7 274.3 12.7 274.28 20 552
34 12.3 243.3 12.3 259.57
35 11.9 214.2 11.9 250.40
36 11.5 186.9 11.5 245.15
37 11.2 161.3 11.2 242.21
38 10.9 147.0 10.9 250.73
39 10.6 133.5 10.6 260.42
40 10.3 111.5 10.3 261.74
41 10.1 264.52
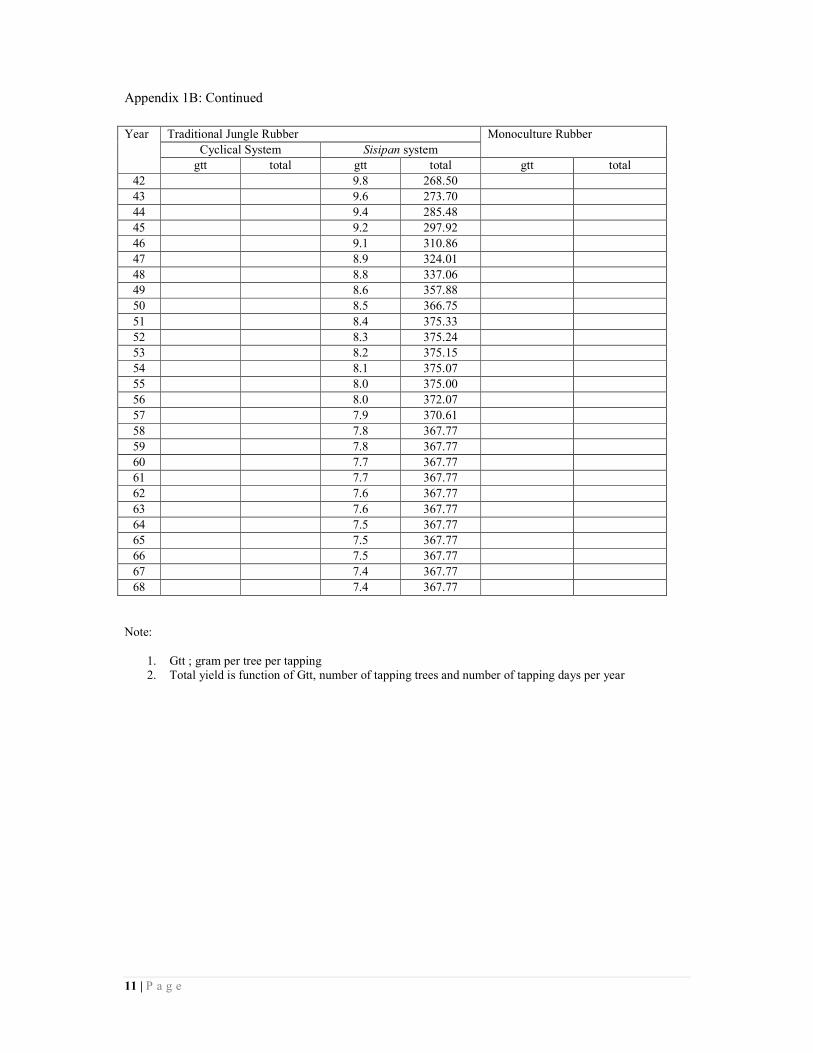
11 | P a g e
Appendix 1B: Continued
Year Traditional Jungle Rubber Monoculture Rubber
Cyclical System Sisipan system
gtt total gtt total gtt total
42 9.8 268.50
43 9.6 273.70
44 9.4 285.48
45 9.2 297.92
46 9.1 310.86
47 8.9 324.01
48 8.8 337.06
49 8.6 357.88
50 8.5 366.75
51 8.4 375.33
52 8.3 375.24
53 8.2 375.15
54 8.1 375.07
55 8.0 375.00
56 8.0 372.07
57 7.9 370.61
58 7.8 367.77
59 7.8 367.77
60 7.7 367.77
61 7.7 367.77
62 7.6 367.77
63 7.6 367.77
64 7.5 367.77
65 7.5 367.77
66 7.5 367.77
67 7.4 367.77
68 7.4 367.77
Note:
1. Gtt ; gram per tree per tapping 2. Total yield is function of Gtt, number of tapping trees and number of tapping days per year
12 | P a g e
APPENDIX 2 AGROFORESTRY AREA UNDER THREATS: DYNAMICS AND TRAJECTORIES OF
RUBBER AGROFOREST IN BUNGO DISTRICT, JAMBI
Andree Ekadinata, M. Thoha Zulkarnain and Atiek Widayati
World Agroforestry Centre (ICRAF), ICRAF Southeast Asia, Indonesia.
INTRODUCTION
Rampant deforestation in Sumatra Island, Indonesia has drawn a lot of attention due to the potential
global impact of the associated carbon stock loss on climate warming and the erosion of biodiversity
(Laumonier, 2010). Laumonier (2010) presented that within only a few decades, the island has lost 12
million ha of forested land at an average rate of 550,000 ha per year. However, various land uses that
replace forest are considered to be able to preserve some of forest ecological functions. Rubber
agroforest, a traditional extensive rubber cultivation system, that has the capacity to support species
diversity in an impoverished landscape currently dominated by monoculture plantation (Rasnovi,
2006; Beukeuma, 2007), while also allowing farmers to make a living out of it. This land use system
unfortunately is also under growing pressure. Evidence from the field shows that rubber agroforest
areas are being replaced by intensive, shorter lived, less environmentally friendly agricultural systems.
ICRAF is currently exploring eco-certification scheme of natural rubber from sustainable rubber
agroforest as an effort to conserve the remaining patches of rubber agroforest in Bungo District,
Jambi. As part of the study, we observed the current dynamics and trajectories of rubber agroforest in
Bungo District over time and space using remote sensing data and spatial analysis. We also analyzed
the potential transition of rubber agroforest by integrating most recent spatial distribution of rubber
agroforest and district’s land use designation and planning. Information on trends and transition
probability can be used to analyze priority location and potential challenges of eco-certification
scheme in the study area. Map of study area presented in Figure 4.

13 | P a g e
Figure 4 Study area in Bungo District, Jambi
MATERIALS
We conducted our study on the basis of time series land-use/cover maps interpreted from satellite
images. Previous study conducted by ICRAF in Bungo has provided collection of land cover maps
from 1973 to 2005. To be able to provide more detailed information on rubber agroforest classes and
the current dynamics, we re-interpreted the last two time series of 2002-2005 and added an
interpretation of satellite images of 2007/08 (Figure 5). Due to different sensors and cloud covers, the
most recent set of images comprises the combination of 2007 and 2008. Table 7 provides the list of
sensors and acquisition dates of satellite images used in this study. Satellite images were selected
using three criteria: appropriate time coverage, spatial resolution and cloud cover.
Table 7 List of satellite image
Sensor/Platform Scene ID Description of data acquisition
Landsat 7/ETM+ 126-061 Acquisition date: May, 24th 2002, 12% cloud cover, pixel size 30m,
Landsat 7/ETM+ 126-061 Acquisition date: May, 7th 2005, 15% cloud cover, pixel size 30m
SPOT 4/XI 272-353 Acquisition date: April, 14th 2007, 10% cloud cover, pixel size 20m
SPOT 4/XI 272-354 Acquisition date: April, 14th 2007, 13% cloud cover, pixel size 20m,
SPOT 4/XI 273-353 Acquisition date: March, 28th 2008, 20% cloud cover, pixel size 20m
SPOT 4/XI 273-354 Acquisition date: September, 24th 2008, 20% cloud cover, pixel size 20m

14 | P a g e
Figure 5 Time series of image satellites
METHODS
Analysis of land use/cover change and trajectories
Analysis of land use/cover changes and trajectories (ALUCT) is a standardised framework used to
understand the land use dynamics over a landscape within a time period based on remotely sensed
data interpretation. ALUCT was applied to study the dynamics and trajectories of rubber agroforest in
Bungo District, Jambi. Before the implementation, it is required to conduct inventories and to define
classes of land use/cover in the study area. The classes are designed such that they are recognizable
from the satellite imageries and they embrace all the dominant land-use/cover types that exist in the
study area. A list of relevant land-use classes was developed through field work in the study area.
ALUCT workflow (Figure 6) can be classified into three stages: (1) image pre-processing, (2) image
classification; and (3) post-interpretation analysis.
The first stage, image pre-processing, aims to rectify geometric distortion in satellite images using
ground control points (GCPs) collected from reference datasets. In this case, orthorectified Landsat
2005 image from the United States Geological Survey (USGS) was used as reference data. We used
20 GCPs in geometric correction; we imposed geometric precision of 0.5 pixel (15 m) for each image.