ecofys- comparison fossil power efficiency · pdf file2.2 energy efficiency of power...
TRANSCRIPT
Wina Graus ([email protected]) Ernst Worrell
August 2006
Ecofys, Utrecht, The Netherlands Project number: PECSNL061867 Commissioned by: Central Research Institute of Electric Power Industry (CRIEPI), Japan
COMPARISON OF EFFICIENCY
FOSSIL POWER GENERATION

2 AUGUST 2006 COMPARISON FOSSIL POWER EFFICIENCY

Summary
The purpose of this study is to compare the energy efficiency of fossil-fired power generation for Australia, China, France, Germany, India, Japan, Nordic countries (Denmark, Finland, Sweden and Norway aggregated), South Korea, United King-dom and Ireland, and United States. This is done by calculating separate benchmark indicators for the energy efficiency of gas-, oil- and coal-fired power generation. These indicators are aggregated to an overall benchmark for fossil-fired power gen-eration. The benchmark indicators are based on deviations from average energy ef-ficiencies. Figure 1 shows the benchmark for the energy-efficiency of fossil-fired power gen-eration. Countries with benchmark indicators above 100% perform better than av-erage and countries below 100% perform worse than the average.
70%
80%
90%
100%
110%
120%
1990 1991 1992 1993 1994 1995 1996 1997 1998 1999 2000 2001 2002 2003
Perc
en
t d
evia
tio
n f
rom
ave
rag
e (
=10
0%
)
Australia
China
France
Germany
India
Japan
Korea
Nordic countries
UK + Ireland
United States
Figure 1 Benchmark for energy-ef f ic iency of foss i l -f ired power production

4 AUGUST 2006 COMPARISON FOSSIL POWER EFFICIENCY
As can be seen in Figure 1, the Nordic countries, Japan and United Kingdom and Ireland perform best in terms of fossil-fired generating efficiency and are respec-tively 8%, 8% and 7% above average in 2003. South Korea and Germany are 6% and 4% above average in 2003 and the United States and France are 2% and 4% be-low average. Australia, China and India perform 7%, 9% and 13% below average. In this study we also look at the effects of NOx and SO2 emissions control on en-ergy efficiency. Pollution abatement technologies can affect the efficiency of power generation, as it leads to increased internal consumption of power (and steam for specific technologies). NOx and SO2 emissions and the level of desulphurisation and denitrification were found to vary widely between the analysed countries. The highest level of desulphurisation and denitrification was found in the countries Ja-pan, Germany, Nordic countries and South Korea. These countries also have the lowest NOx and SO2 emissions per kWh power generated. Limited pollution control was found to be implemented in India and China, resulting in high specific NOx and SO2 emissions. The effect of NOx and SO2 control technologies on generating efficiency was found to consist mainly of power consumption by the installations. The effect on net en-ergy efficiency is around 2% for coal-fired power plants (wet scrubber, SCR and combustion modification) and 1% for gas-fired power plants (SCR and combustion modification). The effect on gross efficiency of SO2 and NOx control is at most 1%, due to loss of boiler efficiency or additional fuel consumption, but probably lower. Note that the efficiencies in this benchmark study are gross efficiencies. We investigated the impact of NOx and SO2 pollution abatement on the net effi-ciency of fossil-fired power generation in the analysed countries. The power use for NOx and SO2 control was estimated to be between 1.2%-1.5% of gross electricity output for countries with high levels of pollution control (Japan, Nordic countries, South Korea and Germany). The effect on net efficiency of NOx and SO2 abatement was found to be between 0-0.6 percent points for the included countries, depending on the abatement level.

Table of contents
1 Introduction 7
2 Methodology 8
2.1 Input data 8 2.2 Energy efficiency of power generation 9 2.3 Benchmark for fossil generation efficiency 10
3 Eff ic iency power generation 13
3.1 Power generation by fossil-fuel sources 14 3.1.1 Fuel mix 14 3.1.2 Power generation 15 3.2 Efficiency of coal-, gas- and oil-fired power generation 17 3.3 Benchmark based on non-weighted average efficiency 24 3.3.1 Benchmark fossil power efficiency (1) 26 3.4 Benchmark based on weighted average efficiency 28 3.4.1 Benchmark fossil power efficiency (2) 30
4 SO2 and NO x emission control 31
4.1 SO2 and NOx control technologies 31 4.1.1 SO2 control 32 4.1.2 NOx control 33 4.2 Emission control technologies applied 35 4.2.1 Coal-fired power plants 36 4.2.2 Gas-fired power plants 38 4.2.3 Oil-fired power plants 39 4.3 Specific SO2 and NOx emissions 40 4.3.1 Emission limits 44 4.4 Effect of SO2 and NOx control on efficiency 46
5 Conclusions 53

6 AUGUST 2006 COMPARISON FOSSIL POWER EFFICIENCY
References 55
Appendix I: Comparison IEA statistics to
national statistics 60
Australia 60 China 60 France 61 Germany 61 India 62 Japan 63 Nordic countries 64 South Korea 65 United Kingdom and Ireland 66 United States 67 Results energy efficiency analysis 70
Appendix II: Input data 72
Power generation 73 Fuel input 74 Heat output 75 Benchmark indicators 76 NOx and SO2 pollution control 78
Appendix III: IEA defini t ions 80

1 Introduction
This study is an update of the analysis “Updated comparison of power efficiency on grid level” (Graus and Voogt, 2005). This analysis aims to compare the fossil-fired power generation efficiency (coal, oil and gas) for Australia, China1, France, Germany, India, Japan, Nordic countries (Denmark, Finland, Sweden and Norway aggregated), South Korea, United King-dom and Ireland, and United States. This selection of countries and regions is based on discussions with the client. United Kingdom and Ireland, and the Nordic coun-tries are aggregated, because of the interconnection between their electricity grids. Although all electricity grids in Europe are interconnected, there are a number of markets that operate fairly independent. These are the Nordic market (Denmark, Finland, Sweden and Norway), the Iberian market (Spain and Portugal), Centrel (Eastern European countries) and United Kingdom and Ireland. The analysis is based on the methodologies described in Phylipsen et al (1998) and applied in Phylipsen et al (2003). Only public power plants are taken into account, including public CHP plants. For the latter a correction for heat extraction has been applied. The methodology for this study is described in Chapter 2. Chapter 3 gives an over-view of the efficiency of fossil-fired power generation. In Chapter 4 we will ex-plore the differences between countries in applied desulphurization and denitrifica-tion technologies and the effect on power generation efficiency. Conclusions are drawn in Chapter 5.
1 Including Hong Kong
8 AUGUST 2006 COMPARISON FOSSIL POWER EFFICIENCY
2 Methodology
This chapter discusses the methodology used to derive the energy efficiency indica-tors as well as the input data used to determine the indicators.
2.1 Input data
This analysis is based on data from IEA Energy Balances edition 2005. The advan-tage of using IEA Energy Balances is its consistency on a number of points: • Energy inputs for power plants are based on net calorific value (NCV)2 • The output of the electricity plants is measured as gross production of electricity
and heat. This is defined as the “electricity production including the auxiliary electricity consumption and losses in transformers at the power station”.
• A distinction is made for electricity production from industrial (decentralised) power plants and public power plants and public combined heat and power (CHP) plants.
In this study we take into account public power plants and public CHP plants3. We distinguish three types of fossil fuel sources: coal and coal products, crude oil and petroleum products and natural gas. For definitions of these types see Appendix III. We will refer to these fuel sources as coal, oil and gas, respectively. As a check, IEA statistics are compared to available national statistics. The results of this are given in Appendix I. In some cases energy efficiencies based on IEA are replaced by energy efficiencies calculated from national statistics. This is done when the efficiencies based on national statistics seem more reliable. Information about the statistics that are used for the analysis can be found in Appendix I.
2 The Net Calorific Value (NCV) or Lower Heating Value (LHV) refers to the quantity of heat
liberated by the complete combustion of a unit of fuel when the water produced is as-
sumed to remain as a vapour and the heat is not recovered. 3 In the terminology of IEA Energy Balances 2005 and following editions this is referred to
as main power producers.

2.2 Energy e f f ic iency of power generat ion
The formula for calculating the energy efficiency of power generation is: E = (P + H*s) / I. Where: • E = Energy efficiency of power generation • P = Power production from public power plants and public CHP plants • H = Heat output from public CHP plants • s = Correction factor between heat and electricity, defined as the reduction in
electricity production per unit of heat extracted • I = Fuel input for public power plants and public CHP plants Heat extraction causes the energy efficiency of electricity generation to decrease although the overall efficiency for heat and electricity production is higher than when the two are generated separately. Therefore, a correction for heat extraction is applied. This correction reflects the amount of electricity production lost per unit of heat extracted from the electricity plant(s). For district heating systems, the substi-tution factors vary between 0.15 and 0.2. In our analysis we have used a value of 0.175. It must be noted that when heat is delivered at higher temperatures (e.g. to industrial processes), the substitution factor can be higher. However, at the mo-ment, the amount of high-temperature heat delivered to industry by public utilities is small in most countries. We estimate that the effect on the average efficiency is not more than an increase of 0.5 percent point4. No corrections are applied for air temperature and cooling method. The efficiency of power plants is influenced by the temperature of the air or cooling water. In gen-eral surface water-cooling leads to a somewhat higher plant efficiency than the use of cooling towers. The cooling methods that can be applied depend on local cir-cumstances, like the availability of abundant surface water and existing regulations. The effect of cooling method on efficiency may be up to 1-2 percent point. Fur-thermore the efficiency of the power plant is affected by the temperature of the cooling medium. The sensitivity to temperature can be in the order of 0.1-0.2 per-cent point per degree. [Phylipsen et al, 1998] The level of pollution control applied can also have impact on the energy effi-ciency. In Chapter 4 we will explore the differences between countries in applied desulphurization and denitrification technologies and try to determine the effect on power generation efficiency. In order to determine the efficiency for power production for a region, we calculate the weighted average efficiency of the countries included in the region.
4 A change of 1 percent point in efficiency here means a change of e.g. 40% to 41%.

10 AUGUST 2006 COMPARISON FOSSIL POWER EFFICIENCY
2.3 Benchmark for foss i l generat ion ef f ic iency
In this analysis we compare the efficiency of fossil-fired power generation across countries and regions. The simple aggregation of coal-, oil- and gas-fired power generation efficiency into one single fossil-fired generation efficiency is not a fair way to compare between countries, as countries with a relatively large share of coal-fired capacity will automatically be disadvantaged. The reason for this is that (technically) the efficiency of gas-fired capacity is generally higher than the effi-ciency of coal-fired capacity5. Therefore we determine separate indicators for gas-, oil- and coal-fired generation efficiencies and aggregate those to a benchmark for fossil-fired generation efficiency, by weighing the indicators by electricity produc-tion. Several possible indicators exist for benchmarking energy-efficiency of power gen-eration. One possible indicator is the comparison of individual countries’ efficien-cies to a predefined best practice efficiency. The difficulty in this method is the definition of best practice efficiency. Best practice efficiency could be based on: • the best performing country in the world or in a region • the best performing plant in the world or in a region • the best practical efficiency possible, by best available technology (BAT). The best practice efficiency differs yearly, which means that back-casting is re-quired to determine best practice efficiencies for historic years. A different method for benchmarking energy-efficiency is the comparison of coun-tries’ efficiencies against average efficiencies. An advantage of this method is the visibility of a countries’ performance against average efficiency. In this study we choose to use this indicator. We compare the efficiency of countries and regions to the average efficiency of the selected countries. The average efficiency is calcu-lated per fuel source and per year and can be either weighted or non-weighted. In the first case the weighted-average efficiency represents the overall energy effi-ciency of the included countries. A disadvantage of this method is that countries with a large installed generating capacity heavily influence the average efficiency while small countries have hardly any influence at all on the average efficiency. On the other hand, when applying non-weighted benchmark indicators, one efficient power plant in a country could influence the average efficiency if absolute power generation in the country is small. In this research we included both methods, to see if this leads to different results.
5 A large share of gas-fired power generation is based on combustion in gas turbines. Be-
cause gas turbines are able to operate at higher temperatures than steam turbines (mostly
used in large-scale coal plants) the efficiency is higher.

The formula for the non-weighted average efficiency for coal (BC1) is given below as an example. The formulas for oil and gas are similar. BC1 = ∑ ECi / n Where: BC1: Benchmark efficiency coal (1). This is the average efficiency of coal-fired
power generation for the selected countries. ECi: Efficiency coal for country or region i (i = 1,…n) n: The number of countries and regions The formula for the weighted average efficiency for coal (BC2) is given below as an example: BC2 = ∑ (PCi + HCi *s)/ ∑ ICi Where: BC2: Benchmark efficiency coal (2). This is the weighted average efficiency of
coal-fired power generation for the selected countries. PCi: Coal-fired power production for country or region i (i = 1,…n) HCi Heat output for country or region i (i = 1,…n) s Correction factor between heat and electricity, defined as the reduction in
electricity production per unit of heat extracted ICi Fuel input for coal-fired power plants for country or region i (i = 1,…n) To determine the performance of a country relative to the benchmark efficiency we divide the efficiency of a country for a certain year by the benchmark efficiency in the same year. The formula of the indicator for the efficiency of coal-fired power is given below as an example: ICi = ECi / BC1 or ICi = ECi / BC2 Where: ICi: Benchmark indicator of the energy-efficiency of coal-fired power genera-
tion for country or region i Countries that perform better than average for a certain year show numbers above 100% and vice versa. To come to an overall comparison for fossil-fired power efficiency we calculate the output-weighted average of the three indicators, as is shown in the formula below: IFi = (ICi * PCi + IGi * PGi + IOi * POi) / (PCi + PGi + POi)
12 AUGUST 2006 COMPARISON FOSSIL POWER EFFICIENCY
Where: IFi, ICi, IGi and IOi = Benchmark indicator for the energy-efficiency of fos-
sil-fired, coal-fired, gas-fired and oil-fired power gen-eration for country or region i
PCi, PGi and POi = Coal-fired, gas-fired and oil-fired power production for country or region i

3 Efficiency power generation
The data presented in this chapter are based on the methodology as specified in Chapter 2. This chapter is structured as follows:
• Section 3.1 shows the fuel mix for electricity generation for the selected countries or regions and the absolute amount of power generation by fuel source.
• Section 3.2 gives energy efficiencies for coal,- gas- and oil-fired power production, including a simple aggregation of fossil-fired power efficiency.
• Section 3.3 and 3.4 provide results of the benchmark analysis. In these two sections benchmark indicators for fossil-fired power efficiency are given, based on non-weighted and weighted average efficiencies, respectively.
The underlying data for the figures in this chapter can be found in Appendix I and in Appendix II. Appendix I shows energy efficiency data and Appendix II gives in-put data for the analysis in terms of power generation, fuel input and heat output and the resulting benchmark efficiencies.

14 AUGUST 2006 COMPARISON FOSSIL POWER EFFICIENCY
3.1 Power generat ion by foss i l - fue l sources
3.1.1 Fuel mix
Figure 2 and Figure 3 show the fuel mix for public electricity production in 2003 based on electricity output.
0
500
1000
1500
2000
2500
3000
3500
4000
United
States
China Japan India Germany France UK + Ireland Nordic
countries
Korea Australia
Ele
ctr
icit
y p
rod
uc
tio
n (
TW
h)
Hydro
Nuclear
Oil
Gas
Coal
Figure 2 Publ ic power generat ion by source in 2003 (IEA, 2005)
0%
10%
20%
30%
40%
50%
60%
70%
80%
90%
100%
Unite
d Sta
tes
Chin
a
Japa
nIn
dia
Ger
man
y
Franc
e
UK +
Irel
and
Nord
ic c
ount
ries
Kor
ea
Aus
tralia
Hydro
Nuclear
Oil
Gas
Coal
Figure 3 Relat ive publ ic power generation by source in 2003 (IEA, 2005)

The share of fossil fuels in the overall fuel mix for electricity generation is in gen-eral more than 50-60%. Two exceptions are France, which has a large share of nu-clear power (84%), and the Nordic countries, which use a lot of hydropower (50%). From the fossil fuels, coal is most frequently used in all countries and regions, ex-cept for Japan and the United Kingdom and Ireland, for which the share of coal and natural gas are almost equal. The share of oil-fired power generation is limited; only Japan and the United States have larger amounts, in absolute sense. Australia, China and India show a very high share of coal in their overall fuel mix for power generation.
3.1.2 Power generat ion
Figure 4, Figure 5, Figure 6 and Figure 7 show the amount of coal-, gas-, oil- and total fossil-fired power generation respectively in the period 1990-2003, from pub-lic power plants and public CHP plants.
0
500
1000
1500
2000
2500
1990 1991 1992 1993 1994 1995 1996 1997 1998 1999 2000 2001 2002 2003
Ele
ctr
icit
y g
en
era
tio
n (
TW
h) Australia
China
France
Germany
India
Japan
Korea
Nordic countries
UK + Ireland
United States
Figure 4 Coal-f ired power generat ion

16 AUGUST 2006 COMPARISON FOSSIL POWER EFFICIENCY
0
100
200
300
400
500
600
700
1990 1991 1992 1993 1994 1995 1996 1997 1998 1999 2000 2001 2002 2003
Ele
ctr
icit
y g
en
era
tio
n (
TW
h) Australia
China
France
Germany
India
Japan
Korea
Nordic countries
UK + Ireland
United States
Figure 5 Gas-f ired power generat ion
0
50
100
150
200
250
1990 1991 1992 1993 1994 1995 1996 1997 1998 1999 2000 2001 2002 2003
Ele
ctr
icit
y g
en
era
tio
n (
TW
h)
Australia
China
France
Germany
India
Japan
Korea
Nordic countries
UK + Ireland
United States
Figure 6 Oi l-f ired power production

0
500
1000
1500
2000
2500
3000
1990 1991 1992 1993 1994 1995 1996 1997 1998 1999 2000 2001 2002 2003
Ele
ctr
icit
y g
en
era
tio
n (
TW
h) Australia
China
France
Germany
India
Japan
Korea
Nordic countries
UK + Ireland
United States
Figure 7 Fossi l-f ired power production
3.2 Eff ic iency o f coa l- , gas- and o i l - f i red power
generat ion
Figure 8, Figure 9 and Figure 10 show the efficiency trend for coal-, gas- and oil-fired power production, respectively, for the period 1990-2003. Figure 11 shows the energy efficiency of fossil-fired power generation by the weighted-average effi-ciency of gas-, oil- and coal-fired power generation.
23%
25%
27%
29%
31%
33%
35%
37%
39%
41%
43%
1990 1991 1992 1993 1994 1995 1996 1997 1998 1999 2000 2001 2002 2003
Perc
en
tual
eff
icie
ncy
Australia
China
France
Germany
India
Japan
Korea
Nordic countries
UK + Ireland
United States
Figure 8 Ef f ic iency of coal-f ired power production

18 AUGUST 2006 COMPARISON FOSSIL POWER EFFICIENCY
The energy efficiencies for coal-fired power generation range from 30% for India to 42% for Japan in 2003. The average efficiency of the countries is 37% and the weighted average efficiency is 35% in 2003.
20%
25%
30%
35%
40%
45%
50%
55%
1990 1991 1992 1993 1994 1995 1996 1997 1998 1999 2000 2001 2002 2003
Perc
en
tual
eff
icie
ncy
Australia
China
France
Germany
India
Japan
Korea
Nordic countries
UK + Ireland
United States
Figure 9 Ef f ic iency of gas-f ired power production
For gas-fired power generation the efficiencies range from 39% for Australia to 52% for India in 2003. The average efficiency for gas is 46% and the weighted av-erage efficiency is 45% in 2003.
20%
25%
30%
35%
40%
45%
50%
1990 1991 1992 1993 1994 1995 1996 1997 1998 1999 2000 2001 2002 2003
Pe
rce
ntu
al eff
icie
ncy
Australia
China
France
Germany
India
Japan
Korea
Nordic countries
UK + Ireland
United States
Figure 10 Ef f ic iency of oi l -f ired power production

For oil-fired power generation the efficiencies range from 30% for India to 45% for Japan in 2003. The average efficiency for oil is 37% and the weighted average effi-ciency is 38% in 2003.
25%
27%
29%
31%
33%
35%
37%
39%
41%
43%
45%
1990 1991 1992 1993 1994 1995 1996 1997 1998 1999 2000 2001 2002 2003
Perc
en
tual e
ffic
ien
cy
Australia
China
France
Germany
India
Japan
Korea
Nordic countries
UK + Ireland
United States
Figure 11 Weighted average ef f ic iency of foss i l-f ired power production
For overall fossil-fired generation, the efficiencies range from 32% for India to 43% for United Kingdom and Ireland and Japan in 2003. Below is a discussion of the results organised by country. Australia
Total fossil-fired power generation in Australia is 198 TWh in 2003, of which 90% is generated from coal. The energy-efficiency for coal-fired power generation is fairly constant in the pe-riod 1990-2003, at 35%. The energy-efficiency of gas-fired power generation shows a strong peak in 2000 of 52%, possibly due to data unreliability. The energy-efficiency in 2003 is 39%. Gas-fired power generation is 21 TWh in 2003. Oil-fired power generation in Australia is very low, only 1 TWh in 2003.
China
China is the second largest fossil-fired power generator of the included countries and generates 1588 TWh in 2003, of which 97% is generated by coal. The energy efficiency of coal-fired power generation increased from 31% in 1998 to 33% in 2002. Coal-based electricity production increases strongly from 898 TWh in 1998 to 1533 TWh in 2003.
20 AUGUST 2006 COMPARISON FOSSIL POWER EFFICIENCY
Figure 9 shows an increase of efficiency of gas-fired power generation for China from 35% in the period 1990-1995 to 44% in 2003. This is a substantial increase in energy efficiency. Gas-fired power generation increased from 3 TWh in the period 1990-1995 to 13 TWh in 2003. In 1996 the first units of a 2,500 MW Combined Cycle Gas Turbine (CCGT) power plant came online in Hong Kong, all units of the plant were completed in 2004 (Power Technology, 2004). Oil-fired power generation is 41 TWh in 2003. The energy-efficiency of oil-fired power generation is constant in the period 1990-2003, at 34%.
France
Fossil-fired power generation in France is fairly small, only 31 TWh in 2003. This is mainly generated by coal. There is no gas-fired power generation by public power plants in France, according to IEA statistics. Oil-fired power generation is only 4 TWh. The energy-efficiency for coal-fired power plants in France ranges from 35% to 40%. Coal-fired power generation in France shows strong fluctuations year by year ranging from 15 to 31 TWh, and may depend on power production by hydro and nuclear plants (in France electricity demand peaks in winter due to electric heating, and fossil power generation is used to absorb the peak in demand). This means that the capacity factor of coal-fired power plants can vary strongly which generally re-duces energy efficiency.
Germany
Fossil-fired power generation in Germany is 340 TWh in 2003, of which 87% is produced from coal. After the reunification of West and East Germany several lignite power plants were closed. This led to a higher efficiency of coal-fired power generation, from 34% in 1990 to 39% in 2003. The IEA statistics show a 7% lower share of lignite-based power production in 1990 than in the year before. In the period 1990 to 2000, the production of lignite-based electricity decreased by 14%. Hard coal-based power production increased by 25% between 1989 and 2000. In the mid-'90s the natural gas market was liberalised in Germany, leading to more competition and lower gas prices. This resulted in more gas use and a large increase of CHP capacity. This has resulted in a strong increase of efficiency of gas-based power generation from 29% in 1994 to 42% in 2003, as shown in Figure 9. Gas-fired power generation increased from 22 TWh in 1994 to 42 TWh in 2003. Oil-fired power generation in Germany is very small, only 3 TWh in 2003.

India
Fossil-fired power generation in India is 468 TWh in 2003, of which 84% is pro-duced from coal. Total coal-fired capacity in India, excluding auto-producers, is 62 GW in 2002 (TERI, 2004). The energy efficiency for coal-fired power generation is low, 30%. Some reasons for this may be (IEA, 2003b):
• The coal is unwashed. • Indian coal has a high ash content of 30% to 55%. • Coal-fired capacity is used for peak load power generation as well as base
load power generation. The energy efficiency for gas-fired power generation is high, 52% in 2002. Gas-fired capacity in India is about 11 GW in 2002 (TERI, 2004). Gas-fired power plants in India are fairly new and all built in the last 15 years. Gas-fired power gen-eration increased from 1990 to 2003 from 8 TWh to 58 TWh. Many gas-fired power plants in India use CCGT technology (IEA, 2003b). Oil-fired power generation is 16 TWh in India in 2003. Remarkable is that the cal-culated efficiency for oil-fired power generation is exactly 30% for all years. This indicates that the fuel input is back-calculated from an assumed efficiency of 30%. The reliability of the data for oil-fired power generation is therefore limited. Be-cause oil only generates 4% of total fossil-fired power generation in India, this does not influence the overall figures for energy efficiency of fossil-fired power genera-tion much. Japan
Japan is the third largest fossil-fired power producer of the included countries with 578 TWh in 2003. Of this amount, 244 TWh is generated by gas, 243 TWh by coal and 91 TWh by oil. Figure 4 shows an increase of coal-fired power generation in Japan from 97 TWh in 1990 to 243 TWh in 2003. The energy efficiency increases in this period from 39% in 1990 to 42% in 2003. Figure 9 shows an increase of gas-fired generating efficiency in Japan from 42% in 1990 to 44% in 2003. Gas-based electricity generation increased in this period from 161 TWh to 244 TWh, as shown in Figure 5. This is a relatively low efficiency for gas-fired capacity for Japan. It can be explained by the type of technologies used. Out of a total natural gas capacity in 2000 of 56 GW, 20 GW uses CCGT. The re-maining 35 GW capacity is based on conventional steam turbines. Of the latter, 12 GW is dual fuel turbines which use both gas and oil as fuel input. [IEA, 2003a] The Japanese Central Research Institute of the Electric Power Industry (CRIEPI) mentions the followings reason for the large share of conventional steam turbines in gas-fired power plants in Japan:
• Japanese general electric utilities started to implement gas-fired power plants ahead of time in response to the oil crises of the 1970s. In those times gas turbines were not implemented yet on a large scale. As a result, utilities implemented conventional steam turbines based on active electric-

22 AUGUST 2006 COMPARISON FOSSIL POWER EFFICIENCY
ity demand, as they remain now. In the 1990s however, utilities imple-mented combined cycle power plants. Furthermore, utilities will imple-ment More Advanced Combined Cycle (MACC) with 59% (LHV) thermal efficiency, among the world's highest. The first MACC is expected to be online by July 2007.
Oil-fired power generation in Japan decreases from 208 TWh in 1990 to 91 TWh in 2003. The energy–efficiency increases in this period from 42% to 45%.
Nordic countries
Total fossil-fired power generation in the Nordic countries is 80 TWh in 2003. Sweden and Norway both have limited fossil power capacity, and generate together only 7 TWh in 2003. Coal-fired power generation in Finland, Denmark, Sweden and Norway was re-spectively 26, 25, 4 and 0.1 TWh in 2003. The energy efficiency for coal-fired power generation of Nordic countries ranges from 40% to 42% in the period 1990-2003. Gas-fired power generation is only significant in Denmark and Finland, which pro-duce respectively 8 and 12 TWh in 2003. Norway has no gas-fired power genera-tion and Sweden generates only 0.4 TWh in 2003. The energy efficiency of gas-fired power generation is 46% in 2003 for the Nordic countries. The relatively low efficiency in the year 1997 of 41%, may be explained by a lower capacity factor for gas, resulting from an increased output from hydropower plants. Hydropower-based generation in Norway and Sweden was 25 TWh higher in 1997 than in 1996. Gas-fired power production in Finland was 20% less in 1997. Oil-fired power generation is very small, only 2 TWh in Denmark and 2 TWh in Sweden in 2003. South Korea
Total fossil-fired power generation in South Korea is 182 TWh in 2003, of which 120 TWh is generated by coal, 40 TWh by gas and 22 TWh by oil. The energy-efficiency for coal-fired power generation increases strongly from 26% in 1990 to 38% in 2003. Coal-fired power generation increases tenfold in this pe-riod from 12 to 120 TWh. The energy-efficiency of gas-fired power generation increases from 41% to 51% in the period 1990-2003. Gas-fired power generation increases in this period from 10 to 40 TWh. The energy-efficiency of oil-fired power generation increases from 38% in 1990 to 44% in 2003. Oil-fired power generation increases from 19 in 1990 to 42 TWh in 1995. After that oil-fired power generation decreases to 22 TWh in 2003.

United Kingdom and Ireland
Total fossil-fired power generation in the United Kingdom and Ireland is 287 TWh in 2003, of which 142 TWh is generated from coal, 140 TWh from gas and 5 TWh from oil. Due to the liberalisation of the electricity market in the early '90s several less effi-cient coal-fired power plants were closed in the UK, leading to a higher average ef-ficiency of coal-fired power plants. In the following years (1996/1997), lower pro-duction of coal-based electricity was achieved by reducing the load factor of coal-fired power plants, resulting in a decrease of the average efficiency of coal-fired power plants. The energy-efficiency for coal-fired power plants in UK + Ireland is 38% in 2003. As gas prices decreased, gas-fired power generation capacity increased signifi-cantly from 1992 onwards. The large addition of new capacity has resulted in a strong increase of the average efficiency of gas-fired power plants, from 40% in 1990 to 51% in 2003. Gas-fired power generation increased from 4 TWh in 1990 to 140 TWh in 2003. Oil-fired power generation is very low, only 5 TWh in 2003. United States
The United States is the largest fossil-fired power generator of the included coun-tries and generates 2764 TWh in 2003, of which 75% is generated by coal. The energy-efficiency of coal-fired power generation remains fairly constant in the period 1990-2003, and is around 36%. The energy-efficiency of gas-fired power generation increases from 37% in 1990 to 42% in 2003. Electricity generation by gas-fired power plants increases strongly in this period from 283 TWh to 627 TWh. Oil-fired power generation is 121 TWh in 2003. The energy-efficiency of oil-fired power generation is 36%.
24 AUGUST 2006 COMPARISON FOSSIL POWER EFFICIENCY
3.3 Benchmark based on non-weighted average
ef f ic iency
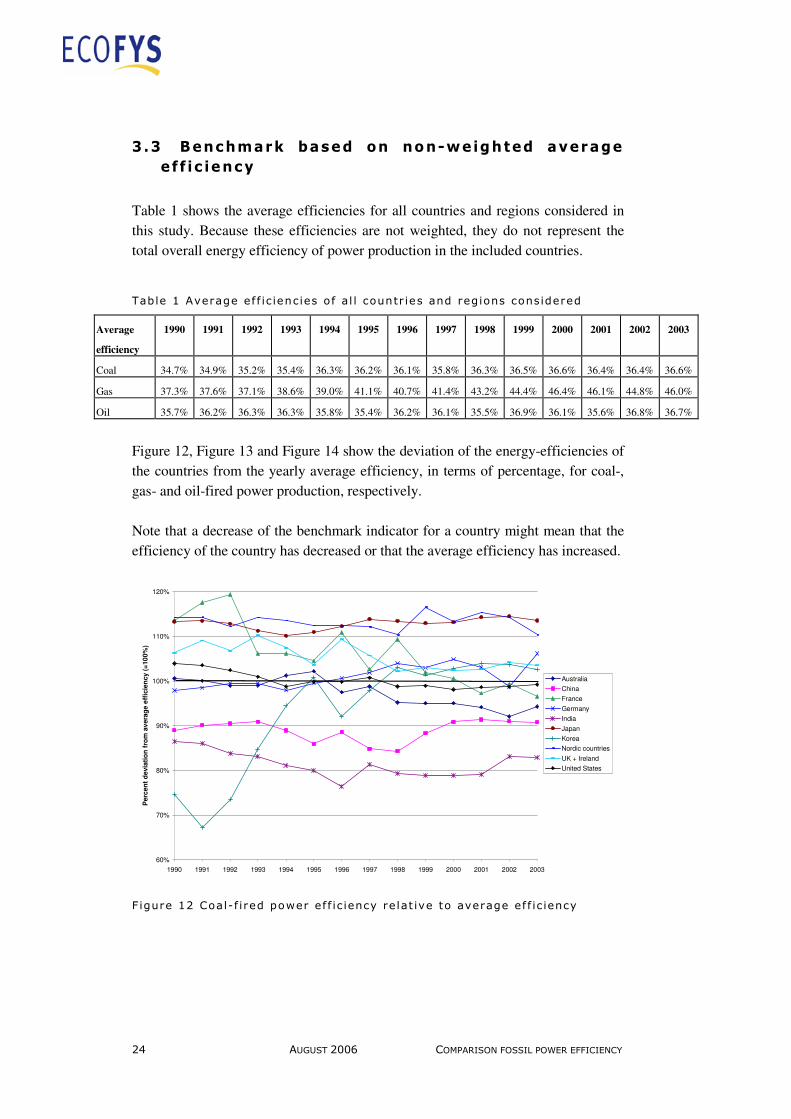
Table 1 shows the average efficiencies for all countries and regions considered in this study. Because these efficiencies are not weighted, they do not represent the total overall energy efficiency of power production in the included countries.
Table 1 Average ef f ic iencies of al l countr ies and regions considered
Average
efficiency
1990 1991 1992 1993 1994 1995 1996 1997 1998 1999 2000 2001 2002 2003
Coal 34.7% 34.9% 35.2% 35.4% 36.3% 36.2% 36.1% 35.8% 36.3% 36.5% 36.6% 36.4% 36.4% 36.6%
Gas 37.3% 37.6% 37.1% 38.6% 39.0% 41.1% 40.7% 41.4% 43.2% 44.4% 46.4% 46.1% 44.8% 46.0%
Oil 35.7% 36.2% 36.3% 36.3% 35.8% 35.4% 36.2% 36.1% 35.5% 36.9% 36.1% 35.6% 36.8% 36.7%
Figure 12, Figure 13 and Figure 14 show the deviation of the energy-efficiencies of the countries from the yearly average efficiency, in terms of percentage, for coal-, gas- and oil-fired power production, respectively. Note that a decrease of the benchmark indicator for a country might mean that the efficiency of the country has decreased or that the average efficiency has increased.
60%
70%
80%
90%
100%
110%
120%
1990 1991 1992 1993 1994 1995 1996 1997 1998 1999 2000 2001 2002 2003
Perc
en
t d
evia
tio
n f
rom
av
era
ge
eff
icie
ncy (
=10
0%
)
Australia
China
France
Germany
India
Japan
Korea
Nordic countries
UK + Ireland
United States
Figure 12 Coal-f ired power ef f ic iency relat ive to average ef f ic iency

60%
70%
80%
90%
100%
110%
120%
130%
1990 1991 1992 1993 1994 1995 1996 1997 1998 1999 2000 2001 2002 2003
Perc
en
tual
devia
tio
n f
rom
ave
rag
e e
ffic
ien
cy (
=10
0%
)
Australia
China
France
Germany
India
Japan
Korea
Nordic countries
UK + Ireland
United States
Figure 13 Gas-f ired power ef f ic iency relat ive to average ef f ic iency
60%
70%
80%
90%
100%
110%
120%
130%
1990 1991 1992 1993 1994 1995 1996 1997 1998 1999 2000 2001 2002 2003
Perc
en
tual d
ev
iati
on
fro
m a
vera
ge e
ffic
ien
cy (
=100
%)
Australia
China
France
Germany
India
Japan
Korea
Nordic countries
UK + Ireland
United States
Figure 14 Oi l-f ired power ef f ic iency relat ive to average ef f ic iency

26 AUGUST 2006 COMPARISON FOSSIL POWER EFFICIENCY
3.3.1 Benchmark foss i l power ef f ic iency (1)
Figure 15 shows the benchmark indicator for the energy efficiency of fossil-fired power production.
70%
80%
90%
100%
110%
120%
1990 1991 1992 1993 1994 1995 1996 1997 1998 1999 2000 2001 2002 2003
Perc
en
t d
evia
tio
n f
rom
ave
rag
e (
=10
0%
)
Australia
China
France
Germany
India
Japan
Korea
Nordic countries
UK + Ireland
United States
Figure 15 Benchmark for energy-ef f ic iency of foss i l-f ired power produc-
t ion (based on non-weighted average ef f ic iencies)
As can be seen in Figure 15, the Nordic countries, Japan and United Kingdom and Ireland perform best in terms of fossil-fired generating efficiency and are respec-tively 8%, 8% and 7% above average in 2003. South Korea and Germany are 6% and 4% above average efficiency in 2003 and the United States and France are 2% and 4% below average. Australia, China and India perform 7%, 9% and 13% below average. The benchmark indicator for Australia decreases from 100% in 1990 to 93% in 2003. This is mainly a result of a fairly constant efficiency for coal-fired power generation while the benchmark efficiency for coal increases from 35% in 1990 to 37% in 2003. The benchmark indicator for China shows a drop from 1995-1999, which results from a lower efficiency for coal-fired power generation of 30% in comparison to 32% before 1995 and 33% after 1999. France shows a decrease of the benchmark indicator for all fuel sources, as can be seen in Figure 12, Figure 13 and Figure 14. This is reflected in the indicator for fos-

sil-fired power efficiency, which decreases in the period 1990-2003 from 112% to 96%. The energy efficiency of fossil-fired power generation decreases from 39%-35% in this period. Germany shows an increase of the benchmark indicator from 96% in 1994 to 104% in 2003. This is mainly caused by an increase of the energy-efficiency of coal-fired power generation from 36% in 1994 to 39% in 2003. In 2002 the benchmark indi-cator equals 97%. This low value is a result of a lower efficiency for coal-fired power generation of 36% in 2002. The trend for India shows a decrease from 85% in 1990 to 79% in 1996, after which there is an increase to 87% in 2003. This drop is caused by a lower coal-fired power efficiency in 1996 of 28% in comparison to 30%. For Japan the benchmark indicator decreases from 116% in 1990 to 108% in 2003. The reason for this is an increase of the average efficiency for gas-fired power pro-duction from 37% to 46%, while the Japanese efficiency for gas-fired capacity in-creases from 42% to 44% in this period. The trend for South Korea shows an increase from 98% in 1990 to 106% in 2003. This is mainly cased by an increase of coal-fired power efficiency from 26% in 1990 to 38% in 2003 and an increase of gas-fired power efficiency from 41% in 1990 to 51% in 2003. For the Nordic countries, the benchmark indicator decreases from 114% in 1990 to 108% in 2003, mainly caused by a relatively lower increase of the efficiencies of coal, oil and gas, in comparison to the benchmark efficiencies. In the United States the energy efficiency for coal-fired power generation remains constant at 36%, while the benchmark efficiency increases from 35% in 1990 to 37% in 2003. This leads to a decreasing benchmark indicator from 103% in 1990 to 98% in 2003. The benchmark indicator for the United Kingdom and Ireland remains fairly con-stant and fluctuates around 108%.

28 AUGUST 2006 COMPARISON FOSSIL POWER EFFICIENCY
3.4 Benchmark based on weighted average ef f i -
c iency
Table 2 shows the weighted average efficiencies for all countries and regions con-sidered in this study.
Table 2 Weighted average ef f ic ienc ies of al l countr ies and regions con-
sidered
Weighted
average
efficiency
1990 1991 1992 1993 1994 1995 1996 1997 1998 1999 2000 2001 2002 2003
Coal 34.7% 34.9% 34.8% 34.8% 34.9% 34.6% 34.6% 34.3% 34.3% 34.8% 35.0% 34.9% 34.9% 35.2%
Gas 38.0% 38.4% 38.5% 39.0% 39.7% 40.5% 41.0% 41.5% 41.9% 42.6% 42.3% 43.1% 43.8% 44.6%
Oil 38.4% 38.5% 38.9% 38.4% 39.1% 38.6% 39.0% 38.5% 37.8% 38.1% 38.5% 37.9% 38.4% 38.3%
Figure 16, Figure 17 and Figure 18 show the deviation of the energy-efficiencies for respectively coal-, gas- and oil-fired power production from the yearly weighted average efficiency, in terms of percentage. Note that a decrease of the benchmark indicator for a country might mean that the efficiency of the country has decreased or that the weighted average efficiency has increased.
65%
75%
85%
95%
105%
115%
125%
1990 1991 1992 1993 1994 1995 1996 1997 1998 1999 2000 2001 2002 2003
Perc
en
tual d
ev
iati
on
fro
m a
vera
ge e
ffic
ien
cy (
=100
%)
Australia
China
France
Germany
India
Japan
Korea
Nordic countries
UK + Ireland
United States
Figure 16 Coal-f ired ef f ic iency relat ive to weighted average ef f ic iency

60%
70%
80%
90%
100%
110%
120%
130%
1990 1991 1992 1993 1994 1995 1996 1997 1998 1999 2000 2001 2002 2003
Pe
rce
nt
dev
iati
on
fro
m a
vera
ge e
ffic
ien
cy (
=100
%)
Australia
China
France
Germany
India
Japan
Korea
Nordic countries
UK + Ireland
United States
Figure 17 Gas-f ired ef f ic iency relat ive to weighted average ef f ic iency
60%
70%
80%
90%
100%
110%
120%
1990 1991 1992 1993 1994 1995 1996 1997 1998 1999 2000 2001 2002 2003
Pe
rce
nt
de
via
tio
n f
rom
avera
ge e
ffic
ien
cy (
=100
%)
Australia
China
France
Germany
India
Japan
Korea
Nordic countries
UK + Ireland
United States
Figure 18 Oi l-f ired ef f ic iency relat ive to weighted average ef f ic iency

30 AUGUST 2006 COMPARISON FOSSIL POWER EFFICIENCY
3.4.1 Benchmark foss i l power ef f ic iency (2)
Figure 19 shows the benchmark indicator for the energy efficiency of fossil-fired power production.
80%
90%
100%
110%
120%
1990 1991 1992 1993 1994 1995 1996 1997 1998 1999 2000 2001 2002 2003
Perc
en
t d
evia
tio
n f
rom
ave
rag
e (
=1
00%
)
Australia
China
France
Germany
India
Japan
Korea
Nordic countries
UK + Ireland
United States
Figure 19 Benchmark for energy-ef f ic iency of foss i l-f ired power produc-
t ion (based on weighted average ef f ic iencies)
The results from the benchmark based on weighted average efficiencies shows that, the Nordic countries, United Kingdom and Ireland, and Japan, perform best in terms of fossil-fired generating efficiency and are respectively 12%, 11% and 10% above average in 2003. South Korea and Germany are 9% and 8% above average efficiency in 2003 and the United States and France are 1% above and 1% below average, respectively. Australia, China and India perform 3%, 6% and 10% below average. Although the exact numbers for the two benchmark approaches; (1) non-weighted and (2) weighted average efficiency, differ, the results in terms of which countries are most efficient, are the same. The benchmark indicators based on weighted aver-age efficiency are higher because the weighted average benchmark efficiencies are lower than the non-weighted average benchmark efficiencies.
4 SO2 and NOx emission control
4.1 Introduct ion
SO2 and NOx control technologies often consume energy and can reduce the overall energy efficiency of a power plant. The level of SO2 and NOx control differs per country, depending e.g. on national emission limits. Countries with high levels of SO2 and NOx control may have lower efficiencies than they would have had if SO2 and NOx control is not applied. In this chapter we will explore the differences between countries in applied desul-phurization and denitrification technologies and the effect on power generation ef-ficiency. First we will give an overview of SO2 and NOx emissions by fuel type and available SO2 and NOx control technologies and their emission reduction potential. For the countries involved we will look at the level of SO2 and NOx control for fossil-fired power generation and NOx and SO2 emissions per kWh electricity generated. We will also give an indication of national emission limits and applicable legislation. Lastly we will look at the effects of desulphurisation and denitrification on the en-ergy efficiency of power generation. The underlying data for the figures in this chapter can be found in Appendix II.
4.2 SO 2 and NO x contro l technologies
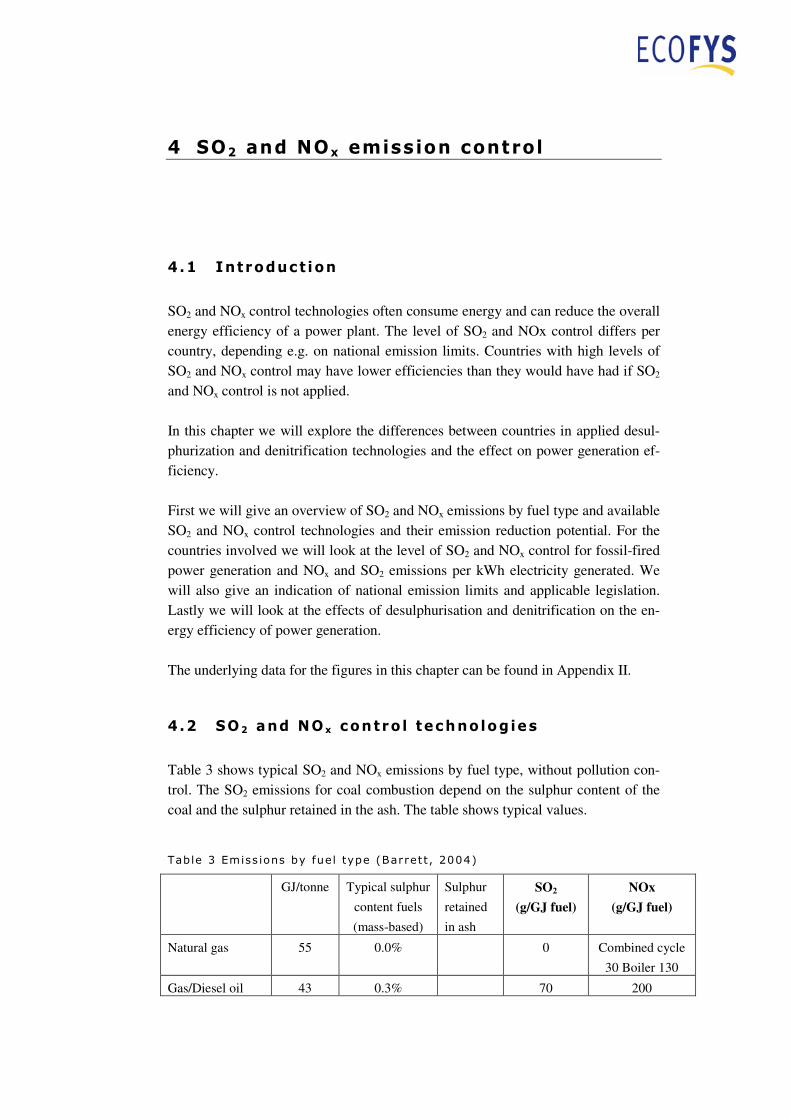
Table 3 shows typical SO2 and NOx emissions by fuel type, without pollution con-trol. The SO2 emissions for coal combustion depend on the sulphur content of the coal and the sulphur retained in the ash. The table shows typical values.
Table 3 Emiss ions by fuel type (Barrett, 2004)
GJ/tonne Typical sulphur
content fuels
(mass-based)
Sulphur
retained
in ash
SO2
(g/GJ fuel)
NOx
(g/GJ fuel)
Natural gas 55 0.0% 0 Combined cycle
30 Boiler 130
Gas/Diesel oil 43 0.3% 70 200

32 AUGUST 2006 COMPARISON FOSSIL POWER EFFICIENCY
GJ/tonne Typical sulphur
content fuels
(mass-based)
Sulphur
retained
in ash
SO2
(g/GJ fuel)
NOx
(g/GJ fuel)
Fuel oil 43 1.5% 350 200
Oil 43 1.0% 230 200
Biomass 10 0.1% 100
Anthracite 29 0.7% 5% 230
Bituminous coal 27 1.1% 5% 390
Lignite 20 1.5% 30% 525
Boiler 540
Fluidised bed 86
Coke 28 0.1% 35
Oil Shale 9 3.0% 80% 670
Peat 10 1.5% 1500
Unabated SO2 emissions are particularly high for coal combustion, typically around 230-525 g/GJ, and highest for lignite. SO2 emission can be lower or higher depend-ing on the sulphur content of the coal. For oil, SO2 emissions are somewhat lower 70-350 g/GJ. NOx emissions from coal are relatively high ~540 g/GJ. For oil this is 200 g/GJ. NOx emissions for natural gas use are lower ~30-130 g/GJ. Natural gas does not contain sulphur so there are no SO2 emissions. Since emission for coal are higher than for natural gas, pollution control is expected to be more often applied in coal-fired power plants. Also the technologies used may be different. For coal-fired power plants, 50-90% of NOx emissions is formed from fuel nitrogen (fuel NOx) and the other part results from combustion of N2 in the air (thermal NOx). For oil combustion fuel NOx can be as high as 50%. For natural gas however, thermal NOx formation, which is highly temperature dependent, is the most relevant source of NOx emissions.
4.2.1 SO 2 contro l
Besides a switch to low-sulphur fuels, there are currently two main types of desul-phurisation equipment: wet scrubbers and dry scrubbers. Other SO2 emission con-trol technologies are sorbent injection and combined NOx and SO2 control. Wet scrubbers are used where SO2 control requirements are most stringent and are the most widely used flue gas desulphurisation (FGD) technology. Calcium-, so-dium- and ammonium-based sorbents are used in a slurry mixture, which is injected into a specially designed vessel to react with the SO2 in the flue gas. The preferred sorbent in operating wet scrubbers is limestone followed by lime. Wet scrubbers can achieve removal efficiencies as high as 99%.
Spray dryer scrubbers are used for applications with less demanding SO2 require-ments. A lime- or sodium-based scrubbing liquor is atomized into the flue gas to absorb the acid gases. Simultaneously, the hot flue gas evaporates the scrubber liq-uor, leaving a dry product for disposal. The reaction products and process ash are then collected by an electrostatic precipitator or fabric filter system. Dry scrubbers are often superior to other designs in terms of cost efficiency, thanks to their sim-plicity and lower capital and maintenance costs. Another option for SO2 control is sorbent injection. There are several types of sor-bent injection, furnace sorbent injection, economiser sorbent injection, duct sorbent injection; and hybrid sorbent injection. The SO2 removal efficiency depends on the design and ranges from 50-80%. Combined SO2/NOx removal processes are fairly complex and costly. However, emerging technologies have the potential to reduce SO2 and NOx emissions for less than the combined cost of conventional flue gas desulphurization (FGD) for SO2 control and selective catalytic reduction (SCR) for NOx control. Most processes are in the development stage, although some processes are commercially used in low to medium-sulphur coal-fired plants [IEA Clean Coal Centre (2006) and ICAC (2006)]. Another measure for reducing SO2 emissions is a switch to low sulphur coal. Rubin (2002) indicates that a disadvantage of shifting to low sulphur coal is increased lev-els of PM emissions (+34%), Hg emissions (+36%) and NOx emissions (+30%). If alternatively SO2 emissions would be removed by wet scrubbing, PM and Hg emis-sions would reduce by 50% and 70%, respectively.
4.2.2 NO x contro l
There are a few basic types of NOx emission controls: advanced combustor design to suppress NOX formation, wet controls using water or steam injection to reduce combustion temperatures, and post-combustion controls (flue gas treatment). Low-NOx burners (LNB) reduce NOx by completing the combustion process in stages. This staging partially delays the combustion process and results in a cooler flame that suppresses thermal NOx formation. For Overfire air (OFA) operation, air ports are installed in addition to existing burners. Burners can then be operated with low excess air, which inhibits NOx for-mation, while the overfire air ensures complete burnout. Part of the flue gases (usually less than 30%) can be recirculated into the combus-tion air. Flue gas recirculation (FGR) results in a reduction of available oxygen in the combustion zone and leads to a decrease of the flame temperature and reduces both fuel-bound nitrogen conversion and thermal NOx formation.

34 AUGUST 2006 COMPARISON FOSSIL POWER EFFICIENCY
The emission reduction from combustion modification can be 20-70%, depending on the technologies applied. [IPPC, 2005] For gas turbines, dry low- NOx combustors (DLNC) can minimize combustion temperatures by providing a lean premixed air/fuel mixture, where air and fuel are mixed before entering the combustor. This minimizes fuel-rich pockets. Dry low-NOX combustors can achieve emission reductions of about 94% (California Air Re-sources Board, 2000). Water or steam injection can be used to reduce NOx emissions from gas turbines and involves the injection of a small amount of water or steam via a nozzle into the immediate vicinity of the combustor burner flame. NOX emissions are reduced by instantaneous cooling of combustion temperatures from the injection of water or steam into the combustion zone. Water injection typically results in a NOX reduc-tion efficiency of about 70%, while steam injection can achieve approximately 80% control (California Air Resources Board, 2000). Post combustion control reduces NOx emissions already formed. They can be im-plemented independently or in combination with primary measures such as a low NOx burner. Post combustion control can be divided into:
• Selective catalytic reduction (SCR) • Selective non catalytic reduction (SNCR)
SCR systems selectively reduce NOx by injecting ammonia (NH3) into the exhaust gas stream upstream of a catalyst. NOx, ammonia, and oxygen react on the surface of the catalyst to form molecular nitrogen (N2) and water. SCR systems typically reduce NOx emissions by 80-95%. A SNCR system is operated without a catalyst and generally reduces NOx emissions by 30-50%. [IPPC, 2005] The SCONOx system uses a catalyst to remove NOx emissions by oxidizing NO to NO2. The NO2 is absorbed onto the catalytic surface using a potassium carbonate (K2CO3) absorber coating. SCONOx can achieve an emission control of more than 95% (California Air Resources Board, 2000).

4.3 Emiss ion contro l techno logies appl ied
In this section we will give an overview of NOx and SO2 control technologies that are applied in the countries observed. Table 4 shows abbreviations used in the fig-ures for the different control technologies.
Table 4 Abbreviat ions
Abbreviations Full name
DLNC (Dry) low NOx combustors
DNOX Unspecified NOx removal equipment
DESOX Unspecified type of SO2 control equipment
EMULS Emulsified fuel oil
FGD Flue gas desulphurization Unspecified type of FGD scrubber
FGR or FR Flue Gas Recirculation
LNB Low-NOx burners
OFA Overfire air
OXI Oxidation catalyst
SCR Selective catalytic reduction
SNCR Selective non-catalytic reduction
SNOX Combined SO2 and NOx control
STM IJ Steam injection
TSC Two-stage combustion
WAT IJ or WI Water injection

36 AUGUST 2006 COMPARISON FOSSIL POWER EFFICIENCY
4.3.1 Coa l- f i red power p lants
Figure 20 shows the level of SO2 control for coal-fired power plants.
0%
10%
20%
30%
40%
50%
60%
70%
80%
90%
100%
Korea
Japan
Ger
man
y
Nord
ic c
ountri
es
UK +
Irela
nd
United S
tate
s
China
Aus
tralia
France
India
Planned FGD
SNOX
Furnace sorbent injection
Control in fluidised bed
Dry scrubber
Wet scrubber
Figure 20 SO2 contro l for coal-f ired power plants units in 2005 (IEACR,
2006)6
As can be seen in Figure 20, wet scrubbing is the most commonly used technology for SO2 control in coal-fired power plants, followed by dry scrubbing. SO2 control is particularly high for South Korea, Japan, Germany and the Nordic countries, and low for China, Australia, France and India. A number of countries use low sulphur fuels to comply with air quality standards. The United States and Australia use for about 50% of coal consumption low sul-phur coal and United Kingdom and Ireland for 66% (Platts, 2006). According to CERES (2004), 31% for coal-fired capacity in the United States is equipped with scrubbers and 69% is unscrubbed but uses low sulphur coal. It is not clear from Platts (2006) and CERES (2004) what the sulphur content of this coal is. Figure 21 shows combustion modification applied for reducing thermal NOx emis-sions in coal-fired power plants.
6 Based on units > 100 MW in operation, including industrial power plants. The share refers
to percentage of units equipped with pollution control device.
0%
10%
20%
30%
40%
50%
60%
70%
80%
90%
100%
Japa
n
Korea
UK +
Irel
and
Ger
many
Nord
ic c
ountri
es
United S
tate
s
Aust
ralia
China
Franc
eIn
dia
LNB
OFA
FGR
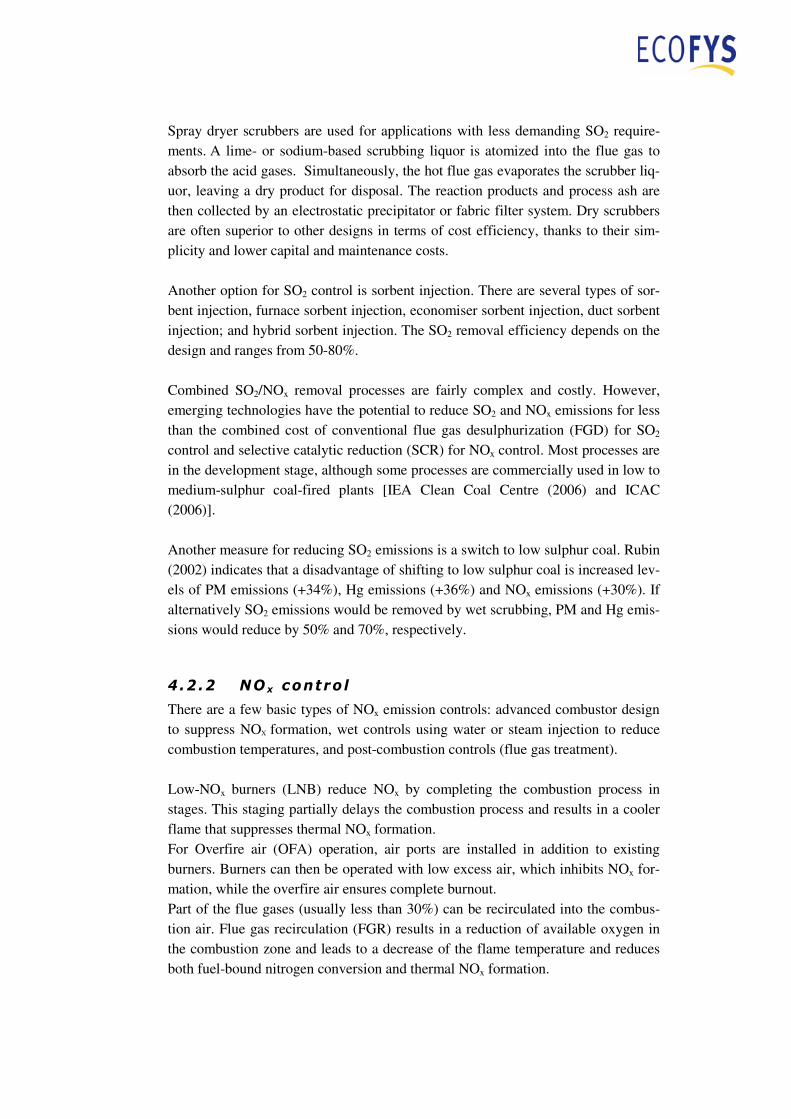
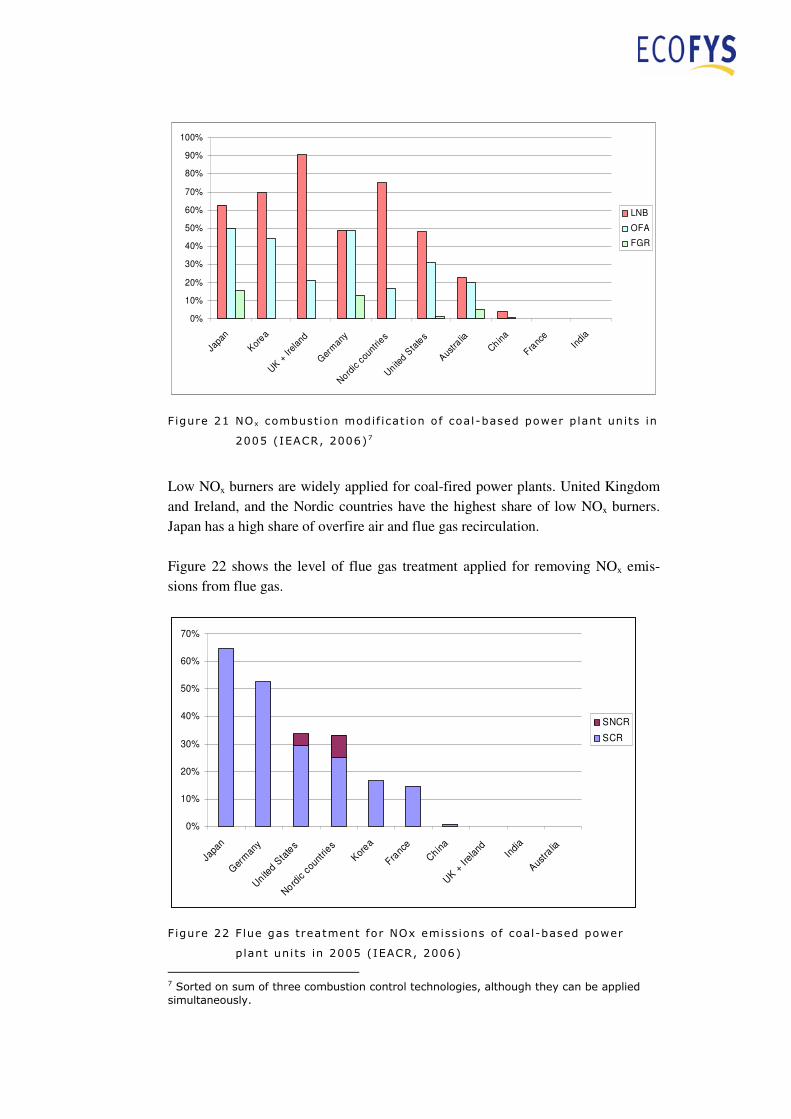
Figure 21 NO x combustion modif icat ion of coal-based power plant units in
2005 (IEACR, 2006)7
Low NOx burners are widely applied for coal-fired power plants. United Kingdom and Ireland, and the Nordic countries have the highest share of low NOx burners. Japan has a high share of overfire air and flue gas recirculation. Figure 22 shows the level of flue gas treatment applied for removing NOx emis-sions from flue gas.
0%
10%
20%
30%
40%
50%
60%
70%
Japa
n
Ger
man
y
Unite
d Sta
tes
Nord
ic c
ount
ries
Kor
ea
Franc
e
Chin
a
UK +
Irel
and
Indi
a
Aus
tralia
SNCR
SCR
Figure 22 F lue gas treatment for NOx emiss ions of coal-based power
plant uni ts in 2005 (IEACR, 2006)
7 Sorted on sum of three combustion control technologies, although they can be applied
simultaneously.

38 AUGUST 2006 COMPARISON FOSSIL POWER EFFICIENCY
SCR is most often applied for flue gas treatment, followed by SNCR which is ap-plied in the United States and Nordic countries. Japan and Germany have the high-est share of installed SCR systems, 65% and 53%, respectively. The differences between countries in terms of SO2 and NOx control applied in coal-fired power plants are large, ranging from 90% to 0% for some technologies. The specific emissions of SO2 and NOx per kWh power generated are therefore ex-pected to differ widely as well.
4.3.2 Gas-f i red power p lants
Figure 23 shows the share of gas-based capacity that is equipped with NOx emis-sion control.
0%
10%
20%
30%
40%
50%
60%
70%
80%
Japan
UK +
Irel
and
Nor
dic
count
ries
Sou
th K
orea
Chi
na
Franc
e
Uni
ted S
tate
s
Ger
many
Indi
a
Aus
tralia
N/A
Other
DNOX
SCR
LNB/SCR
DLNC/SCR
WAT IJ
STM IJ
TSC/FR
LNB/WI
OFA/FGR
LNB/OFA
LNB
DLNC
Figure 23 Share of gas-based capaci ty wi th NO x contro l in 2005 (Plat ts ,
2006)
In general, DLNC (Dry Low NOx Combustors) is the most applied NOx abatement technology for gas-fired power plants. Japan has a high share of SCR and two-stage combustion/flue-gas recirculation. Please note that the data in the figure is taken from Platts (2006). This data source includes the category “Not Applicable (N/A)”, which is used for internal combus-tion plants or older steam-electric power plants with no pollution control. In case

data fields are empty this means information on NOx and SO2 control systems or processes is absent.
4.3.3 Oi l - f i red power p lants
Figure 24 shows the share of oil-based capacity that is equipped with NOx emission control. Note that oil-fired power generation is very small (< 5 TWh) for Australia, Germany, United Kingdom and Ireland, France and the Nordic countries. For oil-fired power generation a lot of data fields give “Not Applicable” (N/A). “Not Applicable” is used for internal combustion plants (engines) or older steam-electric plants with no pollution control (Platts, 2006).
0%
10%
20%
30%
40%
50%
60%
70%
Japan
South K
orea
Germ
any
Nor
dic c
ountri
es
Uni
ted S
tate
sIn
dia
France
Chi
na
Austra
lia
UK +
Irela
nd
N/A
DNOX
SNCR
SCR
WAT IJ
EMULS
TSC/FR
TSC
LNB/OFA
LNB
DLNC
Figure 24 Share of o i l-based capac ity wi th NO x contro l in 2005 (Plat ts ,
2006)
Figure 24 shows that SCR is the most applied NOx abatement technology for oil-fired power plants. The level of SCR is high for South Korea and Japan. Japan has additionally a high share of two-staged combustion in combination with flue gas recirculation. Figure 25 shows the share of oil-based capacity with SO2 control.

40 AUGUST 2006 COMPARISON FOSSIL POWER EFFICIENCY
0%
10%
20%
30%
40%
50%
60%
70%
80%
90%
100%
Ger
man
y
Japa
n
Nor
dic
count
ries
South
Kore
a
Uni
ted
State
s
China
Franc
eIn
dia
Austra
lia
UK +
Irel
and
N/A
In f luidised bed control
FGD
Dry scrubber
Wet scrubber
Figure 25 Share of o i l-based capac ity wi th SO2 contro l in 2005 (Plat ts ,
2006)
Figure 25 shows that wet scrubbers are applied on a limited scale in Germany, Ja-pan and Nordic countries. In general, SO2 control for oil-based capacity seems lim-ited. A number of countries use low sulphur fuels to comply with air quality standards. Low sulphur oil is used in the United Kingdom and Ireland (32% of oil consump-tion), the United States (44% of oil consumption) and Nordic Countries (10% of oil consumption) (Platts, 2006). It is not clear from Platts (2006) what the sulphur con-tent of the oil is.
4.4 Spec i f ic SO 2 and NO x emiss ions
In the previous section we looked at the level of NOx and SO2 control technologies applied. The difference between countries was found to be large. The level of NOx and SO2 control is highest in Japan, South Korea, Germany and the Nordic coun-tries. Some countries (e.g. the Unites States, Australia, United Kingdom and Ire-land) use partly low sulphur fuels to comply with air standards. Pollution control in India and China was found to be limited. In this section we will give an overview of SO2 and NOx emissions per kWh elec-tricity generation based on the OECD Environmental Data Compendium 2004.

Data for India and China are not available from this source and estimates from other sources for India and China are mentioned in the text. Figure 26 shows SO2 emissions per kWh for coal and oil-fired power generation.
0
2
4
6
8
10
12
14
1990 1991 1992 1993 1994 1995 1996 1997 1998 1999 2000 2001 2002
SO
2 e
mis
sio
ns
(g
/kW
h) Australia
France
Germany
Japan
Korea
Nordic countries
UK + Ireland
United States
Figure 26 SO2 emiss ions per kWh for coal- and o i l -f ired power generat ion
(IEA (2005) and OECD (2004))8
Figure 26 shows a strong decrease in SO2 emissions per kWh for many countries, in some cases specific emissions reduce nearly tenfold. The differences between countries in terms of specific SO2 emissions are large ranging from 0.5 to 5.5 g/kWh in 2002 (factor 11). Japan has the lowest specific SO2 emissions, followed by Germany, South Korea (data for 1999) and Nordic countries, respectively 0.5, 0.9, 1.3 and 1.3 g/kWh. The highest level of specific SO2 emissions is 5.5 for the United Kingdom and Ireland and 4.4 for the United States in 2002. For the United Kingdom and Ireland, additional wet scrubbers are planned to be applied to around 30% of coal capacity. Furthermore a number of ex-isting wet scrubbers became operational after 2002. SO2 emissions for the United Kingdom and Ireland are therefore expected to decrease. According to OSC (2006), SO2 emissions from thermal power plants in India are 7.4 g/kWh in 1998. For China, average SO2 emissions from coal-fired power plants are 7.3 g/kWh in 2000, according to Jintian et al. (2002). Based on LBNL (2004)9
8 SO2 emissions from electric power stations taken from OECD (2004) are divided by oil-
and coal-fired electricity generation in public power plants (IEA, 2005). 9 SO2 emissions for electric utilites are divided by by oil- and coal-fired electricity
generation in public power plants (IEA, 2005).
42 AUGUST 2006 COMPARISON FOSSIL POWER EFFICIENCY
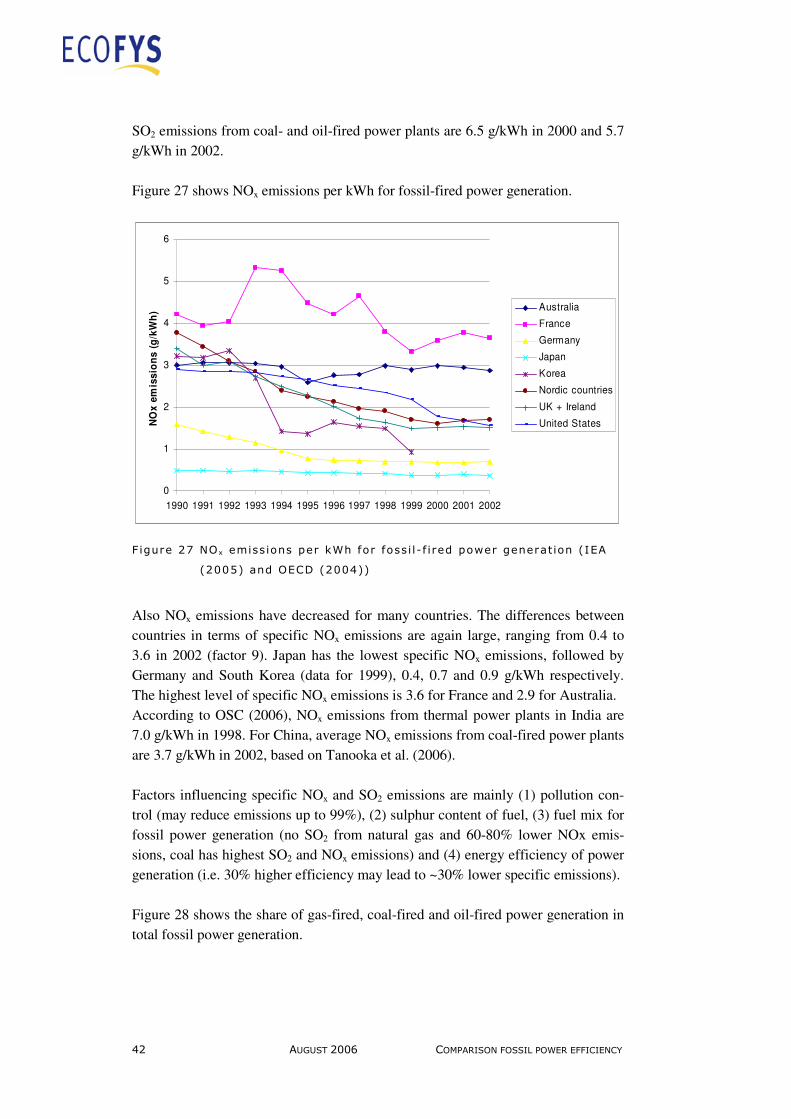
SO2 emissions from coal- and oil-fired power plants are 6.5 g/kWh in 2000 and 5.7 g/kWh in 2002. Figure 27 shows NOx emissions per kWh for fossil-fired power generation.
0
1
2
3
4
5
6
1990 1991 1992 1993 1994 1995 1996 1997 1998 1999 2000 2001 2002
NO
x e
mis
sio
ns
(g
/kW
h) Australia
France
Germany
Japan
Korea
Nordic countries
UK + Ireland
United States
Figure 27 NO x emiss ions per kWh for foss i l-f ired power generation (IEA
(2005) and OECD (2004))
Also NOx emissions have decreased for many countries. The differences between countries in terms of specific NOx emissions are again large, ranging from 0.4 to 3.6 in 2002 (factor 9). Japan has the lowest specific NOx emissions, followed by Germany and South Korea (data for 1999), 0.4, 0.7 and 0.9 g/kWh respectively. The highest level of specific NOx emissions is 3.6 for France and 2.9 for Australia. According to OSC (2006), NOx emissions from thermal power plants in India are 7.0 g/kWh in 1998. For China, average NOx emissions from coal-fired power plants are 3.7 g/kWh in 2002, based on Tanooka et al. (2006). Factors influencing specific NOx and SO2 emissions are mainly (1) pollution con-trol (may reduce emissions up to 99%), (2) sulphur content of fuel, (3) fuel mix for fossil power generation (no SO2 from natural gas and 60-80% lower NOx emis-sions, coal has highest SO2 and NOx emissions) and (4) energy efficiency of power generation (i.e. 30% higher efficiency may lead to ~30% lower specific emissions). Figure 28 shows the share of gas-fired, coal-fired and oil-fired power generation in total fossil power generation.

0%
10%
20%
30%
40%
50%
60%
70%
80%
90%
100%
UK +
Irel
and
Japa
n
Nor
dic coun
tries
Korea
Uni
ted S
tate
s
Germ
anyIn
dia
Austra
lia
China
France
Coal
Oil
Gas
Figure 28 Share gas, o i l and coal in tota l foss i l power generation in 2003
(IEA, 2005)

44 AUGUST 2006 COMPARISON FOSSIL POWER EFFICIENCY
4.4.1 Emiss ion l imits
Table 5 gives an overview of SO2 and NOx emission limits for power plants. In case no emission limits are available a short description is provided of relevant policies in the field of SO2 and NOx emissions of power plants.
Table 5 NO x and SO2 emiss ion l imits for power plants or re lated pol ic ies
SO2 (mg/Nm3) 10
NOx (mg/Nm3)9
European Union [Entec (2005), Barrett (2004)]
EU Large Combustion Plant
Directive (LCPD)
(2001/80/EC)
To be applied from
1 January 2008
Existing plants > 500 MW
400 for solid and liquid fuels
35 for gaseous fuels
Plants built after 2003 >300MW
200 for solid and liquid fuels11
35 for gaseous fuels
Existing plants > 500 MW
500 for solid fuels
400 for liquid fuels
200 for gaseous fuels
Plants built after 2003 >300MW
200 for solid and liquid fuels
100 for gaseous fuels
Germany
300 for solid fuels. In addition plants
have to comply with a sulphur re-
moval rate of at least 85%.
200 for solid fuels
135-150 for gaseous fuels
Finland
- 200 for plants >1000 MWth
United States [Entec (2005), Rubin et al. (2002), Schwarz (2003)]
US Acid Rain Program (cap-
and-trade programme started
in 1995)
Phase two (started in 2000):
1475
490-1060
(depending on boiler type)
Federal New Source Per-
formance Standard (NSPS)
1475 for solid fuels
985 for gas and liquid fuels
615-985 for solid fuels
370-615 for liquid fuels
245-615 for gaseous fuels
(depending on fuel characteristics)
Plants modified after 1997
185
North Carolina Clean
Smokestacks Act12
200 for coal 100-120 for coal
10 Emission limits are given in mg/Nm3. Nm3 refers to the volume (m3) of exhaust gas in
normal conditions (273 °K, 101.3 kPa) after correction for the water vapour content. 11 In case emission limits cannot be met due to fuel characteristics, desulphurisation must
be at least 95% and maximum emissions 400 mg/Nm3. 12 The actual numbers will be different at every facility depending upon facility type, boiler
technology and coal type (Schwarz, 2003).

SO2 (mg/Nm3) 10
NOx (mg/Nm3)9
Japan [World Bank (2001), Ministry of Environment Japan (2006), Tanaka (2000)]
Air Pollution Control Law
The emission limits for sulphur oxide
range from ~170-300013 and vary ac-
cording to geographical location and
height of exhaust stack. Sulphur con-
tent limits for fuels are <0.5-1.2%.
The average sulphur content of the
heavy oil used in Japan was 2.5% in
1967, but by 1992 had dropped to
1.05%.
Large-scale boilers
410-51314 for coal
267-308 for oil
123-205 for gas
(depending on size)
South Korea [Kim and Kim, 1999]
Air Quality Control Law
(1999)
Existing power plants > 500 MW
429-772 for solid fuels
429-515 for liquid fuels
New power plants > 500 MW
343 for solid and liquid fuels
Sulphur content limits for fuels are
<0.1–1.0%, depending on region and
fuel type.
Power plants > 500 MW
718 for solid fuels
513 and 1950 for liquid fuels
820 and 1025 for gas
(upper value is for internal combus-
tion engines)
China
[Battelle Memorial Institute,
1998 and Jintian et al. 2002]
China is attempting to control sulphur
emissions associated with power pro-
duction by implementing flue gas de-
sulphurisation (FGD) facilities.
Government agencies in the power
sector have also made efforts to im-
prove the quality of coal supplies to
reduce pollution. The average sulphur
content in coal supplied to power
plants decreased from 1.2% in 1988
to 1.05% in 1999.
The Chinese government has yet to
develop a specific standard for NOx
emissions for power production,
although the former Ministry of
Electric Power Industry had re-
quested that new thermal power
plants with a unit capacity over 300
megawatts use low NOx emission
technologies.
India
[EIA, 2004b]
The Central Pollution Control Board has been slow to set sulphur dioxide
(SO2) emission limits for coal-fired power plants, mainly because most of
the coal mined in India is low in sulphur content. Coal-fired power plants do
not face any nitrogen oxide (NOx) emissions limits either.
Australia
[EIA, 2002]
Australia does not have specific emission limits for power plants. The rea-
son is that sulphur dioxide, for example, is not a major pollutant, both be-
cause of the low-sulphur nature of Australia's coal and because most power
plants are located at significant distance from urban areas.
13 Converted with 1 ppm = 2.86 mg/Nm3 for SO2 14 Converted with 1 ppm = 2.05 mg/Nm3 for NO2

46 AUGUST 2006 COMPARISON FOSSIL POWER EFFICIENCY
Note that emission standards are mostly set on a fuel input or flue gas output basis. More efficient plants will have lower emissions on a per kWh basis. Input-based emission standards however provide no incentive to reduce emissions by improving the energy-efficiency of power plants. In contrast output-based standards would provide an incentive to do so.
4.5 Effect o f SO 2 and NO x contro l on ef f ic iency
In the previous sections we saw that the level of pollution control and specific SO2 and NOx emissions differ widely per country. In this section we will look at the ef-fects of SO2 and NOx control on power generation efficiency. The impact of SO2 control on power efficiency mainly consists of power consump-tion for the scrubber (i.e. fan and pump). Power consumption for wet scrubbers is around 1-2% of a unit’s generating capacity (ICAC, 2006 and IPCC, 2005). In some cases, flue gas may need to be reheated in order to comply with minimum temperature requirements of exhaust gases. This could lead to another efficiency penalty of 1%. When gas-to-gas heating is used for this, there is no additional effi-ciency penalty (World Bank, 2006). The energy consumption for spray dry scrubbers is lower, around 0.5-1% of a unit’s generating capacity (IPCC, 2005). The power consumption for sorbent injection is around 0.01%-0.2% of a unit’s generating capacity. If furnace sorbent injection is applied, boiler efficiency may drop by 2% (IPCC, 2005). This is not the case with duct sorbent injection. Power consumption for NOx control is ~0.5% of a unit’s generating capacity for SCR and 0.1-0.3% for SNCR (IPCC, 2005). For combustion modification the situation is complex. Rubin (2002) mentions that at some plants, the use of low-NOx burners has been accompanied by an increase in unburned carbon caused by changes in furnace firing conditions. This would reduce the efficiency of the power generation. Flue gas recirculation (FGR) is aimed at reducing peak flame temperature causing reduced thermal NOx emissions. With the reduction in flame temperature, the heat absorption in the radiant section of a boiler furnace is reduced. If the reduction in heat absorption is not recovered in the convection section of the boiler, thermal ef-ficiency reduction will occur. FGR can then cause stack temperature to rise, which

could lead to a reduced boiler efficiency of 0.2%-0.8%15 (COEN, 2006). In addition fan power is required for the recirculation fan. For steam injection, fuel is required to produce the extra steam for injection. NOx combustion control however does not necessarily lead to a lower efficiency. The use of a swirl flash system e.g. can improve efficiency for a simple cycle by 1-2% and have no efficiency penalty in combined cycle modes (Stork, 2005). Swirl flash is a technology which uses hot pressurised water to obtain tiny droplets, which behave like aerosols and are injected in the compressor of a gas turbine. The power output rises by 10-25% and NOx emissions reduce by 25-40% (Liere et al., 2001). A swirl flash system is installed in the Amer power station in the Nether-lands and led to 10-14% rise of power output and 10% increase of fuel input, lead-ing to an energy-efficiency increase of 0-4%. Table 6 gives a summary of the impact of the SO2 and NOx control technologies on the energy efficiency of power generation.
Table 6 Impact SO2 and NO x contro l technology on ef f ic iency power gen-
eration
Power consumption as
share of unit’s generat-
ing capacity
Other effects
SO2 wet scrubbers 1-2% In some cases 1% gross efficiency loss for reheating flue gases
SO2 dry scrubbers 0.5-1% -
SO2 sorbent injec-tion
0.01%-2% 2% drop boiler efficiency for furnace sorbent injection is possible
NOx SCR 0.5% -
NOx SCNR 0.1-0.3% -
NOx combustion modification
Fan power for FGR (<0.5%)
Depending on technology • FGR: 0.2-0.8% reduced boiler
efficiency is possible • Steam injection: fuel consump-
tion for steam production
Table 7 shows the effect of pollution control on net energy efficiency for three fic-tive power plants, based on the power plant model IECM 5.11 (Carnegie Mellon University, 2006).
15 Boiler efficiency loss is 0.0325 times share of FGR (COEN, 2006). Typical amounts of flue
gas recirculation are 5-25% (IPPC, 2006).

48 AUGUST 2006 COMPARISON FOSSIL POWER EFFICIENCY
The effect of pollution control on net energy efficiency includes the electrical out-put required for pumps, compressors and booster fans and the equivalent in electri-cal output of thermal (steam) energy used.
Table 7 Ef fect po l lut ion contro l on net ef f ic iency (IECM model 5.11)
Power consumption
as share of gross out-
put (%)
Power plant Pollution control Net
efficiency
Gross
efficiency
Own con-
sumption
Of which
Pollution
control
No pollution control 36.35% 38.60% 5.9% 0%
NOx combustion control 36.35% - 5.9% Negligible
NOx SCR 36.14% - 6.4% 0.5%
SO2 wet scrubbers 80% removal efficiency
35.63% - 7.7% 1.9%
SO2 wet scrubbers 98% removal efficiency
35.48% - 8.1% 2.2%
Coal-fired power plant steam turbine 500 MW
NOx SCR and SO2 wet scrubbers-98%
35.27% - 9.1% 2.8%
IGCC oxygen-blown 600 MW
In bed SO2 removal 98% Selexol
37.13% 42.40% 12.4% 0.9%
No pollution control 50.15% 51.15% 2.0% 0% Gas-fired power plant gas turbine 330 MW
NOx combustion control 50.15% - 2.0% Negligible
NOx combustion control has in the IECM model a negligible impact on net effi-ciency. Note that the oxygen-blown IGCC has a high share of own power consump-tion of 12.4%. Of this amount, 11.5% is used for the gasifier and the air separation unit. The results in Table 6 and Table 7 combined indicate that the effect on net effi-ciency due to power consumption NOx and SO2 control is around 2% for coal-fired power plants (wet scrubber, SCR and combustion modification) and 1% for gas-fired power plants (SCR and combustion modification). The effect on gross effi-ciency of SO2 and NOx control is at most 1% due to loss of boiler efficiency or ad-ditional fuel consumption, but is probably lower. Note that the efficiencies in this benchmark study are gross efficiencies.

Figure 29 shows the own power consumption in electricity, CHP and heat plants, including auto-producers, as share of total gross power generation in 2003.
0%
1%
2%
3%
4%
5%
6%
7%
8%
9%
10%
Nordic
countries
Japan France Korea UK +
Ireland
United
States
Germany Australia India China
Figure 29 Own power consumption in power and heat p lants as share in
tota l gross power generat ion in 2003 (IEA Extended Energy
Balances 2005)
The difference in own power consumption between countries can be explained by e.g. (1) the fossil-fuel mix for power generation (own power consumption for natu-ral gas plants is lower than for coal plants), (2) the level of pollution control, (3) ef-ficiency of pumps, compressors etc and operation and maintenance and (4) the en-ergy efficiency of power generation. Table 8 shows the level of applied NOx and SO2 control technologies and in the last row an estimate is given of the power consumption.

50 AUGUST 2006 COMPARISON FOSSIL POWER EFFICIENCY
Table 8 Leve l of appl ied NO x and SO2 pol lut ion contro l (excl . p lanned)
Coal Gas Oil
SO2
control
NOx com-
bustion
control
SCR NOx
control
SO2
control
NOx
control
Australia 1% 23% 0% 15% 0% 2%
China 8% 4% 1% 38% 0% 7%
France 0% 0% 15% 32% 0% 8%
Germany 78% 49% 53% 24% 16% 18%
India 0% 0% 0% 15% 0% 10%
Japan 78% 63% 65% 70% 14% 63%
Korea 94% 69% 17% 42% 1% 36%
Nordic countries 75% 75% 25% 44% 7% 16%
UK + Ireland 21% 90% 0% 51% 0% 0%
United States 30% 48% 29% 32% 0% 13%
Power consumption 1.5% 0.5% 0.5% 1% 1.5% 1%
Table 9 shows the gross efficiencies calculated in this study and gives estimates for net efficiency. In the two right-hand columns, the estimated power use for NOx and SO2 control is given as a share of gross power generation and the net efficiency ex-cluding NOx and SO2 control is calculated. The net efficiency refers to net electricity output divided by fuel input, while the gross efficiency refers to gross electricity output divided by fuel input. The differ-ence between gross and net electricity output is the power consumption of a power plant for its own use, including power consumption for pollution control. Please note that the uncertainties in the net efficiency and in the power use for NOx and SO2 pollution control are significant. The share of own power consumption in gross power generation (see Figure 29) refers to total heat and power plants and may not be entirely representative for the fossil-fired power generation share. These results therefore merely aim to show the sensitivity of net efficiencies to NOx and SO2 pollution control.
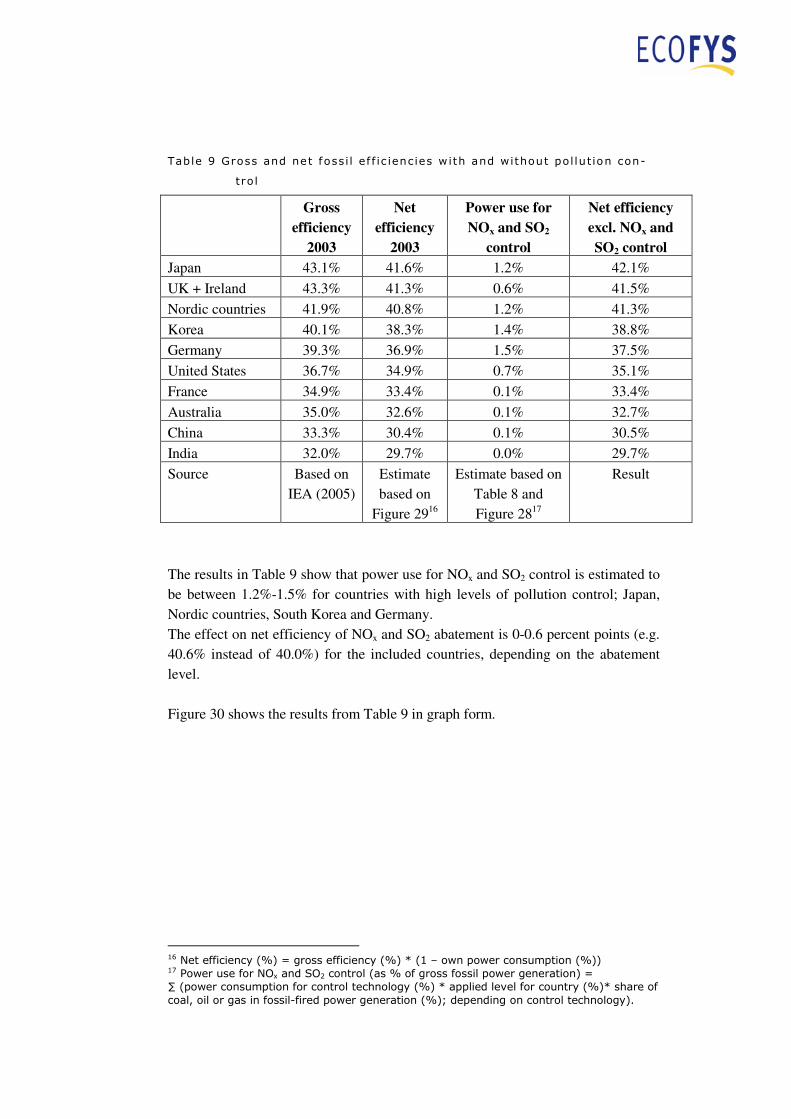
Table 9 Gross and net foss i l ef f ic iencies with and without pol lut ion con-
tro l
Gross
efficiency
2003
Net
efficiency
2003
Power use for
NOx and SO2
control
Net efficiency
excl. NOx and
SO2 control
Japan 43.1% 41.6% 1.2% 42.1%
UK + Ireland 43.3% 41.3% 0.6% 41.5%
Nordic countries 41.9% 40.8% 1.2% 41.3%
Korea 40.1% 38.3% 1.4% 38.8%
Germany 39.3% 36.9% 1.5% 37.5%
United States 36.7% 34.9% 0.7% 35.1%
France 34.9% 33.4% 0.1% 33.4%
Australia 35.0% 32.6% 0.1% 32.7%
China 33.3% 30.4% 0.1% 30.5%
India 32.0% 29.7% 0.0% 29.7%
Source Based on IEA (2005)
Estimate based on
Figure 2916
Estimate based on Table 8 and Figure 2817
Result
The results in Table 9 show that power use for NOx and SO2 control is estimated to be between 1.2%-1.5% for countries with high levels of pollution control; Japan, Nordic countries, South Korea and Germany. The effect on net efficiency of NOx and SO2 abatement is 0-0.6 percent points (e.g. 40.6% instead of 40.0%) for the included countries, depending on the abatement level. Figure 30 shows the results from Table 9 in graph form.
16 Net efficiency (%) = gross efficiency (%) * (1 – own power consumption (%)) 17 Power use for NOx and SO2 control (as % of gross fossil power generation) =
∑ (power consumption for control technology (%) * applied level for country (%)* share of
coal, oil or gas in fossil-fired power generation (%); depending on control technology).
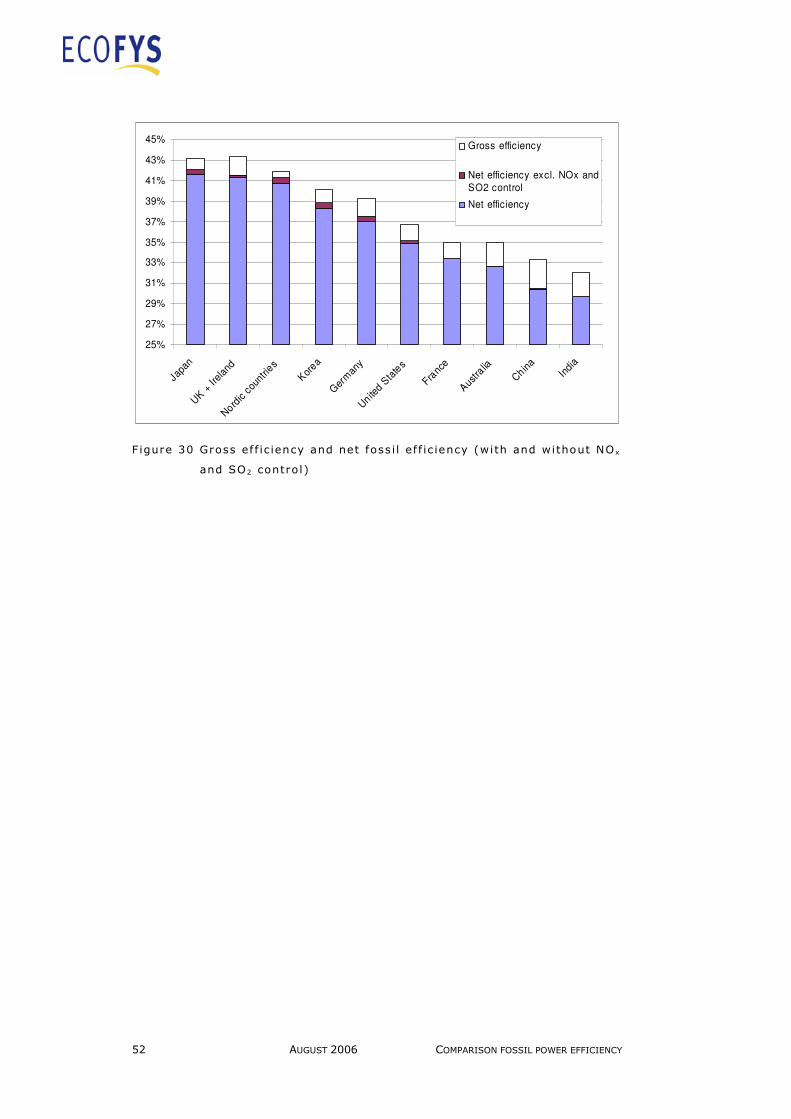
52 AUGUST 2006 COMPARISON FOSSIL POWER EFFICIENCY
25%
27%
29%
31%
33%
35%
37%
39%
41%
43%
45%
Japa
n
UK +
Irel
and
Nord
ic c
ount
ries
Kor
ea
Ger
man
y
Unite
d Sta
tes
Franc
e
Aus
tralia
Chin
aIn
dia
Gross efficiency
Net efficiency excl. NOx and
SO2 control
Net efficiency
Figure 30 Gross ef f ic iency and net foss i l ef f ic iency (with and without NO x
and SO2 contro l)

5 Conclusions
The main purpose of this study is to compare fossil-fired power generation effi-ciency (coal, oil and gas) for Australia, China, France, Germany, India, Japan, Nor-dic countries (Denmark, Finland, Sweden and Norway aggregated), South Korea, United Kingdom and Ireland, and United States. In this study we applied two approaches for benchmarking energy efficiency: (1) by using non-weighted average efficiencies and (2) by using weighted average effi-ciencies by countries’ electricity generation. Although the exact numbers for the two approaches differ, the general results, in terms of which countries are most ef-ficient, are the same. The benchmark indicators in the second approach are higher because the weighted average benchmark efficiencies are lower than the average benchmark efficiencies. The benchmark based on non-weighted average efficiencies, shows that the Nordic countries, Japan and United Kingdom and Ireland perform best in terms of fossil-fired generating efficiency and are respectively 8%, 8% and 7% above average in 2003. South Korea and Germany are 6% and 4% above average efficiency in 2003 and the United States and France are 2% and 4% below average. Australia, China and India perform 7%, 9% and 13% below average. The benchmark based on weighted average efficiencies, shows again that the Nor-dic countries, United Kingdom and Ireland, and Japan, perform best in terms of fossil-fired generating efficiency and are respectively 12%, 11% and 10% above average in 2003. South Korea and Germany are 9% and 8% above average effi-ciency in 2003 and the United States and France are 1% above and 1% below aver-age, respectively. Australia, China and India perform 3%, 6% and 10% below aver-age. Pollution abatement technologies can affect the net efficiency of power generation, as it leads to increased internal consumption of power (and steam for specific tech-nologies). NOx and SO2 emissions and the level of desulphurisation and denitrifica-tion vary widely between the analysed countries. The highest level of desulphurisa-tion and denitrification was found in the countries Japan, Germany, Nordic coun-tries and South Korea. These countries also have the lowest NOx and SO2 emissions per kWh power generated. Limited pollution control was found to be implemented in India and China, resulting in high specific NOx and SO2 emissions. The various countries and regions have varying emission standards, which may also result in varying abatement strategies and technologies. For example, the enactment

54 AUGUST 2006 COMPARISON FOSSIL POWER EFFICIENCY
of the Clean Air Act in the United States has primarily resulted in a shift to low-sulphur coals, and less to abatement technology installation (as it has in e.g. Ger-many and Japan). This affects not only power generation efficiency, but also other air pollutant emissions (e.g. particulate matter and mercury). The effect of NOx and SO2 control technologies on generation efficiency mainly consists of power consumption by the installations. The effect on net energy effi-ciency is around 2% for coal-fired power plants (wet scrubber, SCR and combus-tion modification) and 1% for gas-fired power plants (SCR and combustion modifi-cation). The effect on gross efficiency of SO2 and NOx control is at most 1% due to loss of boiler efficiency or additional fuel consumption, but probably lower. Note that the efficiencies in this benchmark study are gross efficiencies. In this study we investigated the impact of air pollution abatement on the net effi-ciency in the analysed countries. Power use for NOx and SO2 control was estimated to be between 1.2%-1.5% of gross power output for countries with high levels of pollution control (Japan, Nordic countries, South Korea and Germany). The effect on net efficiency of NOx and SO2 abatement was found to be between 0-0.6 percent points for the included countries, depending on the abatement level (see Figure 31).
29%
31%
33%
35%
37%
39%
41%
43%
Japa
n
UK +
Irel
and
Nord
ic c
ount
ries
Kor
ea
Ger
man
y
Unite
d Sta
tes
Franc
e
Aus
tralia
Chin
aIn
dia
Net efficiency excl. NOx and
SO2 control
Net efficiency
Figure 31 Net foss i l ef f ic iency in 2003 (with and without NO x and SO2
contro l)
Note that there are significant uncertainties in available data on the performance of the abatement technology, which may affect the results of this analysis. However, the observed trend and relative magnitude of the impact is unlikely to differ much.
References
• ABARE (2006). Electricity generation. Data from ABARE eReport 05.9 Australian energy: national and state projections to 2029-30. http://www.abareconomics.com/interactive/energy/excel/ELEC_05.xls
• Arbeitsgemeinschaft Energiebilanzen (2005). Auswertungstabellen zur En-ergiebilanz für die Bundesrepublik Deutschland 1990 bis 2004. November 2005. Berlin, Germany. http://www.ag-energiebilanzen.de/18
• Barrett, M. (2004). Atmospheric Emissions from Large Point Sources in Europe SENCO. United Kingdom.
• Battelle Memorial Institute (1998). China's Electric Power Options: An Analysis of Economic and Environmental Costs. Advanced International Studies Unit. Pacific Northwest National Laboratory. Washington, United States. http://www.pnl.gov/aisu/pubs/chinapwr.pdf
• California Air Resources Board (2000). Air Resources Board (ARB) Guid-ance for Power Plant Siting and Best Available Control Technology. United States. http://www.arb.ca.gov/energy/powerpl/appcfin.pdf
• Carnegie Mellon University (2006). IECM version 5.11. Integrated Envi-ronmental Control Model. http://www.netl.doe.gov/technologies/coalpower/ewr/pubs/cmu-iecm.html
• CERES (2004). Benchmarking Air Emissions of the 100 largest electric power producers in the United States – 2002. CERES, NRDC and PSEG. United States.
• COEN (2006). Steam Injection vs. FGR for the Reduction of Thermal NOx. Technical Bulletin #20-103. United States. http://www.coen.com/mrktlit/brochures/pdf/tb20103.pdf
• Danish Energy Authority (2005). Annual Energy Statistics for 2004. Co-penhagen, Denmark. http://www.ens.dk/graphics/UK_Facts_Figures/Statistics/yearly_statistics/Homepage/sp_frameset.htm
• DTI (2006).19 Energy Statistics. Department of Trade and Industry (DTI). United Kingdom. http://www.dti.gov.uk/files/file17421.xls
• EIA (2002). Australia: Environmental Issues. Energy Information Admini-stration (EIA). US Department of Energy (DOE). Washington D.C., United States. http://www.eia.doe.gov/emeu/cabs/ausenv.html
18 Table 2.10.1 and http://www.ag-energiebilanzen.de/daten/str0205w1.pdf
http://www.ag-energiebilanzen.de/daten/vorengl.pdf
http://www.ag-energiebilanzen.de/daten/gesamt.pdf 19 Table 5.6 Electricity fuel use, generation and supply. Data for major power producers.

56 AUGUST 2006 COMPARISON FOSSIL POWER EFFICIENCY
• EIA (2004a) Japan: Environmental Issue. Energy Information Administra-tion (EIA). US Department of Energy (DOE). Washington D.C., United States. http://www.eia.doe.gov/emeu/cabs/japanenv.html
• EIA (2004b). India: Environmental Issues. Energy Information Administra-tion (EIA). US Department of Energy (DOE). Washington D.C., United States. http://www.eia.doe.gov/emeu/cabs/indiaenv.html
• EIA (2005).20 Annual Energy Review 2004. Report No. DOE/EIA-0384(2004). August 15, 2005. Energy Information Administration (EIA). US Department of Energy (DOE). Washington D.C., United States. http://www.eia.doe.gov/aer/elect.html
• Energy Foundation China (2006). http://www.efchina.org/programs.electricutilities.cfm
• Entec (2005). Preparation of the review relating to the Large Combustion Plant Directive A Report for European Commission, Environment Direc-torate General, United Kingdom. http://www.eu.nl/environment/air/pdf/final_report_05225.pdf
• European Commission (2003). European energy and transport – Trends to 2030. Brussels, Belgium. http://europa.eu.int/comm/dgs/energy_transport/figures/trends_2030/1_pref_en.pdf
• Federal Environmental Agency (2005). Berlin, Germany. Common Report-ing Format (CRF), submitted to UNFCCC. Available at: http://unfccc.int/national_reports/annex_i_ghg_inventories/national_inventories_submissions/items/2761.php21
• FirstEnergy Corp. (1999). Measurement Of Net Versus Gross Power Gen-eration For The Allocation Of NOx Emission Allowances. Submitted by FirstEnergy Corp. January 27, 1999. http://www.epa.gov/airmarkets/fednox/feb99/netvgrow.pdf
• Graus, W.H.J. and G.J.M. Phylipsen (2004). Efficiency of power genera-tion, country comparison. Ecofys. Utrecht, The Netherlands.
• Graus, W.H.J. and M. Voogt (2005). Updated comparison of power effi-ciency on grid level. Ecofys. Utrecht, The Netherlands.
• ICAC (2006). Acid Gas/ SO2 Control Technologies. Institute of Clean Air Companies. Washington, United States. http://www.icac.com/i4a/pages/index.cfm?pageid=3401
• INSEE (2005). Institut National de la Statistique et des Études Économi-ques (INSEE). http://www.insee.fr/
20 Table 8.7b Consumption of Combustible Fuels for Electricity Generation and Useful Ther-
mal Output: Electric Power Sector
Table 8.2b Electricity Net Generation: Electric Power Sector, 1949-2004
Table 8.3b Useful Thermal Output at Combined-Heat-and-Power Plants: Electric Power Sec-
tor, 1989-2004 21 Table 1A(a)

• IEA (2005). Energy balances of OECD countries 1960-2003. Energy bal-ances of non-OECD countries 1971-2003. nternational Energy Agency (IEA). Paris, France.
• IEA (2005b). Personal communication with Antonio Di Cecca on 22-07-05 and Yuichiro Torikata on 13-07-05. International Energy Agency (IEA). Paris, France.
• IEA (2003a). World Energy Outlook 2002. International Energy Agency (IEA). Paris, France.
• IEA (2003b). Electricity in India. Providing power for the millions. Interna-tional Energy Agency (IEA). Paris, France.
• IEA (2002). Electricity Statistics 1960-2000. International Energy Agency (IEA). Paris, France.
• IEA Clean Coal Centre (2006). Wet scrubbers for SO2 control. http://www.iea-coal.org.uk/content/default.asp?PageId=87
• IEACR (2006). CleanPower5 database. IEA Clean Coal Centre. United Kingdom.http://www.iea-coal.org.uk/content/default.asp?PageId=60&LanguageId=0
• IPPC (2005). Reference document on Best Available Technology for large combustion plants. Integrated Pollution Prevention and Control (IPPC). Seville, Spain. http://eippcb.jrc.es/pages/FAbout.htm
• Jintian, Y., C.A.O. Dong, G.E. Chazhong and G.A.O. Shuting (2002). Air pollution control strategy for China’s power sector. Chinese Academy for environmental planning. Beijing, China. http://www.cse.polyu.edu.hk/~activi/BAQ2002/BAQ2002_files/Powerpoint/Subworkshop3/sw3a-3Yang_paper.doc.
• KEPCO (2006). Information Center. Statistics. Gross power generation. Fuel Consumption for Generation. http://www.kepco.co.kr/kepco_plaza/en/
• Kim, Eui-Du and Joo-Soo Kim (1999). Air Pollutant Control Strategies for Thermal Power Plants in KEPCO. Korea Electric Power Corporation, South Korea. http://www.netl.doe.gov/publications/proceedings/99/99korea/edkim.pdf
• KOSIS (2006). Fuel consumption for power generation. Gross power gen-eration. http://www.nso.go.kr/eng/index.html
• LBNL (2004). China Energy Databook. Version 6.0. June 2004. China En-ergy Group, Lawrence Berkeley National Laboratory (LBNL). Berkeley, United States.
• Liere, J. van, G.H.M. Laagland and C.G. Meijer (2001) Retrofit of gas tur-bines by SwirlFlash over-spray. Alpha Power Systems and KEMA. Arn-hem, The Netherlands. http://www.alphapowersystems.nl/NewOrleans.pdf
• METI (2004). Overview of Electric Power Supply and Demand 2004. Agency of Natural Resource and Energy; Ministry of Economy, Trade and Industry (METI). Tokyo, Japan.
58 AUGUST 2006 COMPARISON FOSSIL POWER EFFICIENCY
• Ministry of Statistics and Programme Implementation (2006). Energy Sta-tistics 2004/2005. Government of India. http://mospi.nic.in/stat_act_t3_1.htm
• Ministry of Environment Japan (2006). Emission Standards for Soot and Dust, and NOx. Government of Japan. http://www.env.go.jp/en/air/aq/air/air4.html
• Ministry of Environment Republic of Korea (2004). Special Measures for Metropolitan Air Quality Improvement. South Korea. http://eng.me.go.kr/docs/cyber/cyber_view.html?fd_no=1&gubun=QWly&av_pg=1 and http://www.env.go.jp/earth/coop/neac/neac13/symposium/117-130.pdf
• Ministry of Environment Republic of Korea (2006). Major Policies. Air. Overview of Policies & Efforts. South Korea. http://eng.me.go.kr/docs/common/common_view.html?idx=7&av_pg=1&mcode=10&classno=10
• OSC (2006). Anthropogenic Emissions from energy activities in India: Generation and Source Characterization. Emissions from Coal Fired Ther-mal Power Plants in India. United States. http://www.osc.edu/research/pcrm/emissions/thermalemissions.shtml
• Phylipsen, G.J.M., W.H.J. Graus, K. Blok, Y. Hofman, M. Voogt (2003). International Comparisons Of Energy Efficiency - Results For Iron & Steel, Cement And Electricity Generation, Ecofys. Utrecht, The Netherlands.
• Phylipsen, G.J.M. (2000). International Comparisons & National Commit-ments, Analysing energy and technology differences in the climate debate, PhD thesis, april 2000, Utrecht University. Utrecht, The Netherlands.
• Phylipsen, G.J.M. K. Blok and E. Worrell (1998). “Benchmarking the en-ergy efficiency of the Dutch energy-intensive industry”, A preliminary as-sessment of the effect on energy consumption and CO2 emissions, Depart-ment of Science, Technology and Society, Utrecht University. Utrecht, The Netherlands.
• Platts (2006). World Electric Power Plant Database (WEPP). United States. http://www.platts.com/infostore/product_info.php?products_id=85
• Power Technology (2004). Black point CCGT power plant, Hong Kong. http://www.power-technology.com/projects/blackpoint/
• RIETI (2005). Conversion factors from gross calorific value to net calorific value. Research Institute of Economy, Trade and Industry (RIETI). Tokyo, Japan. http://www.rieti.go.jp/users/kainou-kazunari/download/pdf/taro11-x1031ebs_2.pdf
• Rubin, E.S., M.B. Berkenpas and A. Farrell (Center for Energy and Envi-ronmental Studies), G.A. Gibbon and D.N. Smith (National Energy Tech-nology Laboratory, US DOE) (2002). Multi-pollutant emission control of electric power plants. Pitsburgh, United States.
• Schwarz, P.M. (2003). Multiple Pollutant Efficiency Standards for Electric-ity Production. Global Institute of Energy and Environmental Systems, UNC Charlotte and Senior Economist, Research Triangle Institute. United States. http://enviro.colorado.edu/Ws2003/Ws2003/Schwarz.doc
• Statistics Finland (2004). Energy Statistics 2003. Helsinki, Finland. • Stork (2005). SwirlFlash – The power of water. Gas turbine power aug-
mentation and NOx reduction. The Netherlands. http://www.stork.com/thermeq/Downloads/TechnicalServices/STQ/SwirlFlash_folder_E_2005_LR2.pdf
• Tanaka, N. (2000). Air Pollution in Urban Area in Japan. Air Quality Man-agement Division. Environmental Management Bureau. Ministry of the Environment. Japanese Government. http://www.asiairnet.org/publications/pubs/tanakadoc.pdf
• Tonooka, Y., A. Kannari and K. Murano (2005). Emission inventory com-parison: China case in 2002. MICS Asia workshop, IIASA, 2005 February 14-15. http://www.iiasa.ac.at/rains/meetings/7thMICS-Asia/papers/tonooka.pdf
• TERI (2004). TERI Energy Data Directory Yearbook 2003/2004 (TEDDY). New Delhi, India.
• World Bank (2001). Thermal power - guidelines for new plants. http://www.worldbank.or.jp/02event/01seminar/pdf_bs/bs17_material.pdf
• World Bank (2006). Wet Flue Gas Desulfurization (FGD) http://www.worldbank.org/html/fpd/em/power/EA/mitigatn/aqsowet.stm

60 AUGUST 2006 COMPARISON FOSSIL POWER EFFICIENCY
Appendix I: Comparison IEA statistics to
national statistics
In this chapter, energy efficiencies based on IEA Energy Balances 2005 are com-pared to energy efficiencies calculated by available national statistics. We only mention differences between statistics if they are larger than 1%.
Austra l ia
For Australia, energy statistics are available from the Australian Bureau of Agricul-ture and Resource Economics (ABARE, 2006)22. These statistics give details about the input and gross output for total fossil-fired power generation by source for the year 2003/2004. The efficiency for coal-fired power generation in 2003 by IEA (2005) is found to be close to the efficiency from ABARE (2006) for 2003/2004; 34.5% in compari-son to 34.0%. For gas-fired power generation the efficiencies are 39.2%, by IEA and 39.4% by ABARE. The overall efficiency for fossil-fired power generation is nearly the same 35.0% by IEA and 34.7% by ABARE. For oil-fired power genera-tion the efficiency was found to be different, 34.7% by IEA and 36.1% by ABARE. Oil-fired power generation is however very small; only 0.4% of total public power generation. We will use IEA data for the energy efficiency of oil-fired power gen-eration.
China
For China, the energy efficiency of fossil-fired power generation is calculated by the China Energy Databook (LBNL, 2004) for the period 1990-2002. This is the most recent version of the China Energy Databook. For the years 1997-2002 the energy efficiency is found to be the same as the energy efficiency calculated by IEA (2005). When looking in detail at the statistics from LBNL, it is found that the data for fossil-fired electricity generation and fuel input is different for the period 1990-1996. IEA reports ~3%-point higher fossil-fired electricity generation than LBNL (2004). For instance for 1996, the efficiency for fossil power generation based on IEA (2005), is 32% while the efficiency based on LBNL (2004) is 29%. For 2002, the energy efficiency is 33% according to both sources.
22 Conversion factors used for converting from gross calorific value (GCV) to net calorific
value (NCV) are 0.9 for natural gas, 0.93 for oil and 0.97 for coal.

We decide to use IEA data for the whole period, because no data is available from LBNL (2004) on the electricity generation by fuel source. Only the total fossil-fired power generation is available.
France
For France no detailed energy statistics could be found to calculate energy effi-ciency for power generation. Data on electricity production from fossil-fuel sources is available from INSEE (2005), but this data includes electricity generation from auto-producers. Total thermal power generation in 2002 is 50.3 TWh by INSEE in comparison to 27.6 TWh for public power generation given by IEA. A calculation based on European Commission (2003) gives an energy efficiency for fossil-fired power generation in France of 37.9% for 2000 in comparison to 37.1% by IEA (2005). No other detailed energy statistics were available for France, for this study, to look further into this.
Germany
For Germany we looked at the Energiebilanz 2005 from Arbeitsgemeinschaft Ener-giebilanzen (2005). Table 10 shows the results for the energy efficiency for fossil-fired power generation calculated by IEA (2005) and by the Energiebilanz 2005. The data from Arbeitsgemeinschaft Energiebilanzen refer to total electricity genera-tion, including electricity generation by auto-producers. The IEA data refer to pub-lic power generation. Public power generation is 93% of total power generation in Germany in 2003 (IEA, 2005).
Table 10 Energy ef f ic iency fossi l-f ired power generat ion (%)
1990 1991 1992 1993 1994 1995 1996 1997 1998 1999 2000 2001 2002 2003
IEA (2004) 33.6 34.0 34.5 34.6 34.7 36.3 35.2 35.4 37.9 37.6 38.6 37.8 37.0 39.3
Energiebilanz
200423
35.8 36.2 36.5 36.7 36.7 37.1 37.8 38.0 38.6 38.4 38.9 39.0 38.8 39.6
The difference in energy efficiency may be caused by the fact that the fuel input data in Energiebilanz only includes fuel consumption for electricity generation and not for heat generation. The way that Arbeitsgemeinschaft Energiebilanzen attrib-utes fuel consumption of CHP plants to either power generation or heat generation is not clear. Total fuel consumption of public CHP plants in Germany is 15% of to-tal fuel consumption by fossil-fired public power plants in 2003 (IEA, 2005). This could explain the fact that the energy-efficiency found in the Energiebilanz is gen-
23 The efficiency calculated by Energiebilanz is not corrected for heat generation because in
these statistics fuel consumption for heat generation is not included in the fuel input data.

62 AUGUST 2006 COMPARISON FOSSIL POWER EFFICIENCY
erally higher than the IEA values. Since no other detailed energy statistics are available for Germany for this study, we will use IEA (2005) for Germany.
India
For India energy statistics are available from the Ministry of Statistics and Pro-gramme Implementation (MOSPI, 2006). After comparing these statistics to IEA statistics we noticed that thermal power generation in both sources is the same. The oil input in thermal power plants was also found to be the same24. For coal input a difference was found of 10%-12% higher coal input in IEA statistics for the period 1990-2003. We found that the reason for this could be different conversion factors to convert from tonne coal to energy. IEA uses e.g. a conversion factor of 18 GJ/tonne coal for India for 2003, while MOSPI uses a conversion factor of 16.6 GJ/tonne coal based on GCV for 2003 (16.1 GJ/tonne based on NCV, with 0.97 conversion from GCV to NCV). This explains the difference in higher coal input in IEA statistics. TERI (2004) gives even lower values for coal input for power gen-eration than MOSPI (2006); 4.3 PJ versus 4.5 PJ in 2001. IEA gives 5.0 PJ for 2001. In this analysis we will use the fuel input data for coal (corrected to NCV) from MOSPI (2006) to calculate the energy efficiency for coal-fired power genera-tion. Table 11 shows the energy efficiency of coal-fired power generation based on IEA and the energy-efficiency based on fuel input for coal from MOSPI (2006).
Table 11 Energy ef f ic iency of coal-f ired power generat ion (%)
1993 1994 1995 1996 1997 1998 1999 2000 2001 2002 2003
IEA (2005) 26.6 26.6 26.3 25.3 25.6 25.6 25.6 25.7 25.8 26.8 26.8
Fuel input
coal from
MOSPI (2006)
29.4 29.4 29.0 27.6 29.1 28.8 28.8 28.8 28.8 30.3 30.4
For oil- and gas-fired power generation we just use the values from IEA statistics. Natural gas consumption for power generation is not available in MOSPI (2006).
24 Calculation is based on 42.7 MJ/kg for diesel oil and 41 MJ/kg for heavy fuel oil
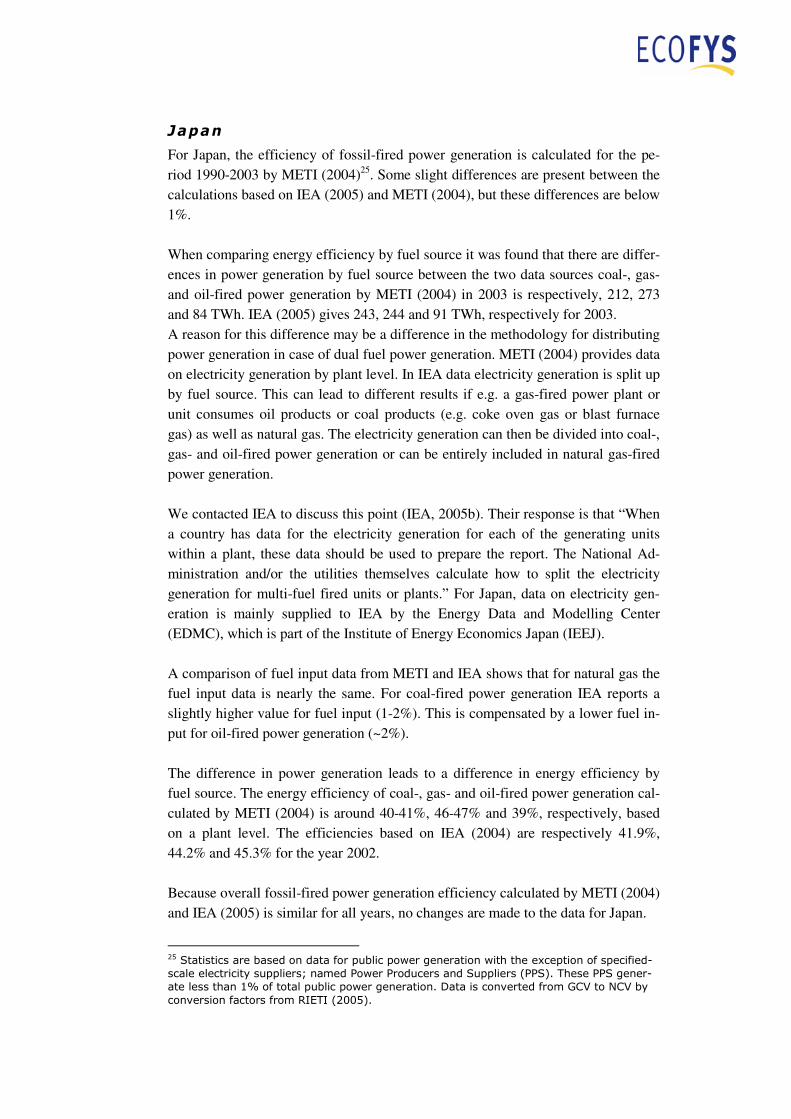
Japan
For Japan, the efficiency of fossil-fired power generation is calculated for the pe-riod 1990-2003 by METI (2004)25. Some slight differences are present between the calculations based on IEA (2005) and METI (2004), but these differences are below 1%. When comparing energy efficiency by fuel source it was found that there are differ-ences in power generation by fuel source between the two data sources coal-, gas- and oil-fired power generation by METI (2004) in 2003 is respectively, 212, 273 and 84 TWh. IEA (2005) gives 243, 244 and 91 TWh, respectively for 2003. A reason for this difference may be a difference in the methodology for distributing power generation in case of dual fuel power generation. METI (2004) provides data on electricity generation by plant level. In IEA data electricity generation is split up by fuel source. This can lead to different results if e.g. a gas-fired power plant or unit consumes oil products or coal products (e.g. coke oven gas or blast furnace gas) as well as natural gas. The electricity generation can then be divided into coal-, gas- and oil-fired power generation or can be entirely included in natural gas-fired power generation. We contacted IEA to discuss this point (IEA, 2005b). Their response is that “When a country has data for the electricity generation for each of the generating units within a plant, these data should be used to prepare the report. The National Ad-ministration and/or the utilities themselves calculate how to split the electricity generation for multi-fuel fired units or plants.” For Japan, data on electricity gen-eration is mainly supplied to IEA by the Energy Data and Modelling Center (EDMC), which is part of the Institute of Energy Economics Japan (IEEJ). A comparison of fuel input data from METI and IEA shows that for natural gas the fuel input data is nearly the same. For coal-fired power generation IEA reports a slightly higher value for fuel input (1-2%). This is compensated by a lower fuel in-put for oil-fired power generation (~2%). The difference in power generation leads to a difference in energy efficiency by fuel source. The energy efficiency of coal-, gas- and oil-fired power generation cal-culated by METI (2004) is around 40-41%, 46-47% and 39%, respectively, based on a plant level. The efficiencies based on IEA (2004) are respectively 41.9%, 44.2% and 45.3% for the year 2002. Because overall fossil-fired power generation efficiency calculated by METI (2004) and IEA (2005) is similar for all years, no changes are made to the data for Japan.
25 Statistics are based on data for public power generation with the exception of specified-
scale electricity suppliers; named Power Producers and Suppliers (PPS). These PPS gener-
ate less than 1% of total public power generation. Data is converted from GCV to NCV by
conversion factors from RIETI (2005).

64 AUGUST 2006 COMPARISON FOSSIL POWER EFFICIENCY
In this way the data are most comparable to the data for the other countries, because they are based on the same methodology.
Nordic countr ies
For the Nordic countries we only compared IEA statistics to national statistics for Denmark and Finland since these countries together generate 87% of the total fos-sil-fired power generation of the Nordic countries in 2002. For Sweden and Norway we will use IEA statistics.
For Denmark, energy statistics are available from the Danish Energy Authority (2005). These statistics give details about total fossil-fired power generation for the period 1990-2004. The efficiency for fossil-fired power plants is for most years equal to the efficiency based on IEA (2005). There are some slight deviations for the year 1998; 42.1% instead of 42.5% by IEA and for 2002; 42.7% instead of 43.3% by IEA. These differences can be caused by the fact that biomass co-firing is included in the Danish Energy Authority’s data. We decided therefore to use IEA data for Denmark for the whole period.
For Finland, IEA statistics are compared to Energy Statistics 2003 (Statistics Finland, 2004). It is difficult to compare these two statistics for a number of rea-sons:
• In Finnish statistics, fuels that are used in combined heat and power pro-duction are divided so that heat is allocated to the amount of fuel required for alternative, separate heat production (at the efficiency ratio of 90%), and power is allocated to the additional fuel required in power production. The fuel consumption for combined heat and power (CHP) plants is there-fore partly included in the “fuel consumption for electricity generation from CHP plants” and partly in the “fuel consumption for district heat and heat from combined heat and power plants”. No further split up is available for the last category.
• In IEA statistics, heat and power production are divided into autoproducer and public power production. The public category includes enterprises whose main business activity is heat and/or power production. The auto-producer category includes enterprises where heat and/or power is pro-duced either partly or entirely for its own use. A corresponding autopro-ducer/public division is not employed in Finnish energy statistics. Electric-ity generated in combined production is separated either into district heat-ing power or industrial process power in Finnish statistics.
• Heat generation in CHP plants is not available by fuel source. This means that heat generation in CHP plants is only given as a total for all CHP plants. Also heat generated by biomass is included in this category. Bio-

mass consists for 13% of the fuel consumption for public CHP plants in 2002 (IEA, 2004).
Especially the first point is a problem, since 35% of fossil-fired power generation in Finland in 2003 is generated in CHP plants (IEA, 2005). In order to compare en-ergy efficiencies, we back-calculated the energy consumption for heat generation by CHP plants26 and added this to the energy input for electricity generation. The results are shown in Table 12.
Table 12 Energy ef f ic iency of foss i l-f ired power generat ion in F inland (%)
1990 1991 1992 1993 1994 1995 1996 1997 1998 1999 2000 2001 2002 2003
IEA (2004) 41.6 41.2 41.7 41.2 41.6 38.5 38.6 37.2 40.0 43.2 42.7 42.9 42.3 40.7
Statistics
Finland (2004)
41.3 41.0 42.1 41.7 41.7 42.0 41.8 42.3 43.5 44.1 43.1 42.0 42.2 41.3
As can be seen in Table 12, the differences in energy efficiency based on these as-sumptions are not so large, except for the period 1995-1999. Because of the mentioned differences in definitions in IEA statistics and Statistics Finland (2004), and the difficulty comparing the two, no changes are made for Finland.
South Korea
For South Korea energy statistics are available from the Korea National Statistical Office (KOSIS, 2006) and from Korea Electric Power Corporation (KEPCO, 2006).27 Table 13 shows energy efficiency by fossil-fired power generation, calculated by both sources.
Table 13 Energy ef f ic iency of foss i l-f ired power generat ion (%)
1993 1994 1995 1996 1997 1998 1999 2000 2001 2002 2003
IEA 37.8 40.3 39.2 39.2 38.0 40.1 38.7 37.8 37.8 42.8 39.7
KOSIS 36.7 38.2 38.3 38.6 38.9 39.3 39.2 39.4 39.9 40.3 40.1
KEPCO 36.0 40.1 40.2 40.1 40.1
26 This is based on 90% efficiency for alternative heat generation. The heat output from
CHP plants is corrected for the input from biomass by subtracting the share of biomass in-
put from total heat generation, in terms of percentage, for all years (IEA, 2005). 27 Conversion factors used for converting from physical units to NCV are 26.6 MJ/tonne an-
thracite, 25.7 MJ/tonne bituminous coal, 41 MJ/kl heavy oil, 34.2 MJ/kl diesel and 49.5
MJ/tonne LNG (based on NCVs for South Korea from IEA and IPCC default values). Heat
generation is not available and is taken from IEA (2005) for natural gas and for total fossil-
fired power generation.
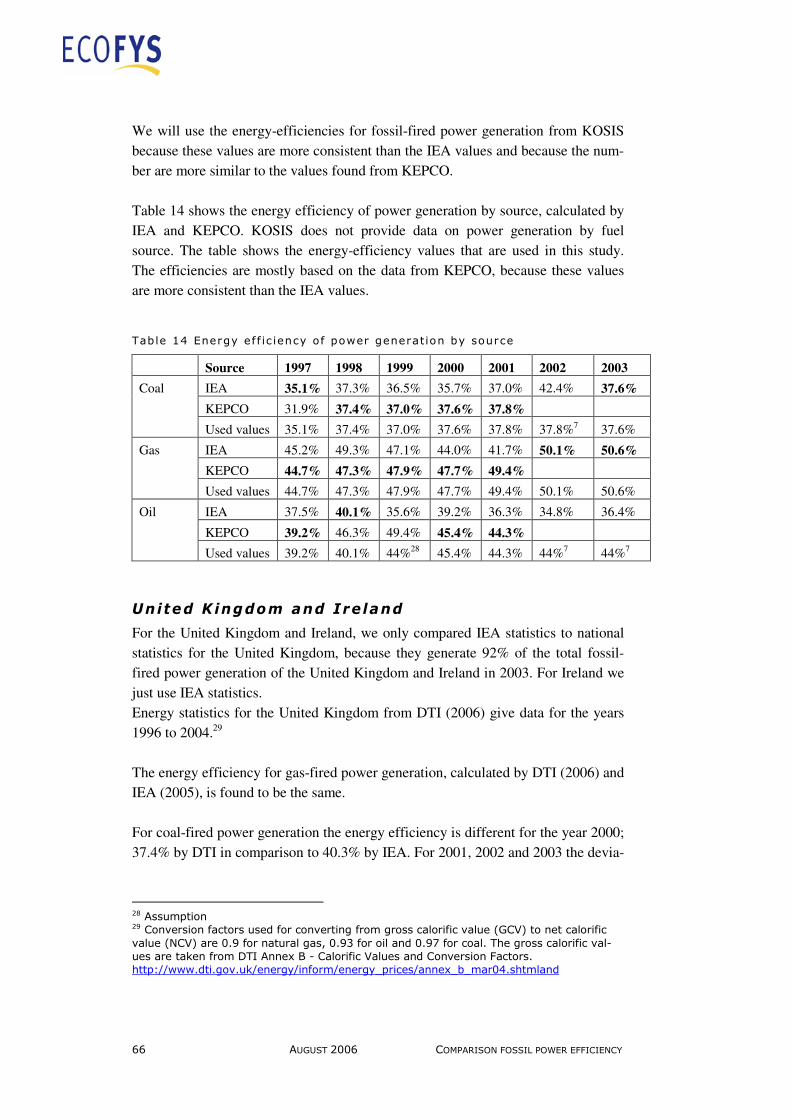
66 AUGUST 2006 COMPARISON FOSSIL POWER EFFICIENCY
We will use the energy-efficiencies for fossil-fired power generation from KOSIS because these values are more consistent than the IEA values and because the num-ber are more similar to the values found from KEPCO. Table 14 shows the energy efficiency of power generation by source, calculated by IEA and KEPCO. KOSIS does not provide data on power generation by fuel source. The table shows the energy-efficiency values that are used in this study. The efficiencies are mostly based on the data from KEPCO, because these values are more consistent than the IEA values.
Table 14 Energy ef f ic iency of power generation by source
Source 1997 1998 1999 2000 2001 2002 2003
IEA 35.1% 37.3% 36.5% 35.7% 37.0% 42.4% 37.6%
KEPCO 31.9% 37.4% 37.0% 37.6% 37.8%
Coal
Used values 35.1% 37.4% 37.0% 37.6% 37.8% 37.8%7 37.6%
IEA 45.2% 49.3% 47.1% 44.0% 41.7% 50.1% 50.6%
KEPCO 44.7% 47.3% 47.9% 47.7% 49.4%
Gas
Used values 44.7% 47.3% 47.9% 47.7% 49.4% 50.1% 50.6%
IEA 37.5% 40.1% 35.6% 39.2% 36.3% 34.8% 36.4%
KEPCO 39.2% 46.3% 49.4% 45.4% 44.3%
Oil
Used values 39.2% 40.1% 44%28 45.4% 44.3% 44%7 44%7
United K ingdom and Ire land
For the United Kingdom and Ireland, we only compared IEA statistics to national statistics for the United Kingdom, because they generate 92% of the total fossil-fired power generation of the United Kingdom and Ireland in 2003. For Ireland we just use IEA statistics. Energy statistics for the United Kingdom from DTI (2006) give data for the years 1996 to 2004.29 The energy efficiency for gas-fired power generation, calculated by DTI (2006) and IEA (2005), is found to be the same. For coal-fired power generation the energy efficiency is different for the year 2000; 37.4% by DTI in comparison to 40.3% by IEA. For 2001, 2002 and 2003 the devia-
28 Assumption 29 Conversion factors used for converting from gross calorific value (GCV) to net calorific
value (NCV) are 0.9 for natural gas, 0.93 for oil and 0.97 for coal. The gross calorific val-
ues are taken from DTI Annex B - Calorific Values and Conversion Factors.
http://www.dti.gov.uk/energy/inform/energy_prices/annex_b_mar04.shtmland

tion is less than 1%. We will use 37.4% for 2000 because this value is more in line with the energy efficiencies for the other years (37.7% in 1999 and 37.3% in 2001). For the period 1996-1999 the energy efficiency was also found to be different; 37% on average by DTI in comparison to 38% on average by IEA. The reason for this is lower input of coal in IEA statistics. This could have something to do with the con-version factor for converting from GCV (used in DTI statistics) to NCV. We will use IEA statistics for the period 1996-1999. The energy-efficiency of oil-fired power generation is much lower according to DTI statistics; around 30% instead of near 60% by IEA. The energy efficiency cal-culated by IEA is too high. Because oil-fired power generation is less than 1% of total fossil-fired power generation in the UK we did not look into this in detail and based the calculations on DTI statistics for the UK. For the energy efficiency of overall fossil-fired power generation the difference is less than 1% for the years 2001 and 2003. For the year 2002 the efficiency based on DTI is 43.7% instead of 44.4% according to IEA data. We will use DTI statistics for the year 2002, because this value is more in line with the energy-efficiency for the other two years (43.2% in 2001 and 43.7% in 2003).
United States
For the United States energy efficiencies are calculated from the Annual Energy Review 2004 (EIA, 2005). A number of differences were found between EIA and IEA data. Some of these dif-ferences may be caused by the fact that EIA reports electricity data in terms of net electricity generation instead of gross electricity generation. The data from EIA are converted to gross electricity generation by a factor of 1.06 for coal, 1.03 for gas and 1.04 for oil30. Table 15 shows energy efficiency by coal-fired power generation, calculated by both sources.
30 Gross electricity generation refers to the electric output of the electrical generator. Net
electricity output refers to the electric output minus the electrical power utilised in the
plant by auxiliary equipment such as pumps, motors and pollution control devices. These
auxiliaries typically utilize 3 to 6% of a plant’s gross output (FirstEnergy Corp., 1999).
Auxiliary consumption is in general higher for coal-fired power plants than for gas-fired
power plants. In this study we use 6% for coal-fired power generation, 3% for gas-fired
power generation and 4% for oil-fired power generation. These values result in figures that
are most consistent with the gross electricity generation figures from IEA (2005).

68 AUGUST 2006 COMPARISON FOSSIL POWER EFFICIENCY
Table 15 Energy ef f ic iency of coal-f ired power generat ion 31
1990 1991 1992-
1999
2000 2001 2002 2003
IEA (2005) 37.2% 37.3% 36% 36.5% 35.0% 35.9% 36.4%
EIA (2005) 36.1% 36.1% 36% 35.9% 35.9% 36.1% 36.2%
Ratio: IEA /
EIA
103% 103% 100% 101% 97% 99% 100%
The energy efficiency for coal-fired power generation differs for the years 1990, 1991, 2000 and 2001. The energy efficiency for these years, based on EIA, is more in line with the energy efficiency for the years 1992-1999 and 2002. Therefore we replace IEA data by EIA data for these years. Table 16 shows energy efficiency by gas-fired power generation, calculated by both sources.
Table 16 Energy ef f ic iency of gas-f ired power generat ion (%)
1992-
1993
1994 1995 1996 1997 1998 1999 2000 2001 2002 2003
IEA (2005) 38.2 38.3 38.0 37.5 37.8 39.6 40.5 41.9 43.1
EIA (2005)
38 39
38.7 39.1 38.6 38.3 38.4 39.0 40.5 42.1 45.4
Ratio: IEA /
EIA
100 100 99 98 98 98 98 102 100 99 95
For gas-fired power generation the difference in energy efficiency between the two sources is less than 1% for the years before 1995. From the period 1995-2000 EIA’s energy efficiency is ~2% higher. We will take EIA data for this period, be-cause this data shows fewer fluctuations. For 2003 we take IEA data.
31 Data from EIA (2005) is based on gross calorific value. This is converted to net calorific
value by a factor of 0.97 for coal, 0.9 for natural gas and 0.93 for oil.

Table 17 shows energy efficiency by oil-fired power generation, calculated by both sources.
Table 17 Energy ef f ic iency of o i l-f ired power generat ion (%)
1993 1994 1995 1996 1997 1998 1999 2000 2001 2002 2003
IEA 38.2 37.9 37.3 36.9 38.0 37.9 37.0 52.4 56.3 40.7 42.4
EIA 36.3 36.1 35.7 35.9 36.6 36.1 35.6 35.5 36.2 36.3 36.6
Ratio: IEA /
EIA
105 105 104 103 104 105 104 148 155 112 116
As can be seen in Table 17, there are large differences in the efficiency of oil-fired power generation. We will replace IEA data with EIA data for oil-fired power gen-eration because the EIA data set seems more reliable, especially for the years 2000-2002, with fewer fluctuations. Table 18 shows energy efficiency by overall fossil-fired power generation, calcu-lated by both sources.
Table 18 Energy ef f ic iency of foss i l-f ired power generat ion
1990 1991 1992-
1999
2000 2001 2002 2003
IEA 37.3% 37.5% 36% 37.5% 36.7% 37.2% 37.9%
EIA 35.9% 35.9% 36% 36.2% 36.6% 37.0% 36.7%
Ratio: IEA
/ EIA
104% 104% 100% 104% 100% 100% 103%
For the efficiency of fossil-fired power generation, differences are present for the years 1990, 1991, 2000 and 2003. For these years we will take EIA data because these values are more in line with the efficiencies for the other years.

70 AUGUST 2006 COMPARISON FOSSIL POWER EFFICIENCY
Resu lts energy e f f ic iency ana lys is
Table 19, Table 20, Table 21 and Table 22 show energy efficiency for coal-fired, gas-fired, oil-fired and fossil-fired power generation. Unless otherwise specified the numbers are based on IEA (2005). Some corrections are made, based on the com-parison of IEA data to national statistics. This is indicated by footnotes.
Table 19 Ef f ic iency of coal-f ired power generat ion (%)
1990 1991 1992 1993 1994 1995 1996 1997 1998 1999 2000 2001 2002 2003
China 30.9 31.4 31.8 32.2 32.3 31.1 32.0 30.4 30.6 32.2 33.3 33.2 33.1 33.3
France 39.5 41.0 42.0 37.6 38.6 37.9 40.0 36.8 39.7 37.2 36.8 35.4 36.2 35.4
Germany 34.0 34.3 35.0 35.2 35.6 36.0 36.3 36.5 37.8 37.6 38.4 37.5 36.0 38.9
Japan 39.4 39.6 39.7 39.4 40.0 40.2 40.5 40.8 41.2 41.3 41.4 41.6 41.7 41.6
United States32 36.1 36.1 36.1 35.8 35.9 36.1 36.0 36.1 35.9 36.1 35.9 35.9 35.9 36.4
UK + Ireland33 36.9 38.0 37.6 39.1 39.0 37.5 39.5 37.9 37.1 37.6 37.5 37.4 38.0 37.9
Nordic countries 39.7 39.8 39.5 40.5 41.2 40.7 40.5 40.2 40.0 42.5 41.5 42.0 41.6 40.4
India34 30.0 30.0 29.5 29.4 29.4 29.0 27.6 29.1 28.8 28.8 28.8 28.8 30.3 30.4
South Korea35 25.9 23.4 25.9 30.0 34.4 36.5 33.2 35.1 37.4 37.0 37.6 37.8 37.8 37.6
Australia 34.9 34.9 34.8 35.1 36.8 37.0 35.2 35.4 34.6 34.7 34.8 34.3 33.5 34.5
Table 20 Ef f ic iency of gas-f ired power generation (%)
1990 1991 1992 1993 1994 1995 1996 1997 1998 1999 2000 2001 2002 2003
China 35.0 35.0 35.0 35.0 35.0 34.8 30.8 40.4 40.7 43.8 44.8 45.5 47.5 43.9
France36 41.3 41.0 41.0 43.7 43.0 50.6 46.4 40.6 40.1 39.7
Germany 32.0 31.2 30.0 30.6 29.0 39.9 36.2 36.9 39.3 38.2 41.1 40.2 39.5 42.0
Japan 42.1 42.2 42.3 42.0 42.6 42.7 43.1 43.4 43.7 44.1 44.0 44.1 44.1 44.0
United States37 37.2 37.8 38.0 38.5 38.9 38.7 39.1 38.6 38.3 38.4 39.0 40.5 41.9 43.1
UK + Ireland 40.4 41.9 35.1 40.6 45.6 47.3 47.1 49.4 49.3 50.0 50.2 50.4 51.5 51.1
Nordic countries 44.5 44.8 43.9 43.7 42.4 39.5 42.7 40.7 43.8 45.2 45.2 45.7 45.4 45.6
India38 23.2 24.9 28.2 32.0 36.7 37.8 40.4 44.1 49.2 52.0 52.0 53.1 52.1 52.4
South Korea39 40.5 40.6 40.3 42.3 42.3 42.2 44.8 44.7 47.3 47.9 47.7 49.4 50.1 50.6
Australia 35.0 35.0 35.0 35.0 35.0 34.8 30.8 40.4 40.7 43.8 44.8 45.5 47.5 43.9
32 The energy-efficiency for the years 1990, 1991, 2000 and 2001 is based on EIA (2005). 33 The energy efficiency for the UK for the year 2000 is based on DTI (2005). The energy
efficiency for Ireland is based on IEA (2005). 34 Coal input data is based on MOSPI (2006). 35 Efficiencies for the period 1997-2003 are based on KEPCO (2005). 36 No gas-fired power generation in France in the years 2000-2002 37 The energy-efficiency for the years 1995-2000 is based on EIA (2005). 38 Original values for 1999 and 2000 are 58% and 57%. These values are considered as
anomalies and are replaced by 52%. 39 Efficiencies for the period 1997-2003 are based on KEPCO (2005).

Table 21 Ef f ic iency of o i l-f ired power generation (%)
1990 1991 1992 1993 1994 1995 1996 1997 1998 1999 2000 2001 2002 2003
China 33.7 33.3 33.4 33.7 33.6 33.9 34.0 33.6 33.6 33.6 33.6 33.6 33.6 33.6
France 37.7 38.1 38.2 36.9 35.6 36.1 36.0 36.8 35.2 33.3 36.1 29.7 32.3 31.8
Germany 27.5 29.7 29.4 26.2 26.1 28.0 30.1 30.1 31.1 31.5 22.8 26.9 32.2 33.8
Japan 42.4 42.6 42.7 42.4 42.9 42.8 43.0 43.4 43.6 44.0 45.0 45.2 45.2 45.3
United States40 35.5 36.3 36.0 36.3 36.1 35.7 35.9 36.6 36.1 35.6 35.5 36.2 36.3 36.3
UK + Ireland41 40.5 38.1 38.9 37.7 32.0 33.9 35.9 36.3 39.3 37.8 34.7 32.8 31.1 33.1
Nordic countries 35.5 37.7 40.0 39.3 39.1 40.3 40.2 41.8 37.0 40.2 41.0 39.5 41.4 43.9
India 30.0 30.0 30.0 30.0 30.0 30.0 30.0 30.0 30.0 30.0 30.0 30.0 30.0 30.0
South Korea42 37.9 39.2 40.8 42.8 45.5 40.5 44.5 39.2 40.1 44.0 45.4 44.3 44.0 44.0
Australia 36.6 36.9 34.1 37.3 36.6 32.4 32.0 33.6 28.9 38.5 37.3 37.9 41.7 34.7
Table 22 Ef f ic iency of foss i l -f ired power generat ion (%)
1990 1991 1992 1993 1994 1995 1996 1997 1998 1999 2000 2001 2002 2003
China 31.1 31.6 31.9 32.3 32.4 31.3 32.0 30.7 30.9 32.4 33.4 33.4 33.3 33.3
France 39.1 40.2 41.3 37.6 38.3 37.7 39.5 36.9 38.9 36.8 37.1 34.8 35.8 34.9
Germany 33.6 33.8 34.3 34.5 34.6 36.2 36.1 36.4 37.8 37.6 38.5 37.7 36.4 39.3
Japan 41.6 41.8 41.9 41.4 42.0 42.0 42.3 42.6 42.8 43.1 43.2 43.2 43.3 43.1
United States43 35.9 35.9 36.4 36.2 36.4 36.5 36.3 36.4 36.2 36.4 36.2 36.7 37.3 36.7
UK + Ireland44 37.4 38.1 37.6 39.1 39.7 39.4 41.4 42.2 41.9 43.6 43.1 42.8 43.4 43.7
Nordic countries 39.9 40.1 40.0 40.8 41.2 40.5 40.8 40.5 40.5 43.0 42.5 42.8 42.7 41.9
India 29.7 29.7 29.4 29.6 29.9 29.6 28.5 30.2 30.3 30.8 30.7 30.4 31.9 32.0
South Korea45 35.5 35.8 36.1 36.7 38.2 38.3 38.6 38.9 39.3 39.2 39.4 39.9 40.3 40.1
Australia 35.1 35.1 35.0 35.3 36.6 37.0 35.2 35.4 34.9 35.3 35.8 34.9 33.6 35.0
40 The energy efficiency for all years is based on EIA (2005). 41 The fuel input for oil-fired power generation for the period 1998-2003 is based on DTI
(2005) for the UK. 42 Efficiencies for the period 1997-2003 are based on KEPCO (2005). 43 The energy efficiency for the years 1990, 1991, 2000 and 2003 is based on EIA (2005). 44 The energy efficiency for the UK for the year 2000 is based on DTI (2005). The energy
efficiency for Ireland is based on IEA (2005). 45 Efficiencies for the period 1990-2003 are based on KOSIS (2005).
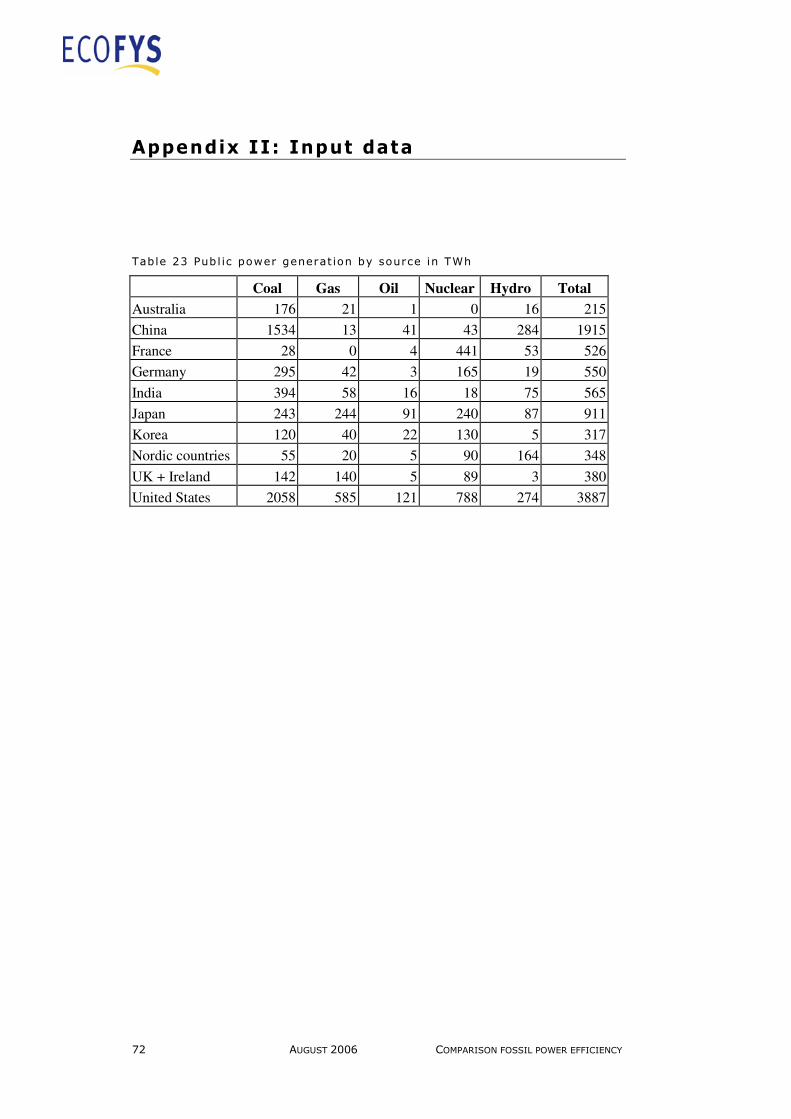
72 AUGUST 2006 COMPARISON FOSSIL POWER EFFICIENCY
Appendix II: Input data
Table 23 Pub l ic power generat ion by source in TWh
Coal Gas Oil Nuclear Hydro Total
Australia 176 21 1 0 16 215
China 1534 13 41 43 284 1915
France 28 0 4 441 53 526
Germany 295 42 3 165 19 550
India 394 58 16 18 75 565
Japan 243 244 91 240 87 911
Korea 120 40 22 130 5 317
Nordic countries 55 20 5 90 164 348
UK + Ireland 142 140 5 89 3 380
United States 2058 585 121 788 274 3887
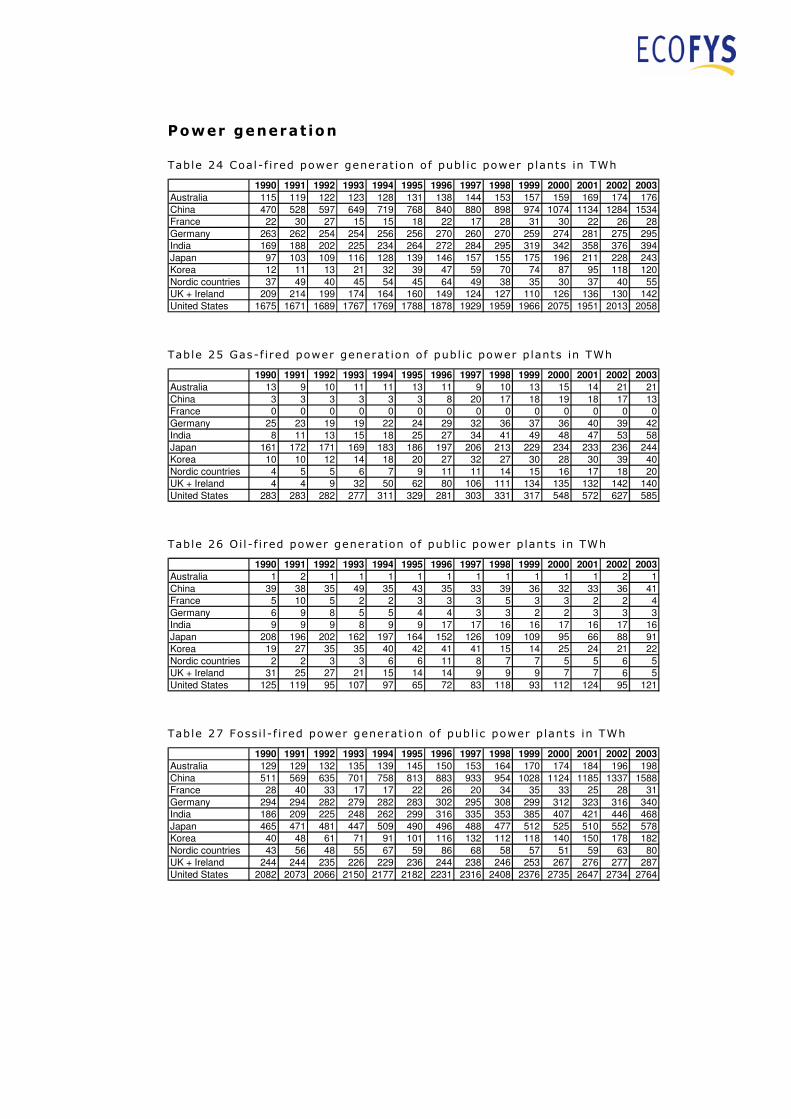
Power generat ion
Table 24 Coal-f ired power generat ion of publ ic power plants in TWh
1990 1991 1992 1993 1994 1995 1996 1997 1998 1999 2000 2001 2002 2003
Australia 115 119 122 123 128 131 138 144 153 157 159 169 174 176
China 470 528 597 649 719 768 840 880 898 974 1074 1134 1284 1534
France 22 30 27 15 15 18 22 17 28 31 30 22 26 28
Germany 263 262 254 254 256 256 270 260 270 259 274 281 275 295
India 169 188 202 225 234 264 272 284 295 319 342 358 376 394
Japan 97 103 109 116 128 139 146 157 155 175 196 211 228 243
Korea 12 11 13 21 32 39 47 59 70 74 87 95 118 120
Nordic countries 37 49 40 45 54 45 64 49 38 35 30 37 40 55
UK + Ireland 209 214 199 174 164 160 149 124 127 110 126 136 130 142
United States 1675 1671 1689 1767 1769 1788 1878 1929 1959 1966 2075 1951 2013 2058
Table 25 Gas-f ired power generat ion of publ ic power plants in TWh
1990 1991 1992 1993 1994 1995 1996 1997 1998 1999 2000 2001 2002 2003
Australia 13 9 10 11 11 13 11 9 10 13 15 14 21 21
China 3 3 3 3 3 3 8 20 17 18 19 18 17 13
France 0 0 0 0 0 0 0 0 0 0 0 0 0 0
Germany 25 23 19 19 22 24 29 32 36 37 36 40 39 42
India 8 11 13 15 18 25 27 34 41 49 48 47 53 58
Japan 161 172 171 169 183 186 197 206 213 229 234 233 236 244
Korea 10 10 12 14 18 20 27 32 27 30 28 30 39 40
Nordic countries 4 5 5 6 7 9 11 11 14 15 16 17 18 20
UK + Ireland 4 4 9 32 50 62 80 106 111 134 135 132 142 140
United States 283 283 282 277 311 329 281 303 331 317 548 572 627 585
Table 26 Oi l -f ired power generat ion of publ ic power plants in TWh
1990 1991 1992 1993 1994 1995 1996 1997 1998 1999 2000 2001 2002 2003
Australia 1 2 1 1 1 1 1 1 1 1 1 1 2 1
China 39 38 35 49 35 43 35 33 39 36 32 33 36 41
France 5 10 5 2 2 3 3 3 5 3 3 2 2 4
Germany 6 9 8 5 5 4 4 3 3 2 2 3 3 3
India 9 9 9 8 9 9 17 17 16 16 17 16 17 16
Japan 208 196 202 162 197 164 152 126 109 109 95 66 88 91
Korea 19 27 35 35 40 42 41 41 15 14 25 24 21 22
Nordic countries 2 2 3 3 6 6 11 8 7 7 5 5 6 5
UK + Ireland 31 25 27 21 15 14 14 9 9 9 7 7 6 5
United States 125 119 95 107 97 65 72 83 118 93 112 124 95 121
Table 27 Fossi l -f ired power generation of publ ic power plants in TWh
1990 1991 1992 1993 1994 1995 1996 1997 1998 1999 2000 2001 2002 2003
Australia 129 129 132 135 139 145 150 153 164 170 174 184 196 198
China 511 569 635 701 758 813 883 933 954 1028 1124 1185 1337 1588
France 28 40 33 17 17 22 26 20 34 35 33 25 28 31
Germany 294 294 282 279 282 283 302 295 308 299 312 323 316 340
India 186 209 225 248 262 299 316 335 353 385 407 421 446 468
Japan 465 471 481 447 509 490 496 488 477 512 525 510 552 578
Korea 40 48 61 71 91 101 116 132 112 118 140 150 178 182
Nordic countries 43 56 48 55 67 59 86 68 58 57 51 59 63 80
UK + Ireland 244 244 235 226 229 236 244 238 246 253 267 276 277 287
United States 2082 2073 2066 2150 2177 2182 2231 2316 2408 2376 2735 2647 2734 2764

74 AUGUST 2006 COMPARISON FOSSIL POWER EFFICIENCY
Fuel input
Table 28 Fuel consumpt ion of coal-f ired power plants in PJ
Input 1990 1991 1992 1993 1994 1995 1996 1997 1998 1999 2000 2001 2002 2003
Australia 1184 1224 1258 1267 1251 1278 1411 1460 1596 1627 1644 1774 1866 1832
China 5469 6048 6750 7255 8012 8884 9454 10416 10556 10881 11624 12278 13952 16598
France 203 264 234 139 138 174 200 168 257 303 290 226 255 284
Germany 2929 2867 2727 2700 2681 2643 2769 2664 2660 2571 2648 2747 2802 2790
India 2025 2259 2468 2750 2865 3286 3555 3510 3694 4000 4270 4474 4469 4672
Japan 888 936 984 1062 1151 1248 1300 1380 1358 1524 1704 1823 1967 2107
Korea 163 166 182 256 337 388 513 606 675 731 878 929 1003 1153
Nordic countries 385 496 416 457 524 446 629 492 390 343 305 361 390 538
UK + Ireland 2041 2027 1910 1603 1511 1538 1362 1175 1232 1048 1125 1314 1230 1350
United States 16201 16113 16871 17775 17757 17819 18782 19236 19675 19598 20518 20103 20183 20410
Table 29 Fuel consumption of gas-f ired power plants in PJ
Input 1990 1991 1992 1993 1994 1995 1996 1997 1998 1999 2000 2001 2002 2003
Australia 127 90 99 104 112 131 110 86 87 101 102 110 220 197
China 32 28 28 36 36 35 90 174 154 148 150 141 128 109
France 2 2 2 2 2 2 2 2 3 2 0 0 0 0
Germany 337 332 297 297 356 287 360 364 391 409 363 432 432 447
India 126 165 172 166 181 237 240 281 302 306 305 319 364 398
Japan 1374 1465 1450 1453 1548 1571 1647 1706 1756 1864 1917 1906 1929 1998
Korea 85 88 109 123 163 174 226 263 205 237 241 281 293 296
Nordic countries 43 47 55 65 81 102 117 124 138 145 154 168 172 190
UK + Ireland 34 39 95 281 395 469 616 770 808 963 966 945 993 988
United States 2735 2711 2683 2603 2898 3112 2657 2893 3189 3036 5072 5178 5496 4993
Table 30 Fuel consumption of o i l-f ired power plants in PJ
Input 1990 1991 1992 1993 1994 1995 1996 1997 1998 1999 2000 2001 2002 2003
Australia 15 16 6 7 6 7 7 7 7 7 7 10 13 8
China 413 412 375 521 379 451 374 355 420 382 342 353 384 444
France 48 96 51 19 16 32 32 25 53 35 27 28 26 40
Germany 109 139 128 105 91 76 75 58 53 47 41 47 38 40
India 112 108 108 100 106 114 203 199 194 197 208 194 201 188
Japan 1761 1661 1702 1373 1659 1379 1274 1041 900 888 758 529 700 723
Korea 179 249 312 294 319 376 335 393 131 143 232 250 219 220
Nordic countries 21 28 35 37 60 60 106 71 75 65 50 53 57 47
UK + Ireland 275 239 247 196 170 148 141 87 78 89 72 82 65 49
United States 1141 1133 915 1012 932 634 709 791 1123 908 772 792 842 1032
Table 31 Fuel consumption of foss i l-f ired power plants in PJ
Input 1990 1991 1992 1993 1994 1995 1996 1997 1998 1999 2000 2001 2002 2003
Australia 1326 1331 1363 1377 1369 1415 1528 1553 1690 1735 1754 1893 2099 2037
China 5914 6488 7153 7811 8427 9370 9918 10945 11129 11411 12116 12772 14465 17152
France 253 362 287 160 156 208 235 195 313 340 317 254 281 324
Germany 3375 3337 3152 3103 3129 3006 3204 3086 3104 3028 3052 3225 3271 3277
India 2263 2533 2748 3016 3152 3636 3999 3990 4190 4503 4782 4988 5034 5258
Japan 4023 4061 4137 3887 4358 4198 4221 4127 4015 4277 4378 4259 4595 4827
Korea 428 504 603 673 819 939 1074 1263 1012 1111 1351 1460 1515 1668
Nordic countries 449 572 506 558 664 609 853 687 603 552 510 582 619 775
UK + Ireland 2350 2304 2252 2080 2075 2155 2119 2032 2118 2100 2163 2340 2289 2387
United States 20078 19957 20469 21389 21587 21566 22148 22920 23986 23541 26362 26074 26521 26434

Heat output
Table 32 Heat output f rom coal-f ired publ ic CHP plants in PJ
1990 1991 1992 1993 1994 1995 1996 1997 1998 1999 2000 2001 2002 2003
Australia 2 2 0 0 0 0 0 0 0 0 0 0 0 0
China 0 0 0 0 0 0 0 0 0 0 0 0 0 0
France 0 0 0 0 0 0 0 0 0 0 0 0 0 0
Germany 289 245 220 211 191 183 200 200 184 189 166 112 108 132
India 0 0 0 0 0 0 0 0 0 0 0 0 0 0
Japan 0 0 0 0 0 0 0 0 0 0 0 0 0 0
Korea 0 0 0 0 0 0 0 0 0 0 0 0 0 0
Nordic countries 114 130 124 130 121 122 133 123 110 104 97 108 109 115
UK + Ireland 0 0 0 0 0 0 0 0 0 0 0 0 0 0
United States 6 9 20 11 21 20 23 23 23 17 82 74 56 54
Table 33 Heat output f rom gas-f ired pub l ic CHP plants in PJ
1990 1991 1992 1993 1994 1995 1996 1997 1998 1999 2000 2001 2002 2003
Australia 0 0 0 0 0 0 0 0 0 0 0 0 0 0
China 0 0 0 0 0 0 0 0 0 0 0 0 0 0
France 0 0 0 0 0 0 0 0 0 0 0 0 0 0
Germany 98 109 108 120 147 171 142 118 139 127 111 175 175 215
India 0 0 0 0 0 0 0 0 0 0 0 0 0 0
Japan 0 0 0 0 0 0 0 0 0 0 0 0 0 0
Korea 0 0 0 0 15 20 23 26 20 27 27 43 32 41
Nordic countries 20 23 30 35 42 49 56 63 68 70 76 80 82 79
UK + Ireland 0 0 0 0 0 0 0 0 0 0 0 0 0 0
United States 0 46 22 23 33 33 32 32 31 33 208 206 268 251
Table 34 Heat output f rom oi l-f ired publ ic CHP plants in PJ
1990 1991 1992 1993 1994 1995 1996 1997 1998 1999 2000 2001 2002 2003
Australia 0 0 0 0 0 0 0 0 0 0 0 0 0 0
China 0 0 0 0 0 0 0 0 0 0 0 0 0 0
France 0 0 0 0 0 0 0 0 0 0 0 0 0 0
Germany 38 58 57 54 36 40 54 42 42 40 20 14 13 16
India 0 0 0 0 0 0 0 0 0 0 0 0 0 0
Japan 0 0 0 0 0 0 0 0 0 0 0 0 0 0
Korea 0 0 0 0 0 1 1 0 0 1 13 25 2 6
Nordic countries 8 11 12 14 19 19 22 13 20 13 8 11 16 15
UK + Ireland 0 0 0 0 0 0 0 0 0 0 0 0 0 0
United States 0 25 23 19 15 11 12 8 6 6 7 8 9 18
Table 35 Heat output f rom fossi l-f ired publ ic CHP plants in PJ
1990 1991 1992 1993 1994 1995 1996 1997 1998 1999 2000 2001 2002 2003
Australia 2 2 0 0 0 0 0 0 0 0 0 0 0 0
China 0 0 0 0 0 0 0 0 0 0 0 0 0 0
France 0 0 0 0 0 0 0 0 0 0 0 0 0 0
Germany 424 411 385 384 373 394 396 360 365 355 297 302 297 364
India 0 0 0 0 0 0 0 0 0 0 0 0 0 0
Japan 0 0 0 0 0 0 0 0 0 0 0 0 0 0
Korea 0 0 0 0 15 20 24 26 20 28 40 69 34 47
Nordic countries 142 164 167 179 183 190 211 199 198 187 181 200 207 209
UK + Ireland 0 0 0 0 0 0 0 0 0 0 0 0 0 0
United States 6 80 64 52 70 64 66 63 60 56 297 288 334 322

76 AUGUST 2006 COMPARISON FOSSIL POWER EFFICIENCY
Benchmark ind icators
Table 36 Benchmark ind icators for coal (by non-weighted average)
1990 1991 1992 1993 1994 1995 1996 1997 1998 1999 2000 2001 2002 2003
Australia 101% 100% 99% 99% 101% 102% 98% 99% 95% 95% 95% 94% 92% 94%
China 89% 90% 90% 91% 89% 86% 89% 85% 84% 88% 91% 91% 91% 91%
France 114% 118% 119% 106% 106% 105% 111% 103% 109% 102% 101% 97% 99% 97%
Germany 98% 99% 99% 99% 98% 100% 101% 102% 104% 103% 105% 103% 99% 106%
India 86% 86% 84% 83% 81% 80% 76% 81% 79% 79% 79% 79% 83% 83%
Japan 113% 113% 113% 111% 110% 111% 112% 114% 113% 113% 113% 114% 115% 114%
Korea 75% 67% 74% 85% 95% 101% 92% 98% 103% 101% 103% 104% 104% 103%
Nordic countries 114% 114% 112% 114% 114% 112% 112% 112% 110% 117% 113% 115% 114% 110%
UK + Ireland 106% 109% 107% 110% 107% 104% 109% 106% 102% 103% 102% 103% 104% 104%
United States 104% 104% 102% 101% 99% 100% 100% 101% 99% 99% 98% 99% 99% 99%
Table 37 Benchmark ind icators for gas (by non-weighted average)
1990 1991 1992 1993 1994 1995 1996 1997 1998 1999 2000 2001 2002 2003
Australia 98% 98% 99% 97% 89% 90% 89% 86% 94% 100% 112% 99% 76% 86%
China 94% 93% 94% 91% 90% 85% 76% 98% 94% 99% 97% 99% 105% 96%
France 111% 109% 111% 113% 110% 123% 114% 98% 93% 89%
Germany 86% 83% 81% 79% 74% 97% 89% 89% 91% 86% 89% 87% 88% 92%
India 62% 66% 76% 83% 94% 92% 99% 106% 114% 117% 113% 115% 115% 115%
Japan 113% 112% 114% 109% 109% 104% 106% 105% 101% 99% 95% 96% 98% 96%
Korea 109% 108% 109% 110% 109% 103% 110% 108% 109% 108% 103% 107% 111% 111%
Nordic countries 119% 119% 119% 113% 109% 96% 105% 98% 101% 102% 98% 99% 101% 100%
UK + Ireland 108% 111% 95% 105% 117% 115% 116% 119% 114% 113% 109% 110% 114% 112%
United States 100% 100% 103% 100% 100% 94% 96% 93% 89% 87% 84% 88% 93% 94%
Table 38 Benchmark ind icators for o i l (by non-weighted average)
1990 1991 1992 1993 1994 1995 1996 1997 1998 1999 2000 2001 2002 2003
Australia 102% 102% 94% 103% 102% 92% 88% 93% 82% 105% 103% 106% 113% 95%
China 94% 92% 92% 93% 94% 96% 94% 93% 95% 91% 93% 94% 91% 92%
France 106% 105% 105% 102% 100% 102% 100% 102% 99% 90% 100% 83% 88% 87%
Germany 77% 82% 81% 72% 73% 79% 83% 83% 88% 86% 63% 76% 88% 92%
India 84% 83% 83% 83% 84% 85% 83% 83% 85% 81% 83% 84% 82% 82%
Japan 119% 118% 118% 117% 120% 121% 119% 120% 123% 119% 124% 127% 123% 124%
Korea 106% 108% 112% 118% 127% 115% 123% 108% 113% 119% 126% 124% 120% 120%
Nordic countries 99% 104% 110% 108% 109% 114% 111% 116% 104% 109% 114% 111% 113% 120%
UK + Ireland 113% 105% 107% 104% 89% 96% 99% 100% 111% 103% 96% 92% 85% 90%
United States 99% 100% 99% 100% 101% 101% 99% 101% 102% 97% 98% 102% 99% 99%
Table 39 Benchmark ind icators for foss i l (by non-weighted average)
1990 1991 1992 1993 1994 1995 1996 1997 1998 1999 2000 2001 2002 2003
Australia 100% 100% 99% 99% 100% 101% 97% 98% 95% 95% 97% 95% 90% 93%
China 89% 90% 91% 91% 89% 86% 89% 85% 85% 89% 91% 92% 91% 91%
France 112% 114% 117% 106% 106% 104% 110% 103% 108% 101% 99% 96% 98% 96%
Germany 96% 97% 98% 98% 96% 99% 99% 100% 102% 101% 103% 101% 97% 104%
India 85% 85% 83% 83% 82% 81% 79% 84% 84% 84% 83% 83% 87% 87%
Japan 116% 115% 115% 112% 114% 112% 112% 112% 110% 108% 107% 107% 109% 108%
Korea 98% 99% 103% 106% 112% 107% 107% 104% 106% 105% 107% 108% 107% 106%
Nordic countries 114% 114% 113% 114% 113% 110% 111% 110% 108% 112% 109% 110% 110% 108%
UK + Ireland 107% 109% 106% 109% 108% 106% 111% 112% 108% 108% 105% 106% 109% 107%
United States 103% 103% 102% 101% 99% 99% 99% 100% 98% 97% 95% 96% 97% 98%

Table 40 Benchmark ind icators for coal (based on weighted average)
1990 1991 1992 1993 1994 1995 1996 1997 1998 1999 2000 2001 2002 2003
Australia 101% 100% 100% 101% 105% 107% 102% 103% 101% 100% 99% 98% 96% 98%
China 89% 90% 91% 93% 93% 90% 92% 89% 89% 93% 95% 95% 95% 94%
France 114% 118% 121% 108% 110% 109% 116% 107% 116% 107% 105% 101% 104% 101%
Germany 98% 99% 101% 101% 102% 104% 105% 106% 110% 108% 110% 107% 103% 110%
India 86% 86% 85% 85% 84% 84% 80% 85% 84% 83% 82% 83% 87% 86%
Japan 113% 113% 114% 113% 115% 116% 117% 119% 120% 119% 118% 119% 120% 118%
Korea 75% 67% 74% 86% 98% 106% 96% 102% 109% 106% 107% 108% 108% 107%
Nordic countries 114% 114% 113% 116% 118% 118% 117% 117% 117% 122% 119% 120% 119% 115%
UK + Ireland 106% 109% 108% 112% 112% 108% 114% 110% 108% 108% 107% 107% 109% 108%
United States 104% 104% 104% 103% 103% 104% 104% 105% 105% 104% 103% 103% 103% 103%
Table 41 Benchmark ind icators for gas (based on weighted average)
1990 1991 1992 1993 1994 1995 1996 1997 1998 1999 2000 2001 2002 2003
Australia 97% 96% 96% 96% 87% 92% 88% 86% 96% 104% 122% 106% 78% 88%
China 92% 91% 91% 90% 88% 86% 75% 97% 97% 103% 106% 106% 108% 98%
France 109% 107% 107% 112% 108% 125% 113% 98% 96% 93%
Germany 84% 81% 78% 79% 73% 99% 88% 89% 94% 90% 97% 93% 90% 94%
India 61% 65% 73% 82% 92% 93% 99% 106% 118% 122% 123% 123% 119% 117%
Japan 111% 110% 110% 108% 107% 106% 105% 105% 104% 103% 104% 102% 101% 99%
Korea 107% 106% 105% 108% 107% 104% 109% 108% 113% 112% 113% 115% 115% 113%
Nordic countries 117% 117% 114% 112% 107% 97% 104% 98% 105% 106% 107% 106% 104% 102%
UK + Ireland 106% 109% 91% 104% 115% 117% 115% 119% 118% 117% 119% 117% 118% 114%
United States 98% 99% 99% 99% 98% 96% 95% 93% 91% 90% 92% 94% 96% 97%
Table 42 Benchmark ind icators for o i l (based on weighted average)
1990 1991 1992 1993 1994 1995 1996 1997 1998 1999 2000 2001 2002 2003
Australia 95% 96% 87% 97% 94% 84% 82% 87% 77% 101% 97% 100% 109% 90%
China 88% 86% 86% 88% 86% 88% 87% 87% 89% 88% 87% 89% 87% 88%
France 98% 99% 98% 96% 91% 93% 92% 96% 93% 87% 94% 78% 84% 83%
Germany 72% 77% 75% 68% 67% 73% 77% 78% 82% 83% 59% 71% 84% 88%
India 78% 78% 77% 78% 77% 78% 77% 78% 79% 79% 78% 79% 78% 78%
Japan 110% 111% 110% 110% 110% 111% 110% 113% 115% 115% 117% 119% 118% 118%
Korea 99% 102% 105% 111% 116% 105% 114% 102% 106% 115% 118% 117% 115% 115%
Nordic countries 92% 98% 103% 102% 100% 104% 103% 109% 98% 105% 107% 104% 108% 115%
UK + Ireland 105% 99% 100% 98% 82% 88% 92% 94% 104% 99% 90% 87% 81% 86%
United States 92% 94% 92% 95% 92% 92% 92% 95% 96% 93% 92% 96% 94% 95%
Table 43 Benchmark ind icators for foss i l (based on weighted average)
1990 1991 1992 1993 1994 1995 1996 1997 1998 1999 2000 2001 2002 2003
Australia 100% 100% 100% 101% 104% 105% 101% 102% 100% 100% 101% 99% 94% 97%
China 89% 90% 91% 92% 92% 90% 92% 89% 89% 93% 95% 95% 95% 94%
France 111% 113% 117% 107% 109% 107% 113% 106% 112% 105% 103% 99% 102% 99%
Germany 96% 97% 98% 99% 99% 103% 103% 104% 108% 106% 108% 105% 101% 108%
India 85% 85% 84% 84% 85% 84% 81% 87% 88% 88% 87% 87% 90% 90%
Japan 111% 111% 111% 110% 110% 110% 110% 111% 112% 111% 112% 111% 111% 110%
Korea 94% 95% 98% 103% 108% 105% 106% 103% 110% 109% 110% 111% 110% 109%
Nordic countries 114% 114% 113% 115% 115% 113% 114% 113% 112% 116% 114% 115% 114% 112%
UK + Ireland 106% 108% 106% 110% 110% 109% 113% 114% 112% 113% 113% 111% 113% 111%
United States 102% 102% 102% 102% 102% 103% 103% 103% 102% 102% 100% 101% 101% 101%
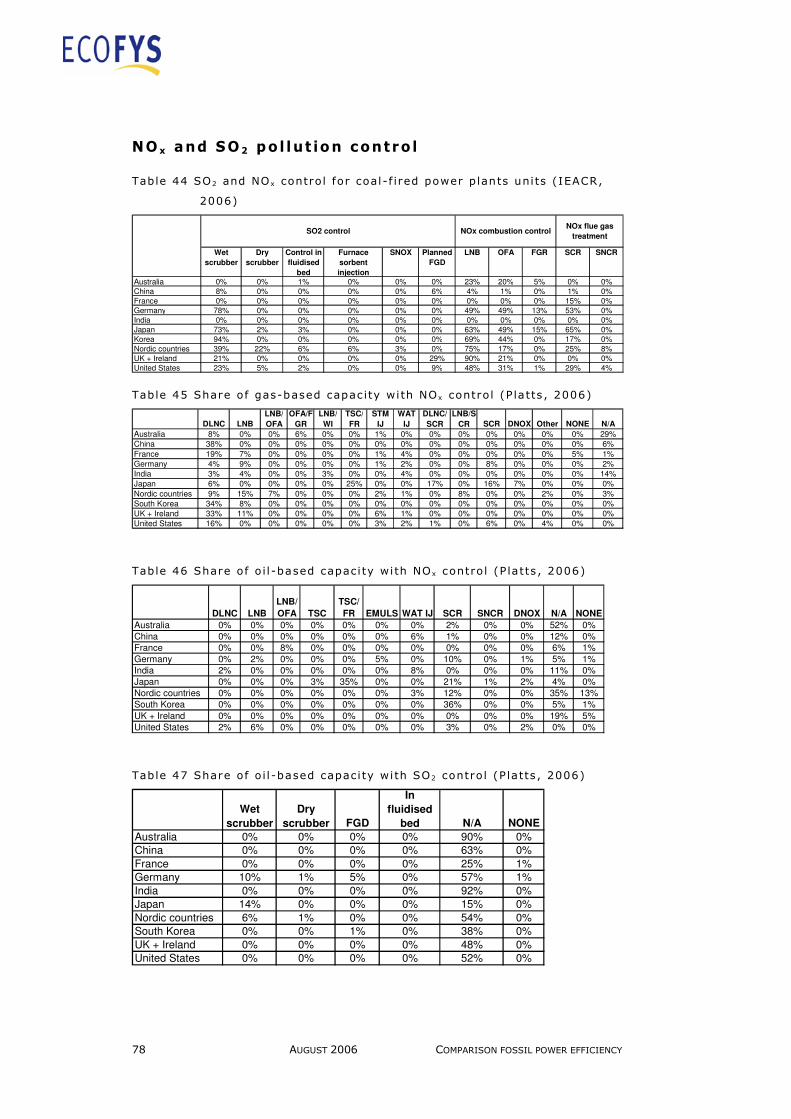
78 AUGUST 2006 COMPARISON FOSSIL POWER EFFICIENCY
NO x and SO 2 po l lut ion contro l
Table 44 SO2 and NO x contro l for coal-f ired power plants uni ts (IEACR,
2006)
Wet
scrubber
Dry
scrubber
Control in
fluidised
bed
Furnace
sorbent
injection
SNOX Planned
FGD
LNB OFA FGR SCR SNCR
Australia 0% 0% 1% 0% 0% 0% 23% 20% 5% 0% 0%
China 8% 0% 0% 0% 0% 6% 4% 1% 0% 1% 0%
France 0% 0% 0% 0% 0% 0% 0% 0% 0% 15% 0%
Germany 78% 0% 0% 0% 0% 0% 49% 49% 13% 53% 0%
India 0% 0% 0% 0% 0% 0% 0% 0% 0% 0% 0%
Japan 73% 2% 3% 0% 0% 0% 63% 49% 15% 65% 0%
Korea 94% 0% 0% 0% 0% 0% 69% 44% 0% 17% 0%
Nordic countries 39% 22% 6% 6% 3% 0% 75% 17% 0% 25% 8%
UK + Ireland 21% 0% 0% 0% 0% 29% 90% 21% 0% 0% 0%
United States 23% 5% 2% 0% 0% 9% 48% 31% 1% 29% 4%
SO2 control NOx combustion controlNOx flue gas
treatment
Table 45 Share of gas-based capac ity wi th NO x contro l (P latts , 2006)
DLNC LNB
LNB/
OFA
OFA/F
GR
LNB/
WI
TSC/
FR
STM
IJ
WAT
IJ
DLNC/
SCR
LNB/S
CR SCR DNOX Other NONE N/A
Australia 8% 0% 0% 6% 0% 0% 1% 0% 0% 0% 0% 0% 0% 0% 29%
China 38% 0% 0% 0% 0% 0% 0% 0% 0% 0% 0% 0% 0% 0% 6%
France 19% 7% 0% 0% 0% 0% 1% 4% 0% 0% 0% 0% 0% 5% 1%
Germany 4% 9% 0% 0% 0% 0% 1% 2% 0% 0% 8% 0% 0% 0% 2%
India 3% 4% 0% 0% 3% 0% 0% 4% 0% 0% 0% 0% 0% 0% 14%
Japan 6% 0% 0% 0% 0% 25% 0% 0% 17% 0% 16% 7% 0% 0% 0%
Nordic countries 9% 15% 7% 0% 0% 0% 2% 1% 0% 8% 0% 0% 2% 0% 3%
South Korea 34% 8% 0% 0% 0% 0% 0% 0% 0% 0% 0% 0% 0% 0% 0%
UK + Ireland 33% 11% 0% 0% 0% 0% 6% 1% 0% 0% 0% 0% 0% 0% 0%
United States 16% 0% 0% 0% 0% 0% 3% 2% 1% 0% 6% 0% 4% 0% 0%
Table 46 Share of o i l -based capaci ty wi th NO x contro l (P latts , 2006)
DLNC LNB
LNB/
OFA TSC
TSC/
FR EMULS WAT IJ SCR SNCR DNOX N/A NONE
Australia 0% 0% 0% 0% 0% 0% 0% 2% 0% 0% 52% 0%
China 0% 0% 0% 0% 0% 0% 6% 1% 0% 0% 12% 0%
France 0% 0% 8% 0% 0% 0% 0% 0% 0% 0% 6% 1%
Germany 0% 2% 0% 0% 0% 5% 0% 10% 0% 1% 5% 1%
India 2% 0% 0% 0% 0% 0% 8% 0% 0% 0% 11% 0%
Japan 0% 0% 0% 3% 35% 0% 0% 21% 1% 2% 4% 0%
Nordic countries 0% 0% 0% 0% 0% 0% 3% 12% 0% 0% 35% 13%
South Korea 0% 0% 0% 0% 0% 0% 0% 36% 0% 0% 5% 1%
UK + Ireland 0% 0% 0% 0% 0% 0% 0% 0% 0% 0% 19% 5%
United States 2% 6% 0% 0% 0% 0% 0% 3% 0% 2% 0% 0%
Table 47 Share of o i l -based capaci ty wi th SO2 contro l (P latts , 2006)
Wet
scrubber
Dry
scrubber FGD
In
fluidised
bed N/A NONE
Australia 0% 0% 0% 0% 90% 0%
China 0% 0% 0% 0% 63% 0%
France 0% 0% 0% 0% 25% 1%
Germany 10% 1% 5% 0% 57% 1%
India 0% 0% 0% 0% 92% 0%
Japan 14% 0% 0% 0% 15% 0%
Nordic countries 6% 1% 0% 0% 54% 0%
South Korea 0% 0% 1% 0% 38% 0%
UK + Ireland 0% 0% 0% 0% 48% 0%
United States 0% 0% 0% 0% 52% 0%

Table 48 SO2 emiss ions per kWh for coal- and oi l-f ired power generation
[IEA (2005) and OECD (2004)]
1990 1991 1992 1993 1994 1995 1996 1997 1998 1999 2000 2001 2002
Australia 3.4 3.4 3.3 3.3 3.2 3.4 3.4 3.0 3.2 3.2 3.3 3.3 3.1
France 12.5 11.0 9.8 13.5 12.5 10.0 8.6 8.7 6.6 4.6 4.4 4.3 3.6
Germany 9.0 7.1 6.5 5.9 5.3 4.2 2.4 1.7 1.2 1.0 0.9 0.9 0.9
Japan 0.7 0.7 0.7 0.7 0.7 0.6 0.6 0.6 0.6 0.5 0.5 0.6 0.5
Korea 9.1 7.8 6.3 6.0 4.5 4.1 4.2 3.5 3.8 1.3
Nordic countries 5.4 5.2 4.6 3.4 2.7 3.0 2.7 2.3 2.3 1.8 1.3 1.4 1.3
UK + Ireland 11.8 11.0 11.2 11.2 10.4 9.7 8.6 8.5 8.7 7.4 6.8 5.7 5.5
United States 8.0 8.0 7.8 7.4 7.2 5.9 5.9 5.9 5.9 5.5 4.7 4.7 4.4
Table 49 NO x emiss ions per kWh for foss i l-f ired generat ion [IEA (2005)
and OECD (2004)]
1990 1991 1992 1993 1994 1995 1996 1997 1998 1999 2000 2001 2002
Australia 3.0 3.1 3.1 3.0 3.0 2.6 2.7 2.8 3.0 2.9 3.0 2.9 2.9
France 4.2 3.9 4.0 5.3 5.2 4.5 4.2 4.6 3.8 3.3 3.6 3.8 3.6
Germany 1.6 1.4 1.3 1.1 1.0 0.8 0.7 0.7 0.7 0.7 0.7 0.7 0.7
Japan 0.5 0.5 0.5 0.5 0.5 0.4 0.4 0.4 0.4 0.4 0.4 0.4 0.4
Korea 3.2 3.2 3.3 2.7 1.4 1.4 1.7 1.5 1.5 0.9Nordic countries 3.8 3.4 3.1 2.9 2.4 2.3 2.1 2.0 1.9 1.7 1.6 1.7 1.7
UK + Ireland 3.4 3.0 3.1 2.7 2.5 2.3 2.0 1.7 1.6 1.5 1.5 1.5 1.5
United States 2.9 2.9 2.9 2.8 2.7 2.7 2.5 2.5 2.3 2.2 1.8 1.7 1.6
Table 50 Relat ive fossi l - f ired power generation by source and own power
consumption in power and heat p lants as share in tota l power
generat ion in 2003 (IEA, 2005)
Gas Oil Coal Own power
consumption as
share in total
gross power
generation
Australia 11% 0% 89% 6.8%
China 1% 3% 97% 8.7%
France 0% 11% 89% 4.4%
Germany 12% 1% 87% 5.9%
India 12% 3% 84% 7.1%
Japan 42% 16% 42% 3.6%
Korea 22% 12% 66% 4.5%
Nordic countries 25% 6% 68% 2.7%
UK + Ireland 49% 2% 50% 4.6%
United States 21% 4% 74% 4.9%
80 AUGUST 2006 COMPARISON FOSSIL POWER EFFICIENCY
Appendix III: IEA definit ions46
Coal and coal products
Coal includes all coal, both primary (including hard coal and lignite/brown coal) and derived fuels (including patent fuel, coke oven coke, gas coke, BKB, coke oven gas, and blast furnace gas). Peat is also included in this category. Crude, NGL and Feedstocks
Crude oil comprises crude oil, natural gas liquids, refinery feedstocks, and additives as well as other hydrocarbons (including emulsified oils, synthetic crude oil, min-eral oils extracted from bituminous minerals such as oil shale, bituminous sand, etc., and oils from coal liquefaction). Petroleum products
Petroleum products comprise refinery gas, ethane, LPG, aviation gasoline, motor gasoline, jet fuels, kerosene, gas/diesel oil, heavy fuel oil, naphtha, white spirit, lu-bricants, bitumen, paraffin waxes, petroleum coke and other petroleum products. Natural Gas
Gas includes natural gas (excluding natural gas liquids) and gas works gas. The lat-ter appears as a positive figure in the "gas works" row but is not part of production. Public power supply
Public supply undertakings generate electricity and/or heat for sale to third parties, as their primary activity. They may be privately or publicly owned. Note that the sale need not take place through the public grid. Electricity generated shows the total number of TWh47 generated by thermal power plants separated into electricity plants and CHP plants, as well as production by nu-clear and hydro (excluding pumped storage production), geothermal, etc. (see, however, the notes on Rows 9 and 10). Electricity produced from crude oil and NGL is included in the petroleum products column.
46 Taken from IEA (2004) 47 Gross electricity produced (including power stations' own consumption).