ecological impact of inside/outside house cats around a suburban nature preserve
TRANSCRIPT

Animal Conservation (2004) 7, 273–283 C© 2004 The Zoological Society of London. Printed in the United Kingdom DOI:10.1017/S1367943004001489
Ecological impact of inside/outside house cats arounda suburban nature preserve
Roland W. Kays1,* and Amielle A. DeWan2
1 New York State Museum, 3140 CEC, Albany, NY 12230, USA2 Dept. Natural Resources, 207 Fernow Hall, Cornell University, Ithaca, NY 14853-3001, USA
(Received 18 September 2003; accepted 21 January 2004)
AbstractWhile subsidised populations of feral cats are known to impact their prey populations, little is known aboutthe ecological impact of inside/outside hunting cats (IOHC). We studied IOHC around a suburban naturepreserve. Mail surveys indicated an average of 0.275 IOHC/house, leading to a regional density estimateof 0.32 IOHC/ha. A geographical model of cat density was created based on local house density anddistance from forest/neighbourhood edge. IOHC hunted mostly small mammals, averaging 1.67 prey broughthome/cat/month and a kill rate of 13%. Predation rates based on kills brought home was lower than the estimatefrom observing hunting cats (5.54 kills/cat/month). IOHC spent most outside time in their or their immediateneighbours’ garden/yard, or in the nearby forest edge; 80% of observed hunts occurred in a garden/yard orin the first 10 m of forest. Radio-tracked IOHC averaged 0.24 ha in home-range size (95% minimum convexpolygon (MCP)) and rarely entered forest. Confirming this, scent stations detected cats more often near theedge and more cats were detected in smaller forest fragments. There was no relationship between the numberof cats detected in an area and the local small mammal abundance or rodent seed predation rates. Cold weatherand healthy cat predator populations are speculated to minimise the ecological impact of IOHC on this area.
Domestic cats (Felis silvestris catus) are of specialconcern for conservation biologists because of theirrecord as a subsidised exotic predator of native species.Because they often receive supplementary food fromhuman caretakers, they can reach densities of 100 times ormore higher than native carnivores (Coleman & Temple,1993). The consequences of their hunting have been espe-cially severe on oceanic islands with no native mammalianpredators, where native prey species have little innateability to elude cat predation (e.g. Bloomer & Bester,1992; Stiling, 1996). Evidence is accumulating that conti-nental cats may also be a conservation concern because ofthe effects their subsidised populations can have on nativeprey (Crooks & Soule, 1999; Baker et al., 2003).
However, F. silvestris lives in a number of distinctdomestic and wild situations and it is important to considerthis variety when evaluating their conservation risk inany particular situation. Studies on their ecological rolehave typically focused on worst case scenarios such asferal cats, farm cats and ‘cat colonies’ (mostly neuteredstrays fed and given shelter at one centralised structure:Clarke & Pacin, 2002). Truly feral cats receive little orno food from humans and hunt as much as four timesmore than domesticated animals (Liberg, 1984; Paltridge,Gibson & Edwards, 1997). Most cats living on farms
∗All correspondence to: R. W. Kays. Fax: 518-486-2034;E-mail: [email protected]
or managed colonies receive supplemental nourishmentfrom humans, but also hunt for meals. These cats live atsuch high densities that their impact on the local faunacan be substantial (Hawkins, 1998). Managed colonies, inparticular, pose a significant threat if located nearprotected areas (Weber & Dailly, 1998; Clarke & Pacin,2002).
However, most cats are not as free-ranging; rather, theylive as well-fed house pets. Estimates put the ownedcat population of the USA at around 60 million andthe stray/feral cat population at between 25–40 million(Patronek & Rowan, 1995). It is estimated that over50% of these owned cats spend time outside their house(APPMA, 1997). These inside/outside house cats (IOHC)typically receive all their food from their owners; theirhunting appears to be more recreational or opportunistic,rather than directed towards feeding themselves or theirlitters (Leyhausen, 1979). Surprisingly, few studies havedocumented the ecological effects of IOHC; even rangingpatterns and hunting rates of this type of cat are poorlyknown (Fitzgerald, 1990; Fitzgerald & Turner, 2000).
What is the ecological effect of this recreationalhunting? A number of studies have sounded the alarmagainst letting house cats roam outside based on thenumber of small prey they bring home (Meek, 1998;Robertson, 1998; Woods, McDonald & Harris, 2003).However, only one study has actually documented anegative impact of these IOHC on a wild population of

274 R. W. KAYS AND A. A. DEWAN
prey in natural areas (scrub breeding birds: Crooks &Soule, 1999). In fact, some authors have warned againstwide ranging civic regulation without more data about thehunting habits and ecological impacts of domestic cats(Fitzgerald, 1990; Jarvis, 1990). Although small mammalsare the most common prey of housecats (Liberg, 1984;Meek, 1998), the impact (or lack there of) of IOHC onnatural small mammal populations is rarely mentionedand most discussion has centred on their impact onbirds. This question has important ramifications past themere conservation of the small mammals themselves,since they often play important ecosystem roles as seeddispersers/predators and vectors of diseases (Ostfeld,Manson & Canham, 1997; Ostfeld & Keesing, 2000).
Because IOHC are so prevalent in society, it is importantto understand the conservation implications of theirpredation on native prey in natural habitats. With thisas our overall objective, we studied a population ofIOHC around the suburban Albany Pine Bush Preserve(APBP), New York, documenting their density, use ofthe landscape, hunting habits, effect on small mammalpopulations and effect on rodent seed predation rates usinga suite of complementary techniques. If IOHC are a majorconservation threat to the preserve, we would expect themto range widely through the preserve, hunt native preywithin the preserve at a high rate and reduce the abundanceof prey in areas where they hunt the most, thereby alsoaffecting the ecological processes associated with theseprey populations.
METHODS AND MATERIALS
Study site
This work was conducted in the forest fragments andneighbourhoods in and around the Albany Pine BushPreserve (APBP), Albany, New York, USA – a smallprotected area completely surrounded and bisected bysuburban development (Rittner, 1976; Barnes, 2003). Thisstudy focused on mixed deciduous/coniferous forests. Our60 km2 study area included 37.6 km2 of forest, with theremaining area being suburban housing and commercialdevelopment. At larger scales, this area was flanked byurban development to the east and north and a mix of sub-urban development and rural areas to the west and south.
Mail surveys of cat owners
In April of 2001 we hand-delivered surveys and self-addressed stamped envelopes to 600 houses that directlybordered or were across the street from the preserve. Thisone-page survey asked if the respondent owned cats andif their cat(s) hunted outside. Additional questions wereasked about wildlife seen in their garden/yard over the lastyear and potential cat–wildlife conflict.
Prey brought home by cats
Eight households (representing 12 cats) collected andfroze 60 dead prey brought home by their hunting cats
from early May to late July of 2002. We collected thesefrozen carcasses and identified their species and age.
Radio-tracking and behavioural observations
We radio-tracked 11 IOHC from eight households border-ing the APBP from May to August of 1991. Cooperativepet owners were identified through our mail surveyand they affixed the radio-collars (Advanced TelemetrySystems, Isanti, MN, USA) to their pet cats. In addition,we trapped, radio-collared and tracked one feral cat in thearea. We used telemetry to home-in on focal animals andwatched their behaviour from a distance with binocularsfor a total of 181 h of observation. We recorded exactmovement paths onto fine-scale paper maps and thenentered these locations into ARCVIEW GIS (3.2). Weused headlamps covered with red filters for nocturnalobservation. We recorded all hunt attempts (n = 31),narrowly defined as a distinct fast chase or pounce afterseen or unseen prey. We used the ARCVIEW AnimalMovement Extension (Hooge & Eichenlaub, 1997) tocalculate 100% and 95% minimum convex polygon(MCP) home-range areas. In selecting fixes for the 95%MCP we used an independence interval of 1 h betweenfixes, since a cat could easily cover its home range in thistime (Doncaster & Macdonald, 1997). This reduced 735total fixes to 249 independent fixes (85% diurnal, 15%nocturnal).
We sought to obtain even sample sizes for each radio-collared cat and to obtain more nocturnal observations,but this was impossible because some cats were typicallyinside their house, especially at night. Thus, our samplesize for each cat is also a general indication of the amountof time that individual spent outside. To evaluate theimpact of this low fix number on home-range measureswe calculated the average 95% MCP for different samplessizes for each individual cat through bootstrap resamplingof independent fixes (100 replicates, starting n = 5, inter-val n = 2: Hooge & Eichenlaub, 1997).
Scent stations
From June to August 2001 we surveyed 22 forestedsites for the presence or absence of domestic cats using108 scent stations. All study sites had coniferous/deciduous forest cover and were embedded in a suburbanlandscape (not commercial or industrial). Twenty-one siteshad five scent stations spaced every 58 m around a circleradiating 50 m from a common centre point; one sitehad only three scent stations due to the small size ofthe forest fragment. Each scent station was run for onenight and consisted of a fatty acid scent tablet (Andelt &Woolley, 1996) placed in the centre of a 1 m radius circle ofraked sandy soil to record footprints of visiting animals.Each scent station was also monitored using a motion-sensitive camera trap (http://www.Camtrakker.com). Ifrain obscured tracks, the setup was moved and this site wassampled again later in the summer. Large forest fragments(> 40 ha) were sampled at both their centre (> 100 m fromforest edge) and edge (< 100 m from forest edge). Because

Ecological effects of house cats 275
cats were individually identifiable by coat pattern, wecounted the number of cats photographed by the camera-traps at each site as a measure of local abundance.
Modelling cat density
We digitised individual houses in a 60 km2 area aroundand including the nature preserve using natural colourdigital orthoimagery taken in 2000 (2 ft resolution:http://www.nysgis.state.ny.us). We did not digitise apart-ment complexes because it was impossible to determinethe number of units per building and because most donot allow cats. We combined our average IOHC perhouse (0.275) with this data on house distribution toestimate the local density of IOHC across the study site.We calculated this using the kernel density estimator ofARCGIS 8.1 (ESRI, Redlands, CA, USA) with a cell size(i.e. resolution) set to represent one domestic garden/yard(50 m) and the search radius (i.e. degree of smoothing)set to represent the diameter of a typical cat home range(183 m). We reduced the predicted density of IOHC withinforested areas based on the fraction of our scent stationsvisited at different distances from the suburban edge(< 50 m, 0.47; < 500 m, 0.05; > 500 m, 0).
Survey of small mammals and seed predation
We conducted small mammal surveys using track tubes(Glennon, Porter & Demers, 2002) in 21 of these 22forested sites from June–August 2001. We used a 7 ×7 grid of tubes with 20 m spacing whenever possible; infragments too small for this design, we placed tubes at20 m intervals arranged to sample as much of the site aspossible. Tubes were baited with peanuts, examined andrebaited after 2 days and examined and collected after4 days. Contact paper strips permanently recorded allfootprints from each tube and these were later identifiedto genus based on a reference collection. We used relativefrequency of detection for each mammal species in eacharea as a measure of relative abundance.
We recorded seed predation rates in September andOctober of 2001 using the track tube methods describedabove except that 10 native plant seeds replaced thepeanut bait. The three native seed species used werealternated every three traps and included species ofconservation importance to this ecosystem: pitch pine(Pinus rigida), blue lupine (Lupinus perennis) and NewJersey tea (Ceanothus americanus).
Small mammal abundance and seed predation rateswere compared with cat abundance and landscape featuresusing simple linear regression.
RESULTS
Survey of cat owners
Of 600 surveys distributed, 381 (63.5%) were returned.Of these, 35% (134) households reported owning a cat(1–7 cats/house, average = 1.5), totaling 207 cats. Ofthese cat owners, 39.6% (53 households) had IOHC (total
Hou
seho
lds
<4 4–8 8–12 12–16 16–24
Hours per day outside
18
15
12
9
6
3
0
Fig. 1. Hours spent outside by cats from 37 households with outsidecats, as reported by owners.
105 cats), based on their observations of hunting behaviouror prey brought home. Of the 105 hunting cats reported,all but three were neutered.
Most owners of IOHC reported that their cats wereout for just a few hours per day, or for about half of theday (Fig. 1). The average of these approximations across37 households reporting these results was 8.35 h/day(± 6.31).
Out of all respondents, 86% said that they did notknow of any feral cats in the area, 6.7% (n = 21) knewof one feral cat, 4.5% (n = 14) reported ‘a few’, while2.2% (n = 7) reported knowing of ‘many’.
Most owners did not report conflict between theircats and wildlife; this was not obviously related to thehunting behaviour of their cats, nor the wildlife activitythey observed or attracted to their garden/yard (Table 1).Owners of hunting cats were more likely to report amissing cat than owners of inside cats. Approximatelyone-third of cat owners viewed the coyote as a threat totheir pets, but only 4% of hunting cats were restrictedbecause of this threat, while 15% of inside cat ownersreported this as a motivation for restricting their cat’smovement.
Cat hunting and ranging behaviour
Judging from dead prey returned to residences, our studypopulation hunted primarily small mammals (86%) and, toa lesser extent, birds (Table 2). This averaged 1.67 prey/cat/summer month (Table 3). Almost half of these preyitems were juvenile animals (Table 2) and most werecommon species for the area. This hunting was variablebetween individuals, ranging from one to 16 prey takenover the summer.
We documented 31 attempted hunts in 181 h of observ-ation (0.17 hunts/h). Birds were the target in 22.6% ofthese attempts, small mammals in 51.6% and the targetwas unknown in 25.8% of the hunts (although it wasprobably small mammals). Eight of these hunts resultedin a capture (all small mammals, 26% capture rate), andfour out of the eight animals escaped alive (13% total killrate). Multiplying this average hunt rate by the averagehours spent outside per day by IOHC suggests a kill rate of

276 R. W. KAYS AND A. A. DEWAN
Table 1. Response of cat owners to mail survey and the relationships between responses as determined by logistical regression
P-value (χ 2, odds ratio) for logistic regression of independentPercent of respondents value below with dependent value to left for all cat owners
Owners of hunting Owners of inside Seen raccoon Seen coyotecats (n = 53) cats (n = 72) Have hunting cat Have bird feeder in last year in last year
Have had cat harassed 8.2% 3.1% 0.43 0.71 0.068 0.11by wildlife (0.61, 1.39) (0.14, 1.37) (3.33, 0.20) (2.61, 0.19)
Have had a cat 21% 7.4% 0.047 0.86 0.66 0.12disappear (3.95, 1.73) (0.03, 0.91) (0.20, 0.76) (2.39, 0.34)
View coyote as 32% 38% 0.88 0.38 0.61 0.13threat to cats (0.02, 0.97) (0.76, 1.5) (0.27, 0.75) (2.30, 0.37)
Restrict cat because 4.0% 15% 0.19 0.42 0.69 0.12of coyote threat (1.74, 0.56) (0.65, 1.89) (0.16, 1.57) (2.39, 0.21)
Table 2. The types of prey brought home by 12 inside/outside housecats from May–June 2001
Prey species Count % Juvenile
Deer mice (Peromyscus sp.) 28 67.9Northern short-tailed shrew 6 0
(Blarina brevicauda)Eastern cottontail (Sylvilagus 5 100
floridanus)Eastern chipmunk (Tamias striatus) 5 0Meadow vole (Microtus pennsylvanicus) 4 25Grey catbird (Dumetella carolinensis) 3 0Cinereus shrew (Sorex cinereus) 3 0Bird species unknown 1 0Ovenbird (Seiurus aurocapillus) 1 0Carolina wren (Thryothorus 1 0
ludovicianus)House wren (Troglodytes aedon) 1 0American robin (Turdus migratorius) 1 100
Total 59 47.5
Bird 8 (13.6%) 12.5Mammal 51 (86.4%) 52.9
Table 3. Estimation of yearly prey killed per inside/outside catfrom records of prey brought home to owners and from behaviouralobservation over three summer months
Kills brought Observedhome hunts
Kills brought home by 12 cats 60over 3 summer months
Behavioural observationObserved hunts/h 0.17Observed kills/hunt 0.13Average h/day outside 8.35Average kills/day 0.18
Average kills per cat 1.67 5.54per summer month
5.54 prey per summer month per cat, which is 3.3times greater than the rate estimated from prey broughthome (Table 3). Most (80.0%) observed hunts were in thegarden/yard, or within the first 10 m of the forest edge.We only recorded two hunts more than 20 m into theneighbouring preserve forest (Fig. 2).
Eleven radio-collared IOHC averaged 0.24 ha in home-range size (95% MCP), while one feral cat had a homerange of 2.23 ha (Table 4). Although this feral cat wasinitially captured near an old barn in the forest preserve,she was never again recorded in the preserve; instead, shespent her time in a junkyard and car park across the streetfrom the preserve. On average, cats in our study rarelyentered the forest; the 95% MCP overlapped with forestfor only five out of 11 IOHC in our study, typically to asmall extent (average 0.056 ha: Table 4, Fig. 3(a), (b)).The home ranges overlapped with an average of3.67 gardens/yards, including that of their owners(Table 4), and only one cat ranged over a large numberof yards (Fig. 3(c)).
Our sample size is uneven, despite our best effortsto obtain comparable numbers of locations betweenindividual cats, because many cats were often inside theirowner’s home, especially at night. Thus, the number offixes (Table 4) is also a relative measure of the time spentoutside by different cats. Our bootstrap analysis of 95%MCP size versus number of fixes suggests that home-rangesize probably would have increased little with the additionof new fixes (Fig. 4). Thus, while they may be slightunderestimates, our home range sizes are probably goodapproximations of the area used by these cats. The shapeof these bootstrap lines themselves is also an indication ofgeneral movement rate and pattern by an individual. It isinteresting that 10 of our IOHC had very similar patternsof slow home range increase, which was very differentfrom the one feral cat. The line for the youngest and mostactive IOHC in our study (Orion) fell between these twogroups in slope and area used (Fig. 4).
Twenty-five out of our 108 scent stations detectedcats within the forest. Typically, cats were detected onlynear the suburban/forest edge. We only found cats atsites further than 40 m from this edge three times, despite

Ecological effects of house cats 277
MetresInside preserve | outside preserve
N
0
1
2
3
4
5
6
7
8
9
10
--120 --80 --40 0 40 80
Fig. 2. The location of hunts by house cats relative to the edge of the forest. Negative numbers are within the preserve, positive numbersare outside the preserve.
Table 4. Space use by 11 radio-collared house cats and one feral cat around the Albany Pine Bush Preserve. Number of fixes was limitedfor some cats because they spent the majority of their time inside their house
100% 95% Gardens/ Min distance ForestFixed/ Hours Total Independent MCP MCP yards used to forest from overlapped by
Name Sex fertile Age observed fixes fixes∗ (ha) (ha) (95% MCP) house (m) 95% MCP (ha)
Feral catTiger Female Fertile Ad 30.3 32 28 5.80 2.23 1 na 0.24
Inside/outside house catsBilly Male Fixed 4 16.8 83 22 1.12 0.33 8 7 0.037Charlie Male Fixed 4 8.8 69 14 0.39 0.25 1 5 0.17Dog Female Fertile Ad 6.3 34 12 0.29 0.19 2 75 0Fred Male Fixed 15 8.0 57 12 0.20 0.03 1 4 0Junior Male Fixed 8 8.5 28 17 0.18 0.079 4 95 0Mookie Female Fixed 4 4.8 24 9 0.14 0.061 3 8 0.009Orion Male Fixed 1 46.5 256 56 3.00 1.30 11 12 0.37Quinton Male Fixed 6 21.5 130 22 0.33 0.080 3 4 0Rusty Male Fixed 7 8.8 29 14 0.41 0.11 5 84 0Smokey Female Fertile Ad 7.5 31 15 0.13 0.12 3 75 0Willie Male Fixed 4 13.5 39 16 0.96 0.12 3 37 0.029
All average 1.08 0.41 3.8 0.071Non-feral 0.65 0.24 4.0 0.056
average
∗ Independent fixes are > 1 h apart.MCP, minimum convex polygon; Ad, adult.
considerable search effort (Fig. 5). On average, cats weremore often detected at scent stations near the forestedge (average distance from edge for stations detectingcats = 35.6 ( ± 48.4) m, not detecting cats = 170.5( ± 184.8) m: Mann–Whitney U test, U = 400, Z = − 4.6,P < 0.005, n = 108). There was no effect of the forestfragment size on the presence or absence of catsat a site (Mann–Whitney U test: U = 39.5, Z = 1.37,P = 0.17, n = 22). However, after identifying individualcats based on coat colour recorded by camera-traps, wefound that smaller forest fragments had more indivi-
dual cats (Spearman correlation r = −0.43, P = 0.046,n = 22).
Cat density and predation extrapolation
According to our surveys, there were 0.275 IOHC perhouse (105 IOHC reported by 381 households), whichmay be extrapolated to 1918 IOHC in our 6000 ha studyarea (given 6976 houses) and an overall density of0.32 IOCH/ha. By focusing on houses near the forestpreserve, we estimated that there were 850 and 552 cats

278 R. W. KAYS AND A. A. DEWAN
A m
B C
50
m50
m150
Legend
Cat locations - independent:
95% MCP home range
Forest
Cat owner,s house
Commercial building
House
Pavement
no
N
yes
Fig. 3. Locations and 95% minimum convex polygon (MCP) home ranges for three inside/outside house cats. Only independent locations(> 1 h apart) were used to generate the range. Maps (A) and (B) show a range that is typical for cats that did not enter the forest, (C) showsthe range of the most widely ranging house cat in our study (Orion).
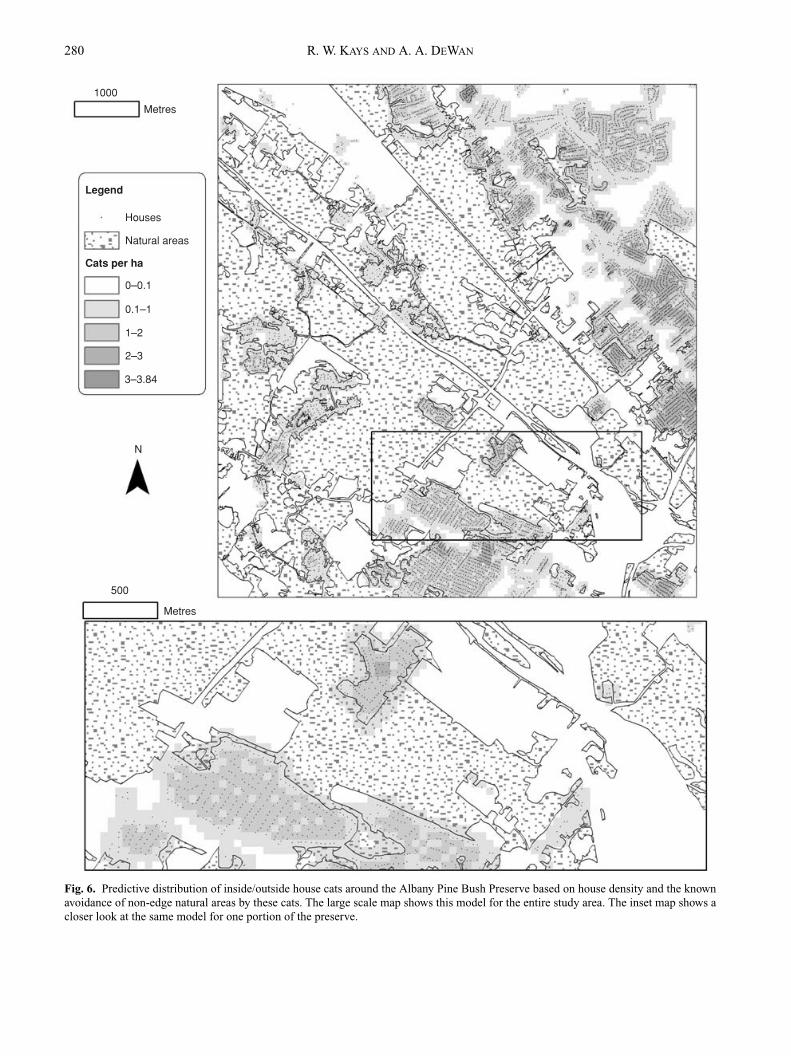
living within 100 m and 50 m of the edge of theforest preserve, respectively, giving densities of 0.21 and0.14 IOHC/ha, respectively. To map the local geographicalvariation of these density estimates we modelled IOHCbased on house density and the fraction of cats expected atdifferent distances from the forest/suburban edge (Fig. 6).Local predicted densities varied from 0 to 3.84 cats/ha,with most of the forest preserve predicted to have fewerthan 0.1 cats/ha. Many of the smaller forest fragmentswithin neighbourhoods, however, had higher predicteddensities.
By combining these density estimates with our averagepredation rates (prey brought home, observed hunt rate:Table 3), we extrapolated the total predation rate to be0.53–1.8 prey/ha/summer month within our 60 km2 studyarea; considering only those cats likely to hunt in the forestpreserve, these rates are 0.35–1.2 prey/ha/summer month
within the forest preserve and first 100 m of developedarea.
Effect on small mammal populations and seed predation
The number of individual cats detected within the forestat each sample site did not have a significant effect onthe total relative density of small mammals (d.f. = 18,R2 = 0.00, P = 0.9), on the density of any one rodentspecies (Sciurus: d.f. = 18, R2 = 0.07, P = 0.24; Peromy-scus: d.f.= 18, R2 = 0.4, P = 0.4), or on the local smallmammal biodiversity (d.f.= 18, R2 = 0.06, P = 0.29).There was also no obvious effect of forest edge on smallmammal abundance (Sciurus: d.f. = 2, X2 = 3.0, P = 0.22;Peromyscus: d.f. = 2, X2 = 2.8, P = 0.24). In addition,there was no relationship between the density of housesnear a site and the relative abundance of small mammals

Ecological effects of house cats 279
Are
a (h
a)
1 Feral cat
11 Inside/outsidehouse cats
5 9 13 17 21 25 29 33 37 41 45 49 53 57
n fixes
2.50
2.00
1.50
1.00
0.50
0.00
Fig. 4. Average 95% minimum convex polygon (MCP) home-range area for 12 radio-collared cats from a bootstrap analysis usingindependent fixes (independence interval = 1 h, 100 bootstrap replicates). The line between the feral cat and the 10 sedentary housecatswas for our most mobile house cat (Orion).
0
2
4
6
8
10
12
14
16
18
20
22
24
26
<50
50–1
00
100–
150
150–
200
200–
250
250–
300
300–
350
350–
400
400–
450
450–
500
500–
550
550–
600
600–
650
650–
700
700–
750
750–
800
>80
0
Metres from forest/neighbourhood edge
Cats not detected
Cats detected
Num
ber
of s
tatio
ns
Fig. 5. The presence or absence of domestic cats at 108 scent stations relative to their distance from the forest/suburban edge.
(within 50 m of the site: R2 = 0.006, P = 0.70; within100 m: R2 = 0.02, P = 0.55; within 500 m: R2 = 0.07,P = 0.24). The local abundance of cats did not affect seedpredator activity (All seeds: F = 0.06, P = 0.81; P. rigida:
F = 0.00, P = 0.98; C. americanus: F = 0.00, P = 0.96;L. perennis: F = 0.50, P = 0.49). However, seed preda-tion was highest at edge sites (d.f. = 2, χ2 = 7.27,P = 0.026).
280 R. W. KAYS AND A. A. DEWAN
1000
Metres
Legend
Cats per ha
Houses
Natural areas
0–0.1
0.1–1
1–2
2–3
3–3.84
N
500
Metres
Fig. 6. Predictive distribution of inside/outside house cats around the Albany Pine Bush Preserve based on house density and the knownavoidance of non-edge natural areas by these cats. The large scale map shows this model for the entire study area. The inset map shows acloser look at the same model for one portion of the preserve.

Ecological effects of house cats 281
DISCUSSION AND CONCLUSIONS
Our data suggest that our study IOHC population isgenerally similar to those studied elsewhere. The overallpercentage of households owning cats in our study (35%)is similar to that from other areas (e.g. Massachusetts22–34%, Indiana 23–31%: Patronek & Rowan, 1995;California ca. 33%: Crooks, 1997). The percentage ofowned cats that hunt outside in our study (39.6%) is similarto that reported in Australia (36%: Robertson, 1998) butlower than that in southern California (ca. 75%: Crooks,1997). These comparisons suggest that our density modelbased on the estimate of 0.275 IOHC per house isroughly similar to what one would find in other suburbansettings with a similar house density. Indeed, our predicteddensities of 0–3.8 IOHC/ha (Fig. 6) are in the same rangeas 25 out of the 29 domestic cat studies covered in a recentreview (Liberg et al., 2000). It is important to rememberthat our model only considers IOHC and not feral cats.
The cats in our study primarily hunted small mammals,followed by birds. Although our sample sizes are small,this fits the general hunting patterns observed at othernorthern continental sites (Fitzgerald & Turner, 2000;Woods et al., 2003). The rate at which our study populationreturned home with kills (1.7 kills/cat/summer month)is within the range reported by similar studies (0.85–3.2 kills/cat/month: for a review, see Woods et al., 2003).Our kill rate calculated from observing cat behaviour(5.5 kills/cat/summer month) was higher than our kills-brought-home estimate; this has been suspected by otherauthors (Carss, 1995; Woods et al., 2003), but we knowof no similar observational data confirming this forIOHC.
The 95% MCP home-range sizes of IOHC in our studyaveraged 0.24 ha. While these were based on a limitednumber of (mostly diurnal) fixes, bootstrap analysissuggests that additional samples would not significantlyincrease most individuals’ ranges. We know of no similarrange measures for suburban IOHC, although these aremuch smaller than those found for housecats in Illinoisfarmland (Warner, 1985) and for all feral cat populationsstudied (for a review, see Liberg et al., 2000).
These small ranges rarely overlapped with a forestedarea, even if it bordered their owner’s garden/yard andonly two out of 31 observed hunts were attempted morethan 10 m into the forest. Confirming these behaviouralobservations, our scent station survey in nearby forestsdetected cats most often near the forest edge and onlyrecorded them at three out of 66 scent stations locatedmore than 40 m from the forest/suburban edge. Otherstudies have also found that, on average, domestic cats aremore abundant near the edge of natural areas (Oehler &Litvaitis, 1996; Crooks, 2002), although there is clearlysome variability between individuals (Warner, 1985;Churcher & Lawton, 1987; Carss, 1995; this study).We have a very poor understanding of what factorsinfluence the penetration of cats into natural areas, bothin terms of variation between different cats, betweendifferent natural areas in a region and between differenthabitat types. Understanding the relative importance of
predation risk, landscape features, native prey abundance,cat condition and human intervention on cat movementwould significantly aid cat management and should be apriority for future studies.
There are three factors about our study site that mayrelate to the conservation risk of local cat populations inpositive ways compared with different habitats in otherparts of the world. First, harsh New York winters probablyfunction to not only restrict IOHC movement for much ofthe year (George, 1974; Churcher & Lawton, 1987), butalso they may limit the suitability of the area for true feralcats compared with warmer climates. Second, the nativepotential prey species in mixed coniferous/deciduousforests of northeastern North America may be lessvulnerable than other areas because it includes few lizardsor low-nesting birds. For example, the scrub nestingbirds hunted by IOHC in suburban southern California(Crooks & Soule, 1999) might be expected to be morevulnerable than small mammal or canopy nesting birdpopulations simply because their low nesting habitsare more easily exploited by scansorial cats (i.e. anevolutionary trap: Schlaepfer, Runge & Sherman, 2002).Finally, the nature preserve around these neighbourhoodsincludes enough forest to support populations of catpredators including coyotes (Canis latrans) and fishers(Martes pennanti: Kays, Bogan & Holevinski, 2001). Thepresence of these predators probably functions to limitferal cat numbers, as well as the movement of any IOHCinto the forest preserve (Crooks & Soule, 1999). Indeed,approximately one-third of cat owners in the area viewcoyotes as a threat to their cats (Table 1).
True feral cats were apparently rare in our studyarea, since only 13.4% of our mail survey respondentsreported seeing them in the area and some of thesecould have been neighborhood IOHC without collars.Likewise, the local animal-control officer reported straycats in neighbourhoods, but not in forest fragments(Town of Guilderland Animal Control, pers. comm.). Ourbehavioural research focused on IOHC, but we did radio-collar one feral cat that was trapped near an old barn withinthe preserve. In our nocturnal and diurnal tracking over thenext 3 months we never again recorded this cat within thepreserve. Rather, she was always in either a junkyard orcar park across the street from the preserve, highlightingthe apparent unsuitability of these forests for F. silvestris.
Do inside/outside house cats affect prey populations?
While our extrapolations of 0.35–1.8 prey/summer monthtaken by IOHC in the area are rough estimates, they givean idea at the scale of predation in the area. To put thisin perspective, Peromyscus leucopus densities typicallyrange from 2–35/ha and they produce several litters of3–5 young per year (Whitaker & Hamilton, 1998). Iscat predation enough to affect prey population size giventhe cat’s inefficient hunting of mostly common, juvenilemammals and rare trips into the preserve itself ? Our datasuggest it is not, since we found no relationships betweenany measures of the small mammal community and catactivity. In fact, although we did not detect higher rodent
282 R. W. KAYS AND A. A. DEWAN
Feral cats andcat colonies
Farm cats Inside/outsidehouse cats
Inside house cats
Potential effects on wildlife per cat
Degree owned, fed and housed by humans
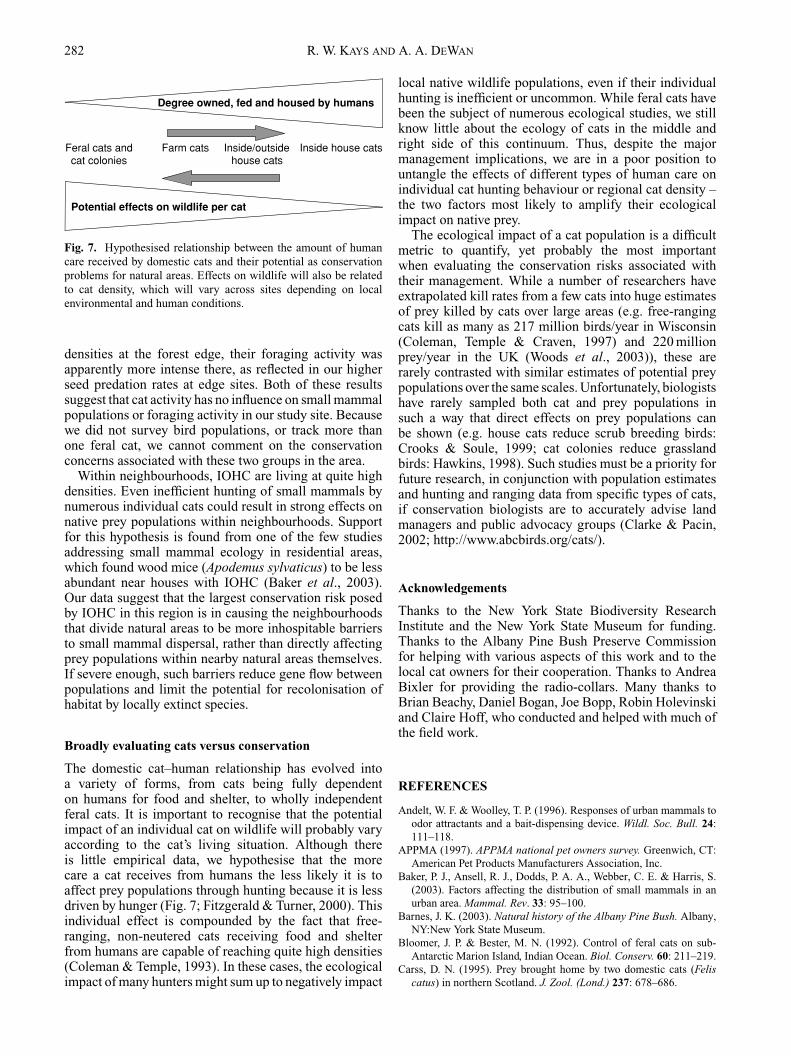
Fig. 7. Hypothesised relationship between the amount of humancare received by domestic cats and their potential as conservationproblems for natural areas. Effects on wildlife will also be relatedto cat density, which will vary across sites depending on localenvironmental and human conditions.
densities at the forest edge, their foraging activity wasapparently more intense there, as reflected in our higherseed predation rates at edge sites. Both of these resultssuggest that cat activity has no influence on small mammalpopulations or foraging activity in our study site. Becausewe did not survey bird populations, or track more thanone feral cat, we cannot comment on the conservationconcerns associated with these two groups in the area.
Within neighbourhoods, IOHC are living at quite highdensities. Even inefficient hunting of small mammals bynumerous individual cats could result in strong effects onnative prey populations within neighbourhoods. Supportfor this hypothesis is found from one of the few studiesaddressing small mammal ecology in residential areas,which found wood mice (Apodemus sylvaticus) to be lessabundant near houses with IOHC (Baker et al., 2003).Our data suggest that the largest conservation risk posedby IOHC in this region is in causing the neighbourhoodsthat divide natural areas to be more inhospitable barriersto small mammal dispersal, rather than directly affectingprey populations within nearby natural areas themselves.If severe enough, such barriers reduce gene flow betweenpopulations and limit the potential for recolonisation ofhabitat by locally extinct species.
Broadly evaluating cats versus conservation
The domestic cat–human relationship has evolved intoa variety of forms, from cats being fully dependenton humans for food and shelter, to wholly independentferal cats. It is important to recognise that the potentialimpact of an individual cat on wildlife will probably varyaccording to the cat’s living situation. Although thereis little empirical data, we hypothesise that the morecare a cat receives from humans the less likely it is toaffect prey populations through hunting because it is lessdriven by hunger (Fig. 7; Fitzgerald & Turner, 2000). Thisindividual effect is compounded by the fact that free-ranging, non-neutered cats receiving food and shelterfrom humans are capable of reaching quite high densities(Coleman & Temple, 1993). In these cases, the ecologicalimpact of many hunters might sum up to negatively impact
local native wildlife populations, even if their individualhunting is inefficient or uncommon. While feral cats havebeen the subject of numerous ecological studies, we stillknow little about the ecology of cats in the middle andright side of this continuum. Thus, despite the majormanagement implications, we are in a poor position tountangle the effects of different types of human care onindividual cat hunting behaviour or regional cat density –the two factors most likely to amplify their ecologicalimpact on native prey.
The ecological impact of a cat population is a difficultmetric to quantify, yet probably the most importantwhen evaluating the conservation risks associated withtheir management. While a number of researchers haveextrapolated kill rates from a few cats into huge estimatesof prey killed by cats over large areas (e.g. free-rangingcats kill as many as 217 million birds/year in Wisconsin(Coleman, Temple & Craven, 1997) and 220 millionprey/year in the UK (Woods et al., 2003)), these arerarely contrasted with similar estimates of potential preypopulations over the same scales. Unfortunately, biologistshave rarely sampled both cat and prey populations insuch a way that direct effects on prey populations canbe shown (e.g. house cats reduce scrub breeding birds:Crooks & Soule, 1999; cat colonies reduce grasslandbirds: Hawkins, 1998). Such studies must be a priority forfuture research, in conjunction with population estimatesand hunting and ranging data from specific types of cats,if conservation biologists are to accurately advise landmanagers and public advocacy groups (Clarke & Pacin,2002; http://www.abcbirds.org/cats/).
Acknowledgements
Thanks to the New York State Biodiversity ResearchInstitute and the New York State Museum for funding.Thanks to the Albany Pine Bush Preserve Commissionfor helping with various aspects of this work and to thelocal cat owners for their cooperation. Thanks to AndreaBixler for providing the radio-collars. Many thanks toBrian Beachy, Daniel Bogan, Joe Bopp, Robin Holevinskiand Claire Hoff, who conducted and helped with much ofthe field work.
REFERENCES
Andelt, W. F. & Woolley, T. P. (1996). Responses of urban mammals toodor attractants and a bait-dispensing device. Wildl. Soc. Bull. 24:111–118.
APPMA (1997). APPMA national pet owners survey. Greenwich, CT:American Pet Products Manufacturers Association, Inc.
Baker, P. J., Ansell, R. J., Dodds, P. A. A., Webber, C. E. & Harris, S.(2003). Factors affecting the distribution of small mammals in anurban area. Mammal. Rev. 33: 95–100.
Barnes, J. K. (2003). Natural history of the Albany Pine Bush. Albany,NY:New York State Museum.
Bloomer, J. P. & Bester, M. N. (1992). Control of feral cats on sub-Antarctic Marion Island, Indian Ocean. Biol. Conserv. 60: 211–219.
Carss, D. N. (1995). Prey brought home by two domestic cats (Feliscatus) in northern Scotland. J. Zool. (Lond.) 237: 678–686.

Ecological effects of house cats 283
Churcher, P. B. & Lawton, J. H. (1987). Predation by domestic cats inan English village. J. Zool. (Lond.) 212: 439–455.
Clarke, A. L. & Pacin, T. (2002). Domestic cat ‘colonies’ innatural areas: a growing exotic species threat. Nat. Areas J. 22:154–159.
Coleman, J. S. & Temple, S. A. (1993). Rural residents’ free-rangingdomestic cats: a survey. Wildl. Soc. Bull. 21: 381–390.
Coleman, J. S., Temple, S. A. & Craven, S. R. (1997). Cats and wildlife:a conservation dilemma. Madison, WI: Wisconsin CooperativeExtension.
Crooks, D. R. & Soule, M. E. (1999). Mesopredator release andavifaunal extinctions in a fragmented system. Nature 400: 563–566.
Crooks, K. (1997). Tabby go home. Wild Earth Winter: 60–63.Crooks, K. (2002). Relative sensitivities of mammalian carnivores to
habitat fragmentation. Conserv. Biol. 16: 488–502.Doncaster, C. P. & Macdonald, D. W. (1997). Activity patterns and
interactions of red foxes (Vulpes vulpes) in Oxford city. J. Zool.(Lond.) 241: 73–87.
Fitzgerald, B. M. (1990). Is cat control needed to protect urban wildlife?Environ. Conserv. 17: 168–169.
Fitzgerald, B. M. & Turner, D. C. (2000). Hunting behaviour of domesticcats and their impact on prey populations. In The domestic cat: thebiology of its behaviour: 151–173. Turner, D. C. & Bateson, P. (Eds).Cambridge: Cambridge University Press.
George, W. G. (1974). Domestic cats as predators and factors in wintershortages of raptor prey. Wilson Bull. 86: 384–396.
Glennon, M. J., Porter, W. F. & Demers, C. L. (2002). An alternative fieldtechnique for estimating diversity of small-mammal populations.J. Mammal. 83: 734–742.
Hawkins, C. C. (1998). Impact of a subsidized exotic predator on nativebiota: effect of house cats (Felis catus) on California birds androdents. Ph.D. thesis. College Station, Texas: Texas A&M University.
Hooge, P. N. & Eichenlaub, B. (1997). Animal movement extension toArcview. Anchorage, AK: U.S. Geological Survey.
Jarvis, P. J. (1990). Urban cats as pests and pets. Environ. Conserv. 19:169–171.
Kays, R., Bogan, D. & Holevinski, R. (2001). Carnivores in a suburbanforest, the Albany Pine Bush Preserve. Proc. N.E. Fish Wildl. Conf.57: 22.
Leyhausen, P. (1979). Cat behaviour: the predatory and social behaviorof domestic and wild cats. New York: Garland STPM Press.
Liberg, O. (1984). Food habits and prey impact by feral and house-baseddomestic cats in a rural area in southern Sweden. J. Mammal. 65:424–432.
Liberg, O., Sandell, M., Pontier, D. & Natoli, E. (2000). Density, spatialorganisation and reproductive tactics in the domestic cat and otherfelids. In The domestic cat: the biology of its behaviour: 120–145.Turner, D. C. & Bateson, P. (Eds). Cambridge: Cambridge UniversityPress.
Meek, P. D. (1998). Food items brought home by domestic cats Feliscatus (L) living in Booderee National Park, Jervis Bay. Proc. Linn.Soc. New South Wales 120: 43–47.
Oehler, J. D. & Litvaitis, J. (1996). The role of spatial scale inunderstanding responses of medium-sized carnivores to forestfragmentation. Can. J. Zool. 74: 2070–2079.
Ostfeld, R. S. & Keesing, F. (2000). Biodiversity and disease risk: thecase of Lyme disease. Conserv. Biol. 14: 722–728.
Ostfeld, R. S., Manson, R. H. & Canham, C. D. (1997). Effects ofrodents on survival of tree seeds and seedlings invading old fields.Ecology 78: 1531–1542.
Paltridge, R., Gibson, D. & Edwards, G. (1997). Diet of the feral cat(Felis catus) in Central Australia. Wildl. Res. 24: 64–76.
Patronek, G. J. & Rowan, A. N. (1995). Determining dog and catnumbers and population dynamics. Anthrozoos 8: 199–205.
Rittner, D. (1976). Pine bush: Albany’s last frontier. Albany, NY: PineBush Historic Preservation Project.
Robertson, I. D. (1998). Survey of predation by domestic cats. Aust. Vet.J. 76: 551–554.
Schlaepfer, M. A., Runge, M. C. & Sherman, P. W. (2002). Ecologicaland evolutionary traps. Trends Ecol. Evol. 17: 474–480.
Stiling, P. (1996). Ecology: theories and applications. New Jersey:Prentice Hall.
Warner, R. E. (1985). Demography and movements of free-rangingdomestic cats in rural Illinois. J. Wildl. Manag. 49: 340–346.
Weber, J. M. & Dailly, L. (1998). Food habits and ranging behaviourof a group of farm cats (Felis catus) in a Swiss mountainous area.J. Zool. (Lond.) 245: 234–237.
Whitaker, J. O. & Hamilton, W. J. (1998). Mammals of the easternUnited States. Ithaca, NY: Cornell University Press.
Woods, M., McDonald, R. A. & Harris, S. (2003). Predation of wildlifeby domestic cats Felis catus in Great Britain. Mammal Rev. 33: 147–188.